Test: Dell XPS 15 7590 - Räcker basmodellen med Core i5 och FHD-skärm till? (Sammanfattning)
| SD Card Reader | |
| average JPG Copy Test (av. of 3 runs) | |
| Dell XPS 15 7590 i5 iGPU FHD (Toshiba Exceria Pro SDXC 64 GB UHS-II) | |
| Dell XPS 15 9570 i7 UHD (Toshiba Exceria Pro SDXC 64 GB UHS-II) | |
| Dell XPS 15 7590 9980HK GTX 1650 (Toshiba Exceria Pro SDXC 64 GB UHS-II) | |
| Genomsnitt av klass Multimedia (23 - 531, n=36, senaste 2 åren) | |
| maximum AS SSD Seq Read Test (1GB) | |
| Genomsnitt av klass Multimedia (37.3 - 1455, n=35, senaste 2 åren) | |
| Dell XPS 15 7590 9980HK GTX 1650 (Toshiba Exceria Pro SDXC 64 GB UHS-II) | |
| Dell XPS 15 9570 i7 UHD (Toshiba Exceria Pro SDXC 64 GB UHS-II) | |
| Dell XPS 15 7590 i5 iGPU FHD (Toshiba Exceria Pro SDXC 64 GB UHS-II) | |
| Networking | |
| iperf3 transmit AX12 | |
| Dell XPS 15 7590 i5 iGPU FHD | |
| Dell XPS 15 9570 Core i9 UHD | |
| Dell XPS 15 7590 9980HK GTX 1650 | |
| iperf3 receive AX12 | |
| Dell XPS 15 7590 9980HK GTX 1650 | |
| Dell XPS 15 9570 Core i9 UHD | |
| Dell XPS 15 7590 i5 iGPU FHD | |
| |||||||||||||||||||||||||
Distribution av ljusstyrkan: 89 %
Mitt på batteriet: 586 cd/m²
Kontrast: 1470:1 (Svärta: 0.4 cd/m²)
ΔE ColorChecker Calman: 2.5 | ∀{0.5-29.43 Ø4.71}
calibrated: 0.6
ΔE Greyscale Calman: 4.5 | ∀{0.09-98 Ø4.96}
98% sRGB (Argyll 1.6.3 3D)
63.2% AdobeRGB 1998 (Argyll 1.6.3 3D)
68.4% AdobeRGB 1998 (Argyll 3D)
98% sRGB (Argyll 3D)
66.5% Display P3 (Argyll 3D)
Gamma: 2.2
CCT: 6836 K
| Dell XPS 15 7590 i5 iGPU FHD LQ156M1, , 1920x1080, 15.6" | Dell XPS 15 7590 9980HK GTX 1650 Samsung 156WR04, SDCA029, , 3840x2160, 15.6" | Dell XPS 15 9570 Core i9 UHD LQ156D1, , 3840x2160, 15.6" | Dell XPS 15 9570 i7 UHD LQ156D1, , 3840x2160, 15.6" | Dell XPS 15 2017 9560 (7300HQ, Full-HD) Sharp SHP1453 LQ156M1, , 1920x1080, 15.6" | |
|---|---|---|---|---|---|
| Display | 23% | 12% | 12% | 3% | |
| Display P3 Coverage (%) | 66.5 | 88.1 32% | 79.6 20% | 79.1 19% | 68.9 4% |
| sRGB Coverage (%) | 98 | 99.6 2% | 98.4 0% | 98.8 1% | 98.9 1% |
| AdobeRGB 1998 Coverage (%) | 68.4 | 91.8 34% | 79.7 17% | 79.2 16% | 70.9 4% |
| Response Times | 94% | 1% | 6% | -33% | |
| Response Time Grey 50% / Grey 80% * (ms) | 52.8 ? | 2.3 ? 96% | 52.4 ? 1% | 46.4 ? 12% | 54 ? -2% |
| Response Time Black / White * (ms) | 32 ? | 2.4 ? 92% | 31.6 ? 1% | 32 ? -0% | 52.4 ? -64% |
| PWM Frequency (Hz) | 1020 ? | 59.5 ? | 1000 ? | 980 ? | |
| Screen | -26% | -71% | -25% | -25% | |
| Brightness middle (cd/m²) | 588 | 421.2 -28% | 451.9 -23% | 494 -16% | 400 -32% |
| Brightness (cd/m²) | 555 | 417 -25% | 414 -25% | 457 -18% | 392 -29% |
| Brightness Distribution (%) | 89 | 94 6% | 81 -9% | 88 -1% | 89 0% |
| Black Level * (cd/m²) | 0.4 | 0.36 10% | 0.34 15% | 0.26 35% | |
| Contrast (:1) | 1470 | 1255 -15% | 1453 -1% | 1538 5% | |
| Colorchecker dE 2000 * | 2.5 | 6.06 -142% | 5.62 -125% | 5.2 -108% | 4.9 -96% |
| Colorchecker dE 2000 max. * | 6.3 | 11.89 -89% | 19.1 -203% | 17.5 -178% | 11 -75% |
| Colorchecker dE 2000 calibrated * | 0.6 | 2.69 -348% | |||
| Greyscale dE 2000 * | 4.5 | 2.8 38% | 6.9 -53% | 2.7 40% | 7.2 -60% |
| Gamma | 2.2 100% | 2.15 102% | 2.2 100% | 2.1 105% | 2.11 104% |
| CCT | 6836 95% | 6235 104% | 6254 104% | 7038 92% | 6911 94% |
| Color Space (Percent of AdobeRGB 1998) (%) | 63.2 | 81 28% | 71.8 14% | 71.2 13% | 64.2 2% |
| Color Space (Percent of sRGB) (%) | 98 | 99.6 2% | 98.5 1% | 98.8 1% | 98.9 1% |
| Totalt genomsnitt (program/inställningar) | 30% /
4% | -19% /
-46% | -2% /
-14% | -18% /
-20% |
* ... mindre är bättre
Visa svarstider
| ↔ Svarstid svart till vitt | ||
|---|---|---|
| 32 ms ... stiga ↗ och falla ↘ kombinerat | ↗ 16.4 ms stiga | 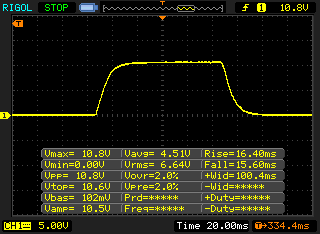 |
| ↘ 15.6 ms hösten | ||
| Skärmen visar långsamma svarsfrekvenser i våra tester och kommer att vara otillfredsställande för spelare. I jämförelse sträcker sig alla testade enheter från 0.1 (minst) till 240 (maximalt) ms. » 86 % av alla enheter är bättre. Detta innebär att den uppmätta svarstiden är sämre än genomsnittet av alla testade enheter (19.8 ms). | ||
| ↔ Svarstid 50 % grått till 80 % grått | ||
| 52.8 ms ... stiga ↗ och falla ↘ kombinerat | ↗ 25.6 ms stiga | 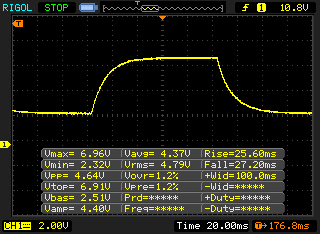 |
| ↘ 27.2 ms hösten | ||
| Skärmen visar långsamma svarsfrekvenser i våra tester och kommer att vara otillfredsställande för spelare. I jämförelse sträcker sig alla testade enheter från 0.165 (minst) till 636 (maximalt) ms. » 89 % av alla enheter är bättre. Detta innebär att den uppmätta svarstiden är sämre än genomsnittet av alla testade enheter (30.9 ms). | ||
Skärmflimmer / PWM (Puls-Width Modulation)
| Skärmflimmer / PWM upptäckt | 1020 Hz | ≤ 25 % ljusstyrka inställning | 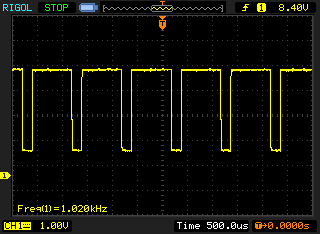 |
Displayens bakgrundsbelysning flimrar vid 1020 Hz (i värsta fall, t.ex. med PWM) Flimrande upptäckt vid en ljusstyrkeinställning på 25 % och lägre. Det ska inte finnas något flimmer eller PWM över denna ljusstyrkeinställning. Frekvensen för 1020 Hz är ganska hög, så de flesta användare som är känsliga för PWM bör inte märka något flimmer. Som jämförelse: 52 % av alla testade enheter använder inte PWM för att dämpa skärmen. Om PWM upptäcktes mättes ett medelvärde av 7748 (minst: 5 - maximum: 343500) Hz. | |||

| PCMark 8 Home Score Accelerated v2 | 4175 poäng | |
| PCMark 8 Creative Score Accelerated v2 | 5022 poäng | |
| PCMark 8 Work Score Accelerated v2 | 5070 poäng | |
| PCMark 10 Score | 4105 poäng | |
Hjälp | ||

| 3DMark 11 Performance | 1989 poäng | |
| 3DMark Cloud Gate Standard Score | 9545 poäng | |
| 3DMark Fire Strike Score | 1100 poäng | |
| 3DMark Time Spy Score | 441 poäng | |
Hjälp | ||
| låg | med. | hög | ultra | 4K | |
|---|---|---|---|---|---|
| BioShock Infinite (2013) | 58.7 | 34.7 | 29.9 | 9.8 | |
| Dota 2 Reborn (2015) | 78 | 49.5 | 20.2 | 17.9 | 6.5 |
| X-Plane 11.11 (2018) | 24.5 | 15.1 | 13.3 |
Ljudnivå
| Låg belastning |
| 29.3 / 29.3 / 29.8 dB(A) |
| Hög belastning |
| 32.4 / 37.2 dB(A) |
 | ||
30 dB tyst 40 dB(A) hörbar 50 dB(A) högt ljud |
||
min: | ||
| Dell XPS 15 7590 i5 iGPU FHD UHD Graphics 630, i5-9300H, Toshiba XG6 KXG60ZNV512G | Dell XPS 15 7590 9980HK GTX 1650 GeForce GTX 1650 Mobile, i9-9980HK, Toshiba XG6 KXG60ZNV1T02 | Dell XPS 15 9570 i7 UHD GeForce GTX 1050 Ti Max-Q, i7-8750H, Toshiba XG5 KXG50ZNV512G | Dell XPS 15 9570 Core i9 UHD GeForce GTX 1050 Ti Max-Q, i9-8950HK, Samsung SSD PM981 MZVLB1T0HALR | Dell XPS 15 2017 9560 (7300HQ, Full-HD) GeForce GTX 1050 Mobile, i5-7300HQ, WDC WD10SPCX-75KHST0 + SanDisk Z400s M.2 2242 32 GB Cache | |
|---|---|---|---|---|---|
| Noise | -9% | -5% | -5% | -18% | |
| av / miljö * (dB) | 29.3 | 28.2 4% | 29.9 -2% | 28.2 4% | 30.3 -3% |
| Idle Minimum * (dB) | 29.3 | 28.2 4% | 29.9 -2% | 28.5 3% | 31.6 -8% |
| Idle Average * (dB) | 29.3 | 28.2 4% | 29.9 -2% | 28.6 2% | 31.6 -8% |
| Idle Maximum * (dB) | 29.8 | 30.4 -2% | 30.3 -2% | 28.8 3% | 33.4 -12% |
| Load Average * (dB) | 32.4 | 43.8 -35% | 36.5 -13% | 36.2 -12% | 47.8 -48% |
| Load Maximum * (dB) | 37.2 | 47.2 -27% | 40.4 -9% | 47.6 -28% | 47.8 -28% |
| Witcher 3 ultra * (dB) | 47.2 | 40.4 | 47.6 |
* ... mindre är bättre
(±) Den maximala temperaturen på ovansidan är 44.6 °C / 112 F, jämfört med genomsnittet av 36.8 °C / 98 F , allt från 21 till 71 °C för klassen Multimedia.
(+) Botten värms upp till maximalt 39 °C / 102 F, jämfört med genomsnittet av 39.1 °C / 102 F
(+) Vid tomgångsbruk är medeltemperaturen för ovansidan 23.1 °C / 74 F, jämfört med enhetsgenomsnittet på 31.3 °C / ### class_avg_f### F.
(+) Handledsstöden och pekplattan är kallare än hudtemperaturen med maximalt 28.9 °C / 84 F och är därför svala att ta på.
(±) Medeltemperaturen för handledsstödsområdet på liknande enheter var 28.7 °C / 83.7 F (-0.2 °C / -0.3 F).
Dell XPS 15 7590 i5 iGPU FHD ljudanalys
(±) | högtalarljudstyrkan är genomsnittlig men bra (79 dB)
Bas 100 - 315 Hz
(-) | nästan ingen bas - i genomsnitt 26.4% lägre än medianen
(±) | linjäriteten för basen är genomsnittlig (12.1% delta till föregående frekvens)
Mellan 400 - 2000 Hz
(+) | balanserad mellan - endast 4.5% från medianen
(±) | linjäriteten för mids är genomsnittlig (8% delta till föregående frekvens)
Högsta 2 - 16 kHz
(+) | balanserade toppar - endast 1.4% från medianen
(+) | toppar är linjära (2.8% delta till föregående frekvens)
Totalt 100 - 16 000 Hz
(±) | linjäriteten för det totala ljudet är genomsnittlig (21.2% skillnad mot median)
Jämfört med samma klass
» 73% av alla testade enheter i den här klassen var bättre, 7% liknande, 20% sämre
» Den bästa hade ett delta på 5%, genomsnittet var 17%, sämst var 45%
Jämfört med alla testade enheter
» 59% av alla testade enheter var bättre, 7% liknande, 34% sämre
» Den bästa hade ett delta på 4%, genomsnittet var 23%, sämst var 134%
| Av/Standby | |
| Låg belastning | |
| Hög belastning |
|
Förklaring:
min: | |
| Dell XPS 15 7590 i5 iGPU FHD i5-9300H, UHD Graphics 630, IPS, 1920x1080 | Dell XPS 15 7590 9980HK GTX 1650 i9-9980HK, GeForce GTX 1650 Mobile, OLED, 3840x2160 | Dell XPS 15 9570 i7 UHD i7-8750H, GeForce GTX 1050 Ti Max-Q, IPS, 3840x2160 | Dell XPS 15 9570 Core i9 UHD i9-8950HK, GeForce GTX 1050 Ti Max-Q, IPS, 3840x2160 | Dell XPS 15 2017 9560 (7300HQ, Full-HD) i5-7300HQ, GeForce GTX 1050 Mobile, LED IGZO IPS InfinityEdge, 1920x1080 | |
|---|---|---|---|---|---|
| Power Consumption | -65% | -87% | -65% | -33% | |
| Idle Minimum * (Watt) | 3.79 | 6.2 -64% | 9.48 -150% | 7.1 -87% | 6.6 -74% |
| Idle Average * (Watt) | 6.9 | 9.6 -39% | 16.1 -133% | 13.6 -97% | 9 -30% |
| Idle Maximum * (Watt) | 9.2 | 21.2 -130% | 16.9 -84% | 14.1 -53% | 10.7 -16% |
| Load Average * (Watt) | 62 | 104.3 -68% | 90.8 -46% | 103.9 -68% | 77.5 -25% |
| Load Maximum * (Watt) | 108 | 135.3 -25% | 134.4 -24% | 130.9 -21% | 130 -20% |
| Witcher 3 ultra * (Watt) | 91.7 | 103 |
* ... mindre är bättre
| Dell XPS 15 7590 i5 iGPU FHD i5-9300H, UHD Graphics 630, 97 Wh | Dell XPS 15 7590 9980HK GTX 1650 i9-9980HK, GeForce GTX 1650 Mobile, 97 Wh | Dell XPS 15 9570 i7 UHD i7-8750H, GeForce GTX 1050 Ti Max-Q, 97 Wh | Dell XPS 15 9570 Core i9 UHD i9-8950HK, GeForce GTX 1050 Ti Max-Q, 97 Wh | Dell XPS 15 2017 9560 (7300HQ, Full-HD) i5-7300HQ, GeForce GTX 1050 Mobile, 56 Wh | Genomsnitt av klass Multimedia | |
|---|---|---|---|---|---|---|
| Batteridrifttid | 25% | -29% | -40% | -39% | -7% | |
| H.264 (h) | 17.6 | 12.3 -30% | 16.8 ? -5% | |||
| WiFi v1.3 (h) | 14.1 | 7.8 -45% | 9.6 -32% | 8.6 -39% | 5.6 -60% | 12.3 ? -13% |
| Load (h) | 1.7 | 3.3 94% | 1.3 -24% | 1 -41% | 1.4 -18% | 1.645 ? -3% |
| Witcher 3 ultra (h) | 1 |
För
Emot

Läs den fullständiga versionen av den här recensionen på engelska här.
Även utan ett dedikerat GeForce-grafikkort är Dell XPS 15 en bra multimedialaptop. För den som inte vill spela spel eller planerar att använda ett externt grafikkort på sitt skrivbord passar iGPU-versionen bättre. Särskilt i fråga om ljud- och temperaturnivå samt pris finns det tydliga fördelar. För de flesta användare är utrustningen i den grundläggande konfigurationen tillräcklig för vardagsbruk.
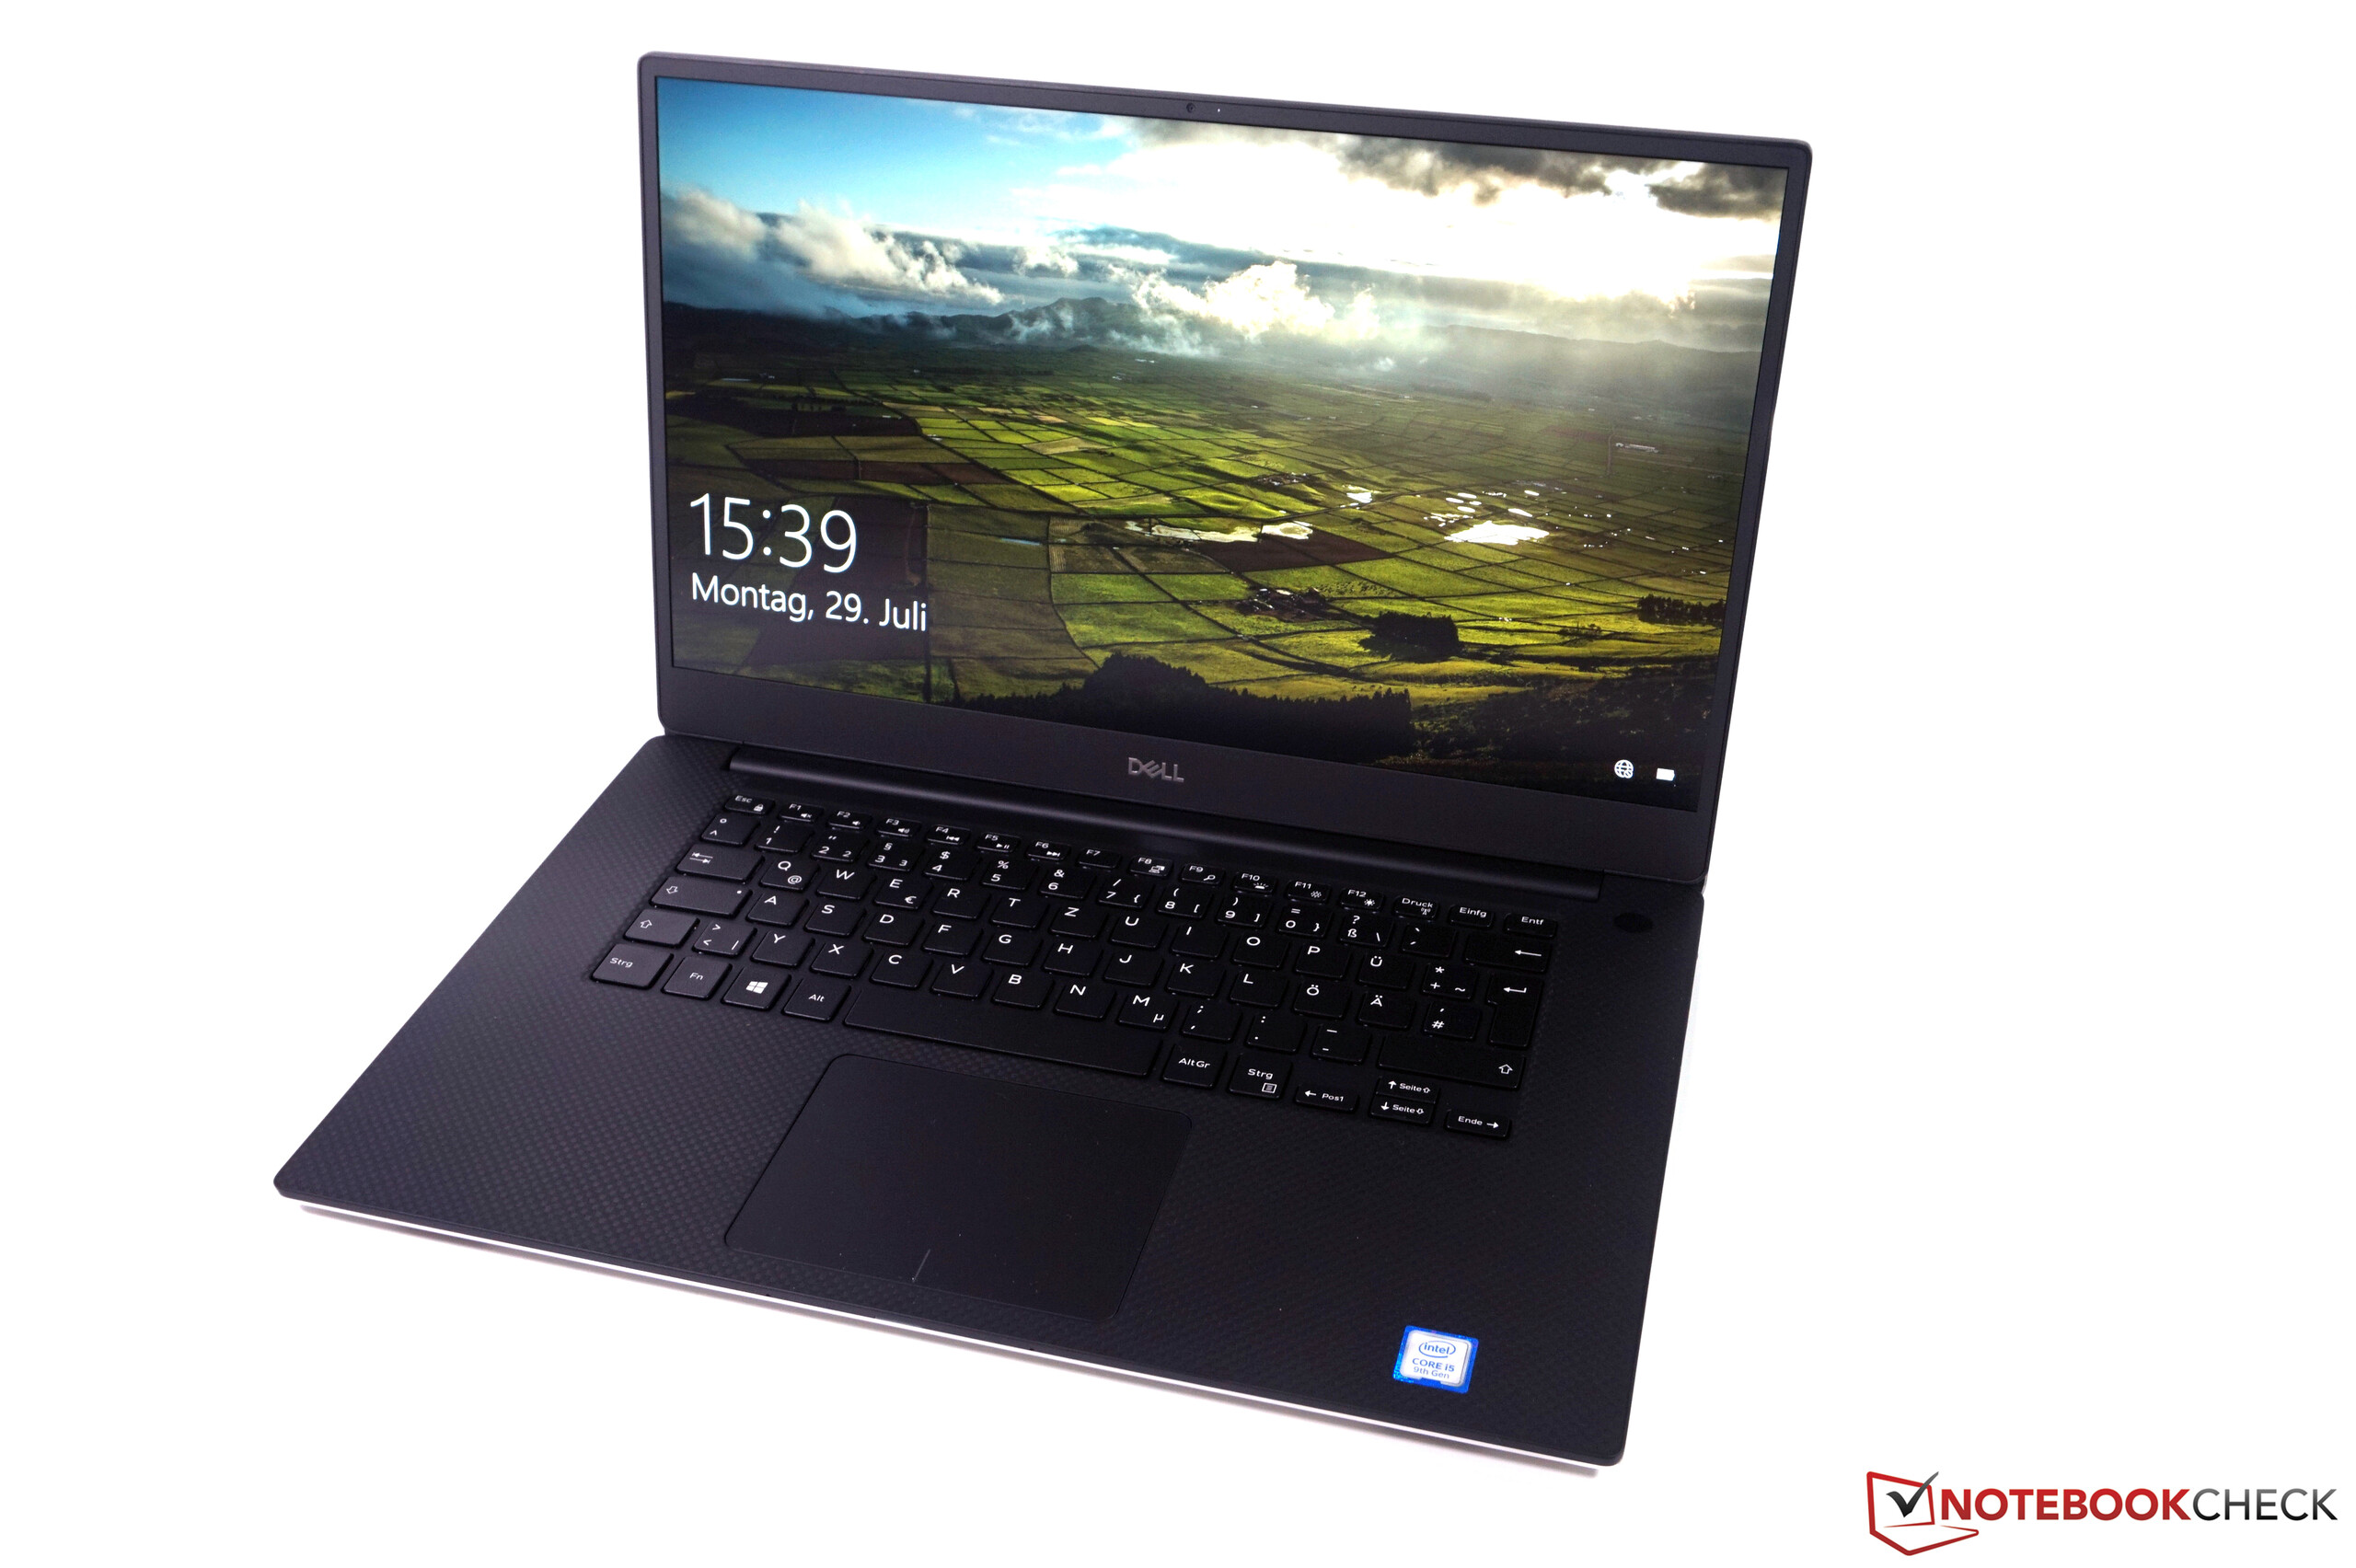
Den som inte tänker spela spel på resande fot utan bara vill ha en högkvalitativ multimedialaptop med en riktigt bra 1080p-skärm kommer definitivt inte hamna fel med grundversionen av senaste Dell XPS 15 7590. Den har till och med några fördelar såsom bättre synlighet utomhus och utmärkt batteritid som man inte får på 4K-versionerna av XPS 15.
Den matta Full HD-skärmen är ett riktigt bra val och har till och med en fördel gentemot 4K-panelerna när det kommer till maximal ljusstyrka. Kombinationen av matt yta och låg energiförbrukning gör den definitivt till det bättre valet om du ofta jobbar mobilt. Då kan du dra nytta av den extremt långa batteritiden som du inte får på 4K-versionerna av XPS 15 (oavsett om du väljer IPS eller OLED).
Dell XPS 15 7590 i5 iGPU FHD
- 09/26/2019 v7 (old)
Andreas Osthoff
Price comparison
