Test: Lenovo ThinkPad E14 - Tunn design slår uppgraderingsmöjligheter (Sammanfattning)
Gradering | Datum | Modell | Vikt | Höjd | Storlek | Upplösning | Pris |
|---|---|---|---|---|---|---|---|
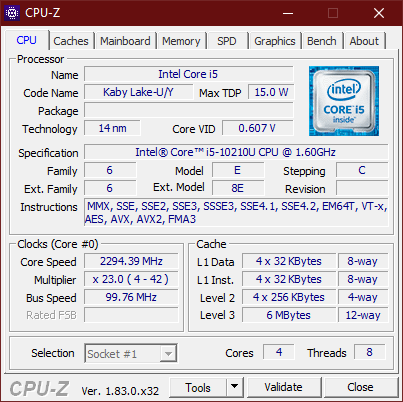
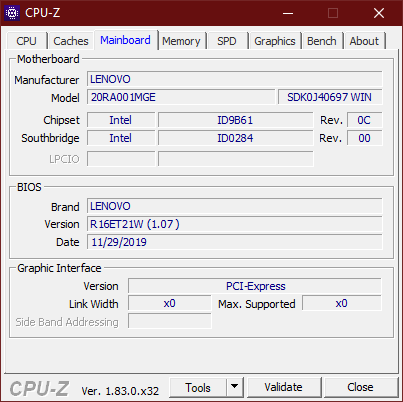
| 84.5 % v7 (old) | 03/2020 | Lenovo ThinkPad E14 20RA001MGE i5-10210U, UHD Graphics 620 | 1.6 kg | 17.9 mm | 14.00" | 1920x1080 | |
| 85.9 % v7 (old) | 08/2019 | Lenovo ThinkPad E490-20N8000RGE i5-8265U, UHD Graphics 620 | 1.8 kg | 19.9 mm | 14.00" | 1920x1080 | |
| 80.9 % v7 (old) | 02/2020 | MSI Modern 14 A10RB-459US i5-10210U, GeForce MX250 | 1.2 kg | 16 mm | 14.00" | 1920x1080 | |
| 83 % v7 (old) | 10/2019 | Dell Latitude 3400 i3-8145U, UHD Graphics 620 | 1.7 kg | 18.65 mm | 14.00" | 1920x1080 | |
| 87.9 % v7 (old) | 06/2019 | Lenovo ThinkPad T490-20N2004EGE i5-8265U, UHD Graphics 620 | 1.4 kg | 17.9 mm | 14.00" | 1920x1080 |

| |||||||||||||||||||||||||
Distribution av ljusstyrkan: 89 %
Mitt på batteriet: 308 cd/m²
Kontrast: 1794:1 (Svärta: 0.17 cd/m²)
ΔE ColorChecker Calman: 5.9 | ∀{0.5-29.43 Ø4.71}
calibrated: 4.6
ΔE Greyscale Calman: 4.4 | ∀{0.09-98 Ø4.96}
59.6% sRGB (Argyll 1.6.3 3D)
38.2% AdobeRGB 1998 (Argyll 1.6.3 3D)
41.65% AdobeRGB 1998 (Argyll 3D)
60% sRGB (Argyll 3D)
40.31% Display P3 (Argyll 3D)
Gamma: 2.05
CCT: 6921 K
| Lenovo ThinkPad E14 20RA001MGE NV140FHM-N48, IPS LED, 1920x1080, 14" | Lenovo ThinkPad E490-20N8000RGE Lenovo NV140FHM-N49, IPS, 1920x1080, 14" | MSI Modern 14 A10RB-459US Chi Mei N140HCE-EN2, IPS, 1920x1080, 14" | Dell Latitude 3400 BOE NV14N4H, IPS, 1920x1080, 14" | Lenovo ThinkPad T490-20N2004EGE NE140FHM-N61, IGZO IPS LED, 1920x1080, 14" | |
|---|---|---|---|---|---|
| Display | -1% | 58% | 0% | 63% | |
| Display P3 Coverage (%) | 40.31 | 39.85 -1% | 64.2 59% | 40.68 1% | 69.2 72% |
| sRGB Coverage (%) | 60 | 58.6 -2% | 94.8 58% | 59.3 -1% | 92.3 54% |
| AdobeRGB 1998 Coverage (%) | 41.65 | 41.18 -1% | 65.4 57% | 42.03 1% | 67.6 62% |
| Response Times | 5% | 17% | 4% | -26% | |
| Response Time Grey 50% / Grey 80% * (ms) | 52 ? | 48.4 ? 7% | 39.2 ? 25% | 44 ? 15% | 71.2 ? -37% |
| Response Time Black / White * (ms) | 39.2 ? | 38.4 ? 2% | 35.6 ? 9% | 42 ? -7% | 44.8 ? -14% |
| PWM Frequency (Hz) | 1250 ? | 1250 ? | 25000 ? | 1000 ? | 2427 ? |
| Screen | -1% | 31% | -16% | 20% | |
| Brightness middle (cd/m²) | 305 | 305 0% | 324.1 6% | 240 -21% | 428 40% |
| Brightness (cd/m²) | 292 | 295 1% | 301 3% | 227 -22% | 409 40% |
| Brightness Distribution (%) | 89 | 90 1% | 87 -2% | 79 -11% | 91 2% |
| Black Level * (cd/m²) | 0.17 | 0.23 -35% | 0.22 -29% | 0.48 -182% | 0.29 -71% |
| Contrast (:1) | 1794 | 1326 -26% | 1473 -18% | 500 -72% | 1476 -18% |
| Colorchecker dE 2000 * | 5.9 | 5.3 10% | 1.63 72% | 4.2 29% | 4.6 22% |
| Colorchecker dE 2000 max. * | 18.4 | 18.9 -3% | 4.25 77% | 7.16 61% | 8.2 55% |
| Colorchecker dE 2000 calibrated * | 4.6 | 5 -9% | 1.42 69% | 2 57% | |
| Greyscale dE 2000 * | 4.4 | 2.3 48% | 2.2 50% | 1.75 60% | 5.4 -23% |
| Gamma | 2.05 107% | 2.09 105% | 2.26 97% | 2.36 93% | 2.09 105% |
| CCT | 6921 94% | 6246 104% | 6887 94% | 6387 102% | 7562 86% |
| Color Space (Percent of AdobeRGB 1998) (%) | 38.2 | 37.7 -1% | 60.2 58% | 38 -1% | 60 57% |
| Color Space (Percent of sRGB) (%) | 59.6 | 58.2 -2% | 95 59% | 59 -1% | 92.2 55% |
| Totalt genomsnitt (program/inställningar) | 1% /
-1% | 35% /
35% | -4% /
-10% | 19% /
22% |
* ... mindre är bättre
Visa svarstider
| ↔ Svarstid svart till vitt | ||
|---|---|---|
| 39.2 ms ... stiga ↗ och falla ↘ kombinerat | ↗ 22 ms stiga | 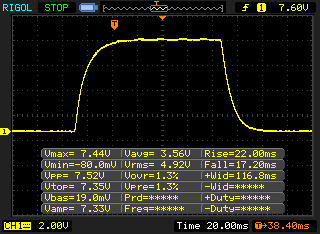 |
| ↘ 17.2 ms hösten | ||
| Skärmen visar långsamma svarsfrekvenser i våra tester och kommer att vara otillfredsställande för spelare. I jämförelse sträcker sig alla testade enheter från 0.1 (minst) till 240 (maximalt) ms. » 97 % av alla enheter är bättre. Detta innebär att den uppmätta svarstiden är sämre än genomsnittet av alla testade enheter (19.8 ms). | ||
| ↔ Svarstid 50 % grått till 80 % grått | ||
| 52 ms ... stiga ↗ och falla ↘ kombinerat | ↗ 26 ms stiga | 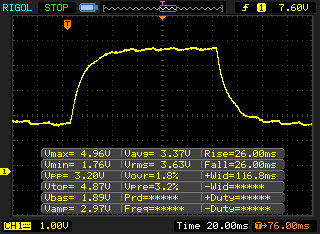 |
| ↘ 26 ms hösten | ||
| Skärmen visar långsamma svarsfrekvenser i våra tester och kommer att vara otillfredsställande för spelare. I jämförelse sträcker sig alla testade enheter från 0.165 (minst) till 636 (maximalt) ms. » 88 % av alla enheter är bättre. Detta innebär att den uppmätta svarstiden är sämre än genomsnittet av alla testade enheter (30.9 ms). | ||
Skärmflimmer / PWM (Puls-Width Modulation)
| Skärmflimmer / PWM upptäckt | 1250 Hz | ≤ 99 % ljusstyrka inställning | 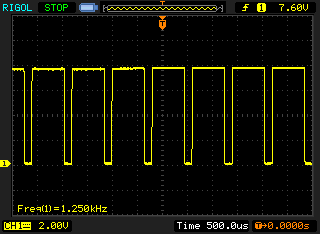 |
Displayens bakgrundsbelysning flimrar vid 1250 Hz (i värsta fall, t.ex. med PWM) Flimrande upptäckt vid en ljusstyrkeinställning på 99 % och lägre. Det ska inte finnas något flimmer eller PWM över denna ljusstyrkeinställning. Frekvensen för 1250 Hz är ganska hög, så de flesta användare som är känsliga för PWM bör inte märka något flimmer. Som jämförelse: 52 % av alla testade enheter använder inte PWM för att dämpa skärmen. Om PWM upptäcktes mättes ett medelvärde av 7748 (minst: 5 - maximum: 343500) Hz. | |||
| PCMark 8 Home Score Accelerated v2 | 3402 poäng | |
| PCMark 8 Work Score Accelerated v2 | 5001 poäng | |
| PCMark 10 Score | 3901 poäng | |
Hjälp | ||
| Lenovo ThinkPad E14 20RA001MGE SK hynix BC501 HFM512GDHTNG-8310A | Lenovo ThinkPad E490-20N8000RGE SK hynix BC501 HFM256GDHTNG | MSI Modern 14 A10RB-459US Kingston RBUSNS8154P3512GJ | Dell Latitude 3400 WDC PC SN520 SDAPNUW-256G | Lenovo ThinkPad T490-20N2004EGE Toshiba KXG5AZNV256G | Genomsnitt SK hynix BC501 HFM512GDHTNG-8310A | |
|---|---|---|---|---|---|---|
| CrystalDiskMark 5.2 / 6 | -9% | -2% | 9% | 24% | -9% | |
| Write 4K (MB/s) | 121.9 | 110.7 -9% | 107.7 -12% | 107.9 -11% | 119.9 -2% | 110 ? -10% |
| Read 4K (MB/s) | 42.66 | 41.02 -4% | 39.73 -7% | 40.27 -6% | 39.94 -6% | 40.6 ? -5% |
| Write Seq (MB/s) | 628 | 757 21% | 926 47% | 1253 100% | 1334 112% | 677 ? 8% |
| Read Seq (MB/s) | 1193 | 1037 -13% | 1014 -15% | 1298 9% | 1357 14% | 1104 ? -7% |
| Write 4K Q32T1 (MB/s) | 590 | 359 -39% | 343.6 -42% | 415 -30% | 311.2 -47% | 438 ? -26% |
| Read 4K Q32T1 (MB/s) | 414.5 | 402.4 -3% | 499.1 20% | 313.3 -24% | 400.6 -3% | 338 ? -18% |
| Write Seq Q32T1 (MB/s) | 866 | 833 -4% | 1033 19% | 1297 50% | 1642 90% | 860 ? -1% |
| Read Seq Q32T1 (MB/s) | 2078 | 1635 -21% | 1604 -23% | 1728 -17% | 2778 34% | 1786 ? -14% |

| 3DMark 11 Performance | 1938 poäng | |
| 3DMark Cloud Gate Standard Score | 8057 poäng | |
| 3DMark Fire Strike Score | 1072 poäng | |
Hjälp | ||
| låg | med. | hög | ultra | |
|---|---|---|---|---|
| BioShock Infinite (2013) | 59.8 | 33.23 | 27.38 | 8.74 |
| Dota 2 Reborn (2015) | 68.7 | 40.7 | 19.3 | 17.1 |
| Rise of the Tomb Raider (2016) | 20.6 | |||
| X-Plane 11.11 (2018) | 10.6 | 9.02 | 8.8 | |
| Total War: Three Kingdoms (2019) | 23.4 |
Ljudnivå
| Låg belastning |
| 29.2 / 29.2 / 29.2 dB(A) |
| Hög belastning |
| 29.5 / 29.9 dB(A) |
 | ||
30 dB tyst 40 dB(A) hörbar 50 dB(A) högt ljud |
||
min: | ||
(±) Den maximala temperaturen på ovansidan är 41.7 °C / 107 F, jämfört med genomsnittet av 34.3 °C / 94 F , allt från 21.2 till 62.5 °C för klassen Office.
(±) Botten värms upp till maximalt 40.3 °C / 105 F, jämfört med genomsnittet av 36.8 °C / 98 F
(+) Vid tomgångsbruk är medeltemperaturen för ovansidan 23.8 °C / 75 F, jämfört med enhetsgenomsnittet på 29.5 °C / ### class_avg_f### F.
(+) Handledsstöden och pekplattan är kallare än hudtemperaturen med maximalt 30 °C / 86 F och är därför svala att ta på.
(-) Medeltemperaturen för handledsstödsområdet på liknande enheter var 27.6 °C / 81.7 F (-2.4 °C / -4.3 F).
Lenovo ThinkPad E14 20RA001MGE ljudanalys
(±) | högtalarljudstyrkan är genomsnittlig men bra (73.6 dB)
Bas 100 - 315 Hz
(-) | nästan ingen bas - i genomsnitt 18.3% lägre än medianen
(-) | basen är inte linjär (15.8% delta till föregående frekvens)
Mellan 400 - 2000 Hz
(±) | högre mellan - i genomsnitt 6.4% högre än median
(±) | linjäriteten för mids är genomsnittlig (8.2% delta till föregående frekvens)
Högsta 2 - 16 kHz
(+) | balanserade toppar - endast 3.2% från medianen
(±) | linjäriteten för toppar är genomsnittlig (11.7% delta till föregående frekvens)
Totalt 100 - 16 000 Hz
(±) | linjäriteten för det totala ljudet är genomsnittlig (26.4% skillnad mot median)
Jämfört med samma klass
» 81% av alla testade enheter i den här klassen var bättre, 6% liknande, 12% sämre
» Den bästa hade ett delta på 7%, genomsnittet var 21%, sämst var 53%
Jämfört med alla testade enheter
» 81% av alla testade enheter var bättre, 4% liknande, 15% sämre
» Den bästa hade ett delta på 4%, genomsnittet var 23%, sämst var 134%
Apple MacBook 12 (Early 2016) 1.1 GHz ljudanalys
(+) | högtalare kan spela relativt högt (83.6 dB)
Bas 100 - 315 Hz
(±) | reducerad bas - i genomsnitt 11.3% lägre än medianen
(±) | linjäriteten för basen är genomsnittlig (14.2% delta till föregående frekvens)
Mellan 400 - 2000 Hz
(+) | balanserad mellan - endast 2.4% från medianen
(+) | mids är linjära (5.5% delta till föregående frekvens)
Högsta 2 - 16 kHz
(+) | balanserade toppar - endast 2% från medianen
(+) | toppar är linjära (4.5% delta till föregående frekvens)
Totalt 100 - 16 000 Hz
(+) | det totala ljudet är linjärt (10.2% skillnad mot median)
Jämfört med samma klass
» 7% av alla testade enheter i den här klassen var bättre, 2% liknande, 90% sämre
» Den bästa hade ett delta på 5%, genomsnittet var 18%, sämst var 53%
Jämfört med alla testade enheter
» 5% av alla testade enheter var bättre, 1% liknande, 94% sämre
» Den bästa hade ett delta på 4%, genomsnittet var 23%, sämst var 134%
| Av/Standby | |
| Låg belastning | |
| Hög belastning |
|
Förklaring:
min: | |
| Lenovo ThinkPad E14 20RA001MGE i5-10210U, UHD Graphics 620, SK hynix BC501 HFM512GDHTNG-8310A, IPS LED, 1920x1080, 14" | Lenovo ThinkPad E490-20N8000RGE i5-8265U, UHD Graphics 620, SK hynix BC501 HFM256GDHTNG, IPS, 1920x1080, 14" | MSI Modern 14 A10RB-459US i5-10210U, GeForce MX250, Kingston RBUSNS8154P3512GJ, IPS, 1920x1080, 14" | Dell Latitude 3400 i3-8145U, UHD Graphics 620, WDC PC SN520 SDAPNUW-256G, IPS, 1920x1080, 14" | Lenovo ThinkPad T490-20N2004EGE i5-8265U, UHD Graphics 620, Toshiba KXG5AZNV256G, IGZO IPS LED, 1920x1080, 14" | Genomsnitt Intel UHD Graphics 620 | Genomsnitt av klass Office | |
|---|---|---|---|---|---|---|---|
| Power Consumption | 11% | -32% | 12% | 5% | -10% | -26% | |
| Idle Minimum * (Watt) | 3.01 | 2.76 8% | 4.2 -40% | 2.4 20% | 2.34 22% | 3.81 ? -27% | 4.25 ? -41% |
| Idle Average * (Watt) | 6.32 | 5.96 6% | 5.9 7% | 4.9 22% | 5.22 17% | 6.94 ? -10% | 7.3 ? -16% |
| Idle Maximum * (Watt) | 8.78 | 6.57 25% | 7.2 18% | 7.4 16% | 8.82 -0% | 8.75 ? -0% | 8.57 ? 2% |
| Load Average * (Watt) | 32.5 | 28.2 13% | 63.4 -95% | 31 5% | 35.8 -10% | 35 ? -8% | 43.8 ? -35% |
| Load Maximum * (Watt) | 45.5 | 43.6 4% | 67.4 -48% | 47 -3% | 47.3 -4% | 47.5 ? -4% | 64.5 ? -42% |
| Witcher 3 ultra * (Watt) | 53.5 |
* ... mindre är bättre
| Lenovo ThinkPad E14 20RA001MGE i5-10210U, UHD Graphics 620, 45 Wh | Lenovo ThinkPad E490-20N8000RGE i5-8265U, UHD Graphics 620, 45 Wh | MSI Modern 14 A10RB-459US i5-10210U, GeForce MX250, 50 Wh | Lenovo ThinkPad T490-20N2004EGE i5-8265U, UHD Graphics 620, 50 Wh | Dell Latitude 3400 i3-8145U, UHD Graphics 620, 56 Wh | Genomsnitt av klass Office | |
|---|---|---|---|---|---|---|
| Batteridrifttid | 8% | 4% | 27% | 14% | 37% | |
| H.264 (h) | 10.3 | 11.5 12% | 11.3 10% | 15.4 ? 50% | ||
| WiFi v1.3 (h) | 8.5 | 8.1 -5% | 8.6 1% | 9.5 12% | 9.7 14% | 13.2 ? 55% |
| Load (h) | 1.7 | 2 18% | 1.8 6% | 2.7 59% | 1.808 ? 6% | |
| Reader / Idle (h) | 17.7 | 16.4 | 22.2 ? |
För
Emot

Läs den fullständiga versionen av den här recensionen på engelska här.
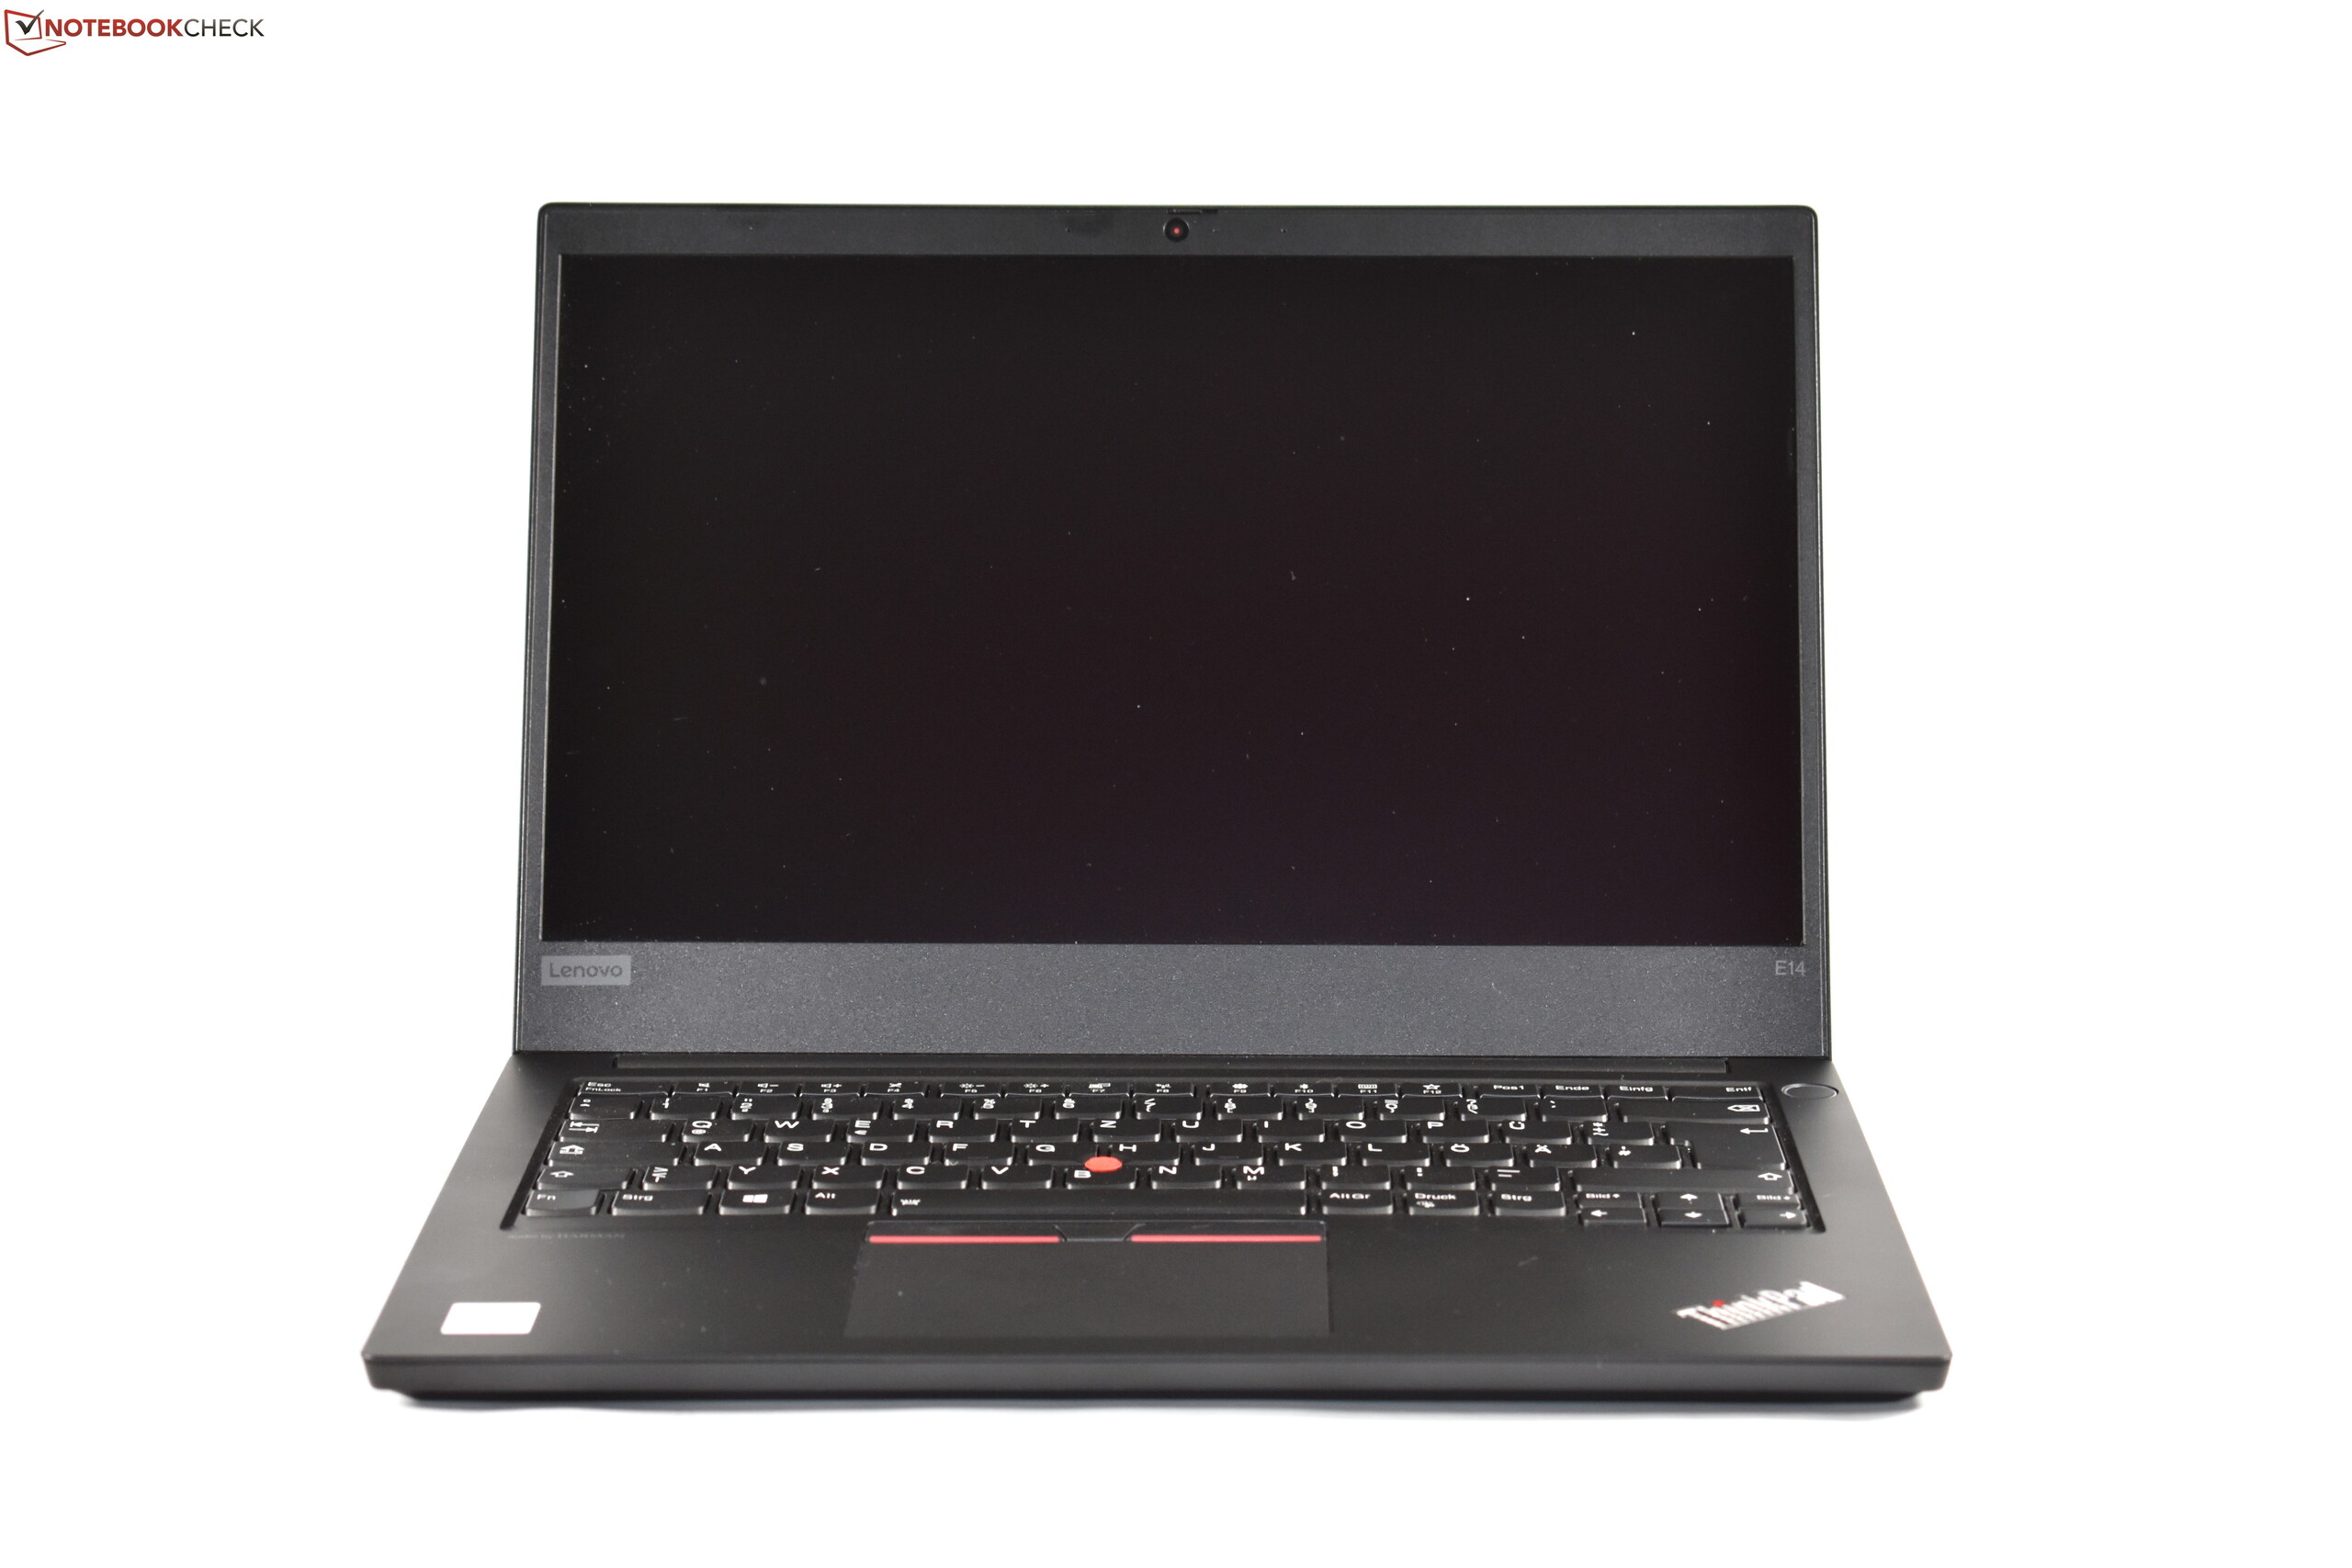
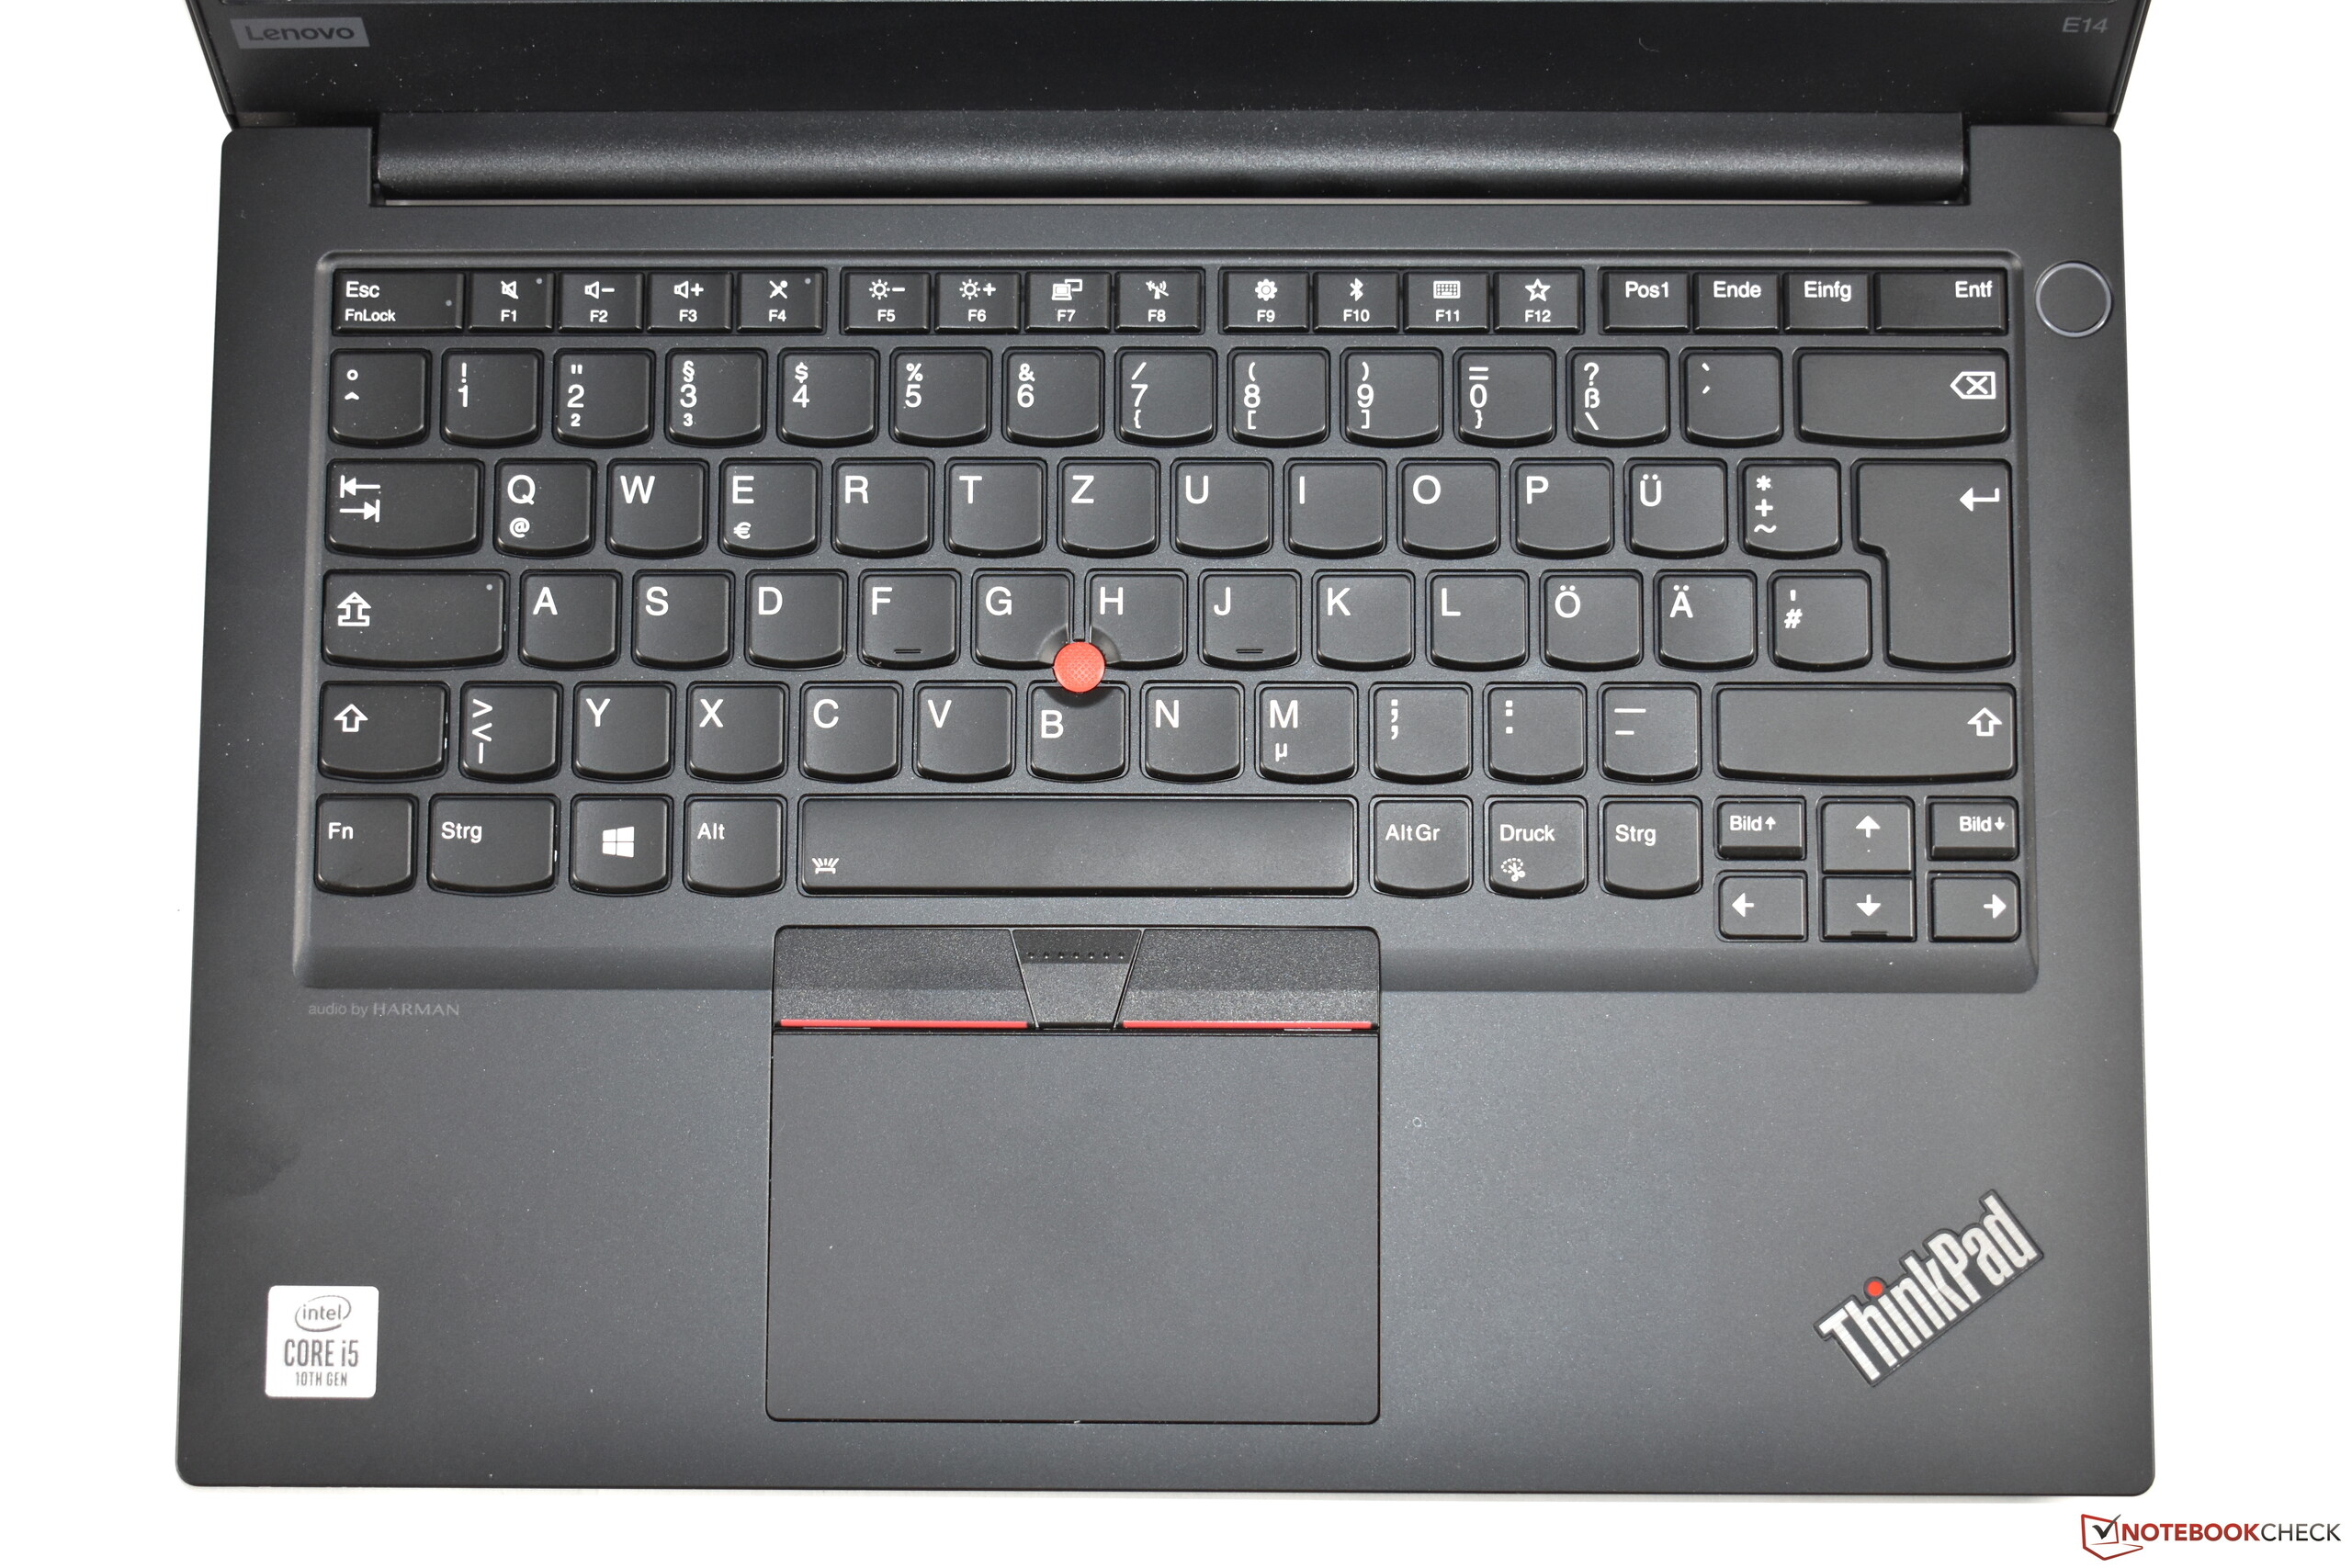
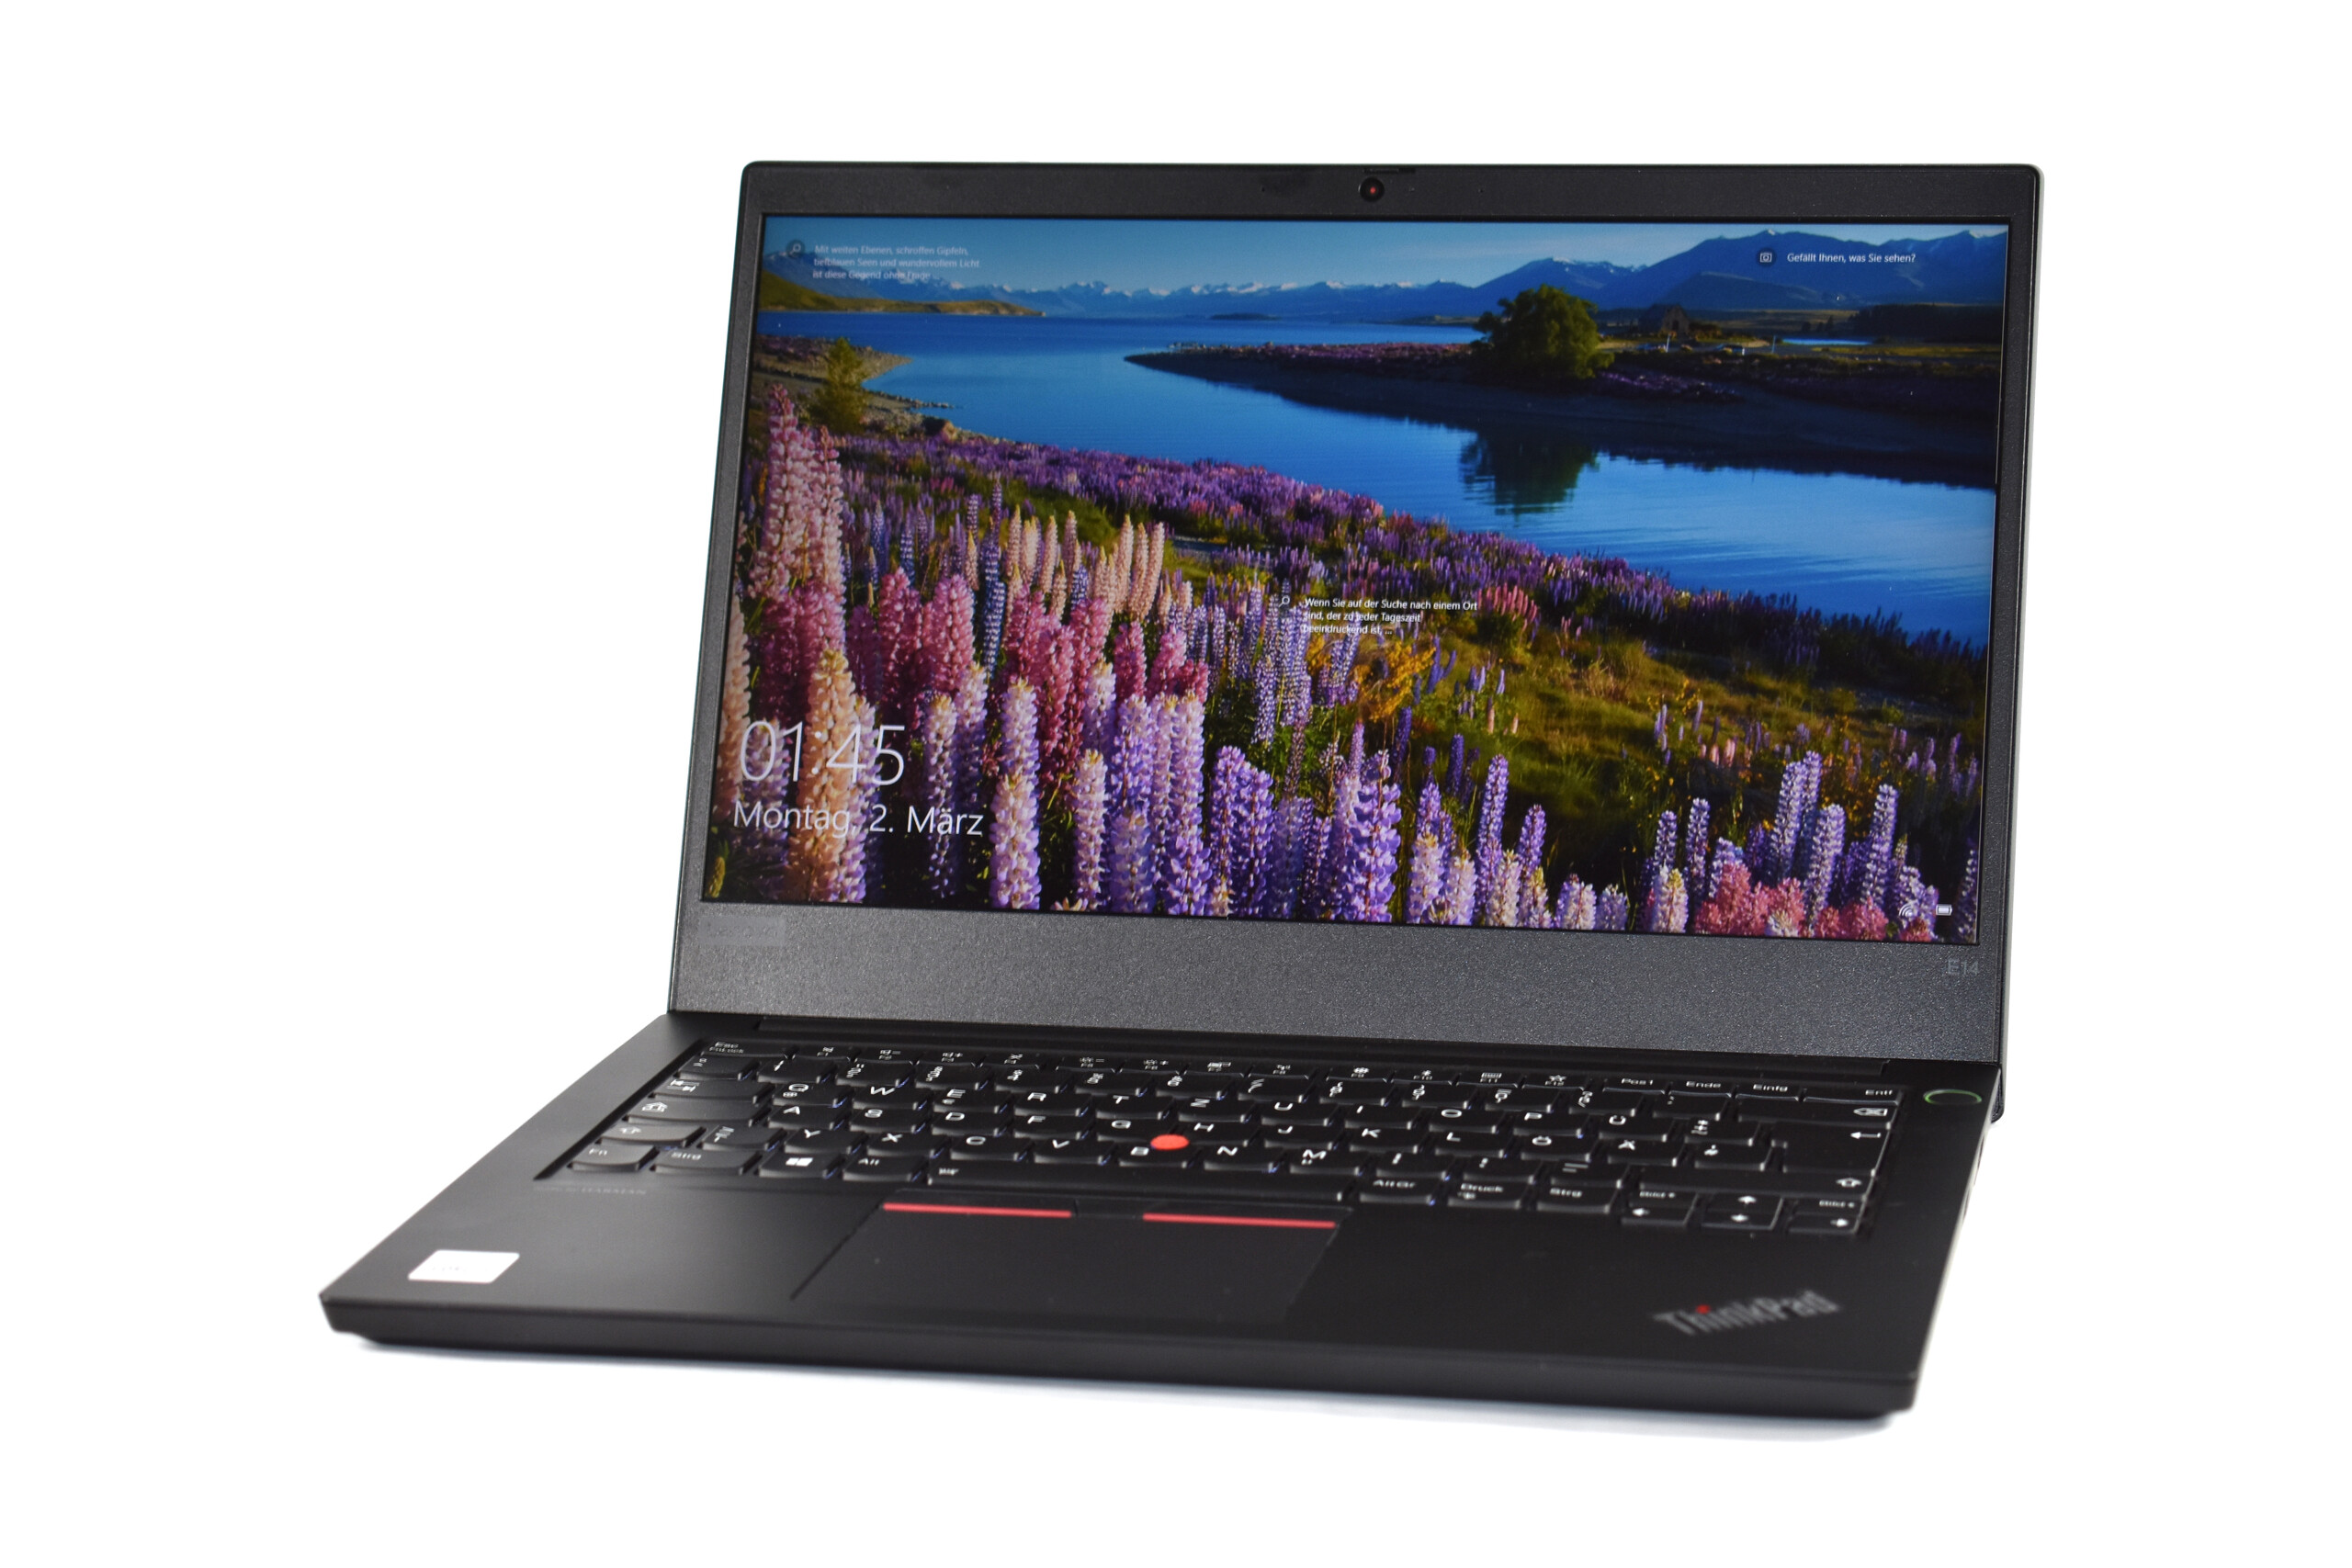
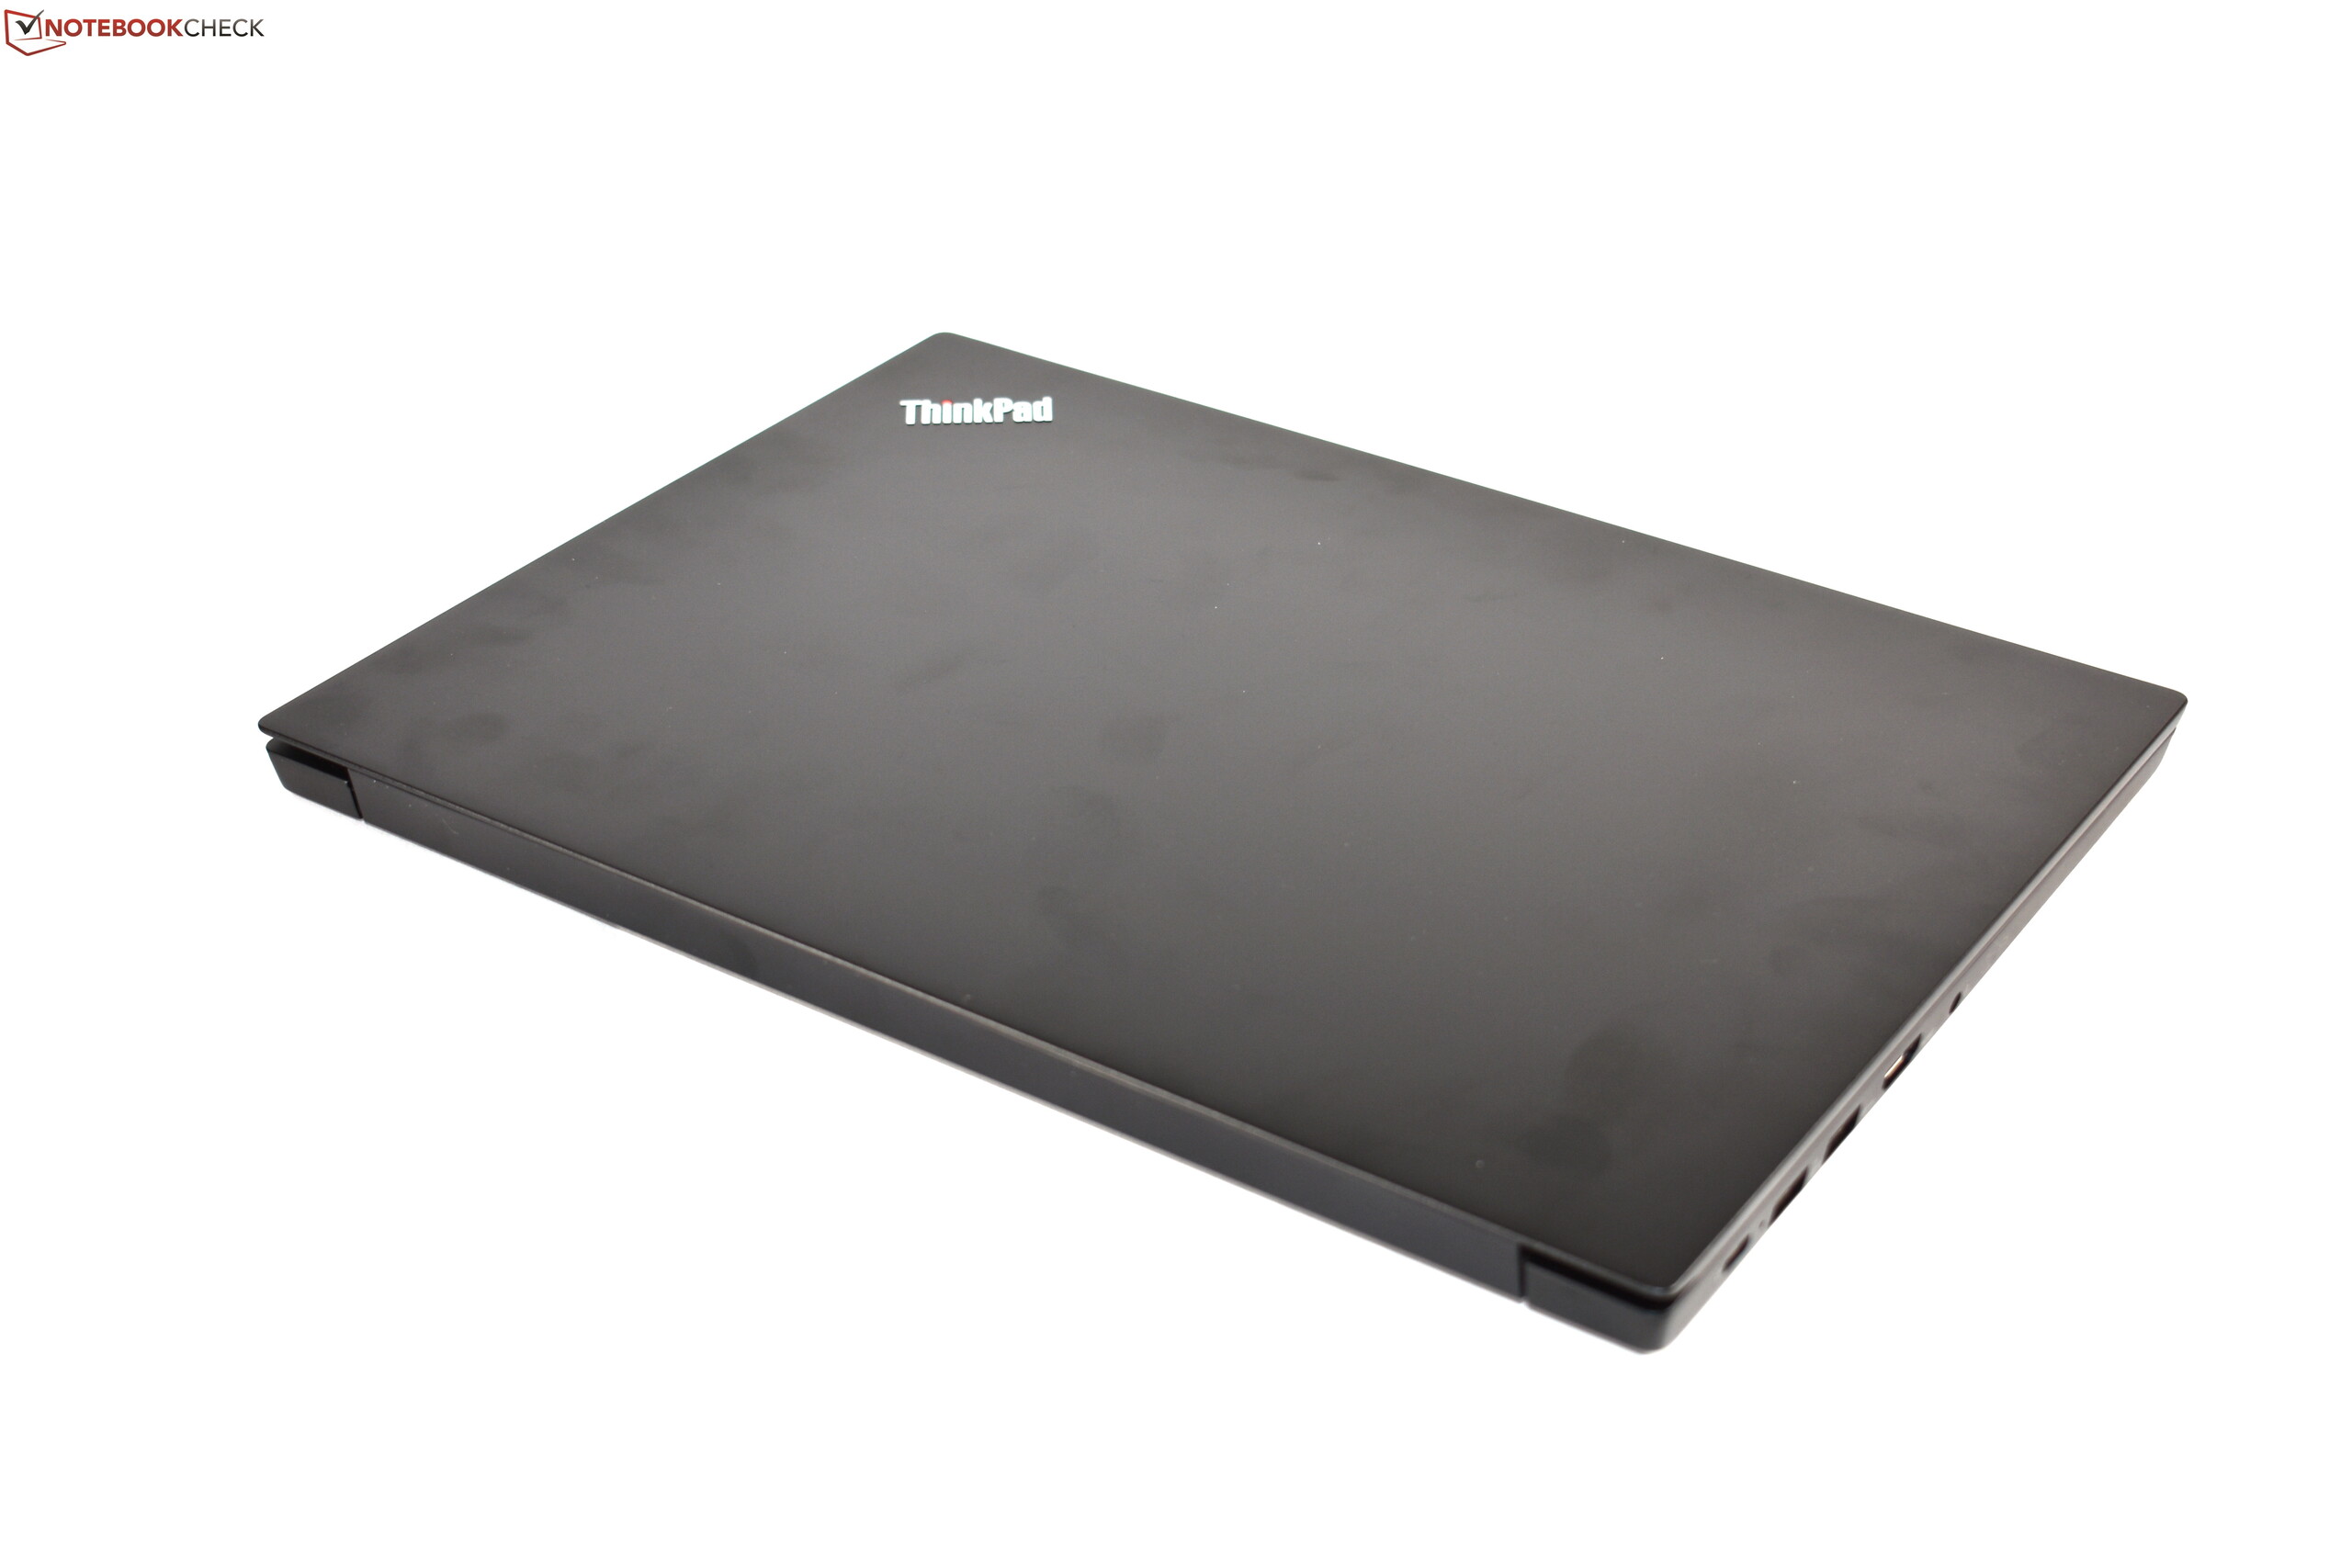
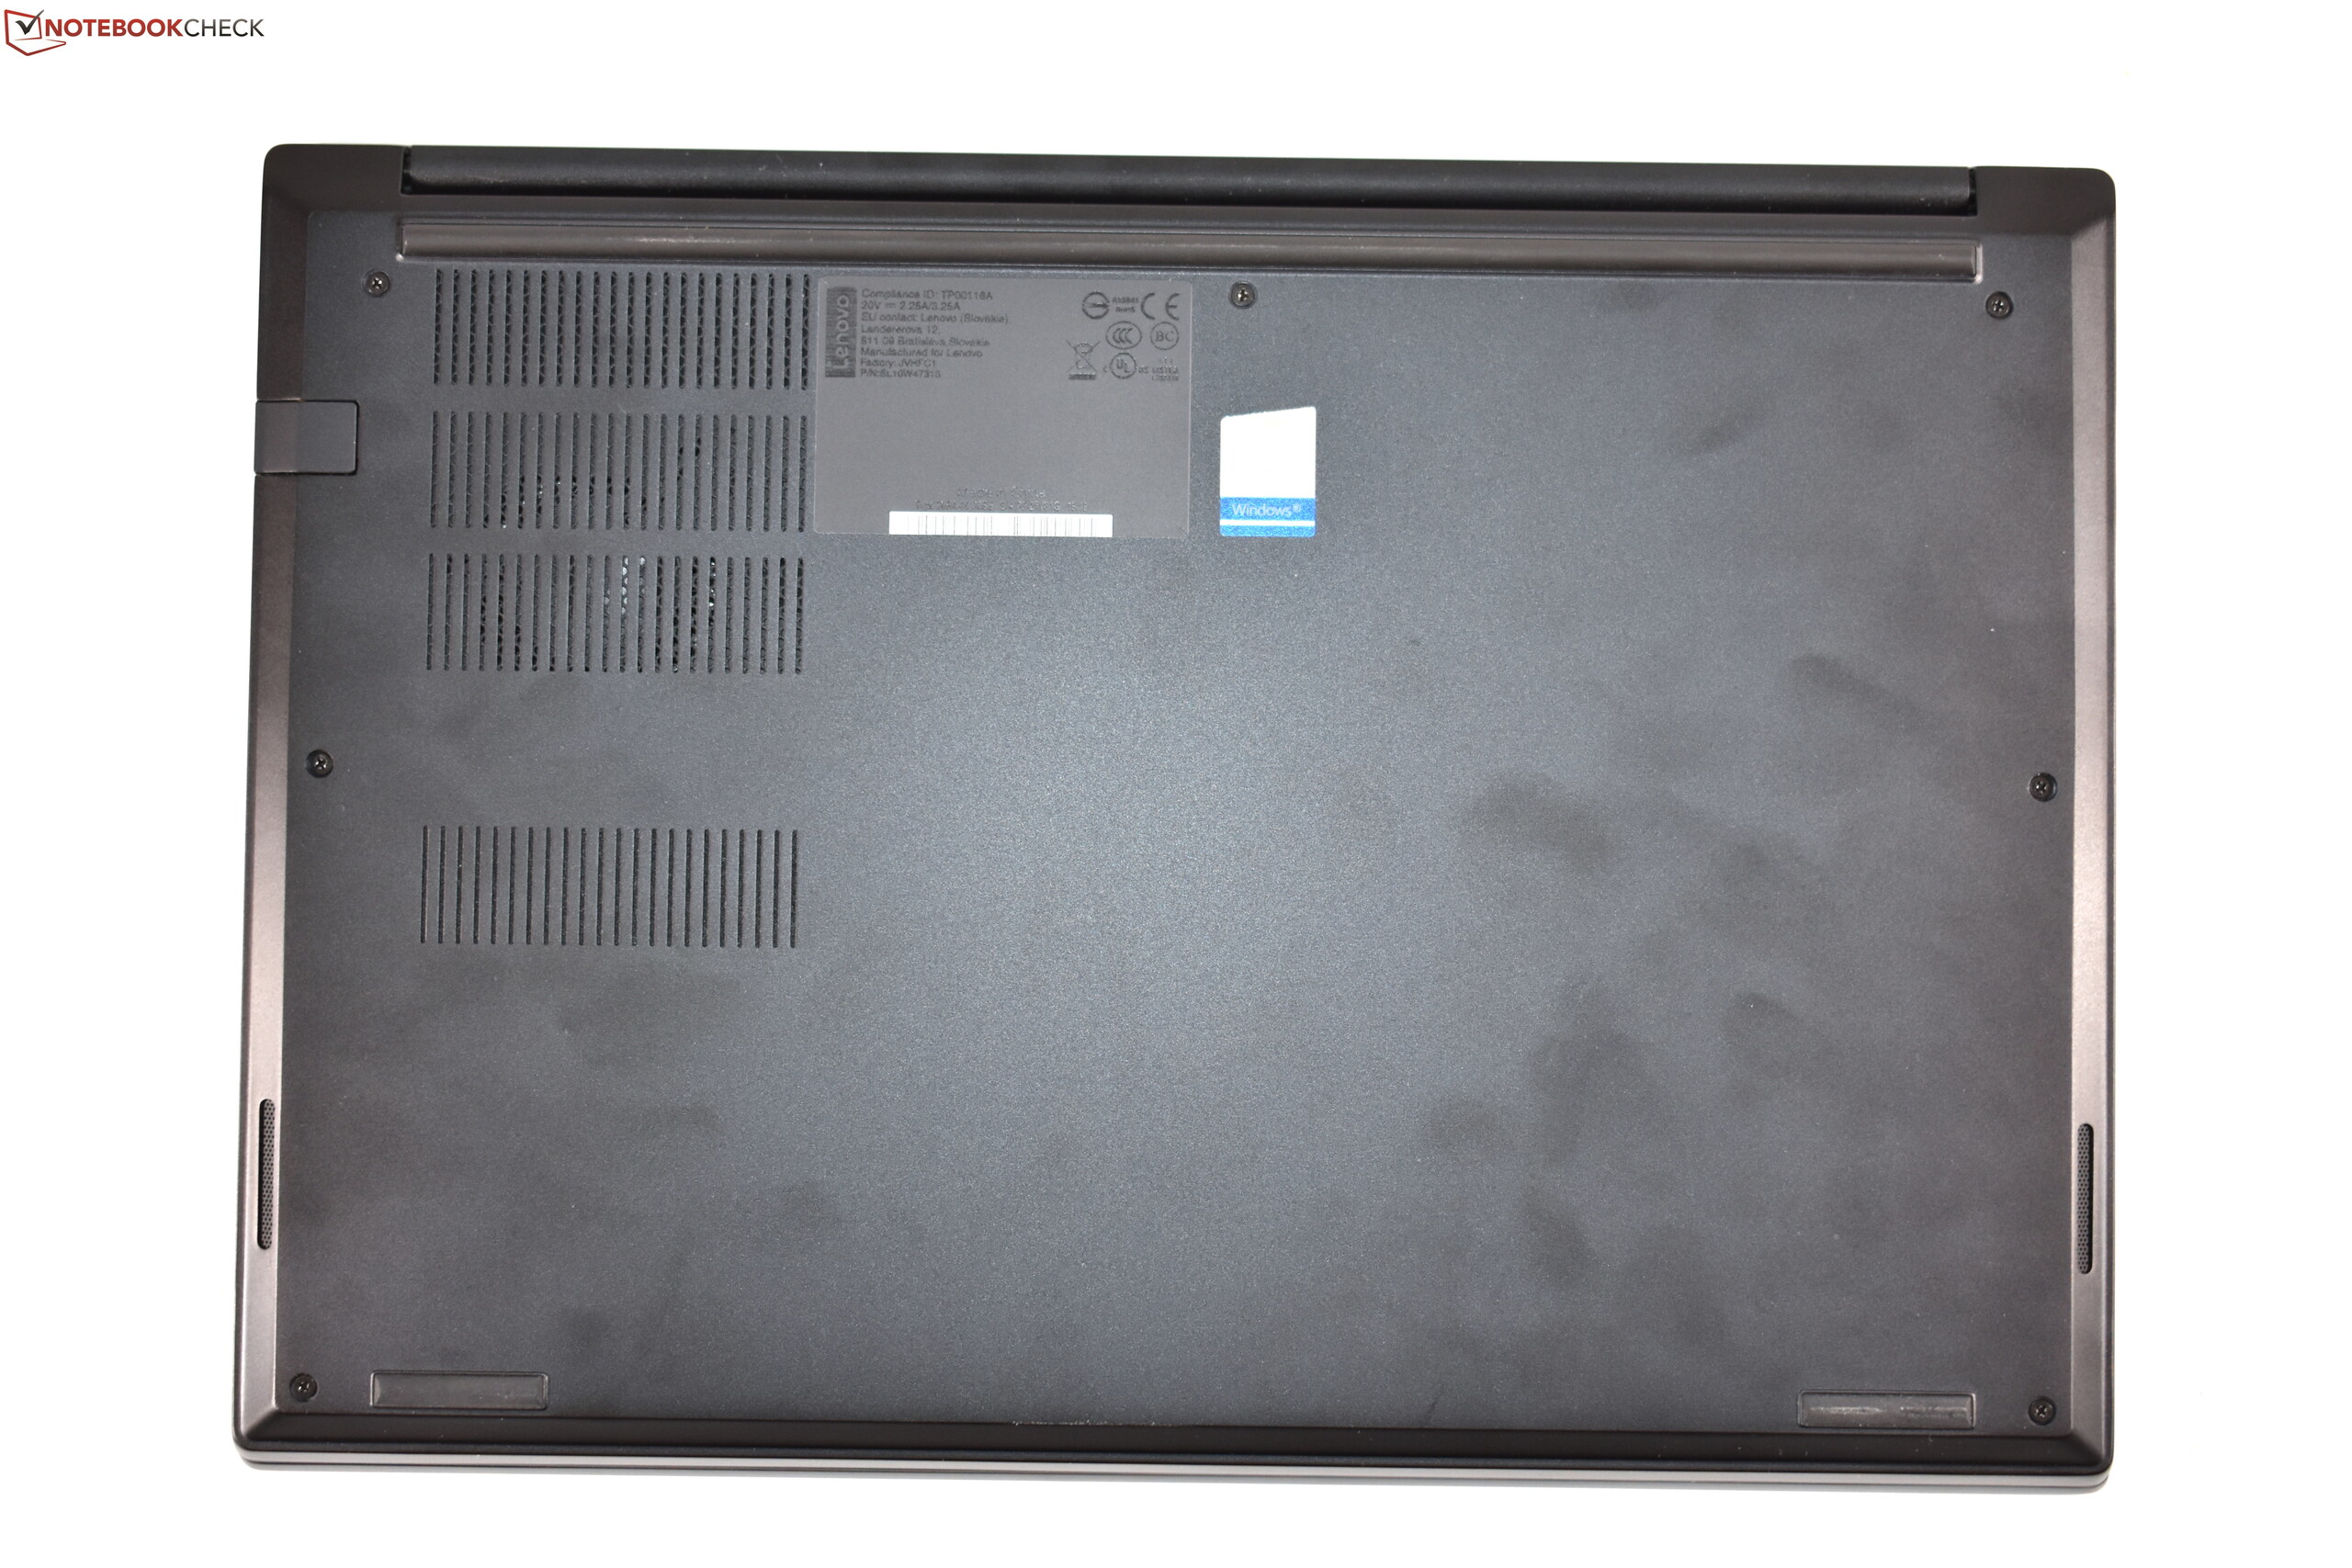
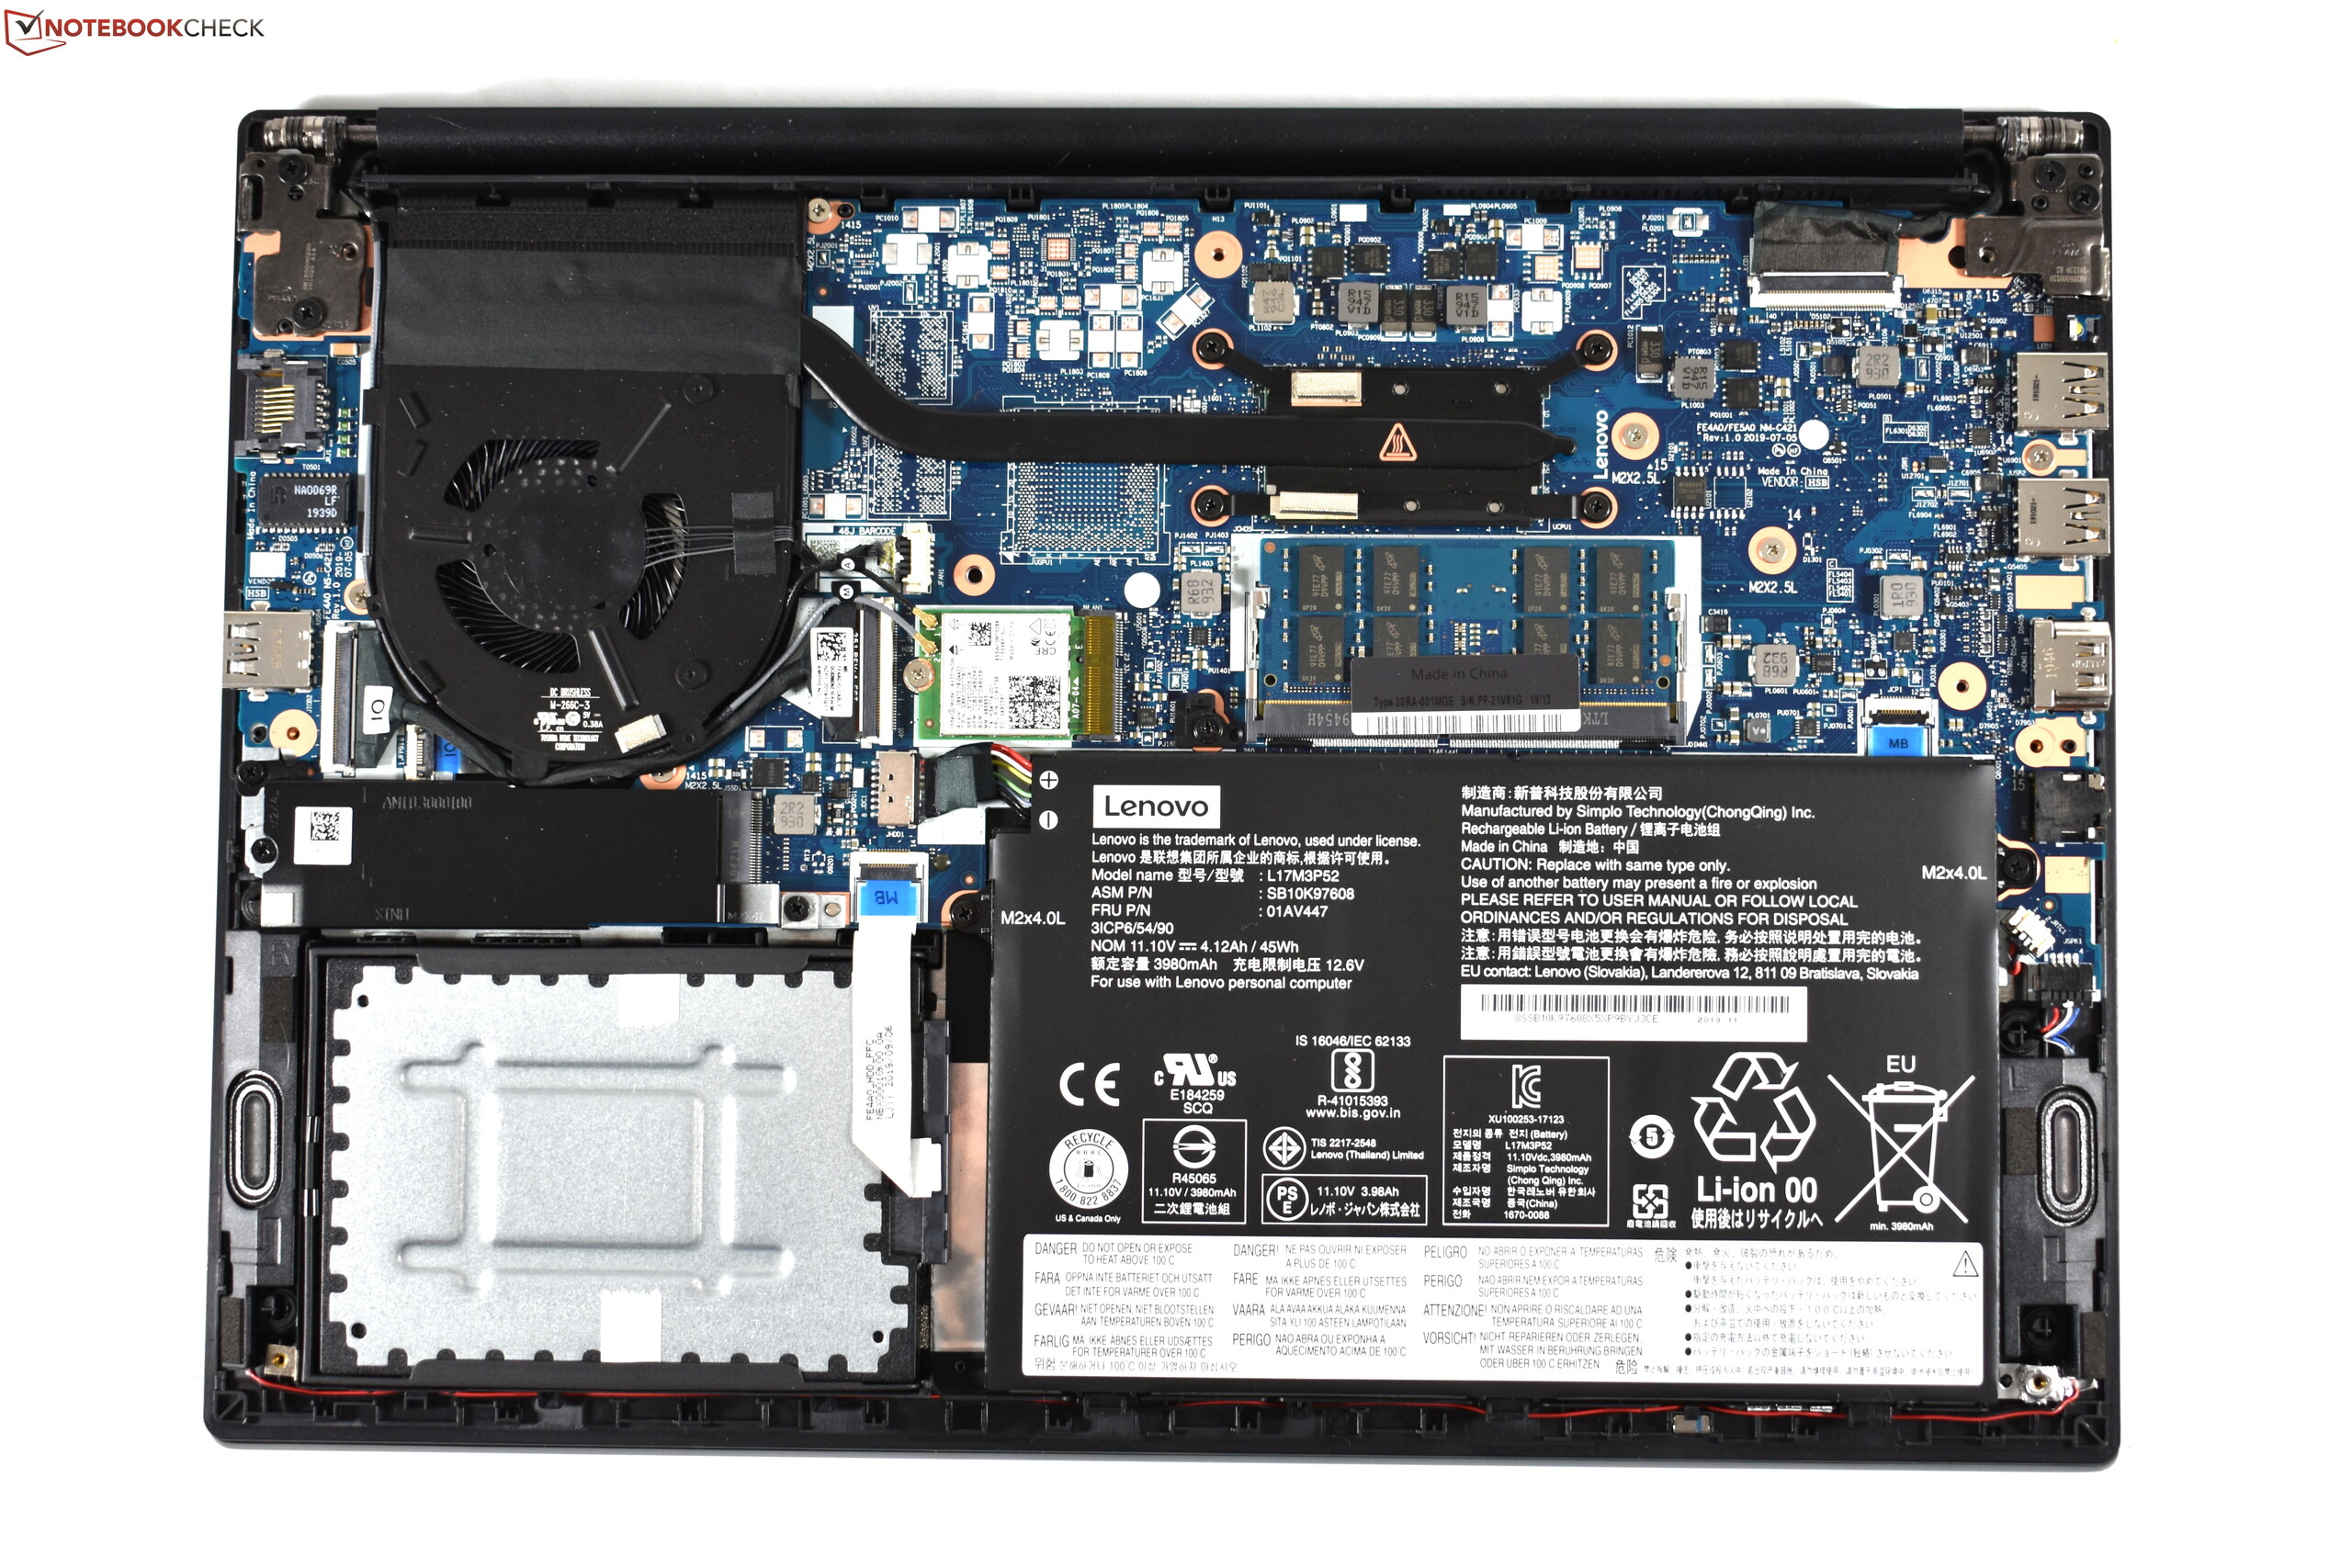
Lenovo fortsätter att utveckla sin E-serie med nya ThinkPad E14: Det tunnare chassit inspireras till stor del av designen från den äldre ThinkPad E490 och har därför också många av dess styrkor. En är de utmärkta ThinkPad-inmatningsenheterna. Andra inkluderar bra batteritid och låg värme/ljudnivå, även vid belastning. ThinkPad E14 går också fortfarande att uppgradera, särskilt när det gäller lagringen. Och tack vare att mer aluminium används känns den också mer högkvalitativ.
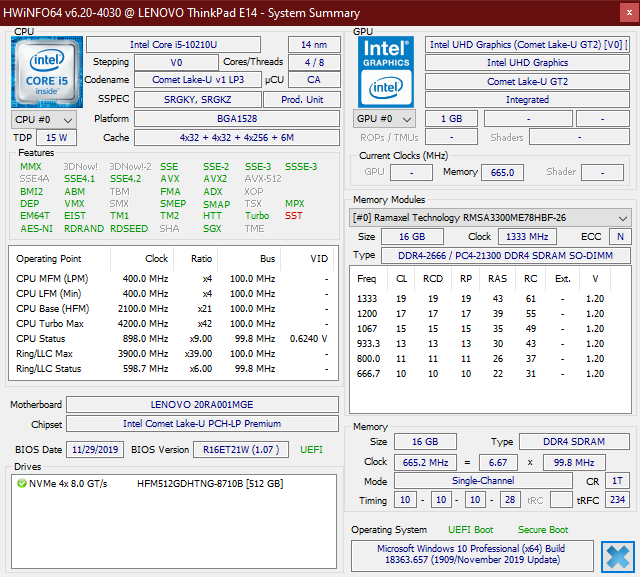
Tyvärr tar den också några steg bakåt: microSD-kortplatsen har tagits bort utan någon ersättning. Möjligheten att uppgradera RAM är också begränsad: Istället för två SO-DIMM platser och upp till 64 GB minne i dubbla kanaler har E14 bara en enda RAM-plats med stöd för upp till 32 GB RAM i enkel kanal. Andra brister inkluderar en kort garanti på 12 månader och en skärm med lågt färgomfång. Det knarrande ljudet som uppstår från gångjärnsområdet när man stänger skärmen är en aning oroväckande – här känns hantverket verkligen inte perfekt.
Egentligen inte bättre än sin föregångare: Lenovo ThinkPad E14 tar bort en del funktioner i onödan.
Totalt sett kan vi fortfarande rekommendera Lenovo ThinkPad E14 då den trots sina brister är en gedigen laptop för den med liten budget – men vi tycker inte den är lika tilltalande som sin föregångare, ThinkPad E490, eftersom en del funktioner saknas.
Lenovo ThinkPad E14 20RA001MGE
- 03/03/2020 v7 (old)
Benjamin Herzig
Price comparison
