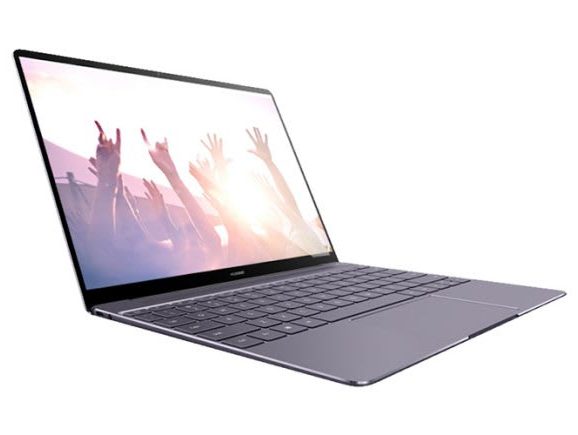
Test: Huawei MateBook 13 (i7-8565U, GeForce MX150) Laptop (Sammanfattning)
| |||||||||||||||||||||||||
Distribution av ljusstyrkan: 93 %
Mitt på batteriet: 366.7 cd/m²
Kontrast: 940:1 (Svärta: 0.39 cd/m²)
ΔE ColorChecker Calman: 2.76 | ∀{0.5-29.43 Ø4.73}
calibrated: 1.53
ΔE Greyscale Calman: 4.2 | ∀{0.09-98 Ø4.97}
97.6% sRGB (Argyll 1.6.3 3D)
63.2% AdobeRGB 1998 (Argyll 1.6.3 3D)
69.2% AdobeRGB 1998 (Argyll 3D)
97.7% sRGB (Argyll 3D)
68.1% Display P3 (Argyll 3D)
Gamma: 2.22
CCT: 6271 K
| Huawei MateBook 13 i7 Chi Mei CMN8201, IPS, 13", 2160x1440 | Dell XPS 13 9370 i7 UHD ID: Sharp SHP148B, Name: LQ133D1, Dell P/N: 8XDHY, IPS, 13.3", 3840x2160 | Apple MacBook Pro 13 2018 Touchbar i5 APPA03E, IPS, 13.3", 2560x1600 | HP Spectre x360 13t-ae000 LGD0588, IPS, 13.3", 3840x2160 | Lenovo Yoga C930-13IKB B139HAN03_0, IPS, 13.9", 1920x1080 | Huawei Matebook X Pro i5 Tianma XM, IPS, 13.9", 3000x2000 | |
|---|---|---|---|---|---|---|
| Display | 1% | 24% | 4% | -4% | -3% | |
| Display P3 Coverage (%) | 68.1 | 68.9 1% | 98.5 45% | 71.9 6% | 64.3 -6% | 65.9 -3% |
| sRGB Coverage (%) | 97.7 | 98.4 1% | 99.9 2% | 98.1 0% | 94.6 -3% | 95.2 -3% |
| AdobeRGB 1998 Coverage (%) | 69.2 | 69.5 0% | 87.3 26% | 73.1 6% | 66.2 -4% | 67.6 -2% |
| Response Times | -50% | -3% | -10% | 10% | 13% | |
| Response Time Grey 50% / Grey 80% * (ms) | 43.2 ? | 69.6 ? -61% | 46 ? -6% | 51.6 ? -19% | 40.8 ? 6% | 40.4 ? 6% |
| Response Time Black / White * (ms) | 32 ? | 44 ? -38% | 32 ? -0% | 32.4 ? -1% | 27.6 ? 14% | 25.6 ? 20% |
| PWM Frequency (Hz) | 3759 ? | 118000 ? | ||||
| Screen | 6% | 34% | 12% | -33% | -0% | |
| Brightness middle (cd/m²) | 366.6 | 478.5 31% | 519 42% | 329.8 -10% | 316 -14% | 442.7 21% |
| Brightness (cd/m²) | 360 | 466 29% | 504 40% | 318 -12% | 291 -19% | 428 19% |
| Brightness Distribution (%) | 93 | 86 -8% | 95 2% | 74 -20% | 83 -11% | 84 -10% |
| Black Level * (cd/m²) | 0.39 | 0.43 -10% | 0.33 15% | 0.25 36% | 0.36 8% | 0.31 21% |
| Contrast (:1) | 940 | 1113 18% | 1573 67% | 1319 40% | 878 -7% | 1428 52% |
| Colorchecker dE 2000 * | 2.76 | 3.09 -12% | 1.4 49% | 2.37 14% | 5.9 -114% | 2.24 19% |
| Colorchecker dE 2000 max. * | 6.19 | 5.94 4% | 2.8 55% | 4.08 34% | 12.9 -108% | 7.19 -16% |
| Colorchecker dE 2000 calibrated * | 1.53 | 2.06 -35% | 1.3 15% | 1.11 27% | ||
| Greyscale dE 2000 * | 4.2 | 2.4 43% | 2.2 48% | 2.8 33% | 8.6 -105% | 9.7 -131% |
| Gamma | 2.22 99% | 2.063 107% | 2.22 99% | 2.145 103% | 2.1 105% | 1.42 155% |
| CCT | 6271 104% | 6883 94% | 6908 94% | 6441 101% | 6854 95% | 6227 104% |
| Color Space (Percent of AdobeRGB 1998) (%) | 63.2 | 69.47 10% | 77.3 22% | 67 6% | 60.7 -4% | 61.6 -3% |
| Color Space (Percent of sRGB) (%) | 97.6 | 98.36 1% | 99.99 2% | 98 0% | 94.5 -3% | 95 -3% |
| Totalt genomsnitt (program/inställningar) | -14% /
-2% | 18% /
27% | 2% /
8% | -9% /
-22% | 3% /
1% |
* ... mindre är bättre
Visa svarstider
| ↔ Svarstid svart till vitt | ||
|---|---|---|
| 32 ms ... stiga ↗ och falla ↘ kombinerat | ↗ 18 ms stiga | 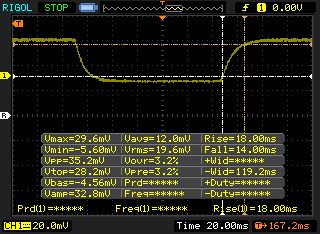 |
| ↘ 14 ms hösten | ||
| Skärmen visar långsamma svarsfrekvenser i våra tester och kommer att vara otillfredsställande för spelare. I jämförelse sträcker sig alla testade enheter från 0.1 (minst) till 240 (maximalt) ms. » 86 % av alla enheter är bättre. Detta innebär att den uppmätta svarstiden är sämre än genomsnittet av alla testade enheter (19.9 ms). | ||
| ↔ Svarstid 50 % grått till 80 % grått | ||
| 43.2 ms ... stiga ↗ och falla ↘ kombinerat | ↗ 22 ms stiga | 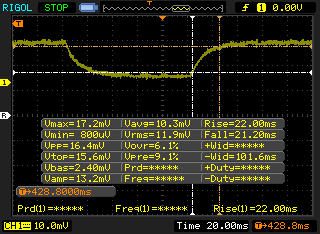 |
| ↘ 21.2 ms hösten | ||
| Skärmen visar långsamma svarsfrekvenser i våra tester och kommer att vara otillfredsställande för spelare. I jämförelse sträcker sig alla testade enheter från 0.165 (minst) till 636 (maximalt) ms. » 72 % av alla enheter är bättre. Detta innebär att den uppmätta svarstiden är sämre än genomsnittet av alla testade enheter (31.1 ms). | ||
Skärmflimmer / PWM (Puls-Width Modulation)
| Skärmflimmer / PWM upptäcktes inte | 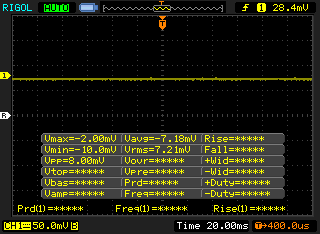 | ||
Som jämförelse: 52 % av alla testade enheter använder inte PWM för att dämpa skärmen. Om PWM upptäcktes mättes ett medelvärde av 7798 (minst: 5 - maximum: 343500) Hz. | |||
| PCMark 8 Home Score Accelerated v2 | 3616 poäng | |
| PCMark 8 Work Score Accelerated v2 | 4709 poäng | |
| PCMark 10 Score | 4344 poäng | |
Hjälp | ||
| Huawei MateBook 13 i7 Samsung SSD PM981 MZVLB512HAJQ | Dell XPS 13 9370 i7 UHD Toshiba XG5 KXG50ZNV512G | HP Spectre x360 13t-ae000 Lite-On CA1-8D256-HP | Lenovo Yoga C930-13IKB SK hynix PC401 HFS256GD9TNG | Huawei Matebook X Pro i5 Samsung PM961 MZVLW256HEHP | |
|---|---|---|---|---|---|
| AS SSD | -41% | -67% | -56% | -30% | |
| Seq Read (MB/s) | 1889 | 2205 17% | 2133 13% | 1850 -2% | 2416 28% |
| Seq Write (MB/s) | 1812 | 435.8 -76% | 945 -48% | 661 -64% | 1170 -35% |
| 4K Read (MB/s) | 55.5 | 29.36 -47% | 29.84 -46% | 38.04 -31% | 48.33 -13% |
| 4K Write (MB/s) | 118.4 | 107.4 -9% | 91.4 -23% | 95 -20% | 103.1 -13% |
| 4K-64 Read (MB/s) | 1257 | 678 -46% | 725 -42% | 434.3 -65% | 1039 -17% |
| 4K-64 Write (MB/s) | 1571 | 444.8 -72% | 404.1 -74% | 266.3 -83% | 399.6 -75% |
| Access Time Read * (ms) | 0.041 | 0.059 -44% | 0.121 -195% | 0.069 -68% | 0.058 -41% |
| Access Time Write * (ms) | 0.032 | 0.055 -72% | 0.13 -306% | 0.056 -75% | 0.036 -13% |
| Score Read (Points) | 1502 | 926 -38% | 968 -36% | 657 -56% | 1329 -12% |
| Score Write (Points) | 1871 | 596 -68% | 590 -68% | 427 -77% | 620 -67% |
| Score Total (Points) | 4147 | 1911 -54% | 1998 -52% | 1373 -67% | 2575 -38% |
| Copy ISO MB/s (MB/s) | 1800 | 585 -67% | 1492 -17% | 539 -70% | 739 -59% |
| Copy Program MB/s (MB/s) | 385.6 | 570 48% | 300.9 -22% | 209.7 -46% | 312.3 -19% |
| Copy Game MB/s (MB/s) | 982 | 503 -49% | 839 -15% | 340 -65% | 486.3 -50% |
* ... mindre är bättre

| 3DMark 11 Performance | 4796 poäng | |
| 3DMark Cloud Gate Standard Score | 14722 poäng | |
| 3DMark Fire Strike Score | 3235 poäng | |
Hjälp | ||
| låg | med. | hög | ultra | |
|---|---|---|---|---|
| BioShock Infinite (2013) | 195 | 110.3 | 93.4 | 34.3 |
| The Witcher 3 (2015) | 70.5 | 39.7 | 22.1 | 11.9 |
| Rocket League (2017) | 156 | 76.1 | 47.4 |
| Huawei MateBook 13 i7 GeForce MX150, i7-8565U, Samsung SSD PM981 MZVLB512HAJQ | Huawei Matebook X Pro i5 GeForce MX150, i5-8250U, Samsung PM961 MZVLW256HEHP | Dell XPS 13 9370 i7 UHD UHD Graphics 620, i5-8550U, Toshiba XG5 KXG50ZNV512G | Apple MacBook Pro 13 2018 Touchbar i5 Iris Plus Graphics 655, i5-8259U | Razer Blade Stealth i7-8565U GeForce MX150, i7-8565U, Lite-On CA3-8D256-Q11 | |
|---|---|---|---|---|---|
| Noise | 0% | 4% | 1% | -2% | |
| av / miljö * (dB) | 28.6 | 27.9 2% | 28 2% | 29.6 -3% | 28.4 1% |
| Idle Minimum * (dB) | 28.6 | 27.9 2% | 28 2% | 29.6 -3% | 28.5 -0% |
| Idle Average * (dB) | 28.6 | 27.9 2% | 28 2% | 29.6 -3% | 29 -1% |
| Idle Maximum * (dB) | 28.6 | 27.9 2% | 28 2% | 29.6 -3% | 29.1 -2% |
| Load Average * (dB) | 34.2 | 36.2 -6% | 32.5 5% | 36.7 -7% | 42.8 -25% |
| Witcher 3 ultra * (dB) | 43 | 45 -5% | 32.5 24% | 41.4 4% | |
| Load Maximum * (dB) | 47 | 45.2 4% | 42.2 10% | 46.7 1% | 41.6 11% |
* ... mindre är bättre
Ljudnivå
| Låg belastning |
| 28.6 / 28.6 / 28.6 dB(A) |
| Hög belastning |
| 34.2 / 47 dB(A) |
 | ||
30 dB tyst 40 dB(A) hörbar 50 dB(A) högt ljud |
||
min: | ||
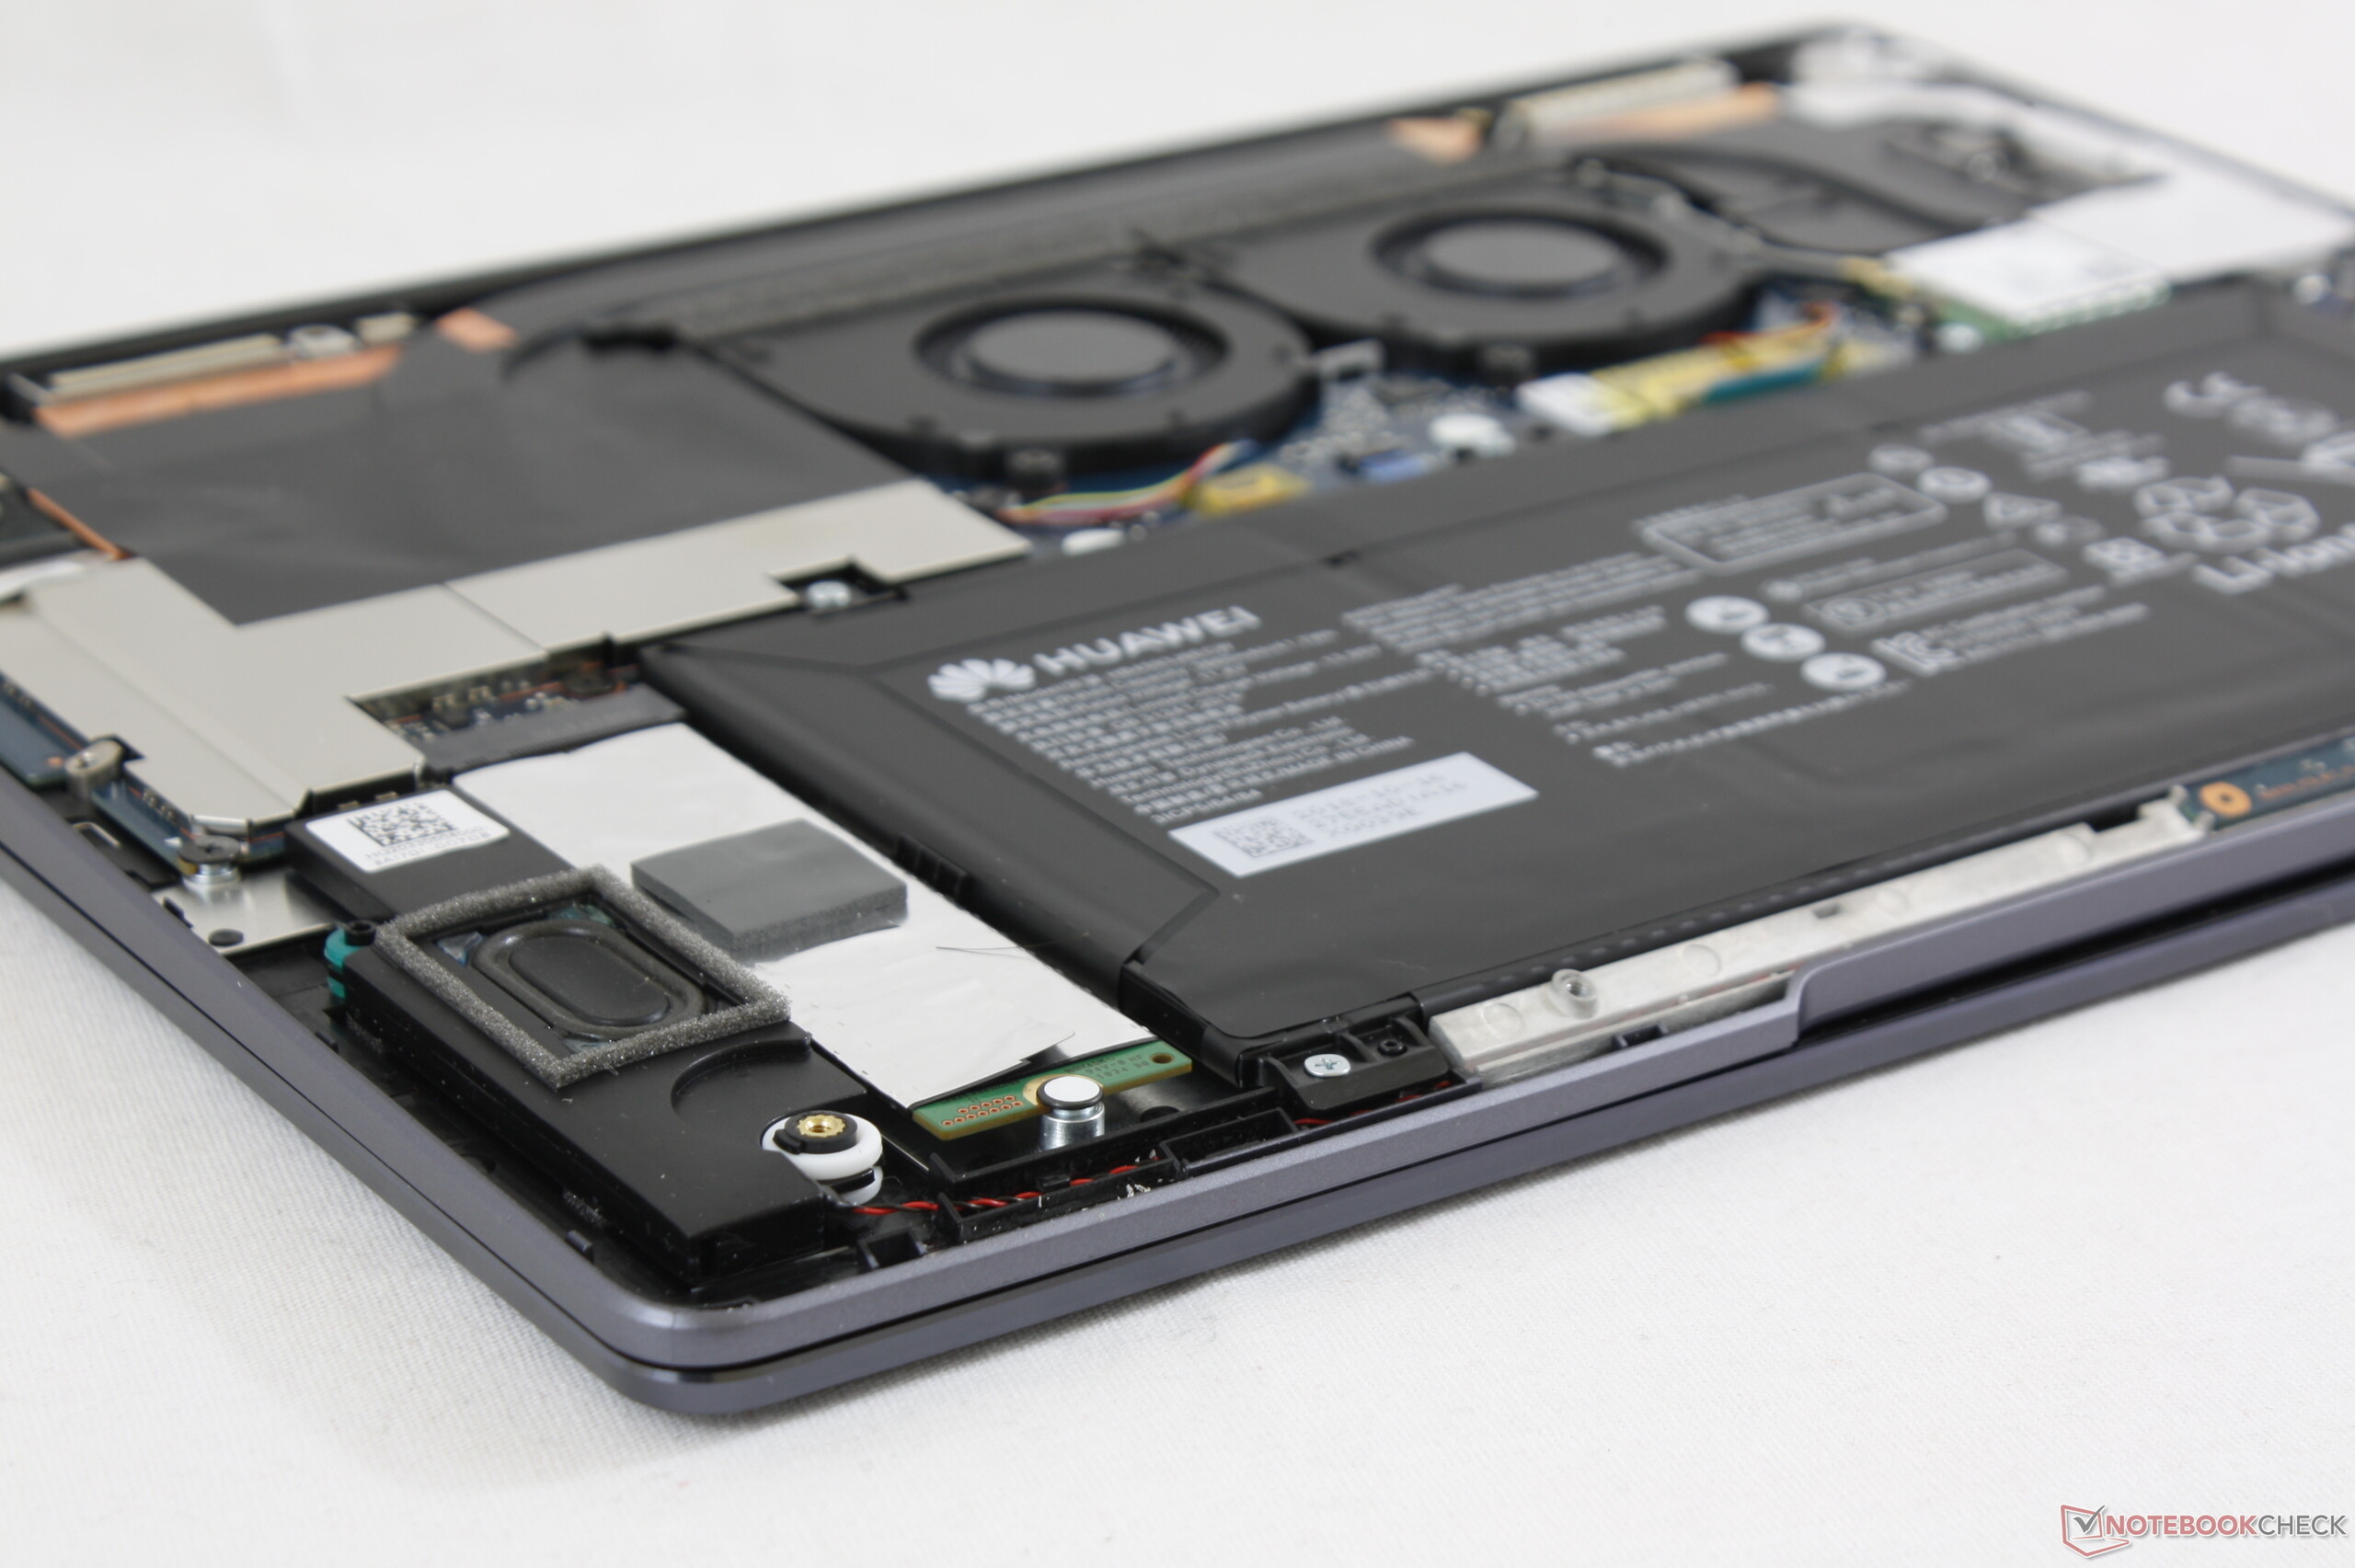
(±) Den maximala temperaturen på ovansidan är 44.2 °C / 112 F, jämfört med genomsnittet av 35.9 °C / 97 F , allt från 21.4 till 59 °C för klassen Subnotebook.
(-) Botten värms upp till maximalt 48 °C / 118 F, jämfört med genomsnittet av 39.2 °C / 103 F
(+) Vid tomgångsbruk är medeltemperaturen för ovansidan 24 °C / 75 F, jämfört med enhetsgenomsnittet på 30.8 °C / ### class_avg_f### F.
(±) När du spelar The Witcher 3 är medeltemperaturen för ovansidan 36 °C / 97 F, jämfört med enhetsgenomsnittet på 30.8 °C / ## #class_avg_f### F.
(+) Handledsstöden och pekplattan når maximal hudtemperatur (33.2 °C / 91.8 F) och är därför inte varma.
(-) Medeltemperaturen för handledsstödsområdet på liknande enheter var 28.2 °C / 82.8 F (-5 °C / -9 F).
Huawei MateBook 13 i7 ljudanalys
(-) | inte särskilt höga högtalare (70.7 dB)
Bas 100 - 315 Hz
(-) | nästan ingen bas - i genomsnitt 16.3% lägre än medianen
(-) | basen är inte linjär (15.7% delta till föregående frekvens)
Mellan 400 - 2000 Hz
(+) | balanserad mellan - endast 4.9% från medianen
(±) | linjäriteten för mids är genomsnittlig (7.3% delta till föregående frekvens)
Högsta 2 - 16 kHz
(+) | balanserade toppar - endast 3.5% från medianen
(±) | linjäriteten för toppar är genomsnittlig (7.5% delta till föregående frekvens)
Totalt 100 - 16 000 Hz
(±) | linjäriteten för det totala ljudet är genomsnittlig (21.7% skillnad mot median)
Jämfört med samma klass
» 73% av alla testade enheter i den här klassen var bättre, 6% liknande, 21% sämre
» Den bästa hade ett delta på 5%, genomsnittet var 18%, sämst var 53%
Jämfört med alla testade enheter
» 61% av alla testade enheter var bättre, 7% liknande, 31% sämre
» Den bästa hade ett delta på 4%, genomsnittet var 24%, sämst var 134%
Apple MacBook 12 (Early 2016) 1.1 GHz ljudanalys
(+) | högtalare kan spela relativt högt (83.6 dB)
Bas 100 - 315 Hz
(±) | reducerad bas - i genomsnitt 11.3% lägre än medianen
(±) | linjäriteten för basen är genomsnittlig (14.2% delta till föregående frekvens)
Mellan 400 - 2000 Hz
(+) | balanserad mellan - endast 2.4% från medianen
(+) | mids är linjära (5.5% delta till föregående frekvens)
Högsta 2 - 16 kHz
(+) | balanserade toppar - endast 2% från medianen
(+) | toppar är linjära (4.5% delta till föregående frekvens)
Totalt 100 - 16 000 Hz
(+) | det totala ljudet är linjärt (10.2% skillnad mot median)
Jämfört med samma klass
» 7% av alla testade enheter i den här klassen var bättre, 2% liknande, 91% sämre
» Den bästa hade ett delta på 5%, genomsnittet var 18%, sämst var 53%
Jämfört med alla testade enheter
» 5% av alla testade enheter var bättre, 1% liknande, 94% sämre
» Den bästa hade ett delta på 4%, genomsnittet var 24%, sämst var 134%
| Av/Standby | |
| Låg belastning | |
| Hög belastning |
|
Förklaring:
min: | |
| Huawei MateBook 13 i7 i7-8565U, GeForce MX150, Samsung SSD PM981 MZVLB512HAJQ, IPS, 2160x1440, 13" | Dell XPS 13 9370 i7 UHD i5-8550U, UHD Graphics 620, Toshiba XG5 KXG50ZNV512G, IPS, 3840x2160, 13.3" | Apple MacBook Pro 13 2018 Touchbar i5 i5-8259U, Iris Plus Graphics 655, , IPS, 2560x1600, 13.3" | HP Spectre x360 13t-ae000 i5-8550U, UHD Graphics 620, Lite-On CA1-8D256-HP, IPS, 3840x2160, 13.3" | Lenovo Yoga C930-13IKB i5-8250U, UHD Graphics 620, SK hynix PC401 HFS256GD9TNG, IPS, 1920x1080, 13.9" | Huawei Matebook X Pro i5 i5-8250U, GeForce MX150, Samsung PM961 MZVLW256HEHP, IPS, 3000x2000, 13.9" | |
|---|---|---|---|---|---|---|
| Power Consumption | 6% | 8% | 1% | 17% | 6% | |
| Idle Minimum * (Watt) | 3.5 | 5 -43% | 2.3 34% | 5.9 -69% | 3.3 6% | 3.5 -0% |
| Idle Average * (Watt) | 7.5 | 8.3 -11% | 8.7 -16% | 9.8 -31% | 6.8 9% | 8.9 -19% |
| Idle Maximum * (Watt) | 12.4 | 8.8 29% | 12.2 2% | 10.6 15% | 9.5 23% | 12.3 1% |
| Load Average * (Watt) | 64.2 | 46.4 28% | 53.3 17% | 36.6 43% | 40.8 36% | 54.2 16% |
| Witcher 3 ultra * (Watt) | 52.5 | 42.4 19% | ||||
| Load Maximum * (Watt) | 65.7 | 48.6 26% | 64 3% | 34.3 48% | 57 13% | 52.1 21% |
* ... mindre är bättre
| Huawei MateBook 13 i7 i7-8565U, GeForce MX150, 41.7 Wh | Dell XPS 13 9370 i7 UHD i5-8550U, UHD Graphics 620, 52 Wh | Apple MacBook Pro 13 2018 Touchbar i5 i5-8259U, Iris Plus Graphics 655, 58 Wh | HP Spectre x360 13t-ae000 i5-8550U, UHD Graphics 620, 60 Wh | Lenovo Yoga C930-13IKB i5-8250U, UHD Graphics 620, 60 Wh | Huawei Matebook X Pro i5 i5-8250U, GeForce MX150, 57.4 Wh | |
|---|---|---|---|---|---|---|
| Batteridrifttid | 31% | 28% | 58% | 70% | 67% | |
| Reader / Idle (h) | 15.4 | 13.7 -11% | 23.9 55% | 20.7 34% | ||
| WiFi v1.3 (h) | 7.6 | 7.8 3% | 9.7 28% | 7.1 -7% | 9.2 21% | 9.3 22% |
| Load (h) | 0.9 | 1.8 100% | 2 122% | 2.1 133% | 2.2 144% | |
| Witcher 3 ultra (h) | 1.6 |
För
Emot
Läs den fullständiga versionen av den här recensionen på engelska här.
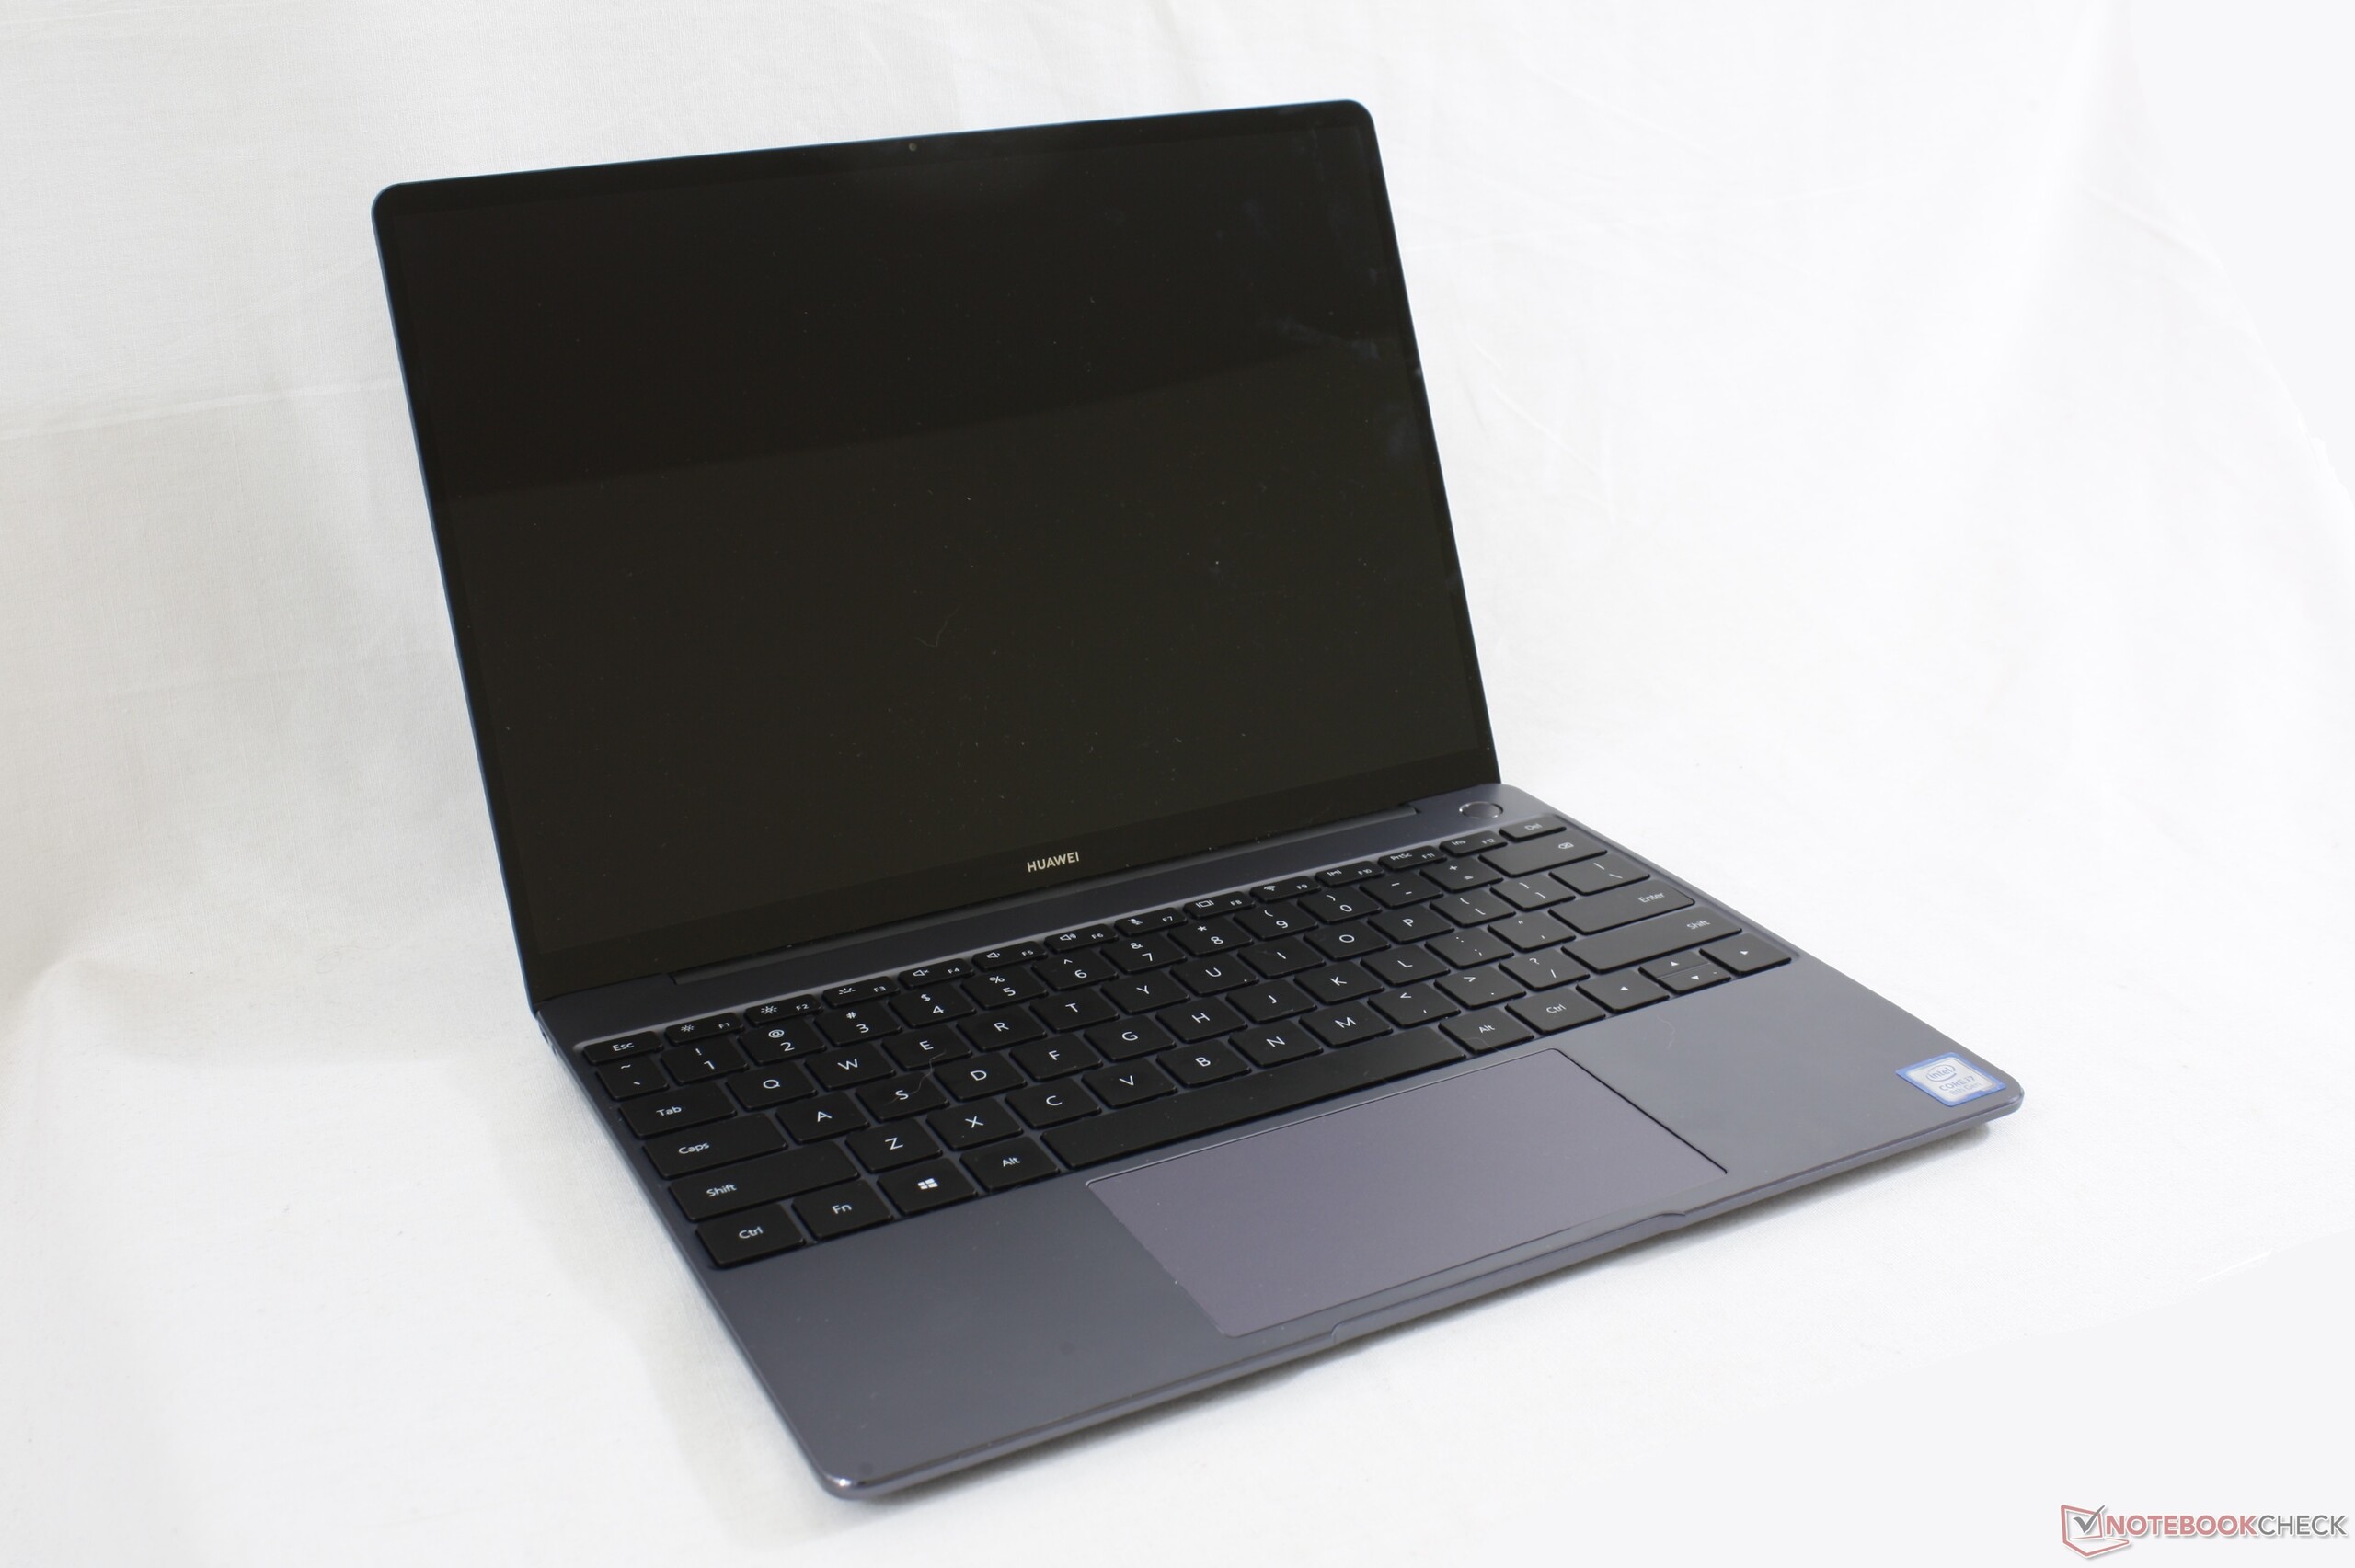
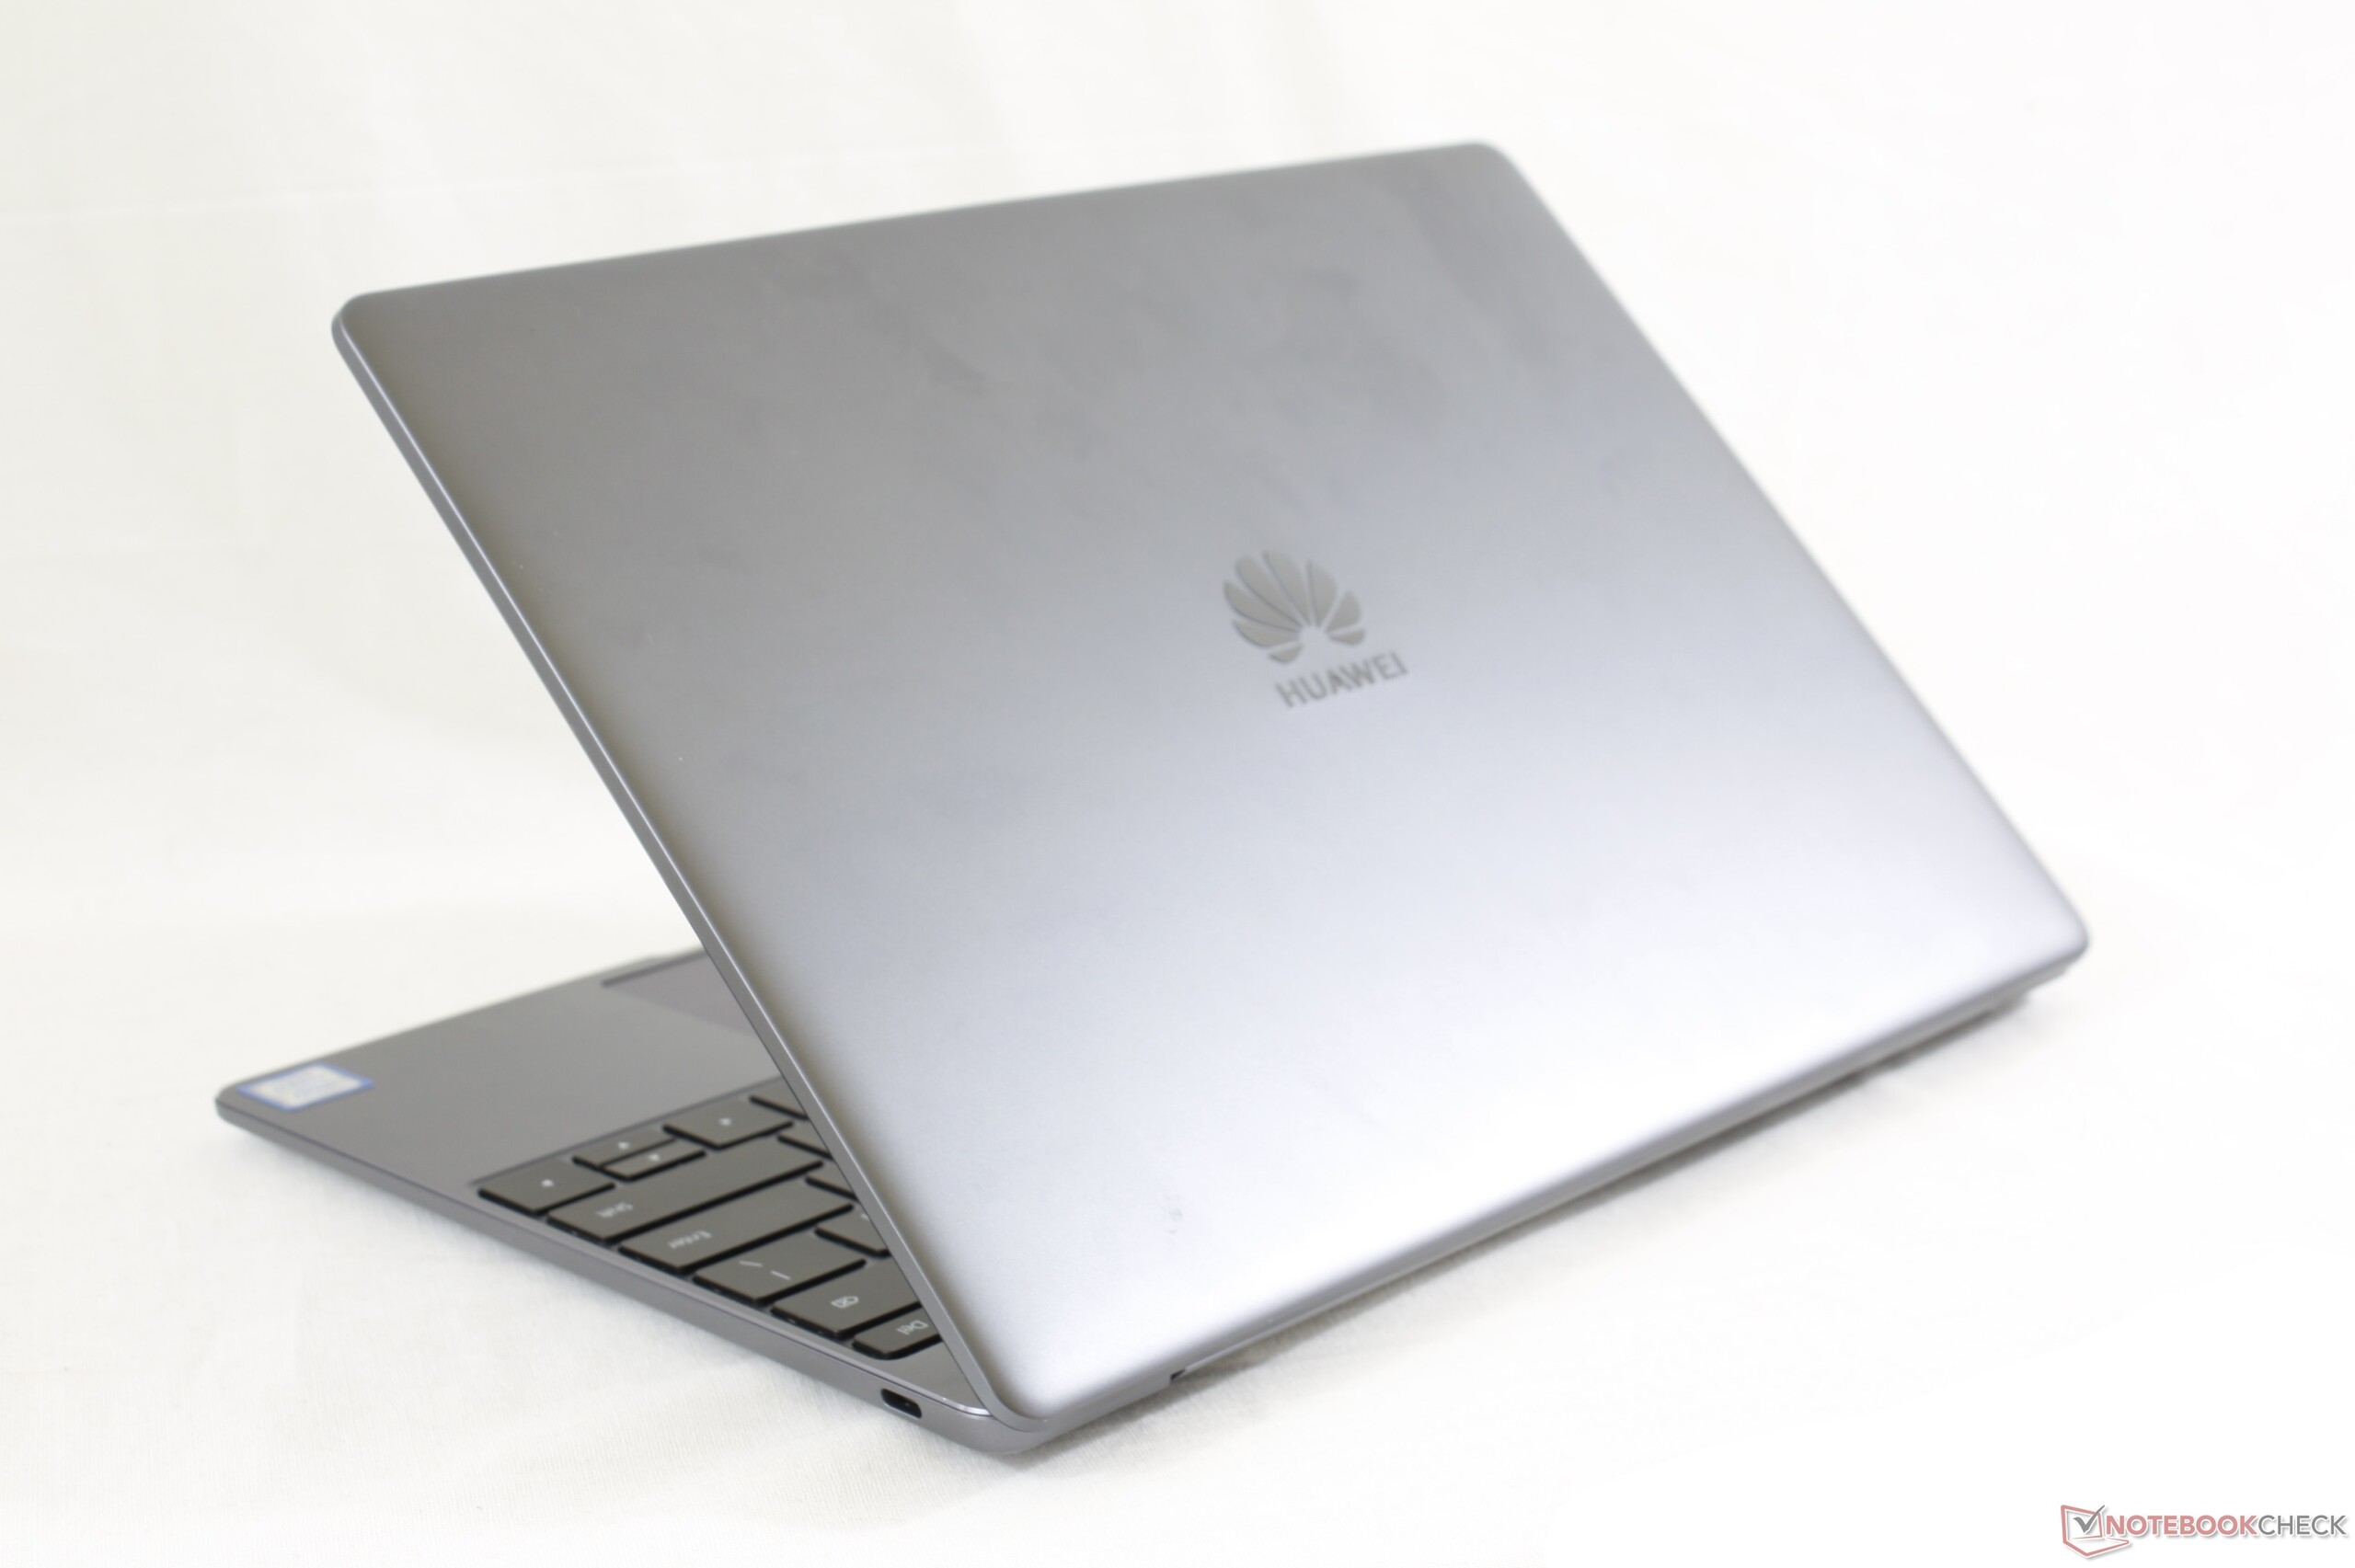
MateBook 13 kostar en aning mindre än flaggskeppsmodellen MateBook X Pro då den är tänkt att vara ett enklare alternativ. I verkligheten presterar den faktiskt bättre än X Pro samtidigt som den behåller det attraktiva och supertunt designade chassit. Vi pratar inte bara om marginella fördelar heller då MateBook 13 har överlägsen kontroll över strypningen och en kraftigare GPU, vilket totalt sett ger runt 25 - 30 procent högre prestanda. Den har till och med snabbare WiFi och en bättre webbkamera.
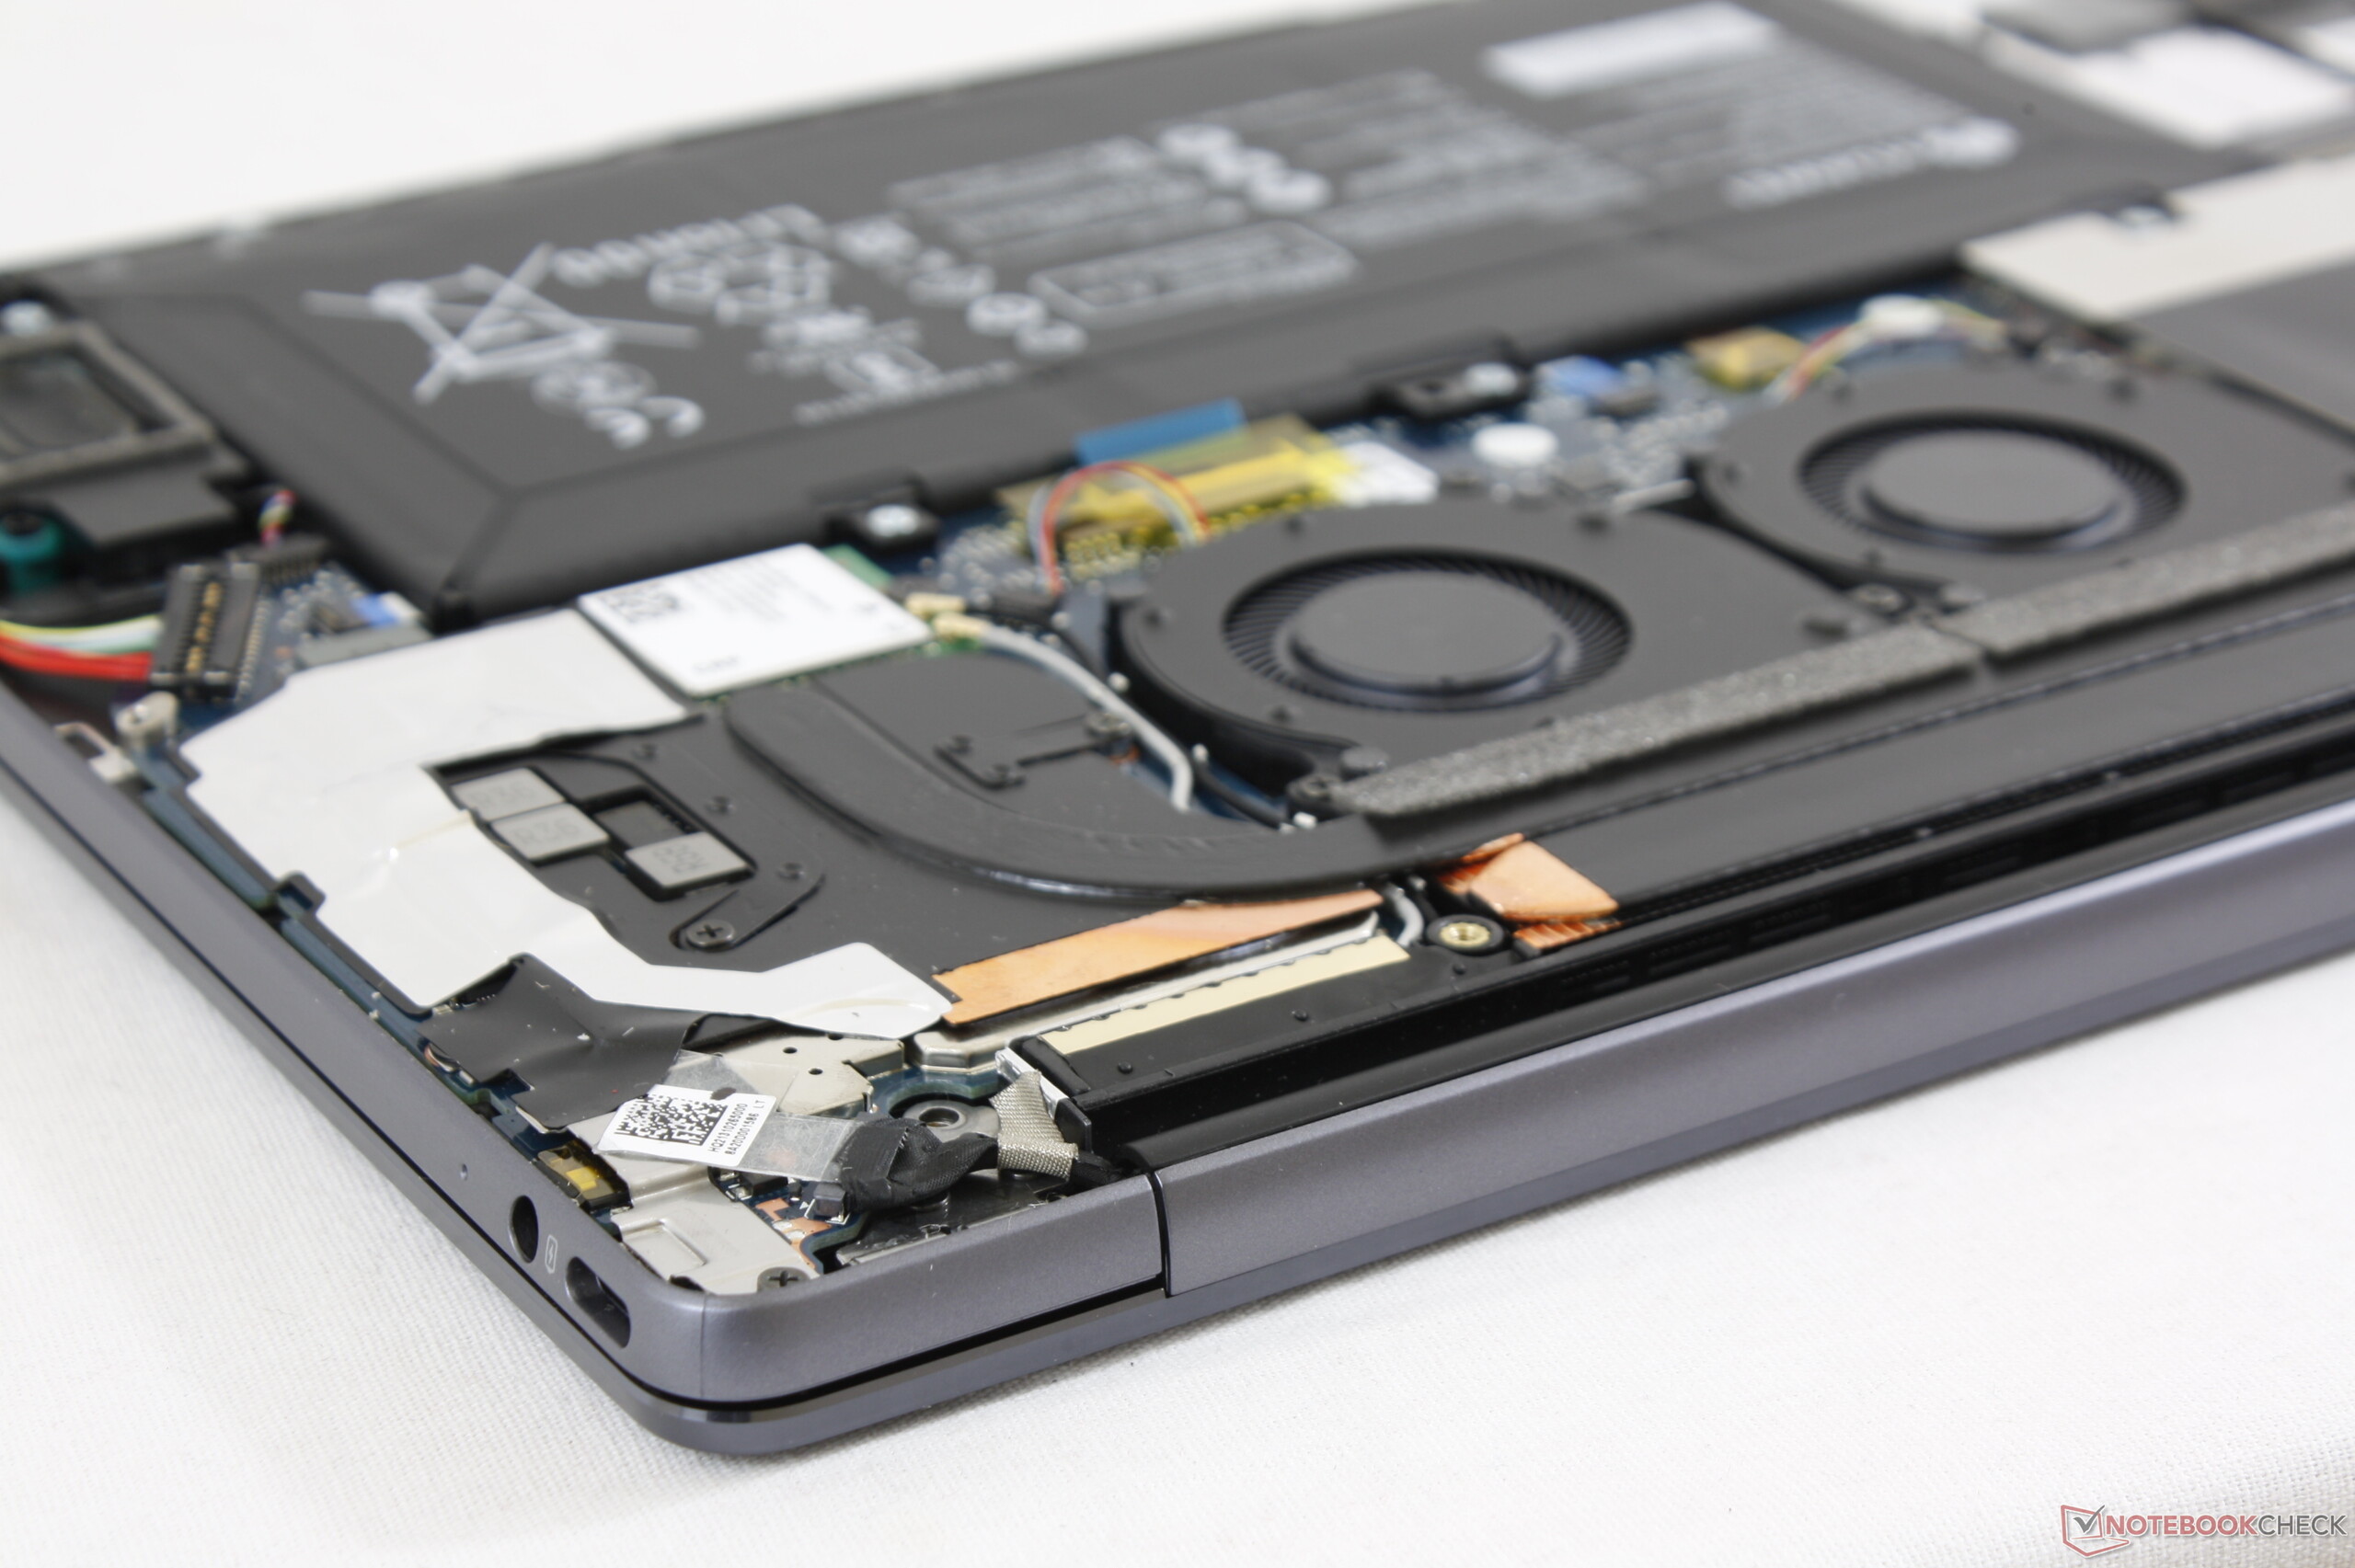
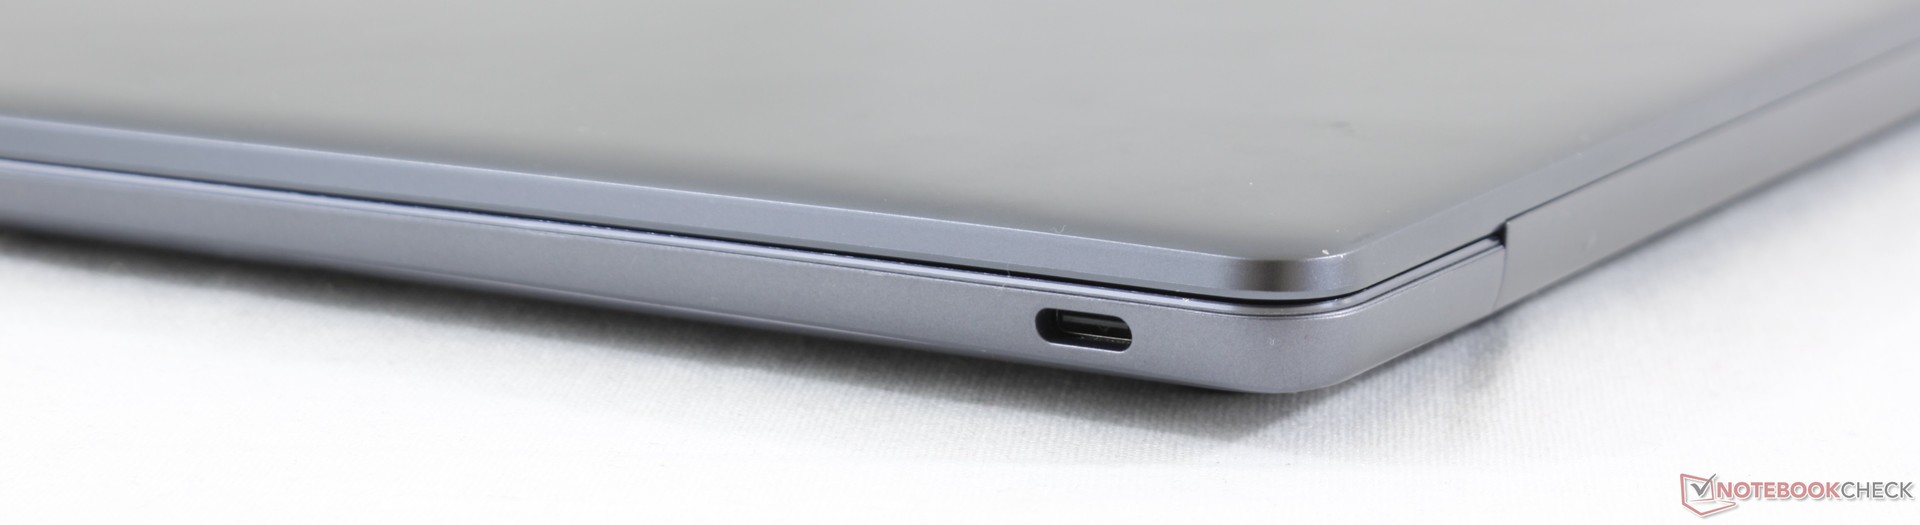
Den största aspekten som förhindrar MateBook 13 från att helt och hållet vara bättre än MateBook X Pro är skärmen. Även om den fortfarande är utmärkt och har god färgprecision är den en aning mindre och mörkare med lägre kontrast och upplösning. Pro-versionen har på så sätt fortfarande en överlägsen skärm. Andra nackdelar MateBook 13 har jämfört med sitt dyrare alternativ är att den har ett mindre batteri, saknar Thunderbolt 3 och saknar USB Typ A.
MateBook 13 är ett vettigt alternativ för den som tröttnat på den svaga grafikpotentialen hos populära Ultrabook-modeller på 13 tum såsom XPS 13, Spectre 13, Gram 13 eller ZenBook 13. Om den kraftfulla GPU:n inte lockar är det bättre att skaffa XPS 13 eller Spectre 13 då de modellerna är robustare och har ett större utbud av portar. Det går också att argumentera för att de har bättre tangentbord.
Den enda Ultrabook-modellen hittills med en 3:2-skärm på 13 tum och ett GeForce MX150 på 25 W som ger prestanda på spelnivå. MateBook 13 inrymmer en otrolig kraft för sin storlek som både casual-spelare och traditionella Ultrabook-användare kan uppskatta.
Huawei MateBook 13 i7
- 01/19/2019 v6 (old)
Allen Ngo
Price comparison
