Test: Asus ZenBook 15 UX534FTC - Matt och kraftfull batteritidskung (Sammanfattning)
Gradering | Datum | Modell | Vikt | Höjd | Storlek | Upplösning | Pris |
|---|---|---|---|---|---|---|---|
| 85.2 % v7 (old) | 03/2020 | Asus ZenBook 15 UX534FTC-A8190T i7-10510U, GeForce GTX 1650 Max-Q | 1.6 kg | 18.9 mm | 15.60" | 1920x1080 | |
| 82.7 % v7 (old) | 02/2020 | Acer ConceptD 5 CN515-51-73Z7 i7-8705G, Vega M GL / 870 | 1.5 kg | 17 mm | 15.60" | 3840x2160 | |
| 87.8 % v7 (old) | 08/2019 | Dell XPS 15 7590 9980HK GTX 1650 i9-9980HK, GeForce GTX 1650 Mobile | 2 kg | 17 mm | 15.60" | 3840x2160 | |
| 89.7 % v7 (old) | 12/2019 | Apple MacBook Pro 16 2019 i9 5500M i9-9880H, Radeon Pro 5500M | 2 kg | 16.2 mm | 16.00" | 3072x1920 |
| SD Card Reader | |
| average JPG Copy Test (av. of 3 runs) | |
| Dell XPS 15 7590 9980HK GTX 1650 (Toshiba Exceria Pro SDXC 64 GB UHS-II) | |
| Genomsnitt av klass Multimedia (23 - 531, n=40, senaste 2 åren) | |
| Asus ZenBook 15 UX534FTC-A8190T (Toshiba Exceria Pro SDXC 64 GB UHS-II) | |
| Asus ZenBook 15 UX534FT-DB77 (Toshiba Exceria Pro SDXC 64 GB UHS-II) | |
| Asus ZenBook 15 UX533FD (Toshiba Exceria Pro SDXC 64 GB UHS-II) | |
| Acer ConceptD 5 CN515-51-73Z7 (Toshiba Exceria Pro SDXC 64 GB UHS-II) | |
| maximum AS SSD Seq Read Test (1GB) | |
| Genomsnitt av klass Multimedia (37.3 - 1455, n=39, senaste 2 åren) | |
| Dell XPS 15 7590 9980HK GTX 1650 (Toshiba Exceria Pro SDXC 64 GB UHS-II) | |
| Asus ZenBook 15 UX534FT-DB77 (Toshiba Exceria Pro SDXC 64 GB UHS-II) | |
| Asus ZenBook 15 UX533FD (Toshiba Exceria Pro SDXC 64 GB UHS-II) | |
| Acer ConceptD 5 CN515-51-73Z7 (Toshiba Exceria Pro SDXC 64 GB UHS-II) | |

| |||||||||||||||||||||||||
Distribution av ljusstyrkan: 89 %
Mitt på batteriet: 300 cd/m²
Kontrast: 1424:1 (Svärta: 0.21 cd/m²)
ΔE ColorChecker Calman: 4.76 | ∀{0.5-29.43 Ø4.71}
ΔE Greyscale Calman: 3.53 | ∀{0.09-98 Ø4.96}
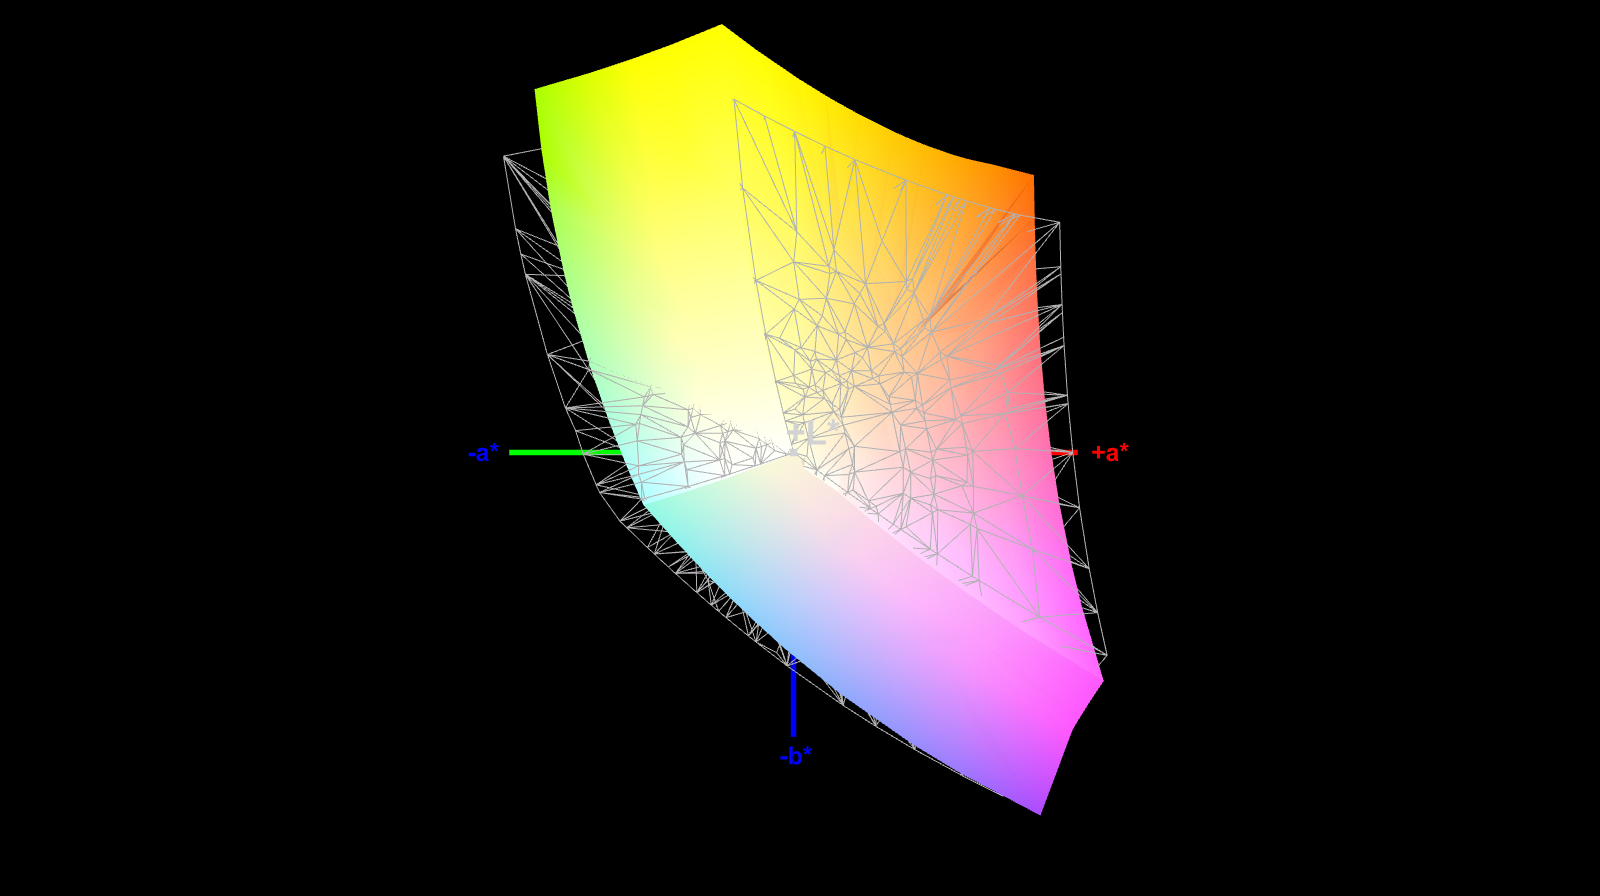
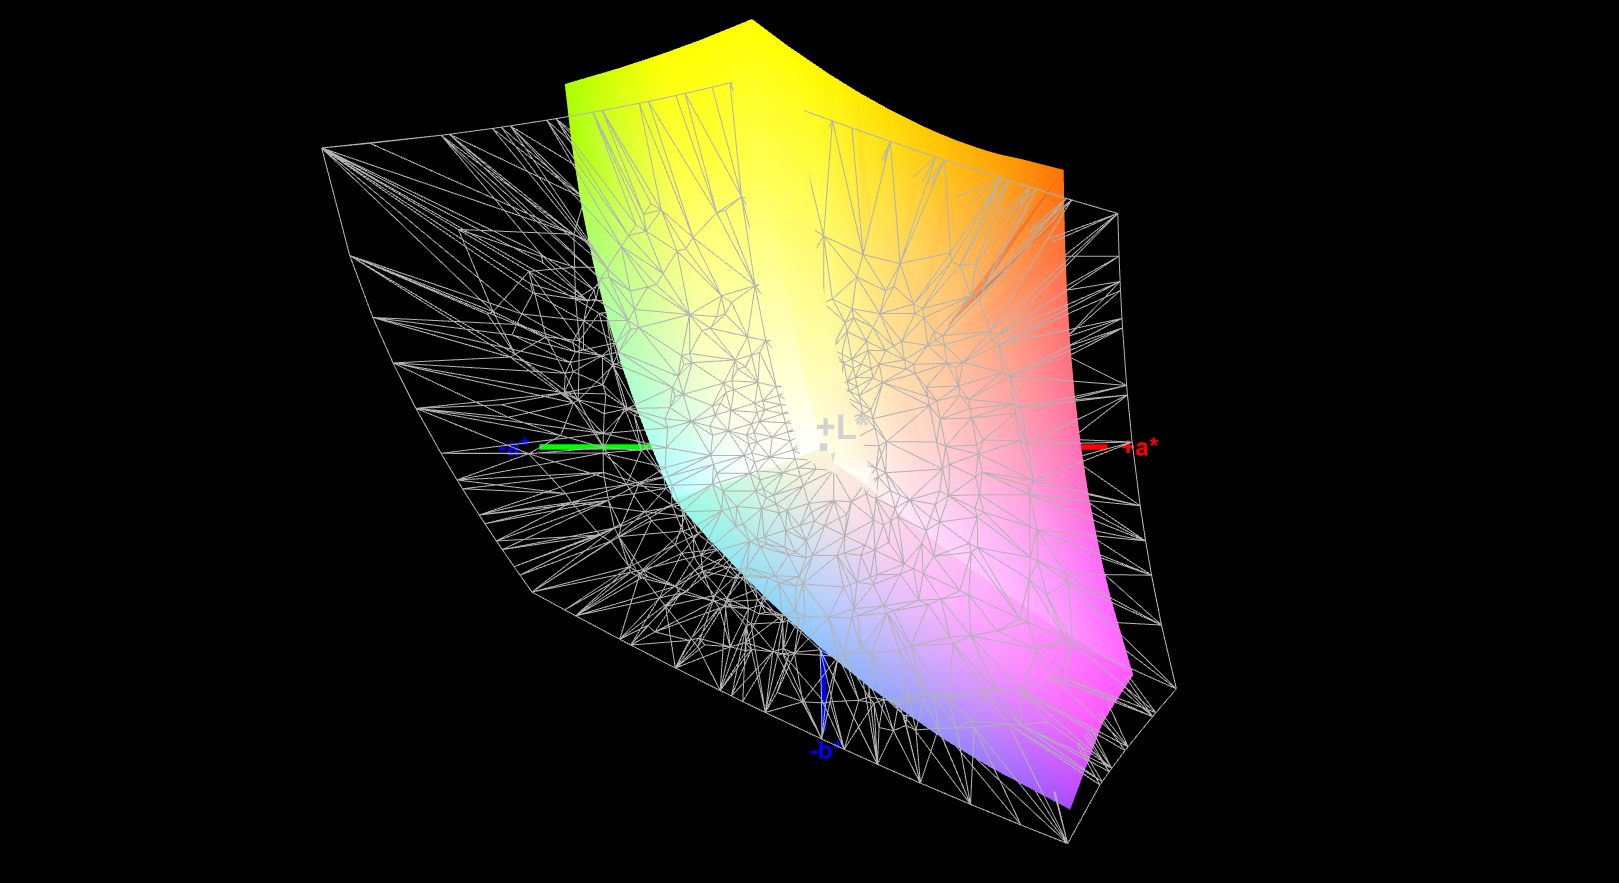
86% sRGB (Argyll 1.6.3 3D)
56% AdobeRGB 1998 (Argyll 1.6.3 3D)
62.9% AdobeRGB 1998 (Argyll 3D)
86.2% sRGB (Argyll 3D)
65% Display P3 (Argyll 3D)
Gamma: 2.3
CCT: 7228 K
| Asus ZenBook 15 UX534FTC-A8190T IPS, 1920x1080, 15.6" | Asus ZenBook 15 UX534FT-DB77 IPS, 1920x1080, 15.6" | Asus ZenBook 15 UX533FD IPS, 1920x1080, 15.6" | Acer ConceptD 5 CN515-51-73Z7 LTPS IPS LED, 3840x2160, 15.6" | Dell XPS 15 7590 9980HK GTX 1650 OLED, 3840x2160, 15.6" | Apple MacBook Pro 16 2019 i9 5500M IPS, 3072x1920, 16" | |
|---|---|---|---|---|---|---|
| Display | 2% | 3% | 35% | 33% | ||
| Display P3 Coverage (%) | 65 | 66.6 2% | 67.2 3% | 86.1 32% | 88.1 36% | |
| sRGB Coverage (%) | 86.2 | 87.7 2% | 88.4 3% | 100 16% | 99.6 16% | |
| AdobeRGB 1998 Coverage (%) | 62.9 | 64.1 2% | 64.6 3% | 99.2 58% | 91.8 46% | |
| Response Times | 2% | -8% | -33% | 94% | -13% | |
| Response Time Grey 50% / Grey 80% * (ms) | 45 ? | 41.2 ? 8% | 45 ? -0% | 63 ? -40% | 2.3 ? 95% | 52.4 ? -16% |
| Response Time Black / White * (ms) | 32 ? | 33.2 ? -4% | 37 ? -16% | 40 ? -25% | 2.4 ? 92% | 34.9 ? -9% |
| PWM Frequency (Hz) | 59.5 ? | 131700 | ||||
| Screen | -14% | -6% | 5% | 15% | 27% | |
| Brightness middle (cd/m²) | 299 | 312.6 5% | 311 4% | 350 17% | 421.2 41% | 519 74% |
| Brightness (cd/m²) | 280 | 290 4% | 303 8% | 329 18% | 417 49% | 477 70% |
| Brightness Distribution (%) | 89 | 85 -4% | 81 -9% | 86 -3% | 94 6% | 86 -3% |
| Black Level * (cd/m²) | 0.21 | 0.31 -48% | 0.24 -14% | 0.265 -26% | 0.39 -86% | |
| Contrast (:1) | 1424 | 1008 -29% | 1296 -9% | 1321 -7% | 1331 -7% | |
| Colorchecker dE 2000 * | 4.76 | 5.78 -21% | 5.1 -7% | 5.08 -7% | 6.06 -27% | 2.28 52% |
| Colorchecker dE 2000 max. * | 9 | 8.86 2% | 8.91 1% | 10.25 -14% | 11.89 -32% | 6.54 27% |
| Greyscale dE 2000 * | 3.53 | 5.4 -53% | 4.93 -40% | 3.62 -3% | 2.8 21% | 0.9 75% |
| Gamma | 2.3 96% | 2.21 100% | 2.44 90% | 2.27 97% | 2.15 102% | 2145 0% |
| CCT | 7228 90% | 7864 83% | 7641 85% | 6389 102% | 6235 104% | 6572 99% |
| Color Space (Percent of AdobeRGB 1998) (%) | 56 | 57.1 2% | 58 4% | 88 57% | 81 45% | 78 39% |
| Color Space (Percent of sRGB) (%) | 86 | 87.4 2% | 88 2% | 100 16% | 99.6 16% | |
| Colorchecker dE 2000 calibrated * | 3.78 | 2.48 | 4.38 | 0.86 | ||
| Totalt genomsnitt (program/inställningar) | -3% /
-9% | -4% /
-4% | 2% /
6% | 47% /
31% | 7% /
20% |
* ... mindre är bättre
Visa svarstider
| ↔ Svarstid svart till vitt | ||
|---|---|---|
| 32 ms ... stiga ↗ och falla ↘ kombinerat | ↗ 18 ms stiga | 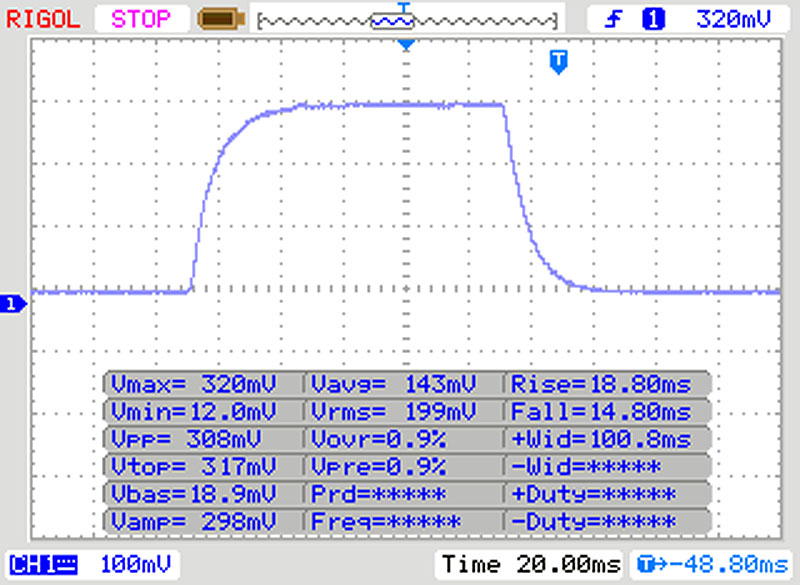 |
| ↘ 14 ms hösten | ||
| Skärmen visar långsamma svarsfrekvenser i våra tester och kommer att vara otillfredsställande för spelare. I jämförelse sträcker sig alla testade enheter från 0.1 (minst) till 240 (maximalt) ms. » 86 % av alla enheter är bättre. Detta innebär att den uppmätta svarstiden är sämre än genomsnittet av alla testade enheter (19.8 ms). | ||
| ↔ Svarstid 50 % grått till 80 % grått | ||
| 45 ms ... stiga ↗ och falla ↘ kombinerat | ↗ 24 ms stiga | 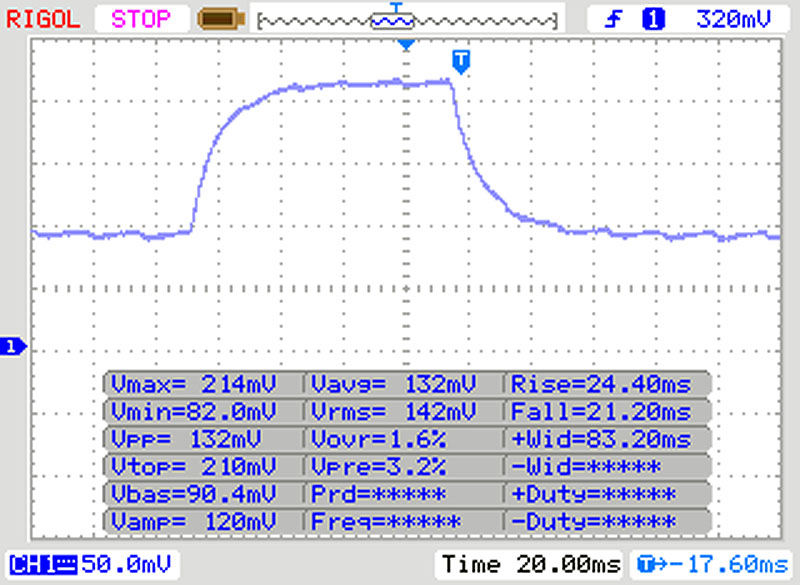 |
| ↘ 21 ms hösten | ||
| Skärmen visar långsamma svarsfrekvenser i våra tester och kommer att vara otillfredsställande för spelare. I jämförelse sträcker sig alla testade enheter från 0.165 (minst) till 636 (maximalt) ms. » 77 % av alla enheter är bättre. Detta innebär att den uppmätta svarstiden är sämre än genomsnittet av alla testade enheter (31 ms). | ||
Skärmflimmer / PWM (Puls-Width Modulation)
| Skärmflimmer / PWM upptäcktes inte | 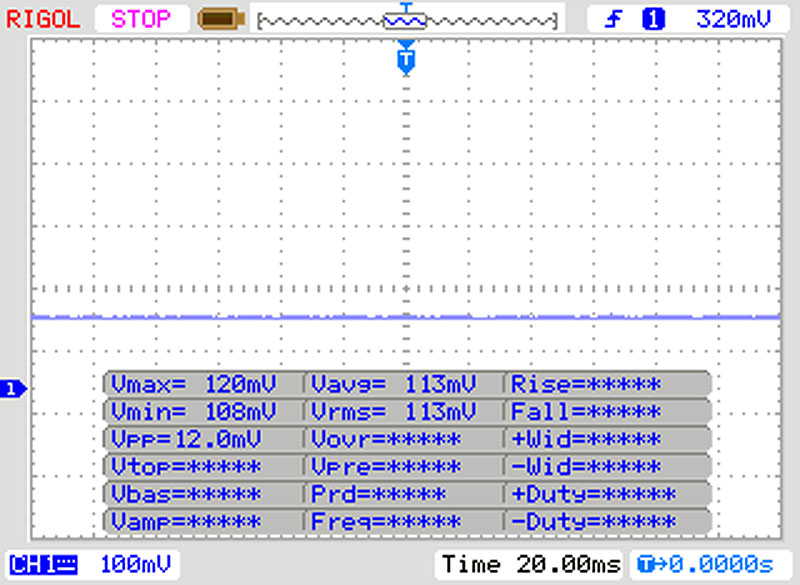 | ||
Som jämförelse: 52 % av alla testade enheter använder inte PWM för att dämpa skärmen. Om PWM upptäcktes mättes ett medelvärde av 7747 (minst: 5 - maximum: 343500) Hz. | |||
| Geekbench 3 | |
| 32 Bit Multi-Core Score | |
| Genomsnitt Intel Core i7-10510U (16742 - 16838, n=2) | |
| Asus ZenBook 15 UX534FTC-A8190T | |
| 32 Bit Single-Core Score | |
| Genomsnitt Intel Core i7-10510U (4369 - 4485, n=2) | |
| Asus ZenBook 15 UX534FTC-A8190T | |
| Geekbench 4.4 | |
| 64 Bit Multi-Core Score | |
| Genomsnitt av klass Multimedia (n=1senaste 2 åren) | |
| Apple MacBook Pro 16 2019 i9 5500M (macOS 10.15.1) | |
| Apple MacBook Pro 16 2019 i9 5500M (Win 10) | |
| Asus ZenBook 15 UX534FTC-A8190T | |
| Genomsnitt Intel Core i7-10510U (13116 - 18364, n=14) | |
| 64 Bit Single-Core Score | |
| Genomsnitt av klass Multimedia (n=1senaste 2 åren) | |
| Apple MacBook Pro 16 2019 i9 5500M (macOS 10.15.1) | |
| Apple MacBook Pro 16 2019 i9 5500M (Win 10) | |
| Genomsnitt Intel Core i7-10510U (4976 - 5832, n=14) | |
| Asus ZenBook 15 UX534FTC-A8190T | |
| Geekbench 5.0 | |
| 5.0 Multi-Core | |
| Apple MacBook Pro 16 2019 i9 5500M (Win 10) | |
| Apple MacBook Pro 16 2019 i9 5500M (mac OS 15.1.0) | |
| Asus ZenBook 15 UX534FTC-A8190T | |
| Genomsnitt Intel Core i7-10510U (3143 - 4476, n=12) | |
| 5.0 Single-Core | |
| Apple MacBook Pro 16 2019 i9 5500M (mac OS 15.1.0) | |
| Apple MacBook Pro 16 2019 i9 5500M (Win 10) | |
| Genomsnitt Intel Core i7-10510U (1118 - 1278, n=12) | |
| Asus ZenBook 15 UX534FTC-A8190T | |
| Mozilla Kraken 1.1 - Total | |
| Acer ConceptD 5 CN515-51-73Z7 (Edge) | |
| Asus ZenBook 15 UX534FT-DB77 (Edge 44.17763.1.0) | |
| Asus ZenBook 15 UX534FTC-A8190T (Edge 44) | |
| Dell XPS 15 7590 9980HK GTX 1650 (Edge 44.18362.267.0) | |
| Apple MacBook Pro 16 2019 i9 5500M (Win 10 Chrome 82) | |
| Genomsnitt Intel Core i7-10510U (742 - 1184, n=36) | |
| Asus ZenBook 15 UX533FD | |
| Genomsnitt av klass Multimedia (228 - 835, n=68, senaste 2 åren) | |
| Octane V2 - Total Score | |
| Genomsnitt av klass Multimedia (64079 - 153175, n=32, senaste 2 åren) | |
| Asus ZenBook 15 UX533FD | |
| Genomsnitt Intel Core i7-10510U (31505 - 51741, n=17) | |
| Dell XPS 15 7590 9980HK GTX 1650 (Edge 44.18362.267.0) | |
| Asus ZenBook 15 UX534FTC-A8190T (Edge 44) | |
| Asus ZenBook 15 UX534FT-DB77 (Edge 44.17763.1.0) | |
| Acer ConceptD 5 CN515-51-73Z7 (Edge) | |
| JetStream 1.1 - 1.1 Total | |
| Genomsnitt av klass Multimedia (n=1senaste 2 åren) | |
| Dell XPS 15 7590 9980HK GTX 1650 (Edge 44.18362.267.0) | |
| Asus ZenBook 15 UX534FTC-A8190T (Edge 44) | |
| Asus ZenBook 15 UX534FT-DB77 (Edge 44.17763.1.0) | |
| Genomsnitt Intel Core i7-10510U (142.6 - 296, n=15) | |
| Asus ZenBook 15 UX533FD | |
* ... mindre är bättre
| PCMark 8 Home Score Accelerated v2 | 3761 poäng | |
| PCMark 8 Creative Score Accelerated v2 | 3959 poäng | |
| PCMark 8 Work Score Accelerated v2 | 5265 poäng | |
| PCMark 10 Score | 4490 poäng | |
Hjälp | ||

| Asus ZenBook 15 UX534FTC-A8190T Samsung SSD PM981 MZVLB1T0HALR | Asus ZenBook 15 UX534FT-DB77 Samsung SSD PM981 MZVLB1T0HALR | Acer ConceptD 5 CN515-51-73Z7 WDC PC SN720 SDAPNTW-512G | Dell XPS 15 7590 9980HK GTX 1650 Toshiba XG6 KXG60ZNV1T02 | Asus ZenBook 15 UX533FD WDC PC SN520 SDAPNUW-512G | Apple MacBook Pro 16 2019 i9 5500M Apple SSD AP1024 7171 | Genomsnitt Samsung SSD PM981 MZVLB1T0HALR | |
|---|---|---|---|---|---|---|---|
| CrystalDiskMark 5.2 / 6 | 0% | -6% | -5% | -29% | -12% | -2% | |
| Write 4K (MB/s) | 138.1 | 141.6 3% | 120.6 -13% | 104.3 -24% | 126.2 -9% | 55.5 -60% | 165.7 ? 20% |
| Read 4K (MB/s) | 45.89 | 45.28 -1% | 41.43 -10% | 45.23 -1% | 41.2 -10% | 16.21 -65% | 44.6 ? -3% |
| Write Seq (MB/s) | 2147 | 1975 -8% | 2402 12% | 1729 -19% | 1055 -51% | 1959 -9% | 1982 ? -8% |
| Read Seq (MB/s) | 2188 | 2272 4% | 1997 -9% | 1861 -15% | 884 -60% | 1763 -19% | 1764 ? -19% |
| Write 4K Q32T1 (MB/s) | 427.8 | 458.6 7% | 335.2 -22% | 509 19% | 445.5 4% | 398.5 -7% | 395 ? -8% |
| Read 4K Q32T1 (MB/s) | 404 | 391.4 -3% | 381.7 -6% | 388.5 -4% | 338.8 -16% | 648 60% | 434 ? 7% |
| Write Seq Q32T1 (MB/s) | 2396 | 2393 0% | 2553 7% | 2813 17% | 1453 -39% | 2727 14% | 2351 ? -2% |
| Read Seq Q32T1 (MB/s) | 3454 | 3464 0% | 3356 -3% | 2906 -16% | 1734 -50% | 3242 -6% | 3234 ? -6% |
| 3DMark 06 Standard Score | 32594 poäng | |
| 3DMark 11 Performance | 10585 poäng | |
| 3DMark Ice Storm Standard Score | 88439 poäng | |
| 3DMark Cloud Gate Standard Score | 22796 poäng | |
| 3DMark Fire Strike Score | 6906 poäng | |
| 3DMark Time Spy Score | 2945 poäng | |
Hjälp | ||
| BioShock Infinite - 1920x1080 Ultra Preset, DX11 (DDOF) | |
| Genomsnitt NVIDIA GeForce GTX 1650 Max-Q (70.2 - 84.3, n=7) | |
| Asus ZenBook 15 UX534FTC-A8190T | |
| Asus ZenBook 15 UX534FT-DB77 | |
| Dell XPS 15 7590 9980HK GTX 1650 | |
| Acer ConceptD 5 CN515-51-73Z7 | |
| Asus ZenBook 15 UX533FD | |
| Apex Legends - 1920x1080 Maximum Settings AA:TS AF:16x | |
| Apple MacBook Pro 16 2019 i9 5500M | |
| Asus ZenBook 15 UX534FTC-A8190T | |
| Genomsnitt NVIDIA GeForce GTX 1650 Max-Q (54.3 - 59.1, n=3) | |
| Need for Speed Heat - 1920x1080 High Preset | |
| Apple MacBook Pro 16 2019 i9 5500M | |
| Genomsnitt NVIDIA GeForce GTX 1650 Max-Q (44 - 46.8, n=2) | |
| Asus ZenBook 15 UX534FTC-A8190T | |
| låg | med. | hög | ultra | |
|---|---|---|---|---|
| Counter-Strike: GO (2012) | 309.6 | 294.4 | 258.6 | 166.6 |
| Tomb Raider (2013) | 367.2 | 253.9 | 191.5 | 92.7 |
| BioShock Infinite (2013) | 286.7 | 208.1 | 182 | 72.7 |
| GTA V (2015) | 162.7 | 142.8 | 76.5 | 36 |
| The Witcher 3 (2015) | 144.6 | 87.2 | 48.7 | 28.1 |
| Batman: Arkham Knight (2015) | 121 | 75 | 64 | 38 |
| Dota 2 Reborn (2015) | 158.2 | 130.9 | 128 | 101.7 |
| World of Warships (2015) | 179 | 144.1 | 117.7 | 104.2 |
| Ashes of the Singularity (2016) | 60.3 | 42.5 | 36.9 | |
| Rocket League (2017) | 249.4 | 193.9 | 131 | |
| World of Tanks enCore (2018) | 414.6 | 160.1 | 59.4 | |
| Far Cry 5 (2018) | 91 | 52 | 48 | 45 |
| Forza Horizon 4 (2018) | 112 | 74 | 69 | 55 |
| Apex Legends (2019) | 143.9 | 78.7 | 59.4 | 59.1 |
| Anthem (2019) | 51.3 | 44.6 | 40.9 | 30.3 |
| Total War: Three Kingdoms (2019) | 150.1 | 52.4 | 31.9 | 23 |
| Control (2019) | 102.8 | 36.1 | 26.3 | |
| Borderlands 3 (2019) | 103.1 | 50.5 | 33.2 | 25.1 |
| FIFA 20 (2019) | 198.6 | 127.9 | 121.5 | 117.7 |
| Ghost Recon Breakpoint (2019) | 75 | 43 | 41 | 24 |
| GRID 2019 (2019) | 121.5 | 60 | 47.6 | 35.2 |
| Call of Duty Modern Warfare 2019 (2019) | 85 | 54.8 | 44.1 | 38.4 |
| Need for Speed Heat (2019) | 68.9 | 50.6 | 44 | 40.6 |
| Red Dead Redemption 2 (2019) | 54.4 | 40.1 | 26.5 | 16.2 |
| Hunt Showdown (2020) | 114.8 | 45.6 | 35.3 |
Ljudnivå
| Låg belastning |
| 30.3 / 30.3 / 30.9 dB(A) |
| Hög belastning |
| 31.3 / 38.2 dB(A) |
 | ||
30 dB tyst 40 dB(A) hörbar 50 dB(A) högt ljud |
||
min: | ||
| Asus ZenBook 15 UX534FTC-A8190T i7-10510U, GeForce GTX 1650 Max-Q | Asus ZenBook 15 UX534FT-DB77 i7-8565U, GeForce GTX 1650 Max-Q | Acer ConceptD 5 CN515-51-73Z7 i7-8705G, Vega M GL / 870 | Dell XPS 15 7590 9980HK GTX 1650 i9-9980HK, GeForce GTX 1650 Mobile | Asus ZenBook 15 UX533FD i7-8565U, GeForce GTX 1050 Max-Q | Apple MacBook Pro 16 2019 i9 5500M i9-9880H, Radeon Pro 5500M | Genomsnitt NVIDIA GeForce GTX 1650 Max-Q | Genomsnitt av klass Multimedia | |
|---|---|---|---|---|---|---|---|---|
| Noise | 1% | -1% | -9% | -7% | -10% | -5% | 6% | |
| av / miljö * (dB) | 30.3 | 28.4 6% | 30.3 -0% | 28.2 7% | 30.5 -1% | 29.8 2% | 29.6 ? 2% | 24.2 ? 20% |
| Idle Minimum * (dB) | 30.3 | 28.4 6% | 30.3 -0% | 28.2 7% | 30.5 -1% | 29.9 1% | 30.2 ? -0% | 24.3 ? 20% |
| Idle Average * (dB) | 30.3 | 28.4 6% | 30.3 -0% | 28.2 7% | 30.5 -1% | 29.9 1% | 30.4 ? -0% | 24.7 ? 18% |
| Idle Maximum * (dB) | 30.9 | 28.4 8% | 30.3 2% | 30.4 2% | 30.5 1% | 29.9 3% | 30.9 ? -0% | 26.4 ? 15% |
| Load Average * (dB) | 31.3 | 33.9 -8% | 32.6 -4% | 43.8 -40% | 40.8 -30% | 43 -37% | 38.2 ? -22% | 37.4 ? -19% |
| Witcher 3 ultra * (dB) | 38.1 | 39.8 -4% | 47.2 -24% | 45.4 -19% | ||||
| Load Maximum * (dB) | 38.2 | 40.2 -5% | 40.2 -5% | 47.2 -24% | 41.8 -9% | 46.1 -21% | 41.2 ? -8% | 46.2 ? -21% |
* ... mindre är bättre
(±) Den maximala temperaturen på ovansidan är 41.4 °C / 107 F, jämfört med genomsnittet av 36.8 °C / 98 F , allt från 21 till 71 °C för klassen Multimedia.
(±) Botten värms upp till maximalt 40.3 °C / 105 F, jämfört med genomsnittet av 39.1 °C / 102 F
(+) Vid tomgångsbruk är medeltemperaturen för ovansidan 24.3 °C / 76 F, jämfört med enhetsgenomsnittet på 31.3 °C / ### class_avg_f### F.
(±) När du spelar The Witcher 3 är medeltemperaturen för ovansidan 34.3 °C / 94 F, jämfört med enhetsgenomsnittet på 31.3 °C / ## #class_avg_f### F.
(+) Handledsstöden och pekplattan är kallare än hudtemperaturen med maximalt 30.2 °C / 86.4 F och är därför svala att ta på.
(±) Medeltemperaturen för handledsstödsområdet på liknande enheter var 28.7 °C / 83.7 F (-1.5 °C / -2.7 F).
| Asus ZenBook 15 UX534FTC-A8190T i7-10510U, GeForce GTX 1650 Max-Q | Asus ZenBook 15 UX534FT-DB77 i7-8565U, GeForce GTX 1650 Max-Q | Acer ConceptD 5 CN515-51-73Z7 i7-8705G, Vega M GL / 870 | Dell XPS 15 7590 9980HK GTX 1650 i9-9980HK, GeForce GTX 1650 Mobile | Asus ZenBook 15 UX533FD i7-8565U, GeForce GTX 1050 Max-Q | Apple MacBook Pro 16 2019 i9 5500M i9-9880H, Radeon Pro 5500M | Genomsnitt NVIDIA GeForce GTX 1650 Max-Q | Genomsnitt av klass Multimedia | |
|---|---|---|---|---|---|---|---|---|
| Heat | -33% | -6% | -30% | -7% | 3% | -18% | -5% | |
| Maximum Upper Side * (°C) | 41.4 | 45.4 -10% | 44.6 -8% | 50.4 -22% | 47.2 -14% | 42 -1% | 47.4 ? -14% | 41.1 ? 1% |
| Maximum Bottom * (°C) | 40.3 | 51.6 -28% | 45.4 -13% | 49.2 -22% | 43.2 -7% | 38 6% | 49.4 ? -23% | 43.7 ? -8% |
| Idle Upper Side * (°C) | 25.7 | 35.4 -38% | 26.1 -2% | 34.8 -35% | 27.7 -8% | 25 3% | 29.9 ? -16% | 27 ? -5% |
| Idle Bottom * (°C) | 25.8 | 40 -55% | 26.4 -2% | 36.4 -41% | 25.6 1% | 25 3% | 30.8 ? -19% | 28 ? -9% |
* ... mindre är bättre
Asus ZenBook 15 UX534FTC-A8190T ljudanalys
(-) | inte särskilt höga högtalare (63.8 dB)
Bas 100 - 315 Hz
(-) | nästan ingen bas - i genomsnitt 16.8% lägre än medianen
(±) | linjäriteten för basen är genomsnittlig (13.7% delta till föregående frekvens)
Mellan 400 - 2000 Hz
(+) | balanserad mellan - endast 4.9% från medianen
(+) | mids är linjära (6.1% delta till föregående frekvens)
Högsta 2 - 16 kHz
(+) | balanserade toppar - endast 1.5% från medianen
(+) | toppar är linjära (4.7% delta till föregående frekvens)
Totalt 100 - 16 000 Hz
(±) | linjäriteten för det totala ljudet är genomsnittlig (22.2% skillnad mot median)
Jämfört med samma klass
» 79% av alla testade enheter i den här klassen var bättre, 4% liknande, 17% sämre
» Den bästa hade ett delta på 5%, genomsnittet var 17%, sämst var 45%
Jämfört med alla testade enheter
» 65% av alla testade enheter var bättre, 6% liknande, 29% sämre
» Den bästa hade ett delta på 4%, genomsnittet var 23%, sämst var 134%
| Av/Standby | |
| Låg belastning | |
| Hög belastning |
|
Förklaring:
min: | |
| Asus ZenBook 15 UX534FTC-A8190T i7-10510U, GeForce GTX 1650 Max-Q | Asus ZenBook 15 UX534FT-DB77 i7-8565U, GeForce GTX 1650 Max-Q | Acer ConceptD 5 CN515-51-73Z7 i7-8705G, Vega M GL / 870 | Dell XPS 15 7590 9980HK GTX 1650 i9-9980HK, GeForce GTX 1650 Mobile | Asus ZenBook 15 UX533FD i7-8565U, GeForce GTX 1050 Max-Q | Apple MacBook Pro 16 2019 i9 5500M i9-9880H, Radeon Pro 5500M | Genomsnitt NVIDIA GeForce GTX 1650 Max-Q | Genomsnitt av klass Multimedia | |
|---|---|---|---|---|---|---|---|---|
| Power Consumption | -55% | -110% | -70% | -4% | -48% | -66% | -36% | |
| Idle Minimum * (Watt) | 2.8 | 5 -79% | 12 -329% | 6.2 -121% | 2.7 4% | 3.7 -32% | 7.75 ? -177% | 5.72 ? -104% |
| Idle Average * (Watt) | 7.7 | 13.2 -71% | 17.8 -131% | 9.6 -25% | 8 -4% | 12.1 -57% | 11.8 ? -53% | 10.2 ? -32% |
| Idle Maximum * (Watt) | 9.4 | 24 -155% | 19.7 -110% | 21.2 -126% | 10.6 -13% | 17 -81% | 16.6 ? -77% | 12.4 ? -32% |
| Load Average * (Watt) | 57 | 70 -23% | 59 -4% | 104.3 -83% | 74 -30% | 91.5 -61% | 75.2 ? -32% | 65.5 ? -15% |
| Witcher 3 ultra * (Watt) | 62 | 63.3 -2% | 91.7 -48% | 103 -66% | ||||
| Load Maximum * (Watt) | 116 | 114 2% | 87 25% | 135.3 -17% | 89 23% | 102.3 12% | 105.5 ? 9% | 114 ? 2% |
* ... mindre är bättre
| Asus ZenBook 15 UX534FTC-A8190T i7-10510U, GeForce GTX 1650 Max-Q, 71 Wh | Asus ZenBook 15 UX533FD i7-8565U, GeForce GTX 1050 Max-Q, 73 Wh | Acer ConceptD 5 CN515-51-73Z7 i7-8705G, Vega M GL / 870, 48 Wh | Dell XPS 15 7590 9980HK GTX 1650 i9-9980HK, GeForce GTX 1650 Mobile, 97 Wh | Asus ZenBook 15 UX534FT-DB77 i7-8565U, GeForce GTX 1650 Max-Q, 71 Wh | Apple MacBook Pro 16 2019 i9 5500M i9-9880H, Radeon Pro 5500M, 99.8 Wh | Genomsnitt av klass Multimedia | |
|---|---|---|---|---|---|---|---|
| Batteridrifttid | -4% | -55% | -14% | -11% | -26% | -1% | |
| Reader / Idle (h) | 27.2 | 26.5 -3% | 7.7 -72% | 15.2 -44% | 21.5 -21% | 24.9 ? -8% | |
| H.264 (h) | 11.9 | 6.9 -42% | 9.7 -18% | 16.4 ? 38% | |||
| WiFi v1.3 (h) | 12.4 | 8.7 -30% | 4.6 -63% | 7.8 -37% | 8.4 -32% | 12 -3% | 12.2 ? -2% |
| Load (h) | 2.4 | 2.9 21% | 1.4 -42% | 3.3 38% | 2.9 21% | 1 -58% | 1.668 ? -30% |
| Witcher 3 ultra (h) | 0.9 |
För
Emot
Läs den fullständiga versionen av den här recensionen på engelska här.
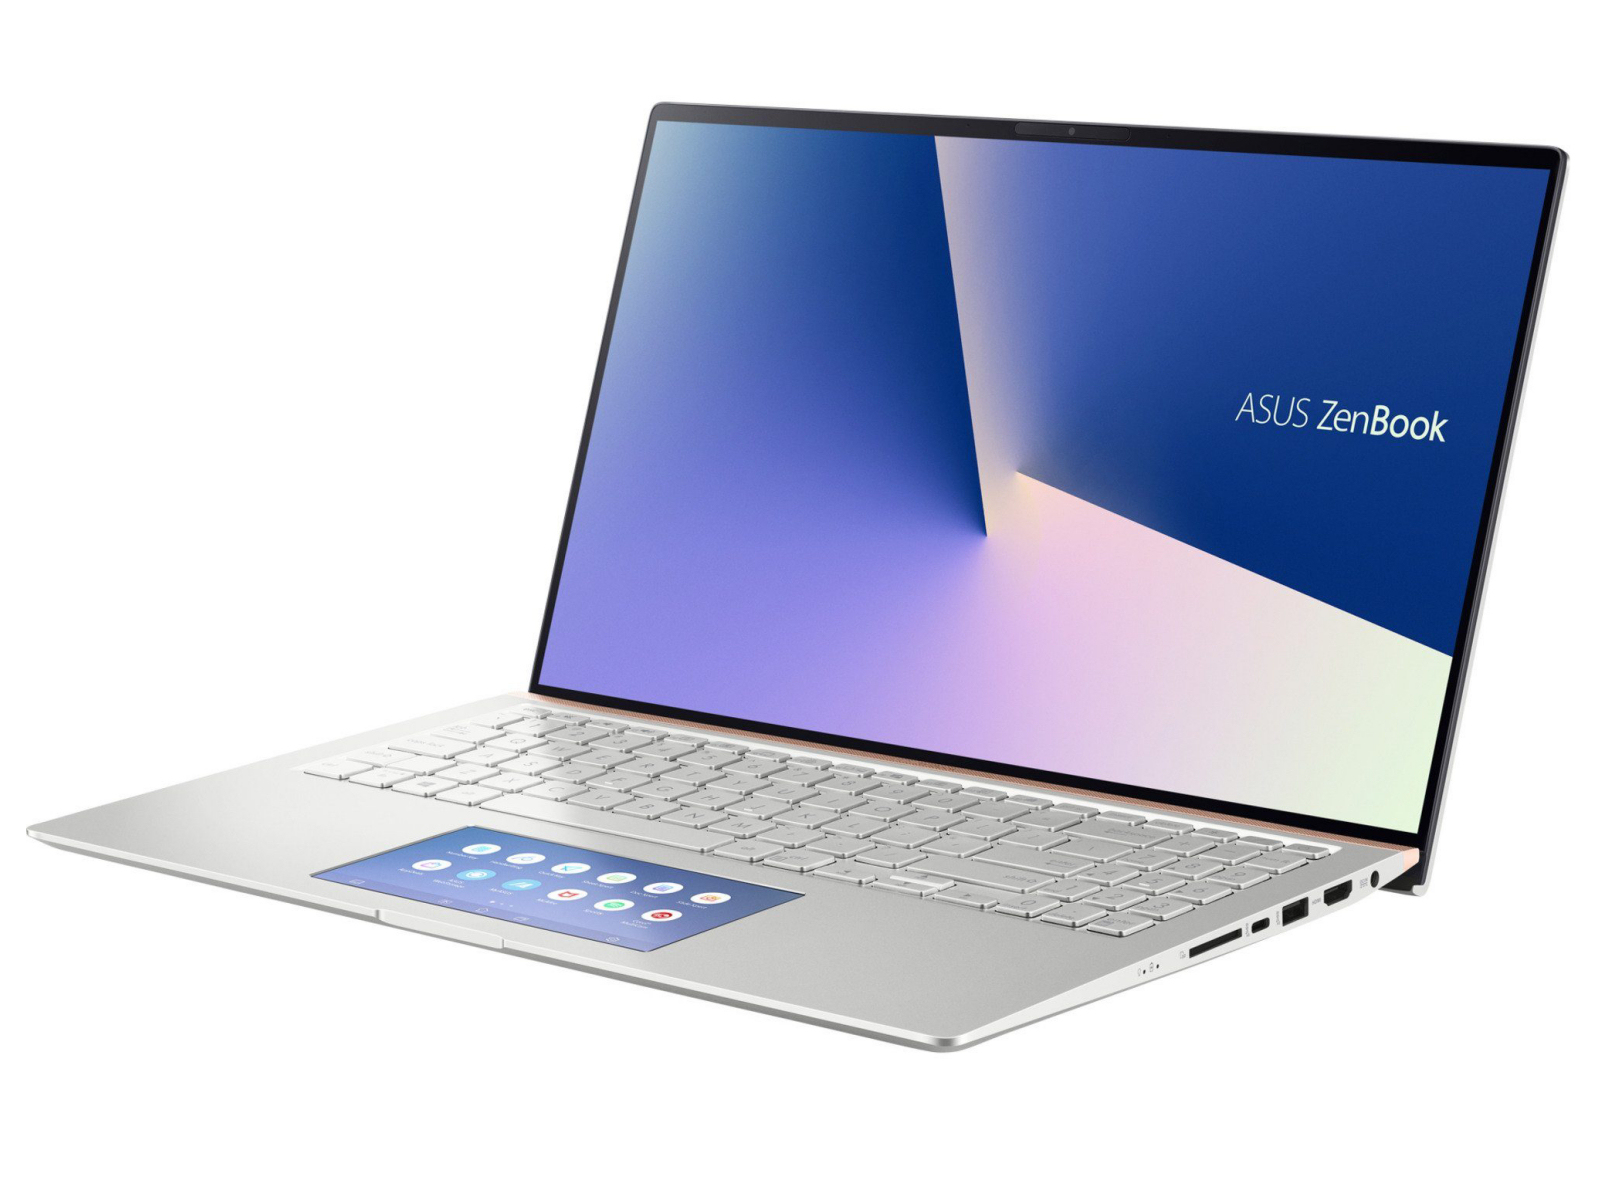
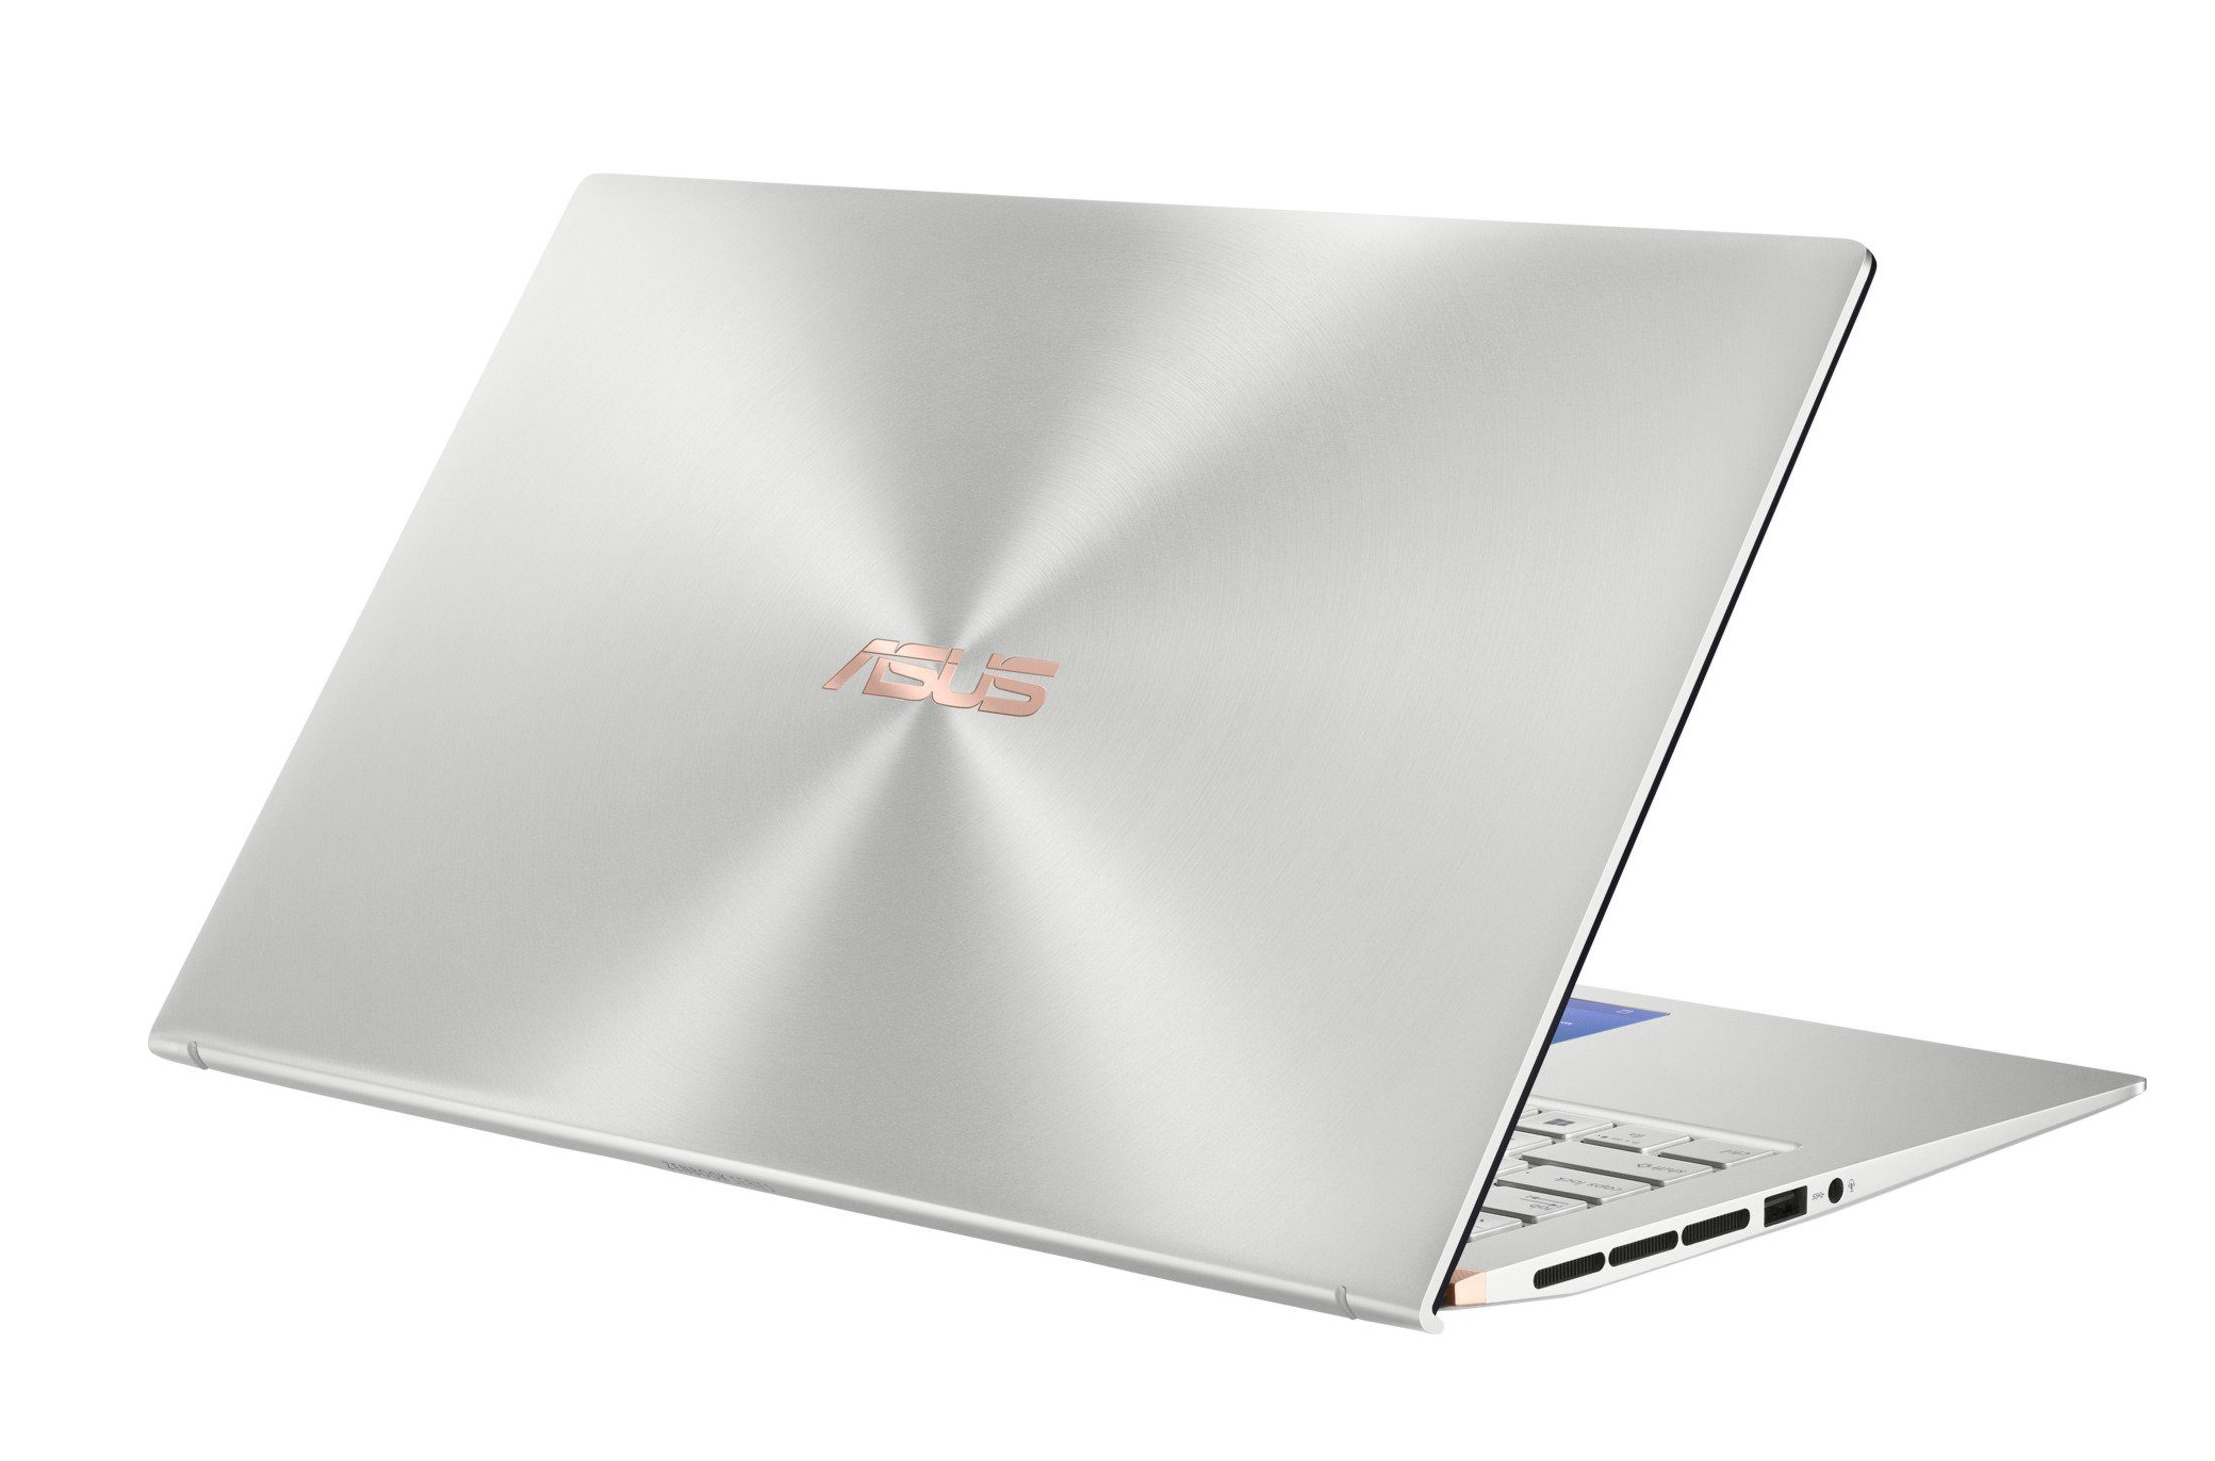
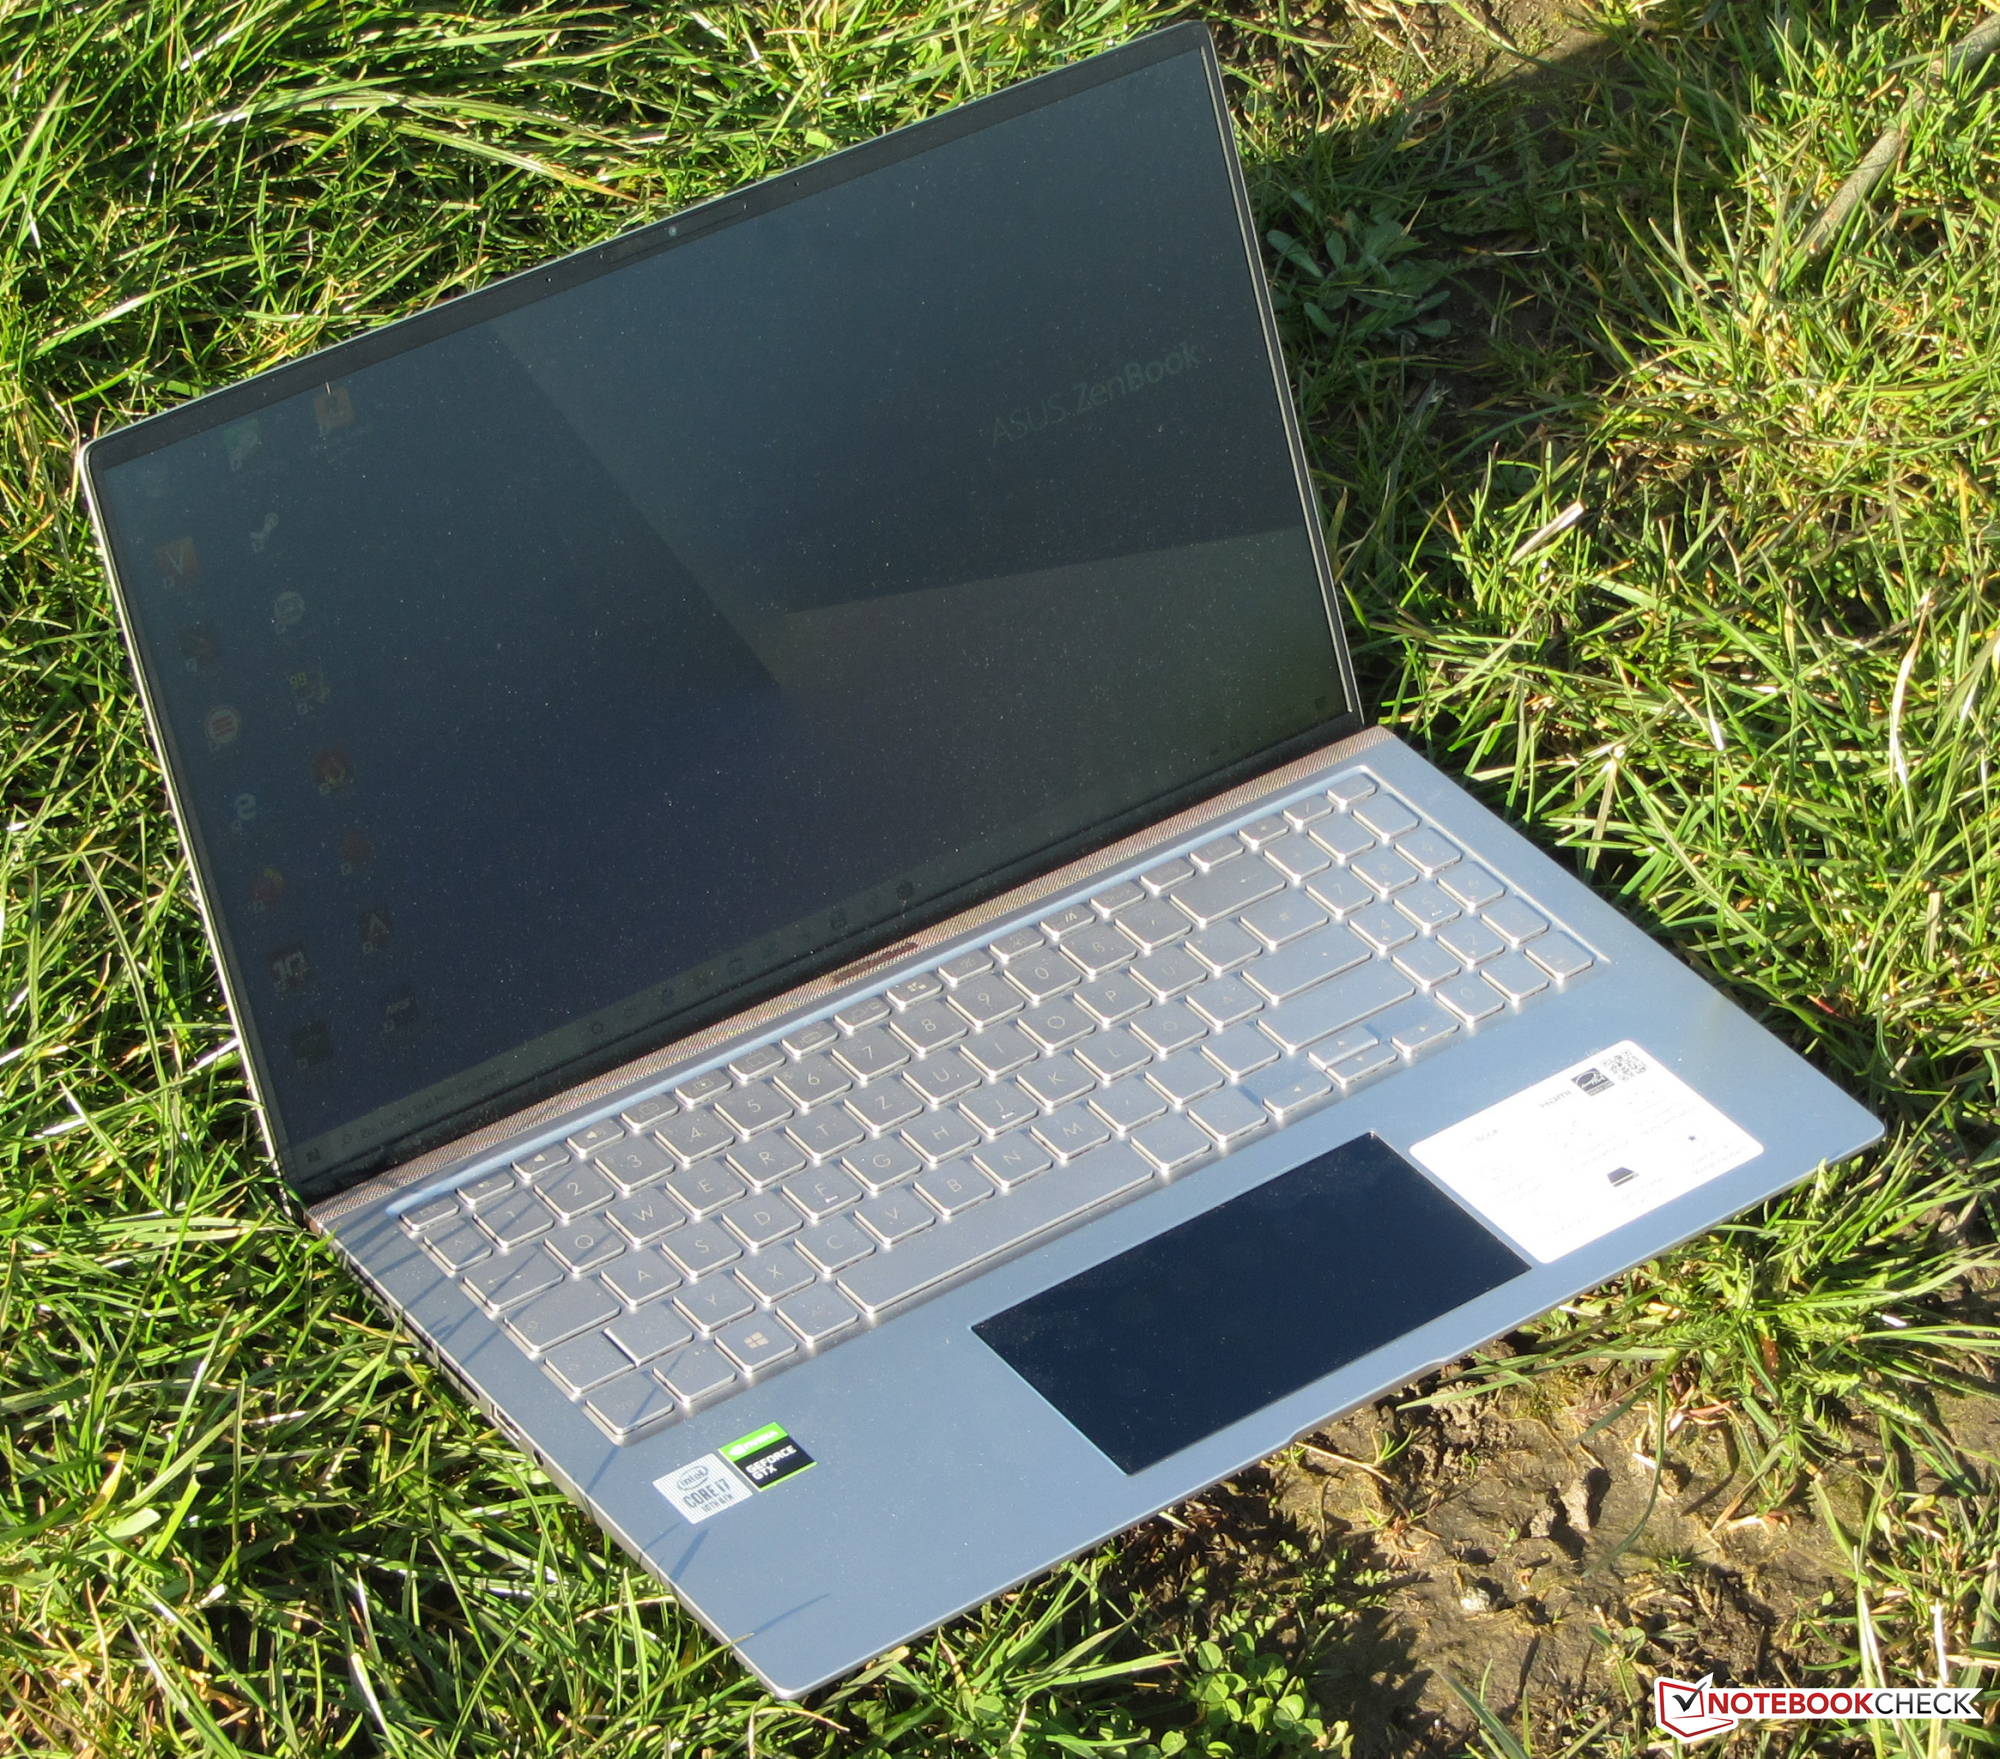
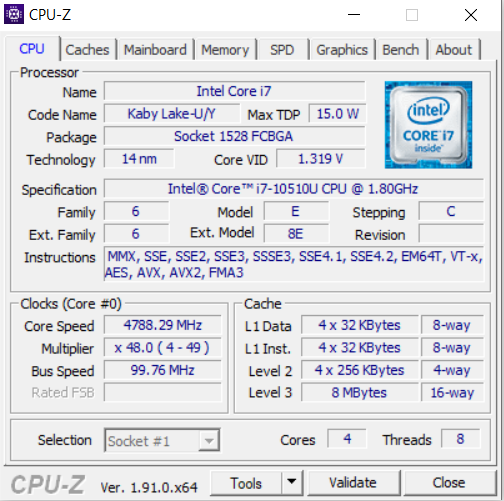
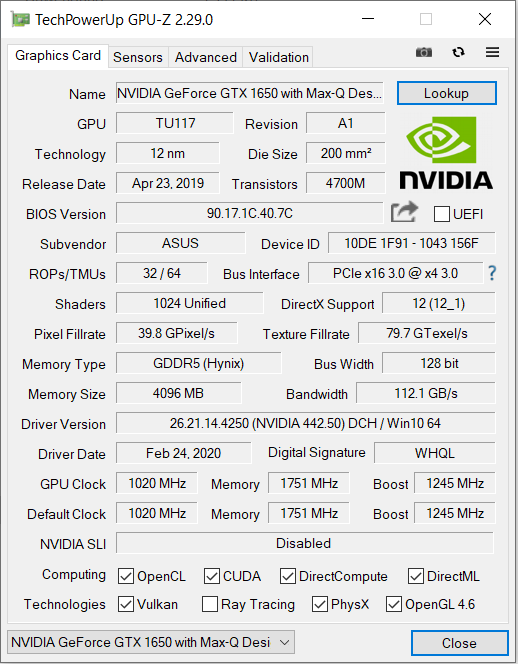
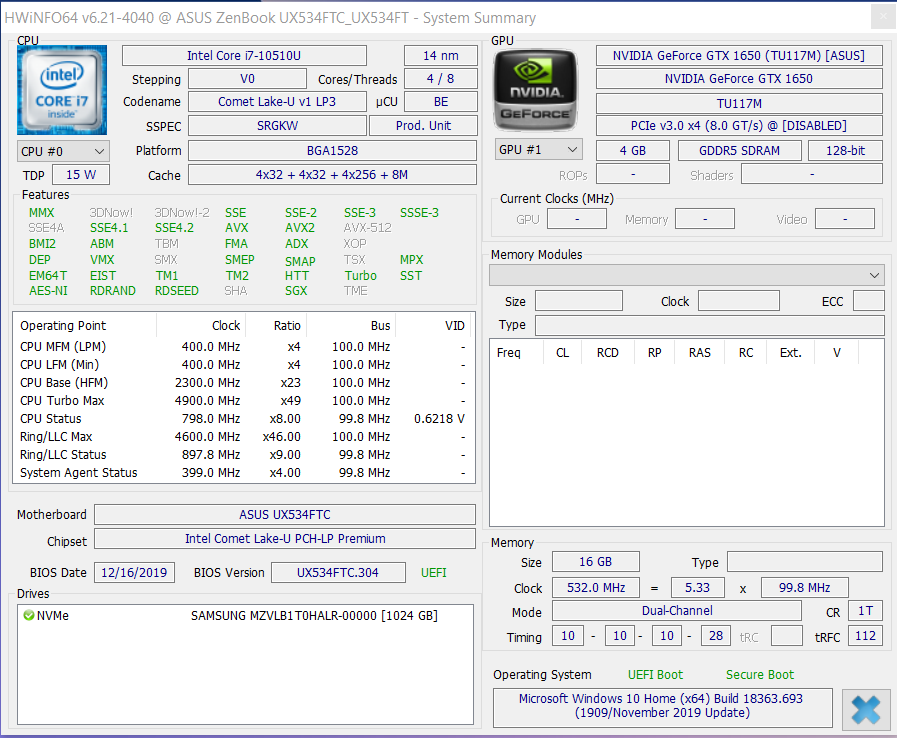
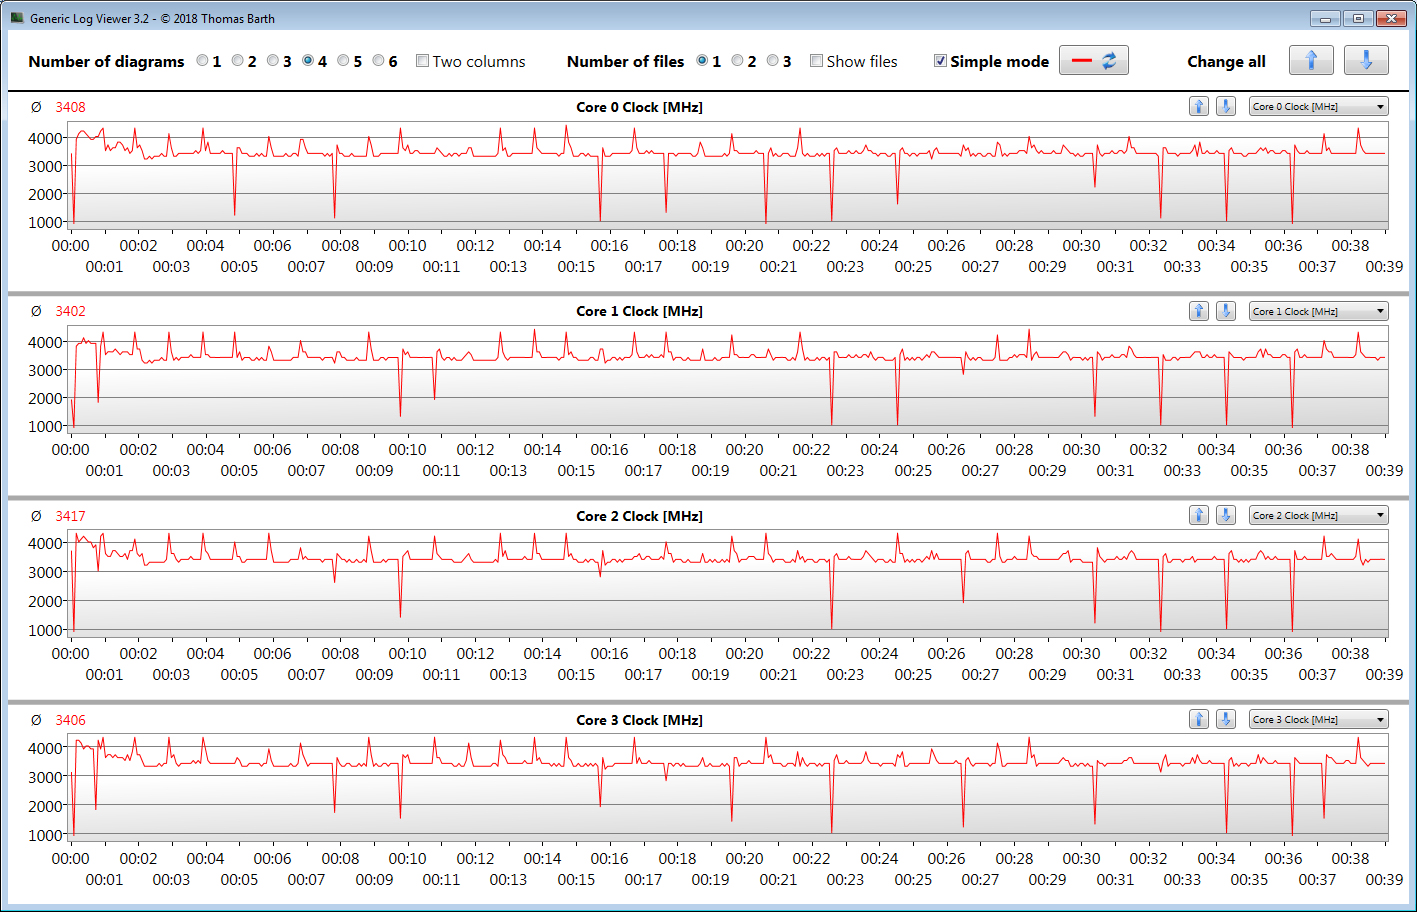
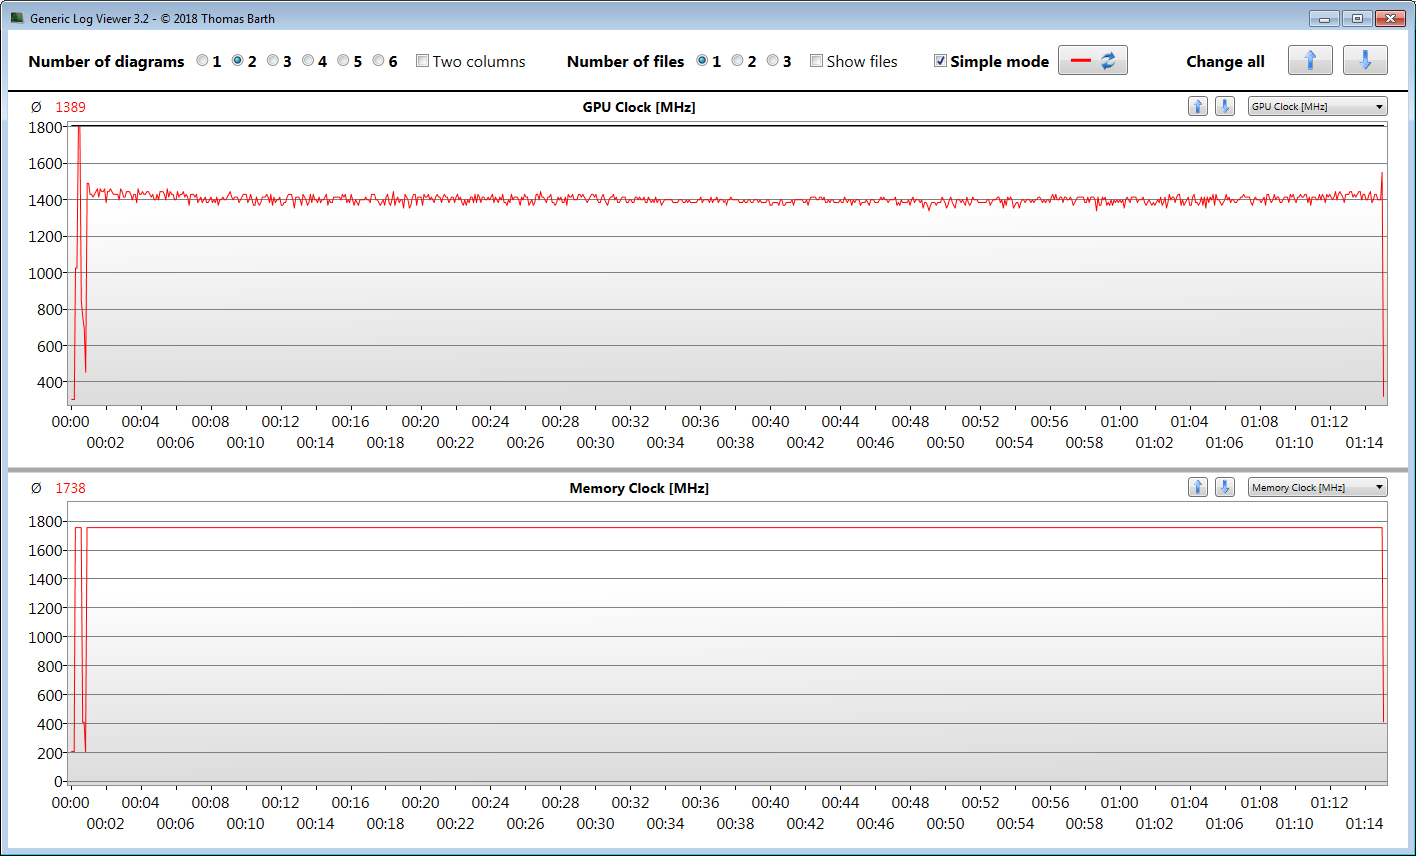
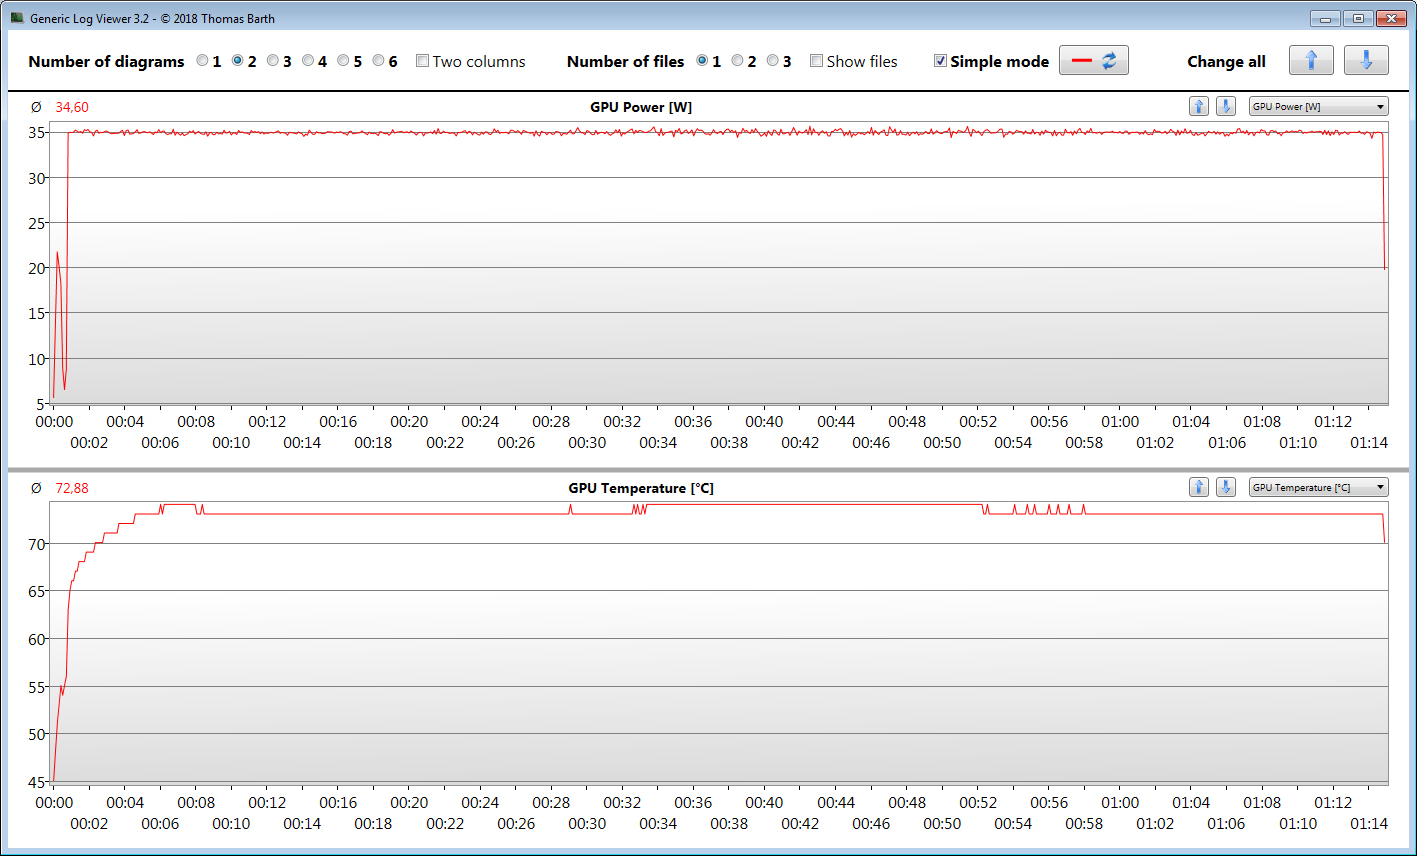
Med ZenBook 15 UX534FTC har Asus skapat en elegant och tunn 15.6 tums-laptop som nästan har samma dimensioner som en enhet på 14 tum. Trots den kompakta konstruktionen saknar den inte prestanda. Både den fyrkärniga processorn Core i7-10510U och det dedikerade grafikkortet GeForce GTX 1650 Max-Q kan konsekvent köras i höga hastigheter.
När det kommer till processorn gäller detta dock bara när datorn är ansluten till elnätet. Vid batteridrift använder processorn Turbo Boost dåligt eller inte alls. Detta är bevisligen priset för datorns utmärkta batteritid. En positiv egenskap är dock att värmeutvecklingen i värsta fall är sansad och även ljudnivån är acceptabel.
Asus ZenBook 15 UX534FTC kombinerar hög prestanda med enastående batteritid.
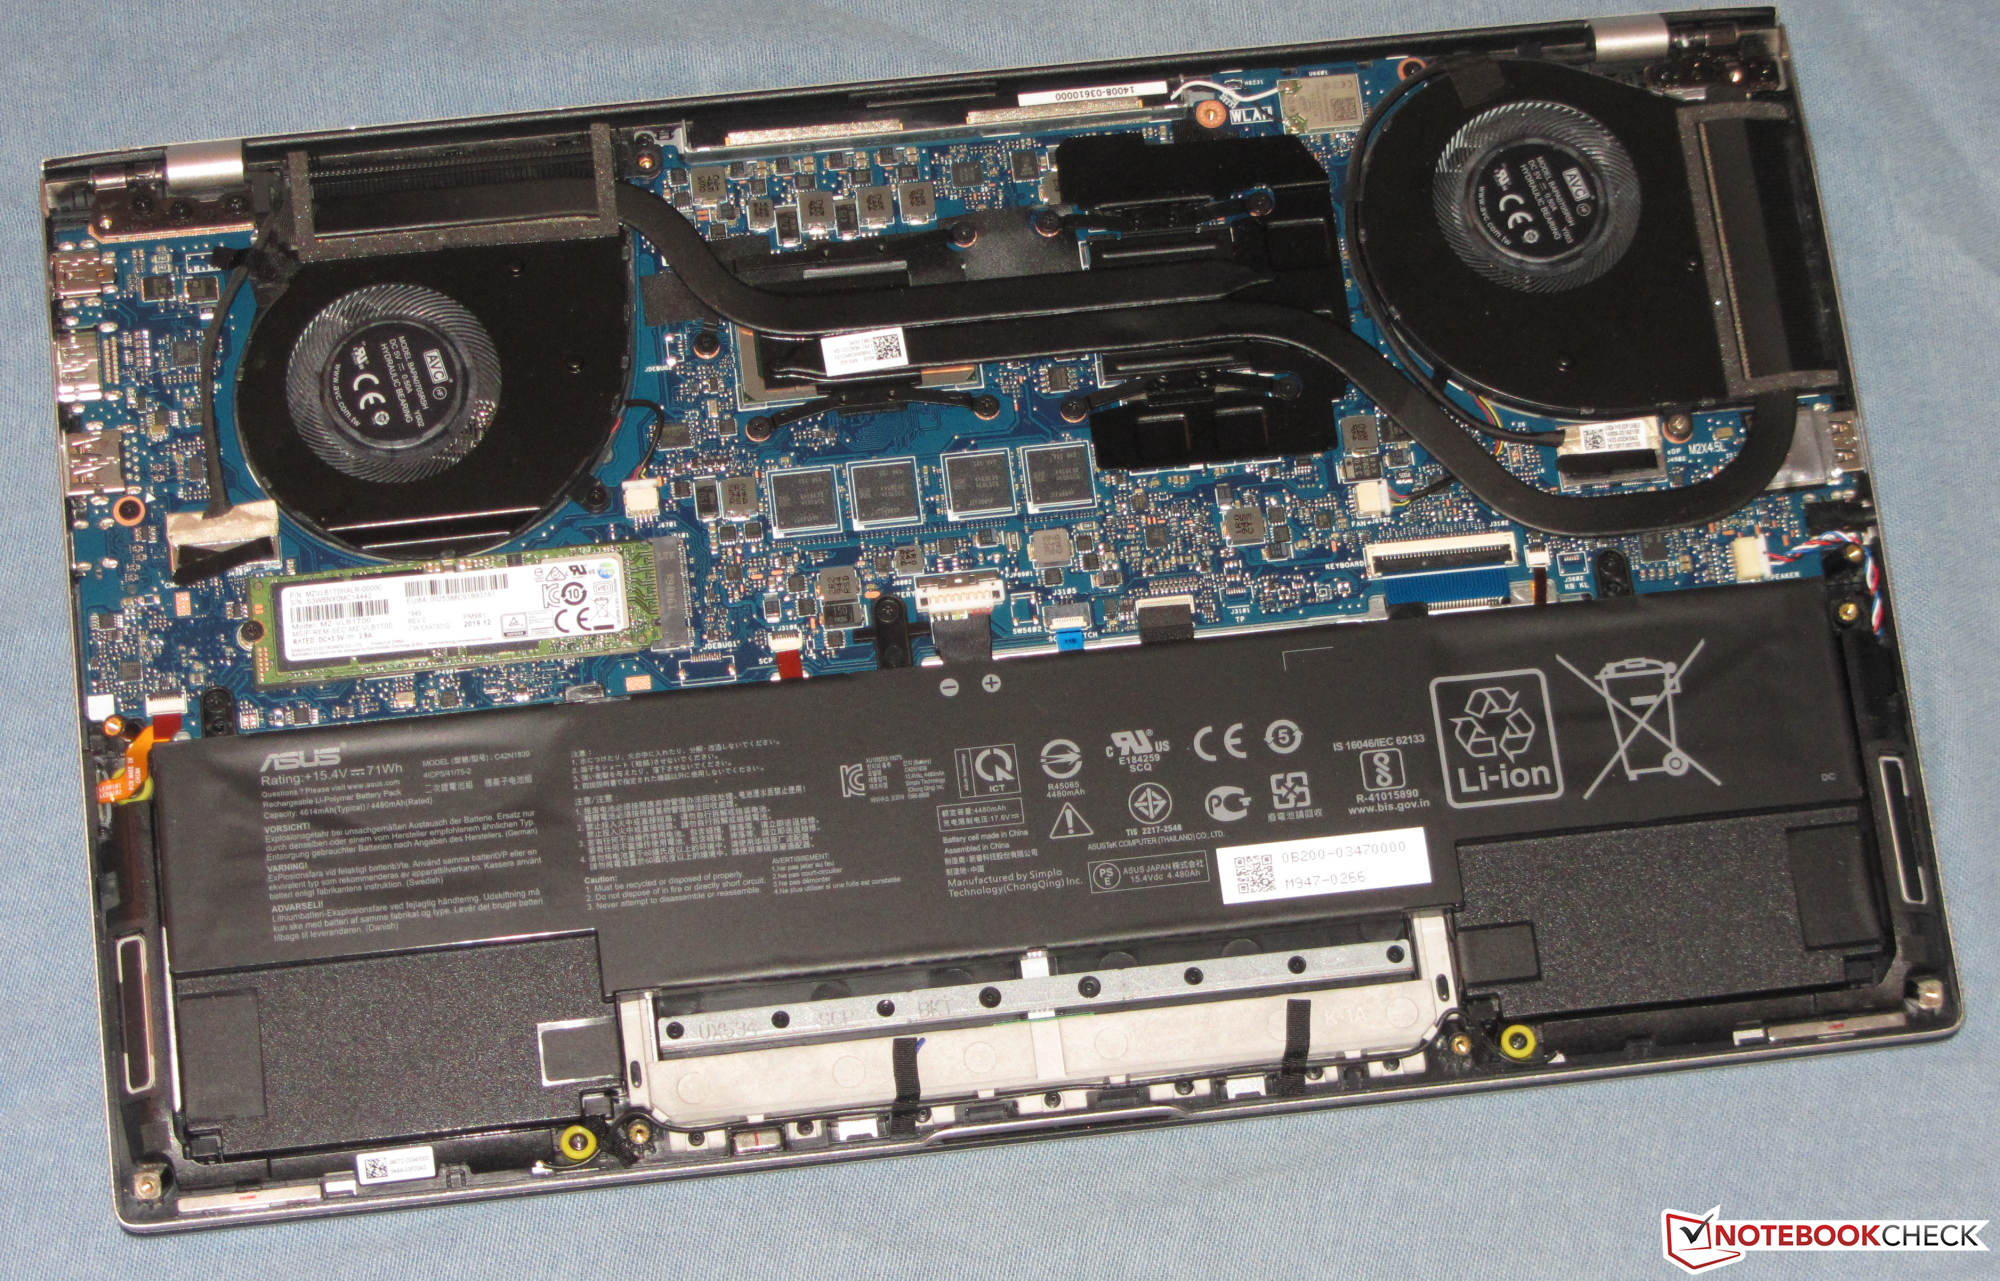
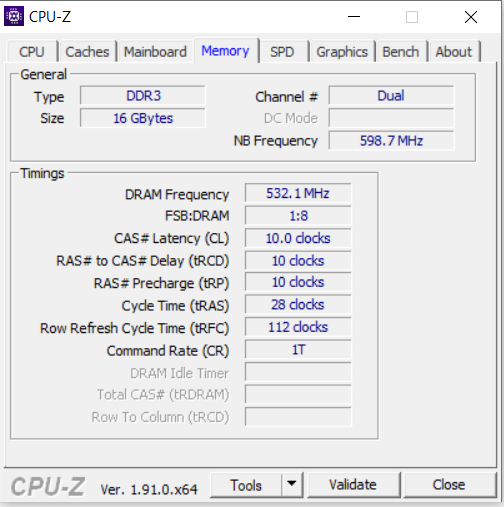
NVMe SSD-enheten som är installerad har snabba överföringshastigheter och tillräckligt med lagring. Att byta ut SSD-enheten kräver att man öppnar höljet, något som dock inte är särskilt komplicerat. Däremot går datorns RAM (upp till 16 GB) inte att uppgradera eftersom det sitter fastlött. Vi hade gärna sett en ZenBook-modell med 32 GB RAM för den som önskar en mer framtidssäkrad konfiguration.
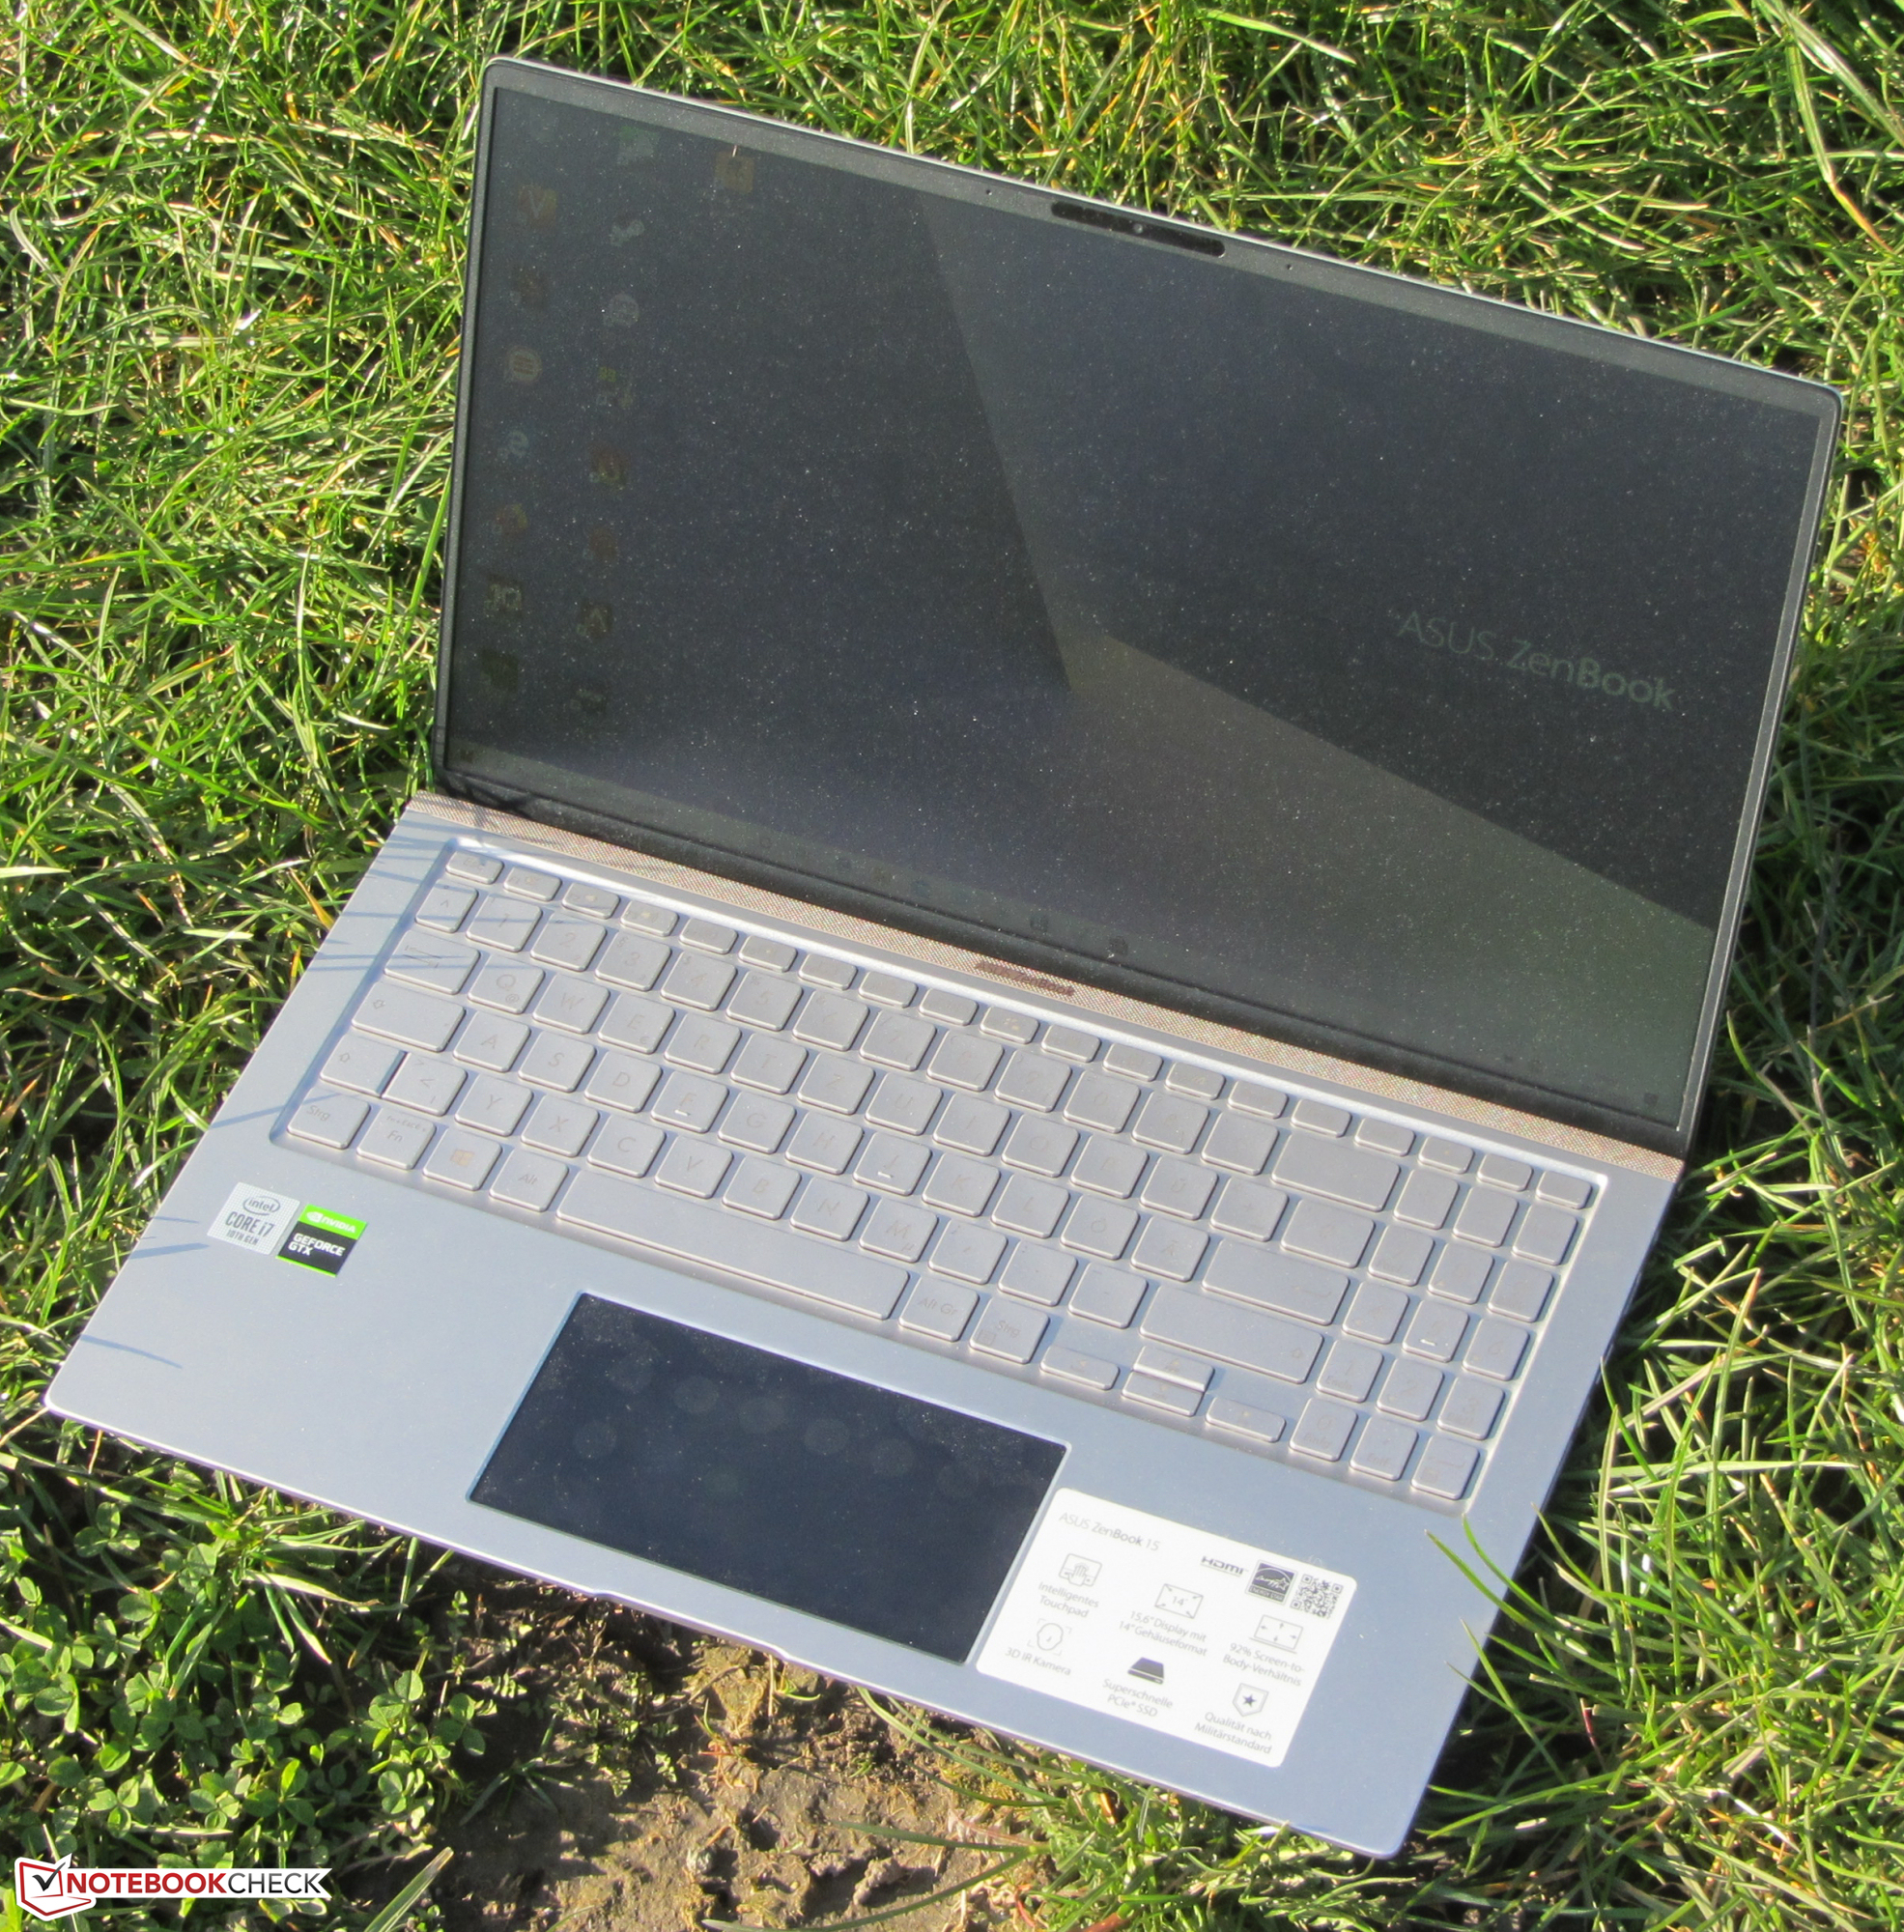
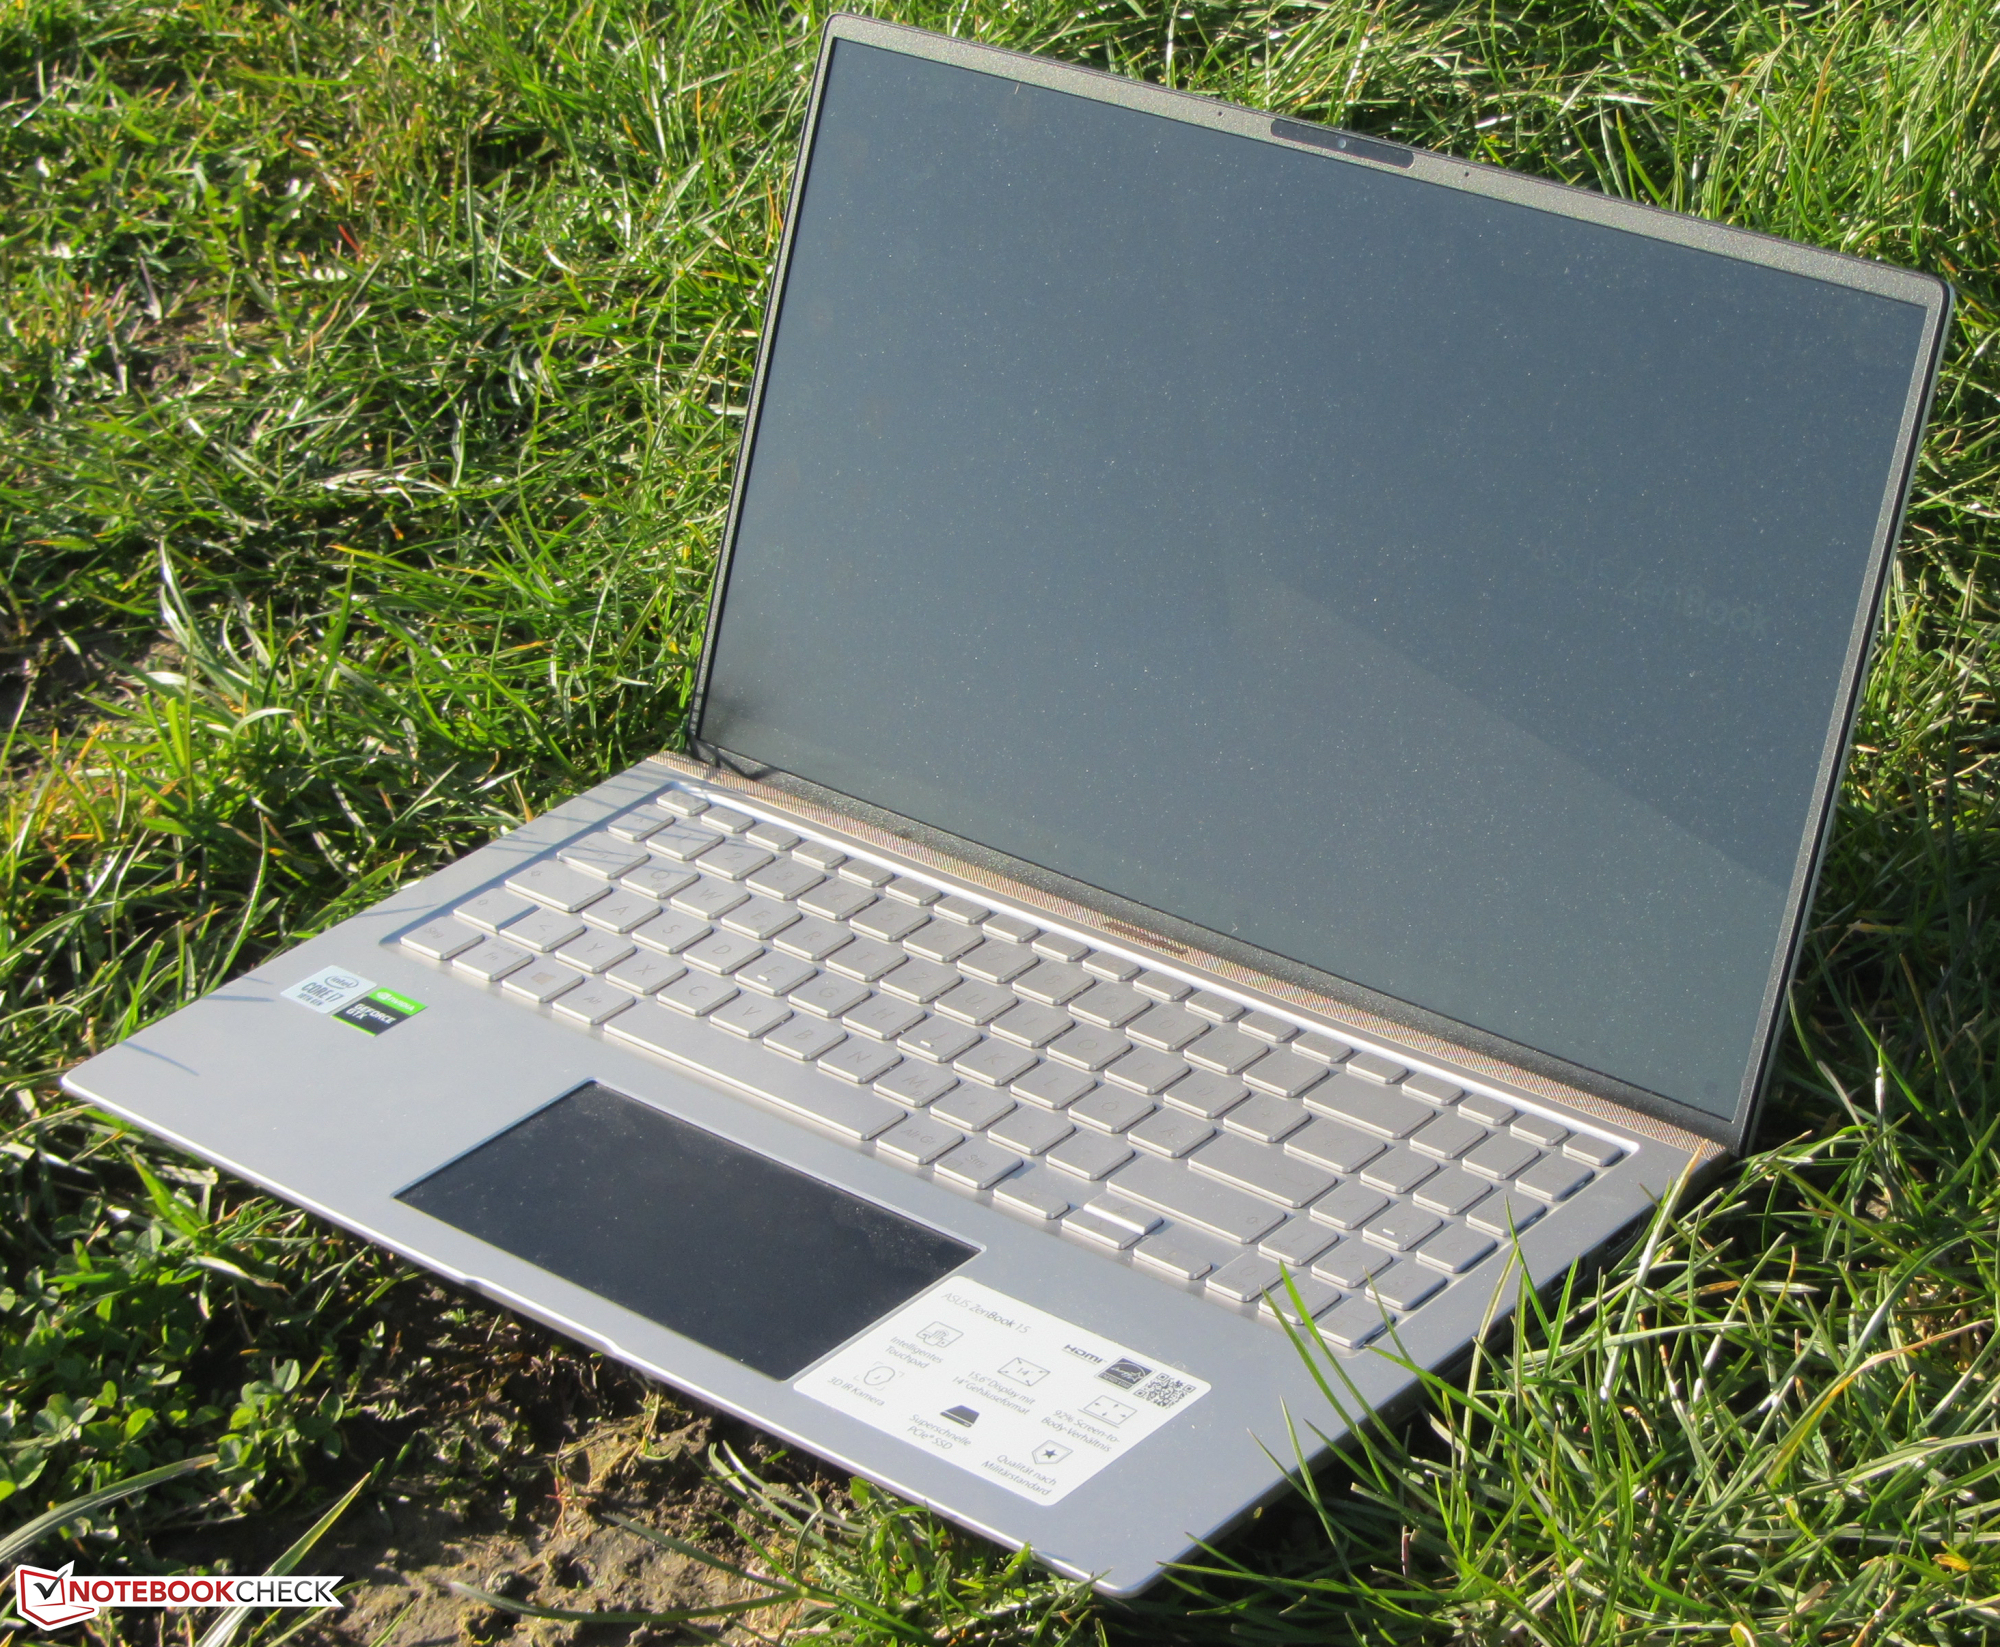
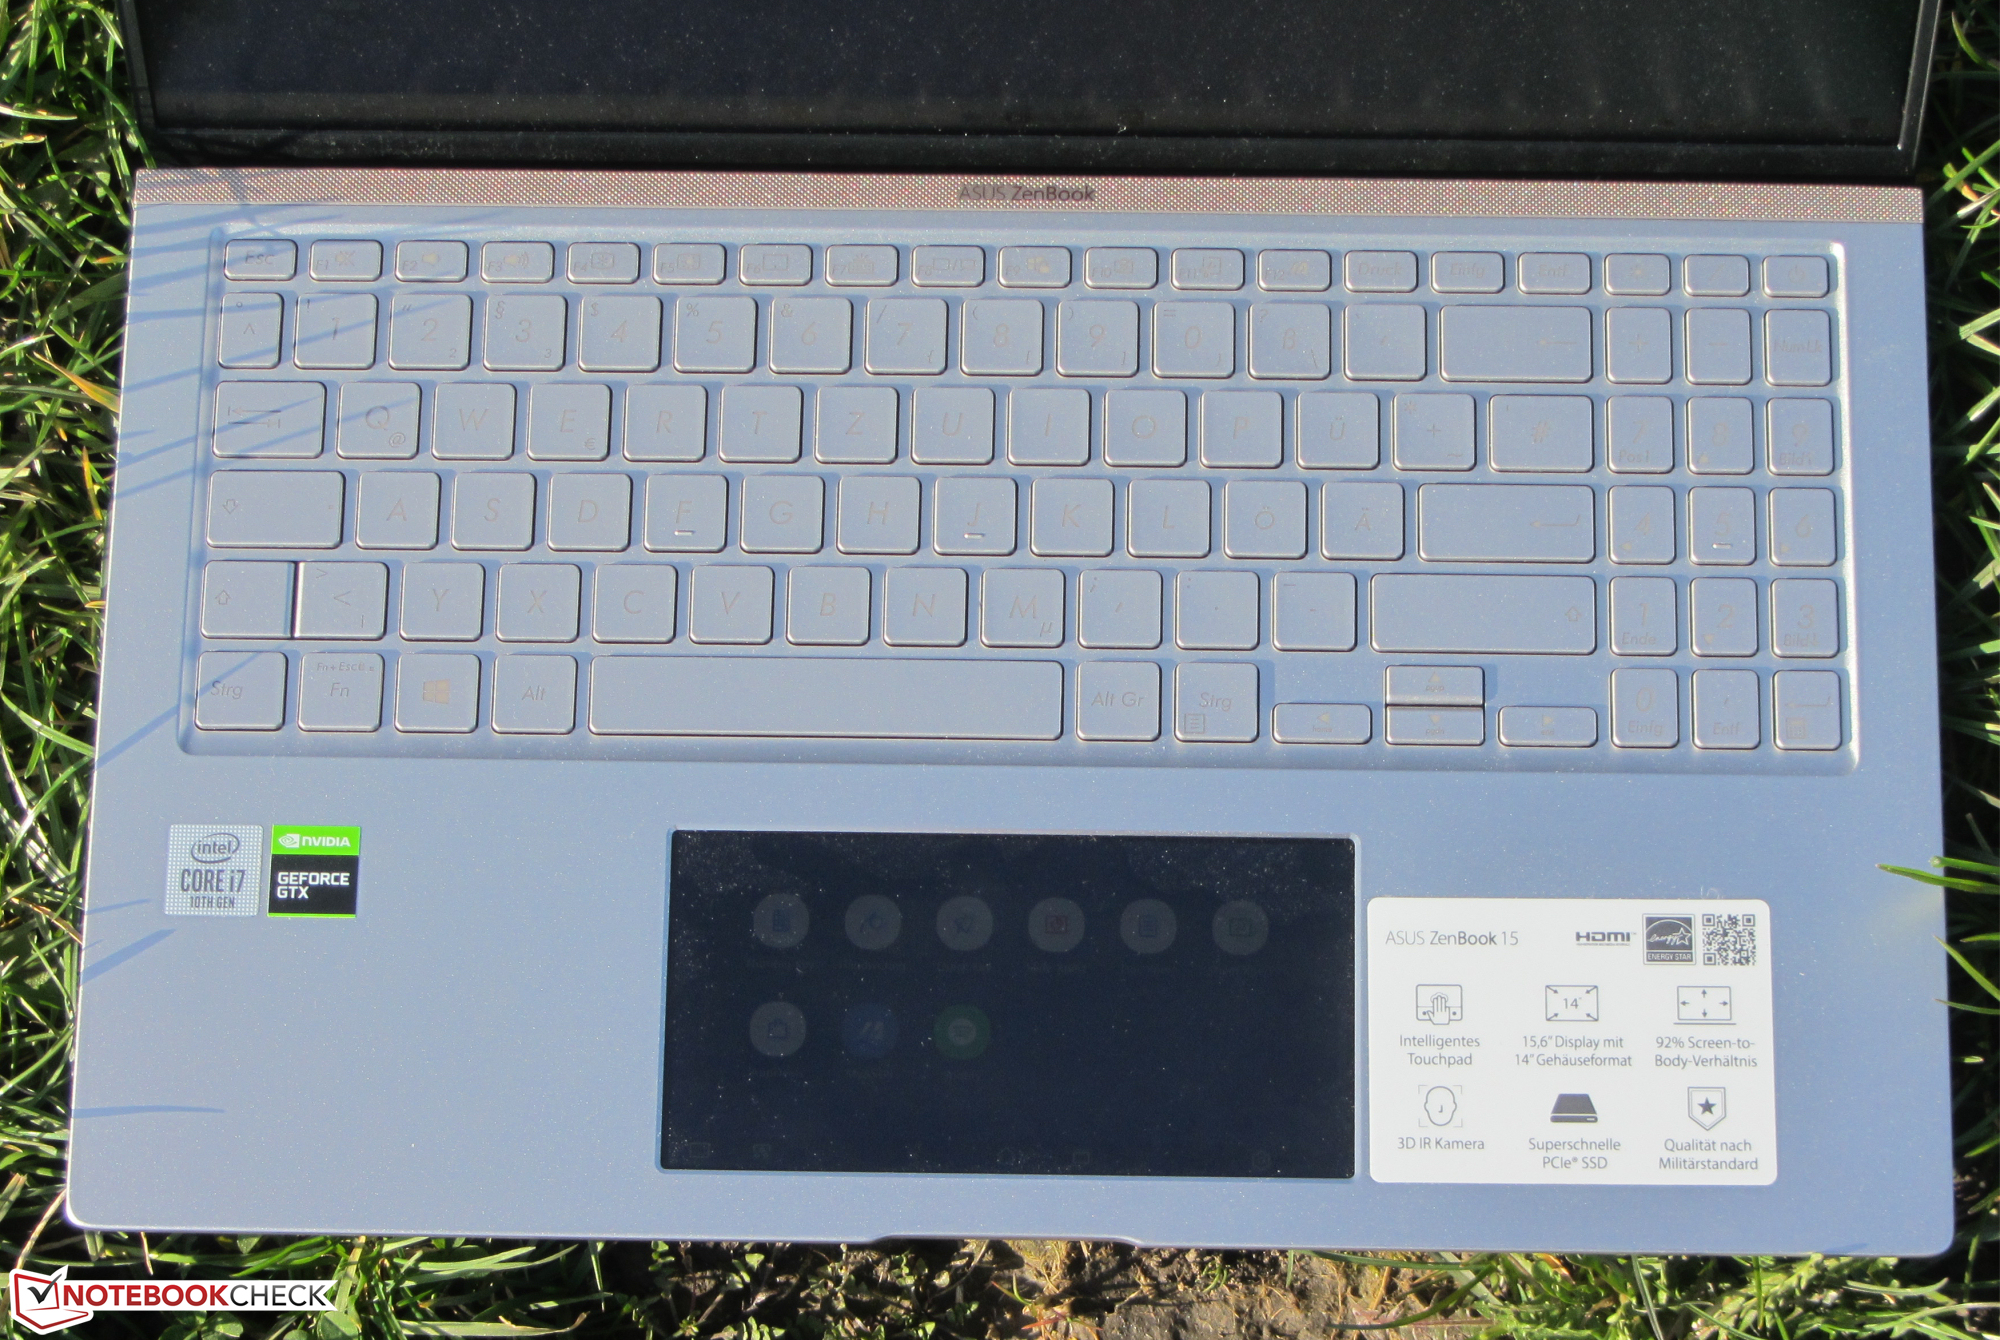
Den matta IPS-skärmen briljerar med gedigna betraktningsvinklar, ett bra kontrastförhållande och skaplig färgåtergivning. Men med det sagt har den för låg ljusstyrka för en enhet från det här prisskiktet. Tangentbordets bakgrundsbelysning har visat sig vara ett trevligt tillägg vid vardagsbruk.
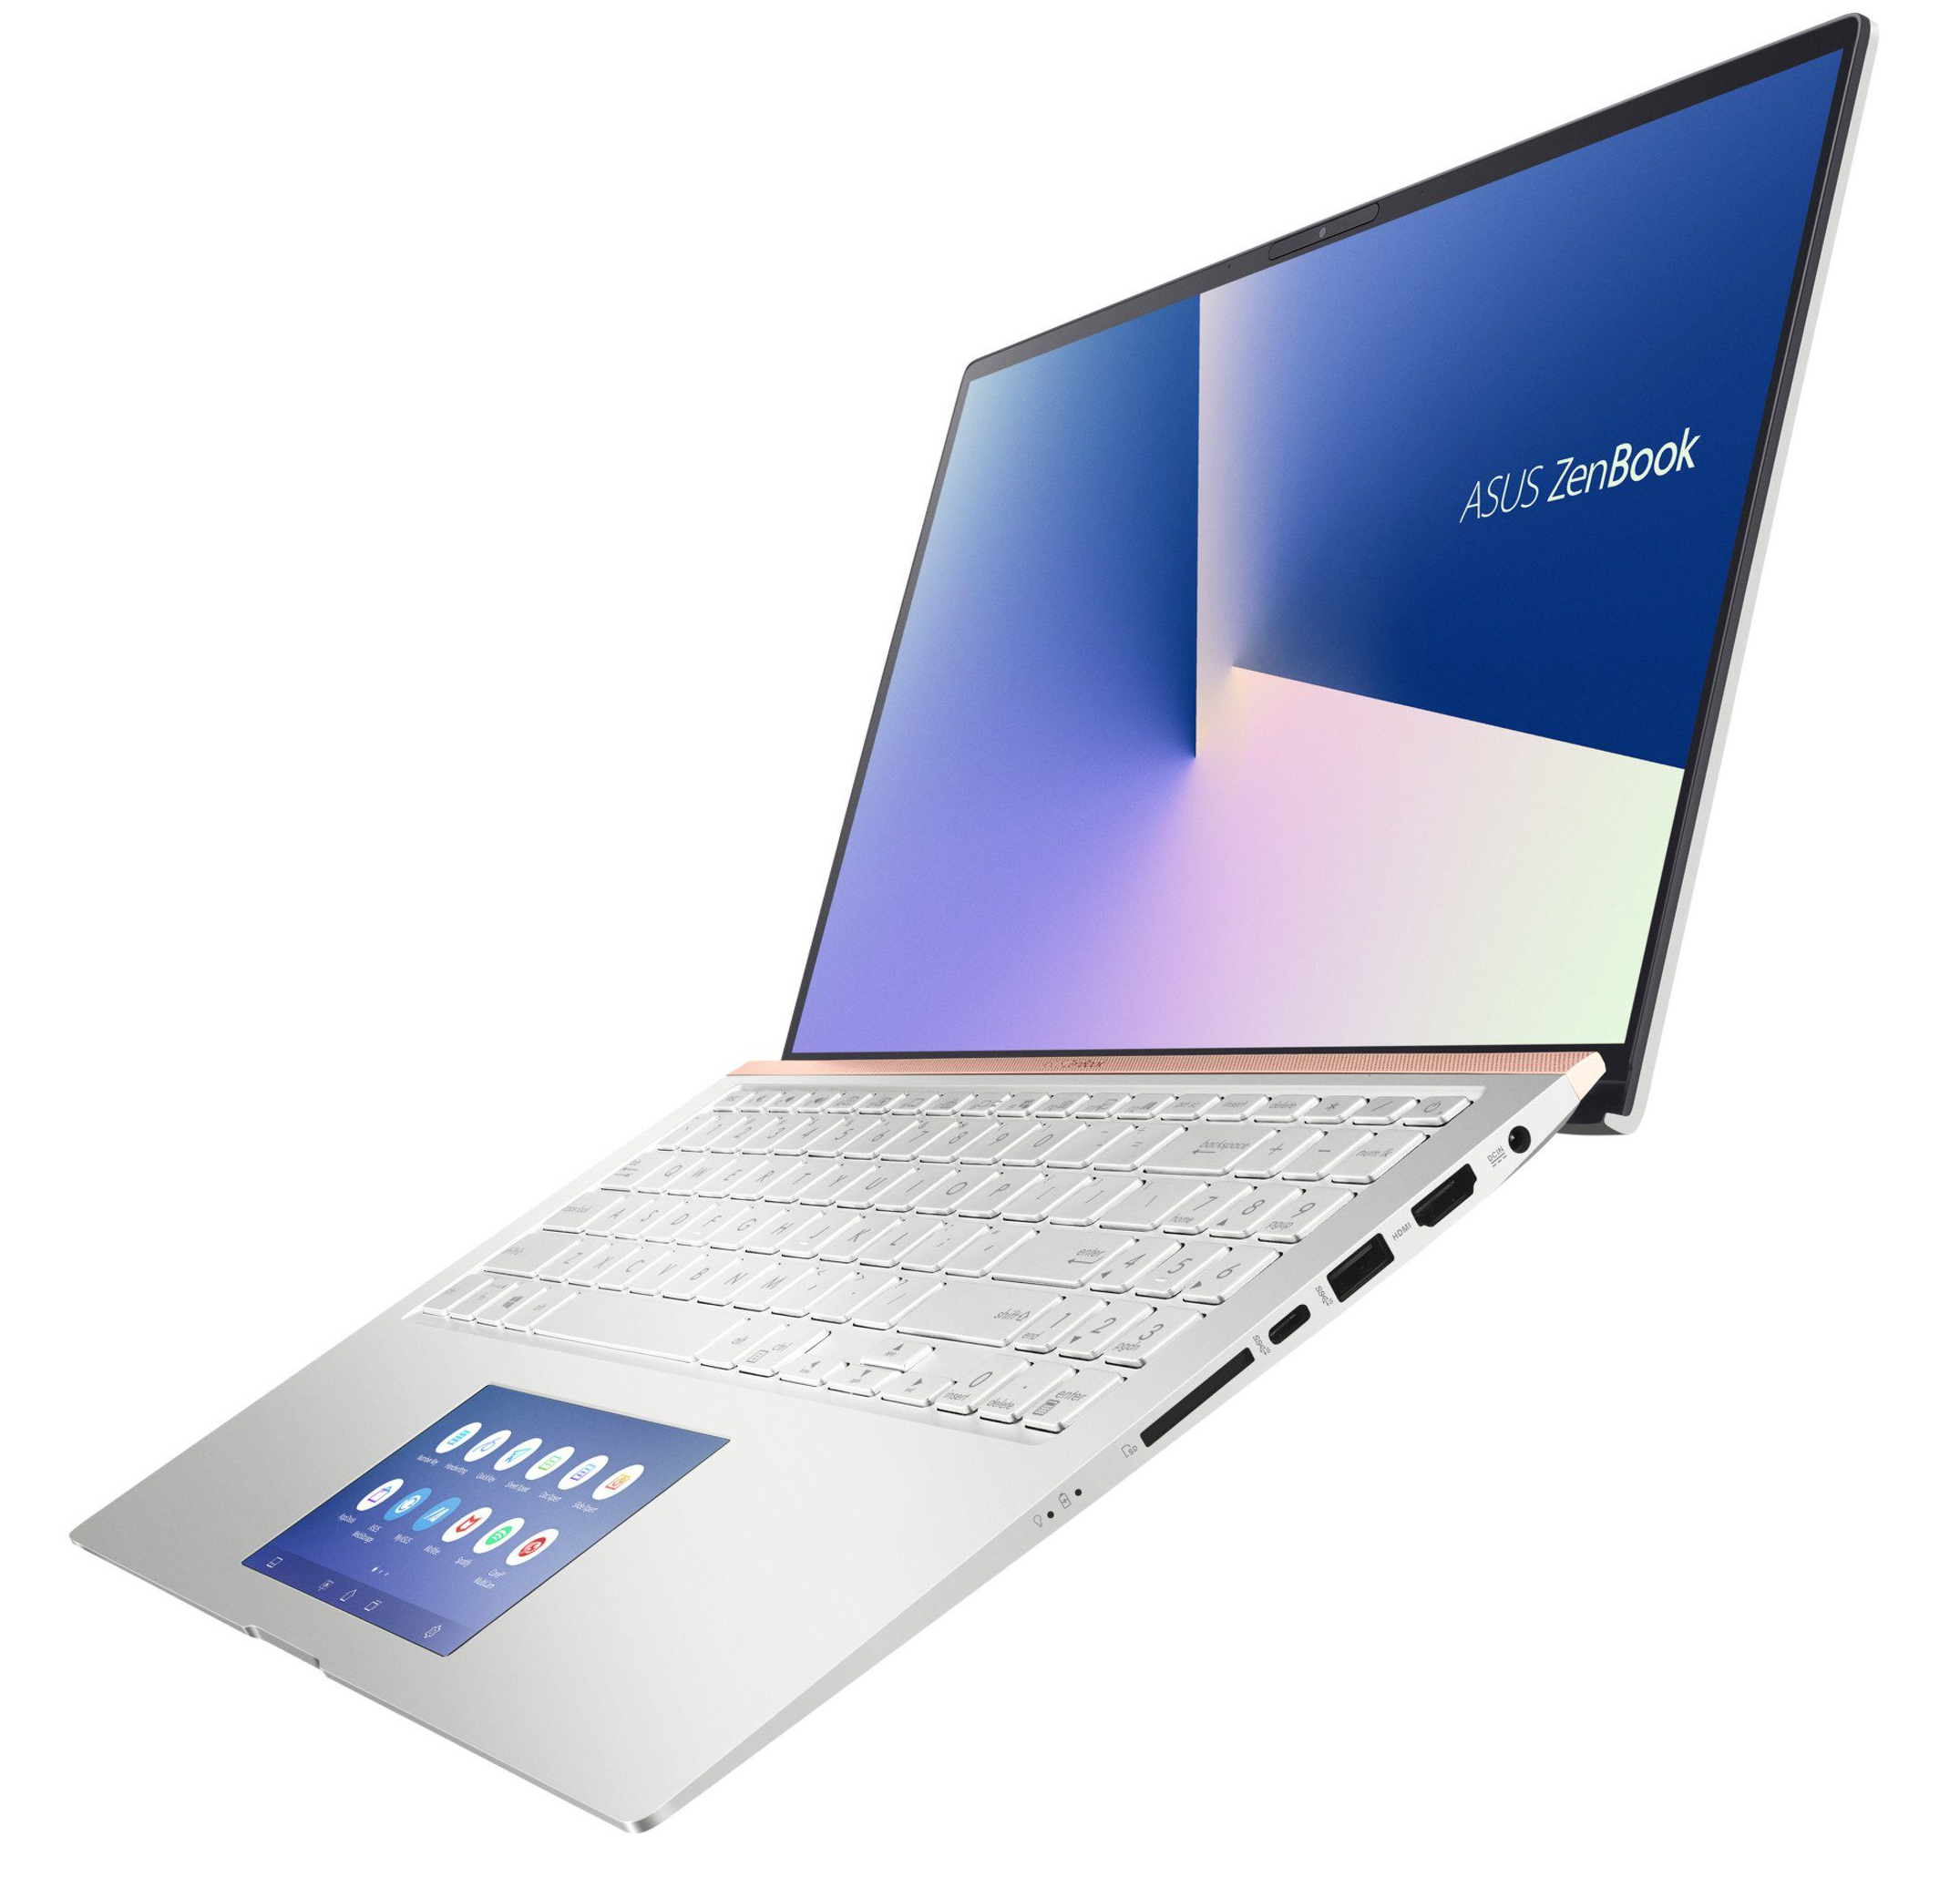
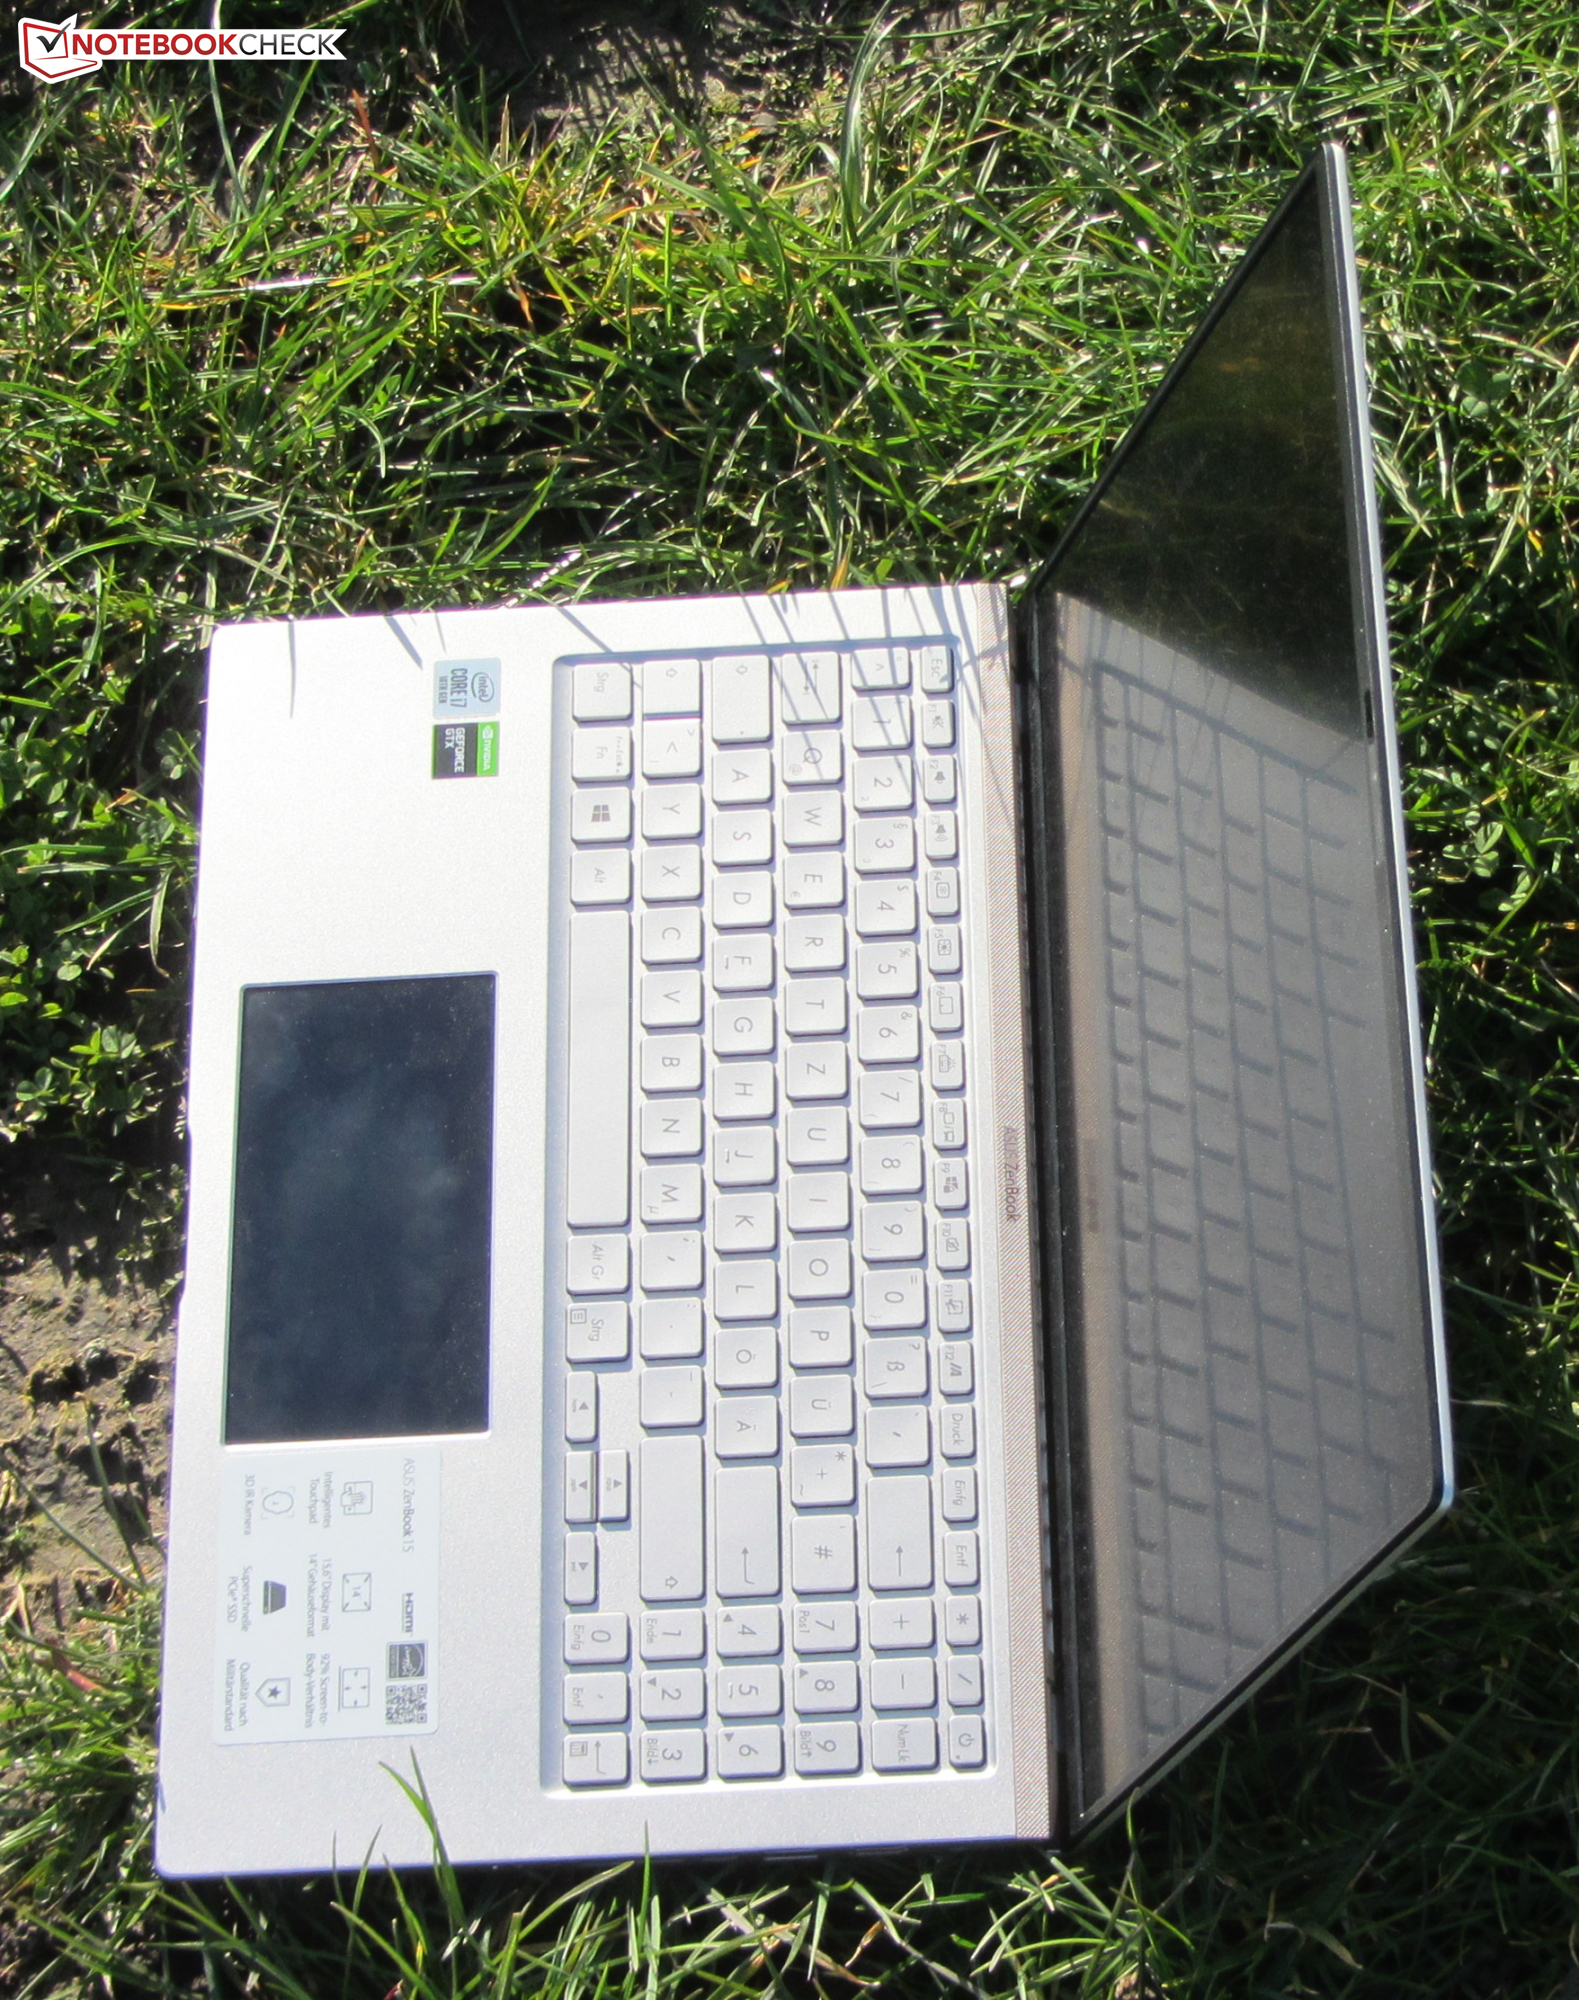
Vidare får vi ge den kritik för att den saknar en Thunderbolt 3-port. På en kompakt och mobil laptop för 16.000 kronor bör detta vara standard. En sådan anslutning hade gjort det möjligt att använda funktionsrika dockningsstationer och kraftfulla externa grafikkort. Som det ser ut nu har Asus bara utrustat ZenBook med två USB 3.2 Gen 2-portar (1x Typ A, 1x Typ C). Typ C-porten kan bara användas för tillbehör, den har inte stöd för DisplayPort genom USB Typ C.
Asus ZenBook 15 UX534FTC-A8190T
- 03/16/2020 v7 (old)
Sascha Mölck
Price comparison
