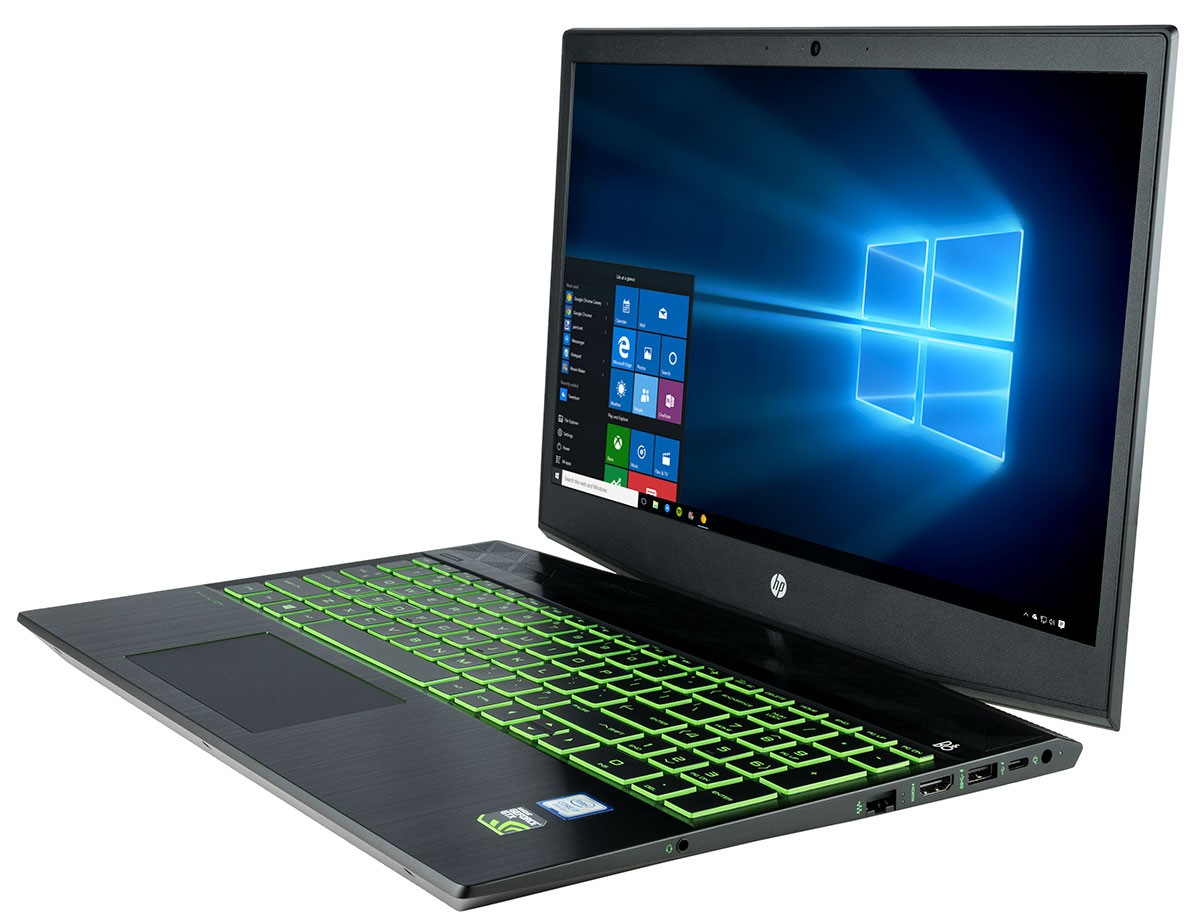
Test: HP Pavilion Gaming 15t (i7-8750H, GTX 1060 3 GB) Laptop (Sammanfattning)
| SD Card Reader | |
| average JPG Copy Test (av. of 3 runs) | |
| Genomsnitt av klass Gaming (20.9 - 210, n=55, senaste 2 åren) | |
| HP Pavilion Gaming 15t-cx0000 (Toshiba Exceria Pro SDXC 64 GB UHS-II) | |
| HP Omen 15-dc0001ng (Toshiba Exceria Pro SDXC 64 GB UHS-II) | |
| Asus FX503VM-EH73 (Toshiba Exceria Pro SDXC 64 GB UHS-II) | |
| Acer Predator Helios 300 PH317-52-51M6 (Toshiba Exceria Pro SDXC 64 GB UHS-II) | |
| MSI GV62 8RE-016US (Toshiba Exceria Pro SDXC 64 GB UHS-II) | |
| Dell G7 15-7588 (Toshiba Exceria Pro SDXC 64 GB UHS-II) | |
| maximum AS SSD Seq Read Test (1GB) | |
| Genomsnitt av klass Gaming (25.5 - 261, n=52, senaste 2 åren) | |
| HP Omen 15-dc0001ng (Toshiba Exceria Pro SDXC 64 GB UHS-II) | |
| Asus FX503VM-EH73 (Toshiba Exceria Pro SDXC 64 GB UHS-II) | |
| Acer Predator Helios 300 PH317-52-51M6 (Toshiba Exceria Pro SDXC 64 GB UHS-II) | |
| HP Pavilion Gaming 15t-cx0000 (Toshiba Exceria Pro SDXC 64 GB UHS-II) | |
| Dell G7 15-7588 (Toshiba Exceria Pro SDXC 64 GB UHS-II) | |
| MSI GV62 8RE-016US (Toshiba Exceria Pro SDXC 64 GB UHS-II) | |
| |||||||||||||||||||||||||
Distribution av ljusstyrkan: 85 %
Mitt på batteriet: 357.5 cd/m²
Kontrast: 993:1 (Svärta: 0.36 cd/m²)
ΔE ColorChecker Calman: 4.19 | ∀{0.5-29.43 Ø4.73}
calibrated: 3.2
ΔE Greyscale Calman: 3.5 | ∀{0.09-98 Ø4.97}
91% sRGB (Argyll 1.6.3 3D)
60% AdobeRGB 1998 (Argyll 1.6.3 3D)
67.1% AdobeRGB 1998 (Argyll 3D)
91.7% sRGB (Argyll 3D)
66.5% Display P3 (Argyll 3D)
Gamma: 2.324
CCT: 7028 K
| HP Pavilion Gaming 15t-cx0000 AU Optronics AUO82ED, IPS, 15.6", 1920x1080 | Dell G7 15-7588 LG Philips LGD053F, IPS, 15.6", 1920x1080 | Acer Predator Helios 300 PH317-52-51M6 LG Philips LP173WF4-SPF5 (LGD056D), IPS, 17.3", 1920x1080 | Lenovo Legion Y530-15ICH B156HAN02.1, IPS, 15.6", 1920x1080 | Asus FX503VM-EH73 AU Optronics B156HAN06.1, IPS, 15.6", 1920x1080 | HP Omen 15-dc0001ng BOE07A1, IPS, 15.6", 1920x1080 | MSI GV62 8RE-016US LG Philips LGD0590, IPS, 15.6", 1920x1080 | |
|---|---|---|---|---|---|---|---|
| Display | -41% | -4% | -40% | -42% | -38% | -38% | |
| Display P3 Coverage (%) | 66.5 | 37.82 -43% | 67.1 1% | 38.31 -42% | 37.48 -44% | 39.64 -40% | 39.58 -40% |
| sRGB Coverage (%) | 91.7 | 56.2 -39% | 86.1 -6% | 57.3 -38% | 56.3 -39% | 59 -36% | 59.5 -35% |
| AdobeRGB 1998 Coverage (%) | 67.1 | 39.2 -42% | 63 -6% | 39.58 -41% | 38.72 -42% | 40.95 -39% | 40.91 -39% |
| Response Times | -130% | -101% | -169% | -146% | -179% | -104% | |
| Response Time Grey 50% / Grey 80% * (ms) | 17.6 ? | 38.8 ? -120% | 36 ? -105% | 43.6 ? -148% | 36.8 ? -109% | 47.2 ? -168% | 33.2 ? -89% |
| Response Time Black / White * (ms) | 11.2 ? | 26.8 ? -139% | 22 ? -96% | 32.4 ? -189% | 31.6 ? -182% | 32.4 ? -189% | 24.4 ? -118% |
| PWM Frequency (Hz) | 122000 ? | 200 ? | |||||
| Screen | -61% | -20% | -34% | -34% | -14% | -35% | |
| Brightness middle (cd/m²) | 357.5 | 250.9 -30% | 365 2% | 282.8 -21% | 235.9 -34% | 275 -23% | 268.7 -25% |
| Brightness (cd/m²) | 351 | 246 -30% | 341 -3% | 264 -25% | 235 -33% | 254 -28% | 246 -30% |
| Brightness Distribution (%) | 85 | 89 5% | 89 5% | 88 4% | 91 7% | 90 6% | 82 -4% |
| Black Level * (cd/m²) | 0.36 | 0.34 6% | 0.32 11% | 0.42 -17% | 0.27 25% | 0.27 25% | 0.42 -17% |
| Contrast (:1) | 993 | 738 -26% | 1141 15% | 673 -32% | 874 -12% | 1019 3% | 640 -36% |
| Colorchecker dE 2000 * | 4.19 | 7.34 -75% | 6.51 -55% | 4.93 -18% | 4.81 -15% | 4.62 -10% | 4.79 -14% |
| Colorchecker dE 2000 max. * | 6.97 | 28.66 -311% | 12.32 -77% | 17.65 -153% | 21.55 -209% | 8.05 -15% | 18.13 -160% |
| Colorchecker dE 2000 calibrated * | 3.2 | 4.42 -38% | 2.9 9% | 4.07 -27% | 3.59 -12% | 4.31 -35% | |
| Greyscale dE 2000 * | 3.5 | 6.8 -94% | 7.65 -119% | 3.8 -9% | 3.1 11% | 4.31 -23% | 3.1 11% |
| Gamma | 2.324 95% | 2.164 102% | 2.64 83% | 2.449 90% | 2.31 95% | 2.49 88% | 2.28 96% |
| CCT | 7028 92% | 6780 96% | 8066 81% | 6112 106% | 6984 93% | 7000 93% | 7049 92% |
| Color Space (Percent of AdobeRGB 1998) (%) | 60 | 36 -40% | 56 -7% | 36 -40% | 36 -40% | 38 -37% | 38 -37% |
| Color Space (Percent of sRGB) (%) | 91 | 56 -38% | 86 -5% | 57 -37% | 56 -38% | 59 -35% | 59 -35% |
| Totalt genomsnitt (program/inställningar) | -77% /
-66% | -42% /
-27% | -81% /
-52% | -74% /
-50% | -77% /
-39% | -59% /
-44% |
* ... mindre är bättre
Visa svarstider
| ↔ Svarstid svart till vitt | ||
|---|---|---|
| 11.2 ms ... stiga ↗ och falla ↘ kombinerat | ↗ 6 ms stiga | 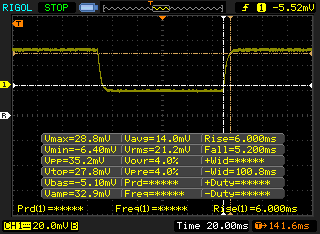 |
| ↘ 5.2 ms hösten | ||
| Skärmen visar bra svarsfrekvens i våra tester, men kan vara för långsam för konkurrenskraftiga spelare. I jämförelse sträcker sig alla testade enheter från 0.1 (minst) till 240 (maximalt) ms. » 30 % av alla enheter är bättre. Det betyder att den uppmätta svarstiden är bättre än genomsnittet av alla testade enheter (19.9 ms). | ||
| ↔ Svarstid 50 % grått till 80 % grått | ||
| 17.6 ms ... stiga ↗ och falla ↘ kombinerat | ↗ 9.2 ms stiga | 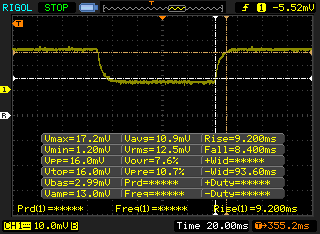 |
| ↘ 8.4 ms hösten | ||
| Skärmen visar bra svarsfrekvens i våra tester, men kan vara för långsam för konkurrenskraftiga spelare. I jämförelse sträcker sig alla testade enheter från 0.165 (minst) till 636 (maximalt) ms. » 31 % av alla enheter är bättre. Det betyder att den uppmätta svarstiden är bättre än genomsnittet av alla testade enheter (31.1 ms). | ||
Skärmflimmer / PWM (Puls-Width Modulation)
| Skärmflimmer / PWM upptäcktes inte | 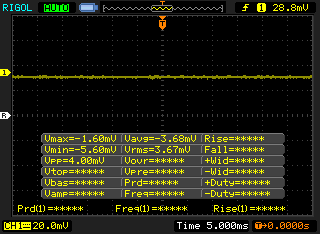 | ||
Som jämförelse: 52 % av alla testade enheter använder inte PWM för att dämpa skärmen. Om PWM upptäcktes mättes ett medelvärde av 7798 (minst: 5 - maximum: 343500) Hz. | |||
* ... mindre är bättre
| PCMark 8 Home Score Accelerated v2 | 4606 poäng | |
| PCMark 8 Work Score Accelerated v2 | 5308 poäng | |
| PCMark 10 Score | 4724 poäng | |
Hjälp | ||
| HP Pavilion Gaming 15t-cx0000 Samsung SSD PM981 MZVLB512HAJQ | Dell G7 15-7588 SK hynix SC311 SATA | Acer Predator Helios 300 PH317-52-51M6 Hynix HFS128G39TND | Lenovo Legion Y530-15ICH Toshiba KBG30ZMT128G | Asus FX503VM-EH73 SanDisk SD8SN8U128G1002 | HP Omen 15-dc0001ng Toshiba KBG30ZMV128G | MSI GV62 8RE-016US Samsung PM871b MZNLN128HAHQ | Genomsnitt Samsung SSD PM981 MZVLB512HAJQ | |
|---|---|---|---|---|---|---|---|---|
| AS SSD | -87% | -120% | -212% | -92% | -117% | -73% | -3% | |
| Copy Game MB/s (MB/s) | 223.2 | 122.6 | 1057 ? | |||||
| Copy Program MB/s (MB/s) | 126.9 | 69.2 | 454 ? | |||||
| Copy ISO MB/s (MB/s) | 460.8 | 170.5 | 1755 ? | |||||
| Score Total (Points) | 4113 | 528 -87% | 811 -80% | 838 -80% | 798 -81% | 670 -84% | 703 -83% | 3966 ? -4% |
| Score Write (Points) | 2087 | 181 -91% | 196 -91% | 128 -94% | 178 -91% | 195 -91% | 207 -90% | 1780 ? -15% |
| Score Read (Points) | 1319 | 233 -82% | 414 -69% | 497 -62% | 411 -69% | 343 -74% | 334 -75% | 1451 ? 10% |
| Access Time Write * (ms) | 0.038 | 0.068 -79% | 0.259 -582% | 0.287 -655% | 0.09 -137% | 0.227 -497% | 0.057 -50% | 0.08337 ? -119% |
| Access Time Read * (ms) | 0.051 | 0.161 -216% | 0.626 -1127% | 0.17 -233% | 0.177 -247% | 0.113 -122% | 0.05092 ? -0% | |
| 4K-64 Write (MB/s) | 1808 | 99.6 -94% | 120.1 -93% | 78.9 -96% | 95.5 -95% | 103.6 -94% | 129.4 -93% | 1504 ? -17% |
| 4K-64 Read (MB/s) | 1160 | 158.8 -86% | 336.6 -71% | 335.3 -71% | 343.4 -70% | 187.8 -84% | 257.7 -78% | 1203 ? 4% |
| 4K Write (MB/s) | 95.9 | 59.8 -38% | 62.7 -35% | 35.74 -63% | 46.48 -52% | 79.3 -17% | 63.5 -34% | 112 ? 17% |
| 4K Read (MB/s) | 35.03 | 23.66 -32% | 26.5 -24% | 38.71 11% | 20.44 -42% | 31.48 -10% | 26.23 -25% | 50.5 ? 44% |
| Seq Write (MB/s) | 1829 | 220.3 -88% | 128.2 -93% | 131.6 -93% | 328.4 -82% | 123.5 -93% | 138.1 -92% | 1637 ? -10% |
| Seq Read (MB/s) | 1235 | 506 -59% | 513 -58% | 1231 0% | 476.3 -61% | 1238 0% | 503 -59% | 1976 ? 60% |
* ... mindre är bättre

| 3DMark | |
| 1280x720 Cloud Gate Standard Graphics | |
| Genomsnitt av klass Gaming (86886 - 223650, n=61, senaste 2 åren) | |
| HP Omen 17t-3AW55AV_1 | |
| MSI GS73 Stealth 8RF-011 | |
| MSI GV62 8RE-016US | |
| Dell G7 15-7588 | |
| HP Pavilion Gaming 15t-cx0000 | |
| Genomsnitt NVIDIA GeForce GTX 1060 Max-Q (42781 - 81720, n=10) | |
| HP Omen 15-dc0001ng | |
| MSI GL63 8RC-069US | |
| HP Spectre x360 15-ch000 | |
| 1920x1080 Fire Strike Graphics | |
| Genomsnitt av klass Gaming (12242 - 62849, n=121, senaste 2 åren) | |
| HP Omen 17t-3AW55AV_1 | |
| MSI GS73 Stealth 8RF-011 | |
| MSI GV62 8RE-016US | |
| Dell G7 15-7588 | |
| Genomsnitt NVIDIA GeForce GTX 1060 Max-Q (9992 - 11366, n=10) | |
| HP Pavilion Gaming 15t-cx0000 | |
| HP Omen 15-dc0001ng | |
| HP Spectre x360 15-ch000 | |
| MSI GL63 8RC-069US | |
| 3DMark 06 Standard Score | 34189 poäng | |
| 3DMark 11 Performance | 12774 poäng | |
| 3DMark Cloud Gate Standard Score | 31926 poäng | |
| 3DMark Fire Strike Score | 9348 poäng | |
Hjälp | ||
| låg | med. | hög | ultra | |
|---|---|---|---|---|
| BioShock Infinite (2013) | 327 | 231 | 215 | 102 |
| The Witcher 3 (2015) | 50 | |||
| Rise of the Tomb Raider (2016) | 168 | 111 | 63 | 54 |
| Rocket League (2017) | 250 | 216 | 155 |
Ljudnivå
| Låg belastning |
| 32.2 / 32.4 / 32.4 dB(A) |
| Hög belastning |
| 40.2 / 47.2 dB(A) |
 | ||
30 dB tyst 40 dB(A) hörbar 50 dB(A) högt ljud |
||
min: | ||
| HP Pavilion Gaming 15t-cx0000 GeForce GTX 1060 Max-Q, i7-8750H, Samsung SSD PM981 MZVLB512HAJQ | Dell G7 15-7588 GeForce GTX 1060 Max-Q, i7-8750H, SK hynix SC311 SATA | Acer Predator Helios 300 PH317-52-51M6 GeForce GTX 1050 Ti Mobile, i5-8300H, Hynix HFS128G39TND | Lenovo Legion Y530-15ICH GeForce GTX 1050 Ti Mobile, i5-8300H, Toshiba KBG30ZMT128G | Asus FX503VM-EH73 GeForce GTX 1060 Mobile, i7-7700HQ, SanDisk SD8SN8U128G1002 | HP Omen 15-dc0001ng GeForce GTX 1050 Ti Mobile, i5-8300H, Toshiba KBG30ZMV128G | MSI GV62 8RE-016US GeForce GTX 1060 Mobile, i5-8300H, Samsung PM871b MZNLN128HAHQ | |
|---|---|---|---|---|---|---|---|
| Noise | 2% | -1% | 8% | 1% | -5% | -6% | |
| av / miljö * (dB) | 28.3 | 28.1 1% | 29 -2% | 28 1% | 27.8 2% | 29 -2% | 28.2 -0% |
| Idle Minimum * (dB) | 32.2 | 29 10% | 29 10% | 28 13% | 29.6 8% | 29 10% | 33.5 -4% |
| Idle Average * (dB) | 32.4 | 29 10% | 31 4% | 28 14% | 29.6 9% | 33 -2% | 33.5 -3% |
| Idle Maximum * (dB) | 32.4 | 29.2 10% | 33 -2% | 28.5 12% | 29.6 9% | 41 -27% | 33.7 -4% |
| Load Average * (dB) | 40.2 | 40.6 -1% | 45 -12% | 34.9 13% | 37.3 7% | 44 -9% | 41 -2% |
| Witcher 3 ultra * (dB) | 45 | 49.8 -11% | 45 -0% | 40 11% | 49.8 -11% | 47 -4% | 52.3 -16% |
| Load Maximum * (dB) | 47.2 | 49.8 -6% | 51 -8% | 49.6 -5% | 53.7 -14% | 49 -4% | 52.3 -11% |
* ... mindre är bättre
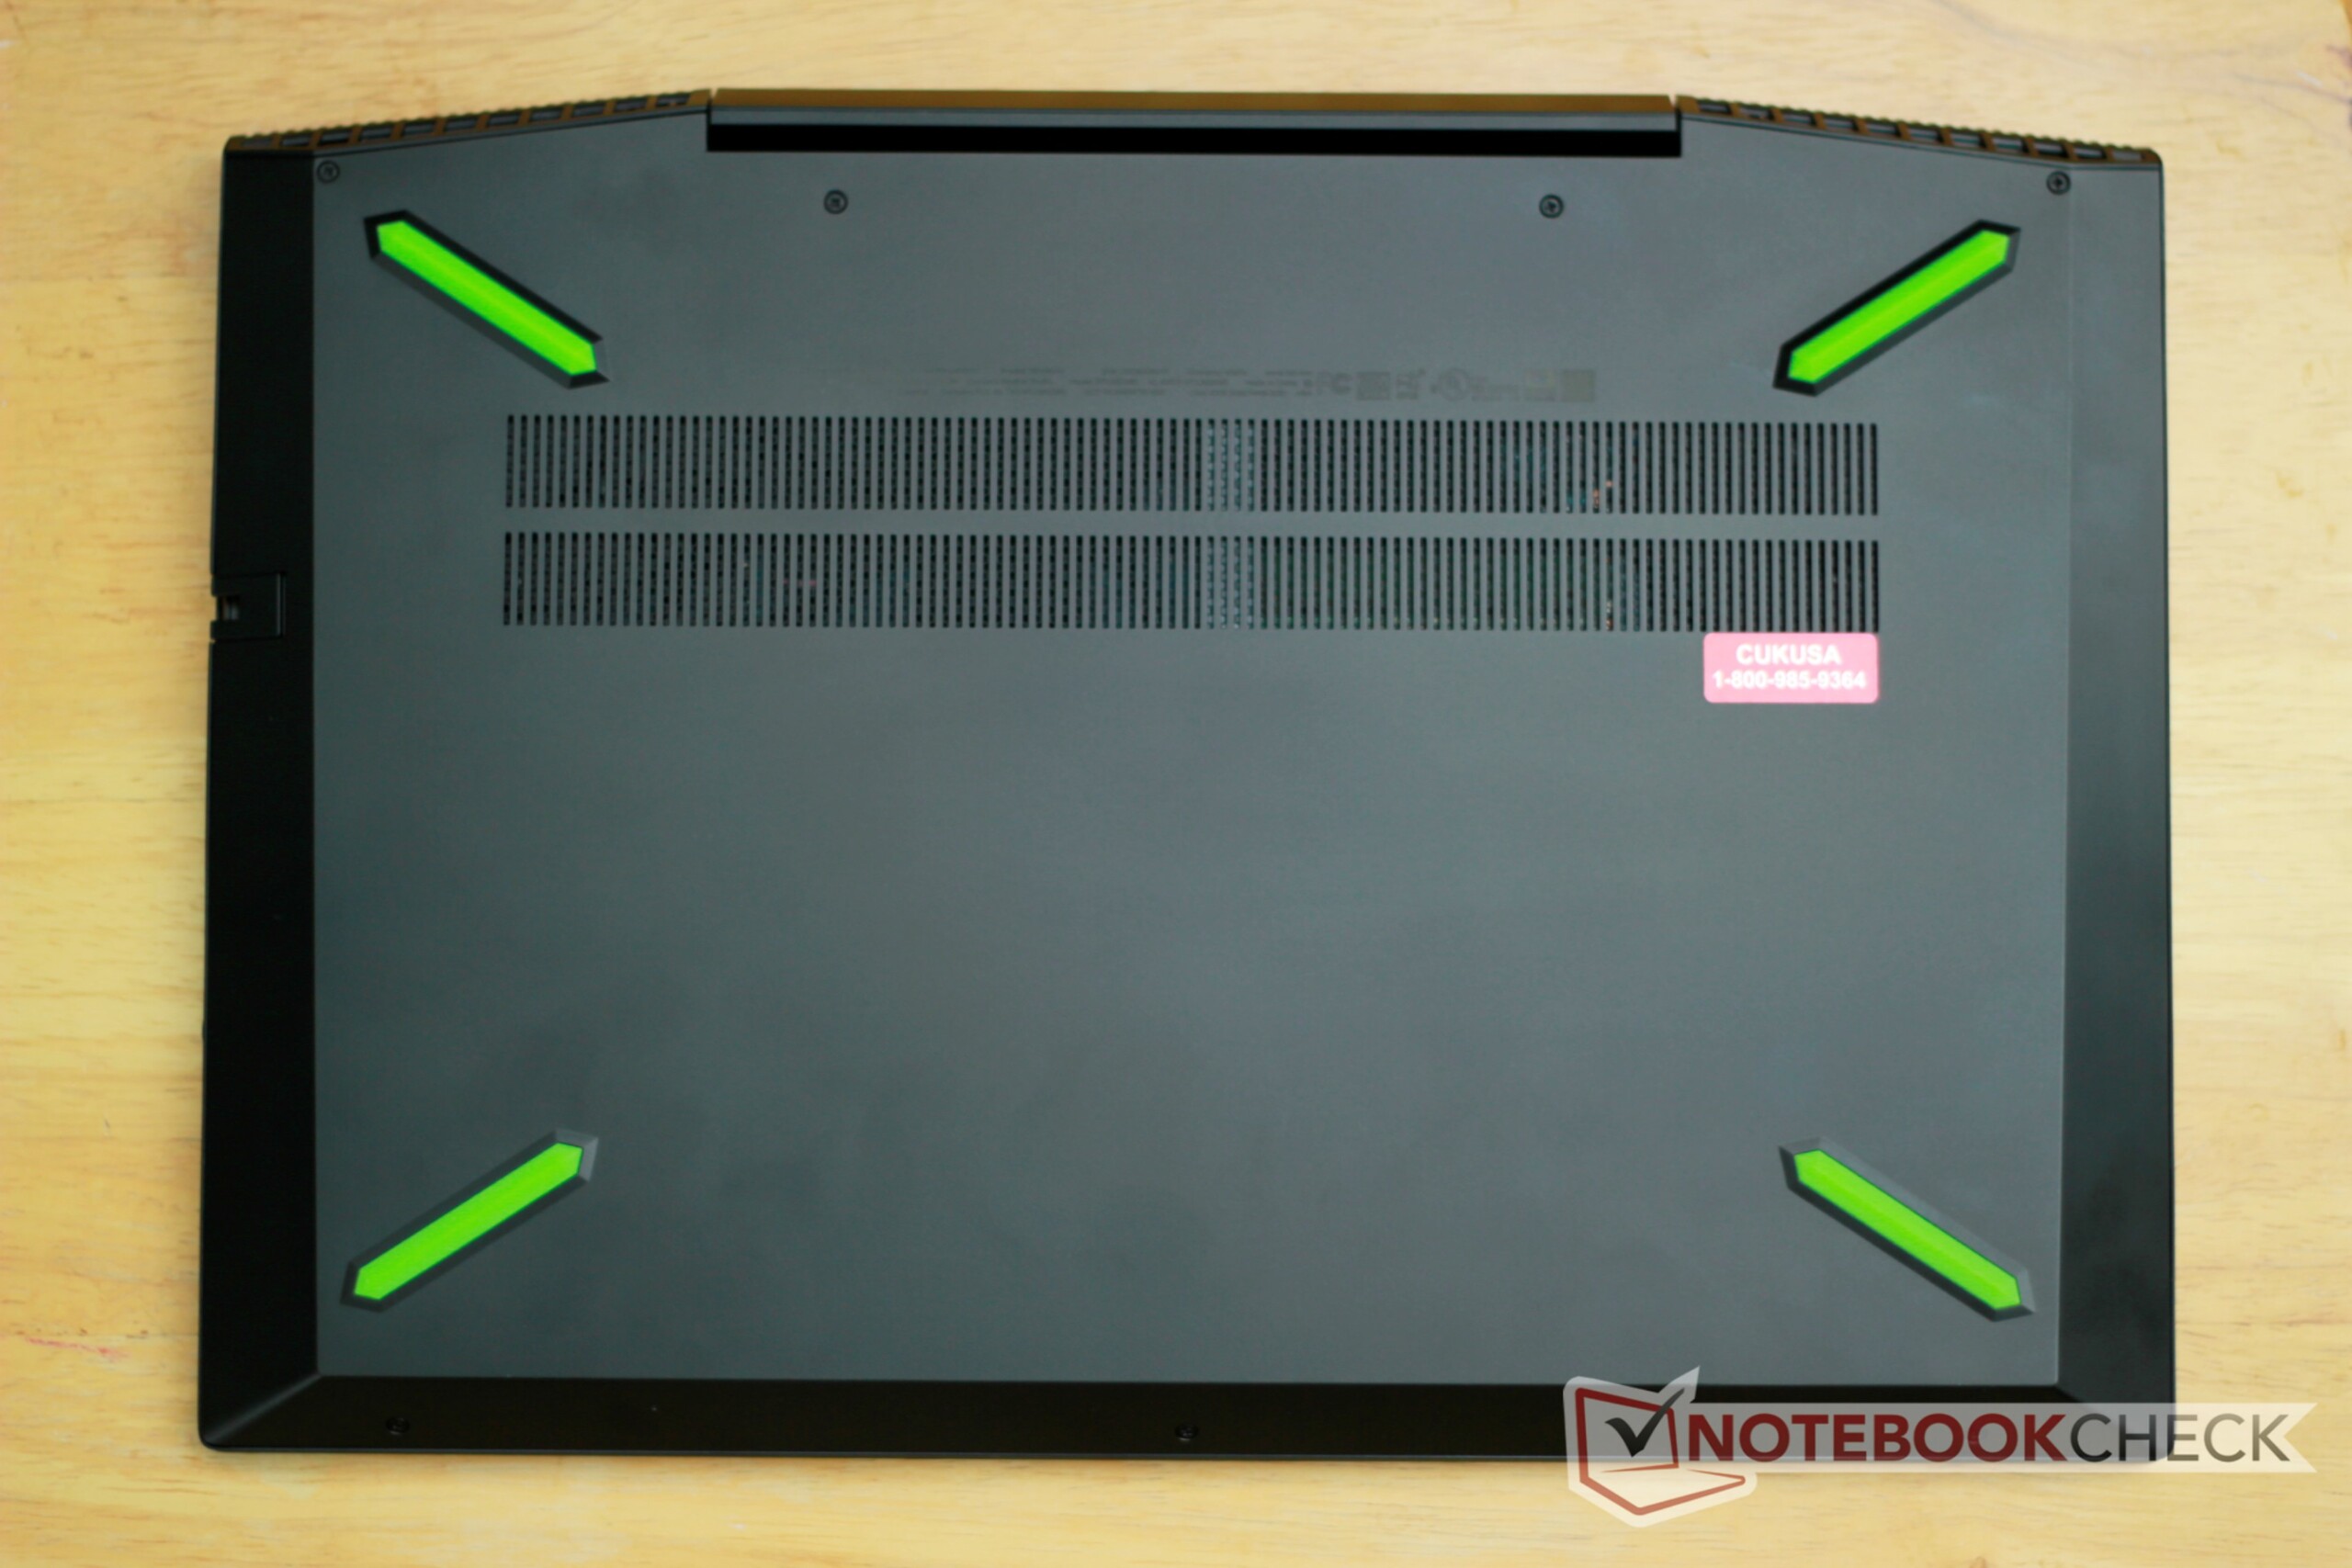
(-) Den maximala temperaturen på ovansidan är 46 °C / 115 F, jämfört med genomsnittet av 40.4 °C / 105 F , allt från 21.2 till 68.8 °C för klassen Gaming.
(-) Botten värms upp till maximalt 52 °C / 126 F, jämfört med genomsnittet av 43.2 °C / 110 F
(+) Vid tomgångsbruk är medeltemperaturen för ovansidan 28.1 °C / 83 F, jämfört med enhetsgenomsnittet på 33.9 °C / ### class_avg_f### F.
(-) När du spelar The Witcher 3 är medeltemperaturen för ovansidan 38.1 °C / 101 F, jämfört med enhetsgenomsnittet på 33.9 °C / ## #class_avg_f### F.
(+) Handledsstöden och pekplattan når maximal hudtemperatur (32.4 °C / 90.3 F) och är därför inte varma.
(-) Medeltemperaturen för handledsstödsområdet på liknande enheter var 28.8 °C / 83.8 F (-3.6 °C / -6.5 F).
HP Pavilion Gaming 15t-cx0000 ljudanalys
(-) | inte särskilt höga högtalare (69.7 dB)
Bas 100 - 315 Hz
(-) | nästan ingen bas - i genomsnitt 17.8% lägre än medianen
(±) | linjäriteten för basen är genomsnittlig (14.1% delta till föregående frekvens)
Mellan 400 - 2000 Hz
(+) | balanserad mellan - endast 3.3% från medianen
(+) | mids är linjära (6.4% delta till föregående frekvens)
Högsta 2 - 16 kHz
(+) | balanserade toppar - endast 2.1% från medianen
(+) | toppar är linjära (6% delta till föregående frekvens)
Totalt 100 - 16 000 Hz
(±) | linjäriteten för det totala ljudet är genomsnittlig (22% skillnad mot median)
Jämfört med samma klass
» 79% av alla testade enheter i den här klassen var bättre, 6% liknande, 15% sämre
» Den bästa hade ett delta på 6%, genomsnittet var 18%, sämst var 132%
Jämfört med alla testade enheter
» 63% av alla testade enheter var bättre, 6% liknande, 30% sämre
» Den bästa hade ett delta på 4%, genomsnittet var 24%, sämst var 134%
Dell G7 15-7588 ljudanalys
(±) | högtalarljudstyrkan är genomsnittlig men bra (74.8 dB)
Bas 100 - 315 Hz
(-) | nästan ingen bas - i genomsnitt 16.7% lägre än medianen
(±) | linjäriteten för basen är genomsnittlig (11.8% delta till föregående frekvens)
Mellan 400 - 2000 Hz
(+) | balanserad mellan - endast 4.6% från medianen
(±) | linjäriteten för mids är genomsnittlig (7.1% delta till föregående frekvens)
Högsta 2 - 16 kHz
(+) | balanserade toppar - endast 4.8% från medianen
(±) | linjäriteten för toppar är genomsnittlig (10.7% delta till föregående frekvens)
Totalt 100 - 16 000 Hz
(±) | linjäriteten för det totala ljudet är genomsnittlig (21.1% skillnad mot median)
Jämfört med samma klass
» 76% av alla testade enheter i den här klassen var bättre, 4% liknande, 20% sämre
» Den bästa hade ett delta på 6%, genomsnittet var 18%, sämst var 132%
Jämfört med alla testade enheter
» 58% av alla testade enheter var bättre, 7% liknande, 35% sämre
» Den bästa hade ett delta på 4%, genomsnittet var 24%, sämst var 134%
| Av/Standby | |
| Låg belastning | |
| Hög belastning |
|
Förklaring:
min: | |
| HP Pavilion Gaming 15t-cx0000 i7-8750H, GeForce GTX 1060 Max-Q, Samsung SSD PM981 MZVLB512HAJQ, IPS, 1920x1080, 15.6" | Dell G7 15-7588 i7-8750H, GeForce GTX 1060 Max-Q, SK hynix SC311 SATA, IPS, 1920x1080, 15.6" | Acer Predator Helios 300 PH317-52-51M6 i5-8300H, GeForce GTX 1050 Ti Mobile, Hynix HFS128G39TND, IPS, 1920x1080, 17.3" | Lenovo Legion Y530-15ICH i5-8300H, GeForce GTX 1050 Ti Mobile, Toshiba KBG30ZMT128G, IPS, 1920x1080, 15.6" | Asus FX503VM-EH73 i7-7700HQ, GeForce GTX 1060 Mobile, SanDisk SD8SN8U128G1002, IPS, 1920x1080, 15.6" | HP Omen 15-dc0001ng i5-8300H, GeForce GTX 1050 Ti Mobile, Toshiba KBG30ZMV128G, IPS, 1920x1080, 15.6" | MSI GV62 8RE-016US i5-8300H, GeForce GTX 1060 Mobile, Samsung PM871b MZNLN128HAHQ, IPS, 1920x1080, 15.6" | |
|---|---|---|---|---|---|---|---|
| Power Consumption | 6% | 3% | 5% | -28% | -28% | -32% | |
| Idle Minimum * (Watt) | 6 | 5.5 8% | 6 -0% | 4.5 25% | 12.8 -113% | 12 -100% | 9.38 -56% |
| Idle Average * (Watt) | 11.2 | 7.6 32% | 9 20% | 10 11% | 15.4 -38% | 14 -25% | 15.95 -42% |
| Idle Maximum * (Watt) | 13.3 | 9 32% | 13 2% | 13.8 -4% | 15.9 -20% | 18 -35% | 18.46 -39% |
| Load Average * (Watt) | 89.2 | 94 -5% | 95 -7% | 92.5 -4% | 78 13% | 92 -3% | 95.68 -7% |
| Witcher 3 ultra * (Watt) | 101.9 | 116.3 -14% | 102 -0% | 108.1 -6% | 107.3 -5% | 100 2% | 135.6 -33% |
| Load Maximum * (Watt) | 134.5 | 154.4 -15% | 134 -0% | 123.2 8% | 143.4 -7% | 142 -6% | 156.98 -17% |
* ... mindre är bättre
| HP Pavilion Gaming 15t-cx0000 i7-8750H, GeForce GTX 1060 Max-Q, 70 Wh | Dell G7 15-7588 i7-8750H, GeForce GTX 1060 Max-Q, 56 Wh | Acer Predator Helios 300 PH317-52-51M6 i5-8300H, GeForce GTX 1050 Ti Mobile, 48 Wh | Lenovo Legion Y530-15ICH i5-8300H, GeForce GTX 1050 Ti Mobile, 52.5 Wh | Asus FX503VM-EH73 i7-7700HQ, GeForce GTX 1060 Mobile, 64 Wh | HP Omen 15-dc0001ng i5-8300H, GeForce GTX 1050 Ti Mobile, 70 Wh | MSI GV62 8RE-016US i5-8300H, GeForce GTX 1060 Mobile, 41 Wh | |
|---|---|---|---|---|---|---|---|
| Batteridrifttid | 31% | 16% | -35% | -29% | 27% | -45% | |
| Reader / Idle (h) | 8 | 10.9 36% | 11.8 48% | 5.7 -29% | 10.4 30% | 5.3 -34% | |
| WiFi v1.3 (h) | 6.3 | 7.5 19% | 5.9 -6% | 4.1 -35% | 4.6 -27% | 8.6 37% | 3.5 -44% |
| Load (h) | 1.6 | 2.2 38% | 1.7 6% | 1.1 -31% | 1.8 13% | 0.7 -56% |
För
Emot

Läs den fullständiga versionen av den här recensionen på engelska här.
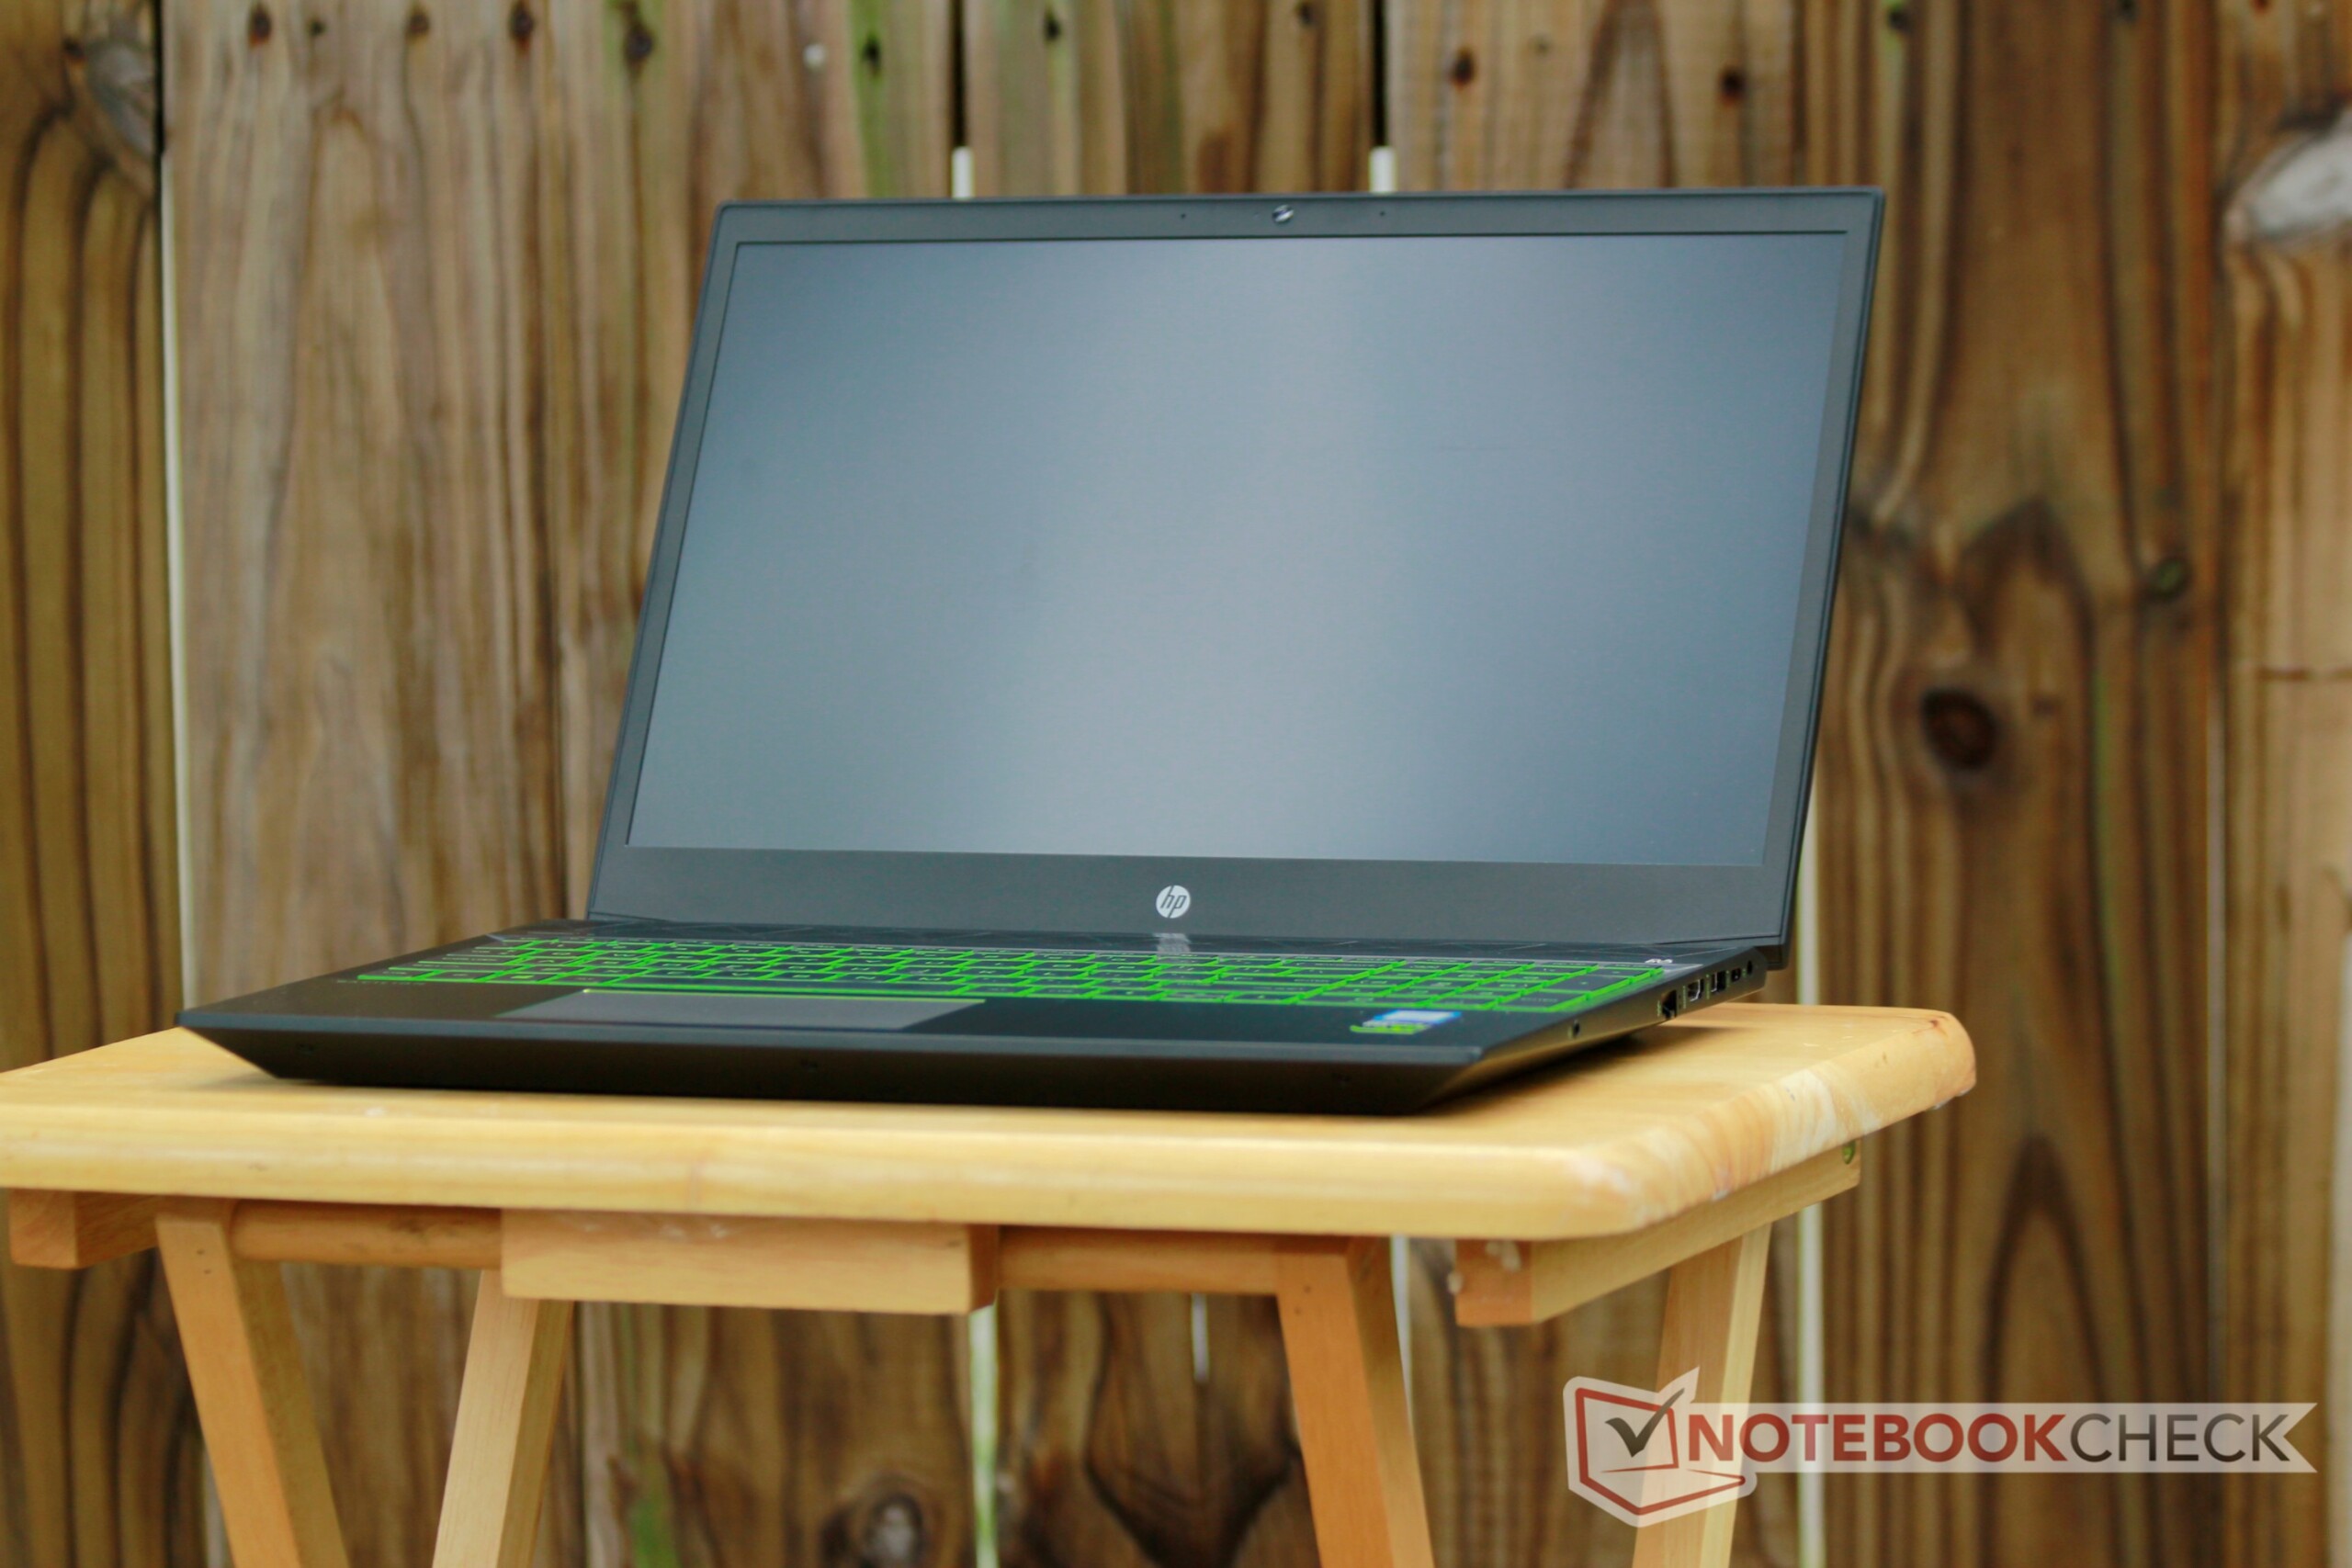
HP Pavilion Gaming 15t är en blandad kompott. Även om den lyckas med att ta en del trevliga funktioner till de bärbara speldatorernas mittenskikt så misslyckas den på andra sätt. Som exempel är ett alternativ för 144 Hz-skärm i princip unikt i det här prisskiktet vilket ger Pavilion Gaming 15t en rejäl fördel gentemot sina rivaler. Å andra sidan arbetar svag CPU-prestanda och värmestrypning mot denna laptop.
Pavilion Gaming 15t är i princip en budgetversion av HP Omen 15. Pavilion delar en del funktioner med Omen-serien, precis som 144 Hz-skärmen, och gör dem tillgängliga på en lägre prisnivå. Omen 15t har bättre konstruktionskvalitet och lyxigare komponenter, men den kostar också mer.
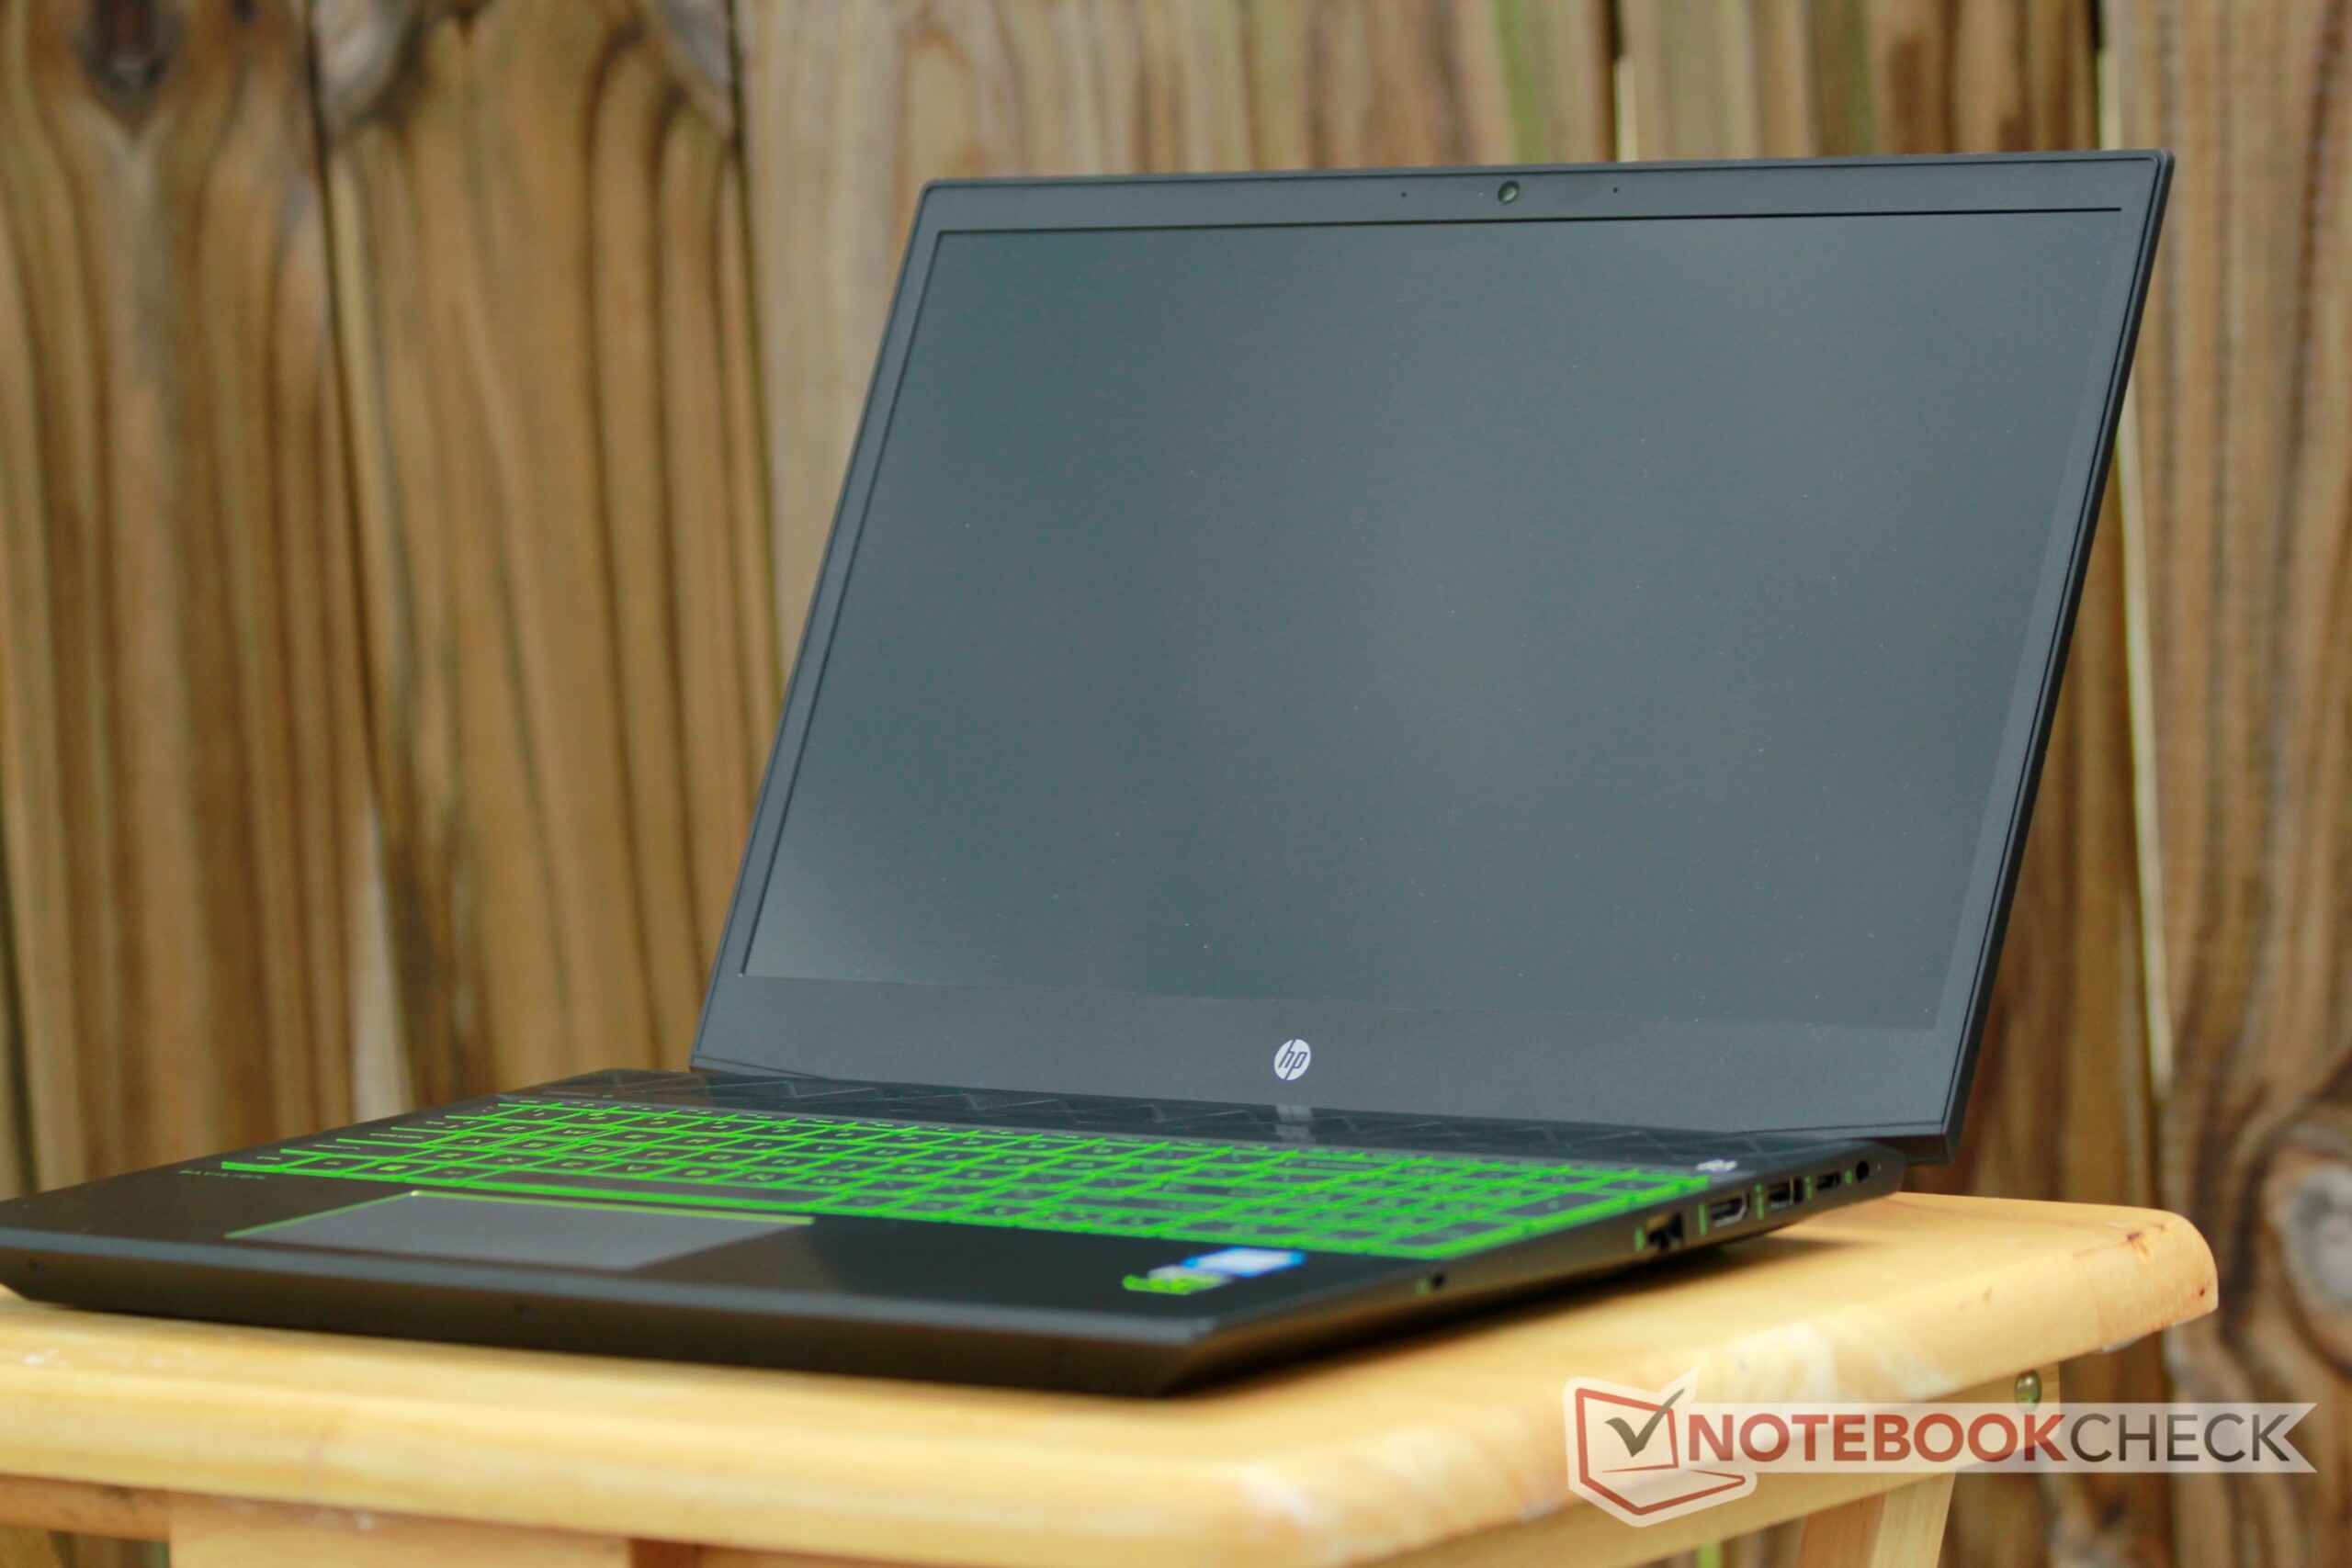
Utöver HP:s interna konkurrenter finns det två hinder i vägen för Pavilion Gaming 15t: Dell och Lenovo. Dell G7 och Lenovos Legion Y530 är båda utmärkta mittenskikts-laptops som erbjuder liknande prestanda till liknande priser. G7 har allt som Pavilion erbjuder tillsammans med bättre konstruktionskvalitet, längre batteritid, högre prestanda samt bättre värmehantering. Den stora fördelen med Pavilion Gaming 15t är dess höga bilduppdateringsfrekvens. Pavilion Gaming 15t är dessutom kompaktare och lättare än G7, vilket kan tilltala gamers på resande fot.
För att summera: HP har konstruerat en konkurrenskraftig laptop som misslyckas på en del nyckelområden men som ändå är en kompetent spelmaskin. Om du vill ha en budget-spelmaskin så finns det bättre alternativ på marknaden. Men om 144 Hz tilltalar dig kan det vara värt att lägga 1.000 - 2.000 kronor extra på Pavilion Gaming 15t.
HP Pavilion Gaming 15t-cx0000
- 09/15/2018 v6 (old)
Sam Medley
Price comparison
