Test: Dell Inspiron 15 5000 5585 - Ett utmärkt alternativ till Intel
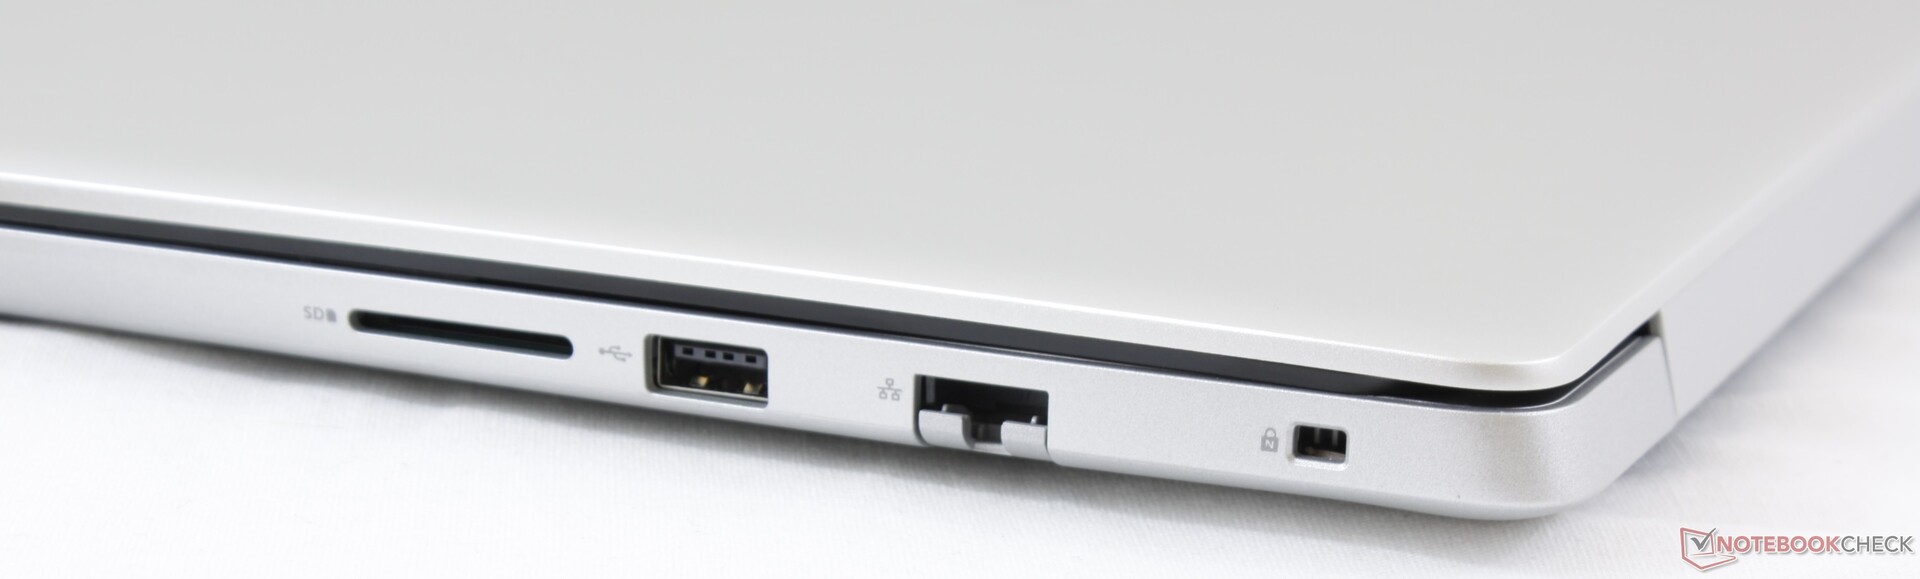
| SD Card Reader | |
| average JPG Copy Test (av. of 3 runs) | |
| Dell XPS 15 9570 Core i9 UHD (Toshiba Exceria Pro SDXC 64 GB UHS-II) | |
| Lenovo Ideapad 330S-15ARR-81FB00C7GE (Toshiba Exceria Pro SDXC 64 GB UHS-II) | |
| Dell Inspiron 15 5000 5585 (Toshiba Exceria Pro SDXC 64 GB UHS-II) | |
| Dell Inspiron 15 3585 (2300U, Vega 6) (Toshiba Exceria Pro SDXC 64 GB UHS-II) | |
| Dell Inspiron 15 5000 5584 (Toshiba Exceria Pro SDXC 64 GB UHS-II) | |
| maximum AS SSD Seq Read Test (1GB) | |
| Dell XPS 15 9570 Core i9 UHD (Toshiba Exceria Pro SDXC 64 GB UHS-II) | |
| Lenovo Ideapad 330S-15ARR-81FB00C7GE (Toshiba Exceria Pro SDXC 64 GB UHS-II) | |
| Dell Inspiron 15 5000 5585 (Toshiba Exceria Pro SDXC 64 GB UHS-II) | |
| Dell Inspiron 15 3585 (2300U, Vega 6) (Toshiba Exceria Pro SDXC 64 GB UHS-II) | |
| Dell Inspiron 15 5000 5584 (Toshiba Exceria Pro SDXC 64 GB UHS-II) | |
| |||||||||||||||||||||||||
Distribution av ljusstyrkan: 84 %
Mitt på batteriet: 179.5 cd/m²
Kontrast: 939:1 (Svärta: 0.27 cd/m²)
ΔE ColorChecker Calman: 6.05 | ∀{0.5-29.43 Ø4.71}
calibrated: 4.97
ΔE Greyscale Calman: 3.2 | ∀{0.09-98 Ø4.96}
55.6% sRGB (Argyll 1.6.3 3D)
35.5% AdobeRGB 1998 (Argyll 1.6.3 3D)
38.55% AdobeRGB 1998 (Argyll 3D)
56.2% sRGB (Argyll 3D)
37.31% Display P3 (Argyll 3D)
Gamma: 2
CCT: 6820 K
| Dell Inspiron 15 5000 5585 LG Philips 156WFC, IPS, 15.6", 1920x1080 | Dell Inspiron 15 3585 (2300U, Vega 6) BOE0802, TN, 15.6", 1920x1080 | Dell Inspiron 15 5000 5584 AU Optronics AUO22ED, B156HAK, IPS, 15.6", 1920x1080 | Dell XPS 15 9570 Core i9 UHD LQ156D1, IPS, 15.6", 3840x2160 | Asus VivoBook S15 S532F LG Philips LP156WFC-SPD1, IPS, 15.6", 1920x1080 | Lenovo Ideapad 330S-15ARR-81FB00C7GE LG Philips LP156WFC-SPD1, IPS, 15.6", 1920x1080 | |
|---|---|---|---|---|---|---|
| Display | 5% | 5% | 98% | -1% | 2% | |
| Display P3 Coverage (%) | 37.31 | 39.22 5% | 39.17 5% | 79.6 113% | 37.12 -1% | 38.1 2% |
| sRGB Coverage (%) | 56.2 | 58.9 5% | 58.8 5% | 98.4 75% | 55.9 -1% | 57.2 2% |
| AdobeRGB 1998 Coverage (%) | 38.55 | 40.52 5% | 40.48 5% | 79.7 107% | 38.35 -1% | 39.4 2% |
| Response Times | 10% | -40% | -51% | 13% | -4% | |
| Response Time Grey 50% / Grey 80% * (ms) | 28.4 ? | 39 ? -37% | 48.8 ? -72% | 52.4 ? -85% | 24.8 ? 13% | 34 ? -20% |
| Response Time Black / White * (ms) | 27.2 ? | 12 ? 56% | 29.2 ? -7% | 31.6 ? -16% | 24 ? 12% | 24 ? 12% |
| PWM Frequency (Hz) | 250 ? | 1000 ? | ||||
| Screen | -48% | -8% | 22% | -7% | -2% | |
| Brightness middle (cd/m²) | 253.6 | 225 -11% | 227 -10% | 451.9 78% | 262.3 3% | 265 4% |
| Brightness (cd/m²) | 227 | 213 -6% | 230 1% | 414 82% | 250 10% | 242 7% |
| Brightness Distribution (%) | 84 | 88 5% | 92 10% | 81 -4% | 89 6% | 74 -12% |
| Black Level * (cd/m²) | 0.27 | 0.535 -98% | 0.21 22% | 0.36 -33% | 0.43 -59% | 0.215 20% |
| Contrast (:1) | 939 | 421 -55% | 1081 15% | 1255 34% | 610 -35% | 1233 31% |
| Colorchecker dE 2000 * | 6.05 | 10.37 -71% | 6.55 -8% | 5.62 7% | 5.81 4% | 6.16 -2% |
| Colorchecker dE 2000 max. * | 14.03 | 19.75 -41% | 23.45 -67% | 19.1 -36% | 14.7 -5% | 18 -28% |
| Colorchecker dE 2000 calibrated * | 4.97 | 3.89 22% | 4.61 7% | 2.69 46% | 5.36 -8% | 6.18 -24% |
| Greyscale dE 2000 * | 3.2 | 12.09 -278% | 5.2 -63% | 6.9 -116% | 2.8 13% | 3.79 -18% |
| Gamma | 2 110% | 2.72 81% | 2.66 83% | 2.2 100% | 2.15 102% | 2.34 94% |
| CCT | 6820 95% | 13335 49% | 6434 101% | 6254 104% | 7016 93% | 7258 90% |
| Color Space (Percent of AdobeRGB 1998) (%) | 35.5 | 37 4% | 37 4% | 71.8 102% | 35.2 -1% | 36 1% |
| Color Space (Percent of sRGB) (%) | 55.6 | 59 6% | 58.2 5% | 98.5 77% | 55.6 0% | 57 3% |
| Totalt genomsnitt (program/inställningar) | -11% /
-31% | -14% /
-9% | 23% /
27% | 2% /
-3% | -1% /
-1% |
* ... mindre är bättre
Visa svarstider
| ↔ Svarstid svart till vitt | ||
|---|---|---|
| 27.2 ms ... stiga ↗ och falla ↘ kombinerat | ↗ 16.4 ms stiga | 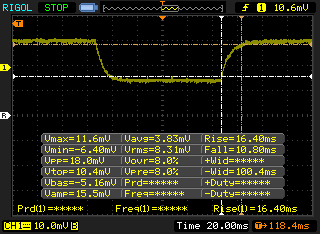 |
| ↘ 10.8 ms hösten | ||
| Skärmen visar relativt långsamma svarsfrekvenser i våra tester och kan vara för långsam för spelare. I jämförelse sträcker sig alla testade enheter från 0.1 (minst) till 240 (maximalt) ms. » 69 % av alla enheter är bättre. Detta innebär att den uppmätta svarstiden är sämre än genomsnittet av alla testade enheter (19.8 ms). | ||
| ↔ Svarstid 50 % grått till 80 % grått | ||
| 28.4 ms ... stiga ↗ och falla ↘ kombinerat | ↗ 10.4 ms stiga | 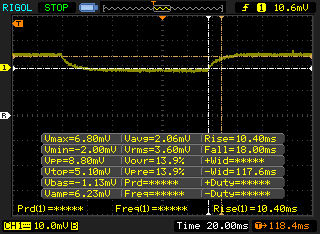 |
| ↘ 18 ms hösten | ||
| Skärmen visar relativt långsamma svarsfrekvenser i våra tester och kan vara för långsam för spelare. I jämförelse sträcker sig alla testade enheter från 0.165 (minst) till 636 (maximalt) ms. » 38 % av alla enheter är bättre. Det betyder att den uppmätta svarstiden liknar genomsnittet av alla testade enheter (30.9 ms). | ||
Skärmflimmer / PWM (Puls-Width Modulation)
| Skärmflimmer / PWM upptäcktes inte | 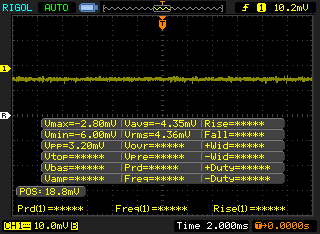 | ||
Som jämförelse: 52 % av alla testade enheter använder inte PWM för att dämpa skärmen. Om PWM upptäcktes mättes ett medelvärde av 7741 (minst: 5 - maximum: 343500) Hz. | |||
| Cinebench R15 | |
| CPU Single 64Bit | |
| Dell XPS 15 9570 Core i9 UHD | |
| HP Omen 15-dc1020ng | |
| Dell Inspiron 15 5000 5584 | |
| Lenovo IdeaPad 330-17IKB 81DM | |
| Dell Latitude 14 5495 | |
| Dell Latitude 13 3390 | |
| Lenovo ThinkPad E495-20NE000JGE | |
| Genomsnitt AMD Ryzen 7 3700U (127 - 146, n=7) | |
| Lenovo Ideapad 330S-15ARR-81FB00C7GE | |
| Dell Inspiron 15 5000 5585 | |
| Dell Inspiron 15 3585 (2300U, Vega 6) | |
| CPU Multi 64Bit | |
| Dell XPS 15 9570 Core i9 UHD | |
| HP Omen 15-dc1020ng | |
| Dell Inspiron 15 5000 5585 | |
| Dell Latitude 14 5495 | |
| Lenovo ThinkPad E495-20NE000JGE | |
| Genomsnitt AMD Ryzen 7 3700U (537 - 683, n=7) | |
| Lenovo Ideapad 330S-15ARR-81FB00C7GE | |
| Dell Inspiron 15 5000 5584 | |
| Dell Latitude 13 3390 | |
| Lenovo IdeaPad 330-17IKB 81DM | |
| Dell Inspiron 15 3585 (2300U, Vega 6) | |
| Cinebench R10 | |
| Rendering Multiple CPUs 32Bit | |
| HP Omen 15-dc1020ng | |
| Lenovo Ideapad 330S-15ARR-81FB00C7GE | |
| Genomsnitt AMD Ryzen 7 3700U (12881 - 18041, n=2) | |
| Rendering Single 32Bit | |
| HP Omen 15-dc1020ng | |
| Genomsnitt AMD Ryzen 7 3700U (4045 - 4776, n=2) | |
| Lenovo Ideapad 330S-15ARR-81FB00C7GE | |
| PCMark 8 | |
| Home Score Accelerated v2 | |
| Dell XPS 15 9570 Core i9 UHD | |
| Genomsnitt AMD Ryzen 7 3700U, AMD Radeon RX Vega 10 (3325 - 3993, n=7) | |
| Asus VivoBook S15 S532F | |
| Dell Inspiron 15 5000 5585 | |
| Dell Inspiron 15 5000 5584 | |
| Lenovo Ideapad 330S-15ARR-81FB00C7GE | |
| Dell Inspiron 15 3585 (2300U, Vega 6) | |
| Work Score Accelerated v2 | |
| Asus VivoBook S15 S532F | |
| Genomsnitt AMD Ryzen 7 3700U, AMD Radeon RX Vega 10 (4418 - 4869, n=6) | |
| Dell XPS 15 9570 Core i9 UHD | |
| Dell Inspiron 15 5000 5584 | |
| Lenovo Ideapad 330S-15ARR-81FB00C7GE | |
| Dell Inspiron 15 5000 5585 | |
| Dell Inspiron 15 3585 (2300U, Vega 6) | |
| PCMark 8 Home Score Accelerated v2 | 3504 poäng | |
| PCMark 8 Work Score Accelerated v2 | 4429 poäng | |
| PCMark 10 Score | 3903 poäng | |
Hjälp | ||
| Dell Inspiron 15 5000 5585 WDC PC SN520 SDAPNUW-512G | Dell Inspiron 15 3585 (2300U, Vega 6) Toshiba BG3 KBG30ZMS256G | Dell Inspiron 15 5000 5584 Toshiba BG3 KBG30ZMS512G | Dell XPS 15 9570 Core i9 UHD Samsung SSD PM981 MZVLB1T0HALR | Asus VivoBook S15 S532F WDC PC SN520 SDAPNUW-256G | Lenovo Ideapad 330S-15ARR-81FB00C7GE WDC PC SN520 SDAPNUW-256G | |
|---|---|---|---|---|---|---|
| AS SSD | -73% | -12% | 77% | 24% | -6% | |
| Seq Read (MB/s) | 398.9 | 1291 224% | 1115 180% | 1320 231% | 1147 188% | 1530 284% |
| Seq Write (MB/s) | 884 | 688 -22% | 841 -5% | 1500 70% | 752 -15% | 1087 23% |
| 4K Read (MB/s) | 34.54 | 21.87 -37% | 46.39 34% | 30.73 -11% | 41.52 20% | 34.7 0% |
| 4K Write (MB/s) | 82.1 | 35.62 -57% | 87.6 7% | 94.4 15% | 149.7 82% | 79.9 -3% |
| 4K-64 Read (MB/s) | 647 | 632 -2% | 904 40% | 1453 125% | 605 -6% | 464.7 -28% |
| 4K-64 Write (MB/s) | 985 | 221.2 -78% | 326.5 -67% | 1815 84% | 453.2 -54% | 326.1 -67% |
| Access Time Read * (ms) | 0.072 | 0.33 -358% | 0.048 33% | 0.061 15% | 0.073 -1% | 0.102 -42% |
| Access Time Write * (ms) | 0.047 | 0.234 -398% | 0.24 -411% | 0.044 6% | 0.025 47% | 0.047 -0% |
| Score Read (Points) | 721 | 783 9% | 1062 47% | 1616 124% | 761 6% | 652 -10% |
| Score Write (Points) | 1155 | 326 -72% | 498 -57% | 2059 78% | 678 -41% | 515 -55% |
| Score Total (Points) | 2279 | 1489 -35% | 2100 -8% | 4507 98% | 1821 -20% | 1489 -35% |
| Copy ISO MB/s (MB/s) | 862 | 432.6 -50% | 1090 26% | 2577 199% | 1093 27% | 690 -20% |
| Copy Program MB/s (MB/s) | 457 | 95.6 -79% | 618 35% | 515 13% | 775 70% | 153.9 -66% |
| Copy Game MB/s (MB/s) | 902 | 263.4 -71% | 750 -17% | 1120 24% | 1196 33% | 339.7 -62% |
* ... mindre är bättre

| 3DMark 11 Performance | 4318 poäng | |
| 3DMark Ice Storm Standard Score | 70349 poäng | |
| 3DMark Cloud Gate Standard Score | 11390 poäng | |
| 3DMark Fire Strike Score | 2694 poäng | |
| 3DMark Time Spy Score | 955 poäng | |
Hjälp | ||
| The Witcher 3 - 1024x768 Low Graphics & Postprocessing | |
| HP Omen 15-dc1020ng | |
| Dell XPS 15 9570 Core i9 UHD | |
| Asus VivoBook S15 S532F | |
| Lenovo IdeaPad 330-17IKB 81DM | |
| Dell Inspiron 15 5000 5585 | |
| Dell Inspiron 15 3585 (2300U, Vega 6) | |
| Genomsnitt AMD Radeon RX Vega 10 (29.7 - 53.8, n=8) | |
| Lenovo Ideapad 330S-15ARR-81FB00C7GE | |
| Dell Latitude 14 5495 | |
| Apple MacBook Pro 13 2018 Touchbar i5 | |
| låg | med. | hög | ultra | |
|---|---|---|---|---|
| BioShock Infinite (2013) | 123.7 | 21.3 | ||
| The Witcher 3 (2015) | 53.8 | 18.8 | 11.5 | |
| Rocket League (2017) | 119.7 | 59.9 | 38.9 | |
| Shadow of the Tomb Raider (2018) | 38 | 15 | 13 |
| Dell Inspiron 15 5000 5585 Vega 10, R7 3700U, WDC PC SN520 SDAPNUW-512G | Dell Inspiron 15 3585 (2300U, Vega 6) Vega 6, R3 2300U, Toshiba BG3 KBG30ZMS256G | Dell Inspiron 15 5000 5584 UHD Graphics 620, i7-8565U, Toshiba BG3 KBG30ZMS512G | Dell XPS 15 9570 Core i9 UHD GeForce GTX 1050 Ti Max-Q, i9-8950HK, Samsung SSD PM981 MZVLB1T0HALR | Asus VivoBook S15 S532F GeForce MX250, i7-8565U, WDC PC SN520 SDAPNUW-256G | Lenovo Ideapad 330S-15ARR-81FB00C7GE Vega 8, R5 2500U, WDC PC SN520 SDAPNUW-256G | |
|---|---|---|---|---|---|---|
| Noise | -8% | 4% | -7% | -5% | -5% | |
| av / miljö * (dB) | 28.3 | 30.6 -8% | 28.4 -0% | 28.2 -0% | 28 1% | 30.6 -8% |
| Idle Minimum * (dB) | 28.3 | 30.6 -8% | 28.4 -0% | 28.5 -1% | 28 1% | 30.6 -8% |
| Idle Average * (dB) | 28.3 | 30.6 -8% | 28.4 -0% | 28.6 -1% | 28 1% | 31.3 -11% |
| Idle Maximum * (dB) | 28.3 | 30.6 -8% | 28.4 -0% | 28.8 -2% | 30 -6% | 31.3 -11% |
| Load Average * (dB) | 31.4 | 36.7 -17% | 28.9 8% | 36.2 -15% | 41.4 -32% | 33.2 -6% |
| Witcher 3 ultra * (dB) | 41.4 | 47.6 -15% | 41.5 -0% | |||
| Load Maximum * (dB) | 41.4 | 41.1 1% | 36 13% | 47.6 -15% | 41.5 -0% | 35.2 15% |
* ... mindre är bättre
Ljudnivå
| Låg belastning |
| 28.3 / 28.3 / 28.3 dB(A) |
| Hög belastning |
| 31.4 / 41.4 dB(A) |
 | ||
30 dB tyst 40 dB(A) hörbar 50 dB(A) högt ljud |
||
min: | ||
(±) Den maximala temperaturen på ovansidan är 41 °C / 106 F, jämfört med genomsnittet av 36.8 °C / 98 F , allt från 21 till 71 °C för klassen Multimedia.
(-) Botten värms upp till maximalt 47 °C / 117 F, jämfört med genomsnittet av 39.1 °C / 102 F
(+) Vid tomgångsbruk är medeltemperaturen för ovansidan 25.6 °C / 78 F, jämfört med enhetsgenomsnittet på 31.3 °C / ### class_avg_f### F.
(±) När du spelar The Witcher 3 är medeltemperaturen för ovansidan 34.7 °C / 94 F, jämfört med enhetsgenomsnittet på 31.3 °C / ## #class_avg_f### F.
(+) Handledsstöden och pekplattan är kallare än hudtemperaturen med maximalt 28.6 °C / 83.5 F och är därför svala att ta på.
(±) Medeltemperaturen för handledsstödsområdet på liknande enheter var 28.7 °C / 83.7 F (+0.1 °C / 0.2 F).
Dell Inspiron 15 5000 5585 ljudanalys
(±) | högtalarljudstyrkan är genomsnittlig men bra (79.1 dB)
Bas 100 - 315 Hz
(±) | reducerad bas - i genomsnitt 12.4% lägre än medianen
(±) | linjäriteten för basen är genomsnittlig (13.1% delta till föregående frekvens)
Mellan 400 - 2000 Hz
(+) | balanserad mellan - endast 3.5% från medianen
(±) | linjäriteten för mids är genomsnittlig (9.6% delta till föregående frekvens)
Högsta 2 - 16 kHz
(+) | balanserade toppar - endast 2.4% från medianen
(±) | linjäriteten för toppar är genomsnittlig (11.1% delta till föregående frekvens)
Totalt 100 - 16 000 Hz
(±) | linjäriteten för det totala ljudet är genomsnittlig (17.2% skillnad mot median)
Jämfört med samma klass
» 49% av alla testade enheter i den här klassen var bättre, 7% liknande, 44% sämre
» Den bästa hade ett delta på 5%, genomsnittet var 17%, sämst var 45%
Jämfört med alla testade enheter
» 32% av alla testade enheter var bättre, 8% liknande, 60% sämre
» Den bästa hade ett delta på 4%, genomsnittet var 23%, sämst var 134%
Apple MacBook 12 (Early 2016) 1.1 GHz ljudanalys
(+) | högtalare kan spela relativt högt (83.6 dB)
Bas 100 - 315 Hz
(±) | reducerad bas - i genomsnitt 11.3% lägre än medianen
(±) | linjäriteten för basen är genomsnittlig (14.2% delta till föregående frekvens)
Mellan 400 - 2000 Hz
(+) | balanserad mellan - endast 2.4% från medianen
(+) | mids är linjära (5.5% delta till föregående frekvens)
Högsta 2 - 16 kHz
(+) | balanserade toppar - endast 2% från medianen
(+) | toppar är linjära (4.5% delta till föregående frekvens)
Totalt 100 - 16 000 Hz
(+) | det totala ljudet är linjärt (10.2% skillnad mot median)
Jämfört med samma klass
» 7% av alla testade enheter i den här klassen var bättre, 2% liknande, 90% sämre
» Den bästa hade ett delta på 5%, genomsnittet var 18%, sämst var 53%
Jämfört med alla testade enheter
» 5% av alla testade enheter var bättre, 1% liknande, 94% sämre
» Den bästa hade ett delta på 4%, genomsnittet var 23%, sämst var 134%
| Av/Standby | |
| Låg belastning | |
| Hög belastning |
|
Förklaring:
min: | |
| Dell Inspiron 15 5000 5585 R7 3700U, Vega 10, WDC PC SN520 SDAPNUW-512G, IPS, 1920x1080, 15.6" | Dell Inspiron 15 3585 (2300U, Vega 6) R3 2300U, Vega 6, Toshiba BG3 KBG30ZMS256G, TN, 1920x1080, 15.6" | Dell Inspiron 15 5000 5584 i7-8565U, UHD Graphics 620, Toshiba BG3 KBG30ZMS512G, IPS, 1920x1080, 15.6" | Dell XPS 15 9570 Core i9 UHD i9-8950HK, GeForce GTX 1050 Ti Max-Q, Samsung SSD PM981 MZVLB1T0HALR, IPS, 3840x2160, 15.6" | Asus VivoBook S15 S532F i7-8565U, GeForce MX250, WDC PC SN520 SDAPNUW-256G, IPS, 1920x1080, 15.6" | Lenovo Ideapad 330S-15ARR-81FB00C7GE R5 2500U, Vega 8, WDC PC SN520 SDAPNUW-256G, IPS, 1920x1080, 15.6" | |
|---|---|---|---|---|---|---|
| Power Consumption | -26% | -5% | -138% | -64% | -15% | |
| Idle Minimum * (Watt) | 4.2 | 6.3 -50% | 3.6 14% | 7.1 -69% | 6 -43% | 5.2 -24% |
| Idle Average * (Watt) | 6.8 | 9.2 -35% | 7.4 -9% | 13.6 -100% | 10.3 -51% | 8.3 -22% |
| Idle Maximum * (Watt) | 7 | 9.6 -37% | 8.3 -19% | 14.1 -101% | 10.5 -50% | 8.2 -17% |
| Load Average * (Watt) | 36.5 | 38 -4% | 38 -4% | 103.9 -185% | 69.1 -89% | 38 -4% |
| Witcher 3 ultra * (Watt) | 37.9 | 103 -172% | 57.8 -53% | |||
| Load Maximum * (Watt) | 44 | 46 -5% | 47.9 -9% | 130.9 -198% | 88 -100% | 46.6 -6% |
* ... mindre är bättre
| Dell Inspiron 15 5000 5585 R7 3700U, Vega 10, 42 Wh | Dell Inspiron 15 3585 (2300U, Vega 6) R3 2300U, Vega 6, 42 Wh | Dell Inspiron 15 5000 5584 i7-8565U, UHD Graphics 620, 42 Wh | Dell XPS 15 9570 Core i9 UHD i9-8950HK, GeForce GTX 1050 Ti Max-Q, 97 Wh | Asus VivoBook S15 S532F i7-8565U, GeForce MX250, 42 Wh | Lenovo Ideapad 330S-15ARR-81FB00C7GE R5 2500U, Vega 8, 30 Wh | |
|---|---|---|---|---|---|---|
| Batteridrifttid | -15% | -17% | -0% | -17% | -28% | |
| Reader / Idle (h) | 14.3 | 7.3 -49% | 15.3 7% | 15 5% | 10.9 -24% | 7.3 -49% |
| WiFi v1.3 (h) | 7 | 5.3 -24% | 3.5 -50% | 8.6 23% | 5.1 -27% | 4.1 -41% |
| Load (h) | 1.4 | 1.8 29% | 1.3 -7% | 1 -29% | 1.4 0% | 1.5 7% |
För
Emot
Läs den fullständiga versionen av den här recensionen på engelska här.
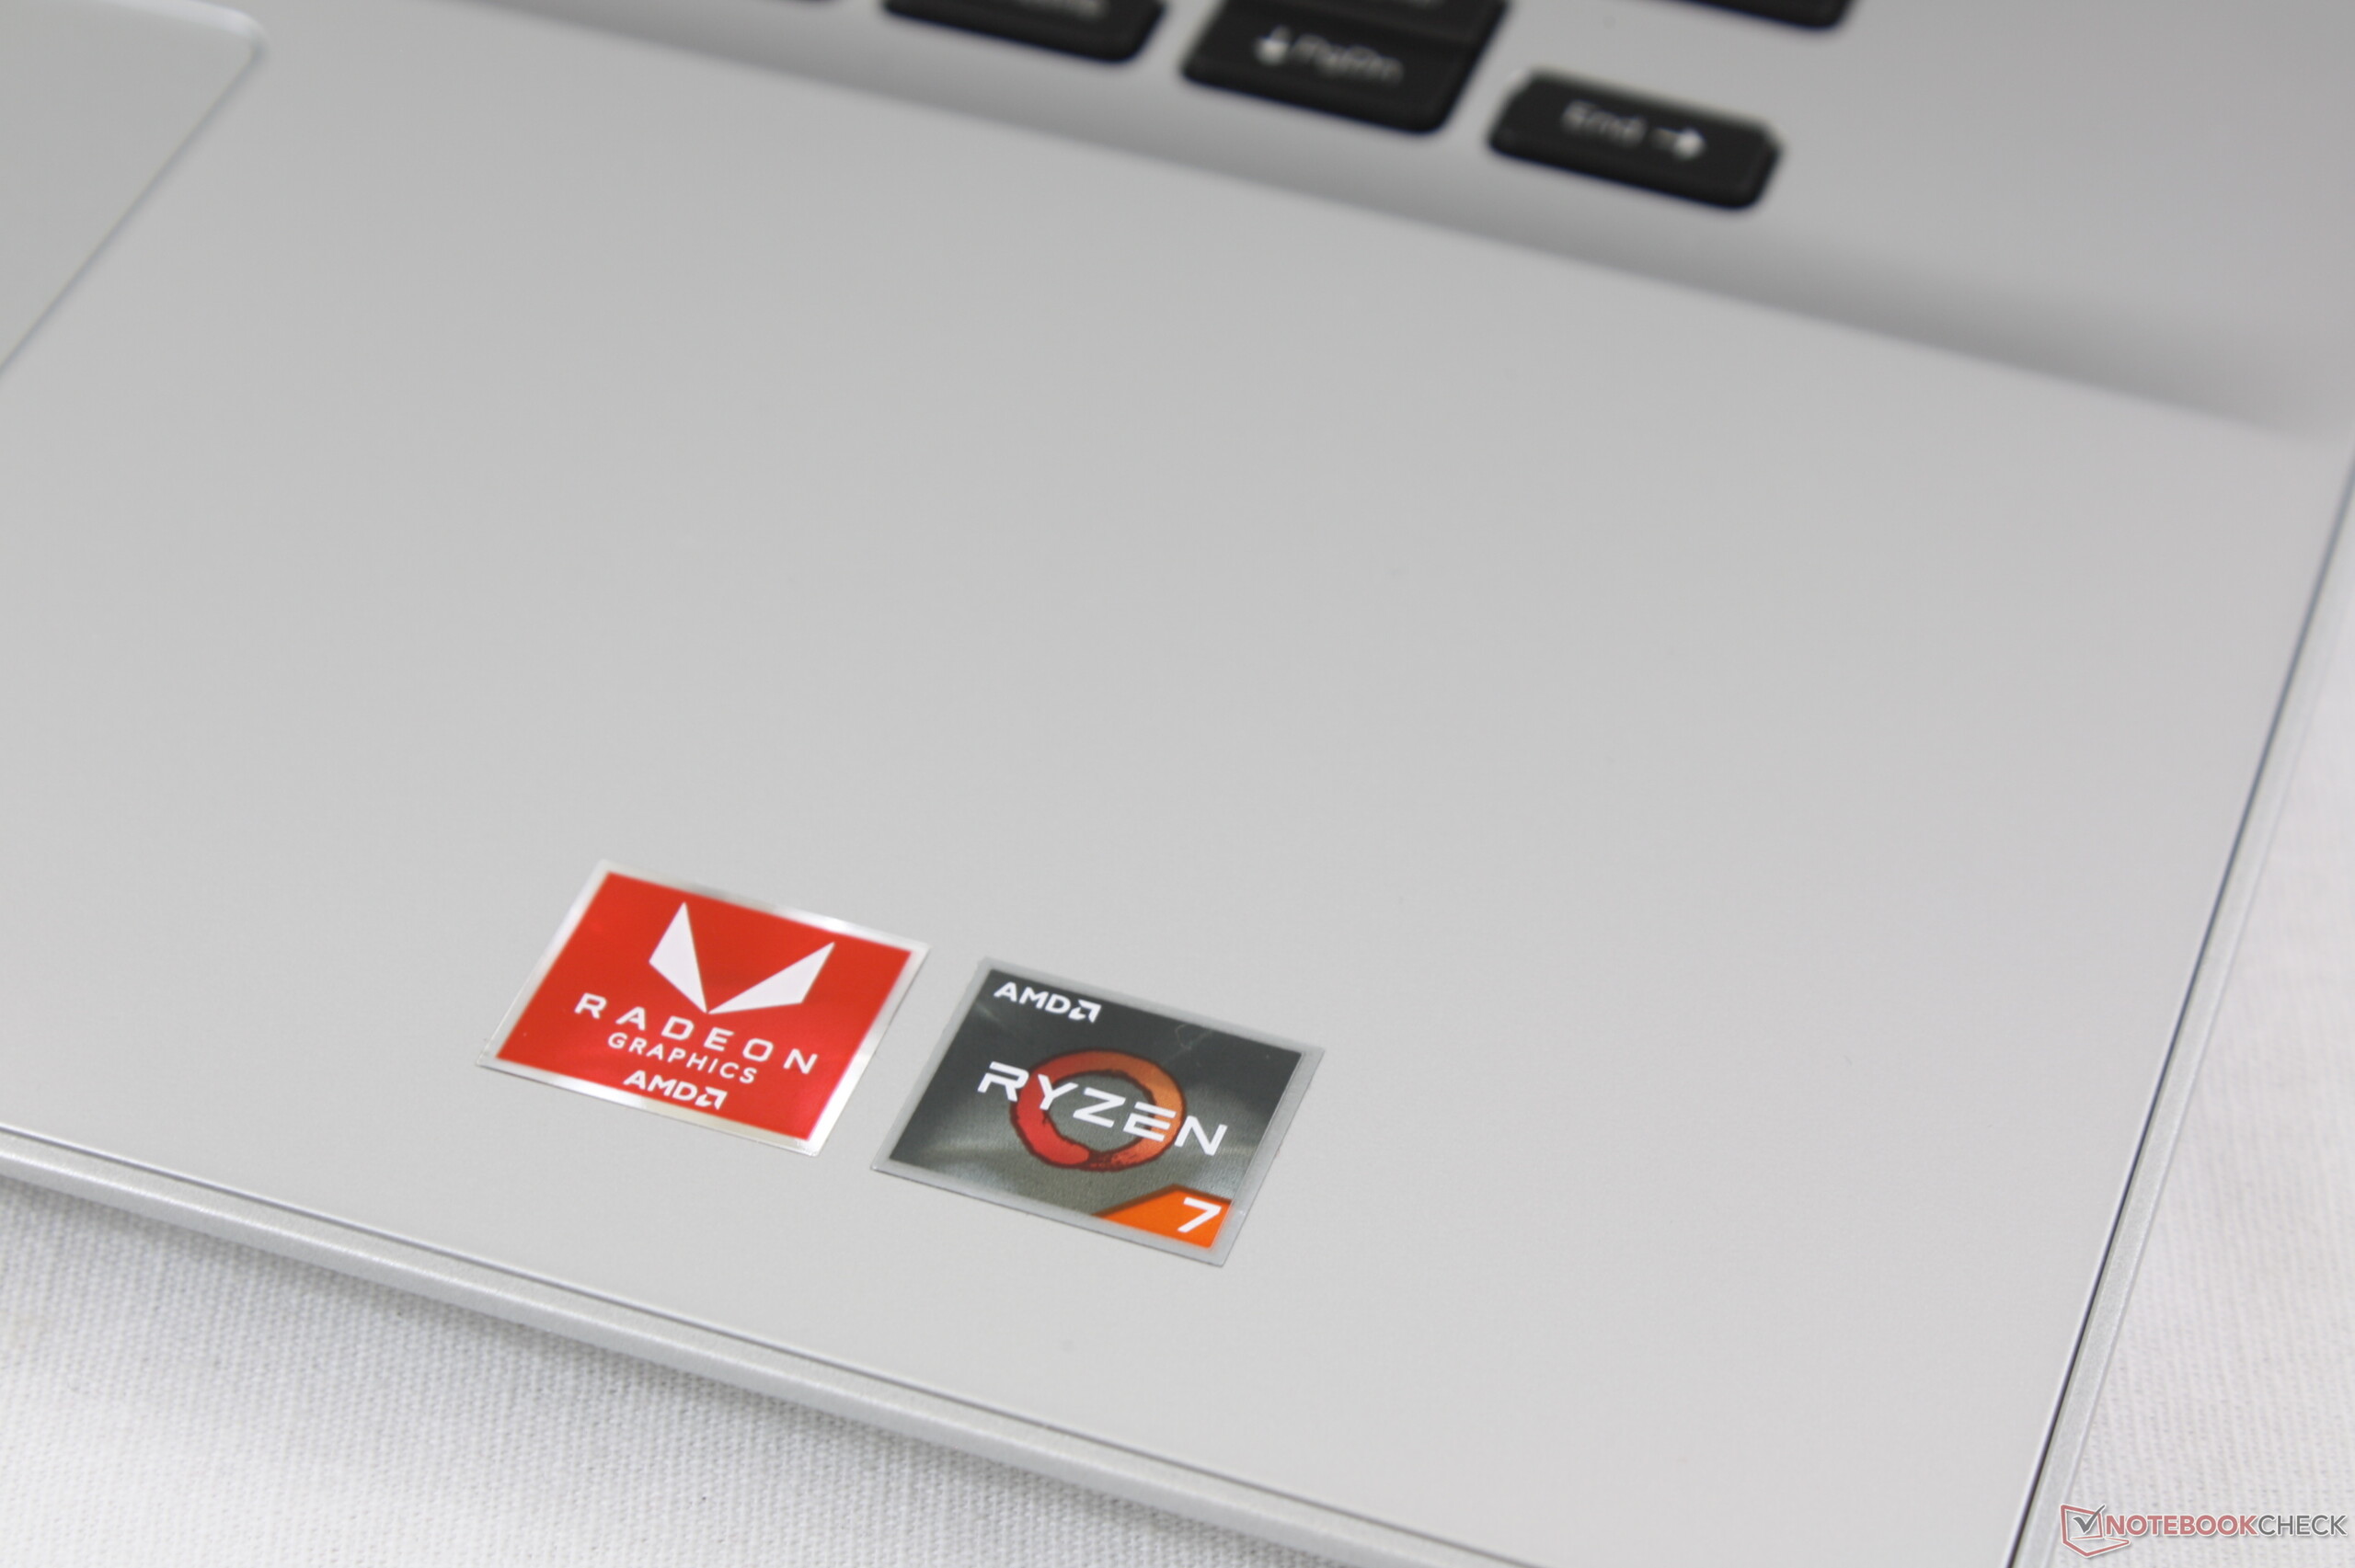
Vi förväntade oss inte särskilt mycket från Inspiron när vi påbörjade den här recensionen, men vi blev glatt överraskade av systemets prestanda. I synnerhet gäller detta AMD-processorn, som hade liknande CPU-prestanda som Core i7-8565U samtidigt som den hade betydligt snabbare GPU-prestanda. Casualspelare som vill spela lite Rocket League eller LoL mellan lektionerna kommer märka att AMD-varianten av Inspiron är ett mycket kraftigare alternativ än de dyrare modellerna XPS 13 och HP Spectre x360 13.
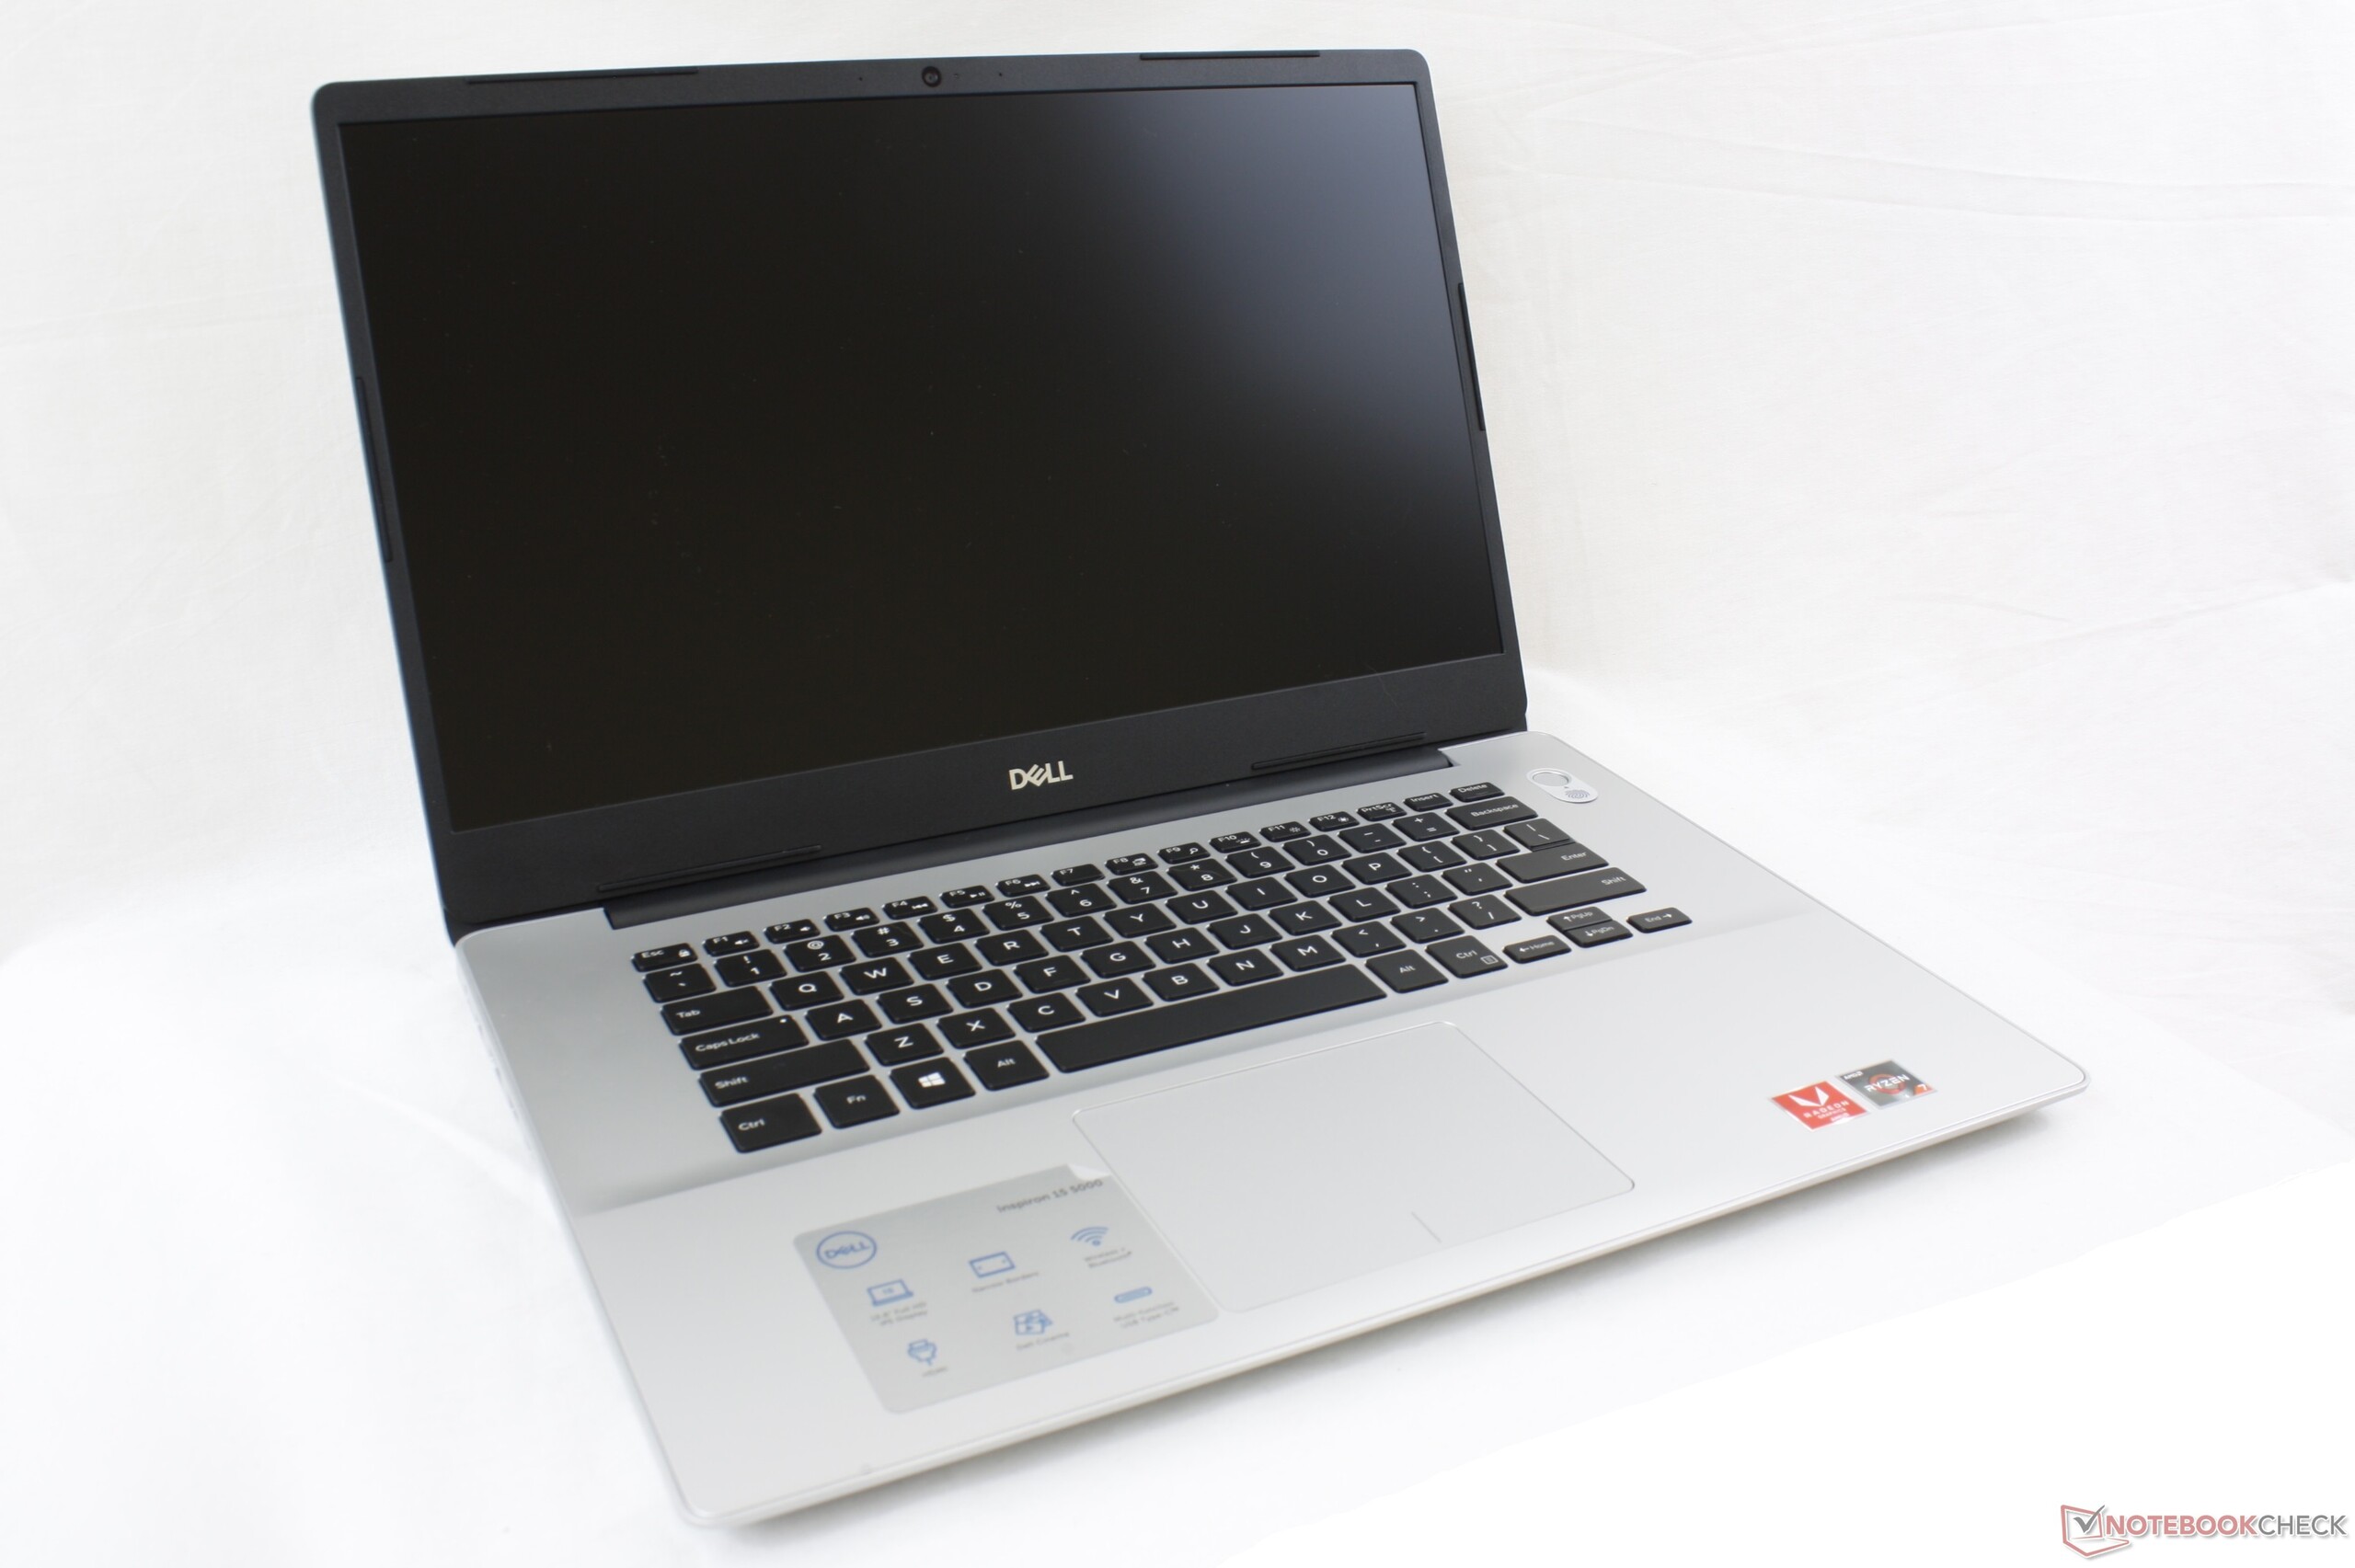
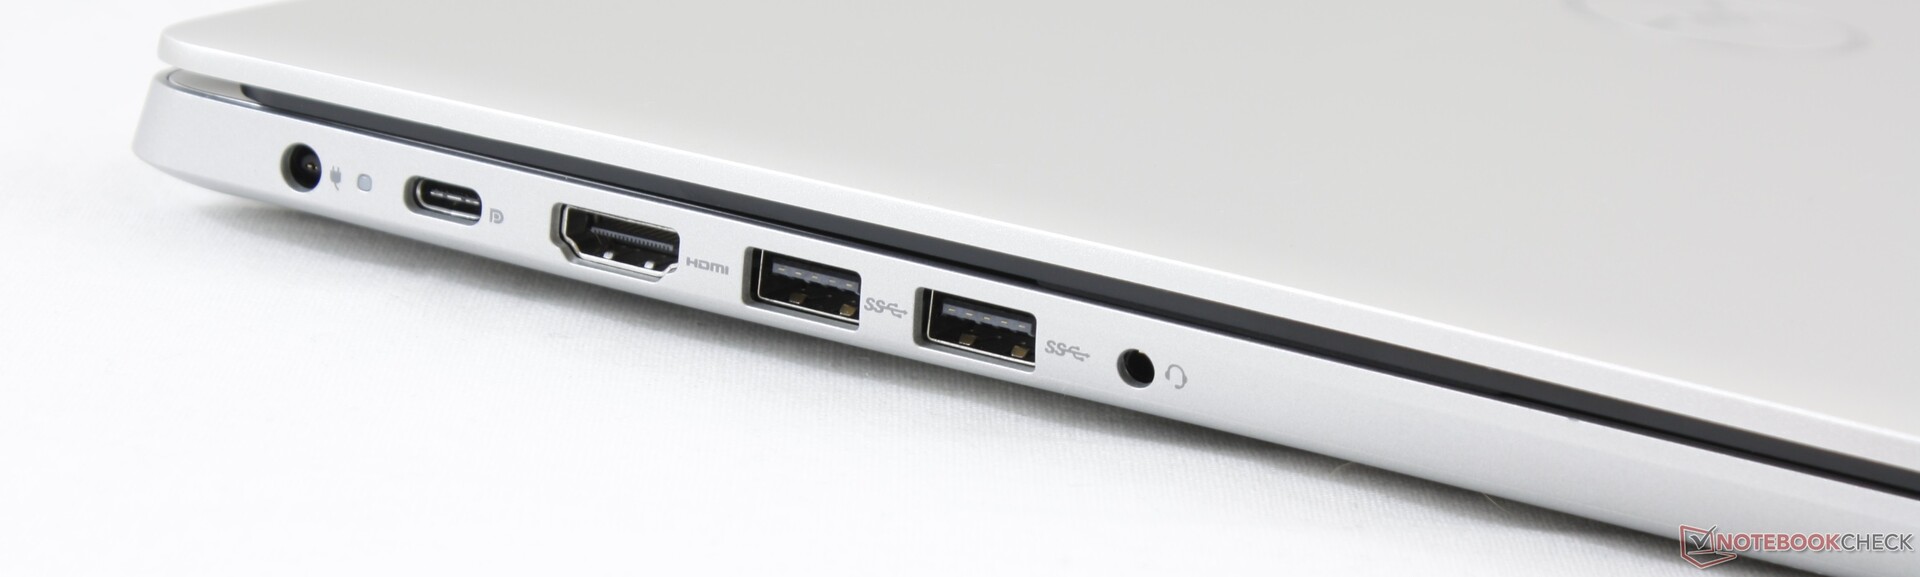
Tyvärr sitter den imponerande processorn i ett mindre imponerande chassi. Det här är trots allt en budgetlaptop, vilket innebär att skärmen är relativt mörk, färgerna saknar djup och plasten saknar all form av lyxkänsla. Batteriet håller dock längre än på Intel-varianten Inspiron 15 5584 och tangentbordet har faktiskt ganska bra återkoppling vilket vi tror att den budgetmedvetna målgruppen kommer uppskatta. Om Dell släpper en uppföljare tror vi Inspiron kan bli bättre med en mer ljusstark skärm och genom att gå över helt till universell USB Typ C-laddning.
En AMD CPU värdig en XPS som är instängd i en Inspiron. Med andra ord, du får prestanda värdig ett Ultrabook-flaggskepp med förvånansvärt skaplig integrerad grafik i ett billig budgetchassi.
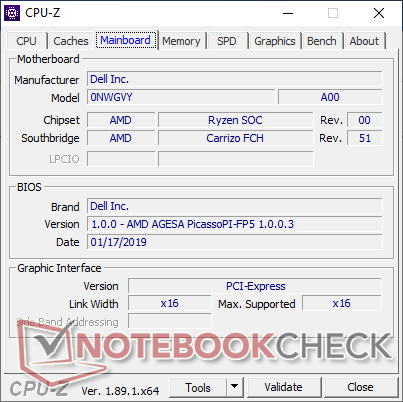
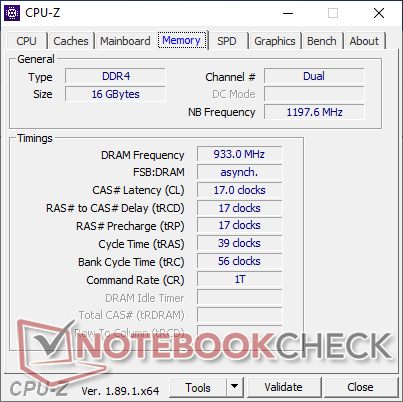
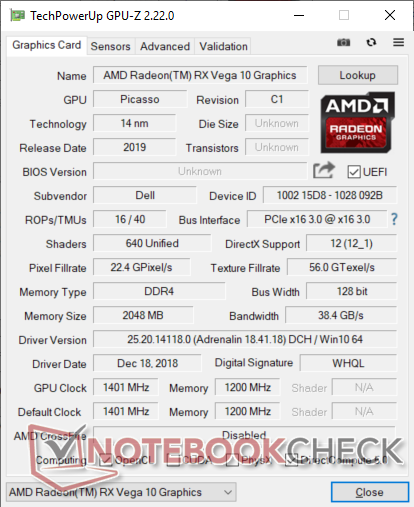
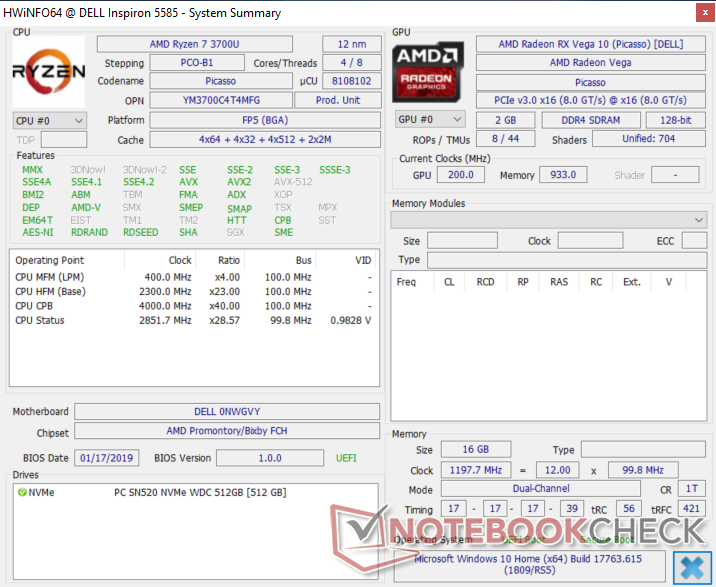
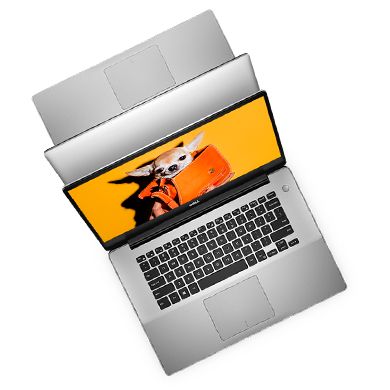
Dell Inspiron 15 5000 5585
- 08/08/2019 v6 (old)
Allen Ngo
Price comparison
