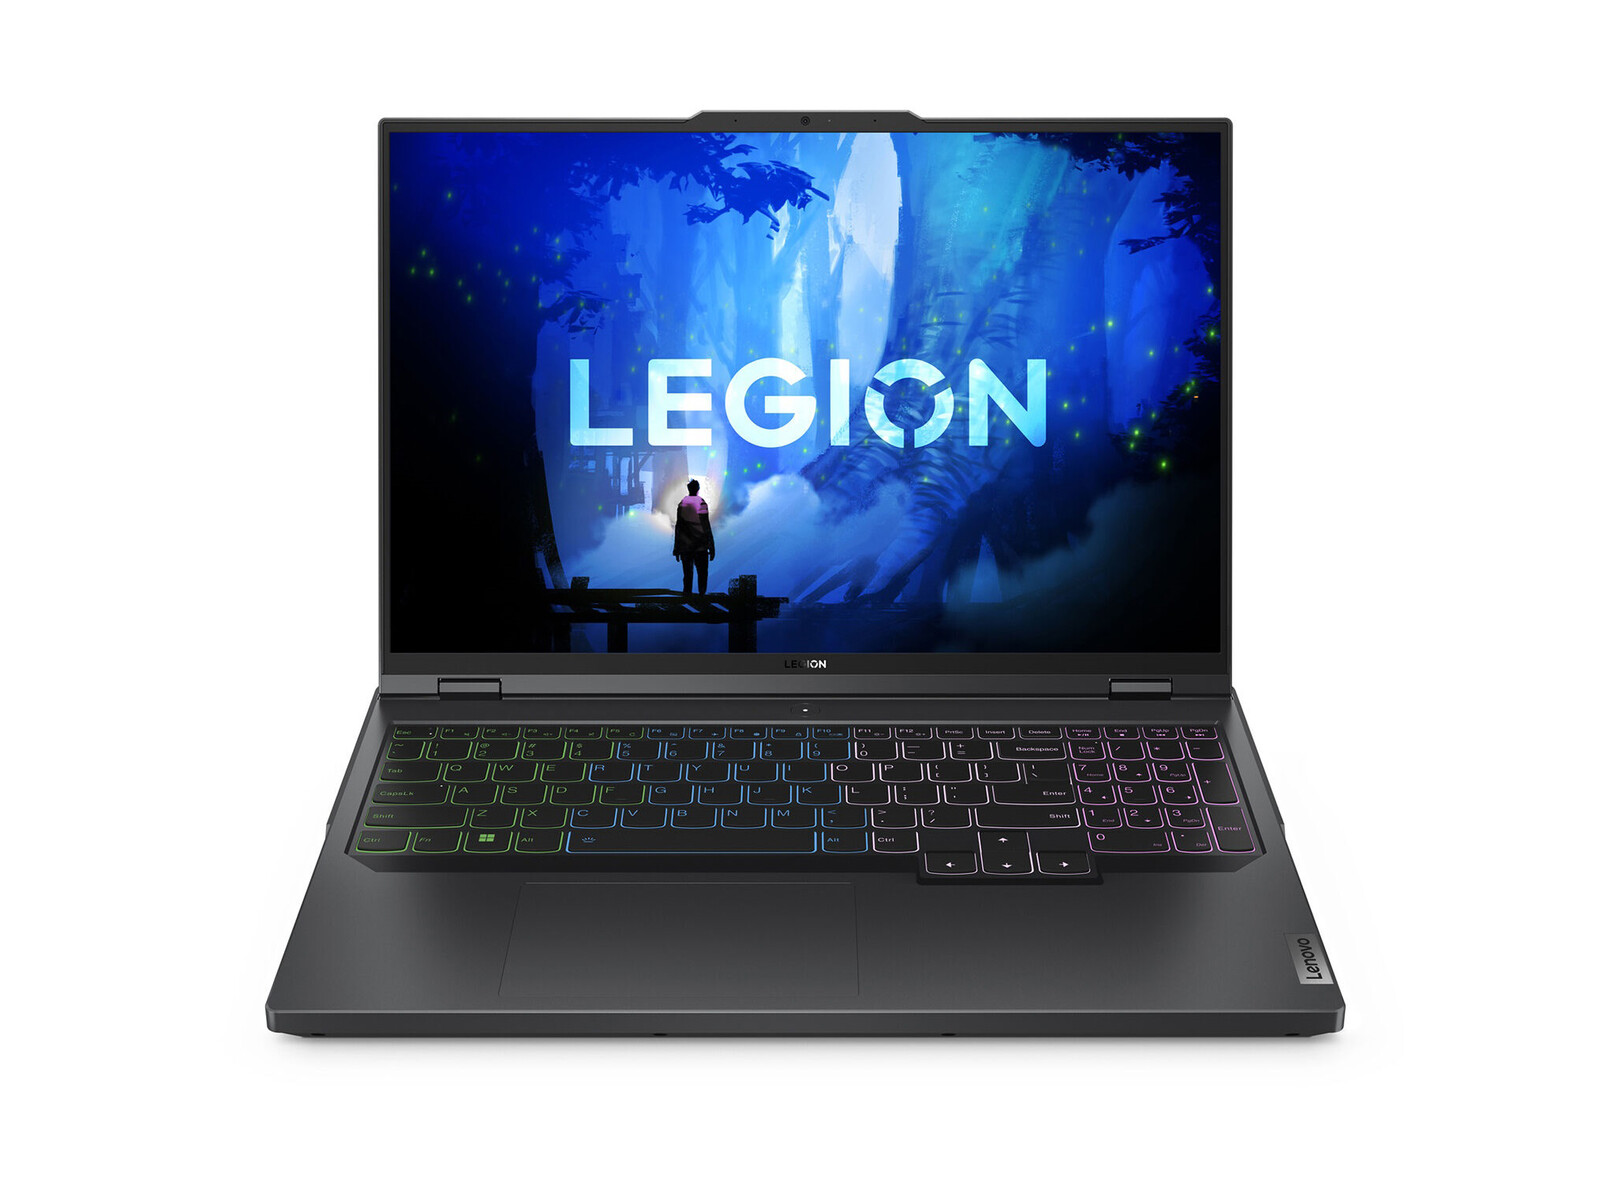
Lenovo Legion Pro 5 16IRX9 recension av bärbar dator: Bra prestanda, men lite tung

Ej att förväxla med visuellt annorlunda Legion 5 16IRX9Legion Pro 5 16IRX9 är en direkt efterföljare till förra årets Legion Pro 5 16 IRX8. Den byter ut 2023 Raptor Lake-HX-processorerna mot 2024 Raptor Lake-HX-uppdateringen samtidigt som den introducerar små visuella förändringar och ett nytt tredje skärmalternativ.
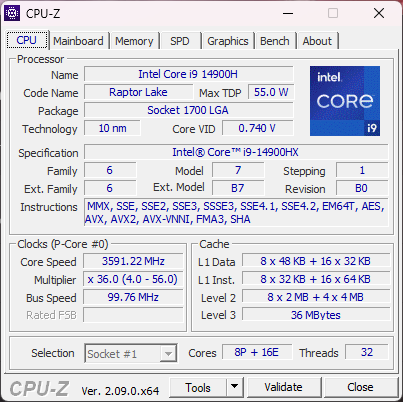
Vår enhet är en avancerad konfiguration med Core i9-14900HX-processor, 140 W GeForce RTX 4070 GPU och 1600p 165 Hz IPS sRGB-skärm för cirka 1900-2100 USD i detaljhandeln. Andra SKU:er börjar med Core i5-14500HX och RTX 4050 med fullständiga DCI-P3 färger istället, men den inbyggda 1600p-upplösningen är densamma över hela linjen.
Alternativ till Legion Pro 5 16 IRX9 inkluderar andra 16-tums bärbara speldatorer i övre mellanklassen som HP Omen Transcend 16,Asus ROG Zephyrus G16eller MSI Stealth 16.
Fler Lenovo recensioner:
Potentiella konkurrenter i jämförelse
Gradering | Datum | Modell | Vikt | Höjd | Storlek | Upplösning | Pris |
|---|---|---|---|---|---|---|---|
| 89.3 % v7 (old) | 04/2024 | Lenovo Legion Pro 5 16IRX9 i9-14900HX, GeForce RTX 4070 Laptop GPU | 2.5 kg | 26.95 mm | 16.00" | 2560x1600 | |
| 87.9 % v7 (old) | 05/2023 | Lenovo Legion Pro 5 16IRX8 i7-13700HX, GeForce RTX 4060 Laptop GPU | 2.5 kg | 26.8 mm | 16.00" | 2560x1600 | |
| 90.2 % v7 (old) | 03/2024 | Alienware m16 R2 Ultra 7 155H, GeForce RTX 4070 Laptop GPU | 2.5 kg | 23.5 mm | 16.00" | 2560x1600 | |
| 88.4 % v7 (old) | 02/2024 | HP Omen Transcend 16-u1095ng i9-14900HX, GeForce RTX 4070 Laptop GPU | 2.3 kg | 20 mm | 16.00" | 2560x1600 | |
| 92.3 % v7 (old) | 02/2024 | Asus ROG Zephyrus G16 2024 GU605M Ultra 7 155H, GeForce RTX 4070 Laptop GPU | 1.8 kg | 16.4 mm | 16.00" | 2560x1600 | |
| 89.1 % v7 (old) | 11/2023 | MSI Stealth 16 Mercedes-AMG Motorsport A13VG i9-13900H, GeForce RTX 4070 Laptop GPU | 1.9 kg | 20 mm | 16.00" | 3840x2400 |
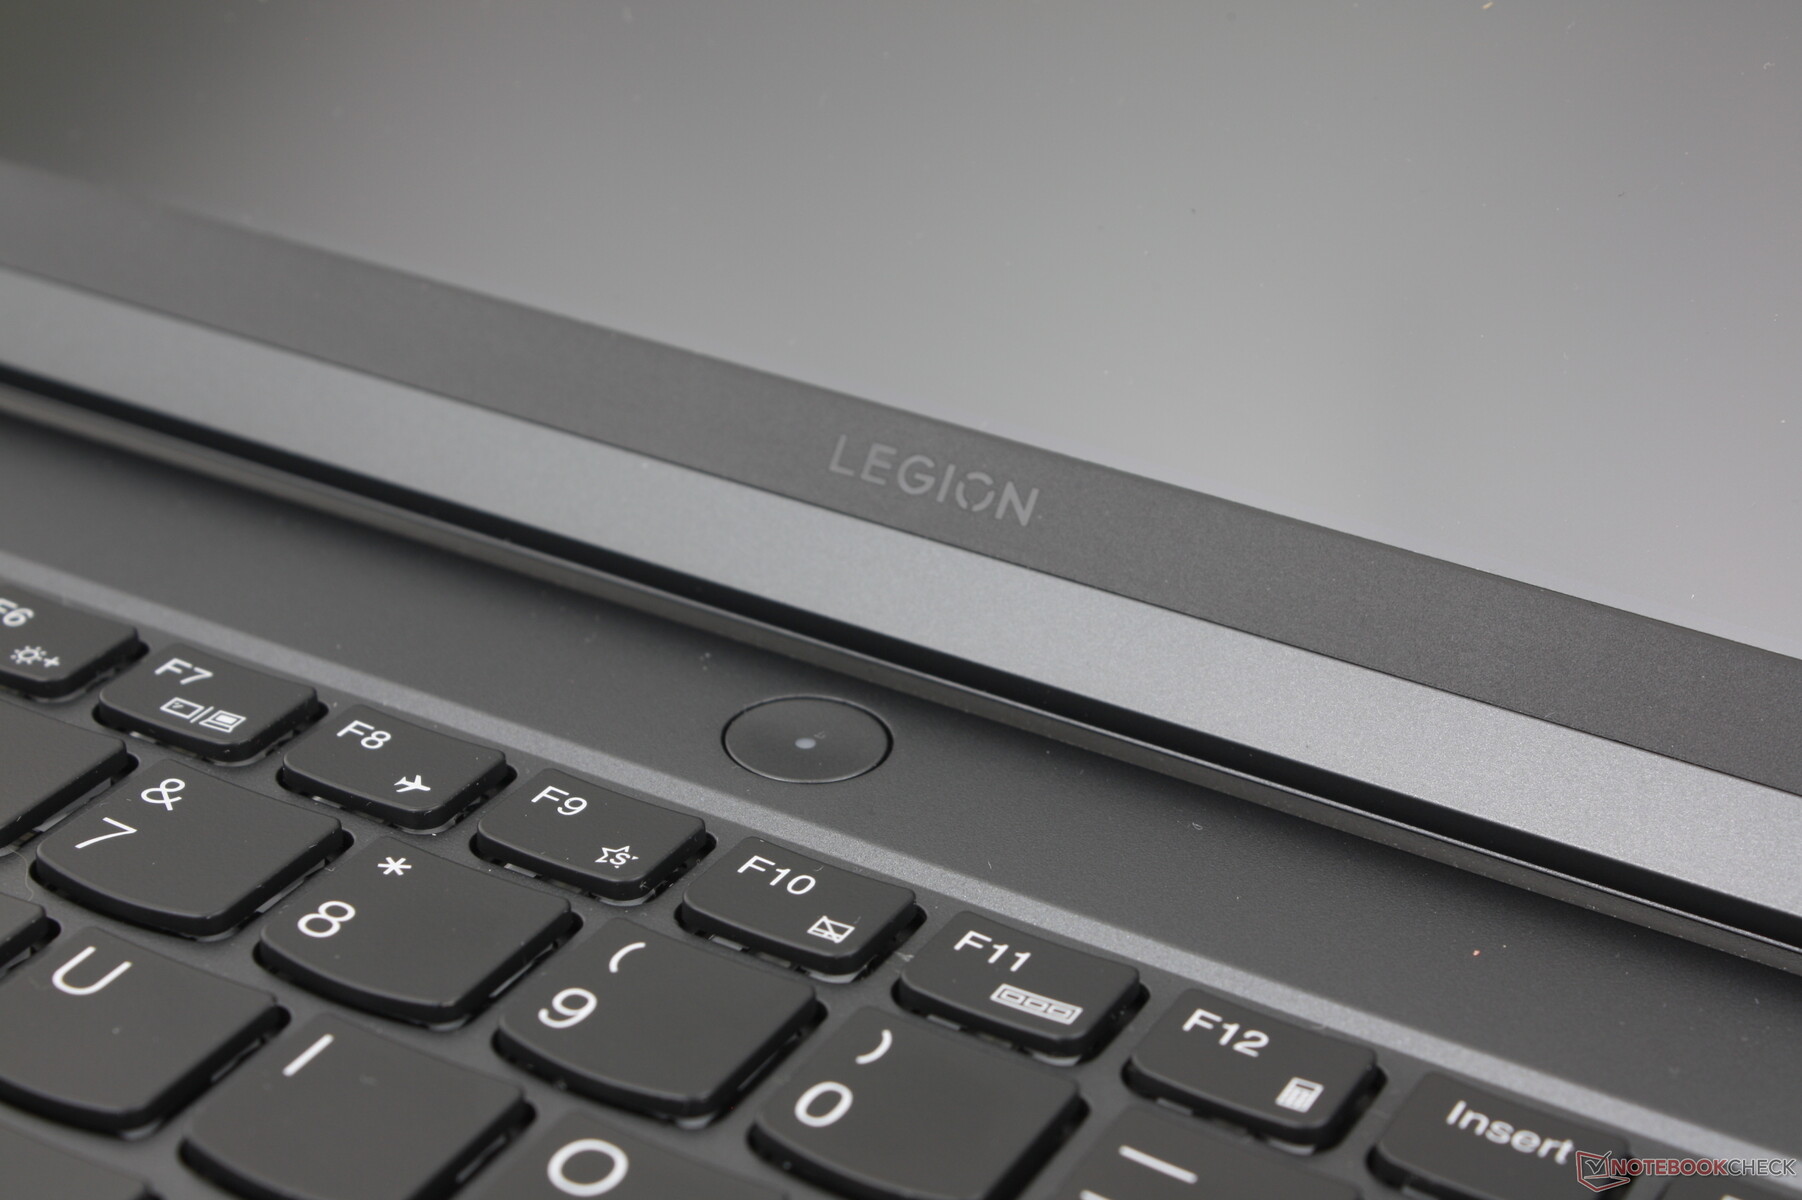
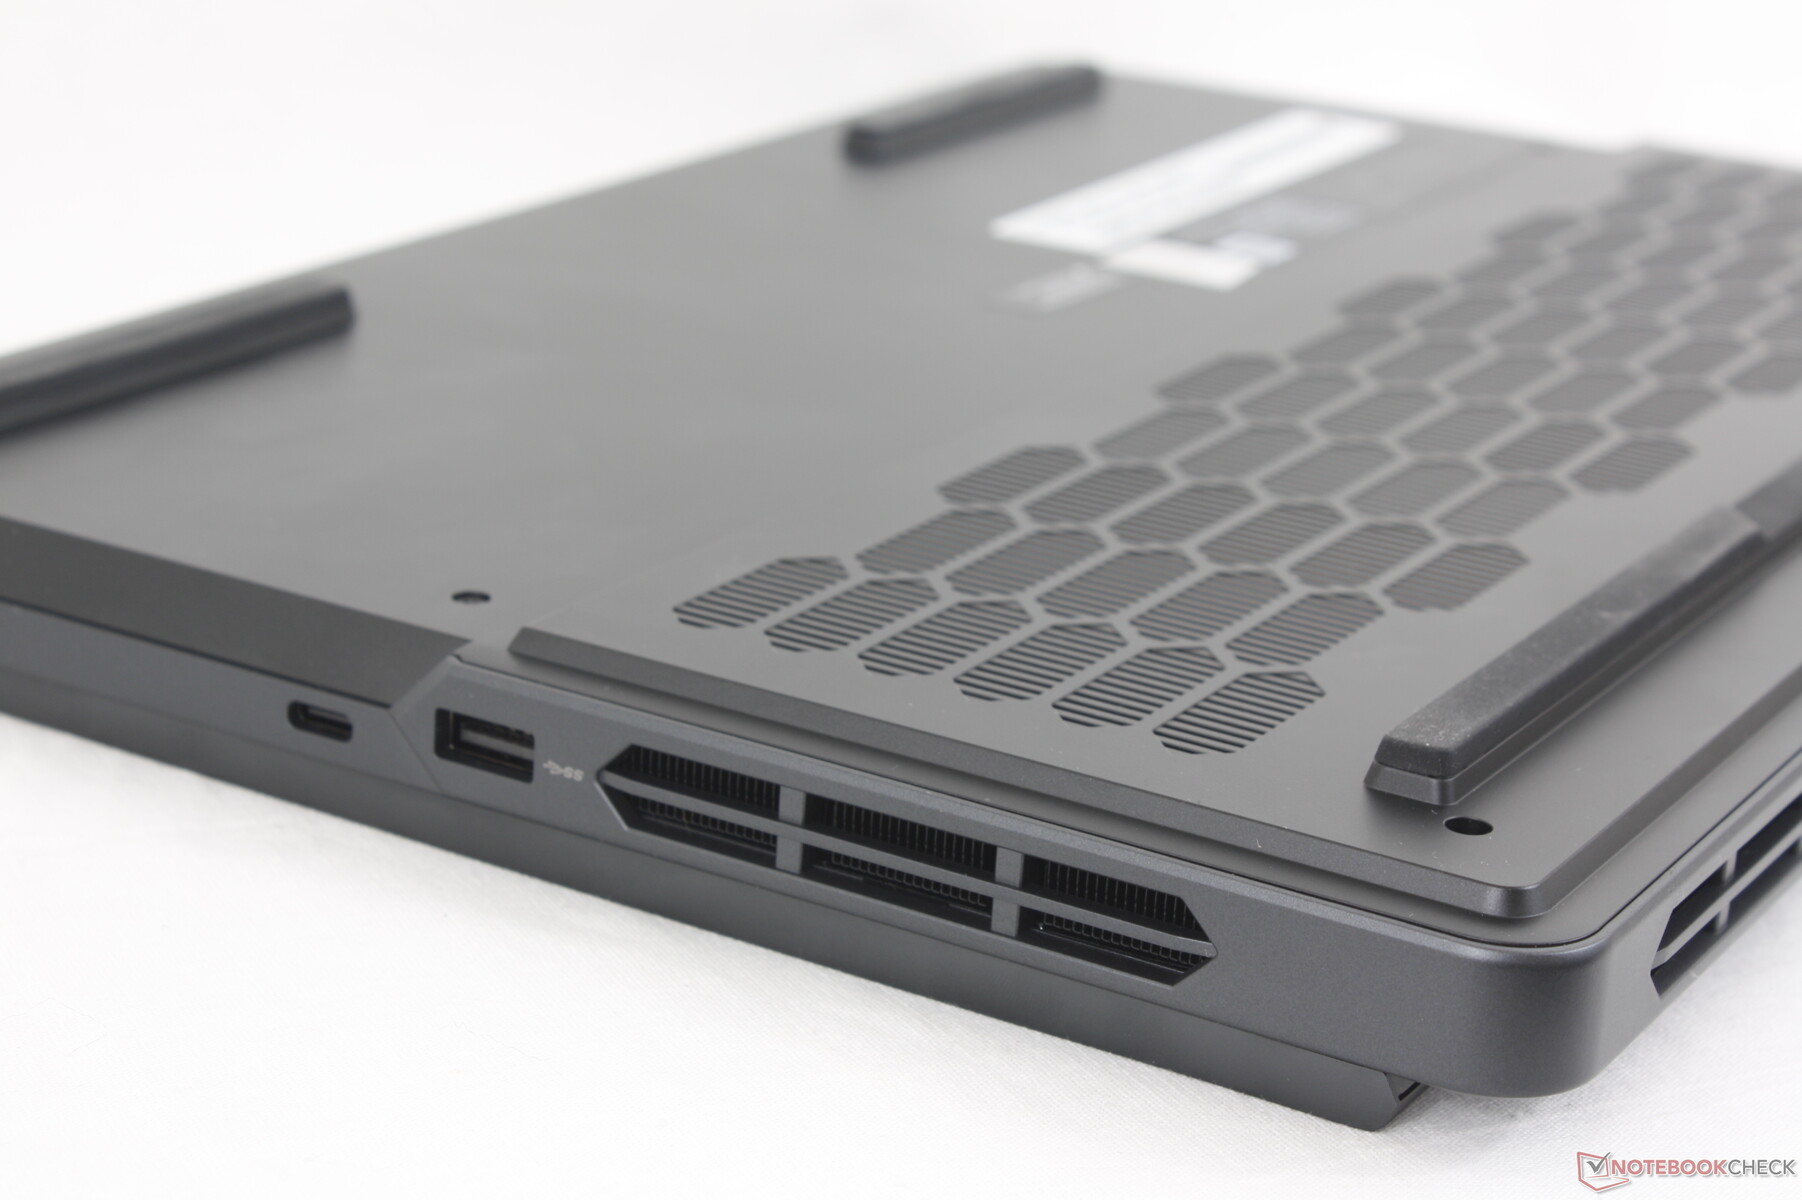
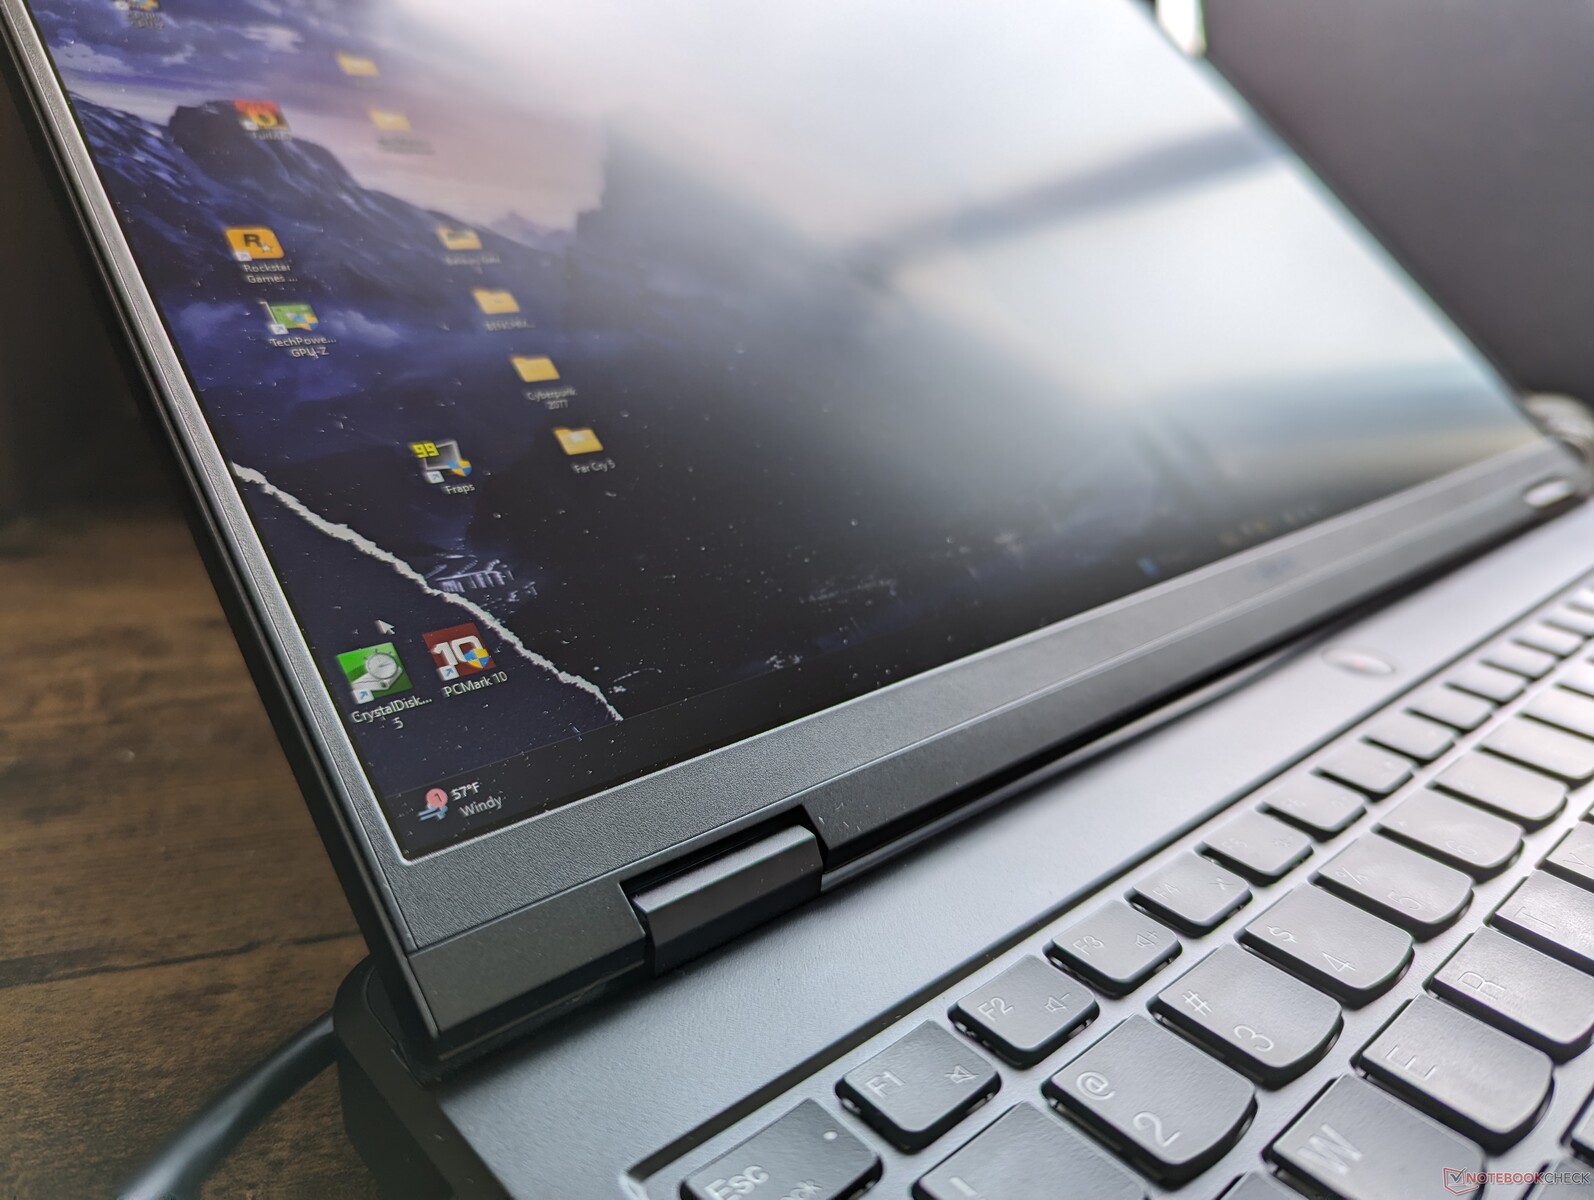
Case - Små externa förändringar
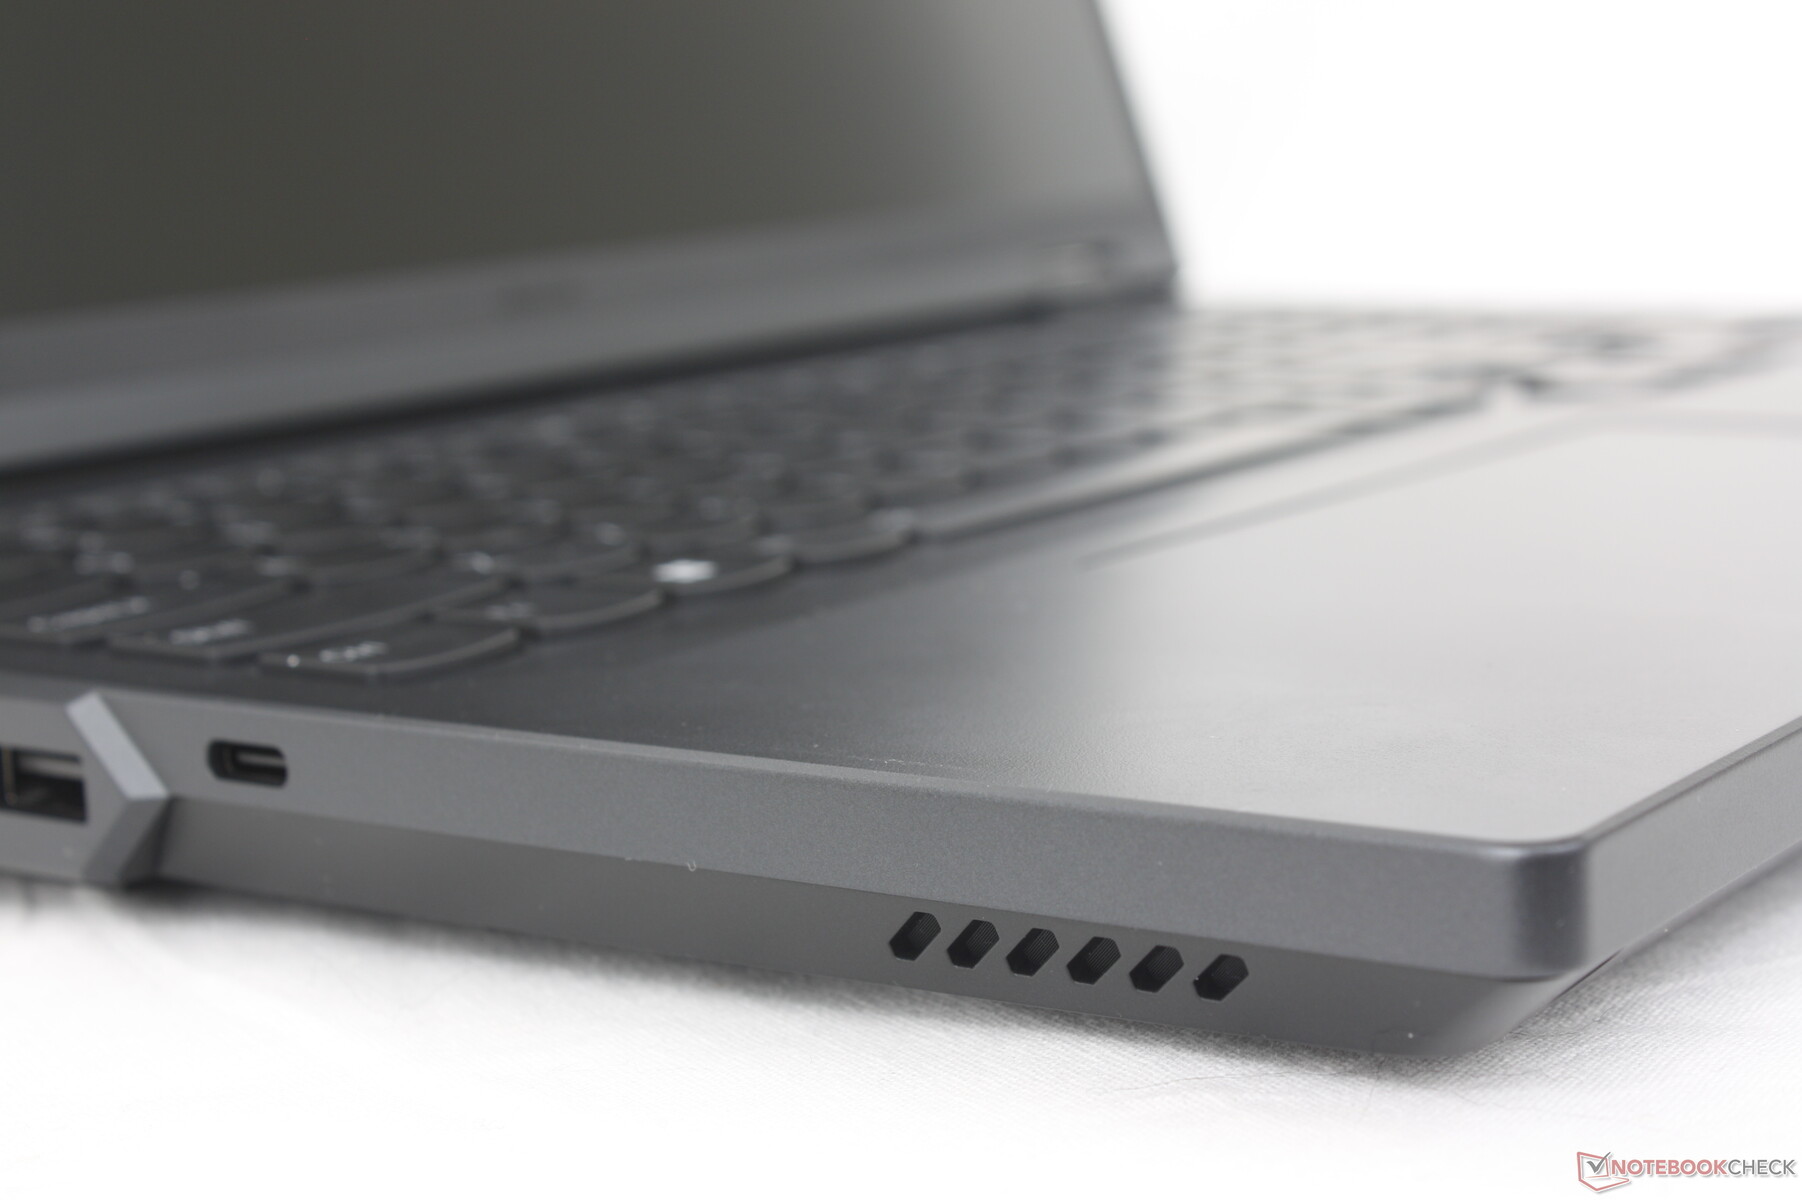
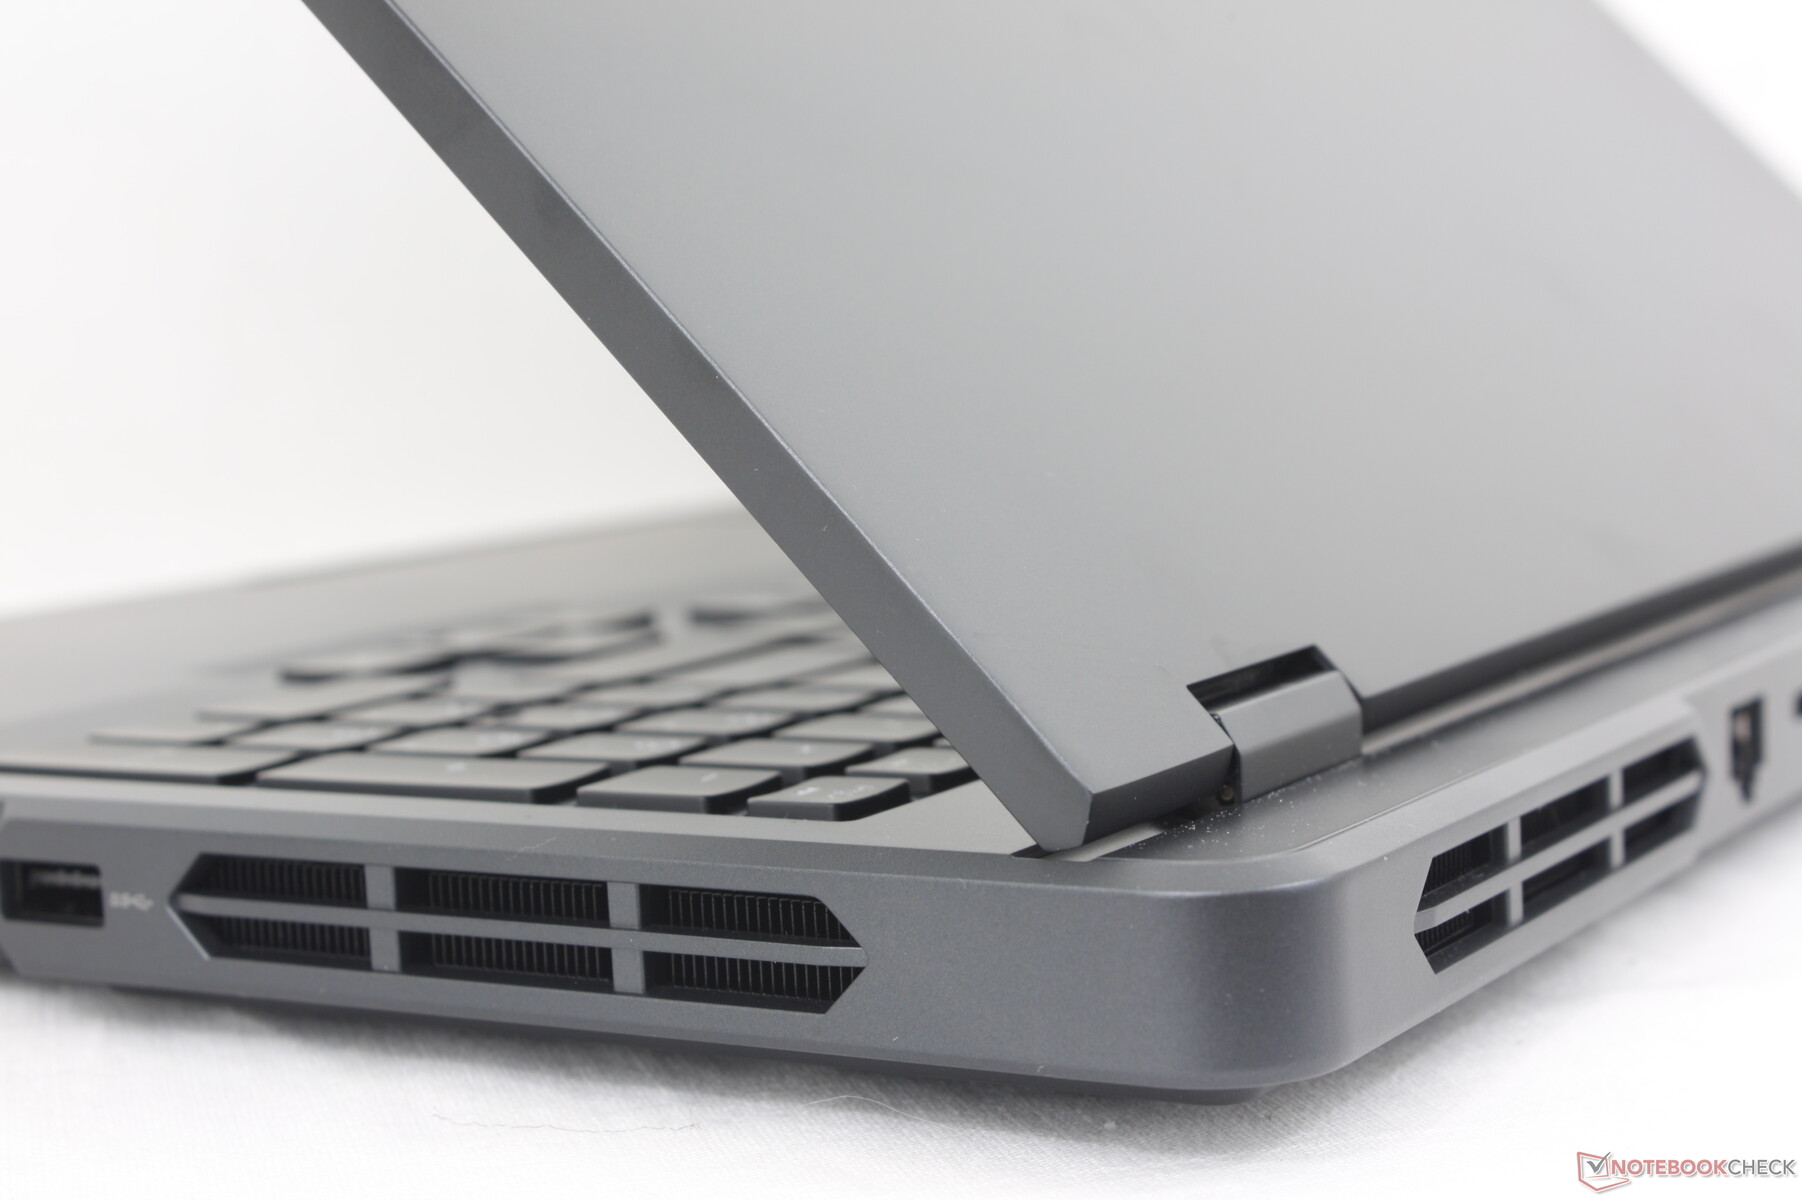
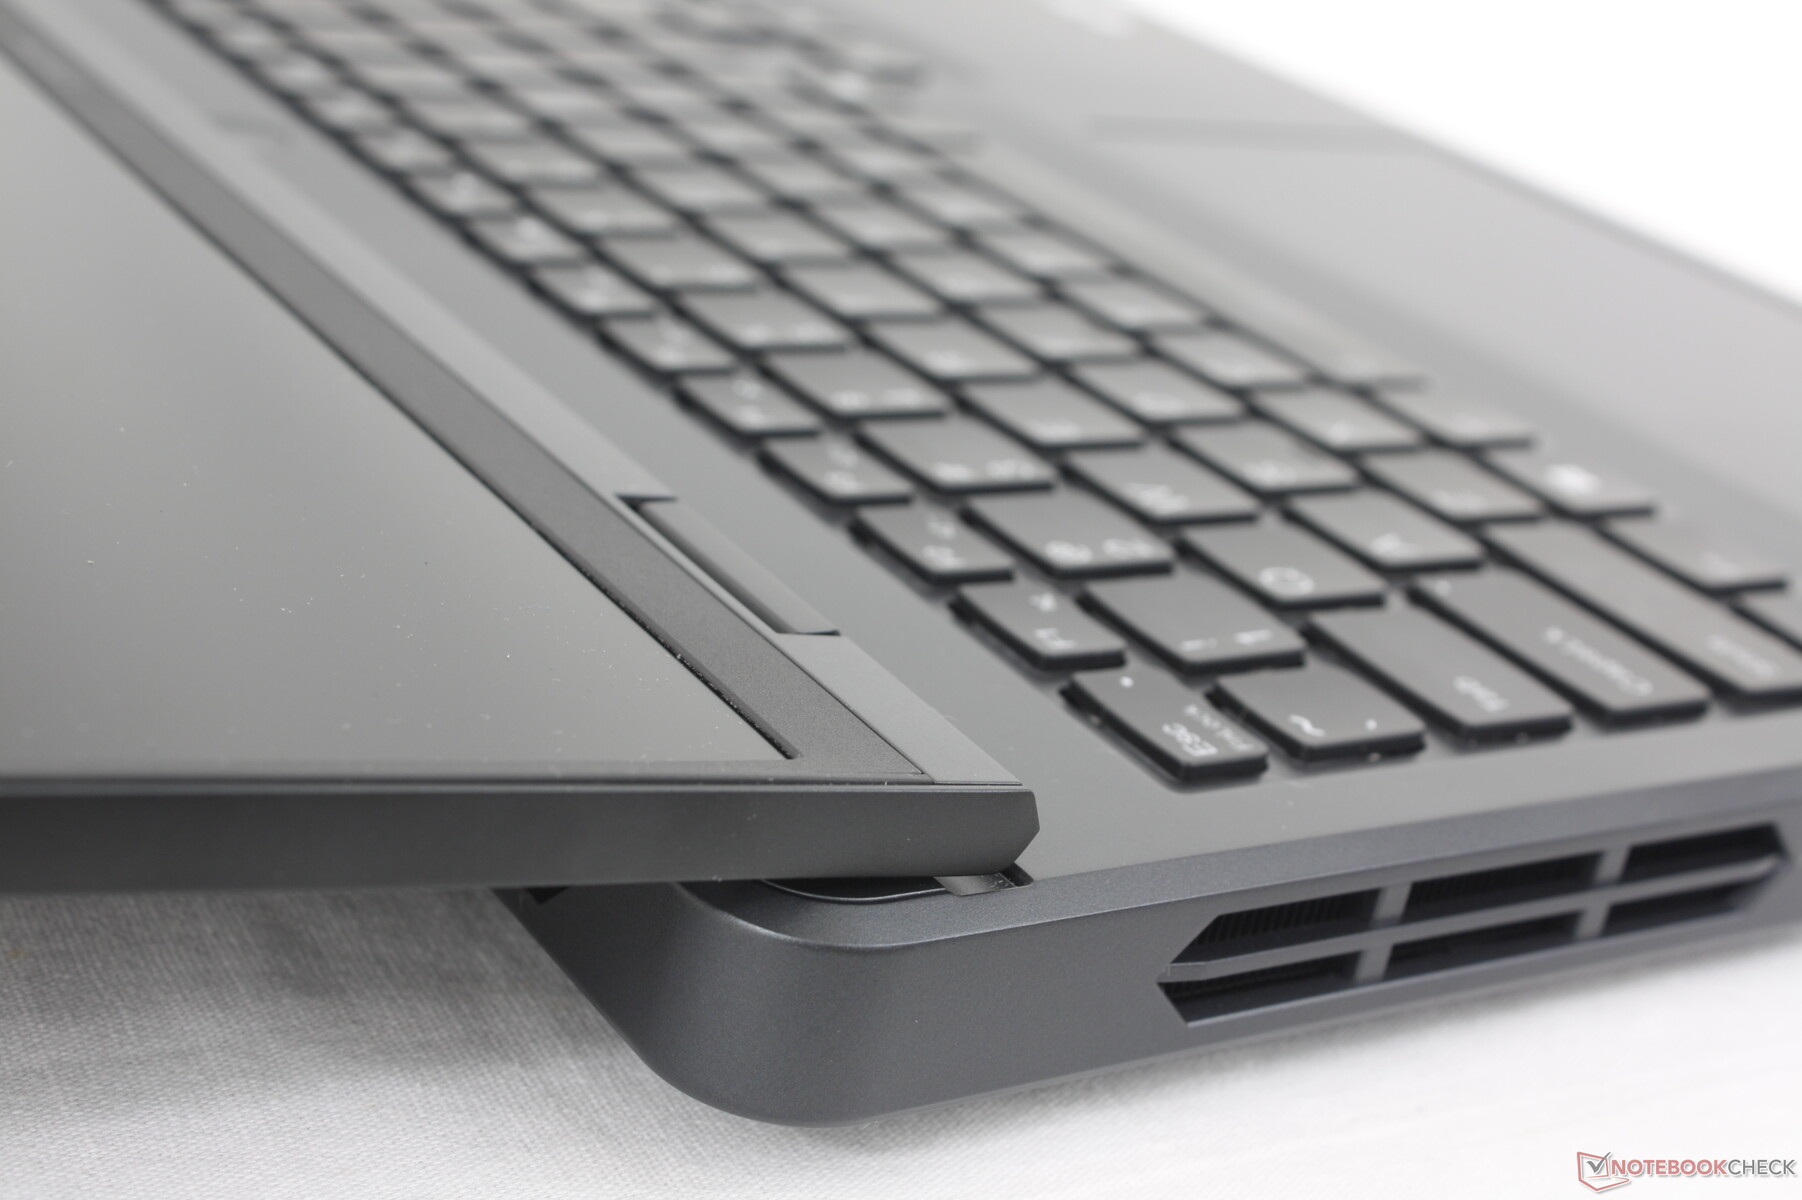
Lenovo använder liknande grå aluminiummaterial i hela sin Legion -serie och Legion Pro 5 16IRX9 är inte annorlunda. Nytt för modellen i år är de omdesignade ventilationsgallren längs bottenpanelen (D-sidan) som nu är förlängda hexagoner istället för rektanglar. Förändringen är övervägande ytlig och resten av chassit är i övrigt detsamma som Legion Pro 5 16IRX8.

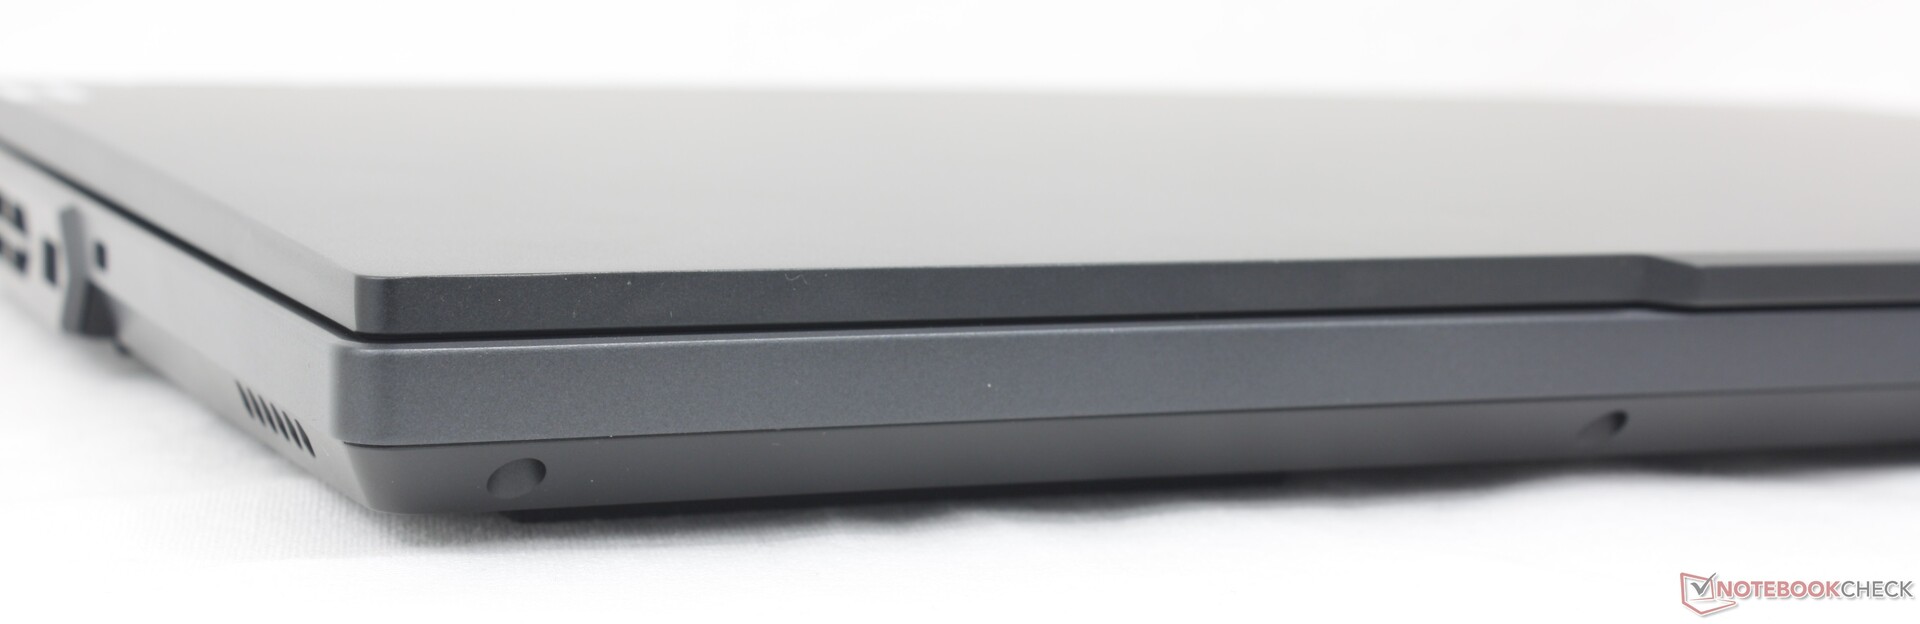
Legion Pro 5 16 är fortfarande en av de största och tyngsta 16-tums gaming-laptops med över 600 gram i vissa fall. Den större storleken är dock inte bortkastad eftersom Lenovo levereras med korrekta Core-HX-seriens processorer medan mindre och lättare alternativ som Alienware m16 R2 kan levereras med långsammare Core Ultra-processorer istället.
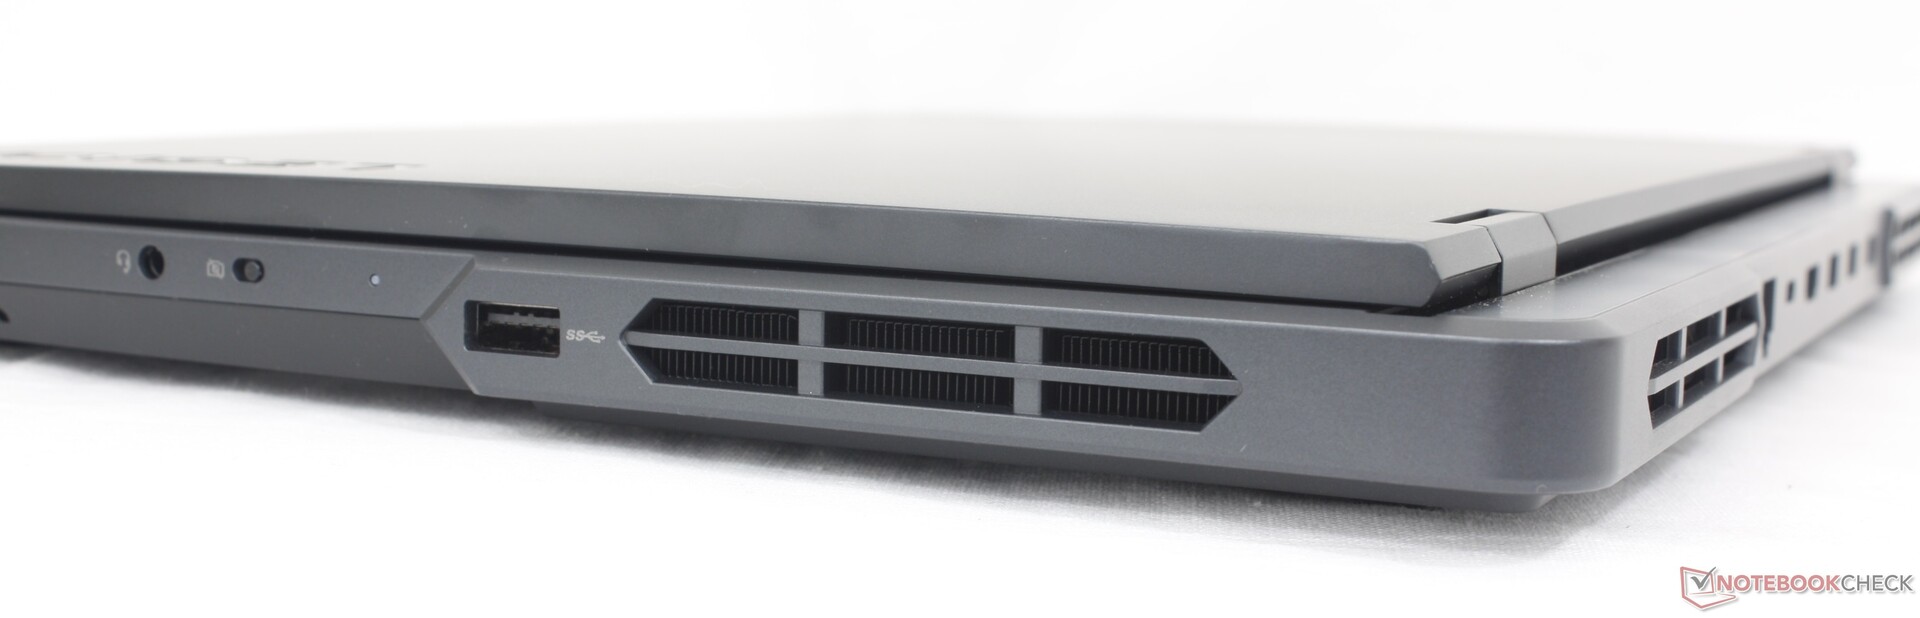
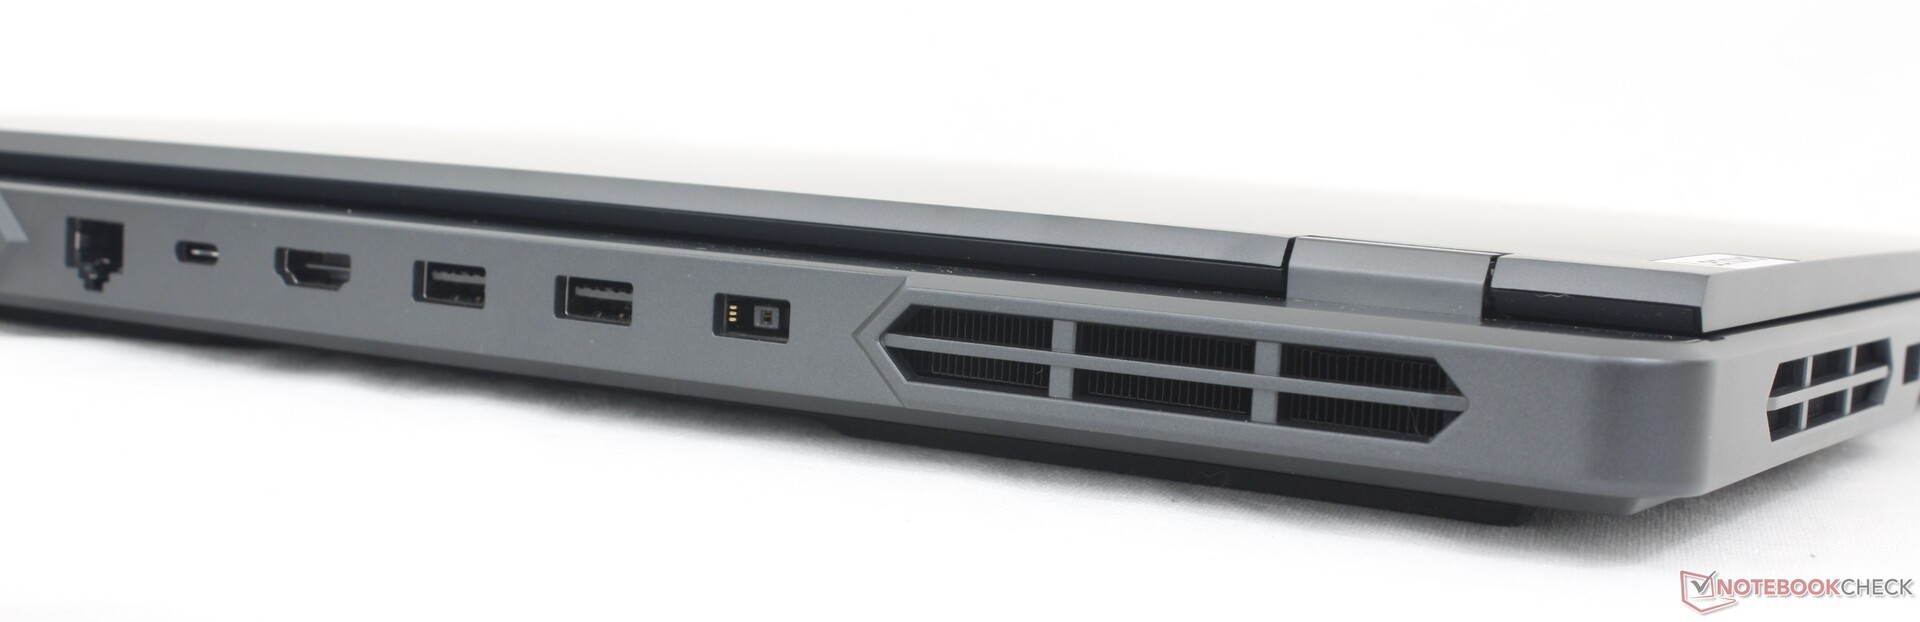
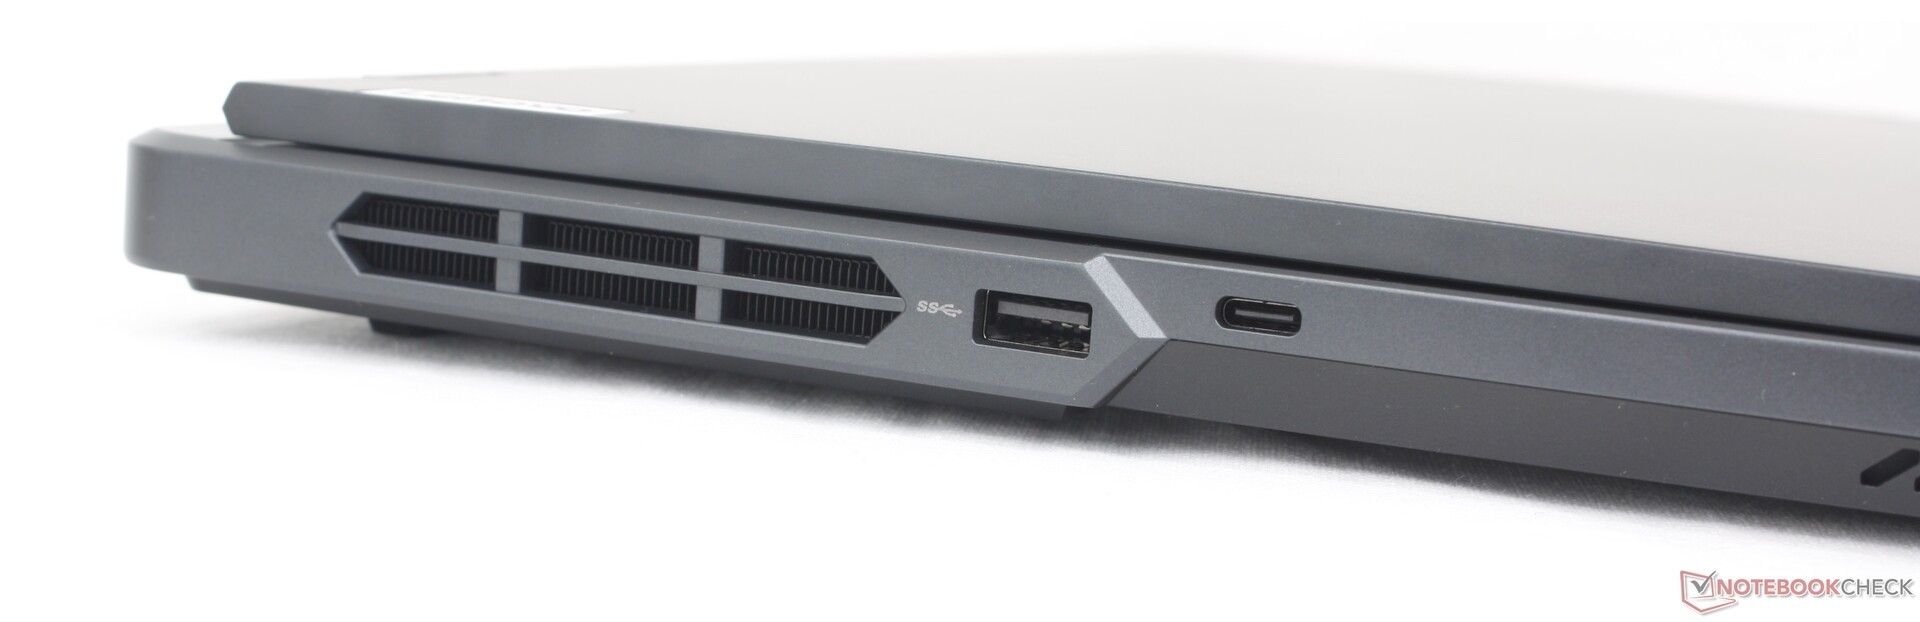
Anslutningsmöjligheter
Portalternativen är fortsatt konkurrenskraftiga, även om avsaknaden av en integrerad SD-kortläsare kan irritera vissa innehållsskapare. De tryckta portsymbolerna längs det termiska däcket gör det mycket lättare att visuellt identifiera de bakre portarna jämfört med bärbara datorer som Alienware m16 R2 eller HP Omen Transcend 16. Symbolerna är dock inte upplysta till skillnad från på Legion Pro 7-serien.
Medan bärbara datorer med stöd för Thunderbolt 5 först nu börjar komma ut på marknaden, är Legion Pro 5 16 fortfarande endast utrustad med Thunderbolt 4.
Kommunikation
En Intel AX211 är standard för Wi-Fi 6E och Bluetooth 5.2-anslutning. Vi upplevde inga problem när vi parade ihop den med vår Asus AXE11000 testrouter.
Webbkamera
Medan vår testenhet levereras med en 2 MP webbkamera, kan vissa SKU:er endast ha en 1 MP webbkamera. En elektronisk slutare är standard utan IR-alternativ.


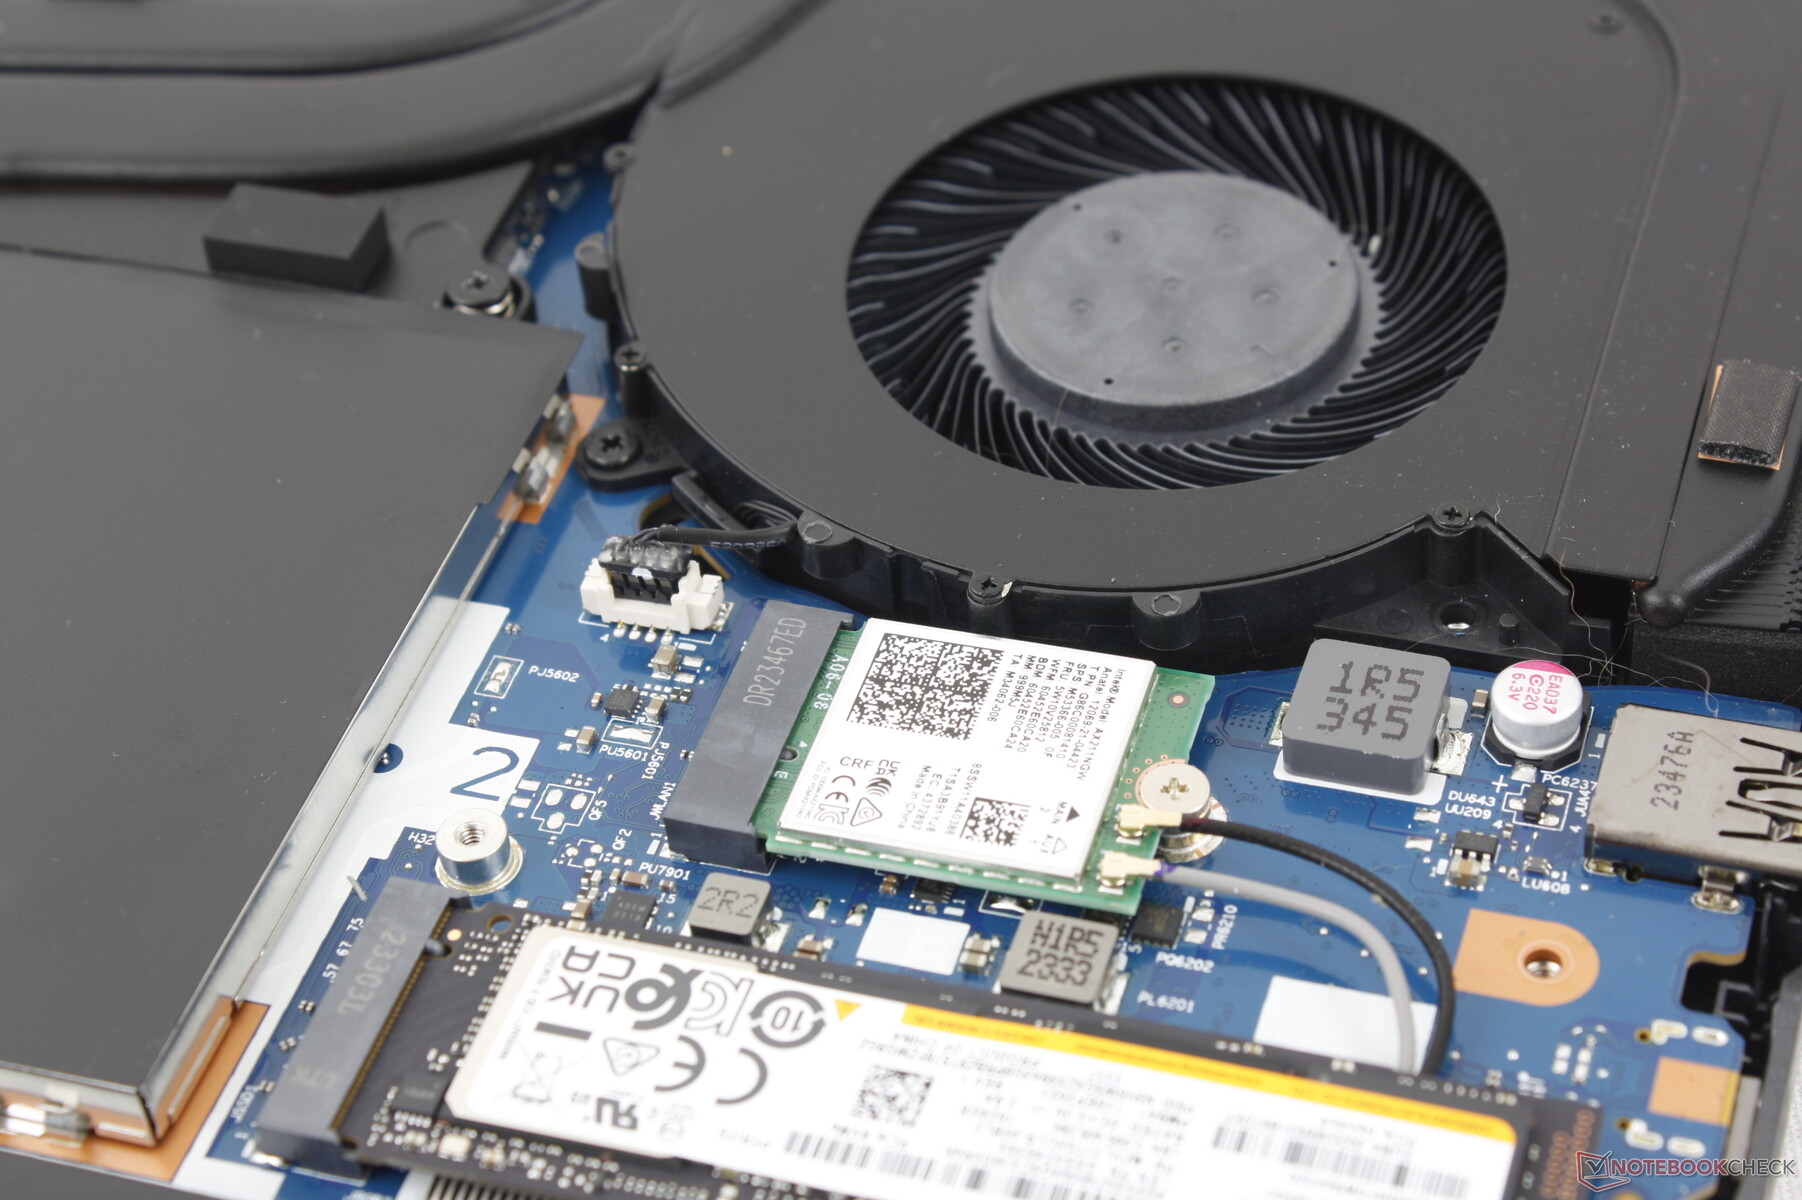
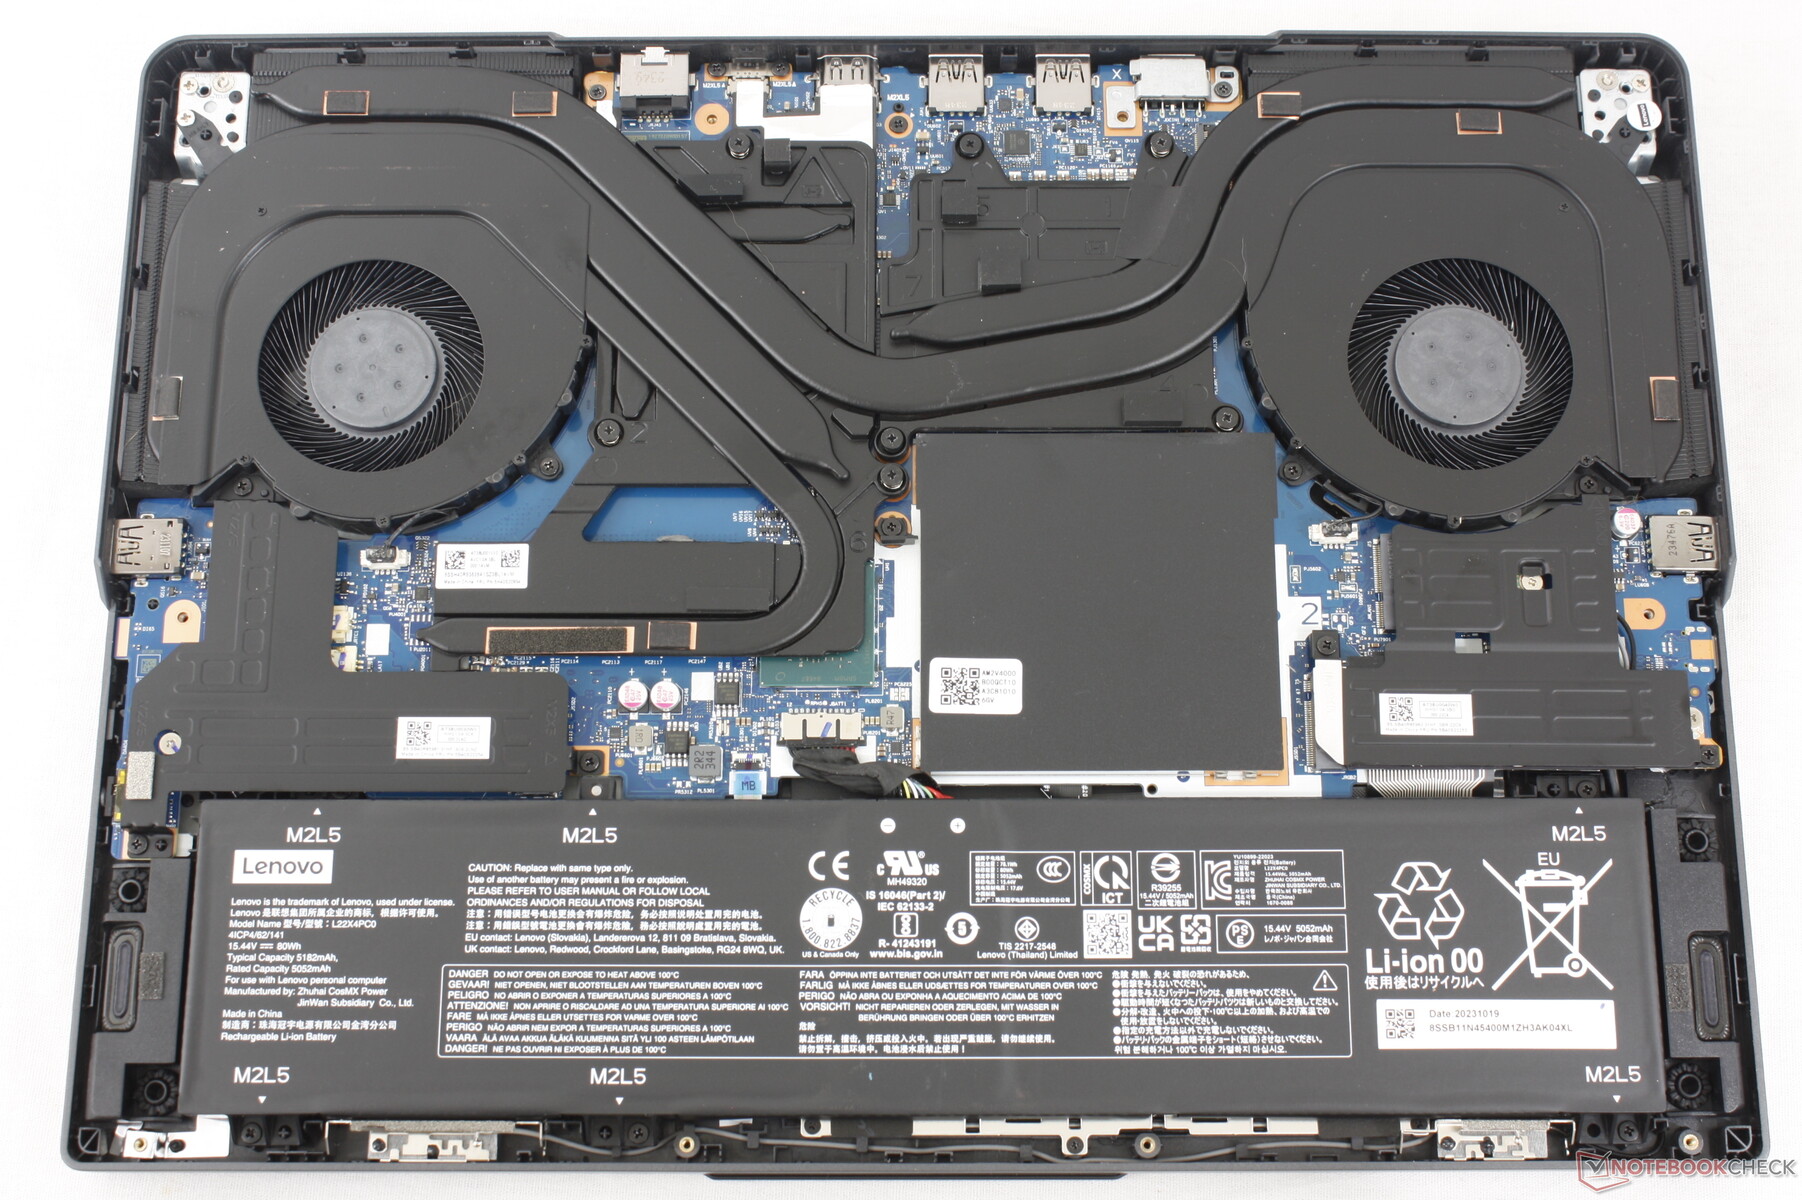
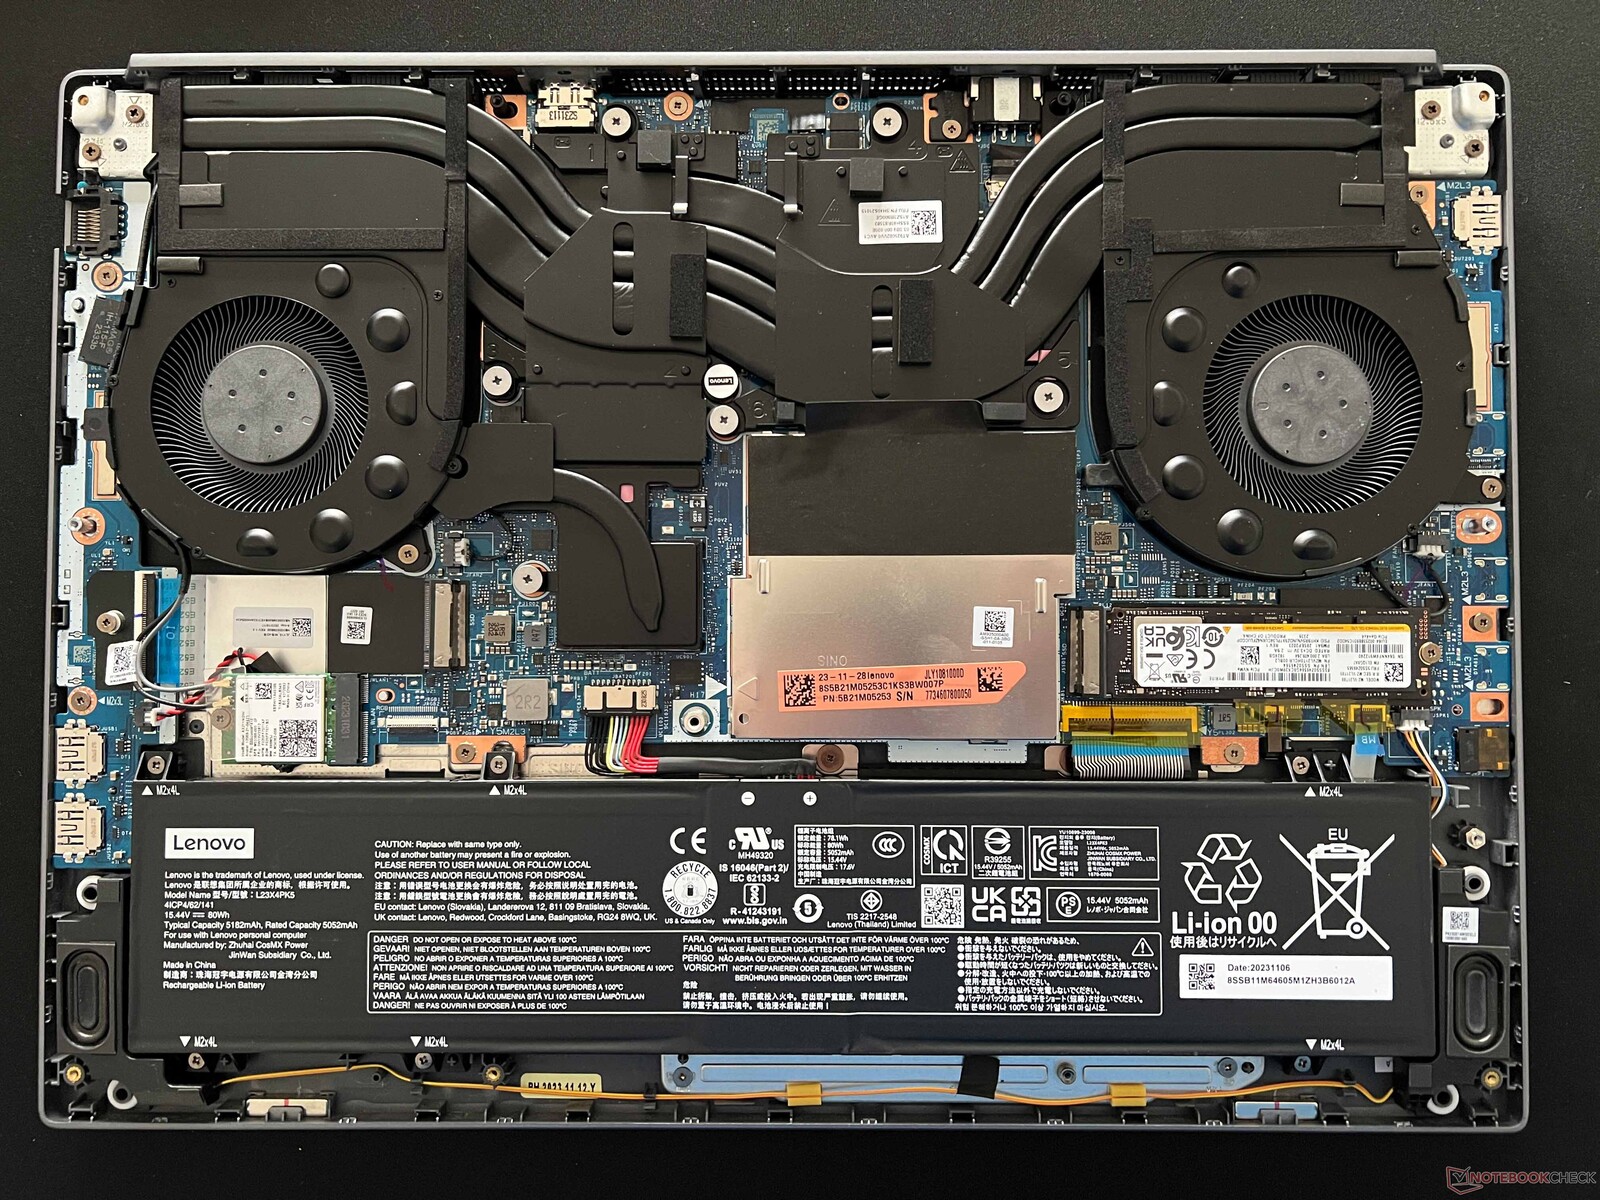
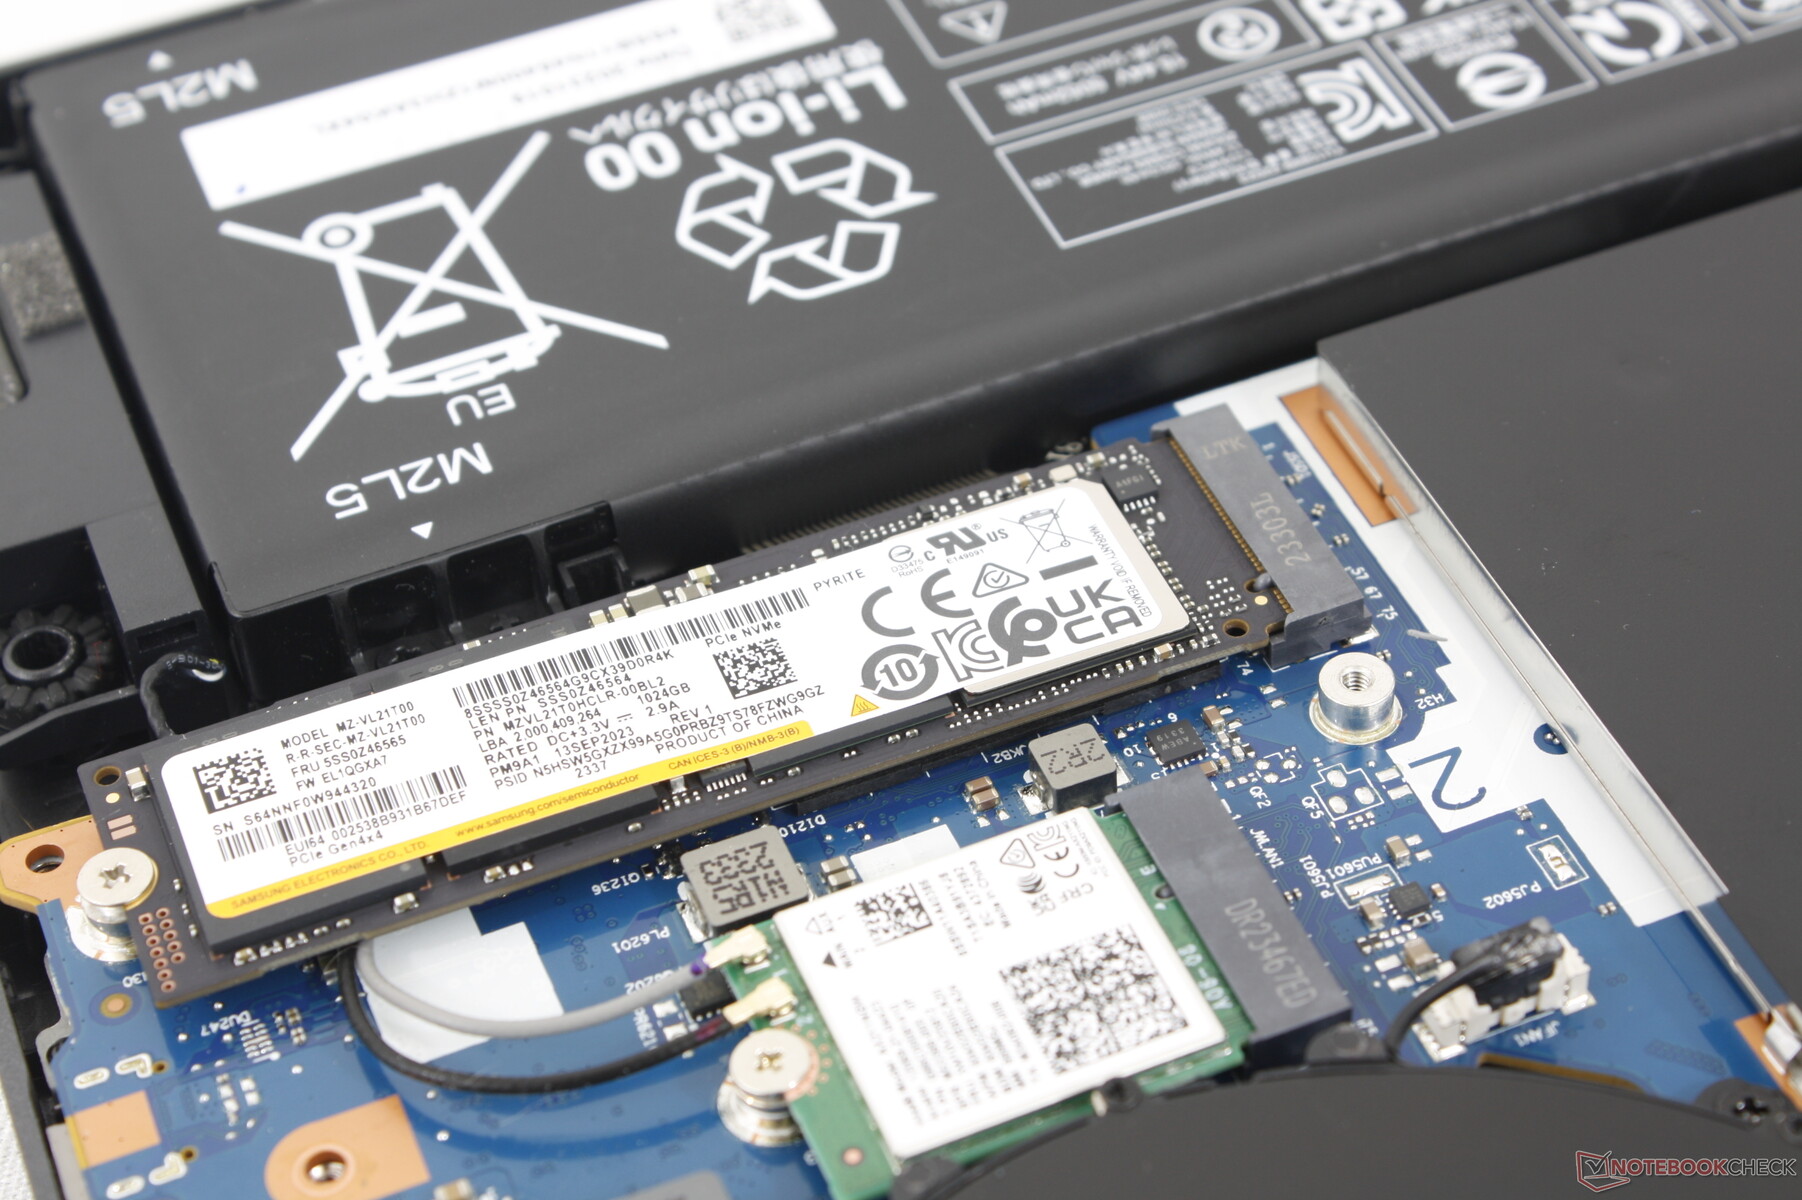
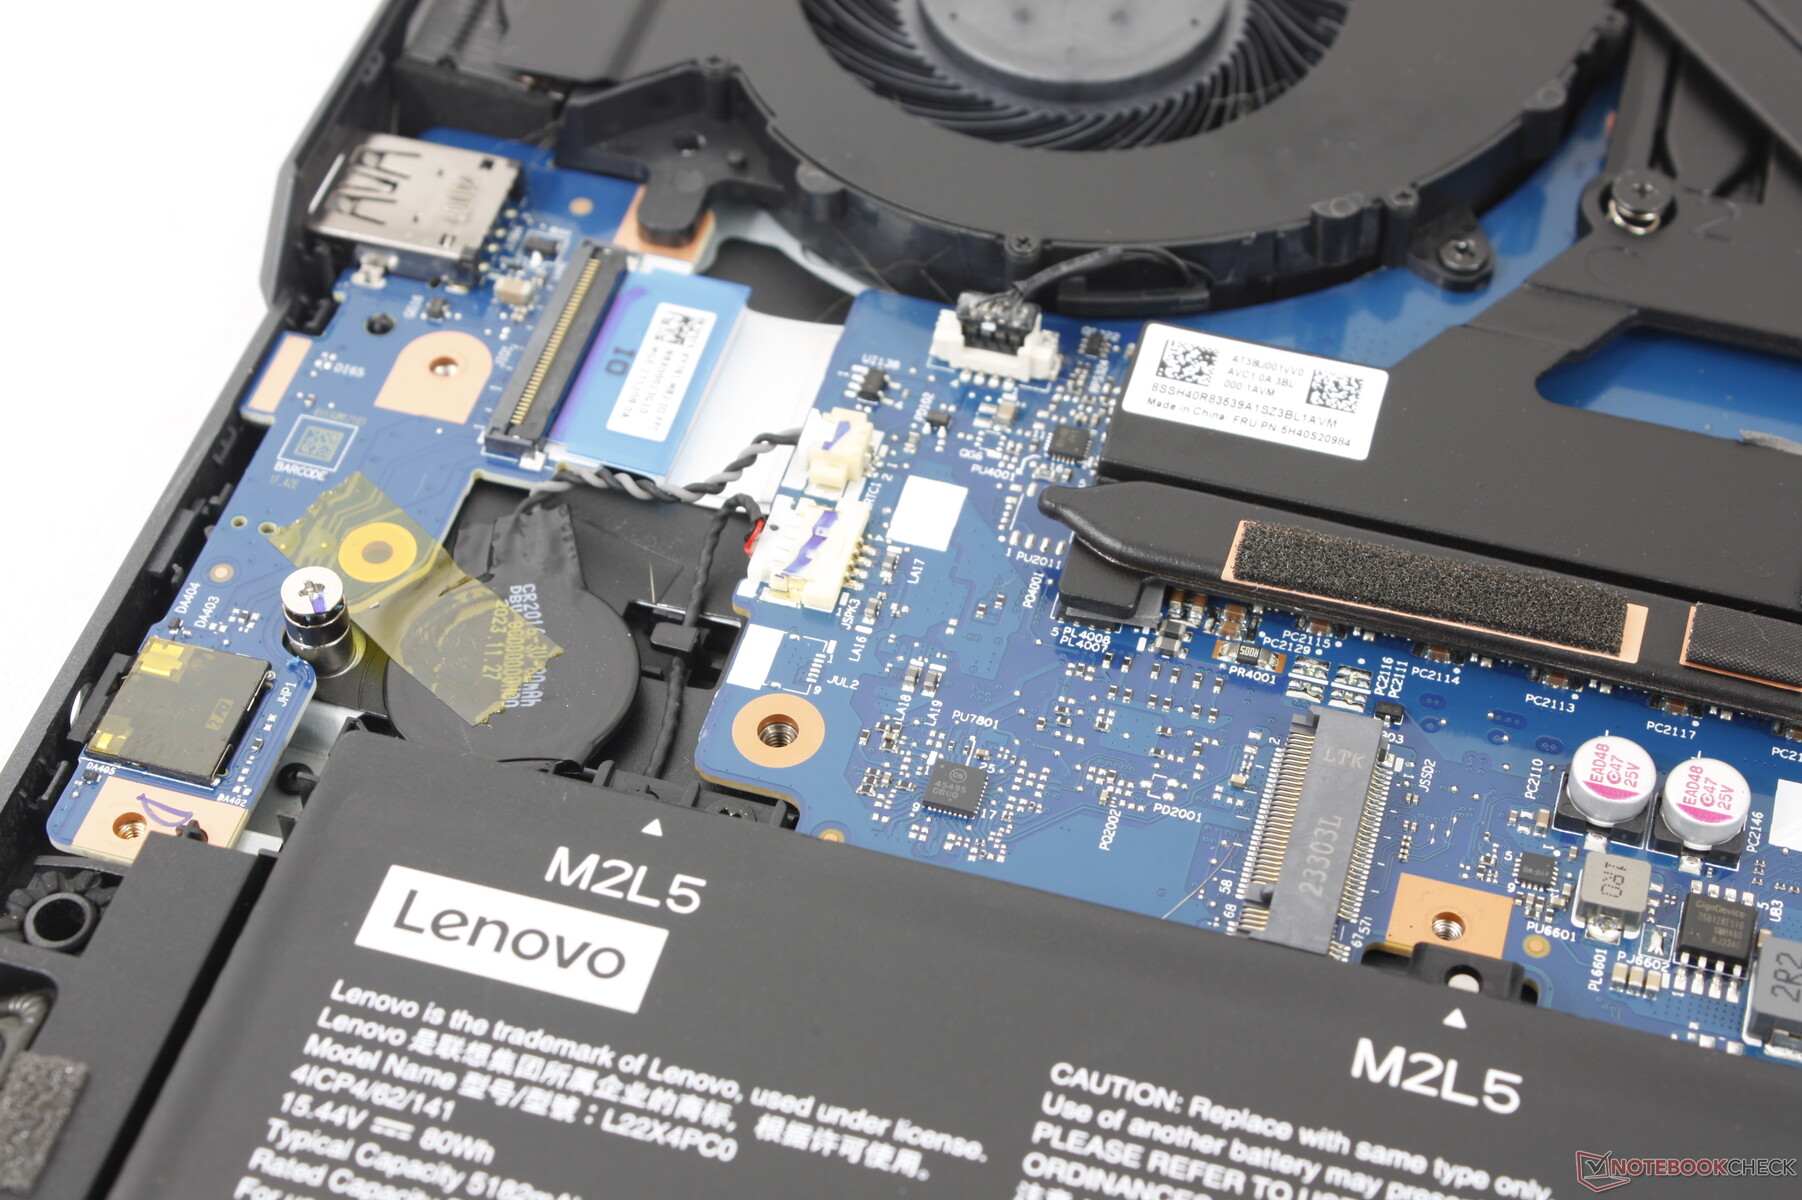
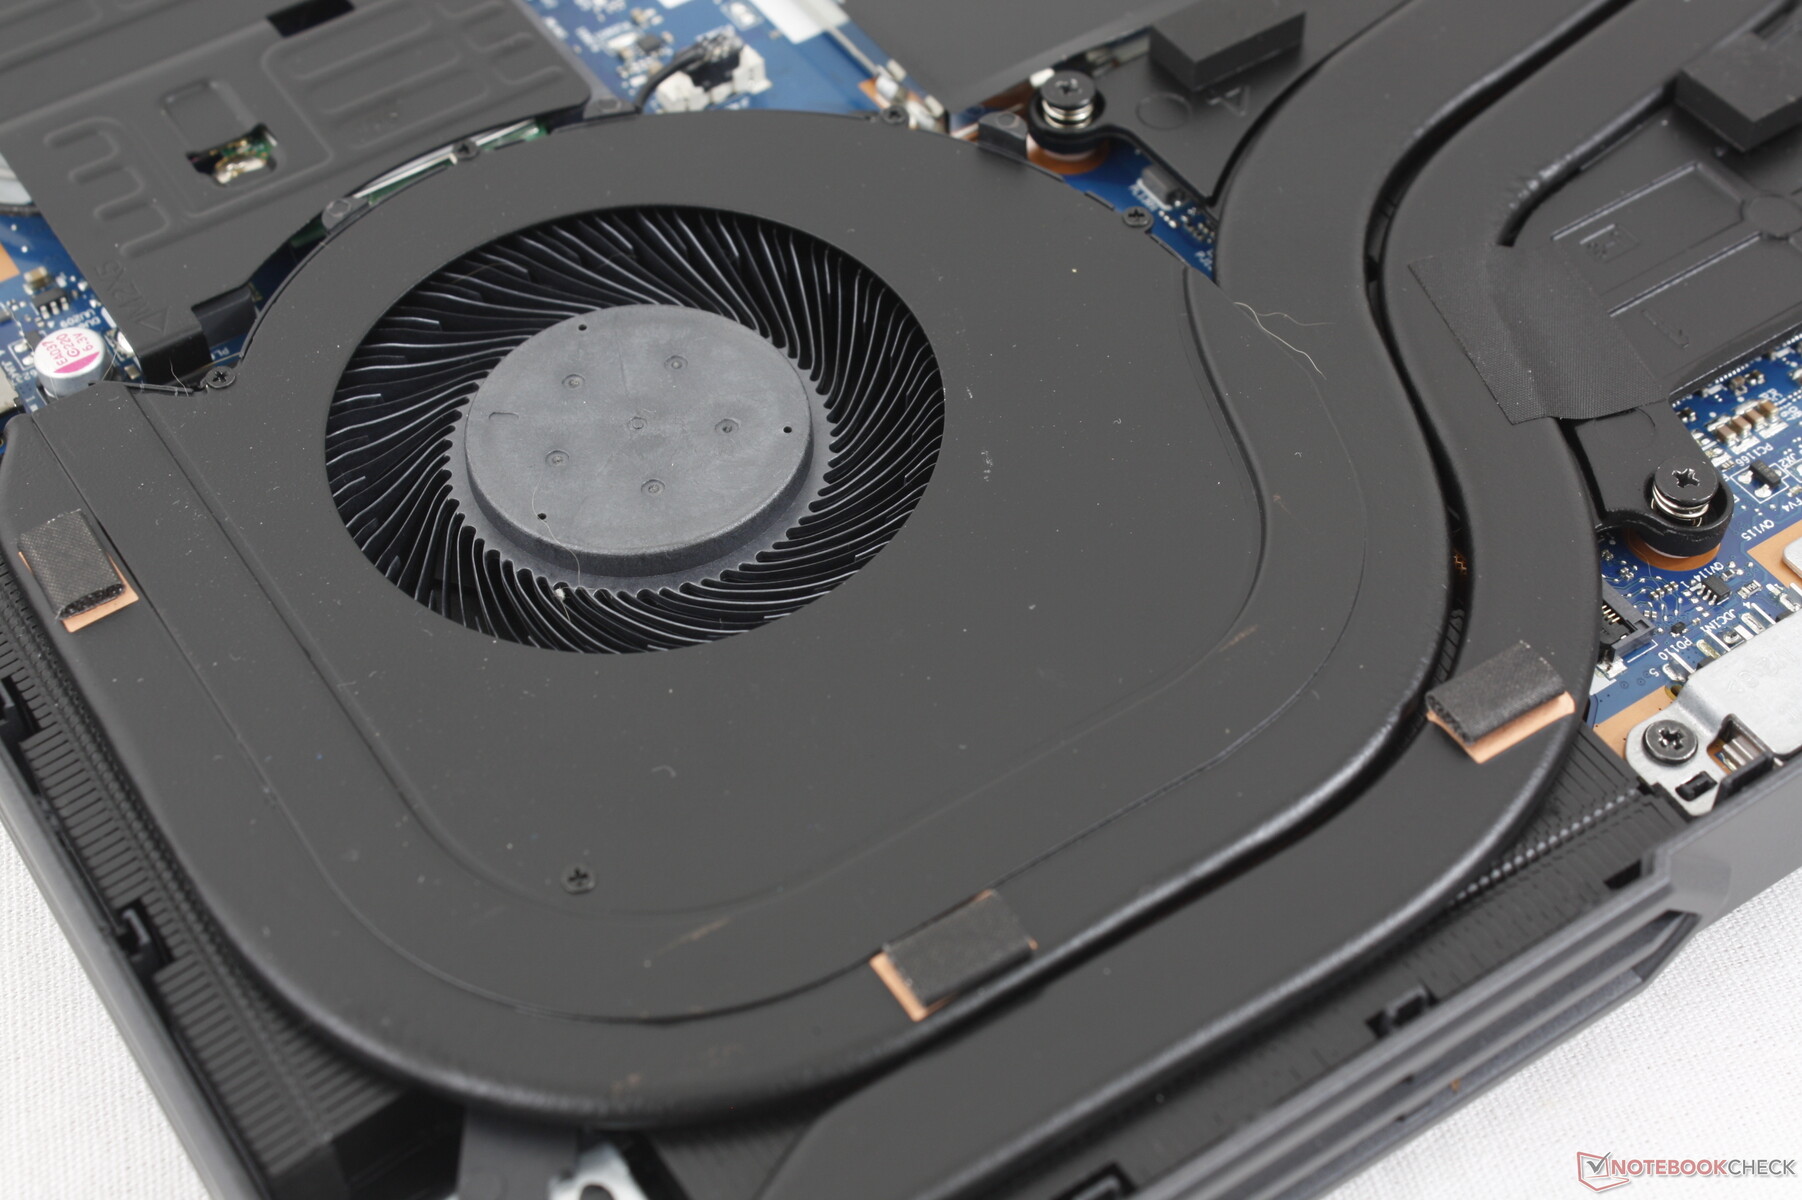
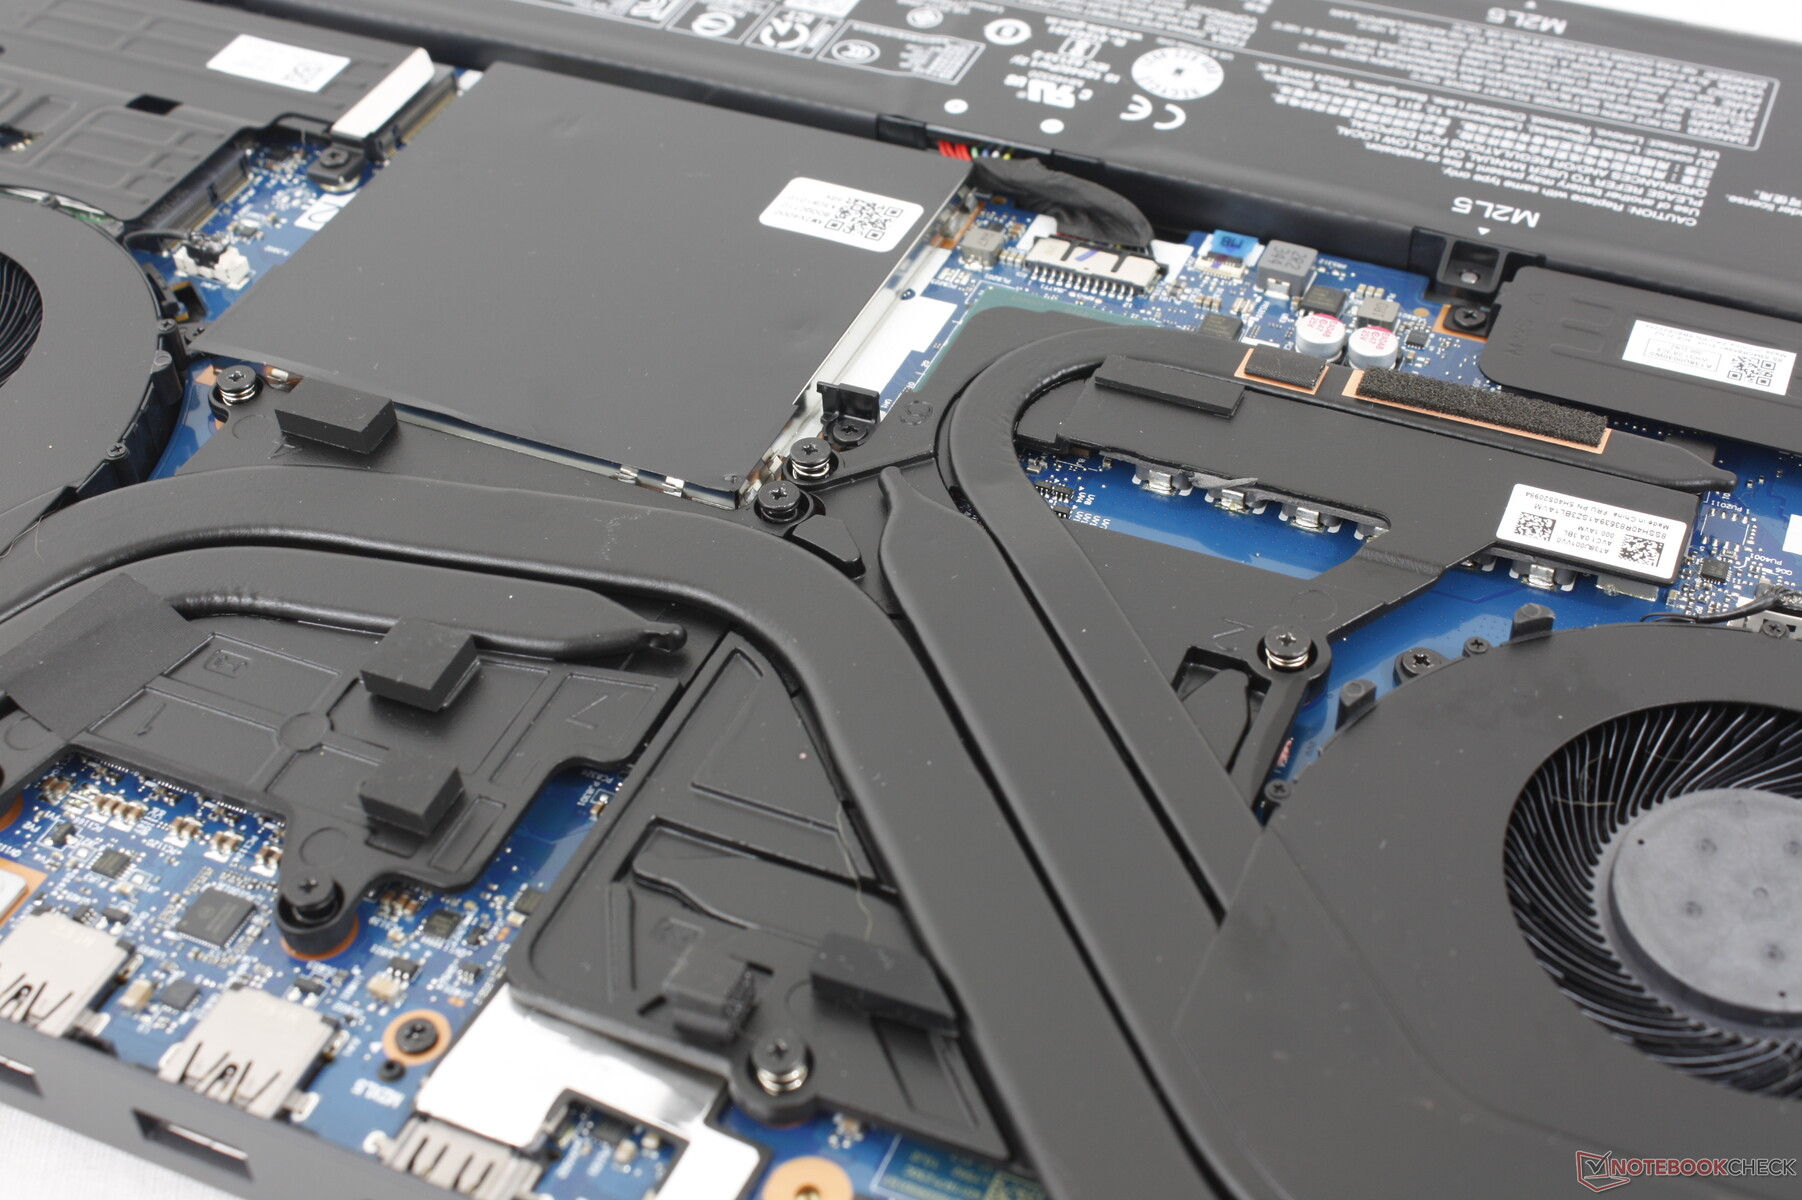
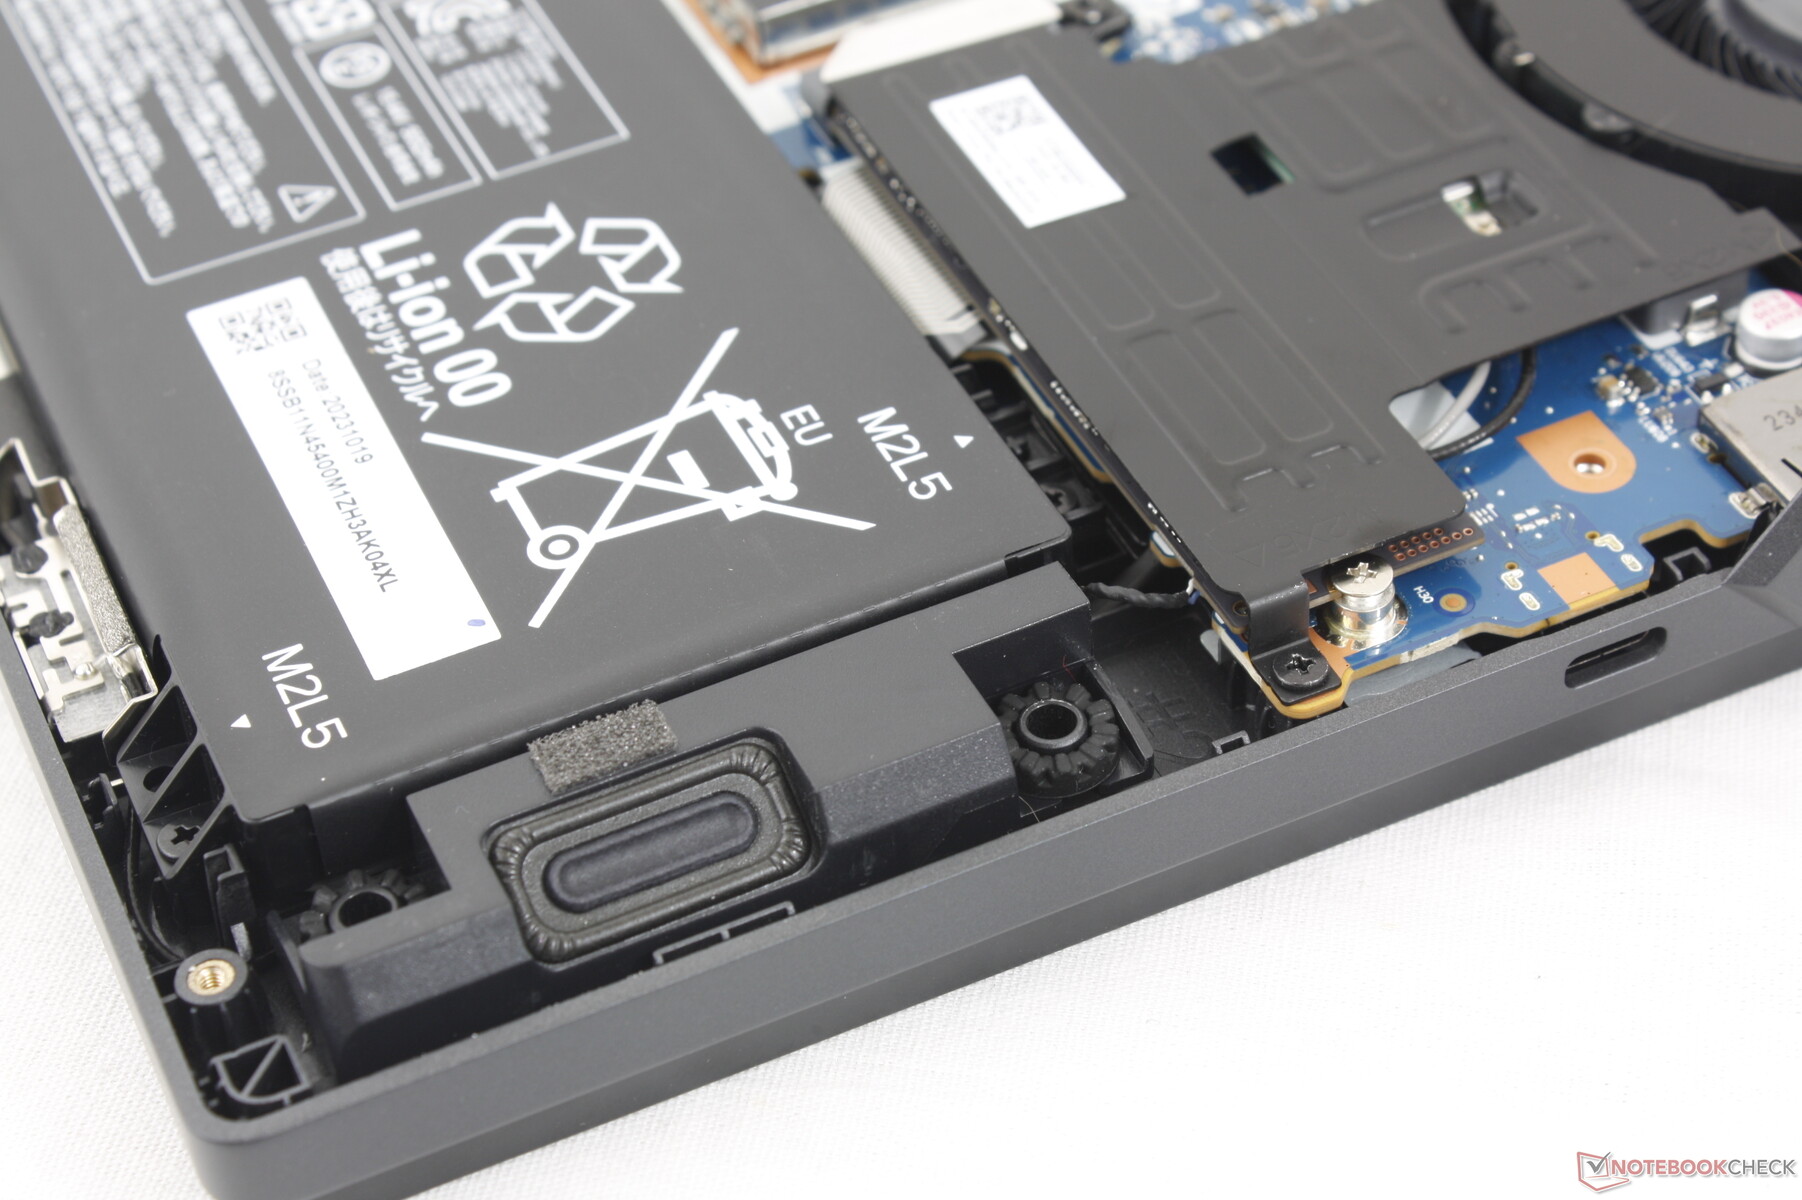
Underhåll
Moderkortet innehåller endast mindre förändringar från förra årets design. WLAN-, RAM- och två SSD-kortplatser är skyddade under ytterligare aluminiumplattor. Intressant nog använder Legion Pro 5 16 färre men tjockare kopparvärmerör än Legion 5 16-designen.
Tillbehör och garanti
Det finns inget extra i förpackningen förutom nätadapter och pappersarbete. Den vanliga ettåriga begränsade tillverkargarantin gäller vid köp i USA.
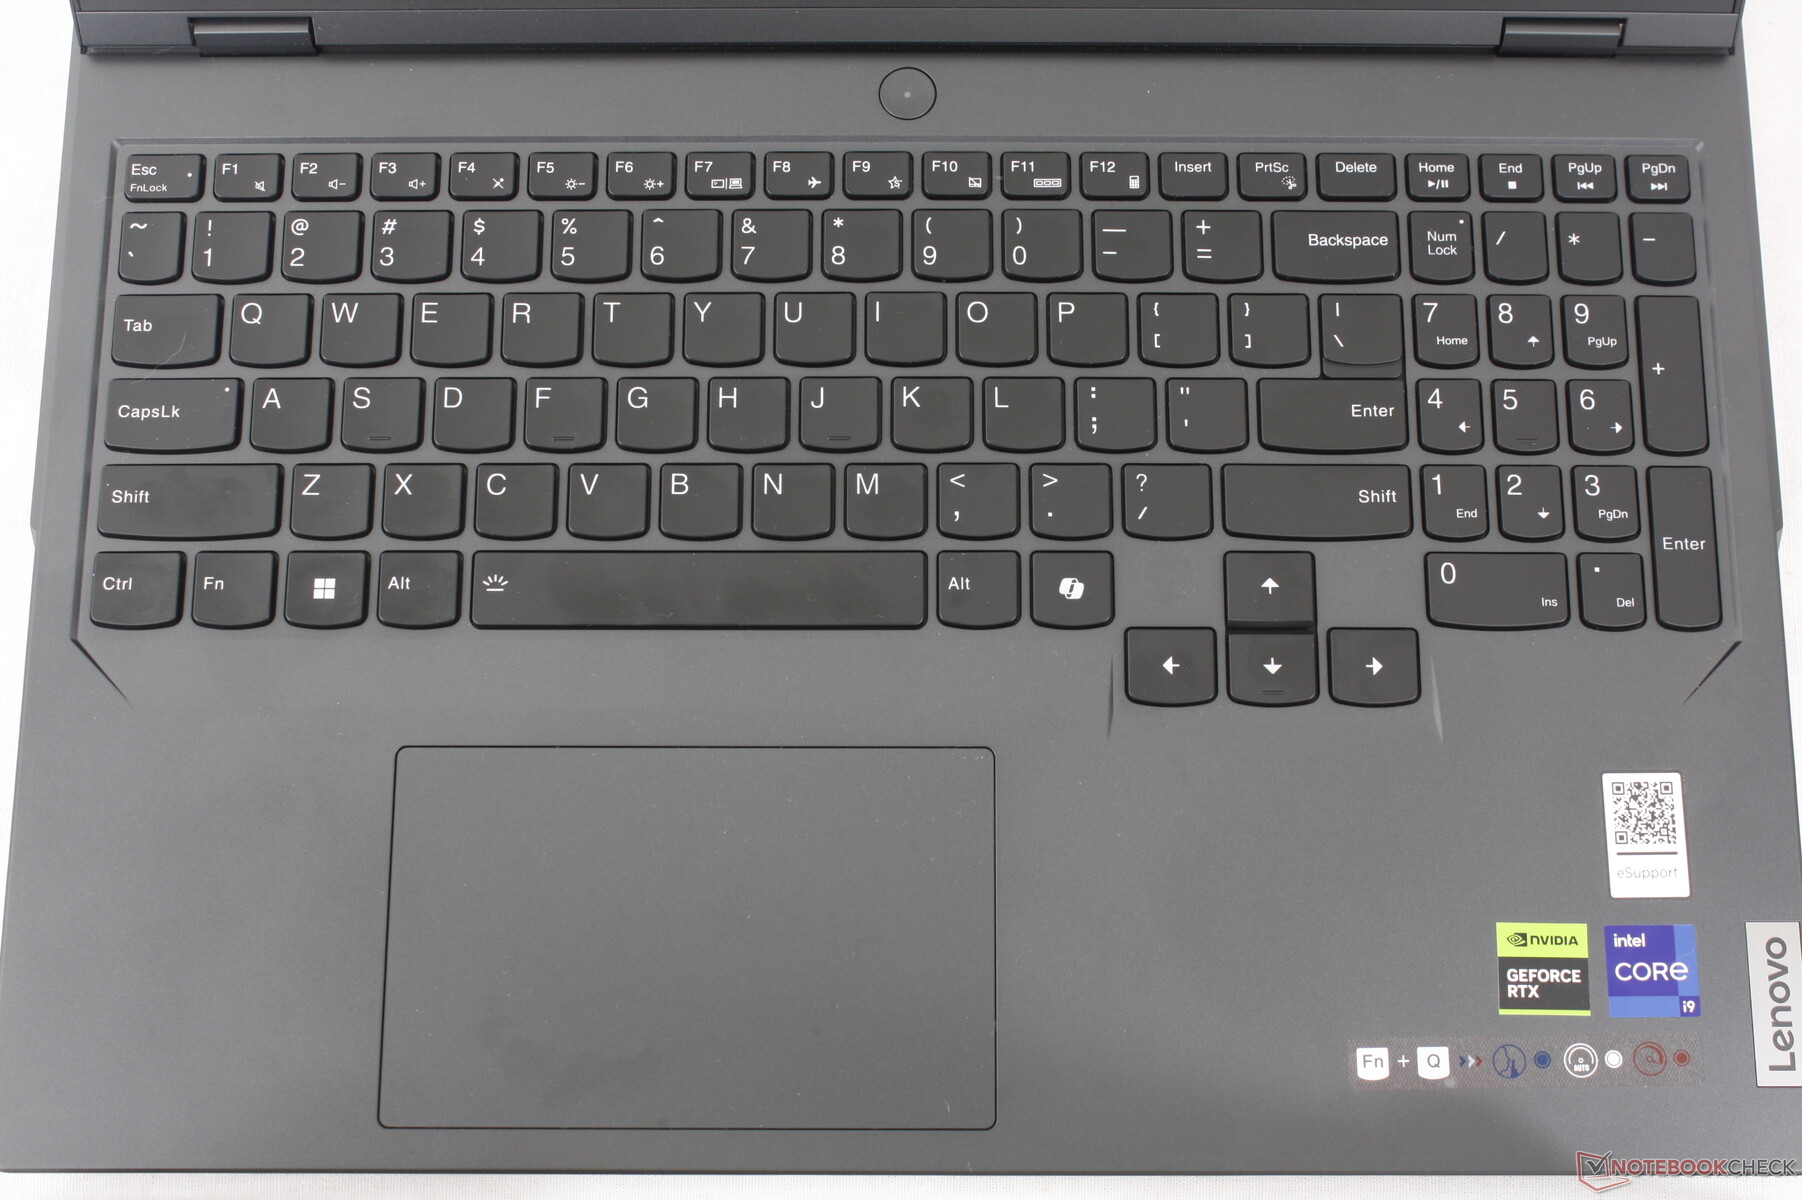
Inmatningsenheter - Kända Legion Erfarenhet
Tangentbord
Precis som på den senaste Yoga Slim 7 14 G9har Legion Pro 5 16 G9 ersatt den andra Ctrl-tangenten med en dedikerad Co-Pilot-tangent. Microsoft förväntas lansera en betydande uppdatering för Windows i år som kretsar kring AI och den nya tangenten är Lenovos sätt att framtidssäkra den bärbara datorn.
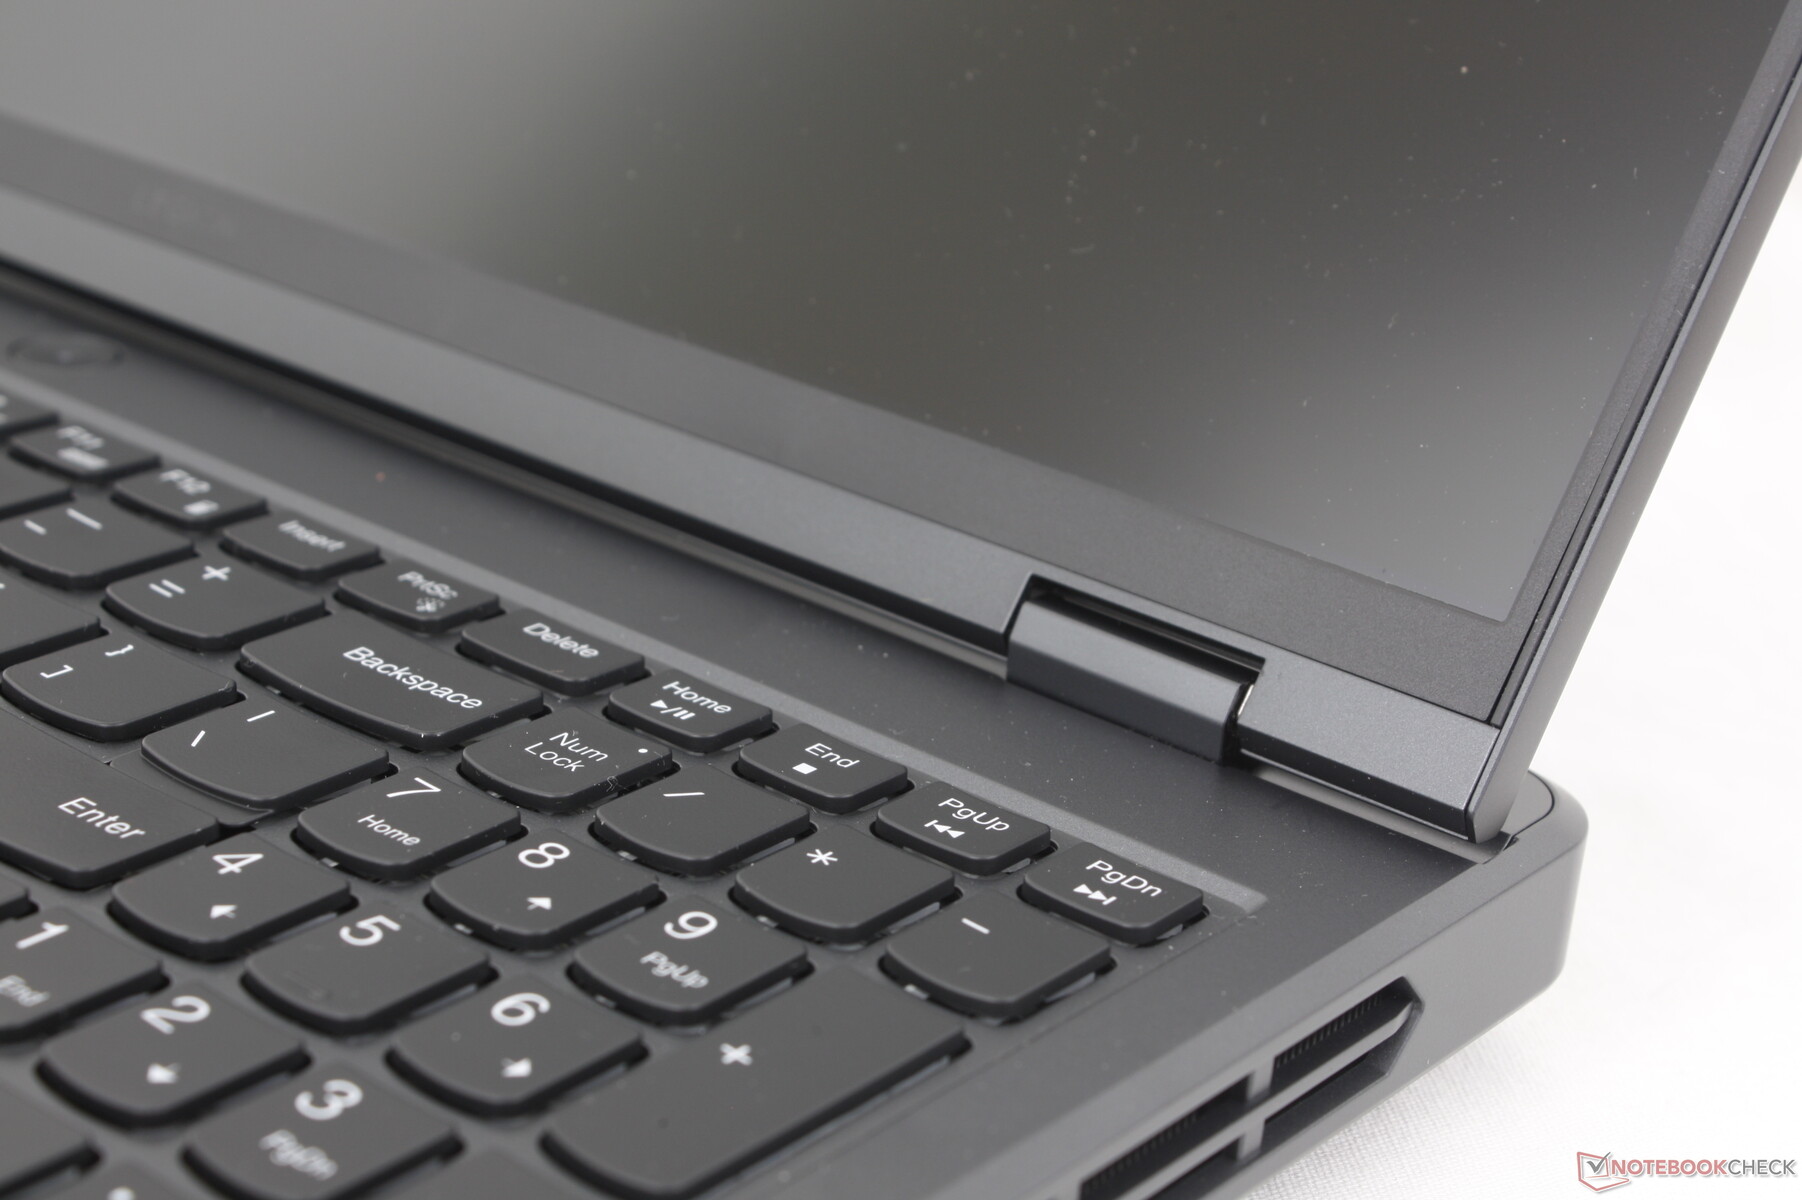
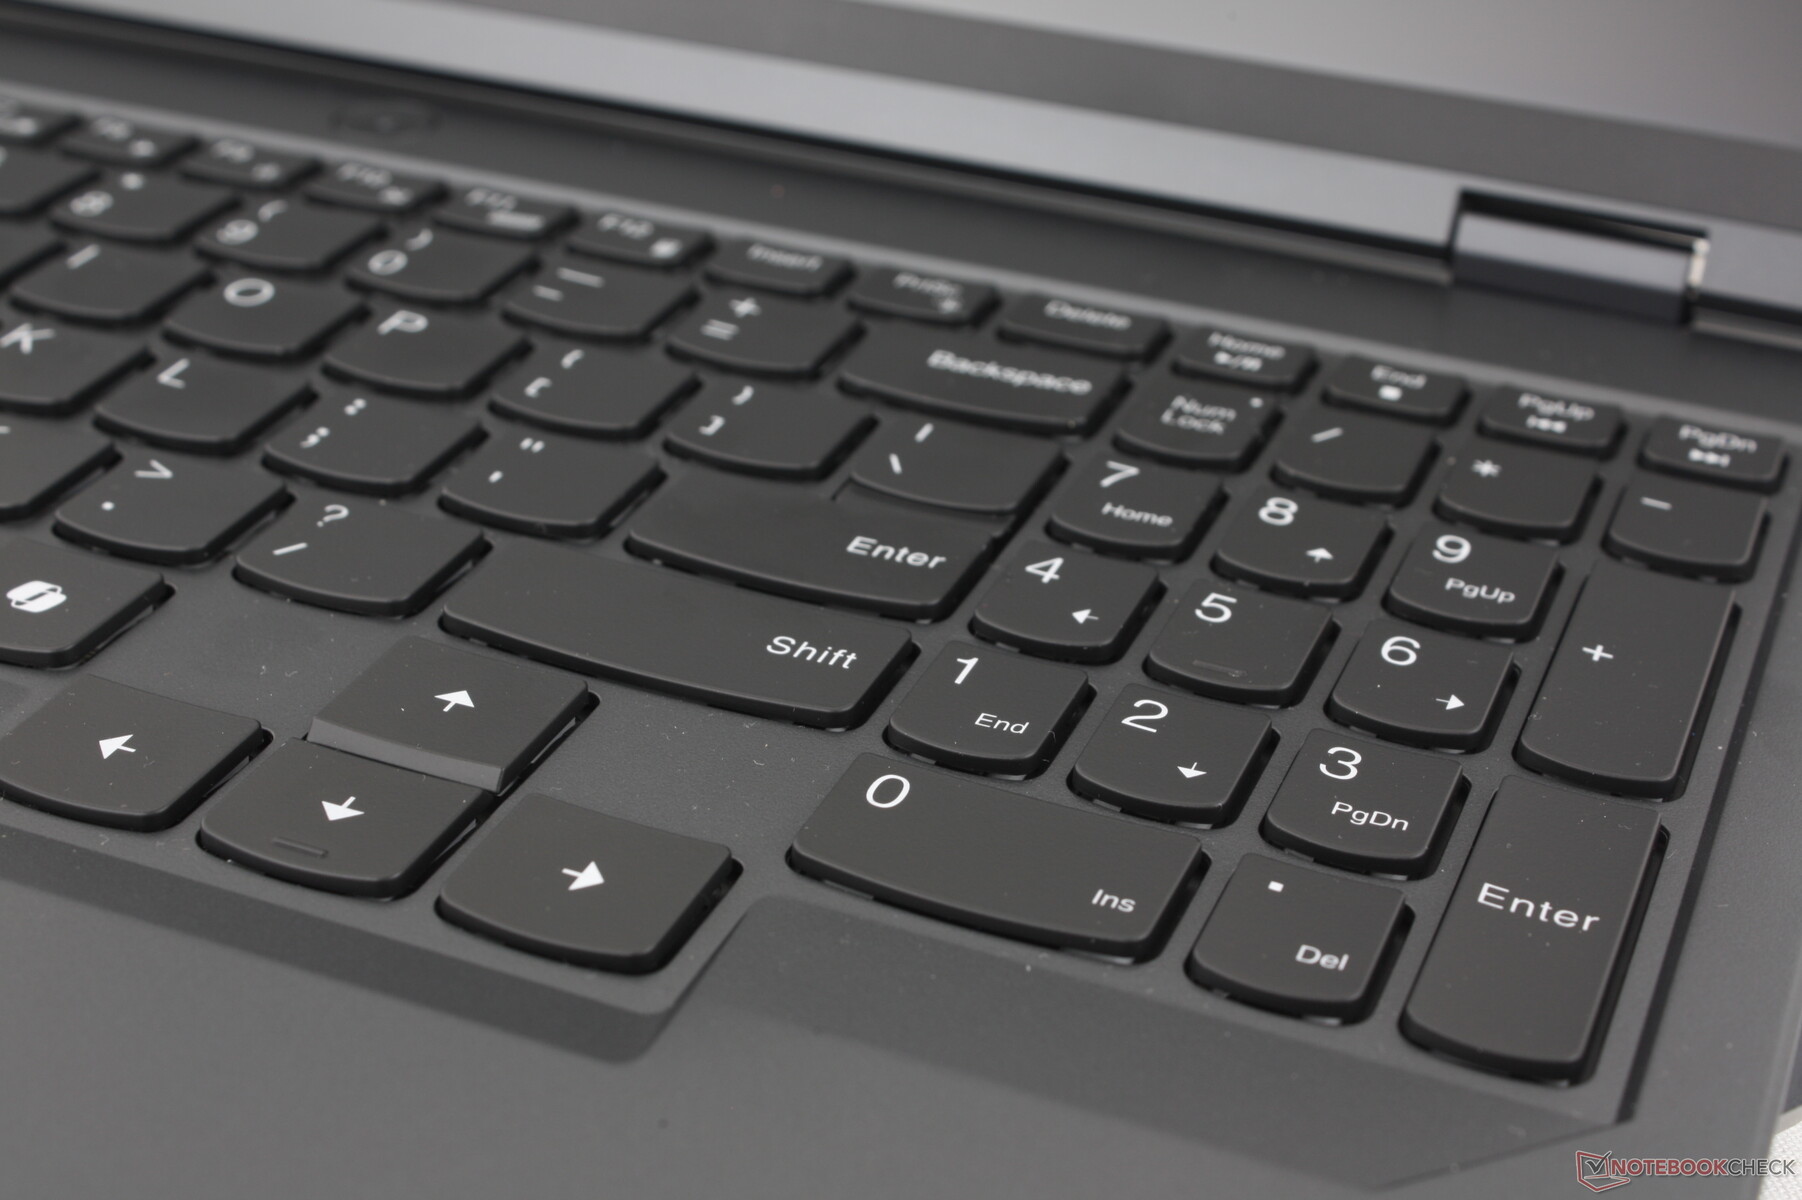
Skrivupplevelsen är i övrigt densamma som på Legion Pro 5 16 G8 eftersom tangentstorlekar och symboler inte har ändrats. Legion -modellerna fortsätter att vara en av få bärbara speldatorer med både en numpad och piltangenter i full storlek.
Tangentbordets bakgrundsbelysning kan konfigureras med antingen single-zone eller quad-zone RGB. För RGB-belysning per tangent måste användare istället överväga den dyrare Legion Pro 7-serien.
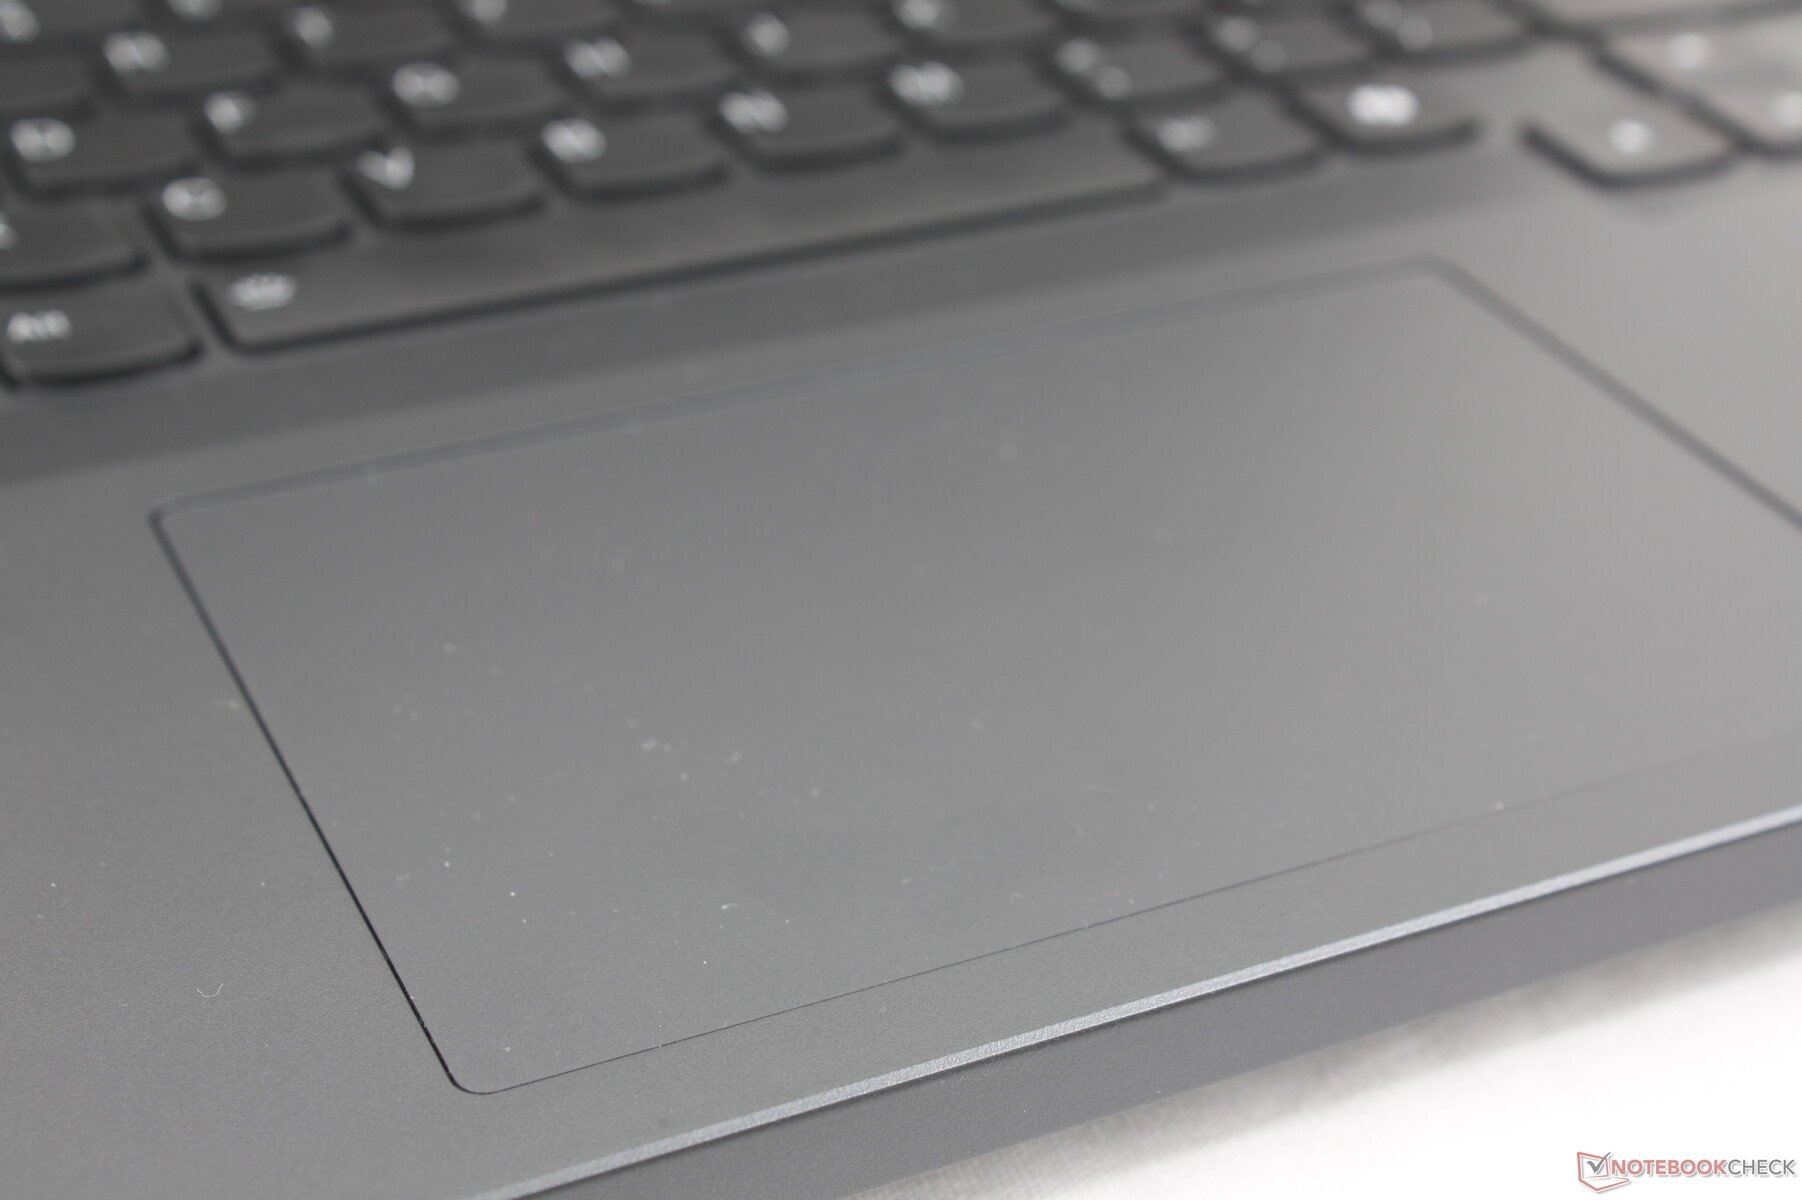
Pekplatta
Mylar-klickplattan är mindre än den på Razer Blade 16 (12 x 7,5 cm jämfört med 17 x 9,7 cm), men den är fortfarande tillräckligt rymlig för enkla uppgifter som surfning. Klickandet fortsätter att vara ytligt och med otillräcklig återkoppling för en otillfredsställande svampig känsla.

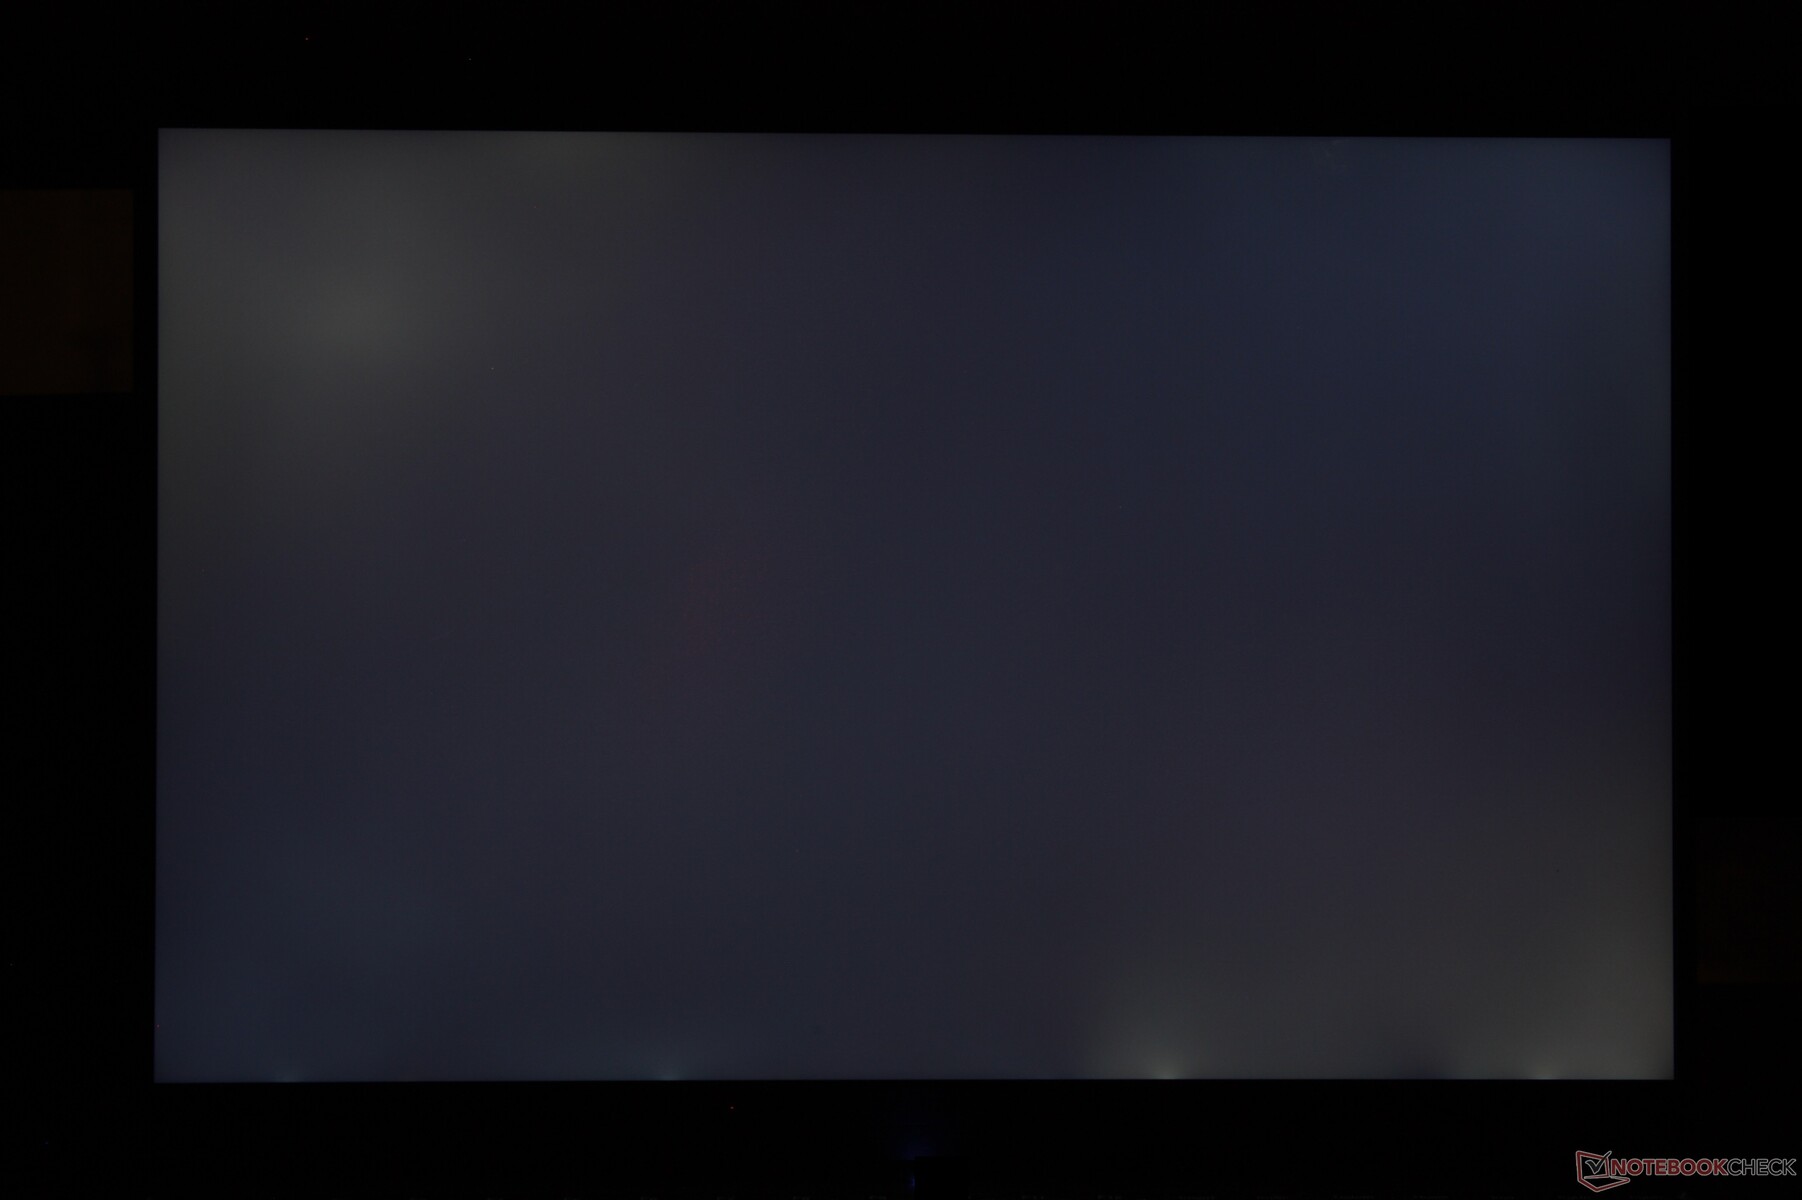
Display - Fullständig sRGB och snabb uppdatering är standard
Tre skärmalternativ är nu tillgängliga medan förra årets modell var begränsad till endast två. Alla är matta IPS med stöd för Advanced Optimus, men endast två har stöd för HDR. Vår testenhet levereras med den panel som markeras nedan.
- 2560 x 1600, 300 nits, 100% sRGB, 165 Hz
- 2560 x 1600, 500 nits, 100% DCI-P3, 240 Hz, HDR400
- 2560 x 1600, 500 nits, 100% sRGB, 240 Hz, HDR400
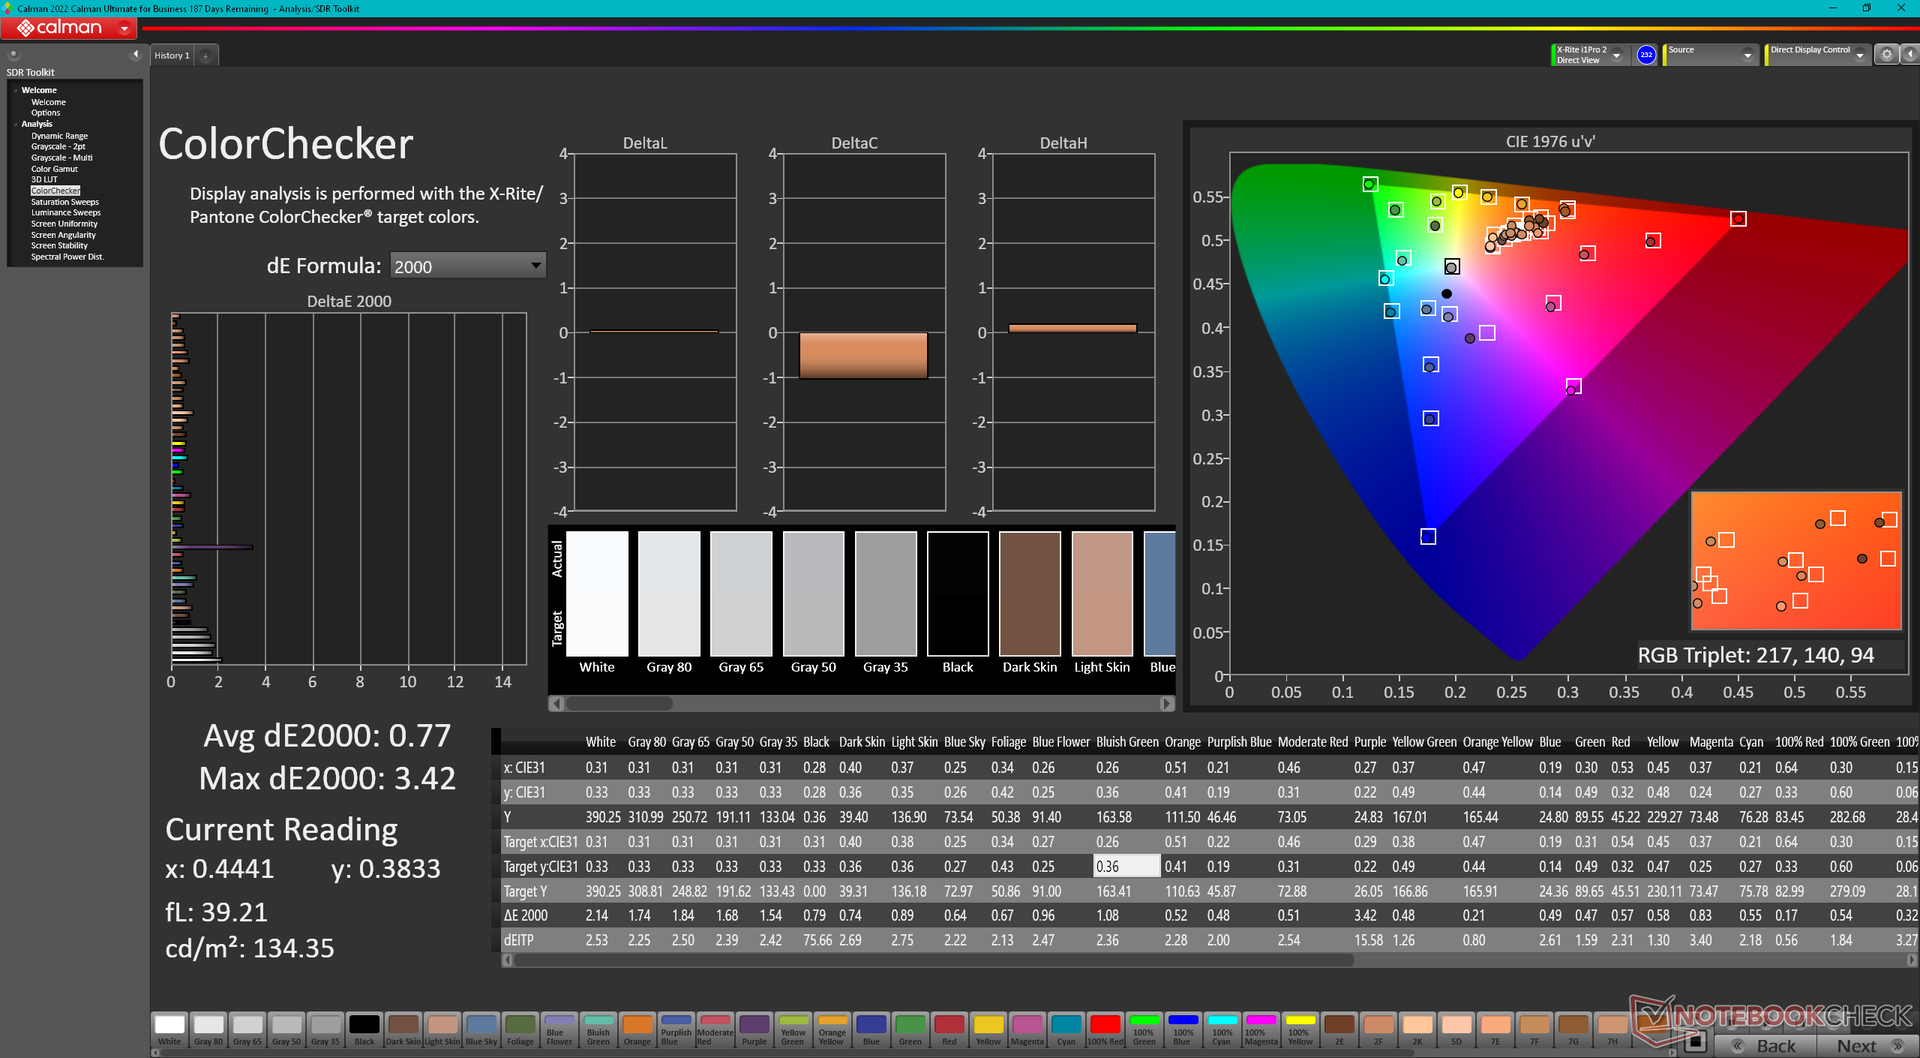
Intressant nog använder vår testenhet BOE NE160QDM-NYC medan förra årets modell kom med AU Optronics B160QAN03.1. Båda erbjuder annars samma 165 Hz uppdateringsfrekvens, snabba svartvita svarstider och fullständiga sRGB-färger för en liknande tittarupplevelse. Även om det fortfarande är en utmärkt panel för spel och enklare redigering saknar den stöd för Windows variabla uppdateringsfrekvens, vilket är en ny funktion på vissa andra bärbara datorer som Framework Laptop 16. Dessutom är HDR på IPS-paneler inte lika imponerande som HDR på OLED eller mini-LED på grund av deras djupare svarta nivåer och ljusare vita nyanser. Användare måste istället uppgradera till den dyrare Legion Pro 9-serien för att få sådana avancerade skärmfunktioner.


| |||||||||||||||||||||||||
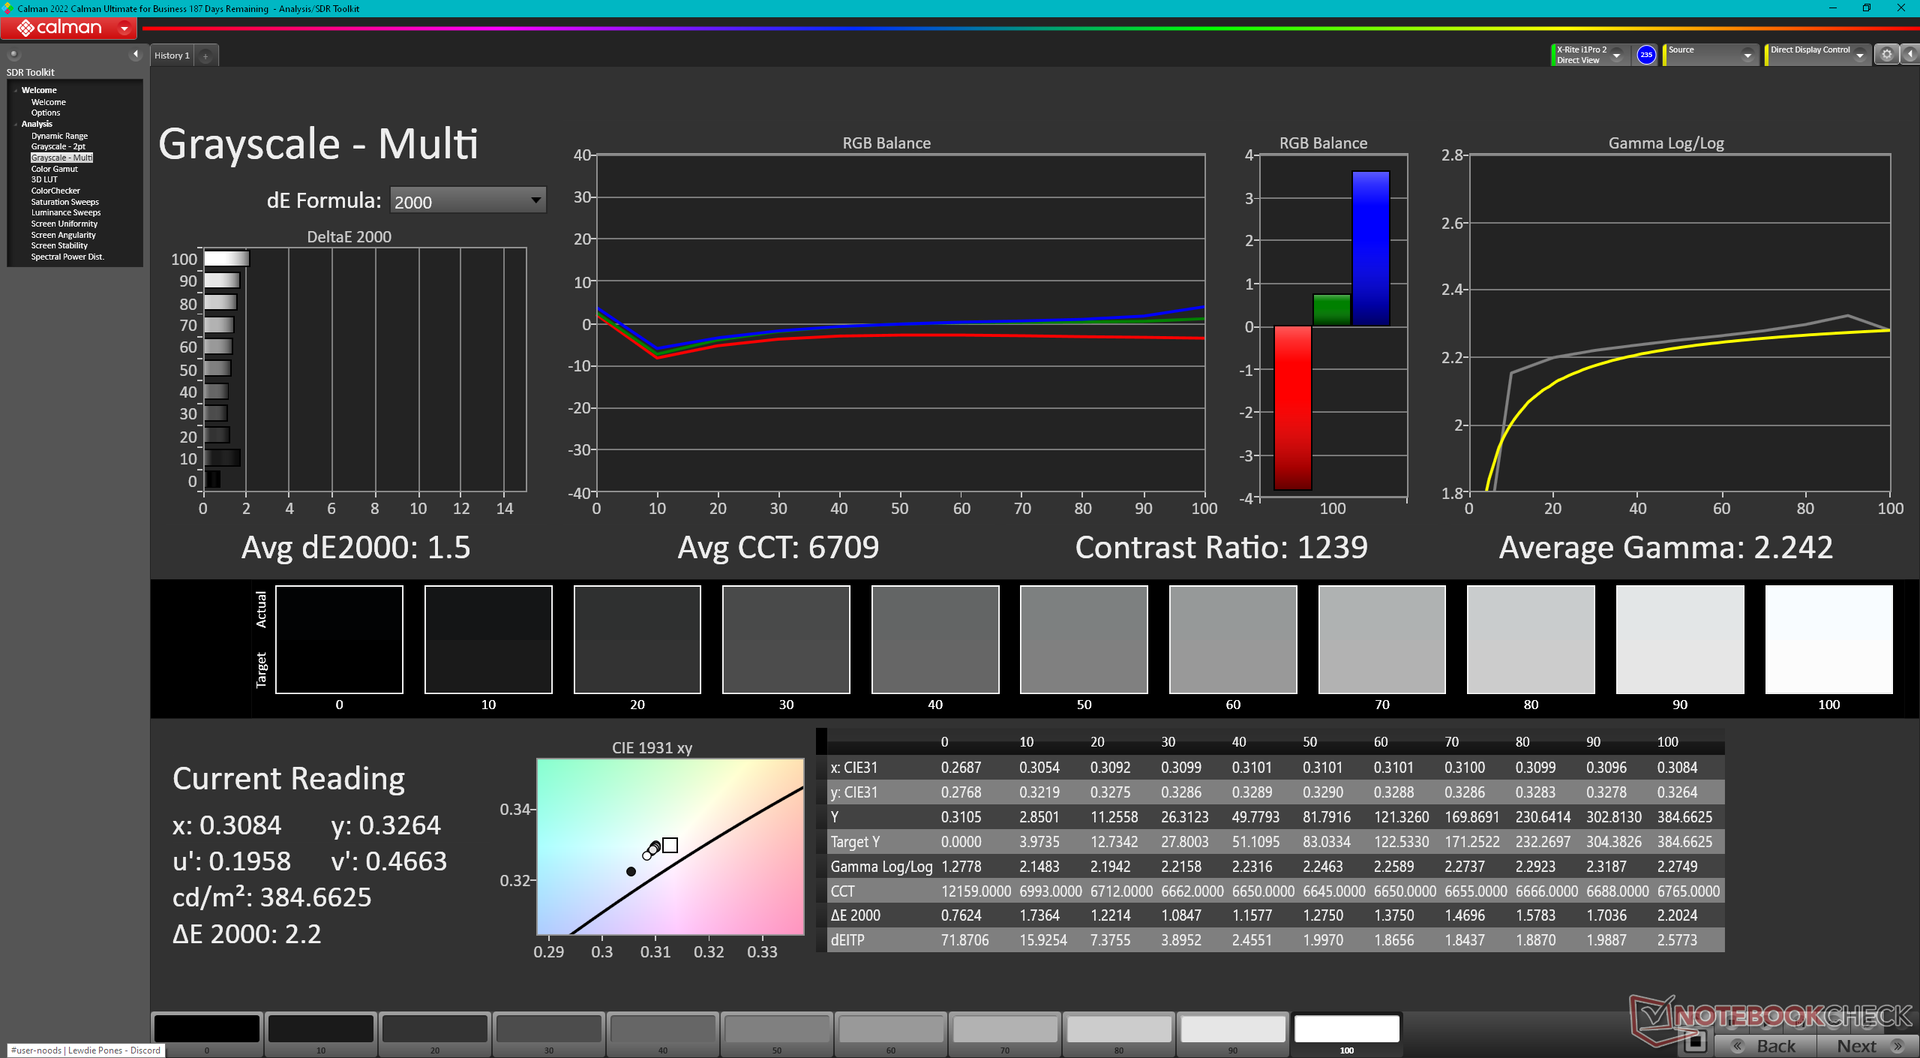
Distribution av ljusstyrkan: 91 %
Mitt på batteriet: 384 cd/m²
Kontrast: 1097:1 (Svärta: 0.35 cd/m²)
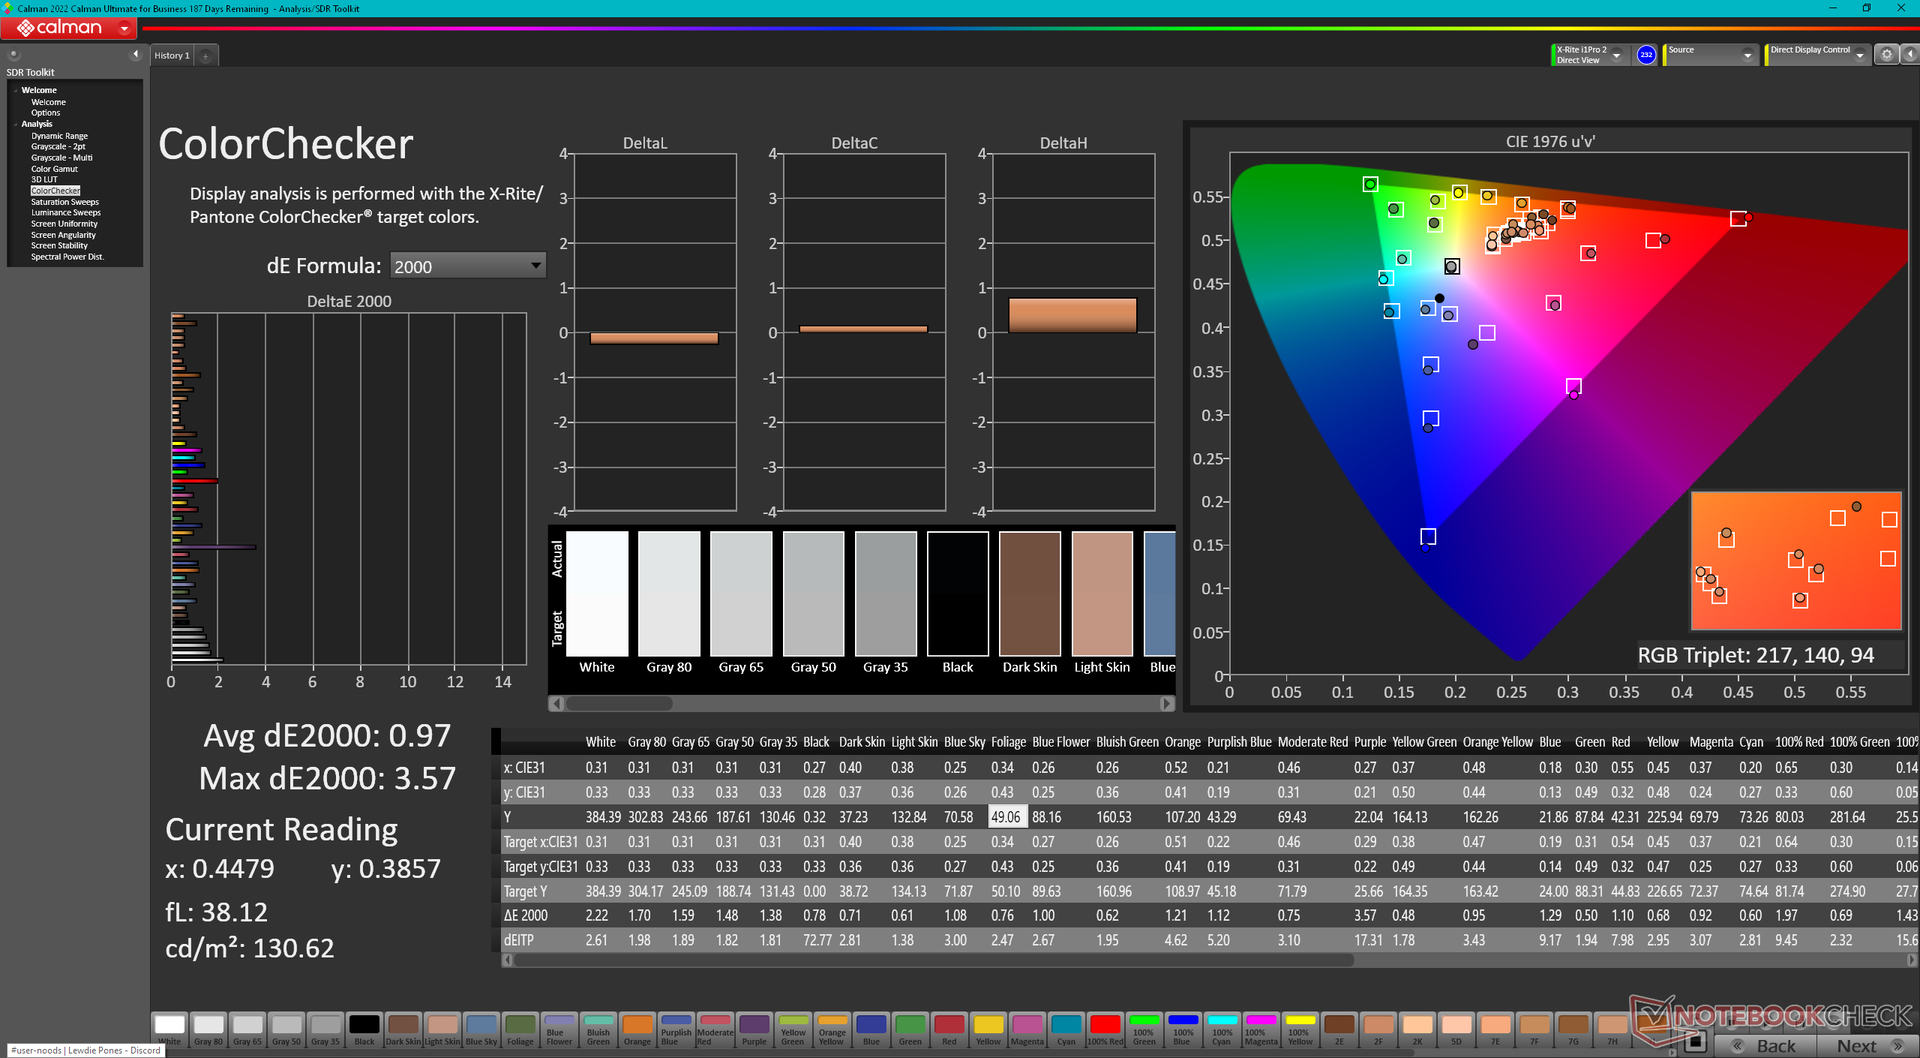
ΔE ColorChecker Calman: 0.97 | ∀{0.5-29.43 Ø4.71}
calibrated: 0.77
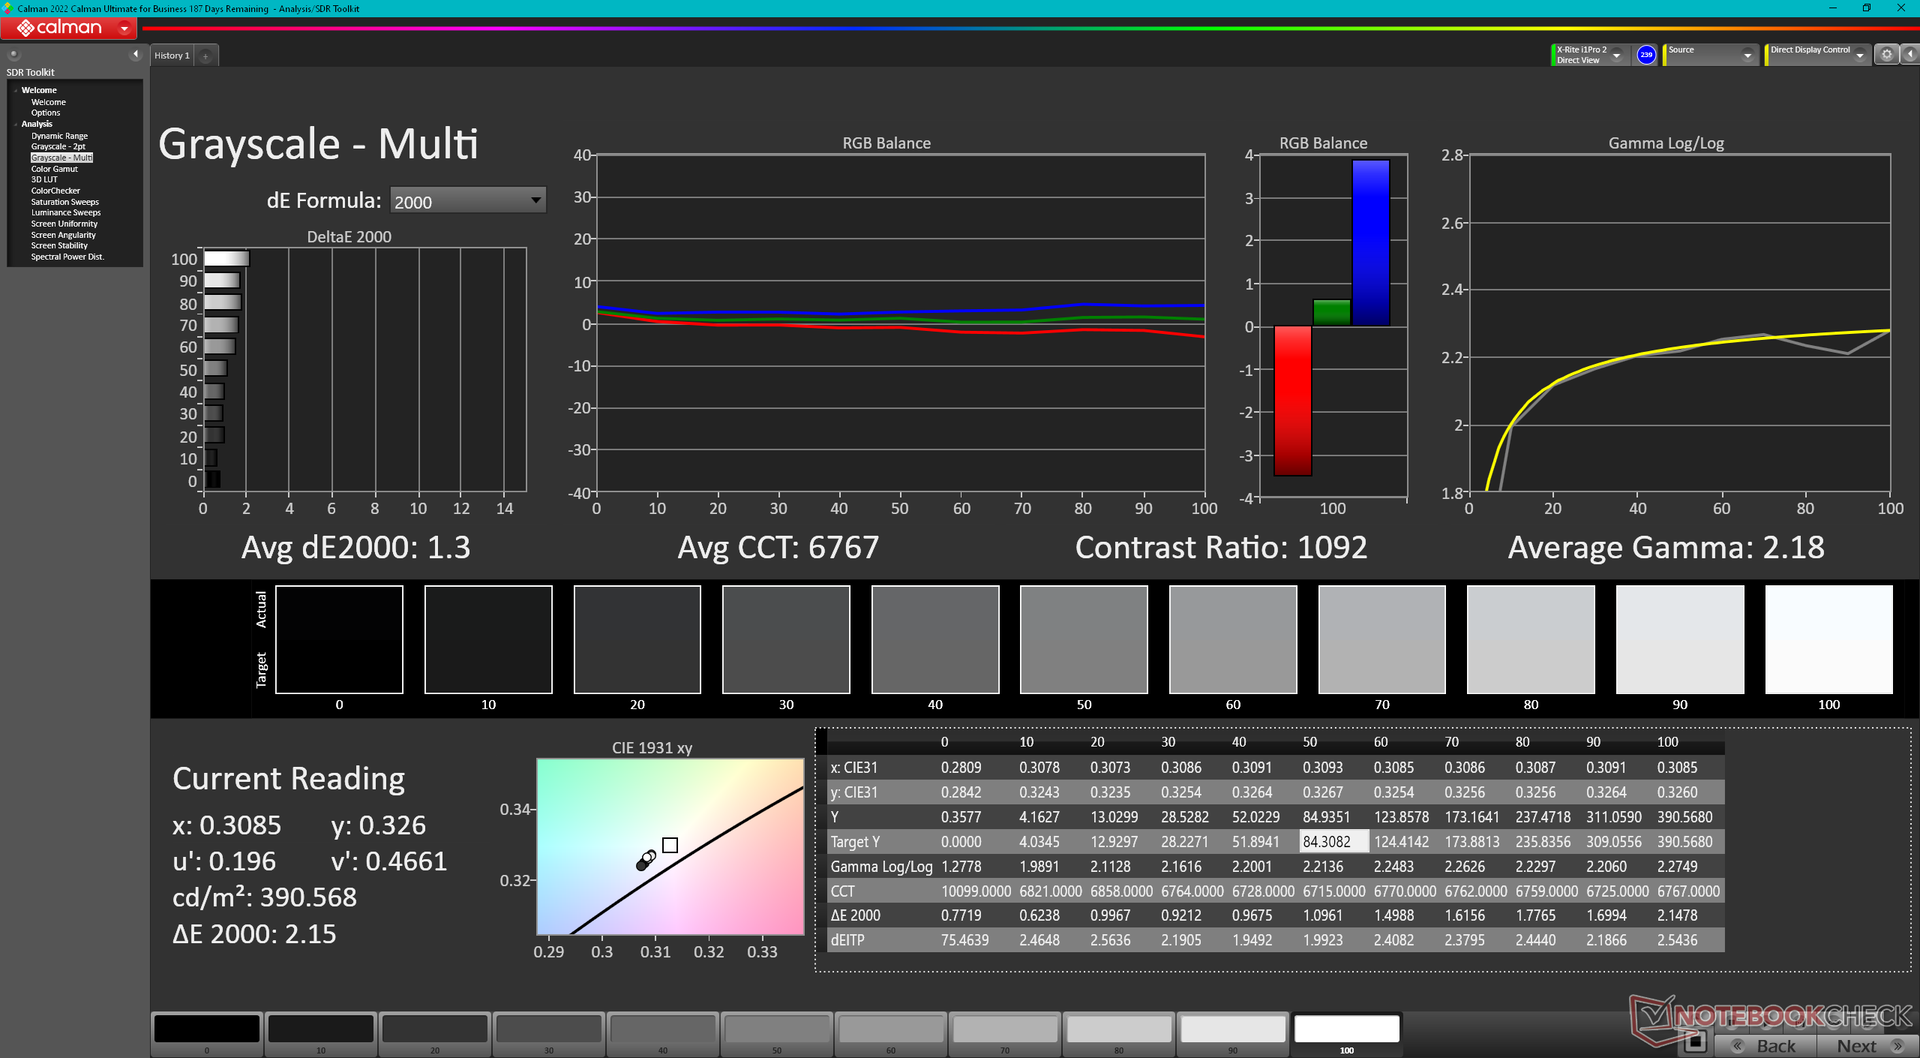
ΔE Greyscale Calman: 1.5 | ∀{0.09-98 Ø4.96}
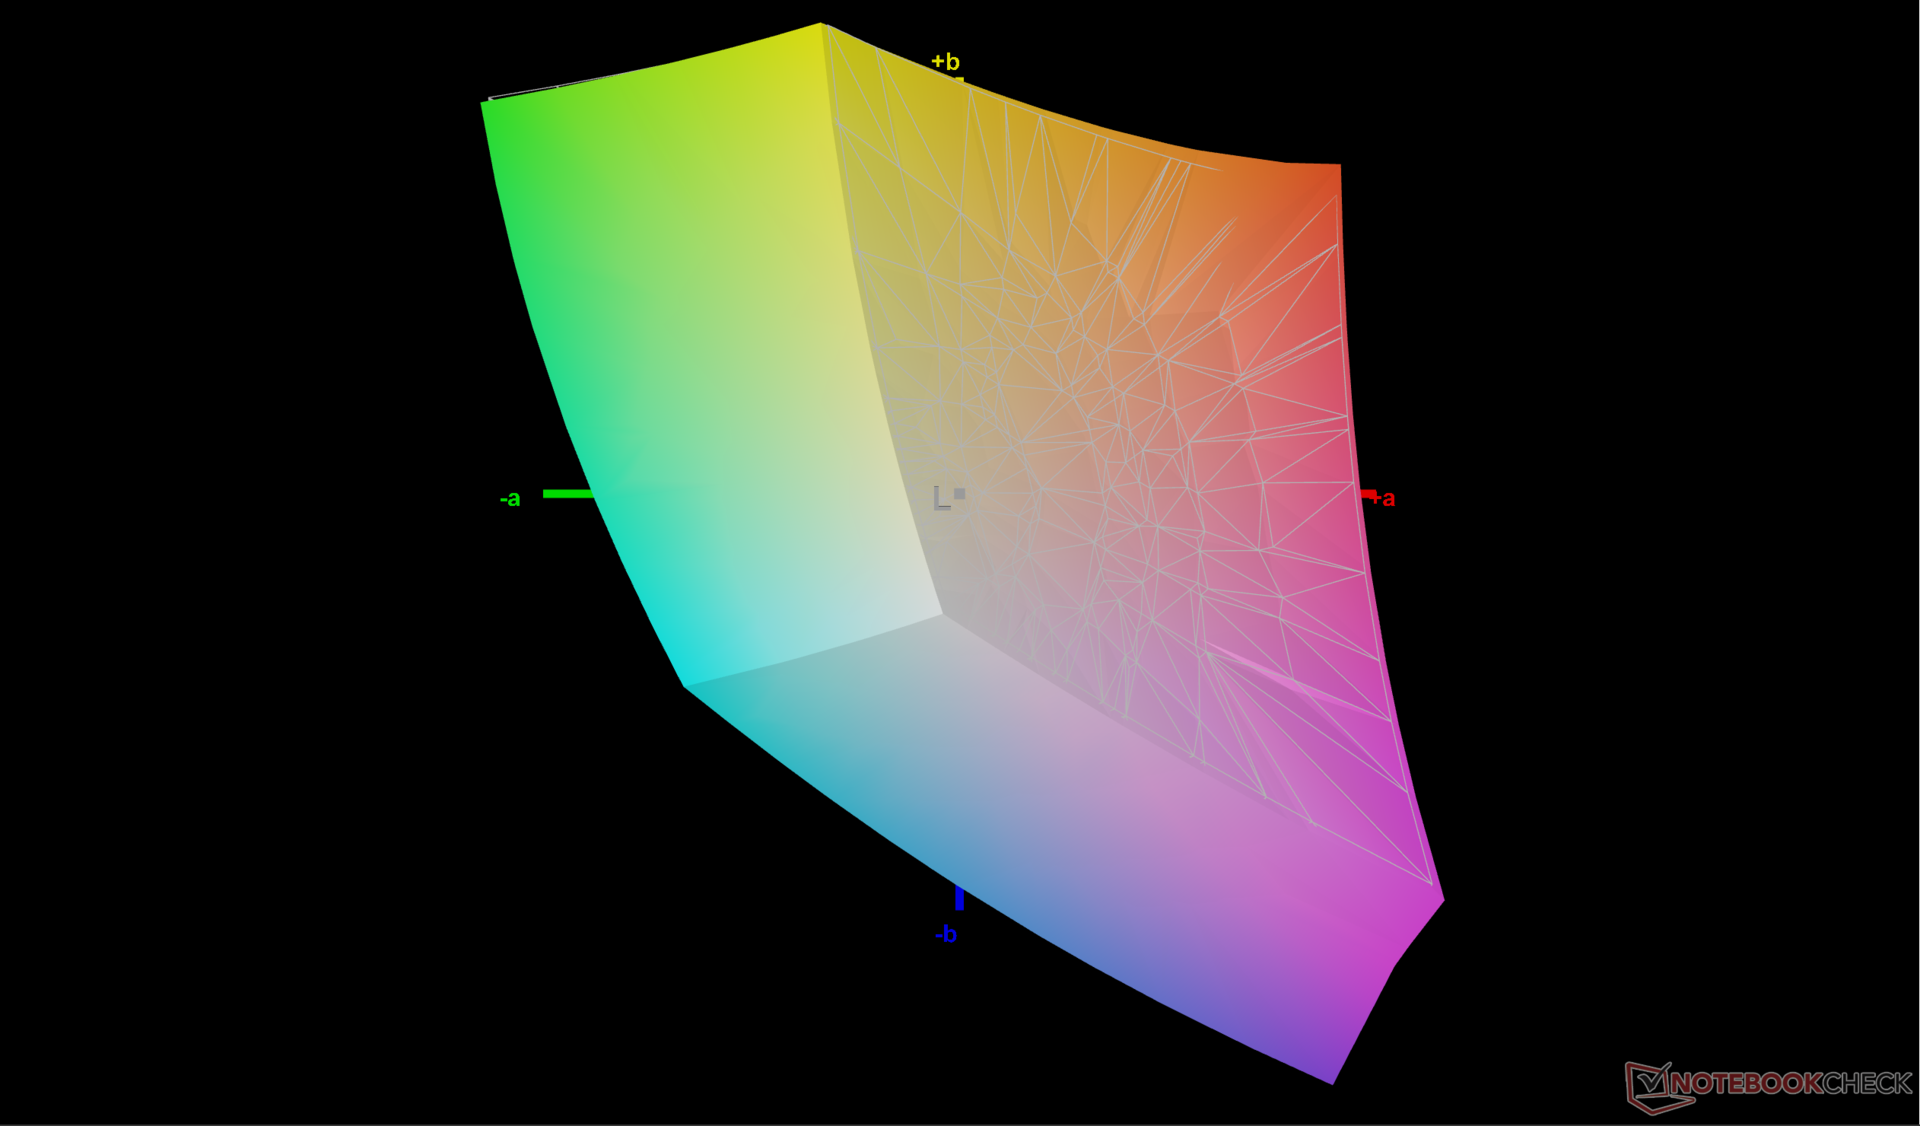
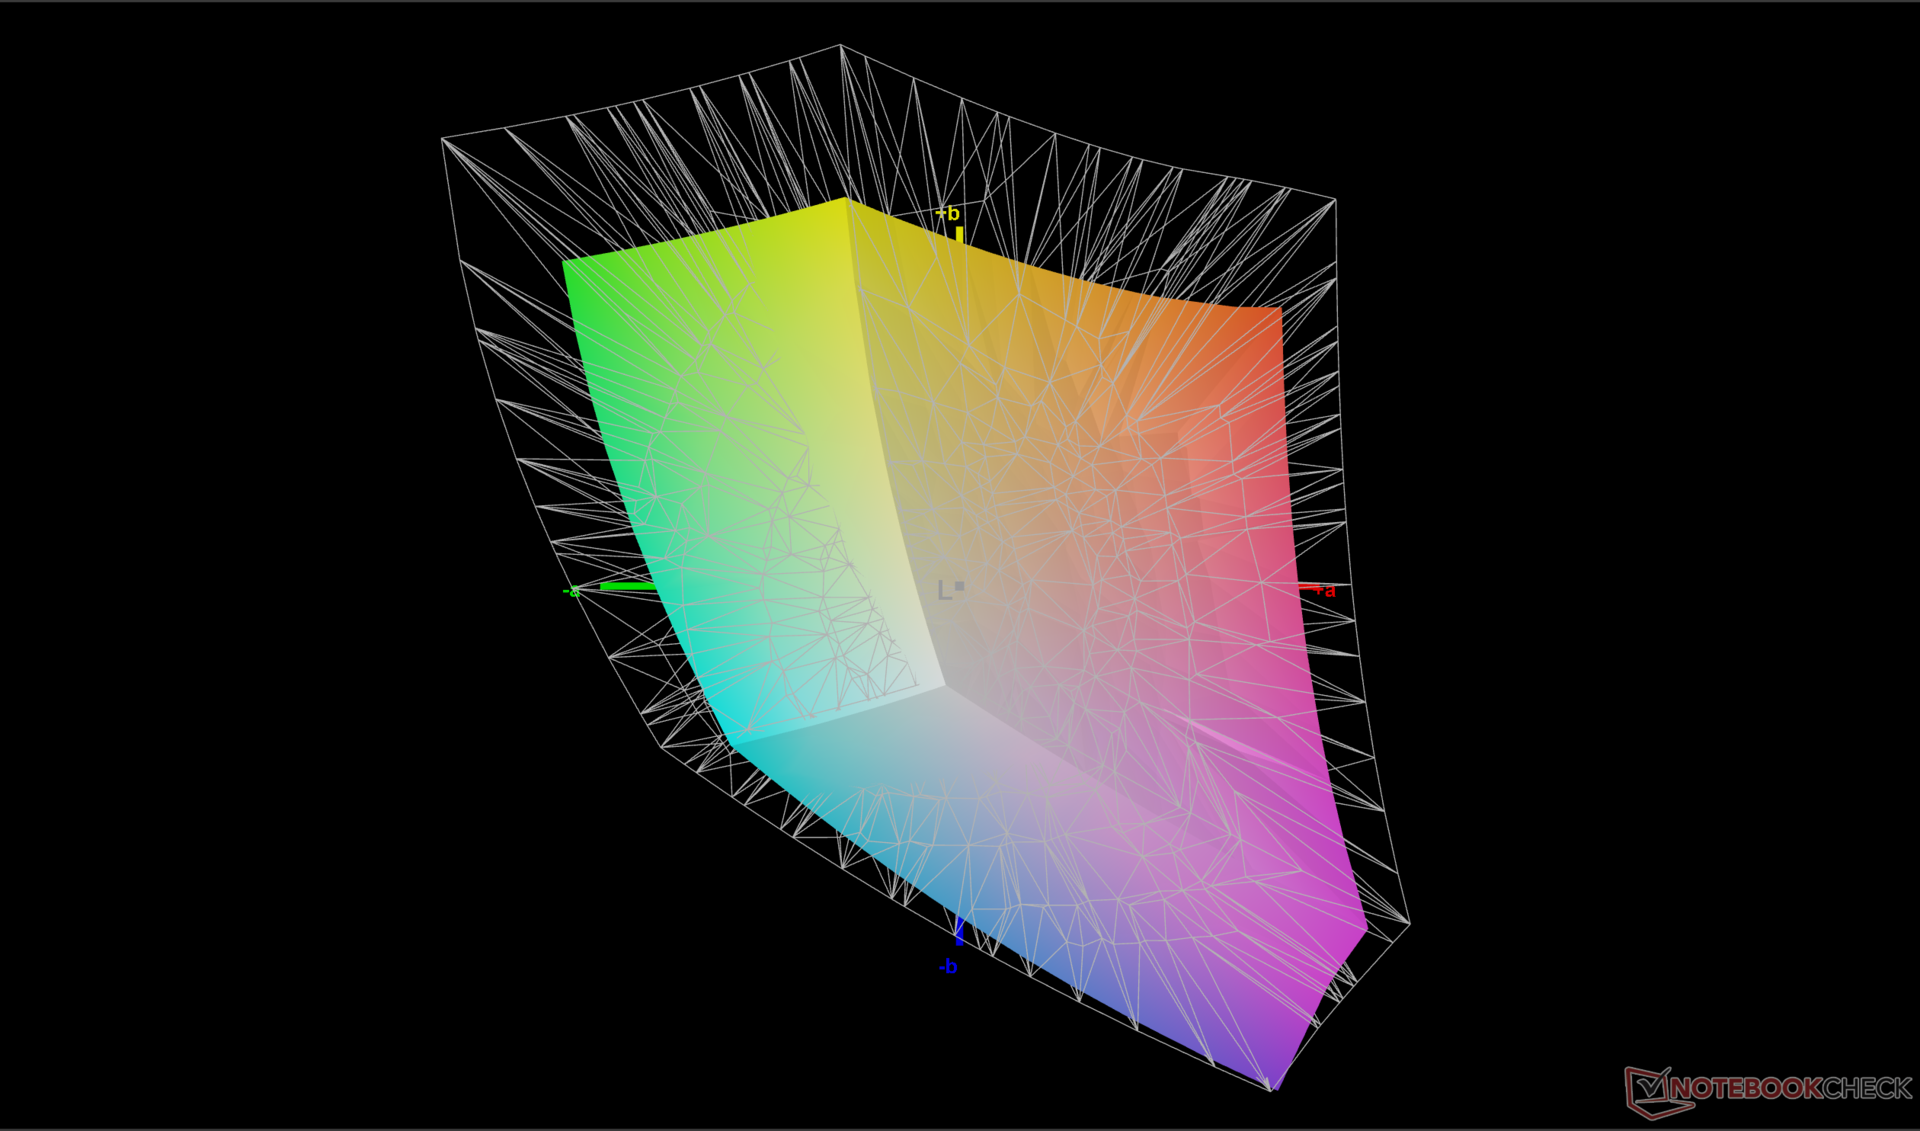
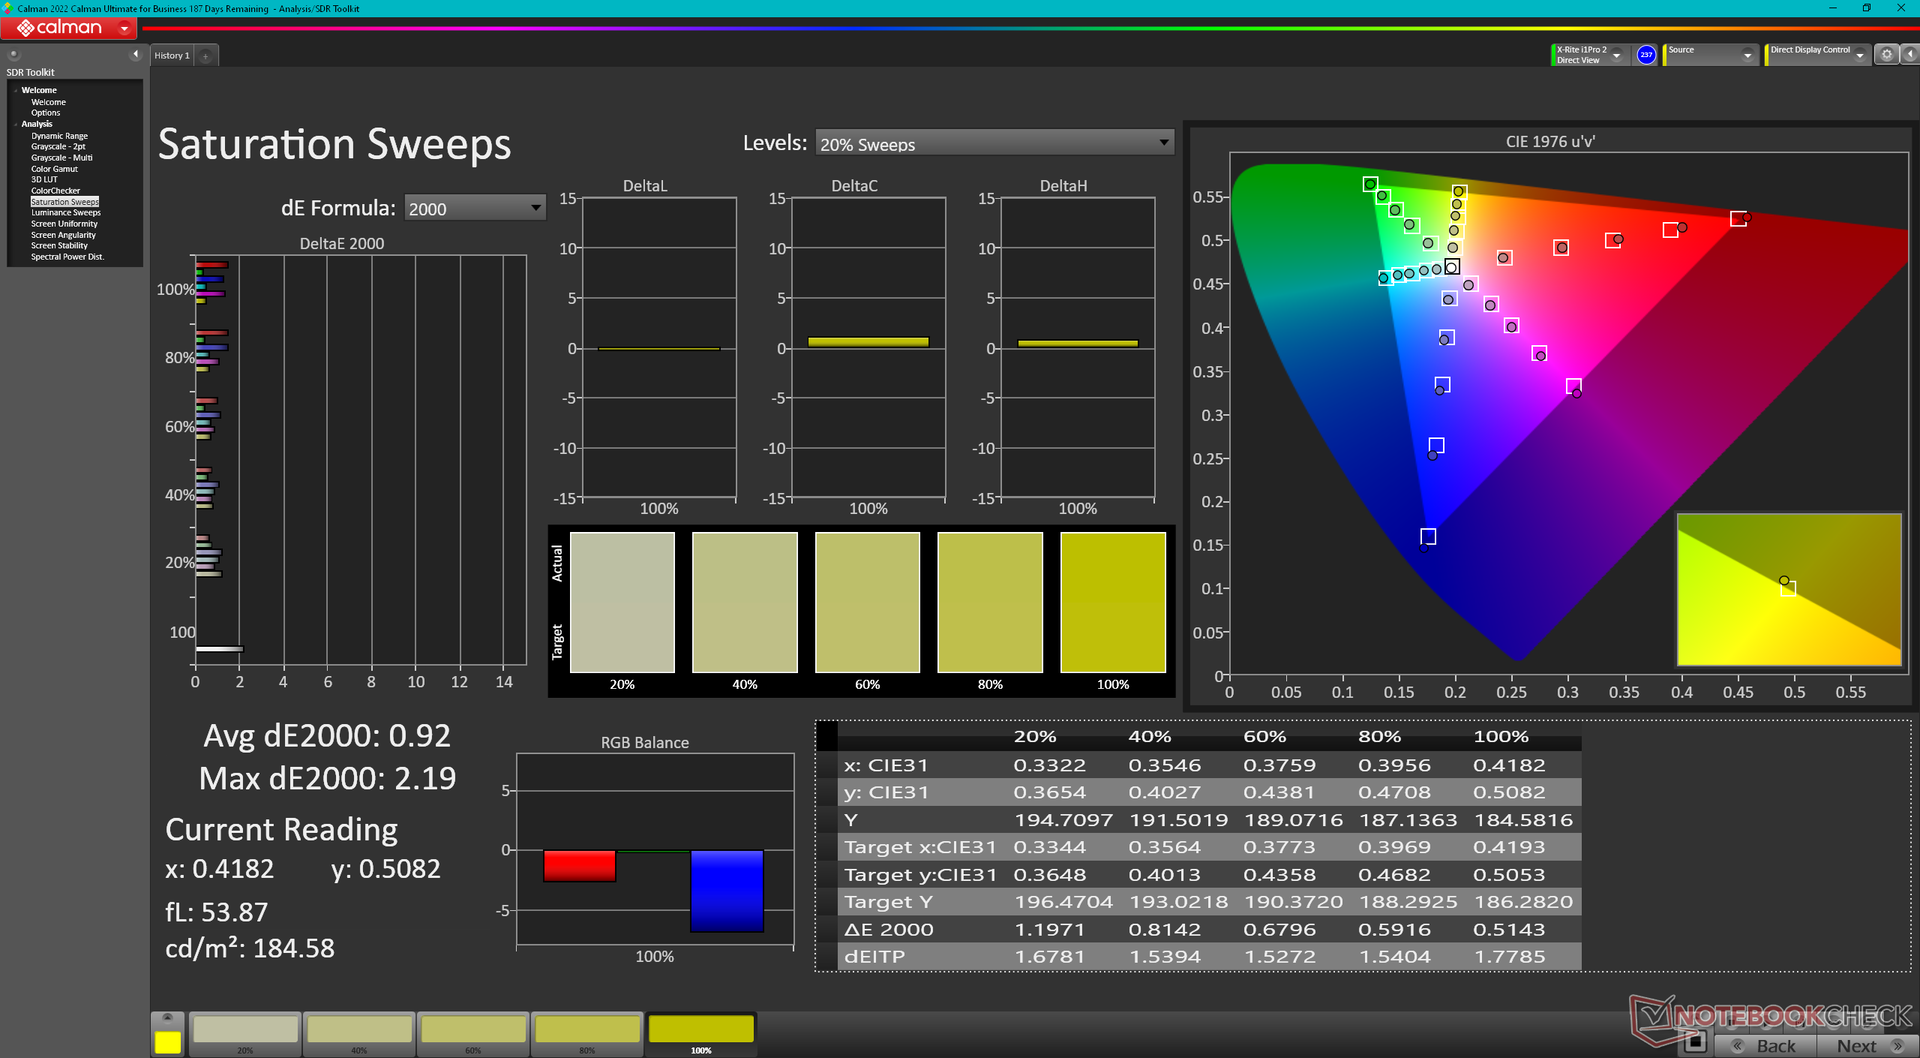
70.1% AdobeRGB 1998 (Argyll 3D)
99.4% sRGB (Argyll 3D)
69.3% Display P3 (Argyll 3D)
Gamma: 2.24
CCT: 6709 K
| Lenovo Legion Pro 5 16IRX9 BOE NE160QDM-NYC, IPS, 2560x1600, 16" | Lenovo Legion Pro 5 16IRX8 AU Optronics B160QAN03.1, IPS, 2560x1600, 16" | Alienware m16 R2 BOE NE16NYH, IPS, 2560x1600, 16" | HP Omen Transcend 16-u1095ng ATNA60DL02-0 (SDC41A4), OLED, 2560x1600, 16" | Asus ROG Zephyrus G16 2024 GU605M ATNA60DL01-0, OLED, 2560x1600, 16" | MSI Stealth 16 Mercedes-AMG Motorsport A13VG ATNA60YV09-0 (SDC4191), OLED, 3840x2400, 16" | |
|---|---|---|---|---|---|---|
| Display | 2% | 2% | 28% | 28% | 23% | |
| Display P3 Coverage (%) | 69.3 | 71.2 3% | 71 2% | 99.8 44% | 99.9 44% | 99.2 43% |
| sRGB Coverage (%) | 99.4 | 98.8 -1% | 100 1% | 100 1% | 100 1% | 99.9 1% |
| AdobeRGB 1998 Coverage (%) | 70.1 | 73.3 5% | 71.4 2% | 97 38% | 96.9 38% | 88.4 26% |
| Response Times | -20% | 27% | 98% | 98% | 87% | |
| Response Time Grey 50% / Grey 80% * (ms) | 11.9 ? | 14.5 ? -22% | 5.7 ? 52% | 0.2 ? 98% | 0.22 ? 98% | 1.5 ? 87% |
| Response Time Black / White * (ms) | 8.9 ? | 10.4 ? -17% | 8.7 ? 2% | 0.2 ? 98% | 0.25 ? 97% | 1.2 ? 87% |
| PWM Frequency (Hz) | 120 ? | 960 ? | 60 ? | |||
| Screen | -5% | -14% | 136% | -13% | 5% | |
| Brightness middle (cd/m²) | 384 | 405.7 6% | 345.8 -10% | 390 2% | 416 8% | 382 -1% |
| Brightness (cd/m²) | 366 | 368 1% | 337 -8% | 392 7% | 418 14% | 383 5% |
| Brightness Distribution (%) | 91 | 87 -4% | 87 -4% | 98 8% | 96 5% | 96 5% |
| Black Level * (cd/m²) | 0.35 | 0.38 -9% | 0.3 14% | 0.02 94% | ||
| Contrast (:1) | 1097 | 1068 -3% | 1153 5% | 19500 1678% | ||
| Colorchecker dE 2000 * | 0.97 | 1.65 -70% | 1.99 -105% | 1.94 -100% | 1.6 -65% | 0.84 13% |
| Colorchecker dE 2000 max. * | 3.57 | 4.2 -18% | 3.52 1% | 4.26 -19% | 2.1 41% | 3.39 5% |
| Colorchecker dE 2000 calibrated * | 0.77 | 0.53 31% | 0.62 19% | 4.21 -447% | 0.8 -4% | |
| Greyscale dE 2000 * | 1.5 | 1.2 20% | 2.1 -40% | 1.5 -0% | 2.7 -80% | 1.3 13% |
| Gamma | 2.24 98% | 2.3 96% | 2.32 95% | 2.221 99% | 2.16 102% | 2.166 102% |
| CCT | 6709 97% | 6453 101% | 6369 102% | 6395 102% | 6331 103% | 6550 99% |
| Totalt genomsnitt (program/inställningar) | -8% /
-6% | 5% /
-5% | 87% /
107% | 38% /
18% | 38% /
23% |
* ... mindre är bättre
Skärmen levereras förkalibrerad med genomsnittliga deltaE-värden för gråskala och färg på bara 1,5 respektive 0,97, vilket är förvånande att se på en bärbar dator i mellanklassen. En slutanvändarkalibrering är därför inte nödvändig för de flesta användare.

Visa svarstider
| ↔ Svarstid svart till vitt | ||
|---|---|---|
| 8.9 ms ... stiga ↗ och falla ↘ kombinerat | ↗ 4.8 ms stiga | 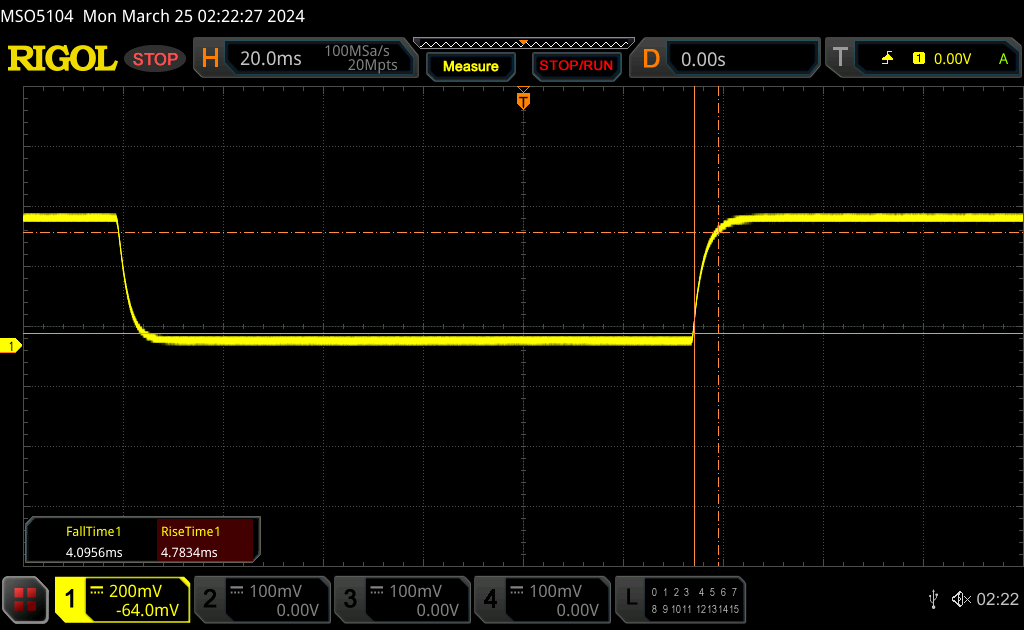 |
| ↘ 4.1 ms hösten | ||
| Skärmen visar snabba svarsfrekvenser i våra tester och bör passa för spel. I jämförelse sträcker sig alla testade enheter från 0.1 (minst) till 240 (maximalt) ms. » 25 % av alla enheter är bättre. Det betyder att den uppmätta svarstiden är bättre än genomsnittet av alla testade enheter (19.8 ms). | ||
| ↔ Svarstid 50 % grått till 80 % grått | ||
| 11.9 ms ... stiga ↗ och falla ↘ kombinerat | ↗ 5.5 ms stiga | 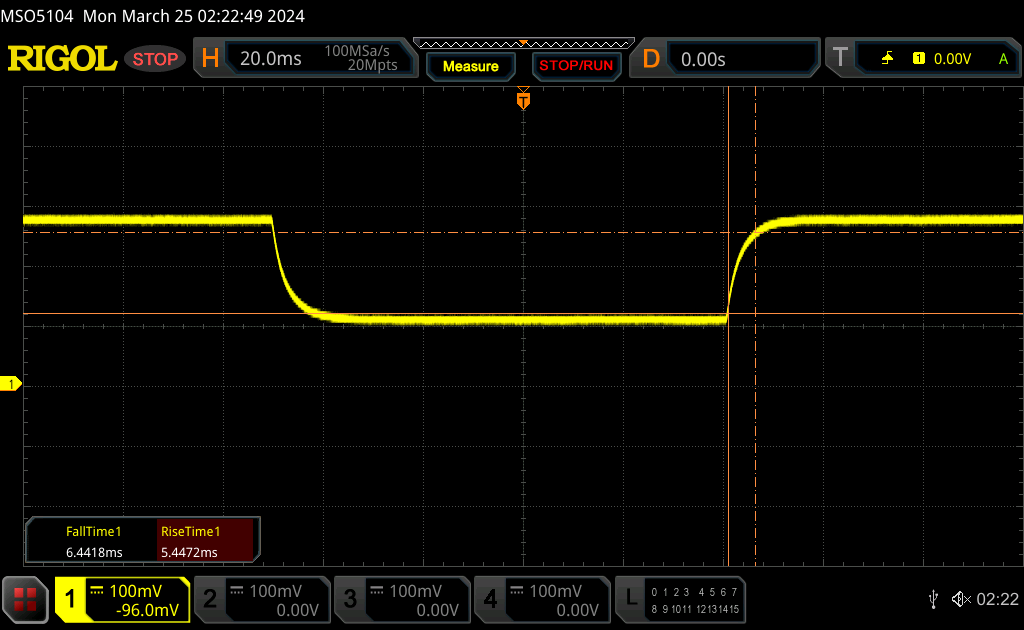 |
| ↘ 6.4 ms hösten | ||
| Skärmen visar bra svarsfrekvens i våra tester, men kan vara för långsam för konkurrenskraftiga spelare. I jämförelse sträcker sig alla testade enheter från 0.165 (minst) till 636 (maximalt) ms. » 25 % av alla enheter är bättre. Det betyder att den uppmätta svarstiden är bättre än genomsnittet av alla testade enheter (30.9 ms). | ||
Skärmflimmer / PWM (Puls-Width Modulation)
| Skärmflimmer / PWM upptäcktes inte | 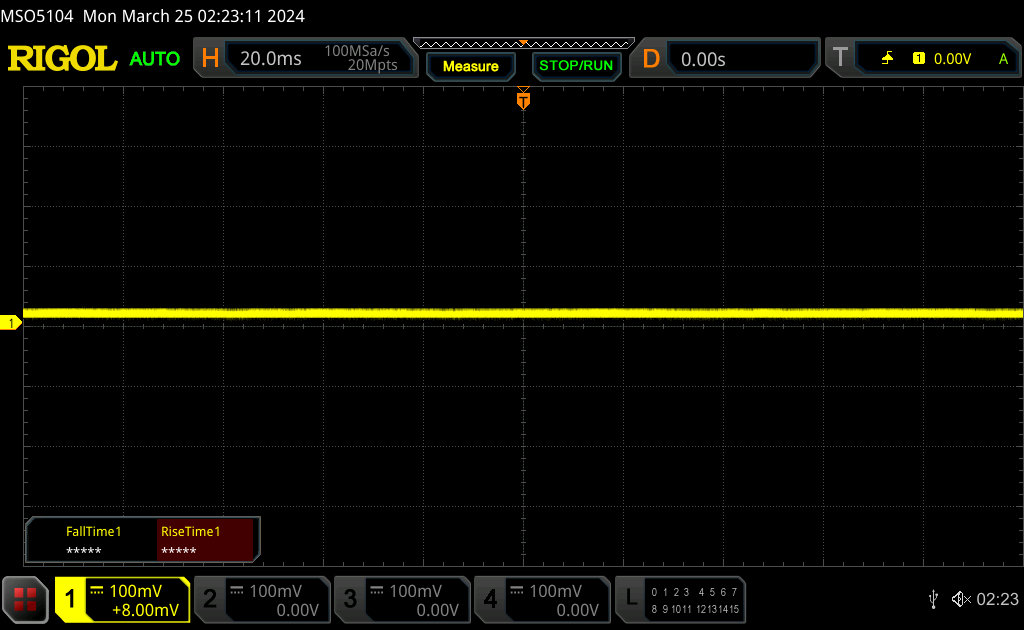 | ||
Som jämförelse: 52 % av alla testade enheter använder inte PWM för att dämpa skärmen. Om PWM upptäcktes mättes ett medelvärde av 7748 (minst: 5 - maximum: 343500) Hz. | |||
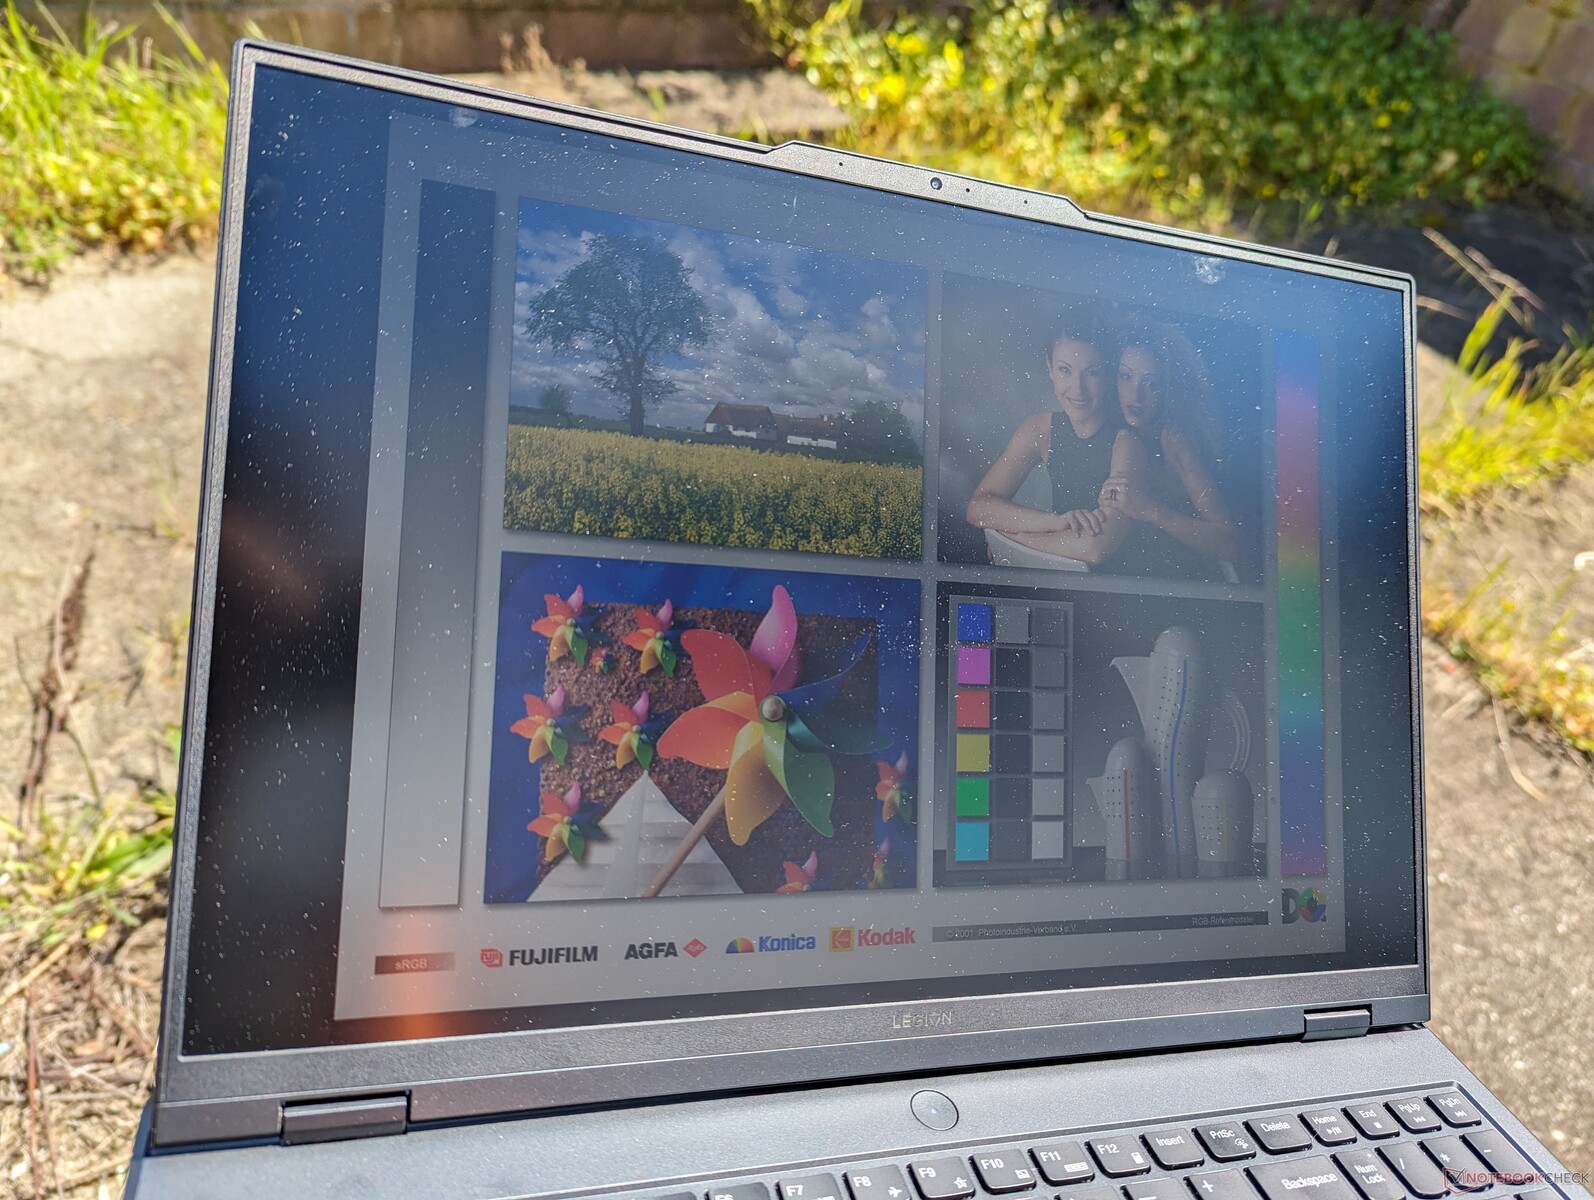
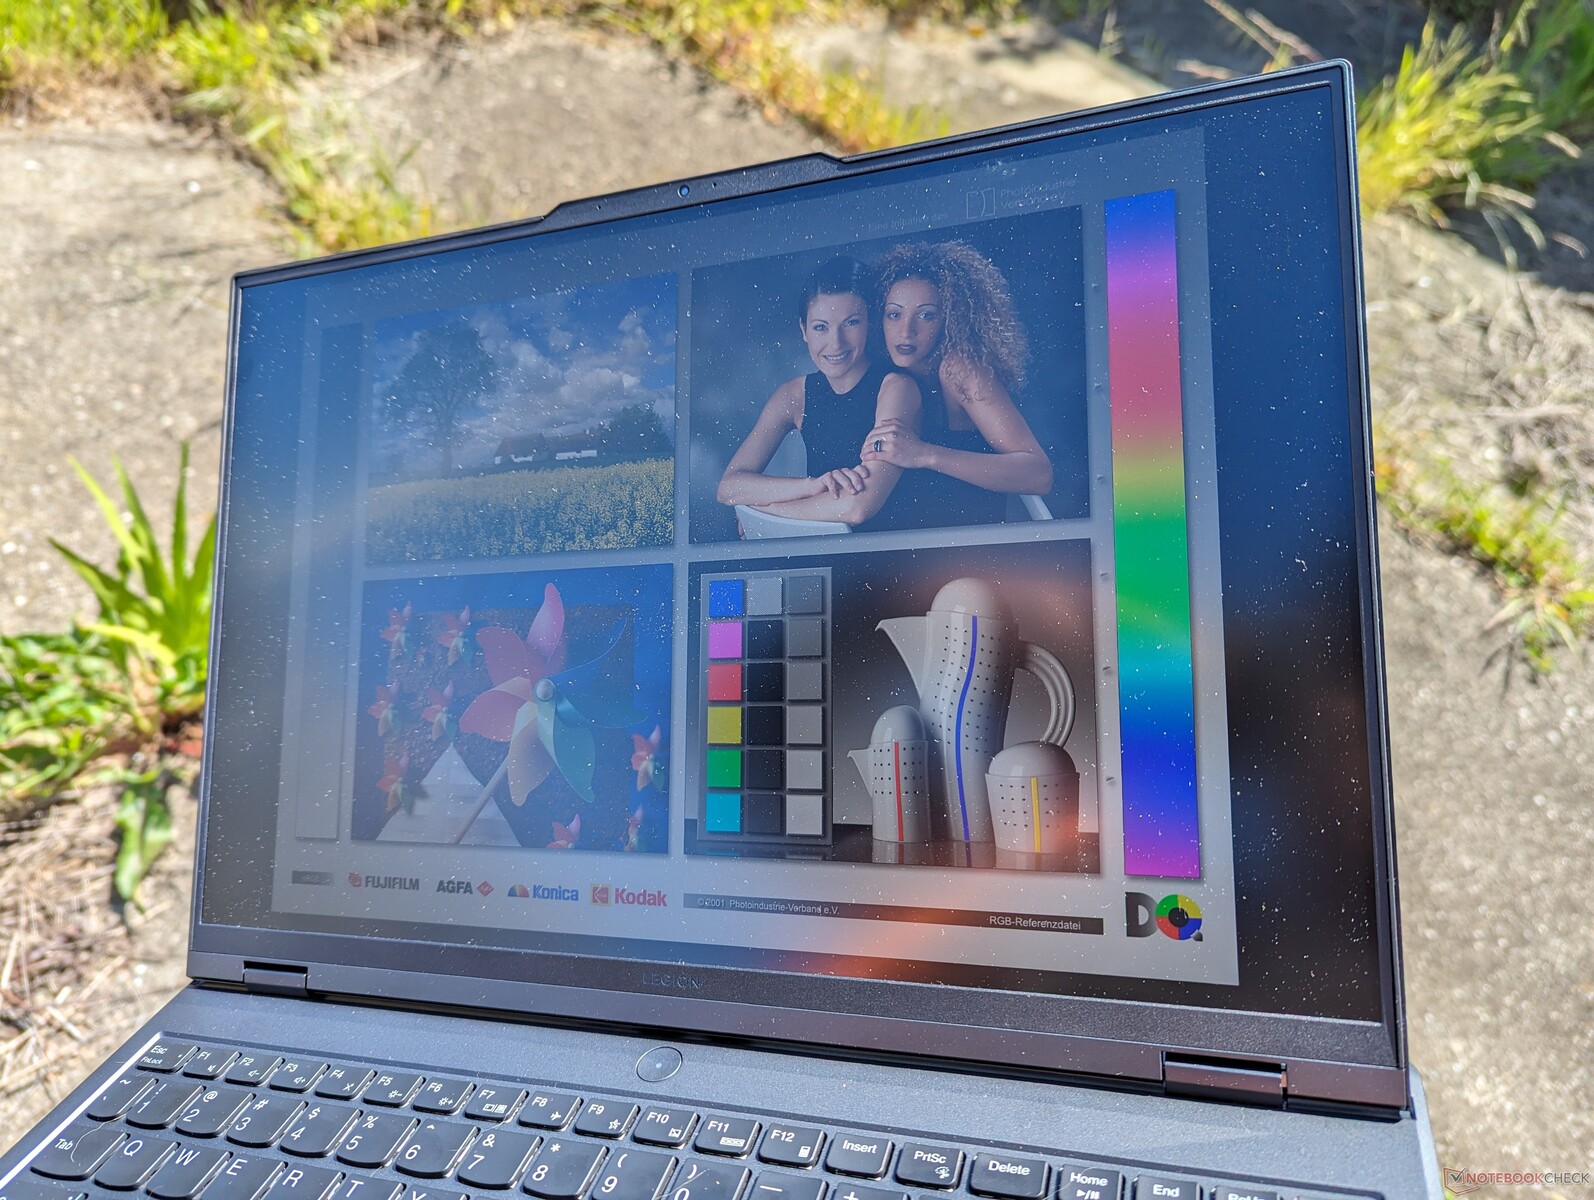
Synligheten utomhus har inte förändrats mycket från förra årets modell eftersom den maximala ljusstyrkan är ungefär densamma. Även om modellen har ljusstarkare paneler är ökningen inte tillräckligt stor för att göra en märkbar skillnad utomhus.


Prestanda - annat namn, samma prestanda
Villkor för testning
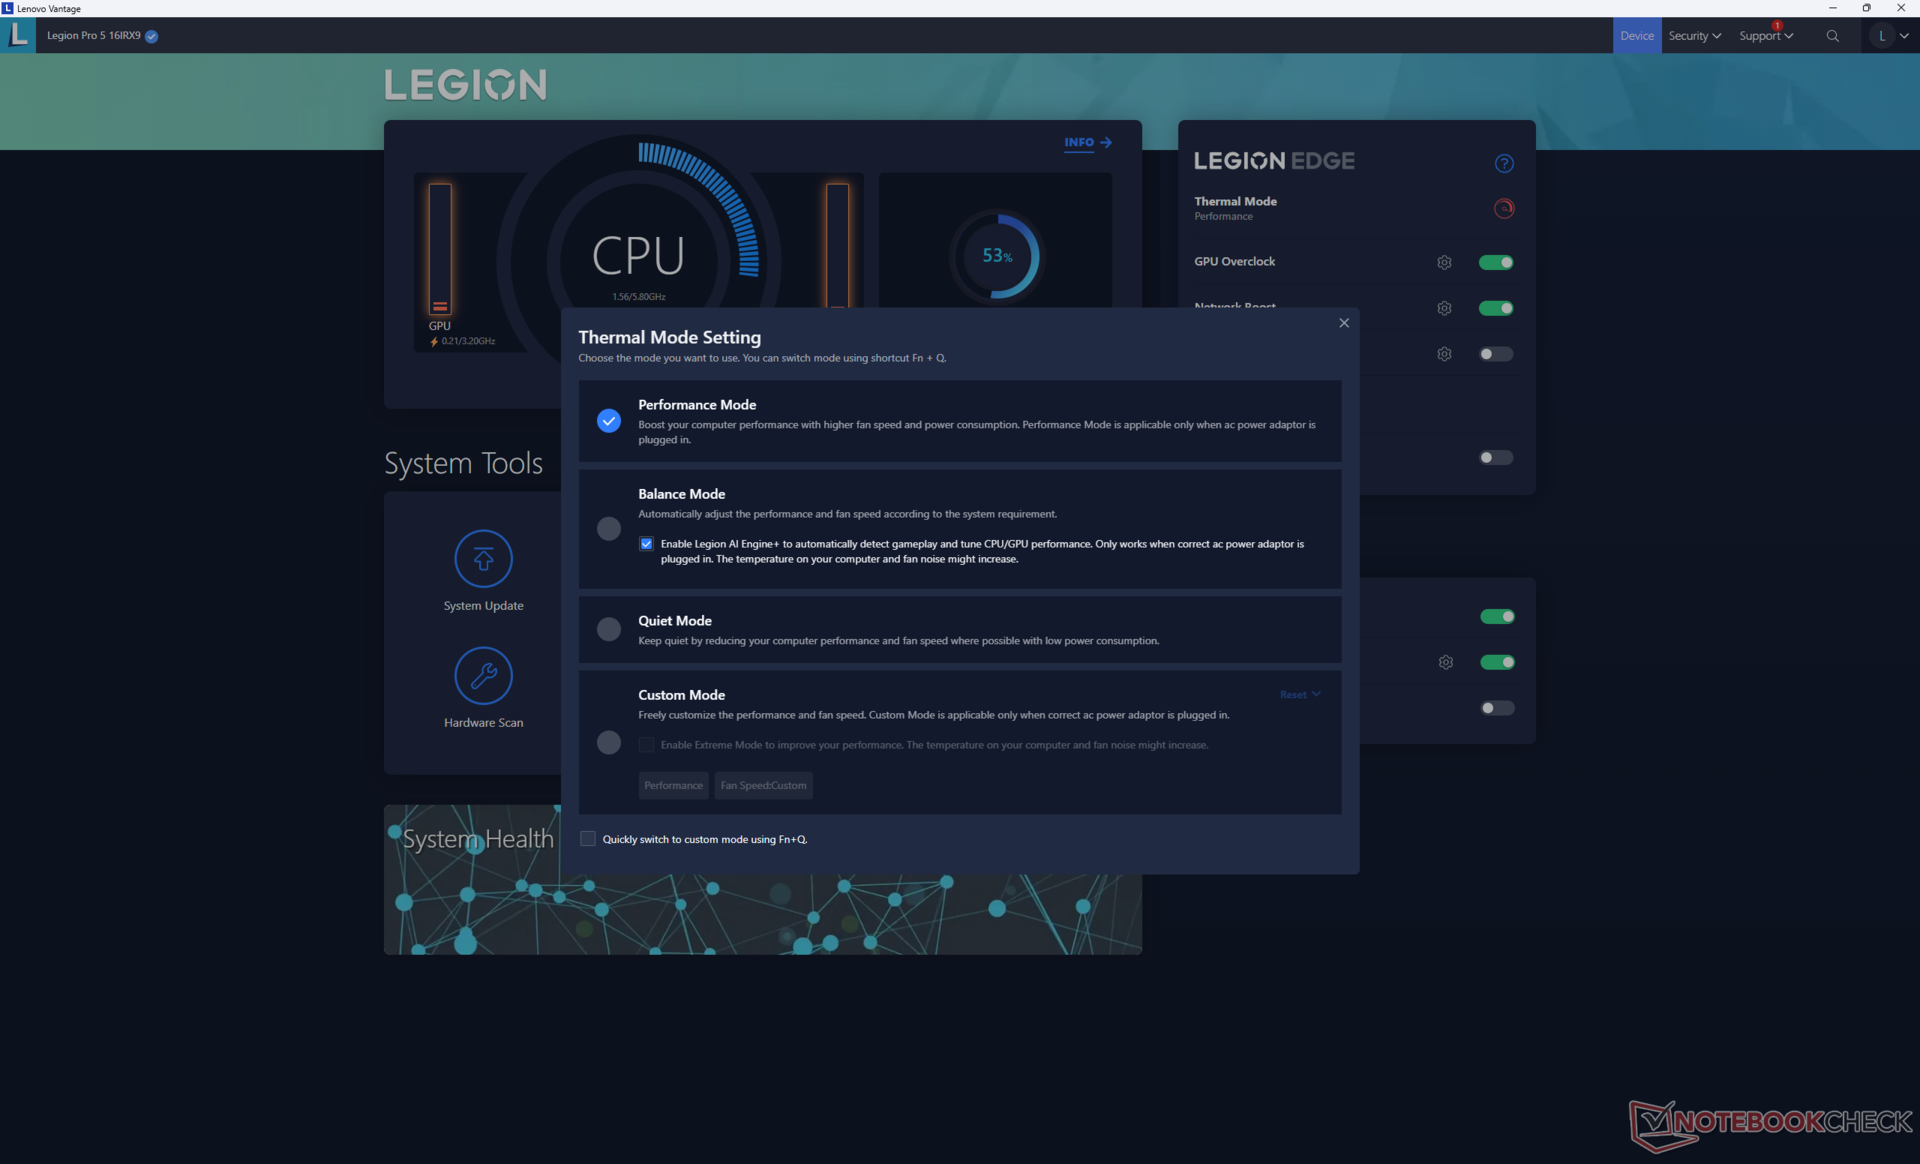
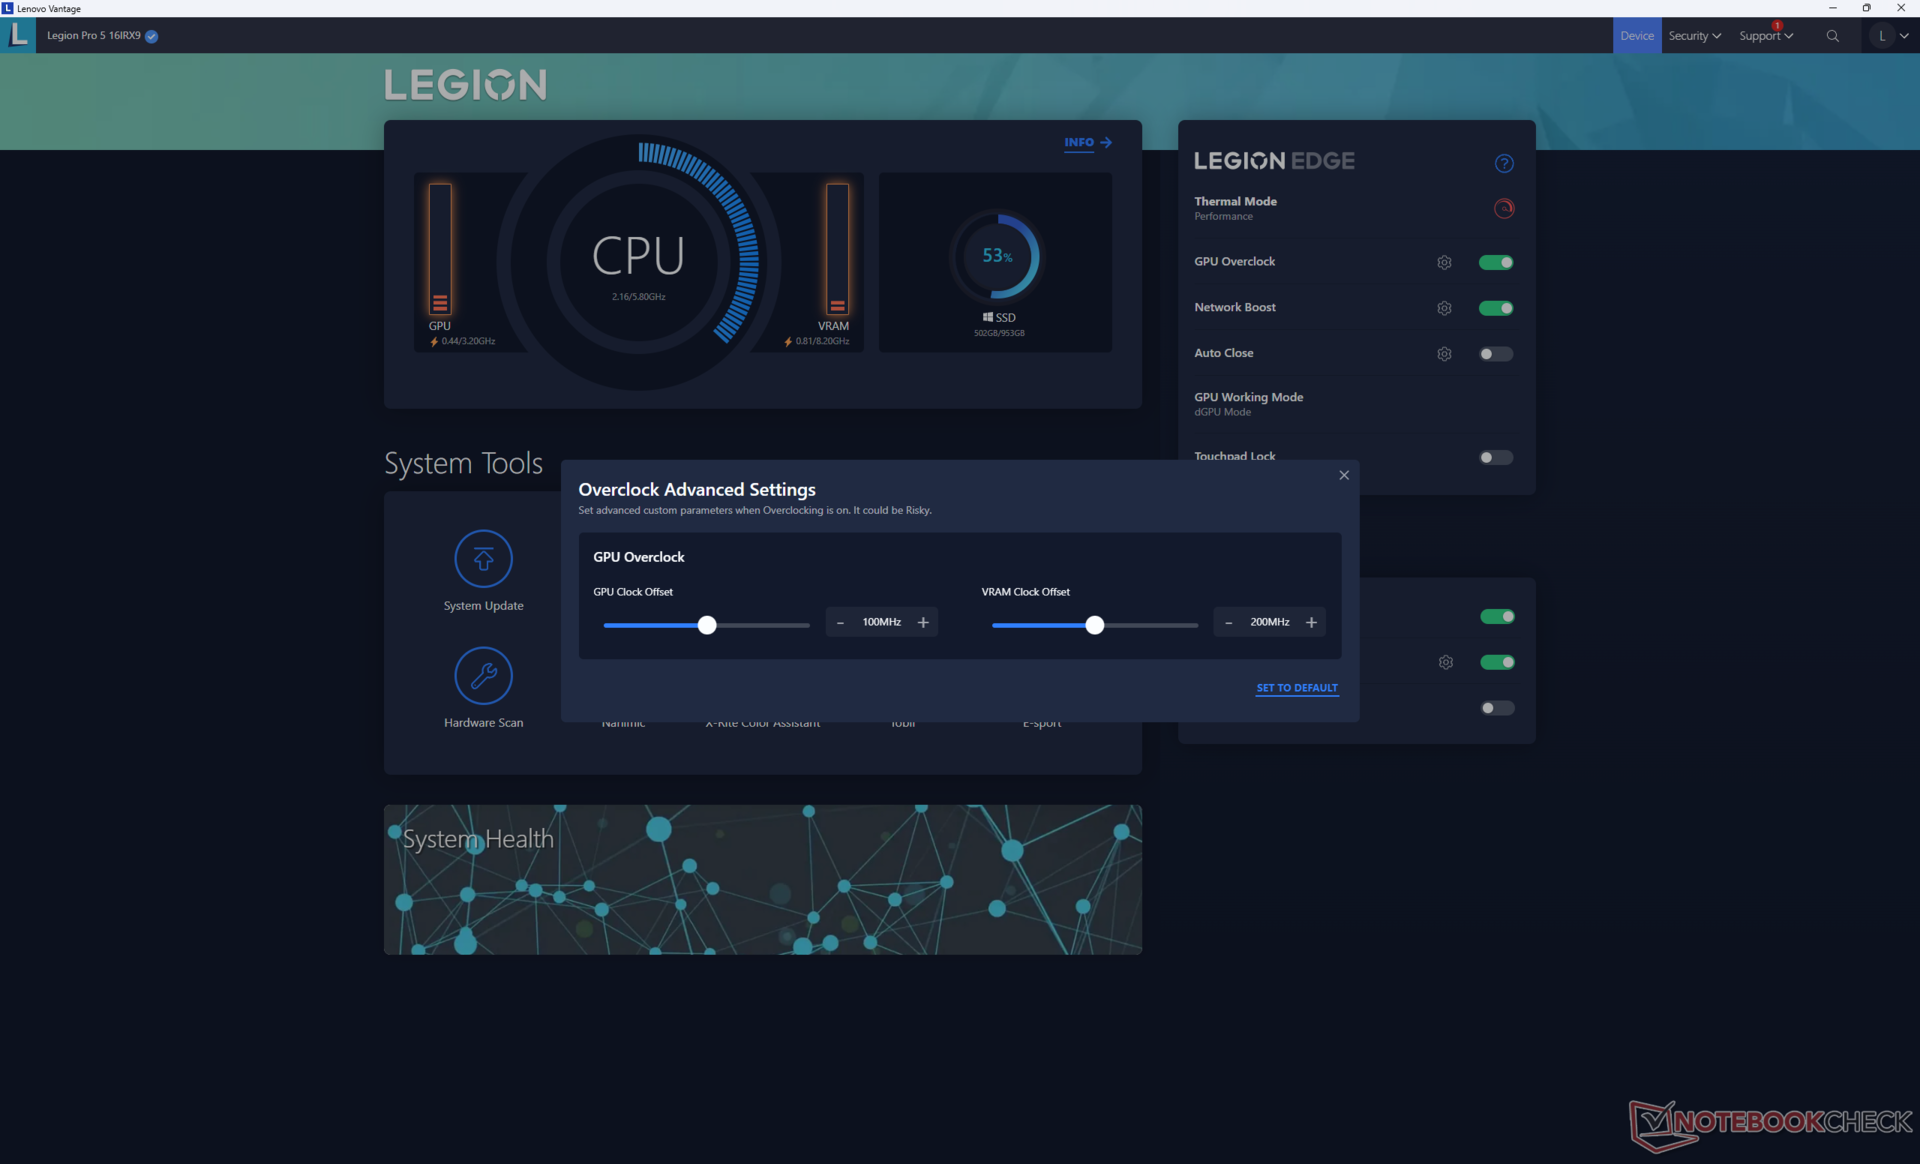
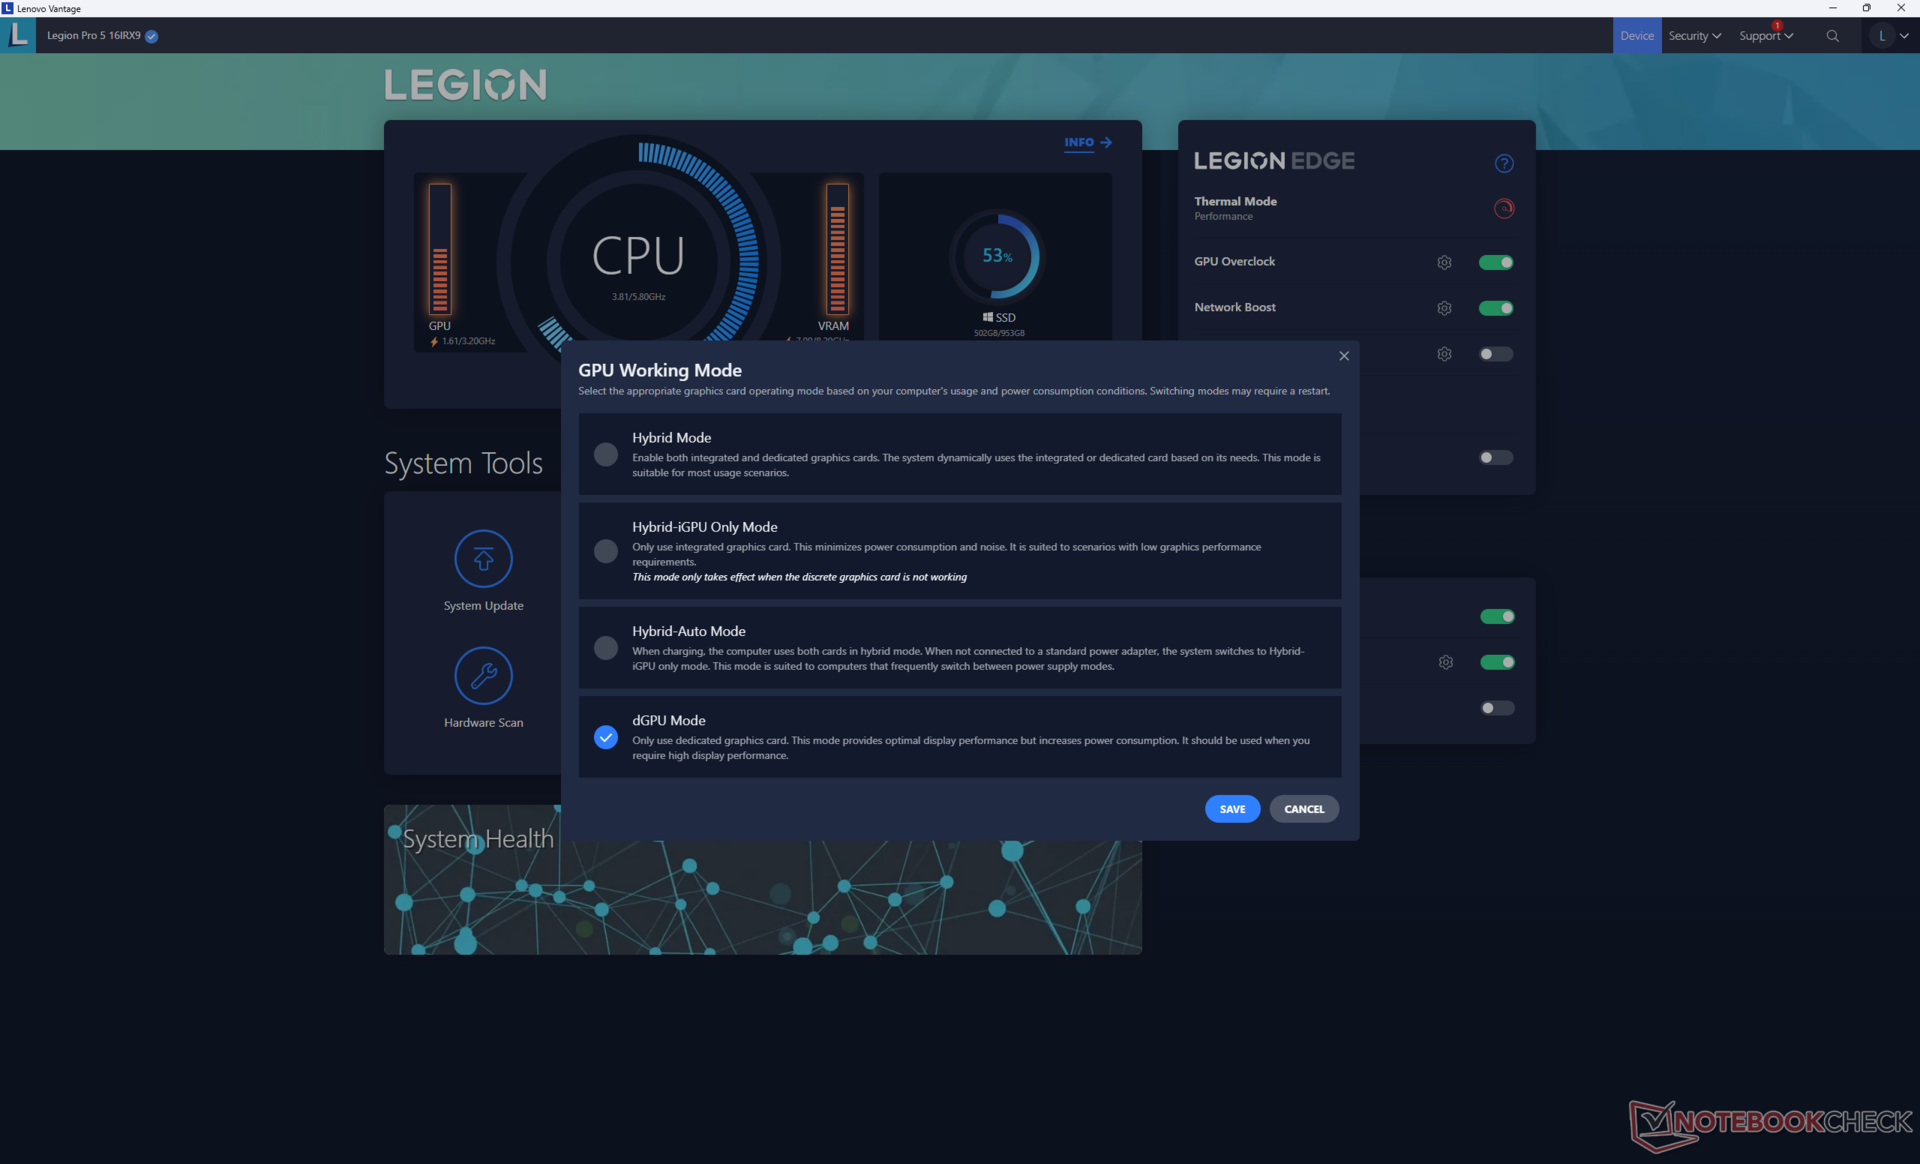
Vi ställde in Lenovo Vantage på Performance-läge, dGPU-läge och Windows på Performance-läge innan vi körde nedanstående benchmarks. GPU-överklockning är också aktiverat som standard till +100/+200 MHz klocka/VRAM.
Avancerad Optimus stöds. Som vanligt är G-Sync endast aktivt för huvudskärmen när den är inställd på dGPU-läge.
Processor
CPU-prestandan är utmärkt, särskilt jämfört med HP Omen Transcend 16 som levereras med samma Core i9-14900HX processor men är mer kraftigt strypt. Den erbjuder också en mycket respektabel prestandaökning på nästan 50 procent över Core i7-13700HX i vår äldre Legion 5 Pro 16IRX8 testenhet. Trots detta är den totala prestandan jämförbar med den billigare Core i9-13900HX eftersom i9-14900HX bara är ett nytt varumärke.
Prestandahållbarheten är bra men inte perfekt. Till exempel skulle prestandan sjunka med cirka 6 procent över tid när CineBench R15 xT kördes i en loop. Tappet är tack och lov inte lika allvarligt som det vi observerade på den tidigare nämnda HP-laptopen, vilket framgår av diagrammet nedan.
Nedgradering till i7-14700HX eller i5-14500HX förväntas minska prestandan med cirka 35 till 45 procent eftersom dessa också är rebrands av de äldre i7-13700HX respektive i5-13500HX.
Cinebench R15 Multi Loop
Cinebench R23: Multi Core | Single Core
Cinebench R20: CPU (Multi Core) | CPU (Single Core)
Cinebench R15: CPU Multi 64Bit | CPU Single 64Bit
Blender: v2.79 BMW27 CPU
7-Zip 18.03: 7z b 4 | 7z b 4 -mmt1
Geekbench 6.7: Multi-Core | Single-Core
Geekbench 5.5: Multi-Core | Single-Core
HWBOT x265 Benchmark v2.2: 4k Preset
LibreOffice : 20 Documents To PDF
R Benchmark 2.5: Overall mean
* ... mindre är bättre
AIDA64: FP32 Ray-Trace | FPU Julia | CPU SHA3 | CPU Queen | FPU SinJulia | FPU Mandel | CPU AES | CPU ZLib | FP64 Ray-Trace | CPU PhotoWorxx
| Performance rating | |
| Lenovo Legion Pro 5 16IRX9 | |
| Genomsnitt Intel Core i9-14900HX | |
| Lenovo Legion Pro 5 16IRX8 | |
| HP Omen Transcend 16-u1095ng | |
| MSI Stealth 16 Mercedes-AMG Motorsport A13VG | |
| Alienware m16 R2 | |
| Asus ROG Zephyrus G16 2024 GU605M | |
| AIDA64 / FP32 Ray-Trace | |
| Lenovo Legion Pro 5 16IRX9 | |
| Genomsnitt Intel Core i9-14900HX (13098 - 33474, n=36) | |
| Lenovo Legion Pro 5 16IRX8 | |
| MSI Stealth 16 Mercedes-AMG Motorsport A13VG | |
| Alienware m16 R2 | |
| HP Omen Transcend 16-u1095ng | |
| Asus ROG Zephyrus G16 2024 GU605M | |
| AIDA64 / FPU Julia | |
| Lenovo Legion Pro 5 16IRX9 | |
| Genomsnitt Intel Core i9-14900HX (67573 - 166040, n=36) | |
| Lenovo Legion Pro 5 16IRX8 | |
| Alienware m16 R2 | |
| MSI Stealth 16 Mercedes-AMG Motorsport A13VG | |
| HP Omen Transcend 16-u1095ng | |
| Asus ROG Zephyrus G16 2024 GU605M | |
| AIDA64 / CPU SHA3 | |
| Lenovo Legion Pro 5 16IRX9 | |
| Genomsnitt Intel Core i9-14900HX (3589 - 7979, n=36) | |
| Lenovo Legion Pro 5 16IRX8 | |
| HP Omen Transcend 16-u1095ng | |
| Alienware m16 R2 | |
| MSI Stealth 16 Mercedes-AMG Motorsport A13VG | |
| Asus ROG Zephyrus G16 2024 GU605M | |
| AIDA64 / CPU Queen | |
| Lenovo Legion Pro 5 16IRX9 | |
| Genomsnitt Intel Core i9-14900HX (118405 - 148966, n=36) | |
| HP Omen Transcend 16-u1095ng | |
| MSI Stealth 16 Mercedes-AMG Motorsport A13VG | |
| Lenovo Legion Pro 5 16IRX8 | |
| Asus ROG Zephyrus G16 2024 GU605M | |
| Alienware m16 R2 | |
| AIDA64 / FPU SinJulia | |
| Lenovo Legion Pro 5 16IRX9 | |
| Genomsnitt Intel Core i9-14900HX (10475 - 18517, n=36) | |
| Lenovo Legion Pro 5 16IRX8 | |
| HP Omen Transcend 16-u1095ng | |
| MSI Stealth 16 Mercedes-AMG Motorsport A13VG | |
| Asus ROG Zephyrus G16 2024 GU605M | |
| Alienware m16 R2 | |
| AIDA64 / FPU Mandel | |
| Lenovo Legion Pro 5 16IRX9 | |
| Genomsnitt Intel Core i9-14900HX (32543 - 83662, n=36) | |
| Lenovo Legion Pro 5 16IRX8 | |
| Alienware m16 R2 | |
| MSI Stealth 16 Mercedes-AMG Motorsport A13VG | |
| HP Omen Transcend 16-u1095ng | |
| Asus ROG Zephyrus G16 2024 GU605M | |
| AIDA64 / CPU AES | |
| Genomsnitt Intel Core i9-14900HX (86964 - 241777, n=36) | |
| Lenovo Legion Pro 5 16IRX9 | |
| Lenovo Legion Pro 5 16IRX8 | |
| HP Omen Transcend 16-u1095ng | |
| MSI Stealth 16 Mercedes-AMG Motorsport A13VG | |
| Alienware m16 R2 | |
| Asus ROG Zephyrus G16 2024 GU605M | |
| AIDA64 / CPU ZLib | |
| Lenovo Legion Pro 5 16IRX9 | |
| Genomsnitt Intel Core i9-14900HX (1054 - 2292, n=36) | |
| Lenovo Legion Pro 5 16IRX8 | |
| HP Omen Transcend 16-u1095ng | |
| Alienware m16 R2 | |
| MSI Stealth 16 Mercedes-AMG Motorsport A13VG | |
| Asus ROG Zephyrus G16 2024 GU605M | |
| AIDA64 / FP64 Ray-Trace | |
| Lenovo Legion Pro 5 16IRX9 | |
| Genomsnitt Intel Core i9-14900HX (6809 - 18349, n=36) | |
| Lenovo Legion Pro 5 16IRX8 | |
| MSI Stealth 16 Mercedes-AMG Motorsport A13VG | |
| Alienware m16 R2 | |
| HP Omen Transcend 16-u1095ng | |
| Asus ROG Zephyrus G16 2024 GU605M | |
| AIDA64 / CPU PhotoWorxx | |
| Lenovo Legion Pro 5 16IRX9 | |
| HP Omen Transcend 16-u1095ng | |
| Asus ROG Zephyrus G16 2024 GU605M | |
| MSI Stealth 16 Mercedes-AMG Motorsport A13VG | |
| Genomsnitt Intel Core i9-14900HX (23903 - 54702, n=36) | |
| Alienware m16 R2 | |
| Lenovo Legion Pro 5 16IRX8 | |
Stresstest
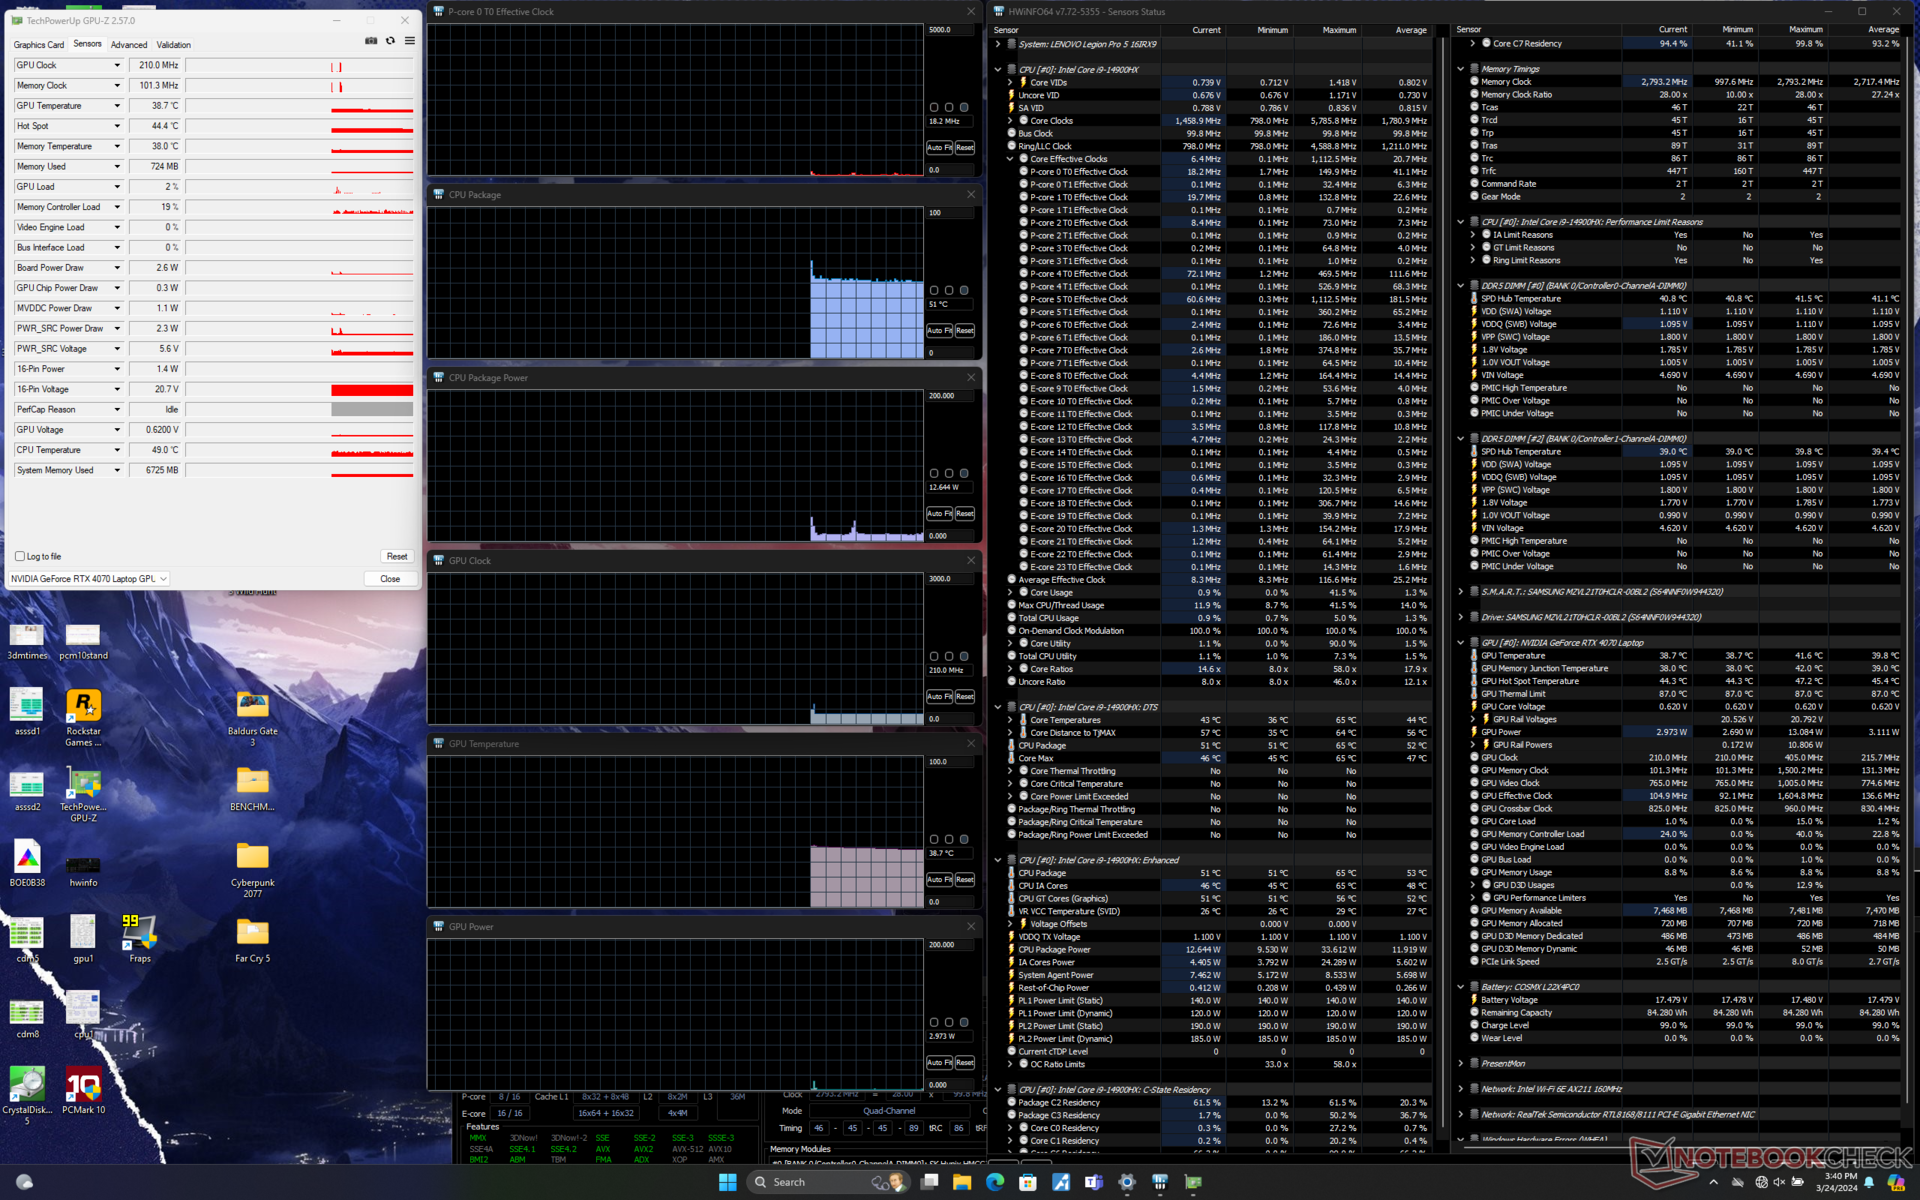
CPU:n ökar till 4 GHz och 187 W när Prime95 körs. När kärntemperaturen når 97 C några sekunder senare stabiliseras dock processorn snabbt till 2,8 GHz och 104 W för att hålla en mer hanterbar kärntemperatur på 89 C. Även om det är något varmare än på förra årets modell är det åtminstone svalare än på Alienware m16 R2 med den långsammare Core Ultra 7-processorn under liknande förhållanden.
Grafikprestandan minskar när du växlar från Performance-läget till Balanced-läget, vilket framgår av avsnittet om GPU-prestanda nedan. GPU-kortets strömförbrukning och klockfrekvens i Performance-läget skulle minska från 114 W respektive 2640 MHz till 2280 MHz och 77 W i Balanced-läget. Å andra sidan är kärntemperaturen betydligt lägre med ca 10 C när du kör i balanserat läge eftersom den övergripande prestandan är långsammare.
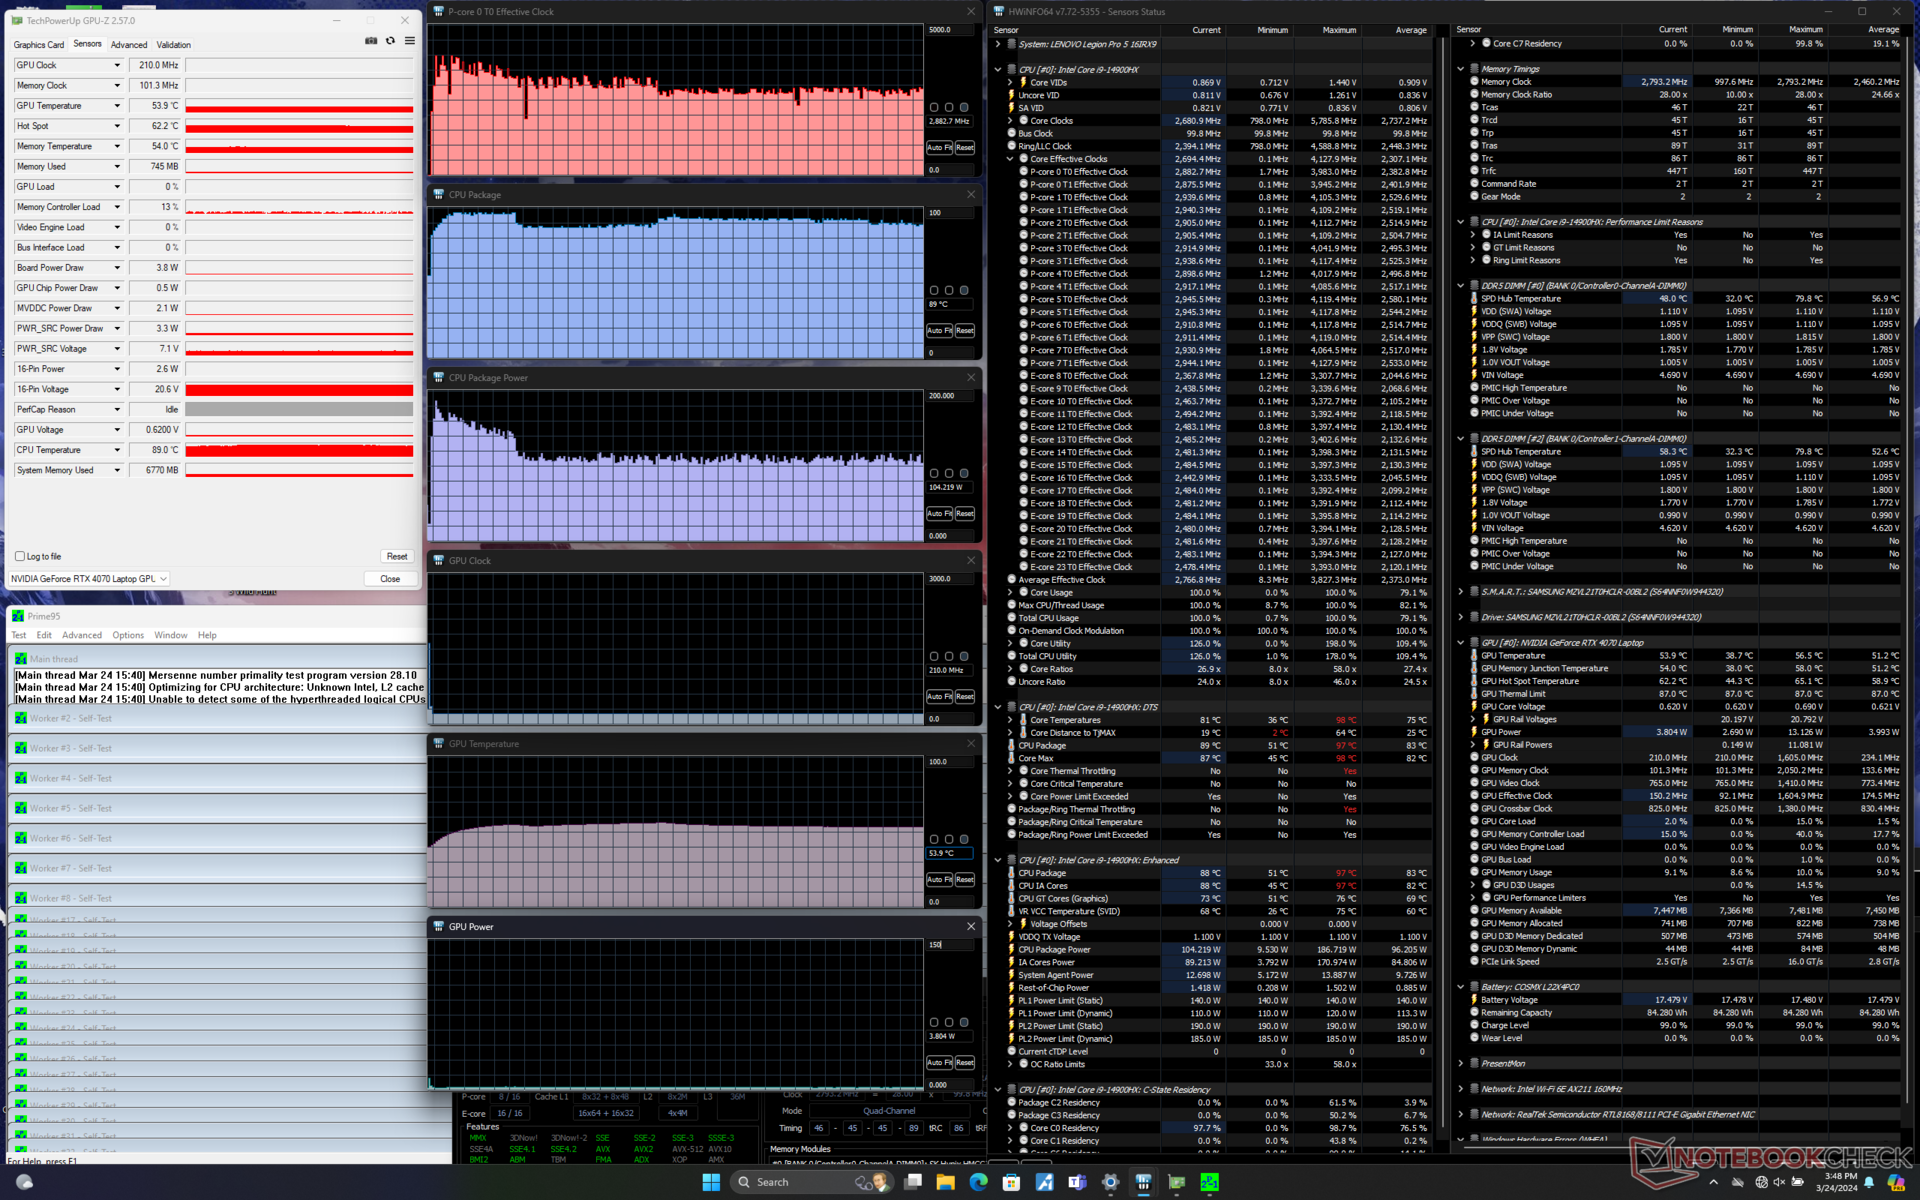
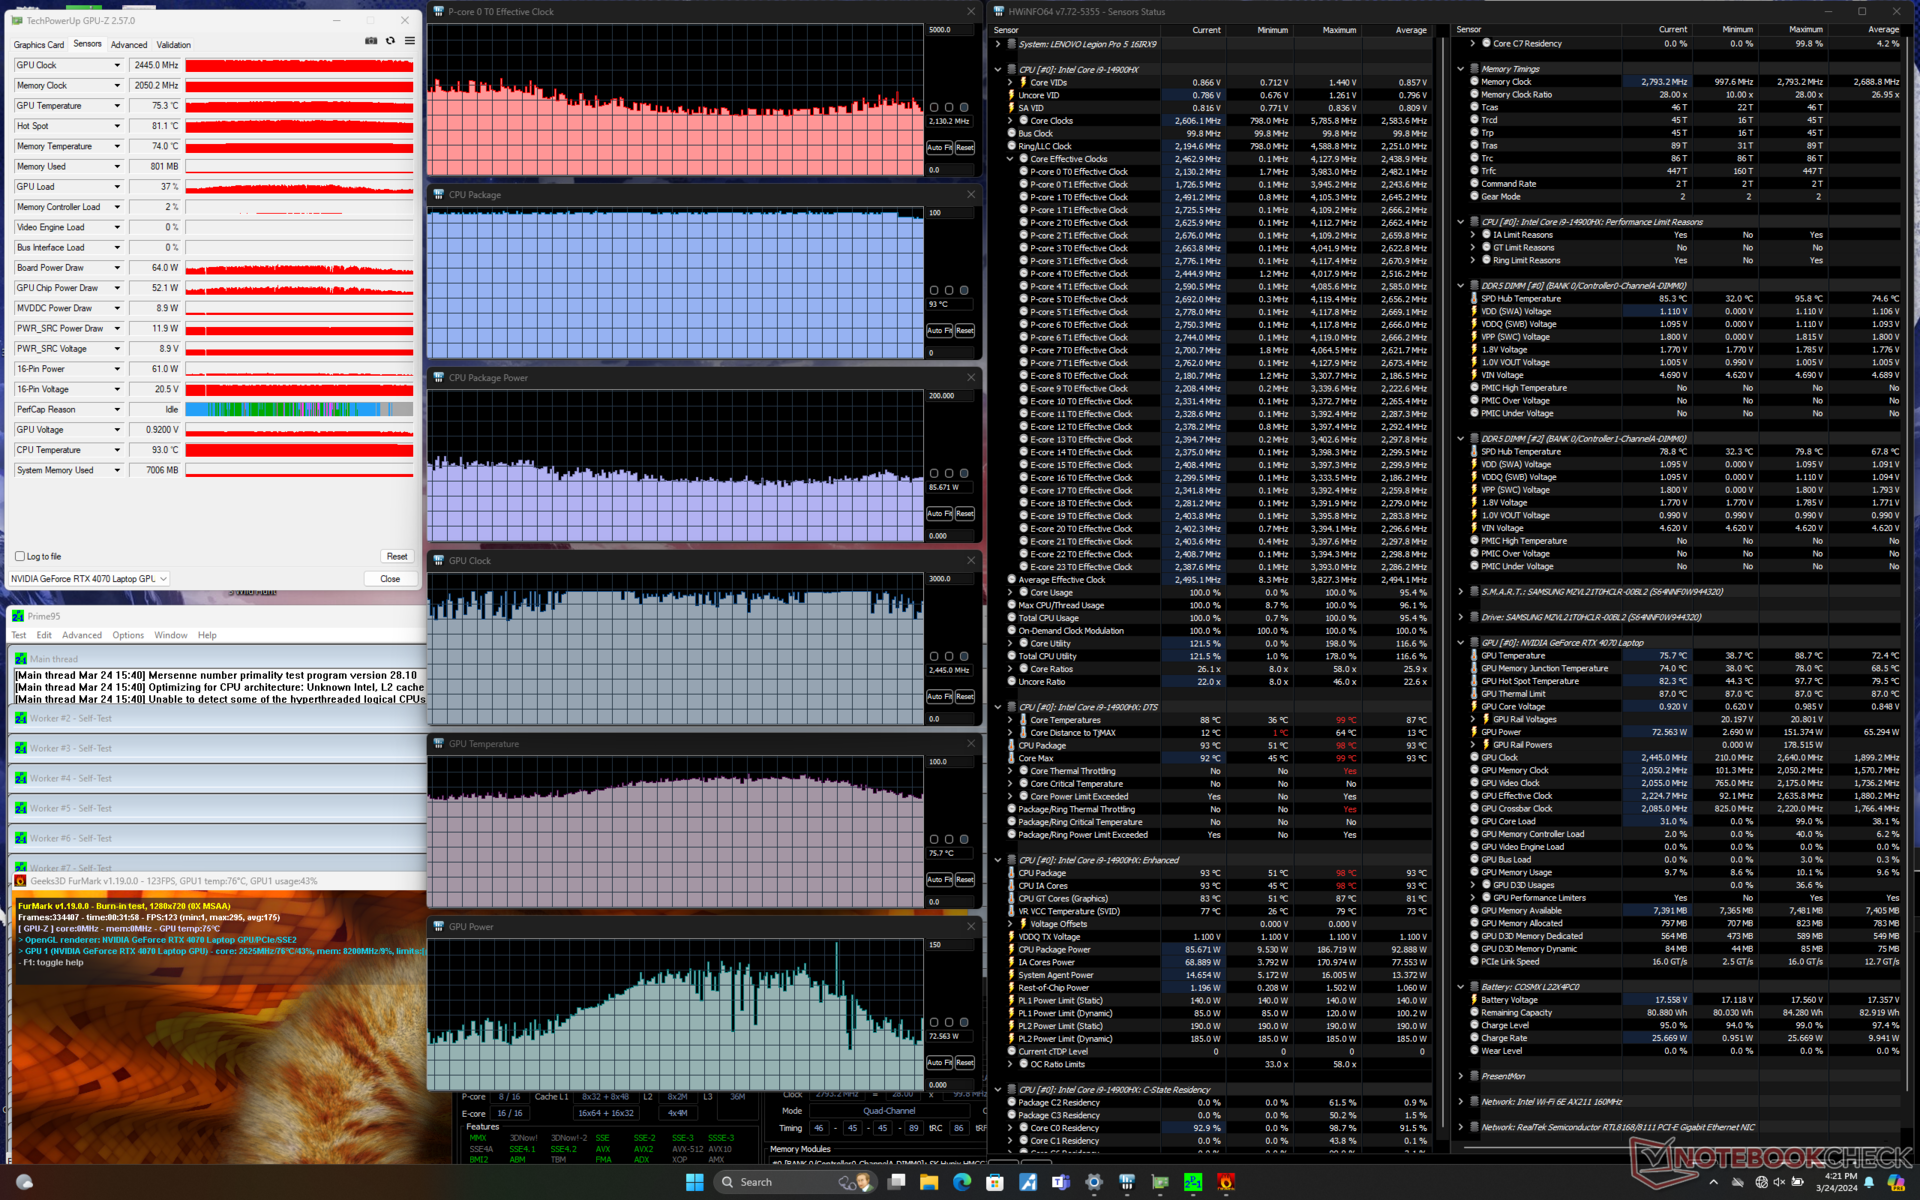
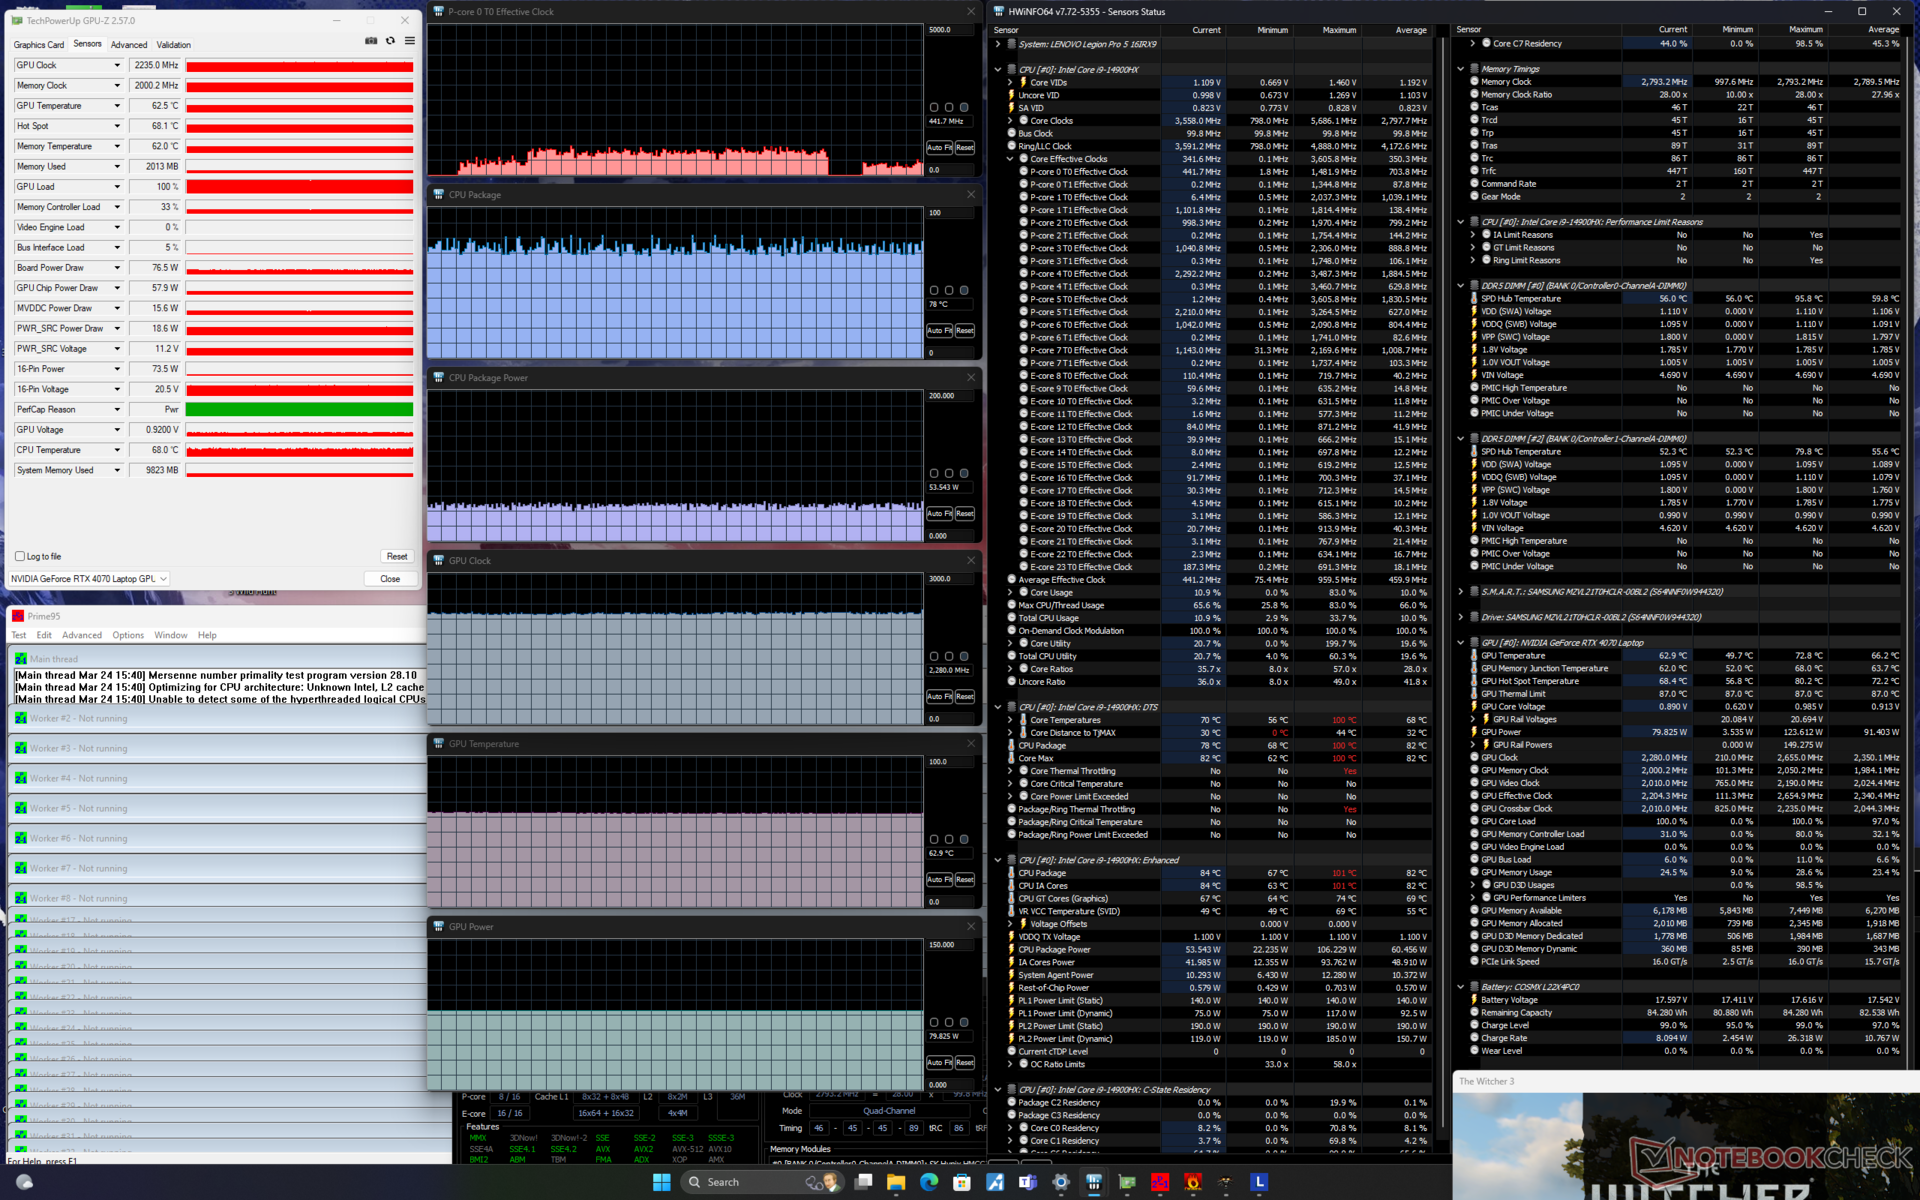
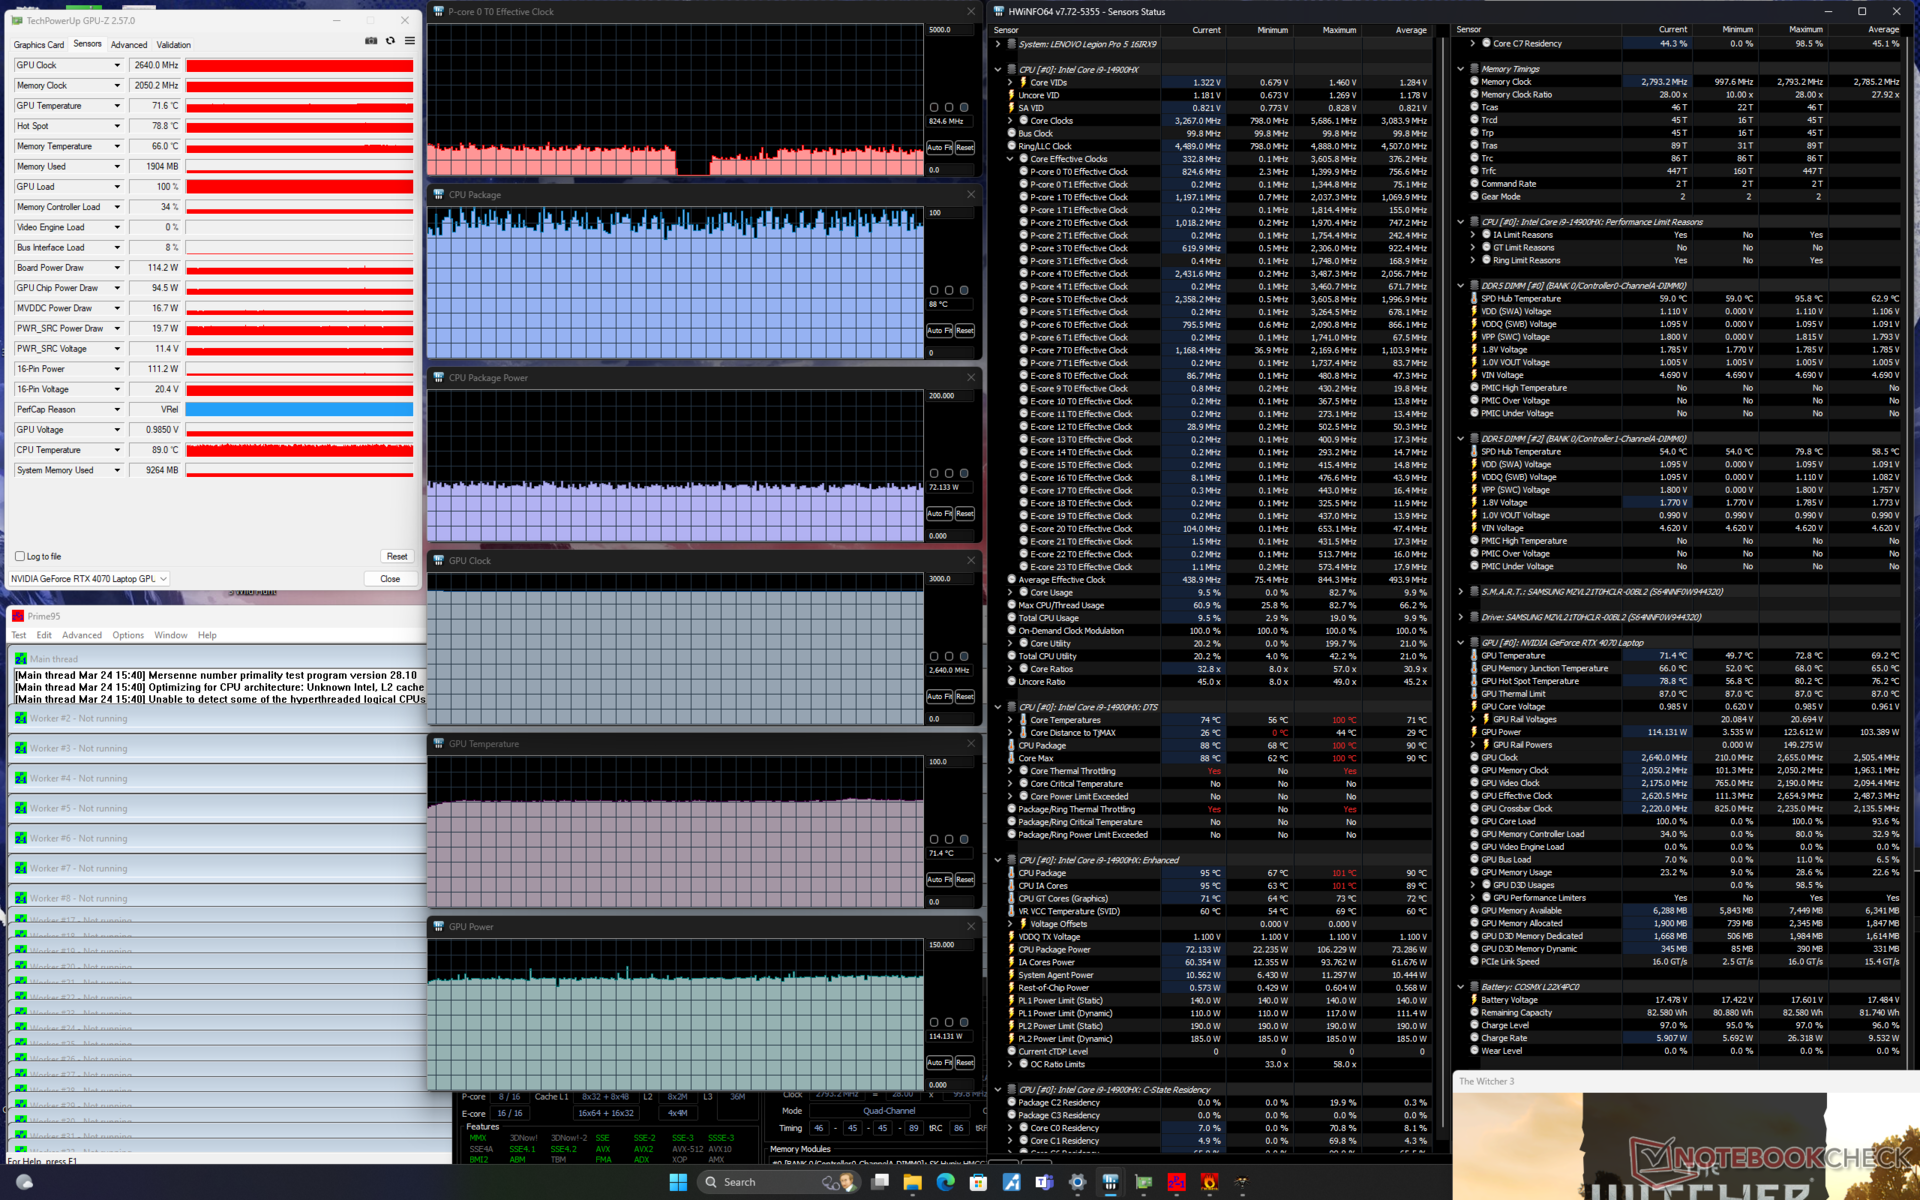
| CPU-klocka (GHz) | GPU-klocka (MHz) | Genomsnittlig CPU-temperatur (°C) | Genomsnittlig GPU-temperatur (°C) | |
| System i viloläge | -- | -- | 51 | 39 |
| Prime95 Stress | 2.8 | -- | 89 | 54 |
| Prime95 + FurMark Stress | ~2.1 | 2100 - 2700 | 95 | 70 - 88 |
| Witcher 3 Stress (balanserat läge) | ~0,5 | 2280 | ~78 | 63 |
| Witcher 3 Stress (Performance mode) | ~0,9 | 2640 | ~88 | 72 |
Systemets prestanda
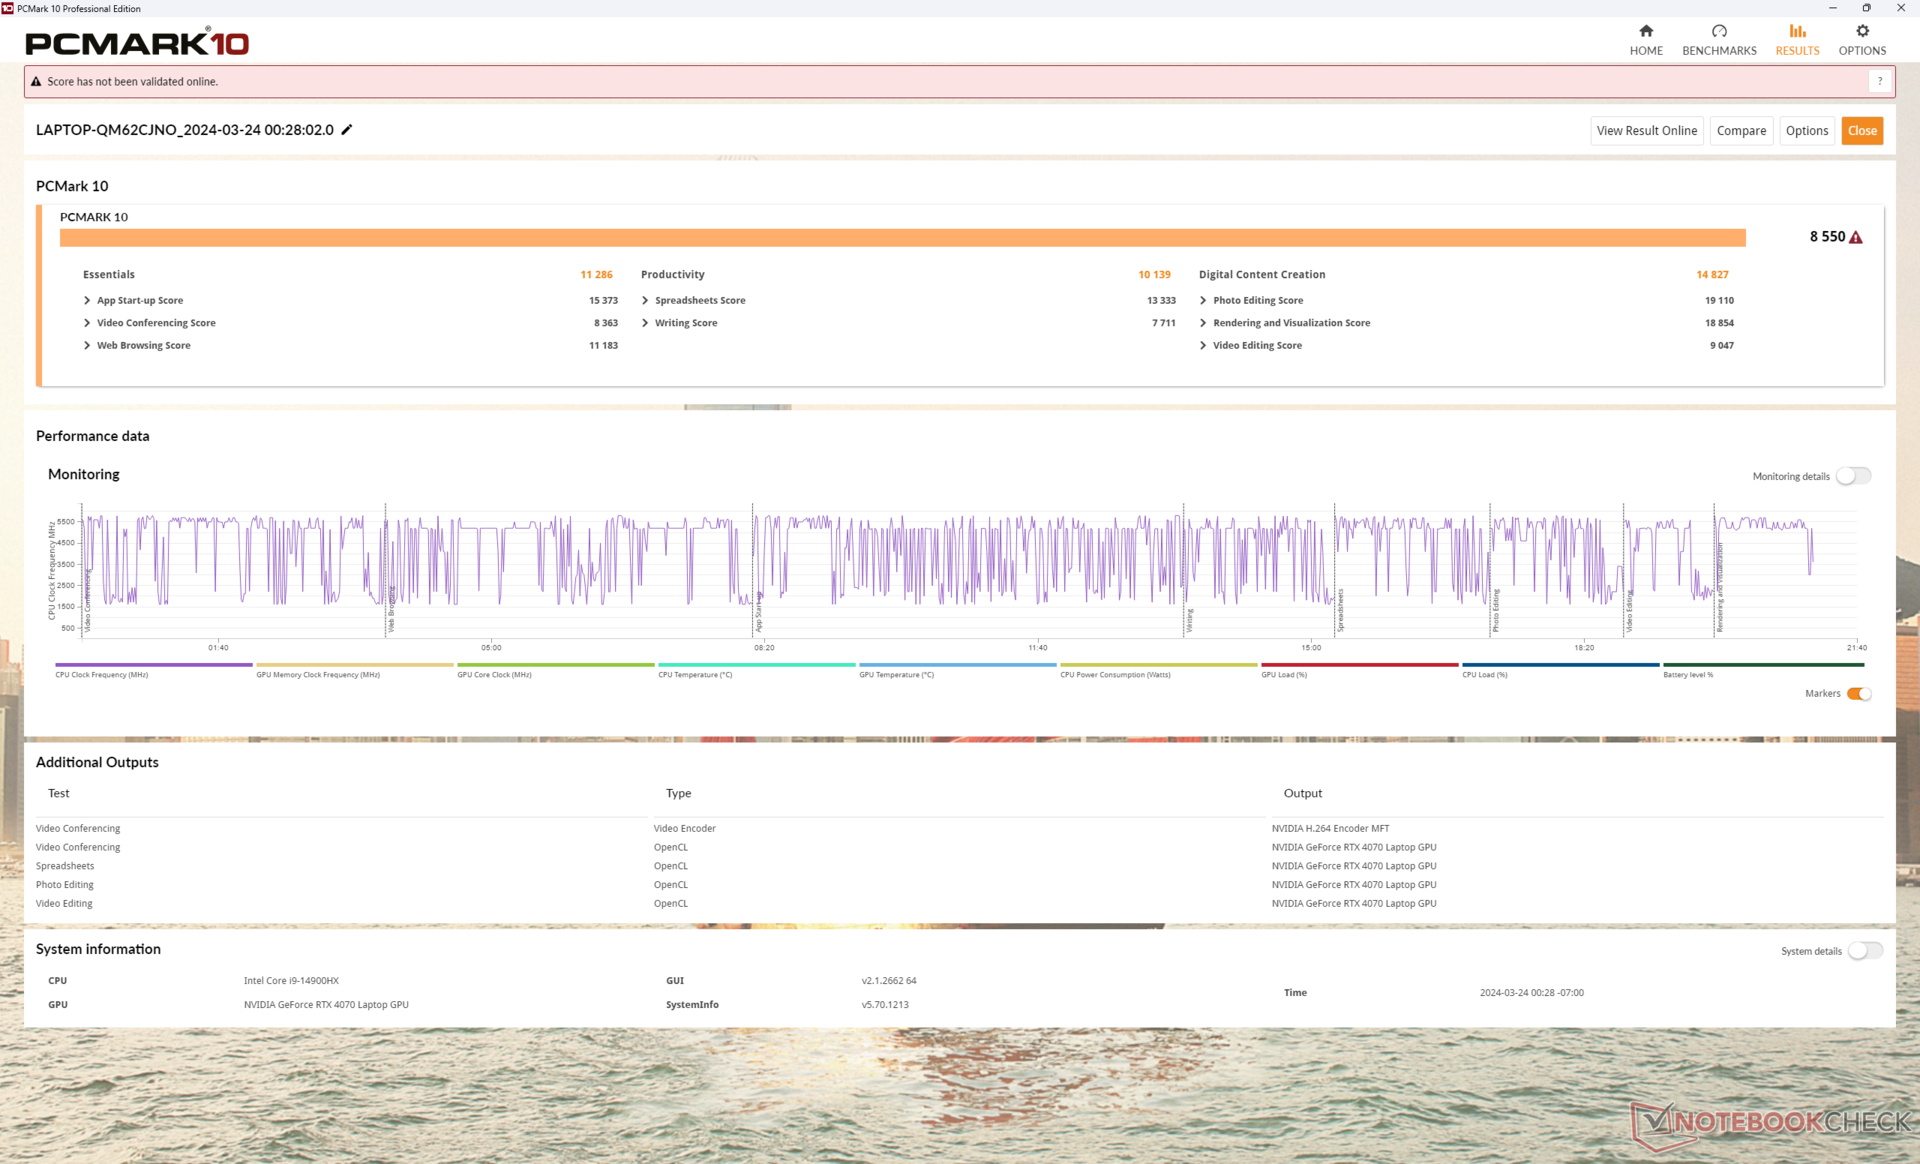
PCMark-resultaten är konsekvent högre än för den äldre Legion Pro 5 16IRX8 eftersom vår enhet är konfigurerad med avancerade Core i9- och GeForce RTX-delar. Vi upplevde inte heller några problem med att vakna från viloläge som vi såg på den senaste Alienware m16 R2.
CrossMark: Overall | Productivity | Creativity | Responsiveness
WebXPRT 3: Overall
WebXPRT 4: Overall
Mozilla Kraken 1.1: Total
| PCMark 10 / Score | |
| Lenovo Legion Pro 5 16IRX9 | |
| Genomsnitt Intel Core i9-14900HX, NVIDIA GeForce RTX 4070 Laptop GPU (7768 - 8550, n=8) | |
| HP Omen Transcend 16-u1095ng | |
| Alienware m16 R2 | |
| Lenovo Legion Pro 5 16IRX8 | |
| MSI Stealth 16 Mercedes-AMG Motorsport A13VG | |
| Asus ROG Zephyrus G16 2024 GU605M | |
| PCMark 10 / Essentials | |
| Lenovo Legion Pro 5 16IRX9 | |
| Genomsnitt Intel Core i9-14900HX, NVIDIA GeForce RTX 4070 Laptop GPU (10104 - 11815, n=8) | |
| Lenovo Legion Pro 5 16IRX8 | |
| MSI Stealth 16 Mercedes-AMG Motorsport A13VG | |
| HP Omen Transcend 16-u1095ng | |
| Alienware m16 R2 | |
| Asus ROG Zephyrus G16 2024 GU605M | |
| PCMark 10 / Productivity | |
| Genomsnitt Intel Core i9-14900HX, NVIDIA GeForce RTX 4070 Laptop GPU (9577 - 11103, n=8) | |
| HP Omen Transcend 16-u1095ng | |
| Lenovo Legion Pro 5 16IRX9 | |
| MSI Stealth 16 Mercedes-AMG Motorsport A13VG | |
| Alienware m16 R2 | |
| Asus ROG Zephyrus G16 2024 GU605M | |
| Lenovo Legion Pro 5 16IRX8 | |
| PCMark 10 / Digital Content Creation | |
| Lenovo Legion Pro 5 16IRX9 | |
| Genomsnitt Intel Core i9-14900HX, NVIDIA GeForce RTX 4070 Laptop GPU (12114 - 14827, n=8) | |
| Alienware m16 R2 | |
| Lenovo Legion Pro 5 16IRX8 | |
| HP Omen Transcend 16-u1095ng | |
| Asus ROG Zephyrus G16 2024 GU605M | |
| MSI Stealth 16 Mercedes-AMG Motorsport A13VG | |
| CrossMark / Overall | |
| Genomsnitt Intel Core i9-14900HX, NVIDIA GeForce RTX 4070 Laptop GPU (2002 - 2312, n=7) | |
| Lenovo Legion Pro 5 16IRX9 | |
| Alienware m16 R2 | |
| Asus ROG Zephyrus G16 2024 GU605M | |
| Lenovo Legion Pro 5 16IRX8 | |
| CrossMark / Productivity | |
| Genomsnitt Intel Core i9-14900HX, NVIDIA GeForce RTX 4070 Laptop GPU (1827 - 2191, n=7) | |
| Lenovo Legion Pro 5 16IRX9 | |
| Alienware m16 R2 | |
| Asus ROG Zephyrus G16 2024 GU605M | |
| Lenovo Legion Pro 5 16IRX8 | |
| CrossMark / Creativity | |
| Genomsnitt Intel Core i9-14900HX, NVIDIA GeForce RTX 4070 Laptop GPU (2258 - 2458, n=7) | |
| Lenovo Legion Pro 5 16IRX9 | |
| Asus ROG Zephyrus G16 2024 GU605M | |
| Alienware m16 R2 | |
| Lenovo Legion Pro 5 16IRX8 | |
| CrossMark / Responsiveness | |
| Genomsnitt Intel Core i9-14900HX, NVIDIA GeForce RTX 4070 Laptop GPU (1734 - 2330, n=7) | |
| Lenovo Legion Pro 5 16IRX9 | |
| Lenovo Legion Pro 5 16IRX8 | |
| Alienware m16 R2 | |
| Asus ROG Zephyrus G16 2024 GU605M | |
| WebXPRT 3 / Overall | |
| HP Omen Transcend 16-u1095ng | |
| Lenovo Legion Pro 5 16IRX9 | |
| Genomsnitt Intel Core i9-14900HX, NVIDIA GeForce RTX 4070 Laptop GPU (269 - 342, n=8) | |
| Alienware m16 R2 | |
| Asus ROG Zephyrus G16 2024 GU605M | |
| Lenovo Legion Pro 5 16IRX8 | |
| WebXPRT 4 / Overall | |
| Genomsnitt Intel Core i9-14900HX, NVIDIA GeForce RTX 4070 Laptop GPU (291 - 304, n=6) | |
| Lenovo Legion Pro 5 16IRX9 | |
| Alienware m16 R2 | |
| Asus ROG Zephyrus G16 2024 GU605M | |
| Lenovo Legion Pro 5 16IRX8 | |
| Mozilla Kraken 1.1 / Total | |
| Asus ROG Zephyrus G16 2024 GU605M | |
| Alienware m16 R2 | |
| Lenovo Legion Pro 5 16IRX8 | |
| Lenovo Legion Pro 5 16IRX9 | |
| Genomsnitt Intel Core i9-14900HX, NVIDIA GeForce RTX 4070 Laptop GPU (431 - 469, n=8) | |
| HP Omen Transcend 16-u1095ng | |
* ... mindre är bättre
| PCMark 10 Score | 8550 poäng | |
Hjälp | ||
| AIDA64 / Memory Copy | |
| Asus ROG Zephyrus G16 2024 GU605M | |
| Lenovo Legion Pro 5 16IRX9 | |
| HP Omen Transcend 16-u1095ng | |
| Genomsnitt Intel Core i9-14900HX (38028 - 83392, n=36) | |
| MSI Stealth 16 Mercedes-AMG Motorsport A13VG | |
| Alienware m16 R2 | |
| Lenovo Legion Pro 5 16IRX8 | |
| AIDA64 / Memory Read | |
| Asus ROG Zephyrus G16 2024 GU605M | |
| Lenovo Legion Pro 5 16IRX9 | |
| HP Omen Transcend 16-u1095ng | |
| Genomsnitt Intel Core i9-14900HX (43306 - 87568, n=36) | |
| Alienware m16 R2 | |
| MSI Stealth 16 Mercedes-AMG Motorsport A13VG | |
| Lenovo Legion Pro 5 16IRX8 | |
| AIDA64 / Memory Write | |
| HP Omen Transcend 16-u1095ng | |
| Lenovo Legion Pro 5 16IRX9 | |
| Asus ROG Zephyrus G16 2024 GU605M | |
| MSI Stealth 16 Mercedes-AMG Motorsport A13VG | |
| Genomsnitt Intel Core i9-14900HX (37146 - 80589, n=36) | |
| Alienware m16 R2 | |
| Lenovo Legion Pro 5 16IRX8 | |
| AIDA64 / Memory Latency | |
| Asus ROG Zephyrus G16 2024 GU605M | |
| Alienware m16 R2 | |
| MSI Stealth 16 Mercedes-AMG Motorsport A13VG | |
| HP Omen Transcend 16-u1095ng | |
| Genomsnitt Intel Core i9-14900HX (76.1 - 105, n=36) | |
| Lenovo Legion Pro 5 16IRX9 | |
| Lenovo Legion Pro 5 16IRX8 | |
* ... mindre är bättre
DPC-fördröjning
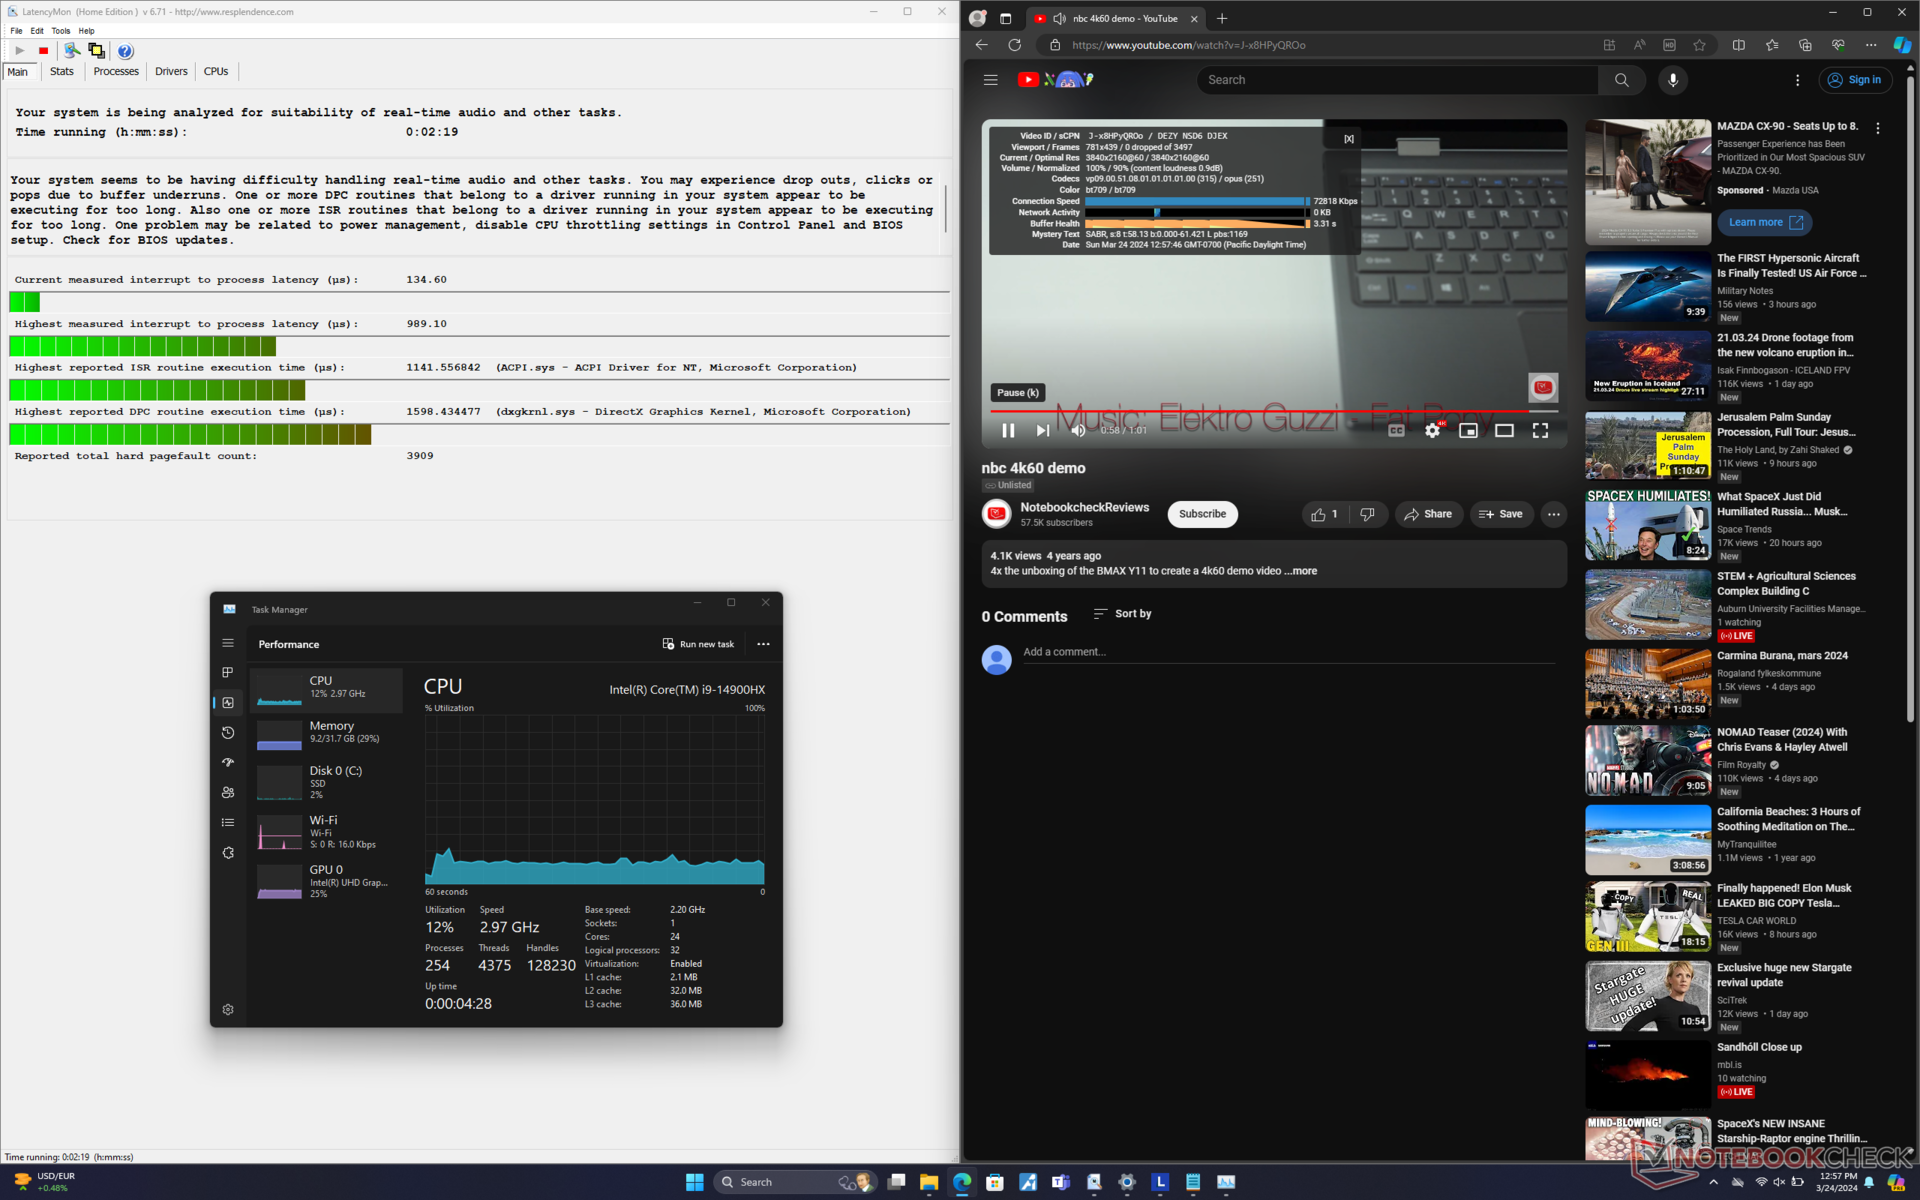
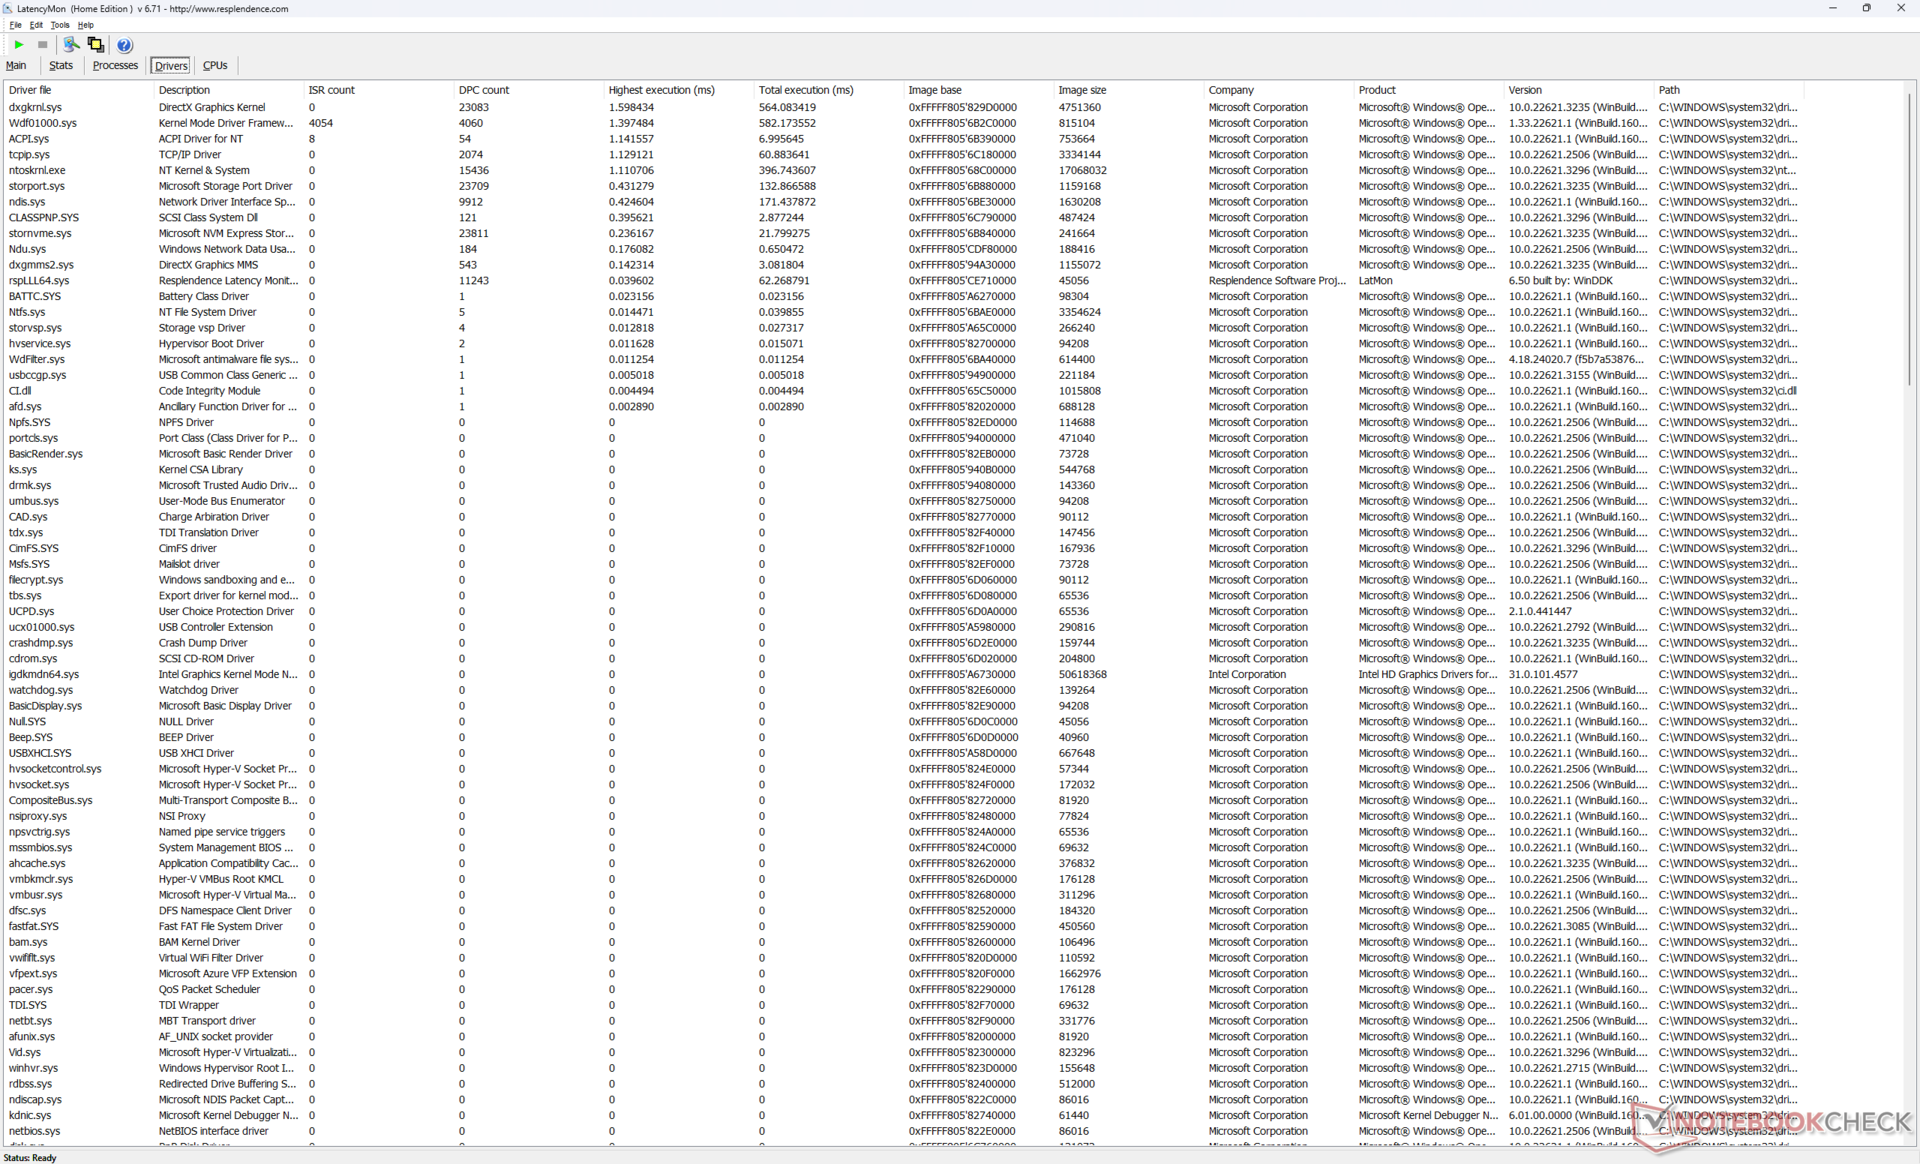
LatencyMon visar DPC-problem när flera webbläsarflikar öppnas på vår hemsida. uppspelning av 4K-video med 60 FPS är annars perfekt i iGPU-läget och inga tappade bildrutor registreras.
| DPC Latencies / LatencyMon - interrupt to process latency (max), Web, Youtube, Prime95 | |
| MSI Stealth 16 Mercedes-AMG Motorsport A13VG | |
| Asus ROG Zephyrus G16 2024 GU605M | |
| Alienware m16 R2 | |
| HP Omen Transcend 16-u1095ng | |
| Lenovo Legion Pro 5 16IRX9 | |
| Lenovo Legion Pro 5 16IRX8 | |
* ... mindre är bättre
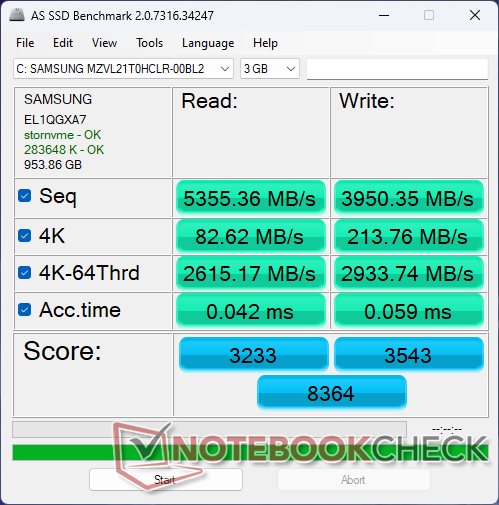
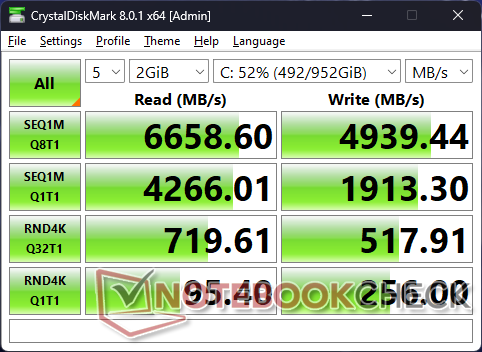
Lagringsenheter
Vår enhet levereras med Samsung PM9A1 istället för SK Hynix PC801 som fanns på förra årets Legion Pro 5 16IRX8. Intressant nog uppvisade vår Samsung-enhet strypning med överföringshastigheter som sjönk från 6600 MB/s till bara 3300 MB/s halvvägs in i vårt DiskSpd-looptest. Samtidigt hade SK Hynix-enheten i förra årets modell inga problem med att upprätthålla mycket högre överföringshastigheter under liknande förhållanden, vilket framgår av vår jämförelsegraf nedan. Det finns tyvärr inget enkelt sätt att veta vilken SSD som modellen kommer att levereras med innan du köper den.

* ... mindre är bättre
Disk Throttling: DiskSpd Read Loop, Queue Depth 8
GPU-prestanda
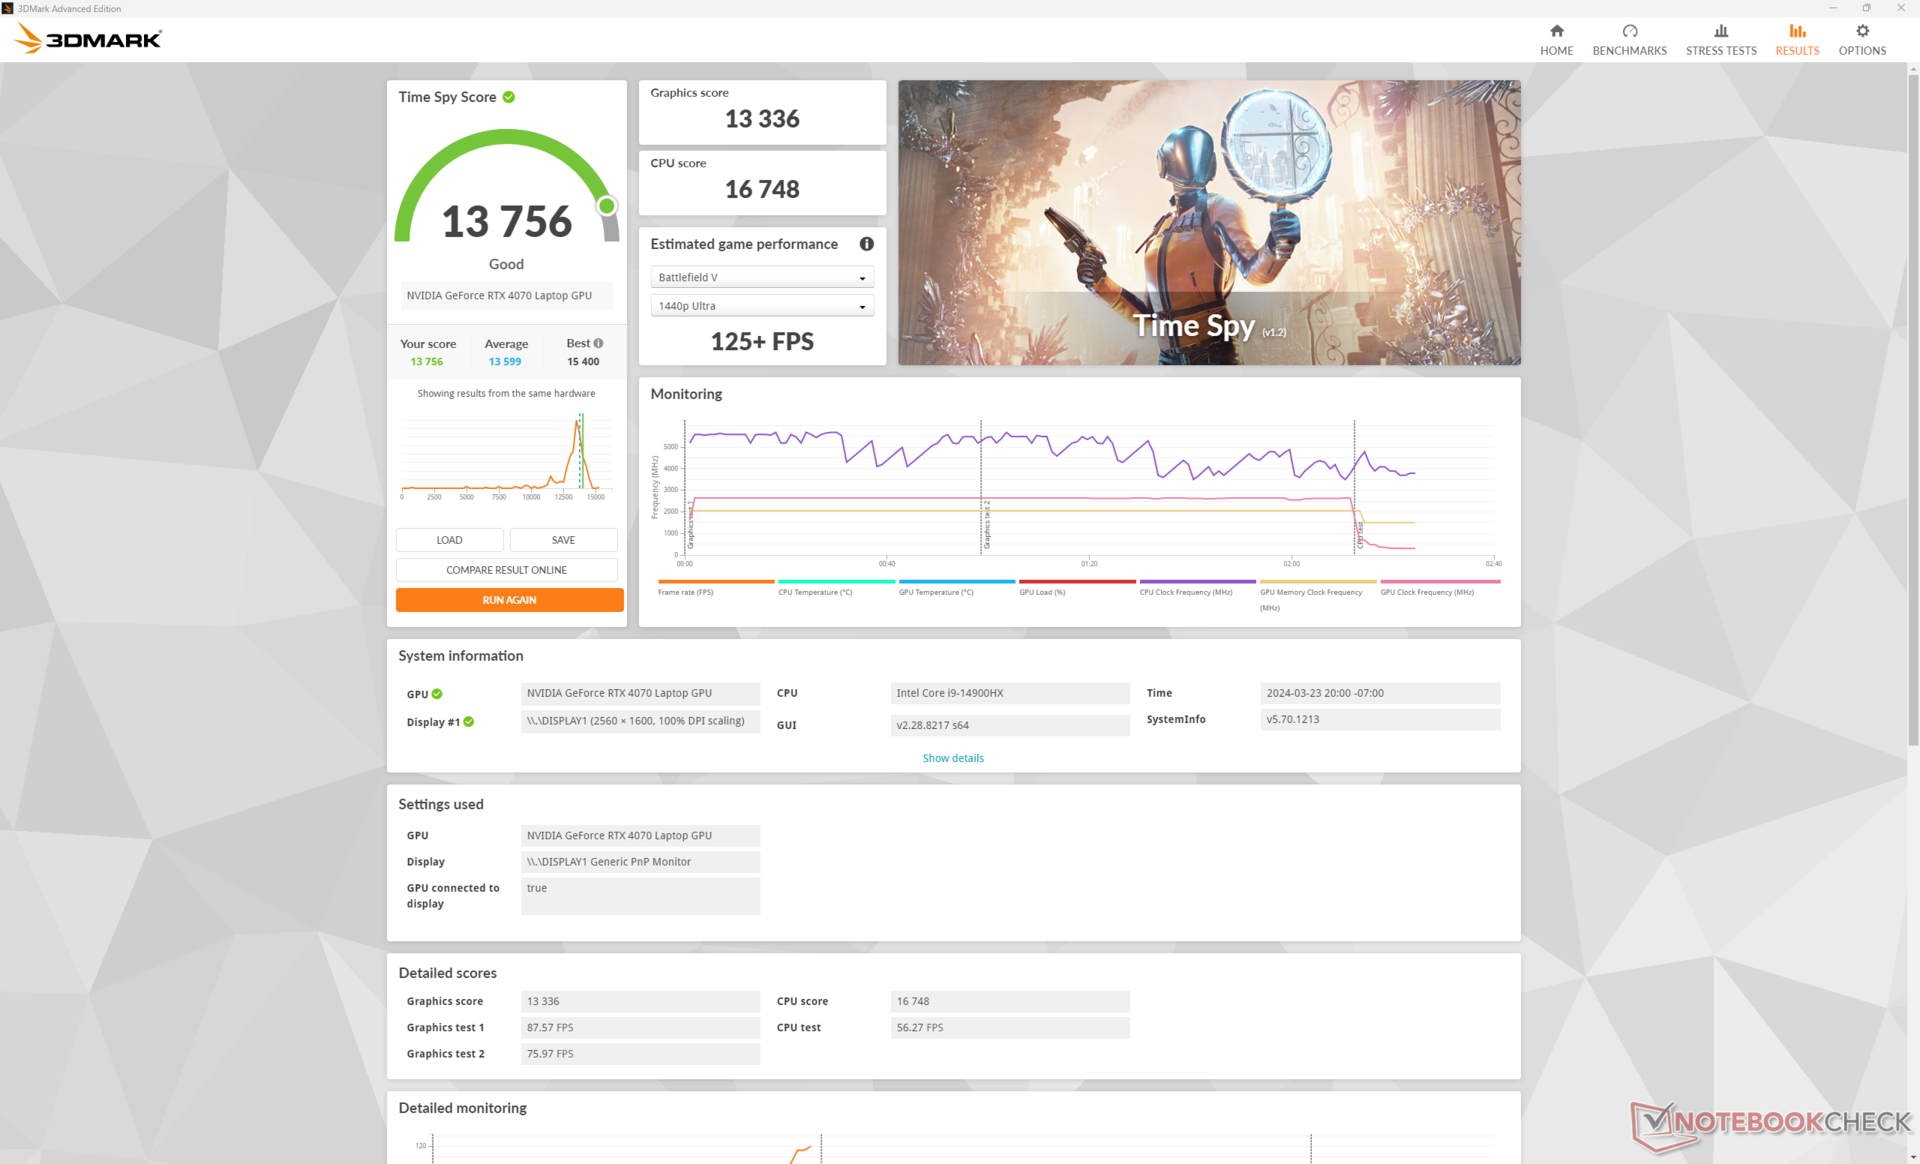
Grafikalternativen inkluderar GeForce RTX 4050, 4060 och 4070 med samma 140 W TGP-mål. Vi är villiga att satsa på att modellen kan stödja snabbare RTX 4080 och 4090-alternativ med tanke på dess storlek och vikt, men Lenovo vill reservera sådana avancerade alternativ för den dyrare Legion Pro 7-serien istället. Trots detta är RTX 4070 i vår Legion Pro 5 16 körs mycket bra med riktmärkesresultat som är upp till 15 procent snabbare än den genomsnittliga bärbara datorn i vår databas med samma GPU-alternativ.
Nedgradering till RTX 4060 eller 4050 förväntas påverka grafikprestandan med cirka 10 till 20 procent respektive 25 till 35 procent. Användare som uppgraderar från en äldre RTX 3070 Ti laptop kommer inte att se några betydande fördelar om inte titeln stöder DLSS 3 eftersom funktionen fortsätter att vara exklusiv för RTX 40 Ada Lovelace GPU:er.
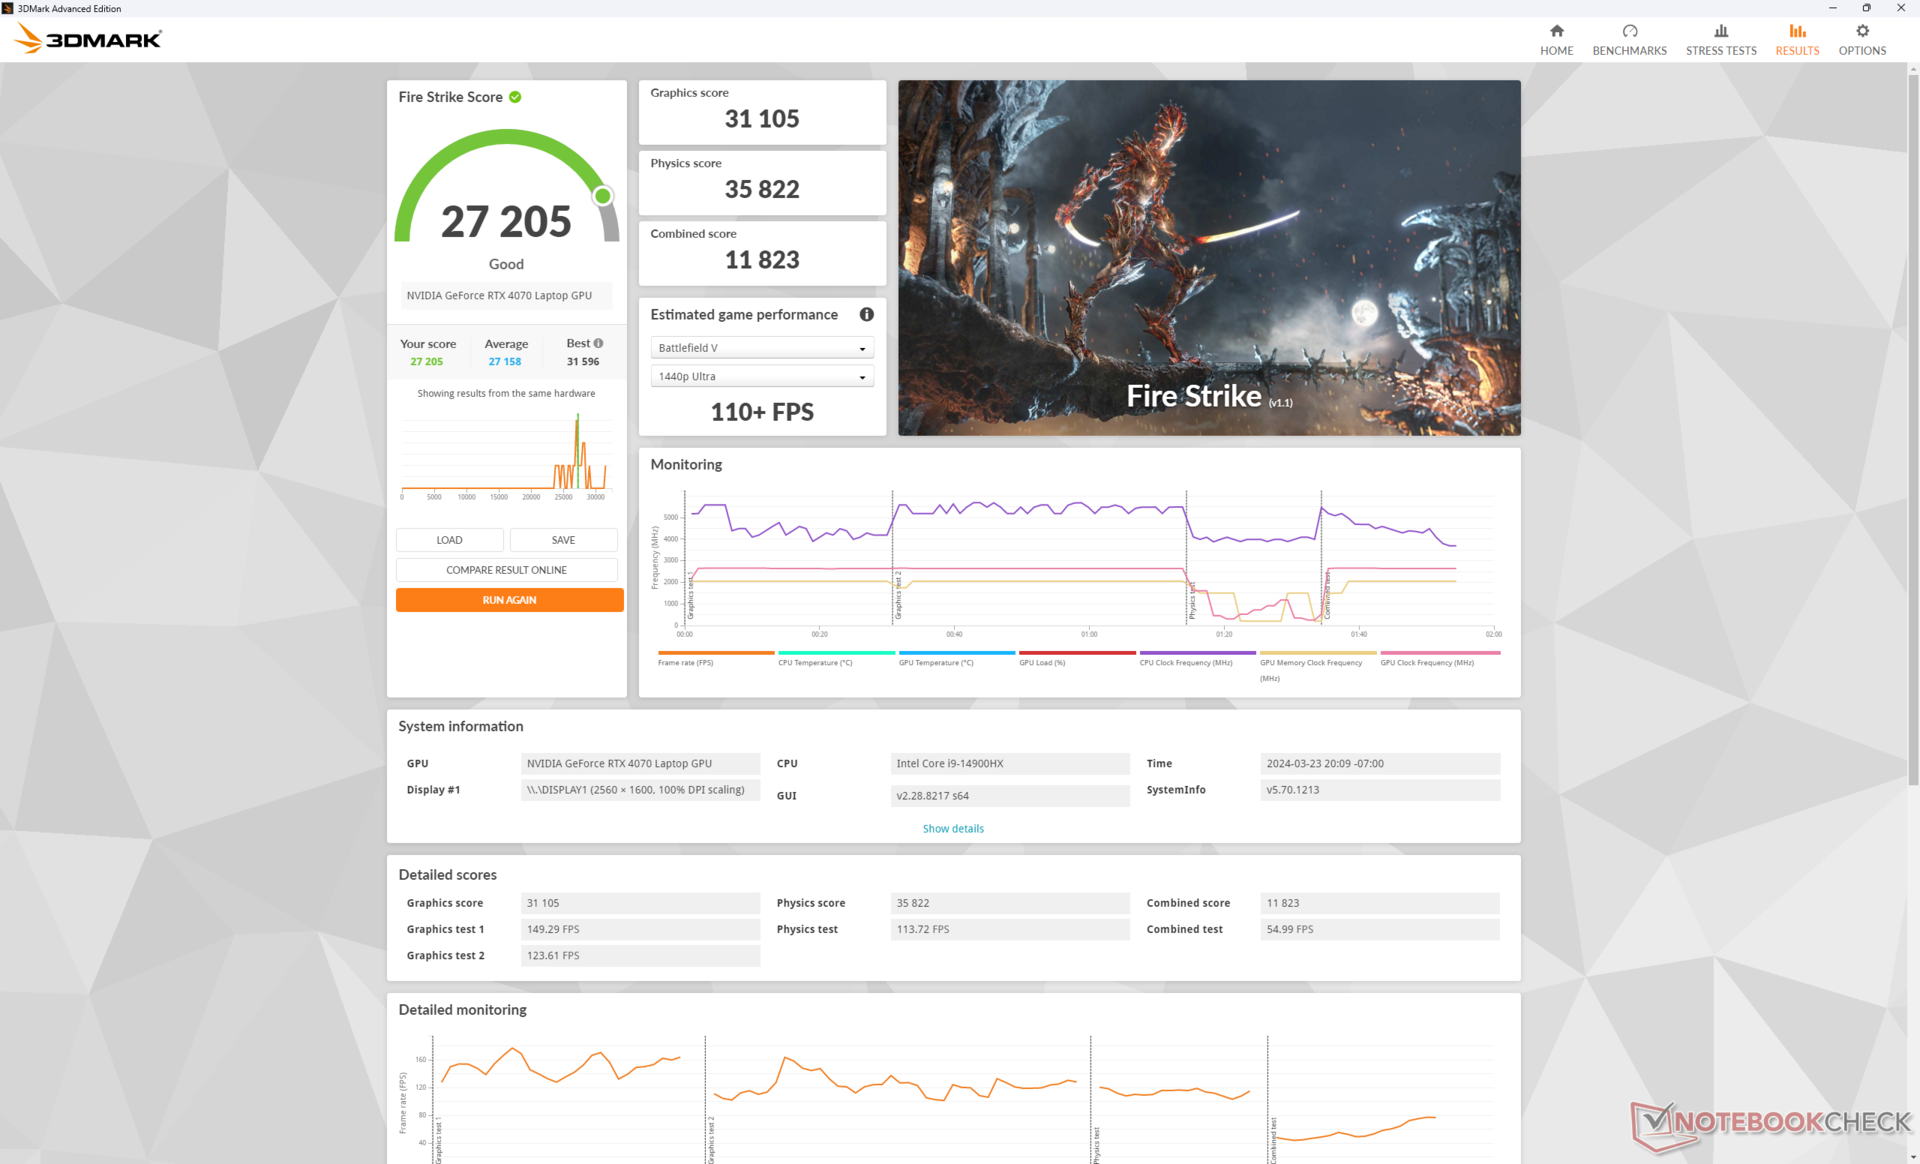
| Kraftprofil | Grafisk poäng | Poäng för fysik | Kombinerat resultat |
| Prestanda-läge | 31105 | 35822 | 11823 |
| Balanserat läge | 29127 (-6%) | 37119 (+4%) | 11040 (-7%) |
| Batteridrift | 21813 (-29%) | 21747 (-39%) | 6324 (-47%) |
Om du ställer in systemet på balanserat läge istället för prestanda minskar GPU-prestandan något med cirka 6 procent, medan CPU-prestandan inte påverkas.
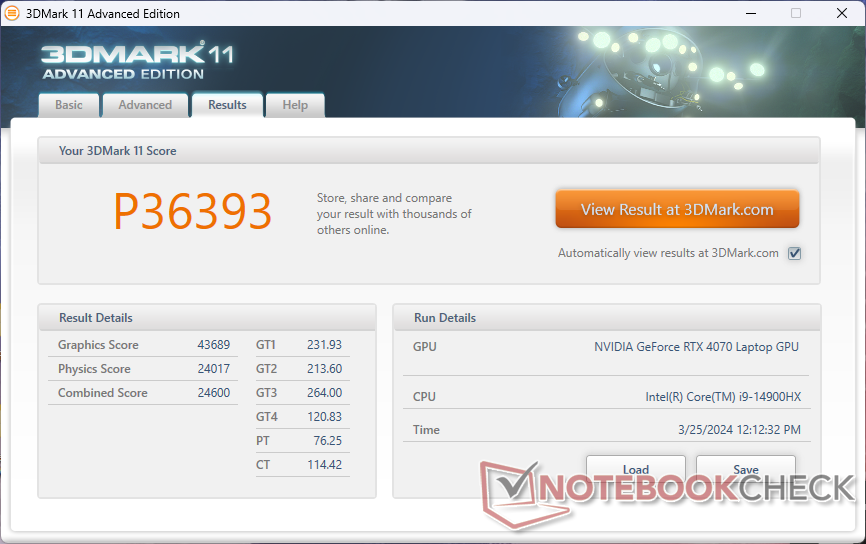
| 3DMark 11 Performance | 36393 poäng | |
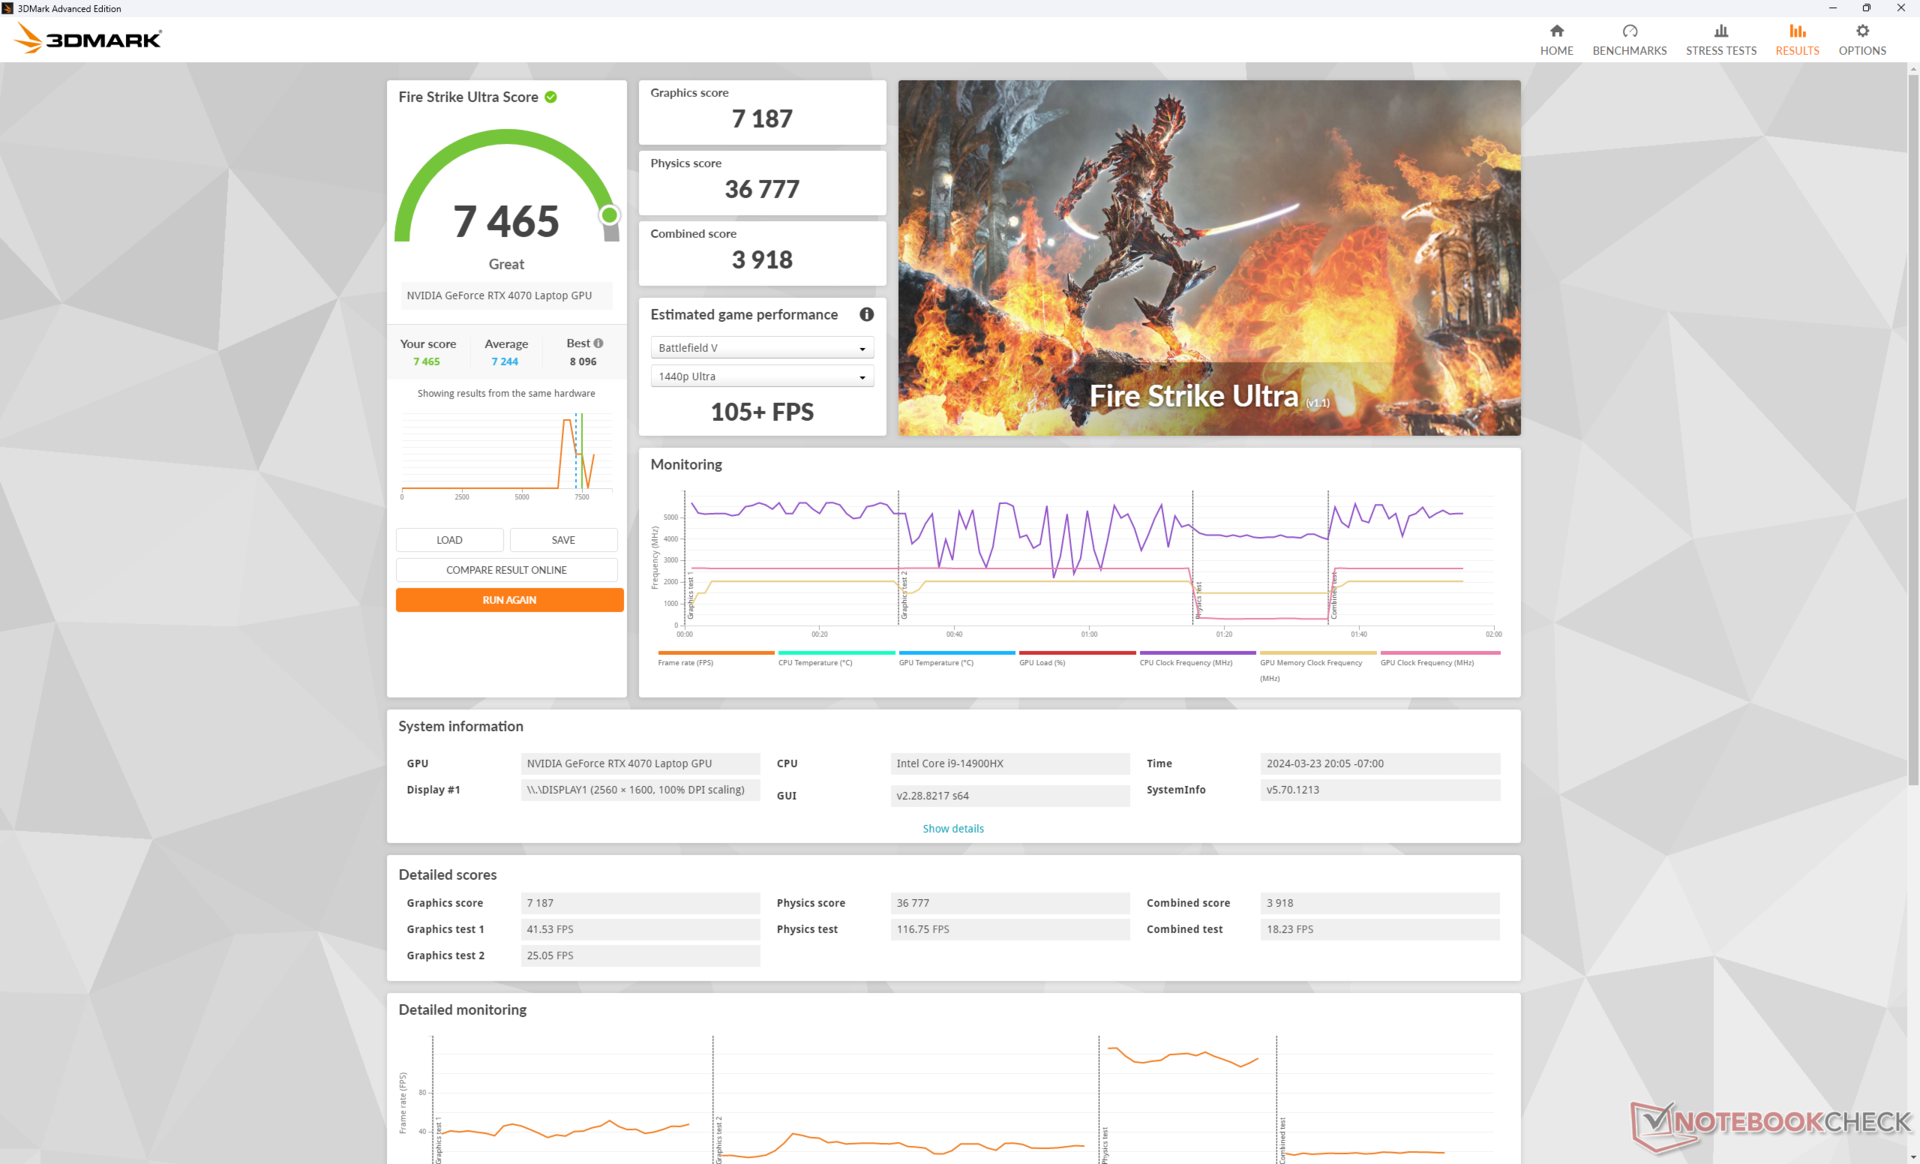
| 3DMark Fire Strike Score | 27205 poäng | |
| 3DMark Time Spy Score | 13756 poäng | |
Hjälp | ||
* ... mindre är bättre
Spelprestanda
Vår Lenovo överträffar nästan konsekvent Alienware m16 R2 med 5 till 10 procent trots att båda levereras med samma 140 W GeForce RTX 4070 GPU. Skillnaden beror sannolikt på vår snabbare Core i9-14900HX-processor medan Alienware istället levereras med Core Ultra 7 155H.
Den mobila RTX 4070 presterar dåligt vid 4K-upplösningar eftersom den är mycket svagare än en "riktig" stationär RTX 4070. För dessa scenarier bör du aktivera DLSS 2 och/eller ramgenerering när det är tillämpligt för att få jämnare bildhastigheter. Om du till exempel kör Cyberpunk 2077 i inbyggd 4K med Ultra-inställningar och ingen RT skulle det resultera i en genomsnittlig bildfrekvens på bara 21. Om DLSS 3 är aktiverat på Balanced kommer dock den genomsnittliga bildfrekvensen att stiga till 64.
Witcher 3 FPS Chart
| låg | med. | hög | ultra | QHD | 4K | |
|---|---|---|---|---|---|---|
| GTA V (2015) | 186.7 | 184.9 | 181.7 | 127.2 | 100.1 | 99.8 |
| The Witcher 3 (2015) | 607.3 | 448.7 | 268.3 | 133.7 | 83.5 | |
| Dota 2 Reborn (2015) | 231 | 205 | 196.7 | 185.3 | 153.3 | |
| Final Fantasy XV Benchmark (2018) | 205 | 185.9 | 131 | 95.1 | 52.8 | |
| X-Plane 11.11 (2018) | 188.3 | 173.3 | 137.6 | 120.3 | ||
| Far Cry 5 (2018) | 191 | 183 | 170 | 158 | 128 | 65 |
| Strange Brigade (2018) | 496 | 340 | 268 | 234 | 150.9 | 77.9 |
| Tiny Tina's Wonderlands (2022) | 283.4 | 230.6 | 151.4 | 115.9 | 79.5 | 36.9 |
| F1 22 (2022) | 320 | 312 | 245 | 88.7 | 58.8 | 27.6 |
| Baldur's Gate 3 (2023) | 176 | 150.8 | 128.5 | 125.6 | 89.6 | 45.2 |
| Cyberpunk 2077 (2023) | 143.4 | 124 | 102.2 | 87.1 | 52.8 | 23.5 |
Utsläpp
Buller från systemet
Fläktljudet är generellt högre än vad vi registrerade på förra årets Core i7- och RTX 4060-modell, vilket kan bero på vår snabbare Core i9- och RTX 4070-konfiguration. När vi kör enkla belastningar som webbläsare eller video ligger fläktljudet vanligtvis strax under 30 dB(A), vilket är i stort sett ohörbart i de flesta scenarier. När du kör 3DMark 06 ökar dock fläktarna hastigheten ganska snabbt även när de är inställda på balanserat läge.
Intressant nog är fläktljudet vid spel i balanserat läge identiskt med prestandaläget på 51 dB(A). Detta stöds av våra stresstestmätningar ovan där kärntemperaturerna skulle vara märkbart svalare i balanserat läge. Därför rekommenderar vi att du spelar i Performance-läget eftersom Balanced-läget inte ger en märkbart tystare upplevelse. Med över 50 dB(A) kommer Lenovo ändå att vara mer högljudd än de flesta andra bärbara speldatorer.
Ljudnivå
| Låg belastning |
| 24.3 / 24.3 / 28.9 dB(A) |
| Hög belastning |
| 45.8 / 56.6 dB(A) |
 | ||
30 dB tyst 40 dB(A) hörbar 50 dB(A) högt ljud |
||
min: | ||
| Lenovo Legion Pro 5 16IRX9 GeForce RTX 4070 Laptop GPU, i9-14900HX, Samsung PM9A1 MZVL21T0HCLR | Lenovo Legion Pro 5 16IRX8 GeForce RTX 4060 Laptop GPU, i7-13700HX, SK hynix PC801 HFS512GEJ9X115N | Alienware m16 R2 GeForce RTX 4070 Laptop GPU, Ultra 7 155H, Samsung PM9A1 MZVL21T0HCLR | HP Omen Transcend 16-u1095ng GeForce RTX 4070 Laptop GPU, i9-14900HX, Kioxia XG8 KXG80ZNV1T02 | Asus ROG Zephyrus G16 2024 GU605M GeForce RTX 4070 Laptop GPU, Ultra 7 155H, WD PC SN560 SDDPNQE-1T00 | MSI Stealth 16 Mercedes-AMG Motorsport A13VG GeForce RTX 4070 Laptop GPU, i9-13900H, Samsung PM9A1 MZVL22T0HBLB | |
|---|---|---|---|---|---|---|
| Noise | 8% | 2% | -2% | 5% | 4% | |
| av / miljö * (dB) | 23.9 | 23 4% | 24.7 -3% | 24 -0% | 23.9 -0% | 25 -5% |
| Idle Minimum * (dB) | 24.3 | 23.1 5% | 25.3 -4% | 29 -19% | 23.9 2% | 25 -3% |
| Idle Average * (dB) | 24.3 | 23.1 5% | 25.3 -4% | 30 -23% | 27.8 -14% | 26 -7% |
| Idle Maximum * (dB) | 28.9 | 26.6 8% | 25.3 12% | 31 -7% | 30.1 -4% | 27 7% |
| Load Average * (dB) | 45.8 | 34.7 24% | 31.7 31% | 45 2% | 34.2 25% | 39 15% |
| Witcher 3 ultra * (dB) | 51 | 47.6 7% | 53.8 -5% | 44 14% | 46.4 9% | 45 12% |
| Load Maximum * (dB) | 56.6 | 54.8 3% | 62 -10% | 47 17% | 46.4 18% | 51 10% |
* ... mindre är bättre
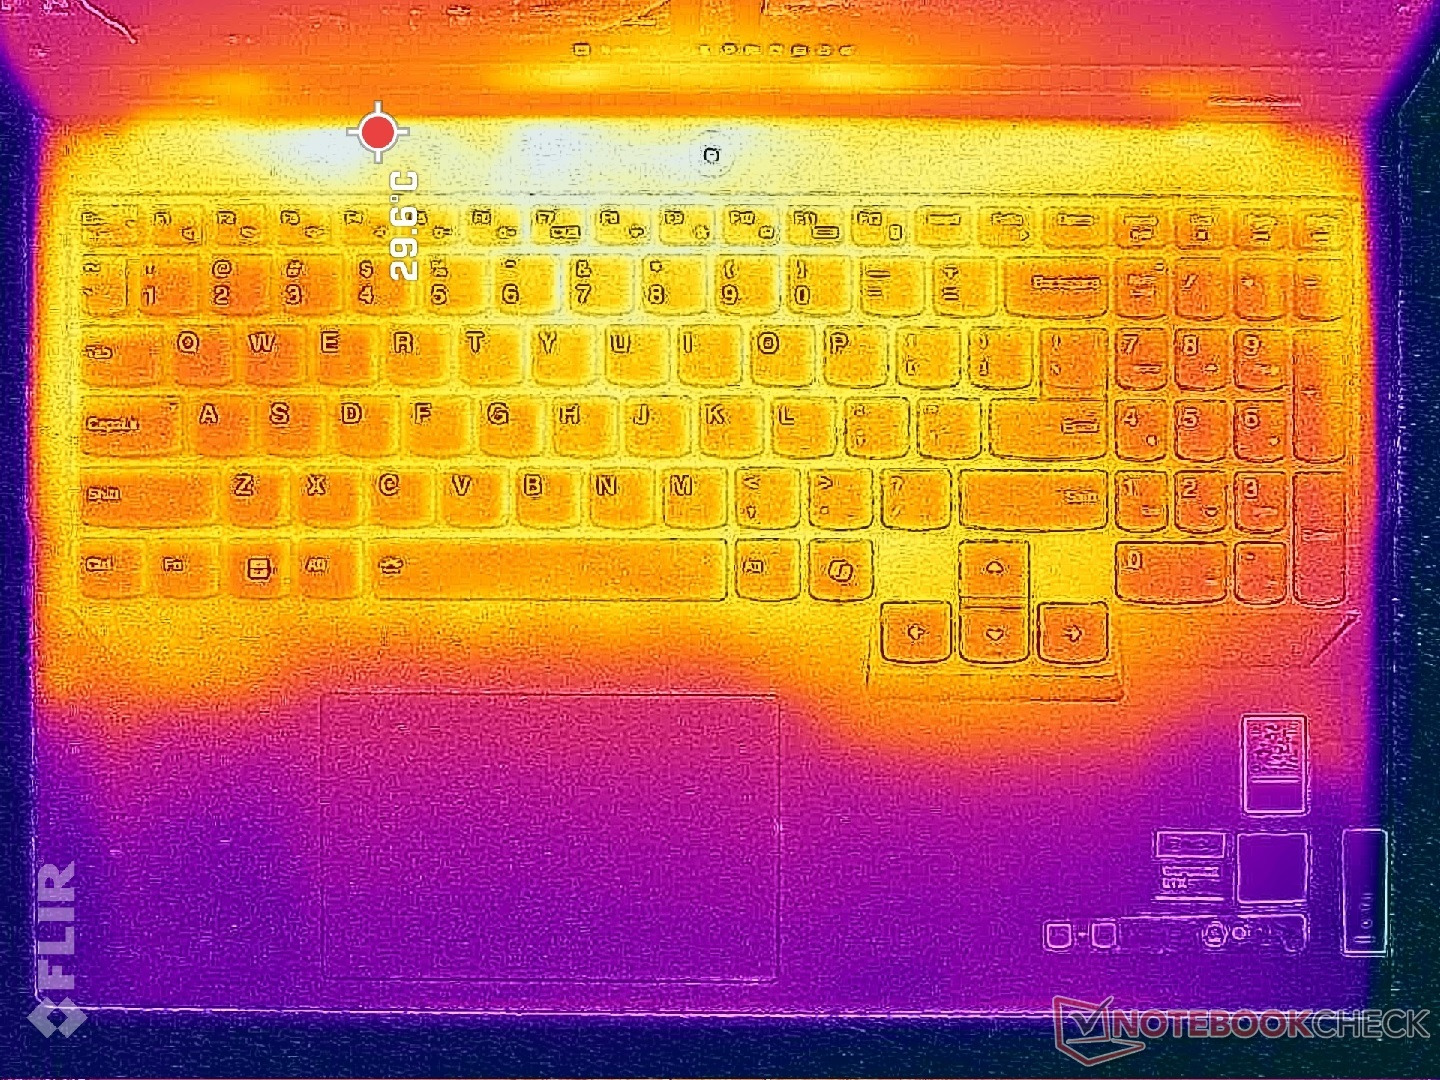
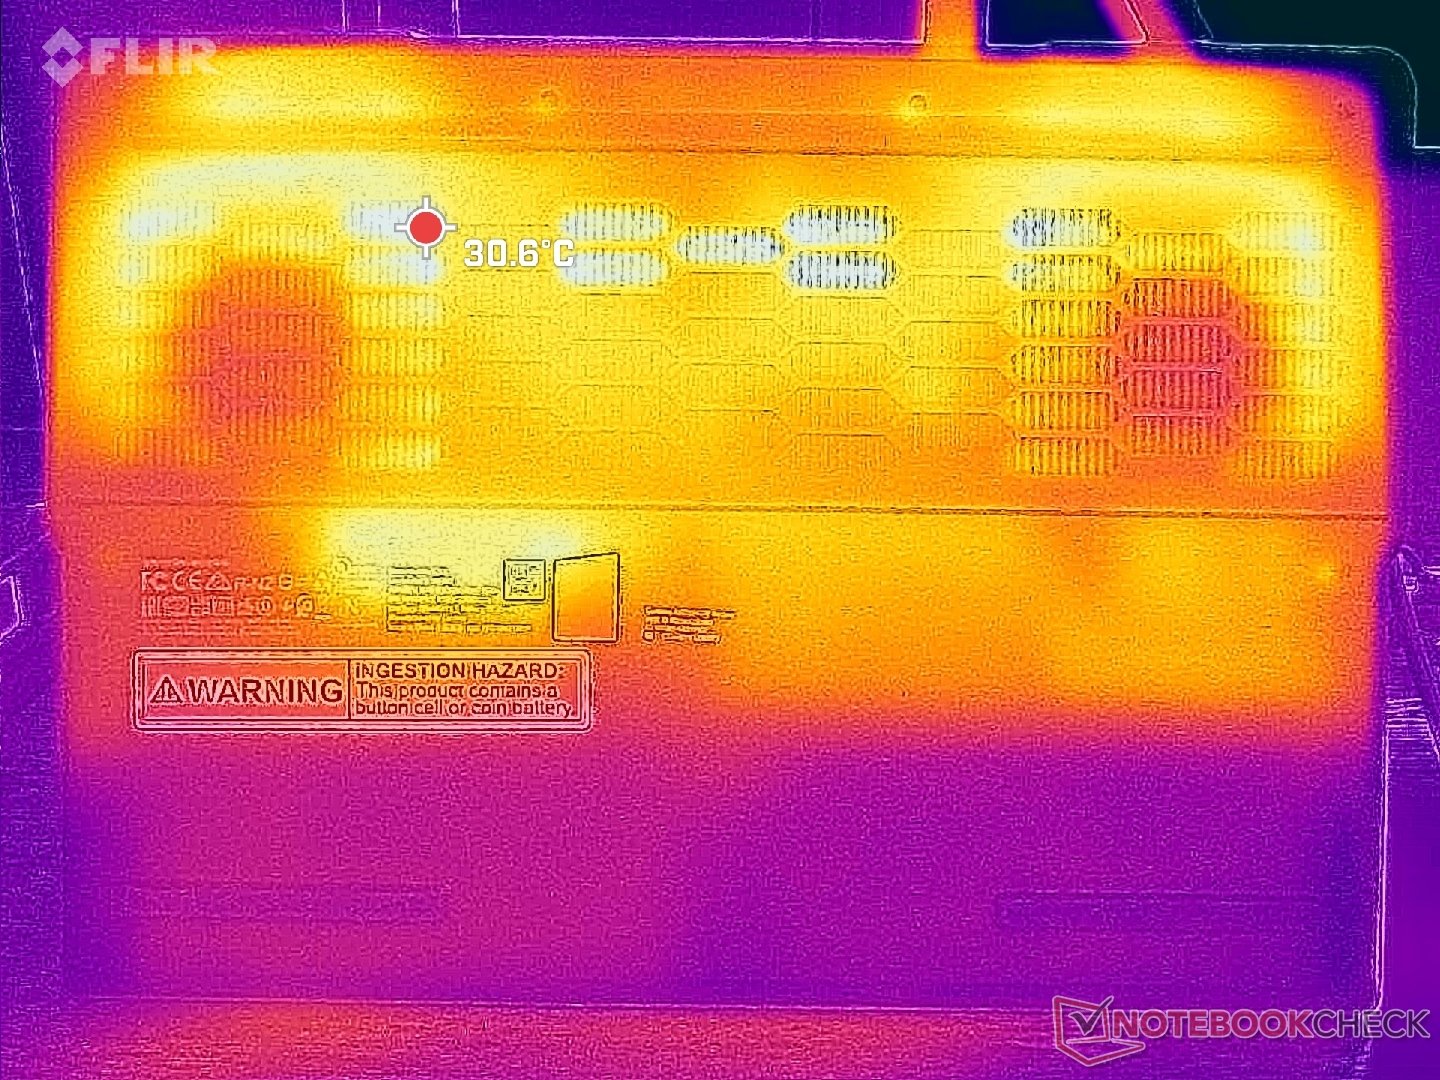
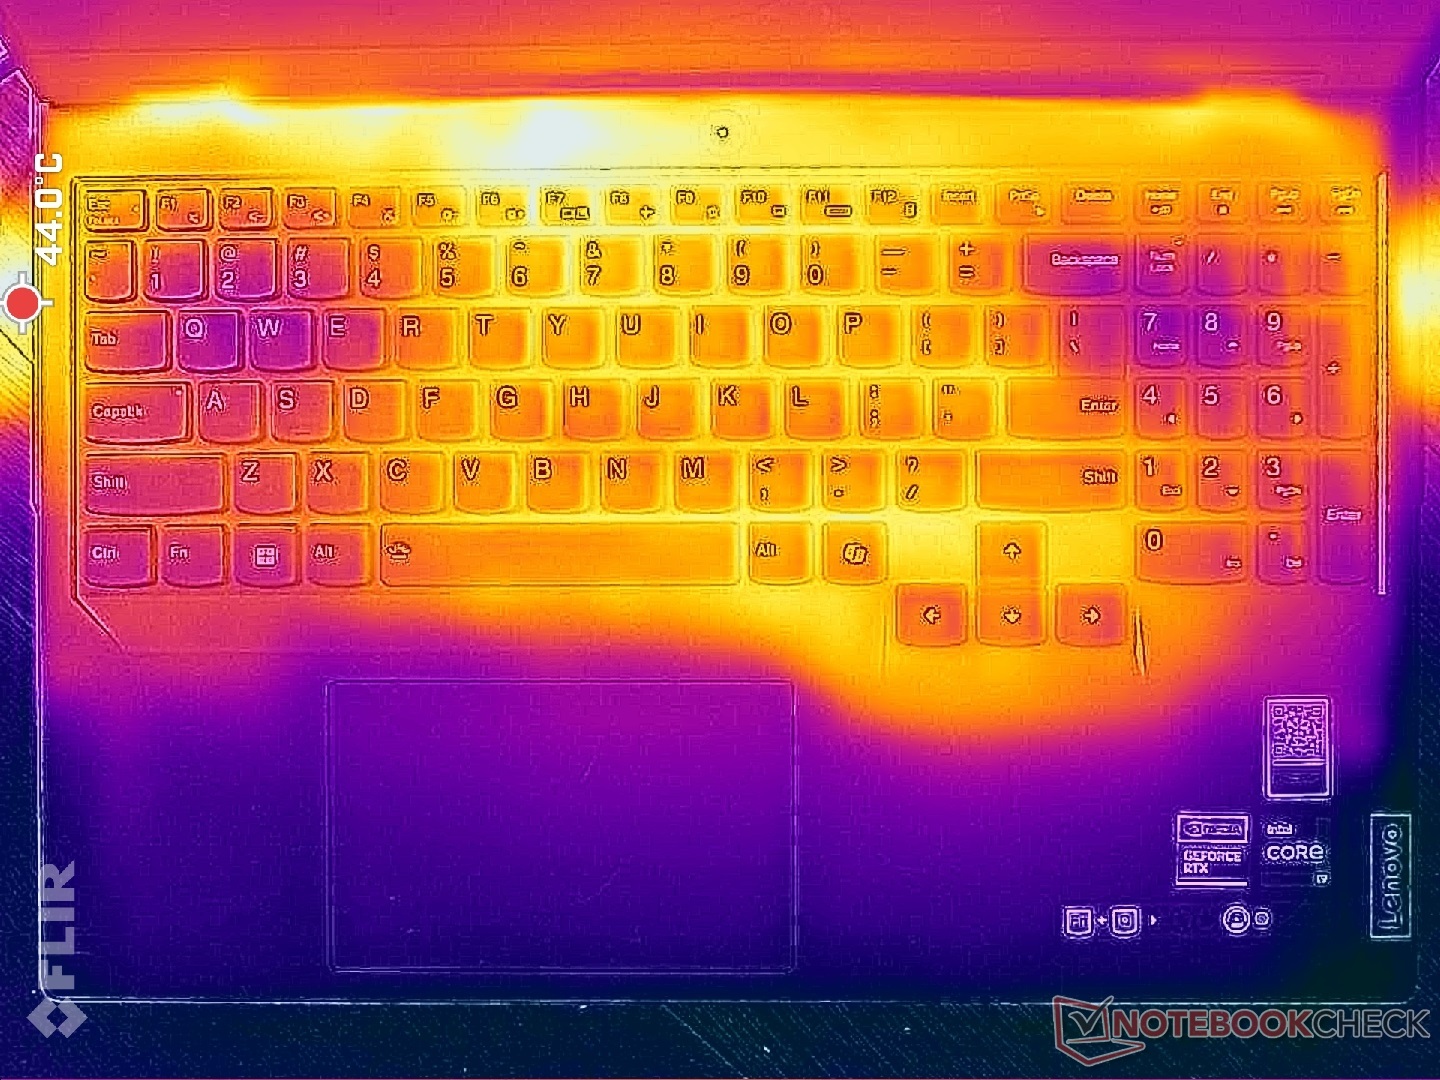
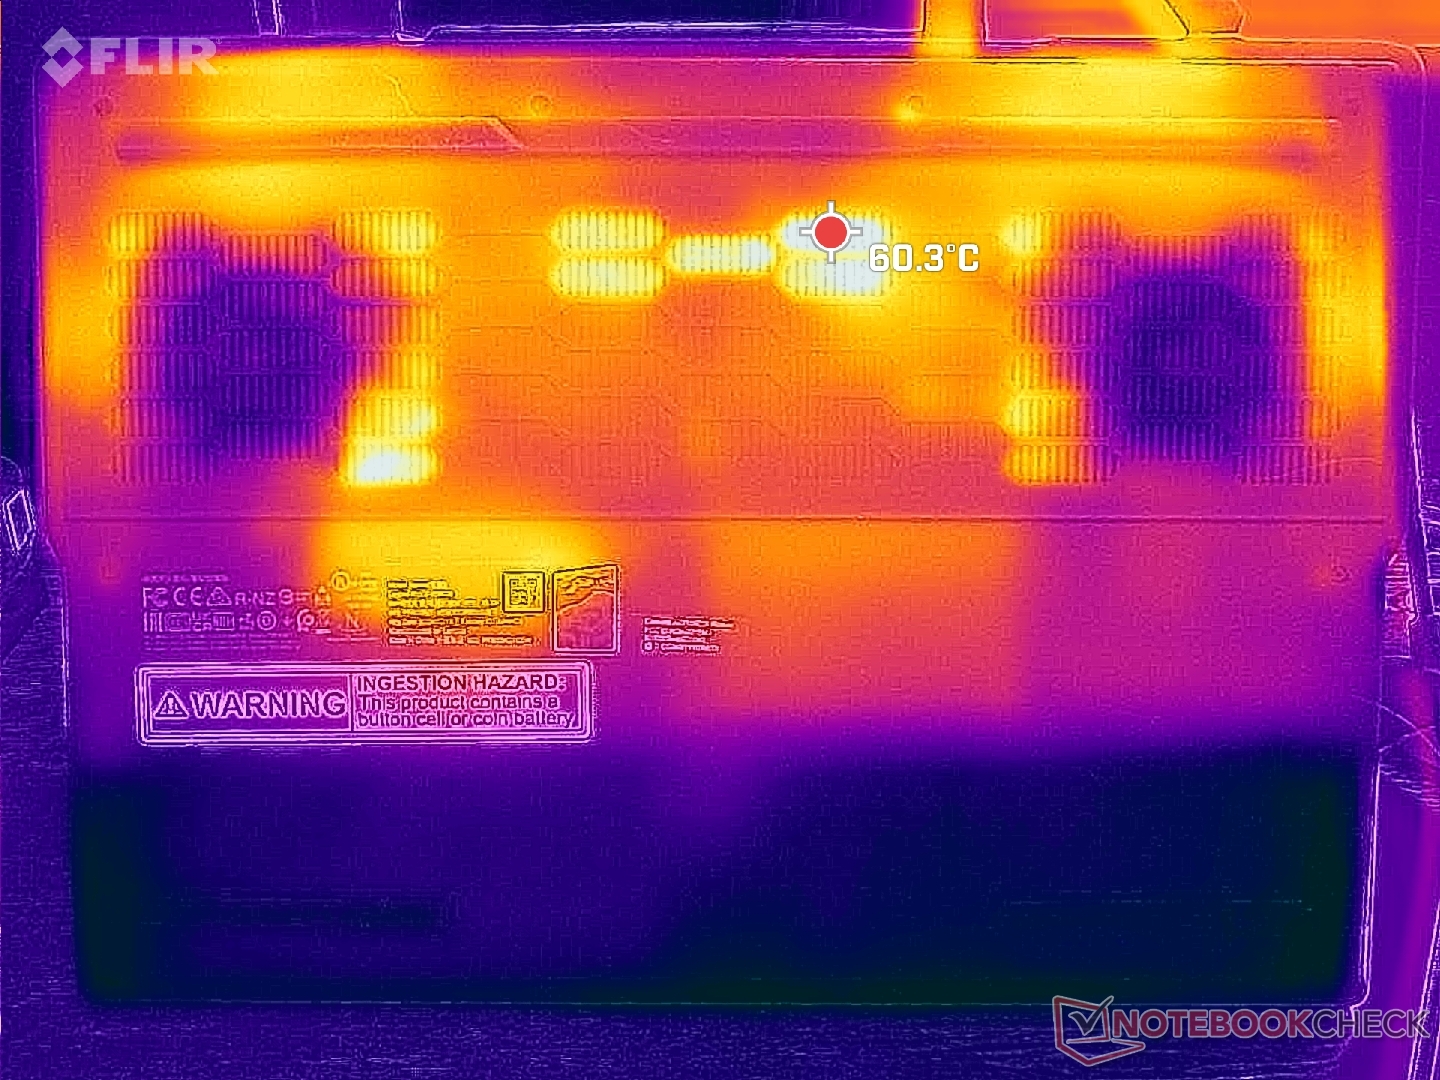
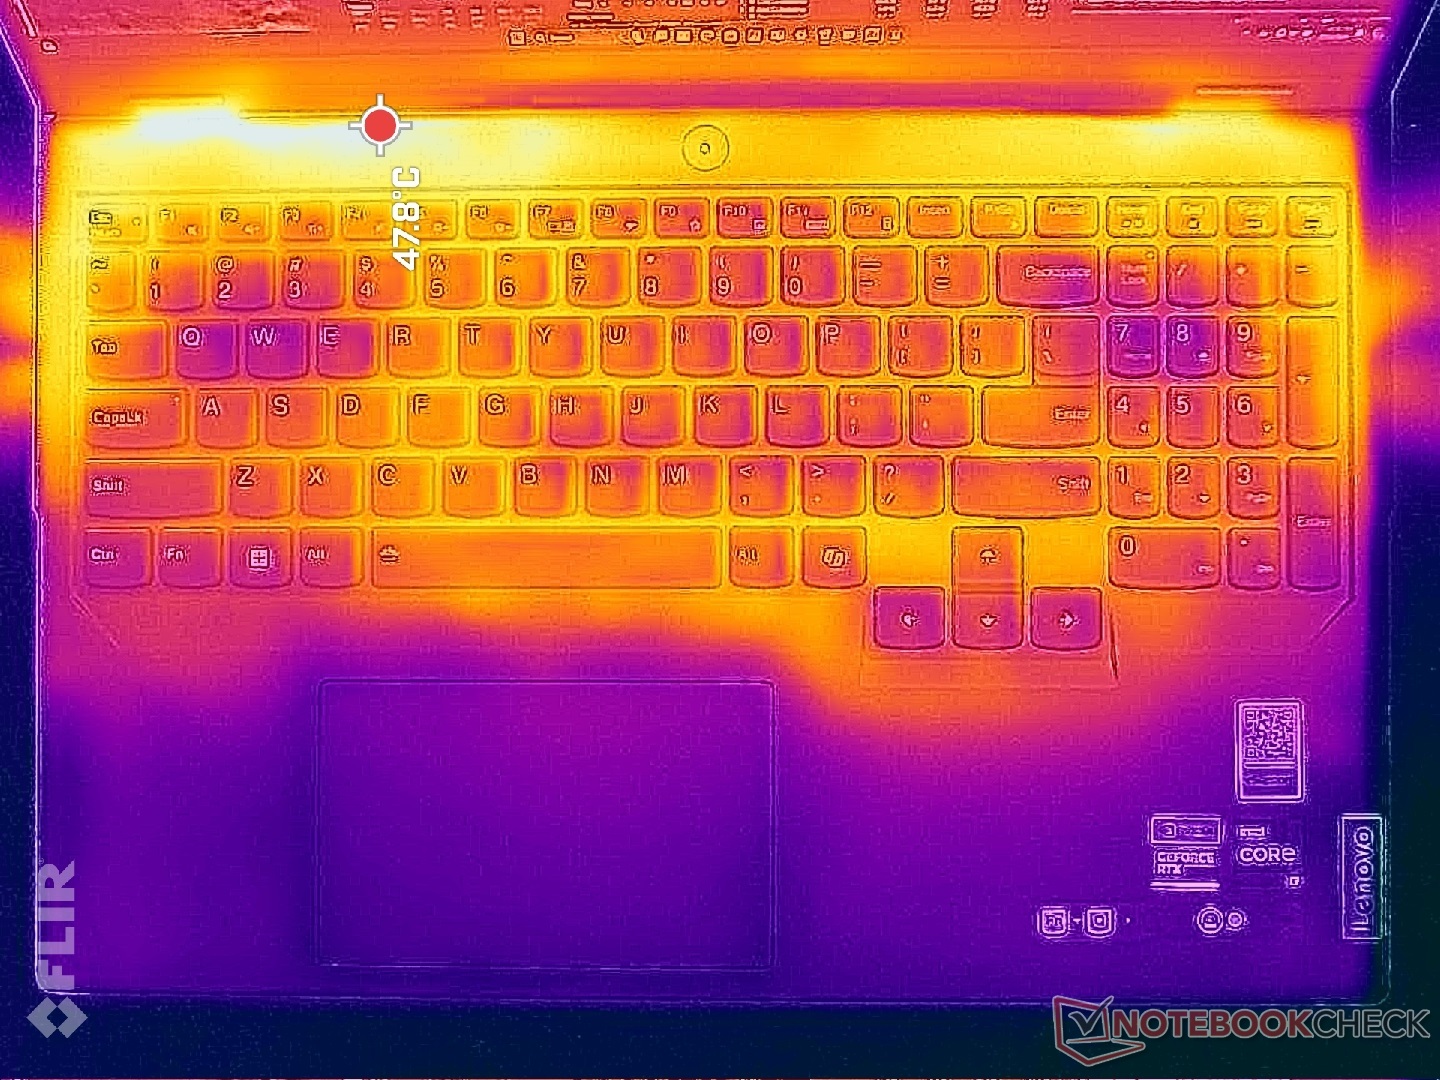
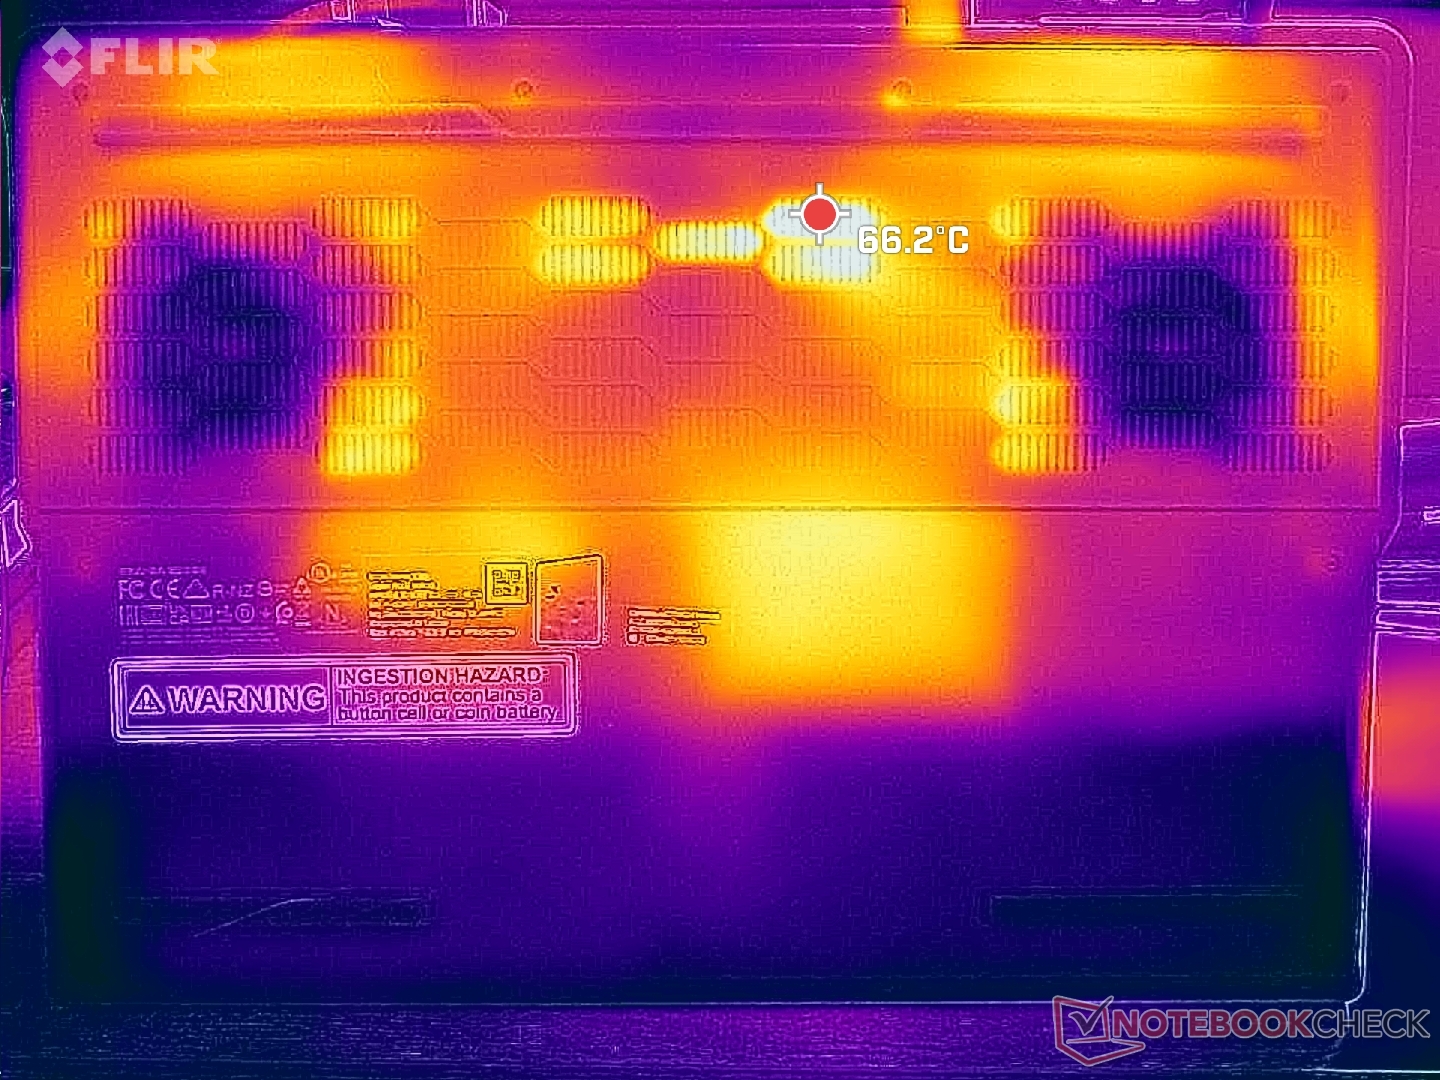
Temperatur
Yttemperaturerna kan vara varmare än vad vi registrerade på förra årets modell. När du spelar, till exempel, skulle en stor del av tangentbordet vara 40 C jämfört med bara 36 C på Legion Pro 5 16IRX8 eller 34 C på Alienware m16 R2. Handledsstöden och WASD-tangenterna skulle förbli svalare för att hålla händerna bekväma när du spelar, men resten av den bärbara datorn skulle vara ganska varm.
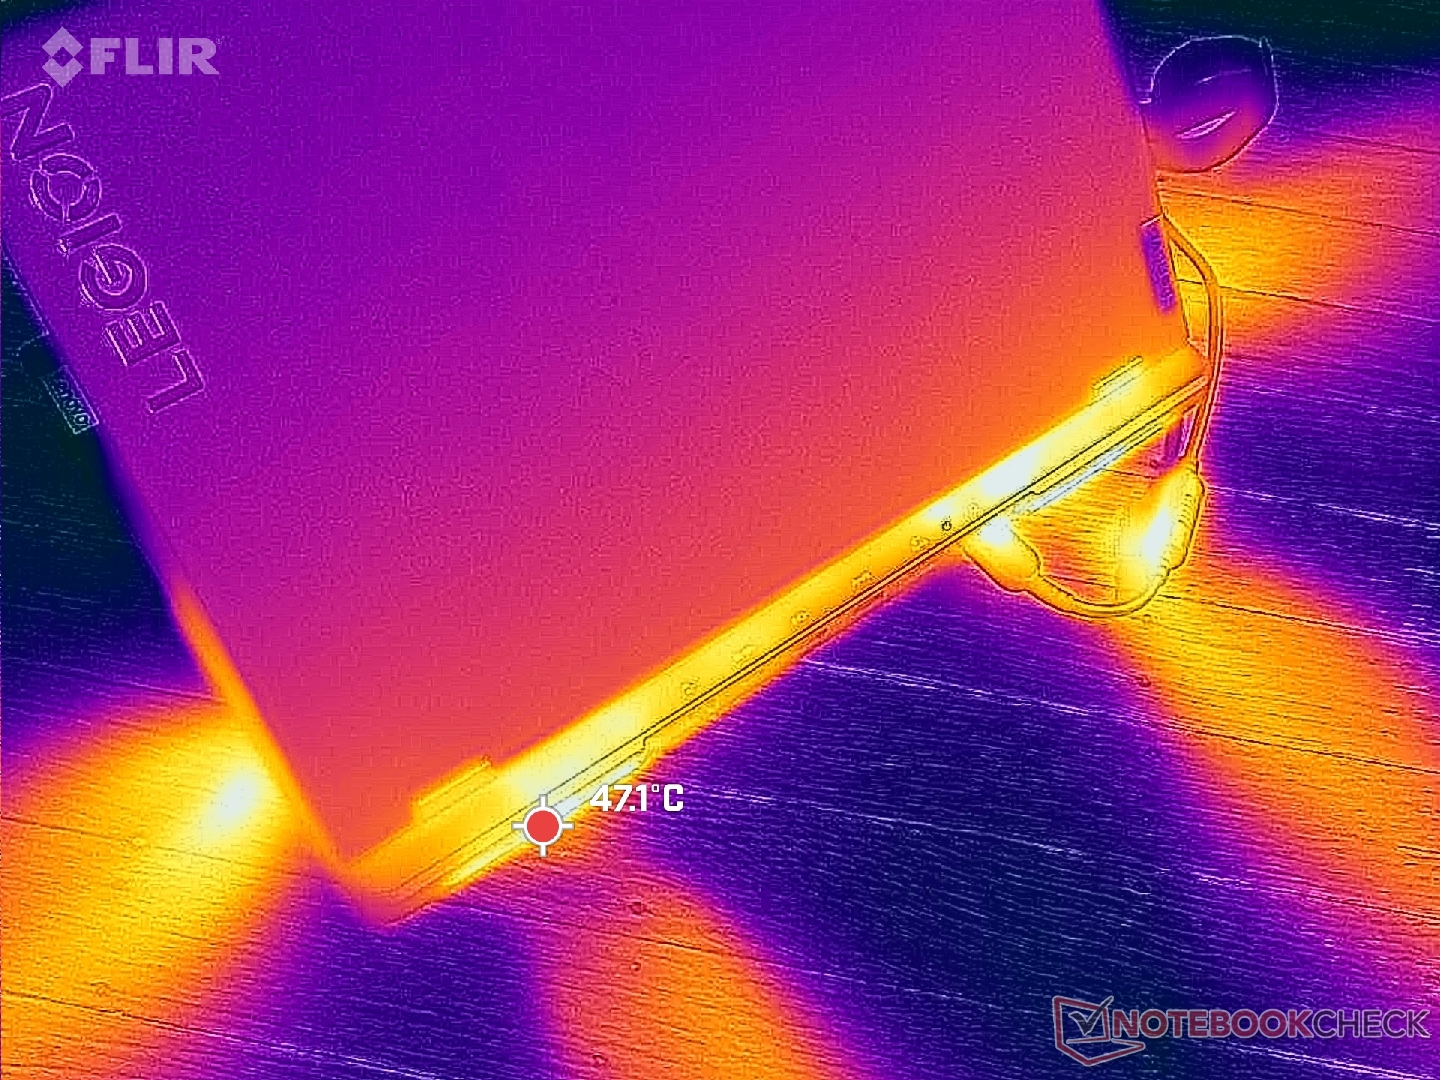
(±) Den maximala temperaturen på ovansidan är 43.8 °C / 111 F, jämfört med genomsnittet av 40.4 °C / 105 F , allt från 21.2 till 68.8 °C för klassen Gaming.
(-) Botten värms upp till maximalt 55.4 °C / 132 F, jämfört med genomsnittet av 43.2 °C / 110 F
(+) Vid tomgångsbruk är medeltemperaturen för ovansidan 29.6 °C / 85 F, jämfört med enhetsgenomsnittet på 33.9 °C / ### class_avg_f### F.
(±) När du spelar The Witcher 3 är medeltemperaturen för ovansidan 36.1 °C / 97 F, jämfört med enhetsgenomsnittet på 33.9 °C / ## #class_avg_f### F.
(+) Handledsstöden och pekplattan är kallare än hudtemperaturen med maximalt 28 °C / 82.4 F och är därför svala att ta på.
(±) Medeltemperaturen för handledsstödsområdet på liknande enheter var 28.8 °C / 83.8 F (+0.8 °C / 1.4 F).
| Lenovo Legion Pro 5 16IRX9 Intel Core i9-14900HX, NVIDIA GeForce RTX 4070 Laptop GPU | Lenovo Legion Pro 5 16IRX8 Intel Core i7-13700HX, NVIDIA GeForce RTX 4060 Laptop GPU | Alienware m16 R2 Intel Core Ultra 7 155H, NVIDIA GeForce RTX 4070 Laptop GPU | HP Omen Transcend 16-u1095ng Intel Core i9-14900HX, NVIDIA GeForce RTX 4070 Laptop GPU | Asus ROG Zephyrus G16 2024 GU605M Intel Core Ultra 7 155H, NVIDIA GeForce RTX 4070 Laptop GPU | MSI Stealth 16 Mercedes-AMG Motorsport A13VG Intel Core i9-13900H, NVIDIA GeForce RTX 4070 Laptop GPU | |
|---|---|---|---|---|---|---|
| Heat | 7% | -5% | 1% | 7% | 1% | |
| Maximum Upper Side * (°C) | 43.8 | 42.8 2% | 44.8 -2% | 49 -12% | 50.3 -15% | 49 -12% |
| Maximum Bottom * (°C) | 55.4 | 50 10% | 48 13% | 63 -14% | 48 13% | 52 6% |
| Idle Upper Side * (°C) | 32.8 | 29.6 10% | 37.2 -13% | 30 9% | 28.8 12% | 32 2% |
| Idle Bottom * (°C) | 36 | 34 6% | 42 -17% | 29 19% | 29.8 17% | 34 6% |
* ... mindre är bättre
Högtalare
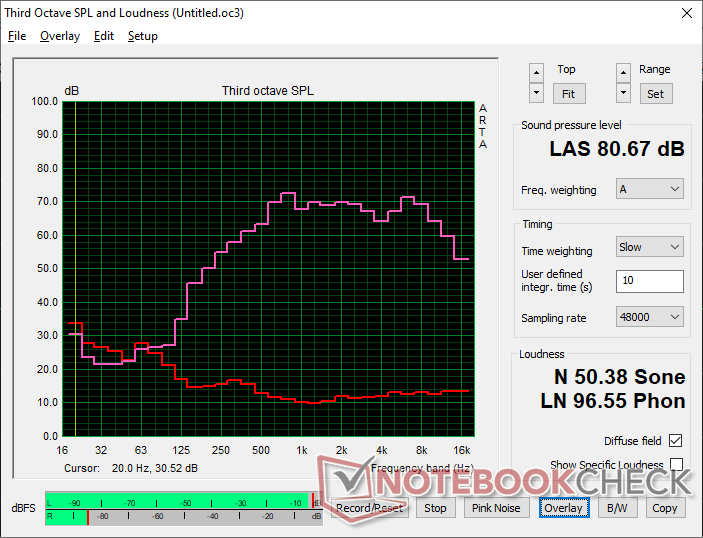
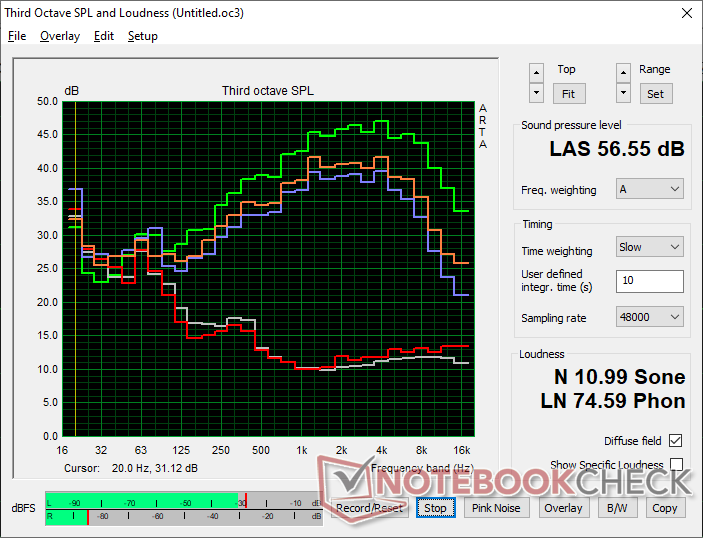
Lenovo Legion Pro 5 16IRX9 ljudanalys
(±) | högtalarljudstyrkan är genomsnittlig men bra (80.7 dB)
Bas 100 - 315 Hz
(-) | nästan ingen bas - i genomsnitt 19% lägre än medianen
(±) | linjäriteten för basen är genomsnittlig (10.1% delta till föregående frekvens)
Mellan 400 - 2000 Hz
(+) | balanserad mellan - endast 4.7% från medianen
(+) | mids är linjära (5.7% delta till föregående frekvens)
Högsta 2 - 16 kHz
(+) | balanserade toppar - endast 3.3% från medianen
(+) | toppar är linjära (5.6% delta till föregående frekvens)
Totalt 100 - 16 000 Hz
(±) | linjäriteten för det totala ljudet är genomsnittlig (17.2% skillnad mot median)
Jämfört med samma klass
» 47% av alla testade enheter i den här klassen var bättre, 11% liknande, 42% sämre
» Den bästa hade ett delta på 6%, genomsnittet var 18%, sämst var 132%
Jämfört med alla testade enheter
» 32% av alla testade enheter var bättre, 8% liknande, 60% sämre
» Den bästa hade ett delta på 4%, genomsnittet var 23%, sämst var 134%
Apple MacBook Pro 16 2021 M1 Pro ljudanalys
(+) | högtalare kan spela relativt högt (84.7 dB)
Bas 100 - 315 Hz
(+) | bra bas - bara 3.8% från medianen
(+) | basen är linjär (5.2% delta till föregående frekvens)
Mellan 400 - 2000 Hz
(+) | balanserad mellan - endast 1.3% från medianen
(+) | mids är linjära (2.1% delta till föregående frekvens)
Högsta 2 - 16 kHz
(+) | balanserade toppar - endast 1.9% från medianen
(+) | toppar är linjära (2.7% delta till föregående frekvens)
Totalt 100 - 16 000 Hz
(+) | det totala ljudet är linjärt (4.6% skillnad mot median)
Jämfört med samma klass
» 0% av alla testade enheter i den här klassen var bättre, 0% liknande, 100% sämre
» Den bästa hade ett delta på 5%, genomsnittet var 17%, sämst var 45%
Jämfört med alla testade enheter
» 0% av alla testade enheter var bättre, 0% liknande, 100% sämre
» Den bästa hade ett delta på 4%, genomsnittet var 23%, sämst var 134%
Energiförvaltning
Strömförbrukning
Att köra Witcher 3 skulle ligga runt 220 W för att vara mer krävande än vad vi registrerade på förra årets modell. Det är också märkbart högre än HP Omen Transcend 16 som levereras med samma CPU och GPU som vår Lenovo. En stor del av skillnaden kan tillskrivas Core i9-processorn i Lenovo som upprätthåller ett högre strömtillstånd när systemet är inställt på Performance-läge.
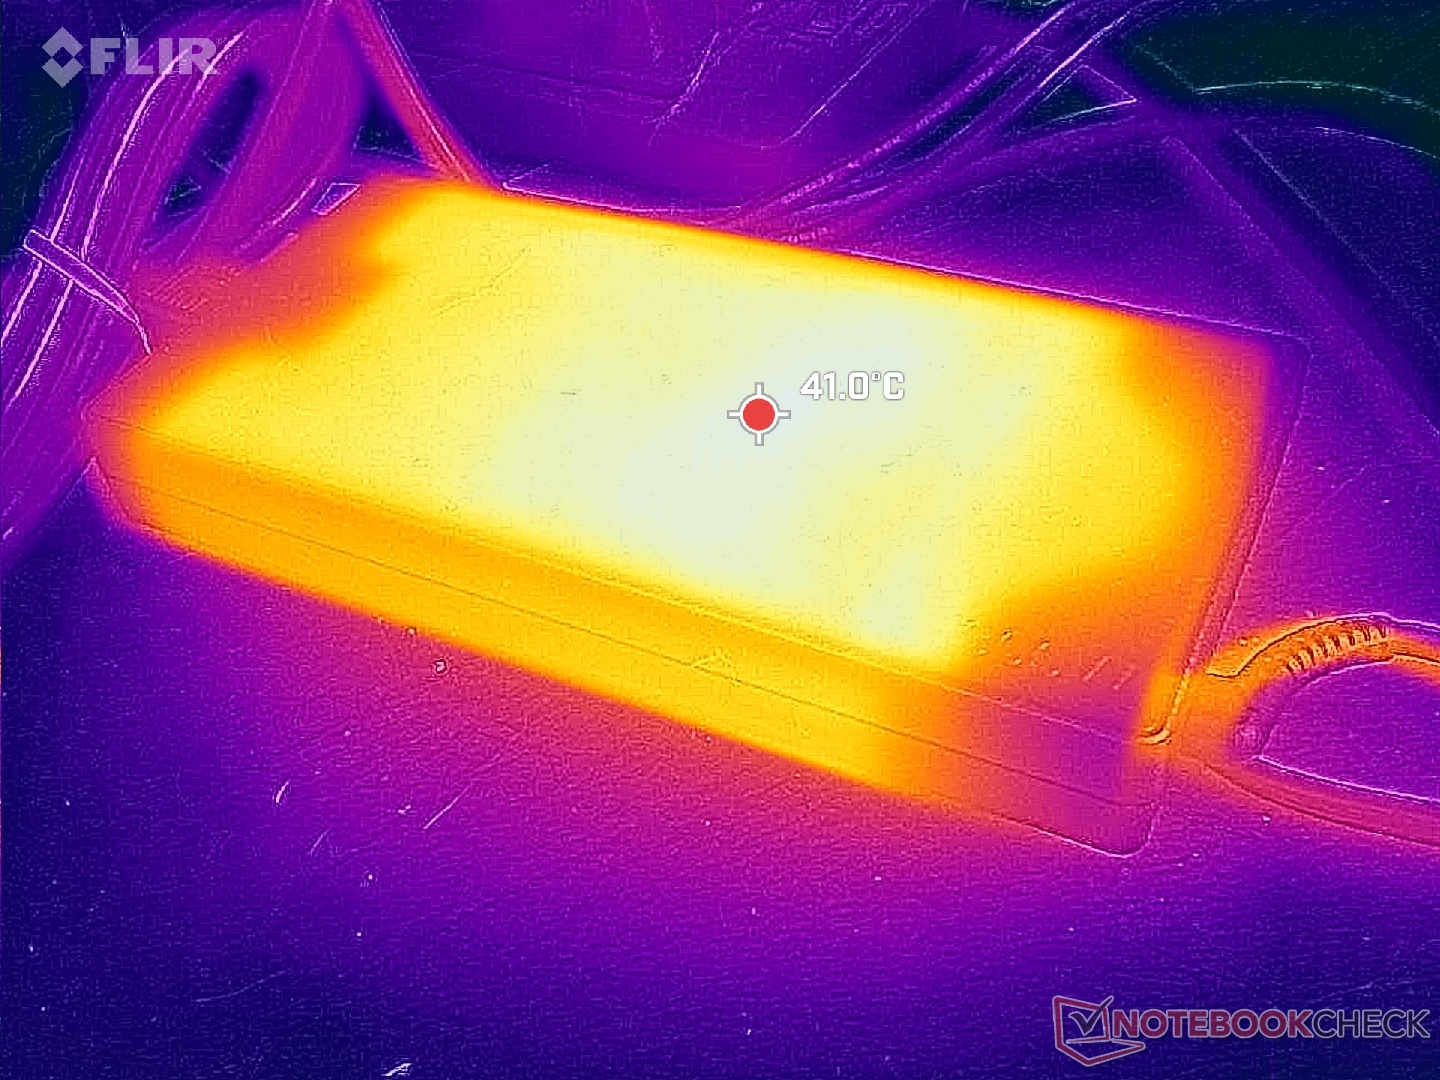
Vi kan registrera en tillfällig maxförbrukning på ca 274 W när CPU och GPU vardera utnyttjas till 100 procent. Den stora (~19,9 x 9,9 x 2,6 cm) 300 W AC-adaptern är samma som levereras med modellerna Legion 5 15, Legion 5 17 och Legion 7 16.
(Redaktörens anmärkning: Detta avsnitt kommer att uppdateras när reparationerna av vår Metrahit Energy-multimeter är slutförda. Vi ber om ursäkt för besväret)
| Av/Standby | |
| Låg belastning | |
| Hög belastning |
|
Förklaring:
min: | |
| Lenovo Legion Pro 5 16IRX9 i9-14900HX, GeForce RTX 4070 Laptop GPU, Samsung PM9A1 MZVL21T0HCLR, IPS, 2560x1600, 16" | Lenovo Legion Pro 5 16IRX8 i7-13700HX, GeForce RTX 4060 Laptop GPU, SK hynix PC801 HFS512GEJ9X115N, IPS, 2560x1600, 16" | Alienware m16 R2 Ultra 7 155H, GeForce RTX 4070 Laptop GPU, Samsung PM9A1 MZVL21T0HCLR, IPS, 2560x1600, 16" | HP Omen Transcend 16-u1095ng i9-14900HX, GeForce RTX 4070 Laptop GPU, Kioxia XG8 KXG80ZNV1T02, OLED, 2560x1600, 16" | Asus ROG Zephyrus G16 2024 GU605M Ultra 7 155H, GeForce RTX 4070 Laptop GPU, WD PC SN560 SDDPNQE-1T00, OLED, 2560x1600, 16" | MSI Stealth 16 Mercedes-AMG Motorsport A13VG i9-13900H, GeForce RTX 4070 Laptop GPU, Samsung PM9A1 MZVL22T0HBLB, OLED, 3840x2400, 16" | |
|---|---|---|---|---|---|---|
| Power Consumption | -19% | 12% | 8% | 42% | 22% | |
| Idle Minimum * (Watt) | 12.5 | 24.5 -96% | 8.1 35% | 10 20% | 8.3 34% | 11 12% |
| Idle Average * (Watt) | 24.6 | 29.2 -19% | 13 47% | 18 27% | 12.5 49% | 14 43% |
| Idle Maximum * (Watt) | 24.8 | 34.3 -38% | 40.3 -62% | 32 -29% | 12.8 48% | 28 -13% |
| Load Average * (Watt) | 109.6 | 98.7 10% | 79 28% | 128 -17% | 71.3 35% | 83 24% |
| Witcher 3 ultra * (Watt) | 218 | 178.6 18% | 188.1 14% | 148.4 32% | 127.5 42% | 140 36% |
| Load Maximum * (Watt) | 284.9 | 249.6 12% | 254.9 11% | 242 15% | 169.1 41% | 204 28% |
* ... mindre är bättre
Power Consumption Witcher 3 / Stresstest
Power Consumption external Monitor
Batteritid
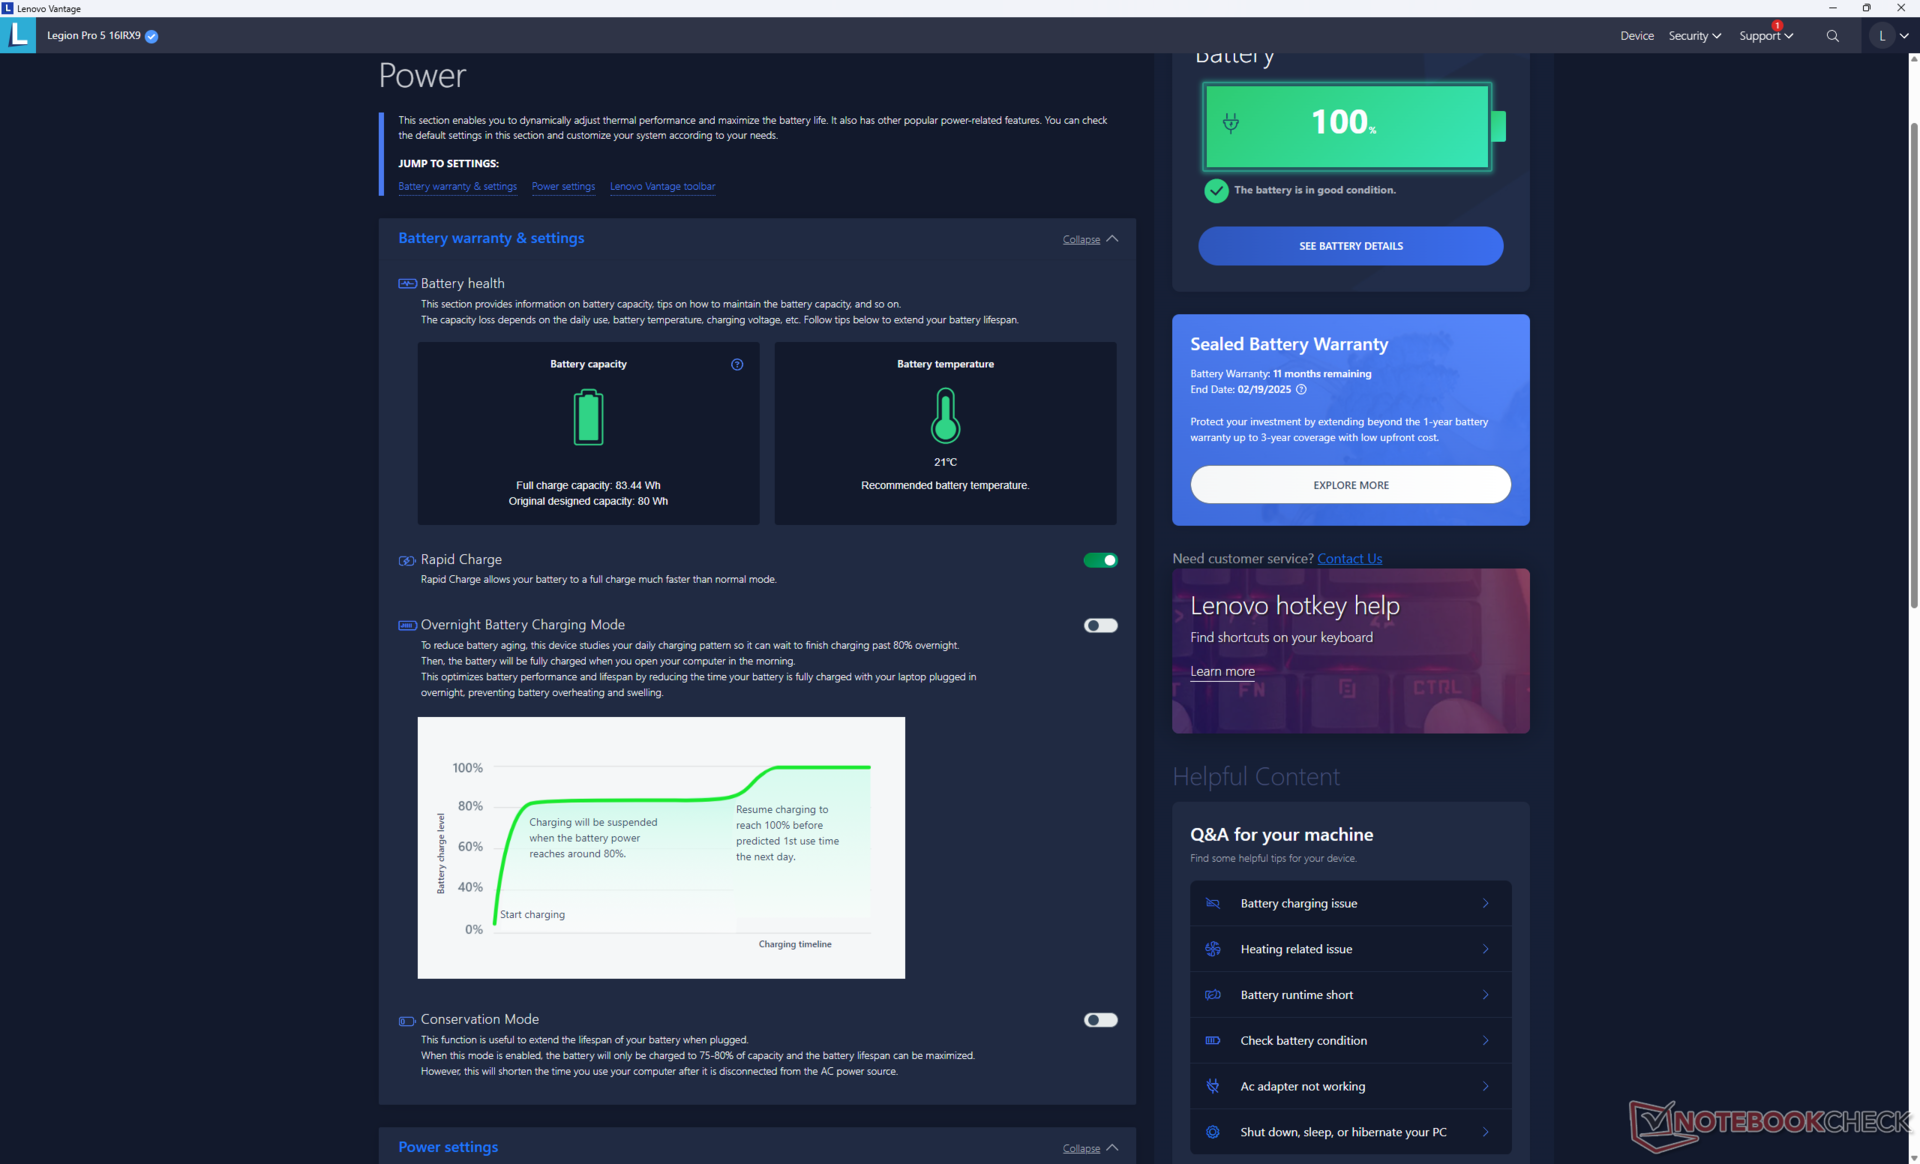
Med 80 Wh är batterikapaciteten mindre än hos de flesta andra bärbara 16-tumsdatorer där 90 Wh eller mer är vanligt. Trots detta är batteritiden nästan 90 minuter längre än på förra årets Legion Pro 5 16IRX8. Zephyrus G16 och Alienware m16 R2 kan båda hålla i flera timmar längre, men de levereras också med långsammare Core Ultra 7-processorer.
Laddning från tom till full kapacitet går mycket snabbt på strax under en timme jämfört med 1,5 till 2 timmar på de flesta andra bärbara datorer. Lenovo Rapid Charge är aktiverat som standard. Systemet kan också laddas med USB-C-adaptrar från tredje part via den bakre USB-C-porten.
| Lenovo Legion Pro 5 16IRX9 i9-14900HX, GeForce RTX 4070 Laptop GPU, 80 Wh | Lenovo Legion Pro 5 16IRX8 i7-13700HX, GeForce RTX 4060 Laptop GPU, 80 Wh | Alienware m16 R2 Ultra 7 155H, GeForce RTX 4070 Laptop GPU, 90 Wh | HP Omen Transcend 16-u1095ng i9-14900HX, GeForce RTX 4070 Laptop GPU, 97 Wh | Asus ROG Zephyrus G16 2024 GU605M Ultra 7 155H, GeForce RTX 4070 Laptop GPU, 90 Wh | MSI Stealth 16 Mercedes-AMG Motorsport A13VG i9-13900H, GeForce RTX 4070 Laptop GPU, 99.99 Wh | |
|---|---|---|---|---|---|---|
| Batteridrifttid | -22% | 49% | 2% | 31% | 35% | |
| Reader / Idle (h) | 6.7 | 6.7 0% | 12.6 88% | |||
| WiFi v1.3 (h) | 4.8 | 3.4 -29% | 8.1 69% | 4.9 2% | 7.3 52% | 6.5 35% |
| Load (h) | 1.1 | 0.7 -36% | 1 -9% | 1.2 9% | ||
| H.264 (h) | 11.2 |
För
Emot
Omdöme - Enkla förändringar för en liknande upplevelse som tidigare
I likhet med den senaste Alienware m18 R2erbjuder Lenovo Legion Pro 5 16 G9 inte tillräckligt över sin omedelbara föregångare för att vara värd en uppgradering. Det är lika bra som tidigare, men det flyttar inte nålen så mycket eftersom det är låst till samma GPU-alternativ tillsammans med ommärkta Raptor Lake-HX-processorer. Med andra ord presterar 2024 Legion Pro 5 16 nästan identiskt med den billigare 2023-versionen när det gäller spel. Det skulle vara klokt att kontrollera om det finns några erbjudanden på 2023 SKU innan du överväger de nyare 2024-alternativen.
Det finns några mindre tillägg där det mest anmärkningsvärda är ett nytt DCI-P3-panelalternativ medan förra årets modell endast var begränsad till sRGB-färger. Nackdelar som den stora storleken, den stora nätadaptern och de högljudda fläktarna kvarstår dock.
Om du verkligen vill ha DCI-P3-färger är Lenovo Legion Pro 5 16IRX9 2024 nästan identisk med den nu billigare 2023-modellen när det gäller prestanda, alternativ och fysiska egenskaper.
Legion Pro 5 16 kan vara attraktiv för dem som föredrar Core HX-seriens processorer framför de långsammare Core Ultra-alternativen. Annars finns det mindre eller mer portabla alternativ som Asus ROG Zephyrus G16 eller Alienware m16 R2 med långsammare processorprestanda men med nästan samma spelprestanda.
Pris och tillgänglighet
Lenovo levererar nu Legion 5 Pro 16 från 1770 USD för Core i7-14650HX- och RTX 4060-konfigurationen upp till 2000 USD för vår Core i9-14900HX- och RTX 4070-konfiguration.
Lenovo Legion Pro 5 16IRX9
- 03/28/2024 v7 (old)
Allen Ngo
Genomskinlighet
Valet av enheter som ska granskas görs av vår redaktion. Testprovet gavs till författaren som ett lån av tillverkaren eller återförsäljaren för denna recension. Långivaren hade inget inflytande på denna recension och inte heller fick tillverkaren en kopia av denna recension innan publiceringen. Det fanns ingen skyldighet att publicera denna recension. Som ett oberoende medieföretag är Notebookcheck inte föremål för auktoritet från tillverkare, återförsäljare eller förlag.
This is how Notebookcheck is testingEvery year, Notebookcheck independently reviews hundreds of laptops and smartphones using standardized procedures to ensure that all results are comparable. We have continuously developed our test methods for around 20 years and set industry standards in the process. In our test labs, high-quality measuring equipment is utilized by experienced technicians and editors. These tests involve a multi-stage validation process. Our complex rating system is based on hundreds of well-founded measurements and benchmarks, which maintains objectivity.
Price comparison

