Lenovo Legion Pro 7 16 (2024) recension: Den bästa bland RTX 4080-bärbara datorer
Legion Pro 7 - en 16-tums bärbar dator som riktar sig till spelare och kreatörer - ligger i den övre delen av prestandaspektrumet. Och den levereras med passande kraftfull hårdvara, med en Core i9-14900HX, a GeForce RTX 408032 GB RAM-minne och en ljusstark IPS-skärm med exakta färger (DCI-P3-täckning, Dolby Vision, G-Sync) och ett bildförhållande på 16:10. Legion Pro konkurrerar med sådana som MSI Vector 16 HX A14V, den Alienware m16 R1 AMD, den HP Omen 16 (2024).
Legion Pro 7 16IRX9H är efterföljaren till Legion Pro 7 16IRX8H och har samma yttre design. Vi hänvisar till vår recension av 16IRX8H för mer information om chassit, funktioner och inmatningsenheter.
Potentiella konkurrenter i jämförelse
Gradering | Datum | Modell | Vikt | Höjd | Storlek | Upplösning | Pris |
|---|---|---|---|---|---|---|---|
| 89.5 % v7 (old) | 03/2024 | Lenovo Legion Pro 7 16IRX9H i9-14900HX, GeForce RTX 4080 Laptop GPU | 2.7 kg | 21.95 mm | 16.00" | 2560x1600 | |
| 89.2 % v7 (old) | 08/2023 | Alienware m16 R1 AMD R9 7845HX, GeForce RTX 4080 Laptop GPU | 3.1 kg | 25.4 mm | 16.00" | 2560x1600 | |
| 88 % v7 (old) | 02/2024 | MSI Vector 16 HX A14V i9-14900HX, GeForce RTX 4080 Laptop GPU | 2.7 kg | 28.55 mm | 16.00" | 2560x1600 | |
| 86.7 % v7 (old) | 02/2024 | HP Omen 16 (2024) i9-14900HX, GeForce RTX 4080 Laptop GPU | 2.4 kg | 23.5 mm | 16.10" | 2560x1440 |
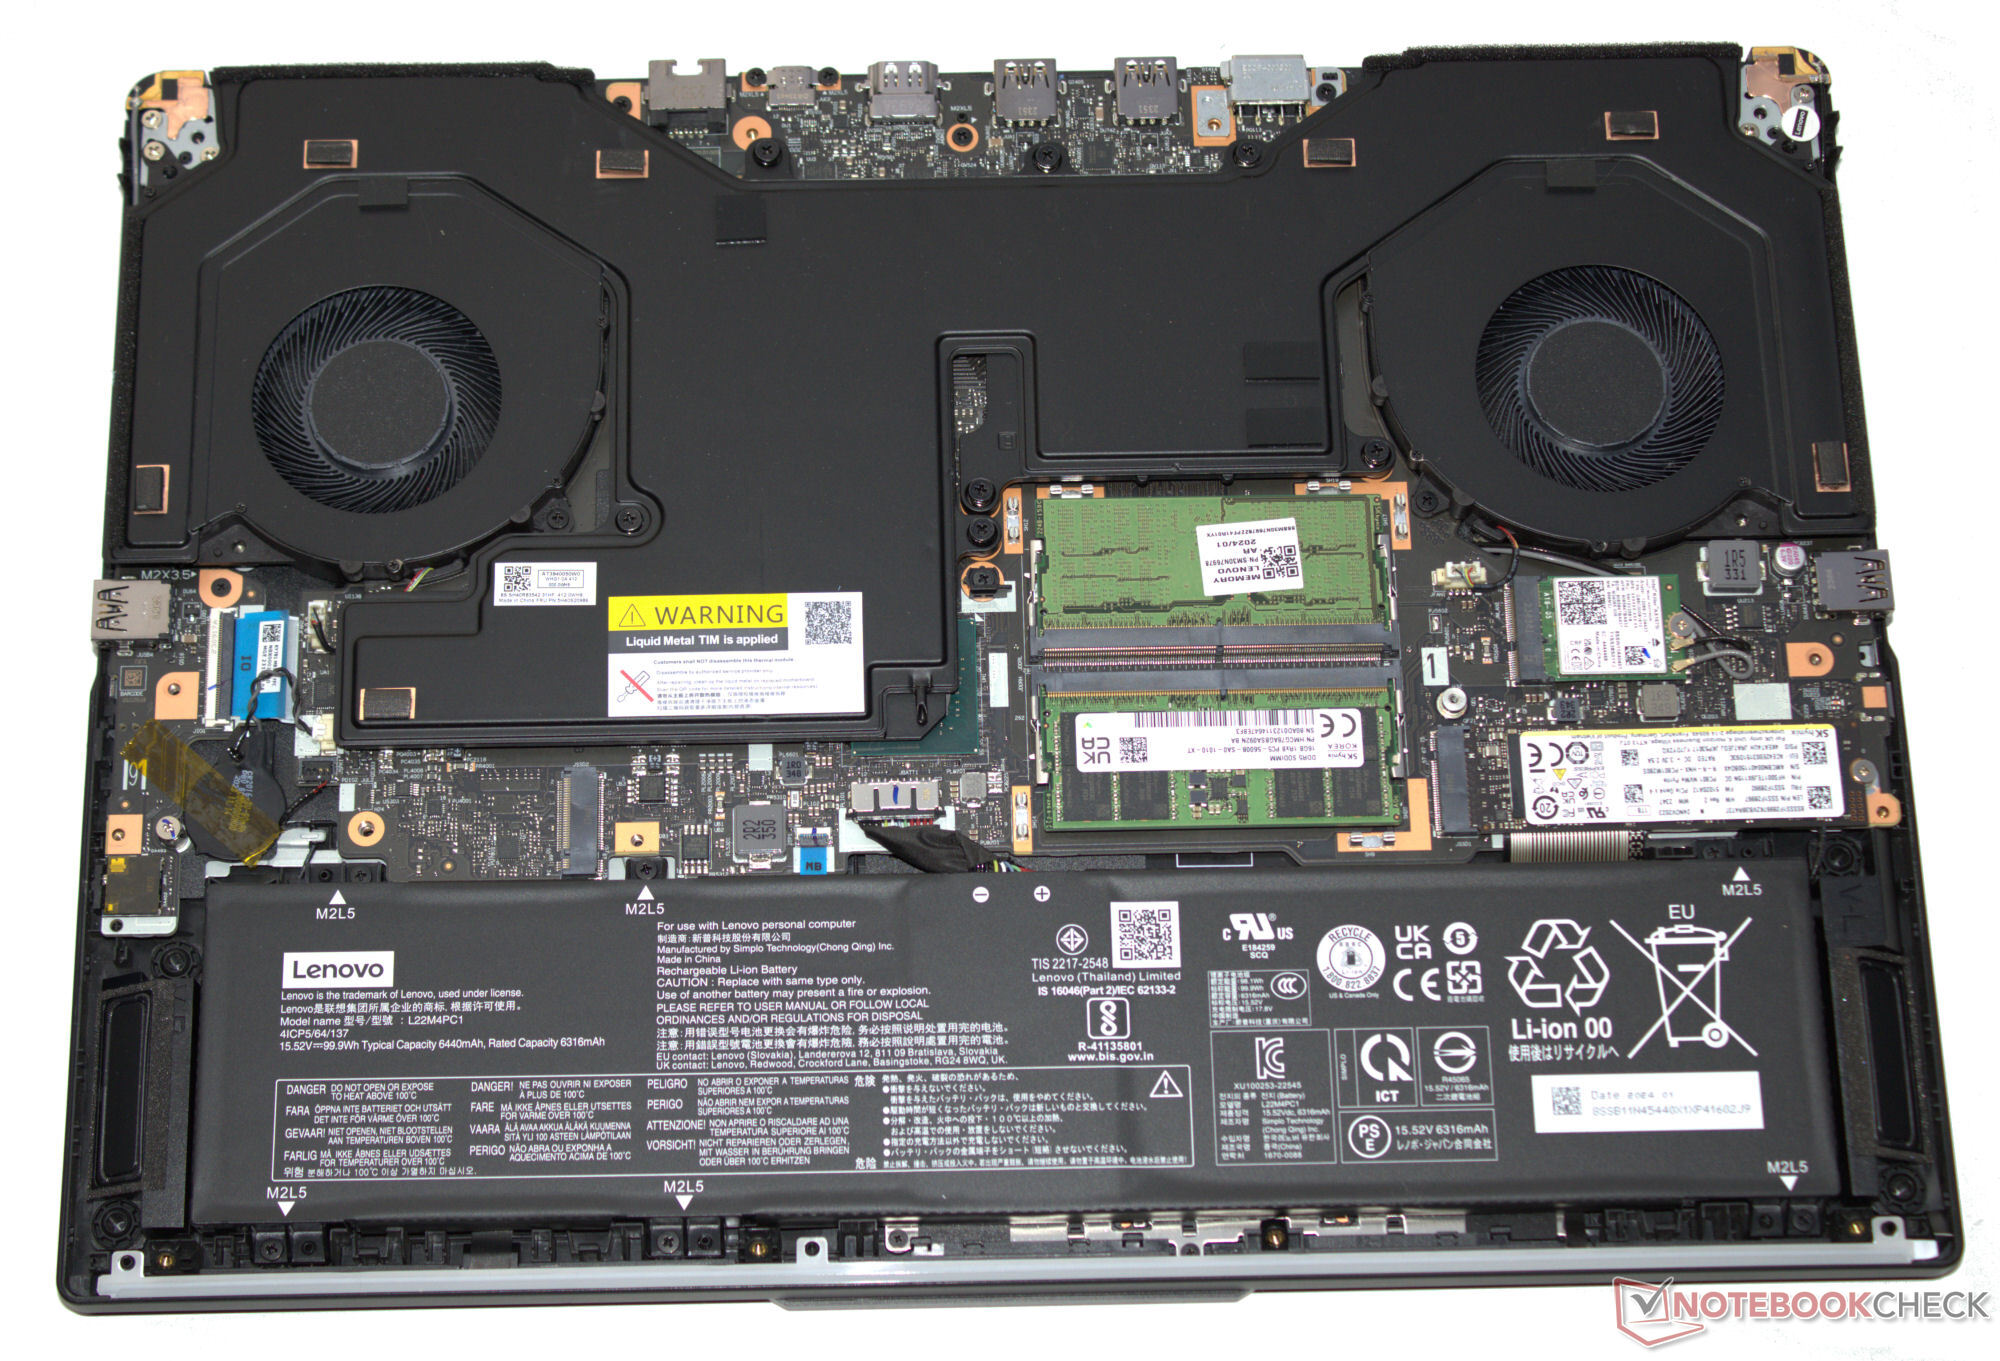
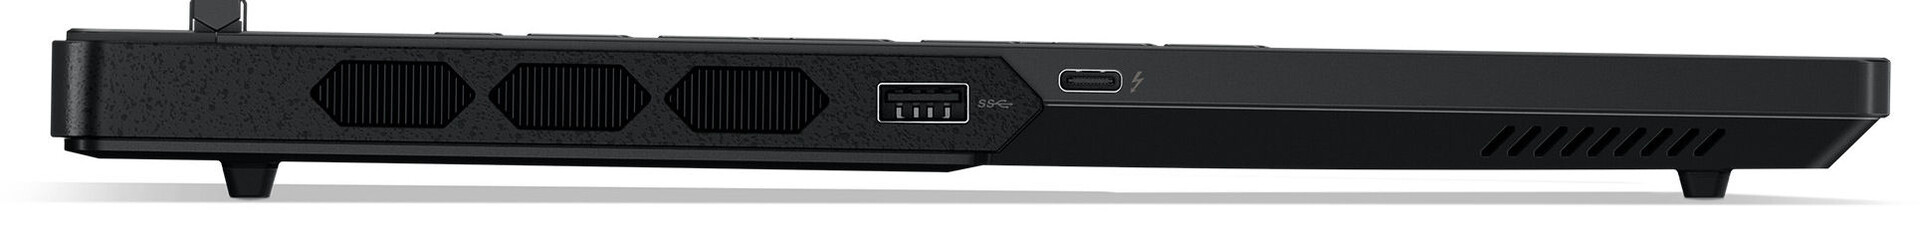
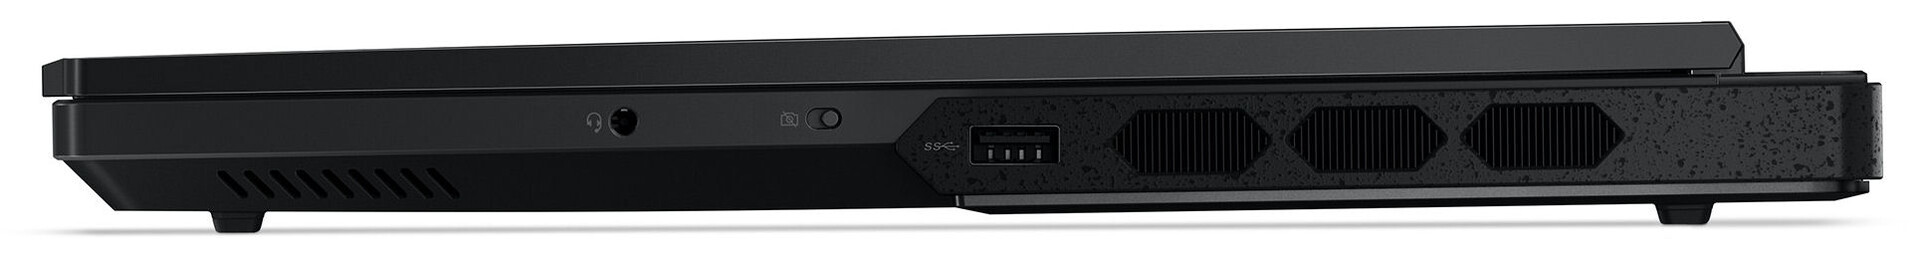
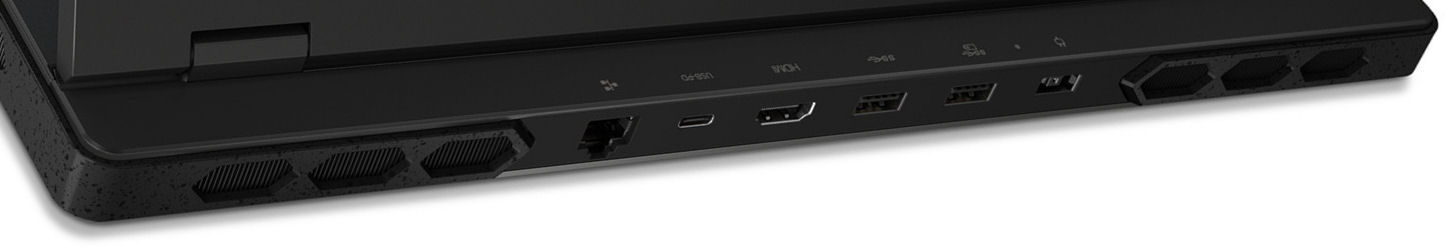
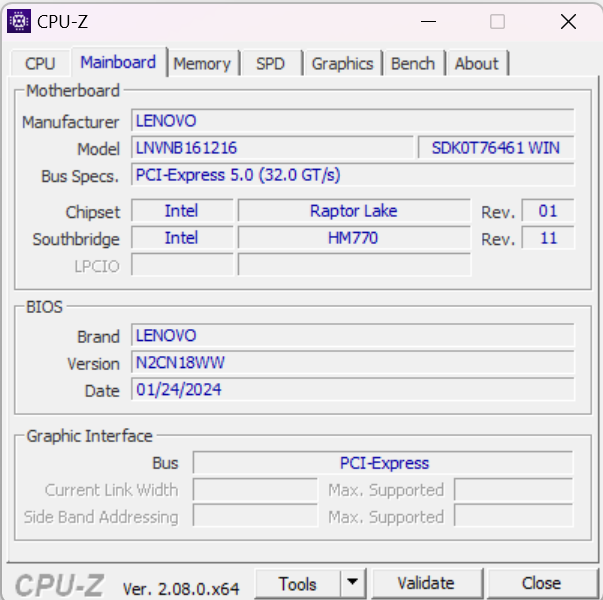
Chassi & specifikationer - Levereras med Thunderbolt 4
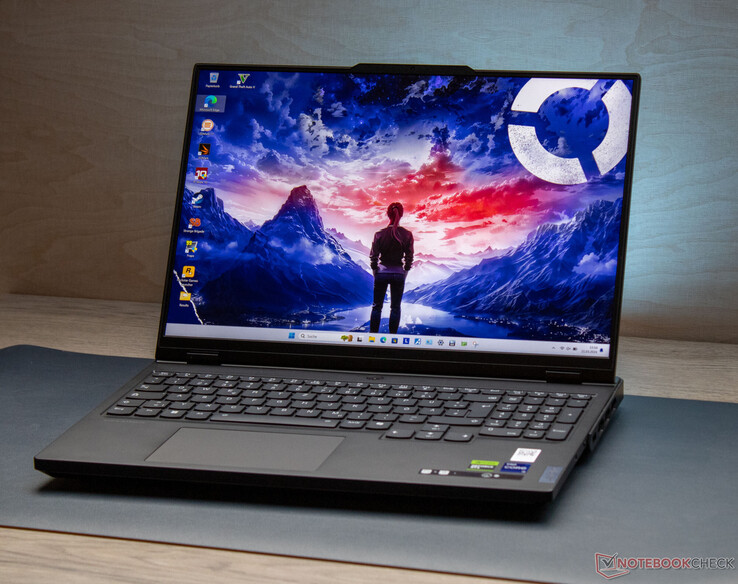
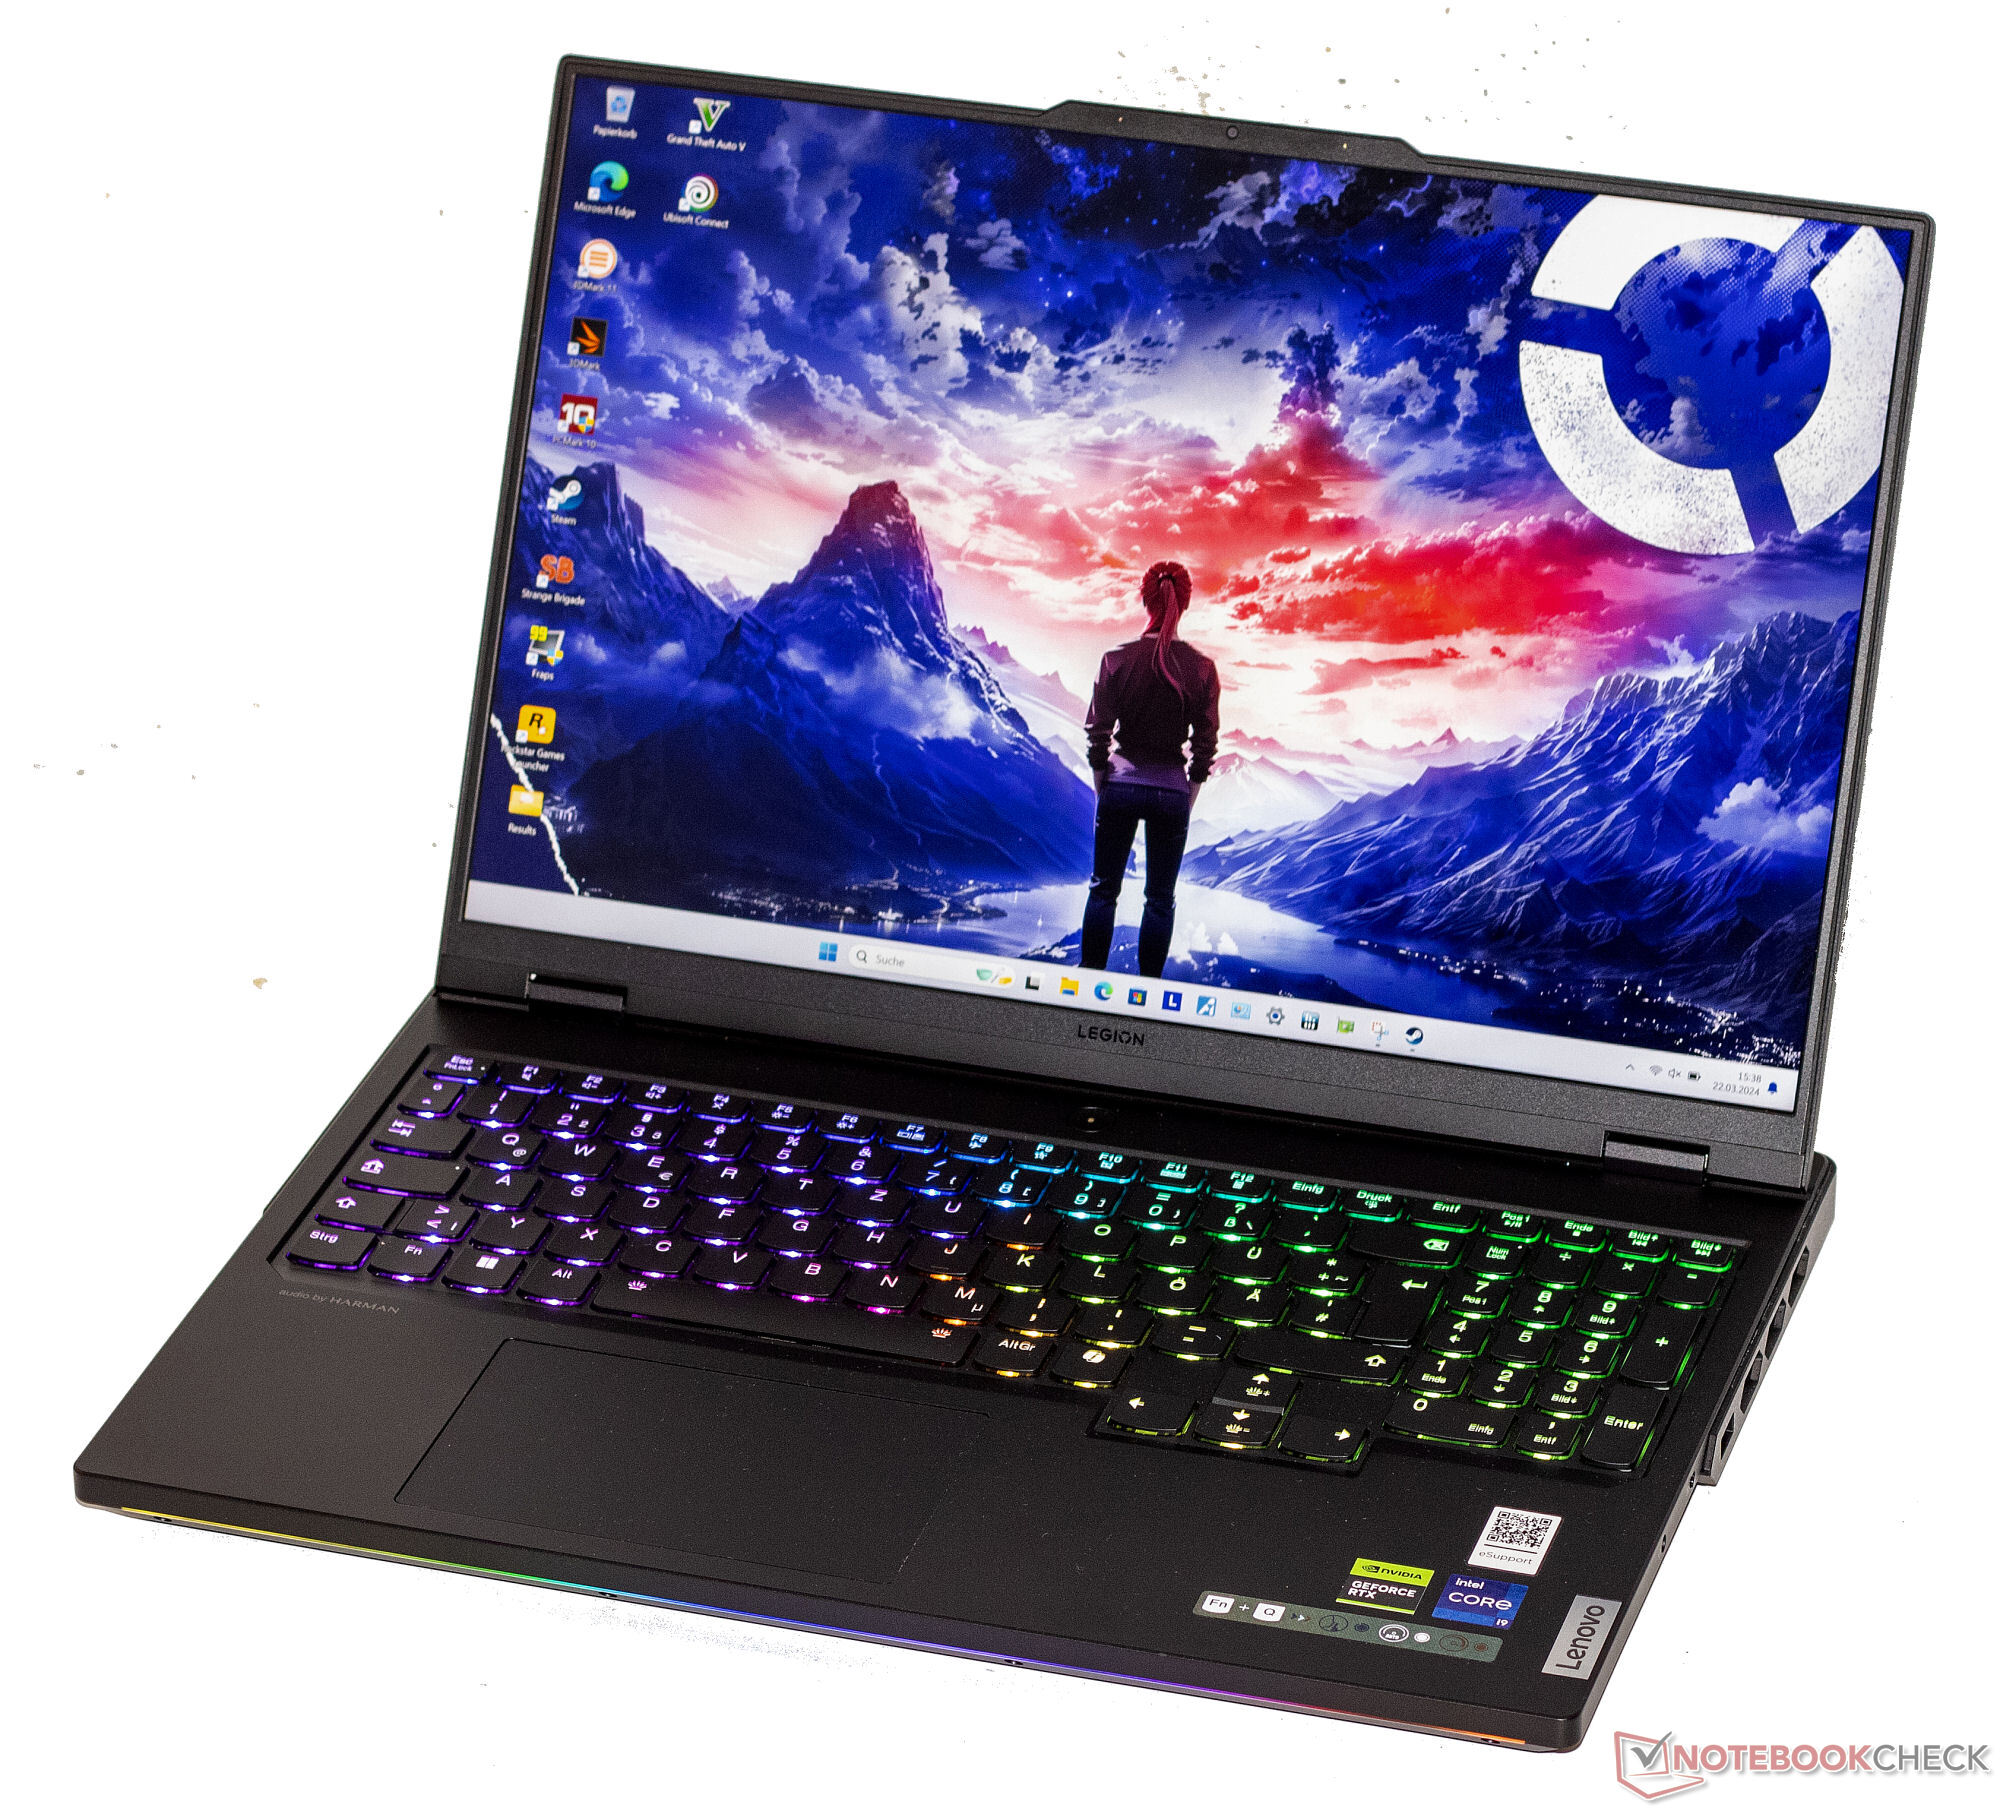
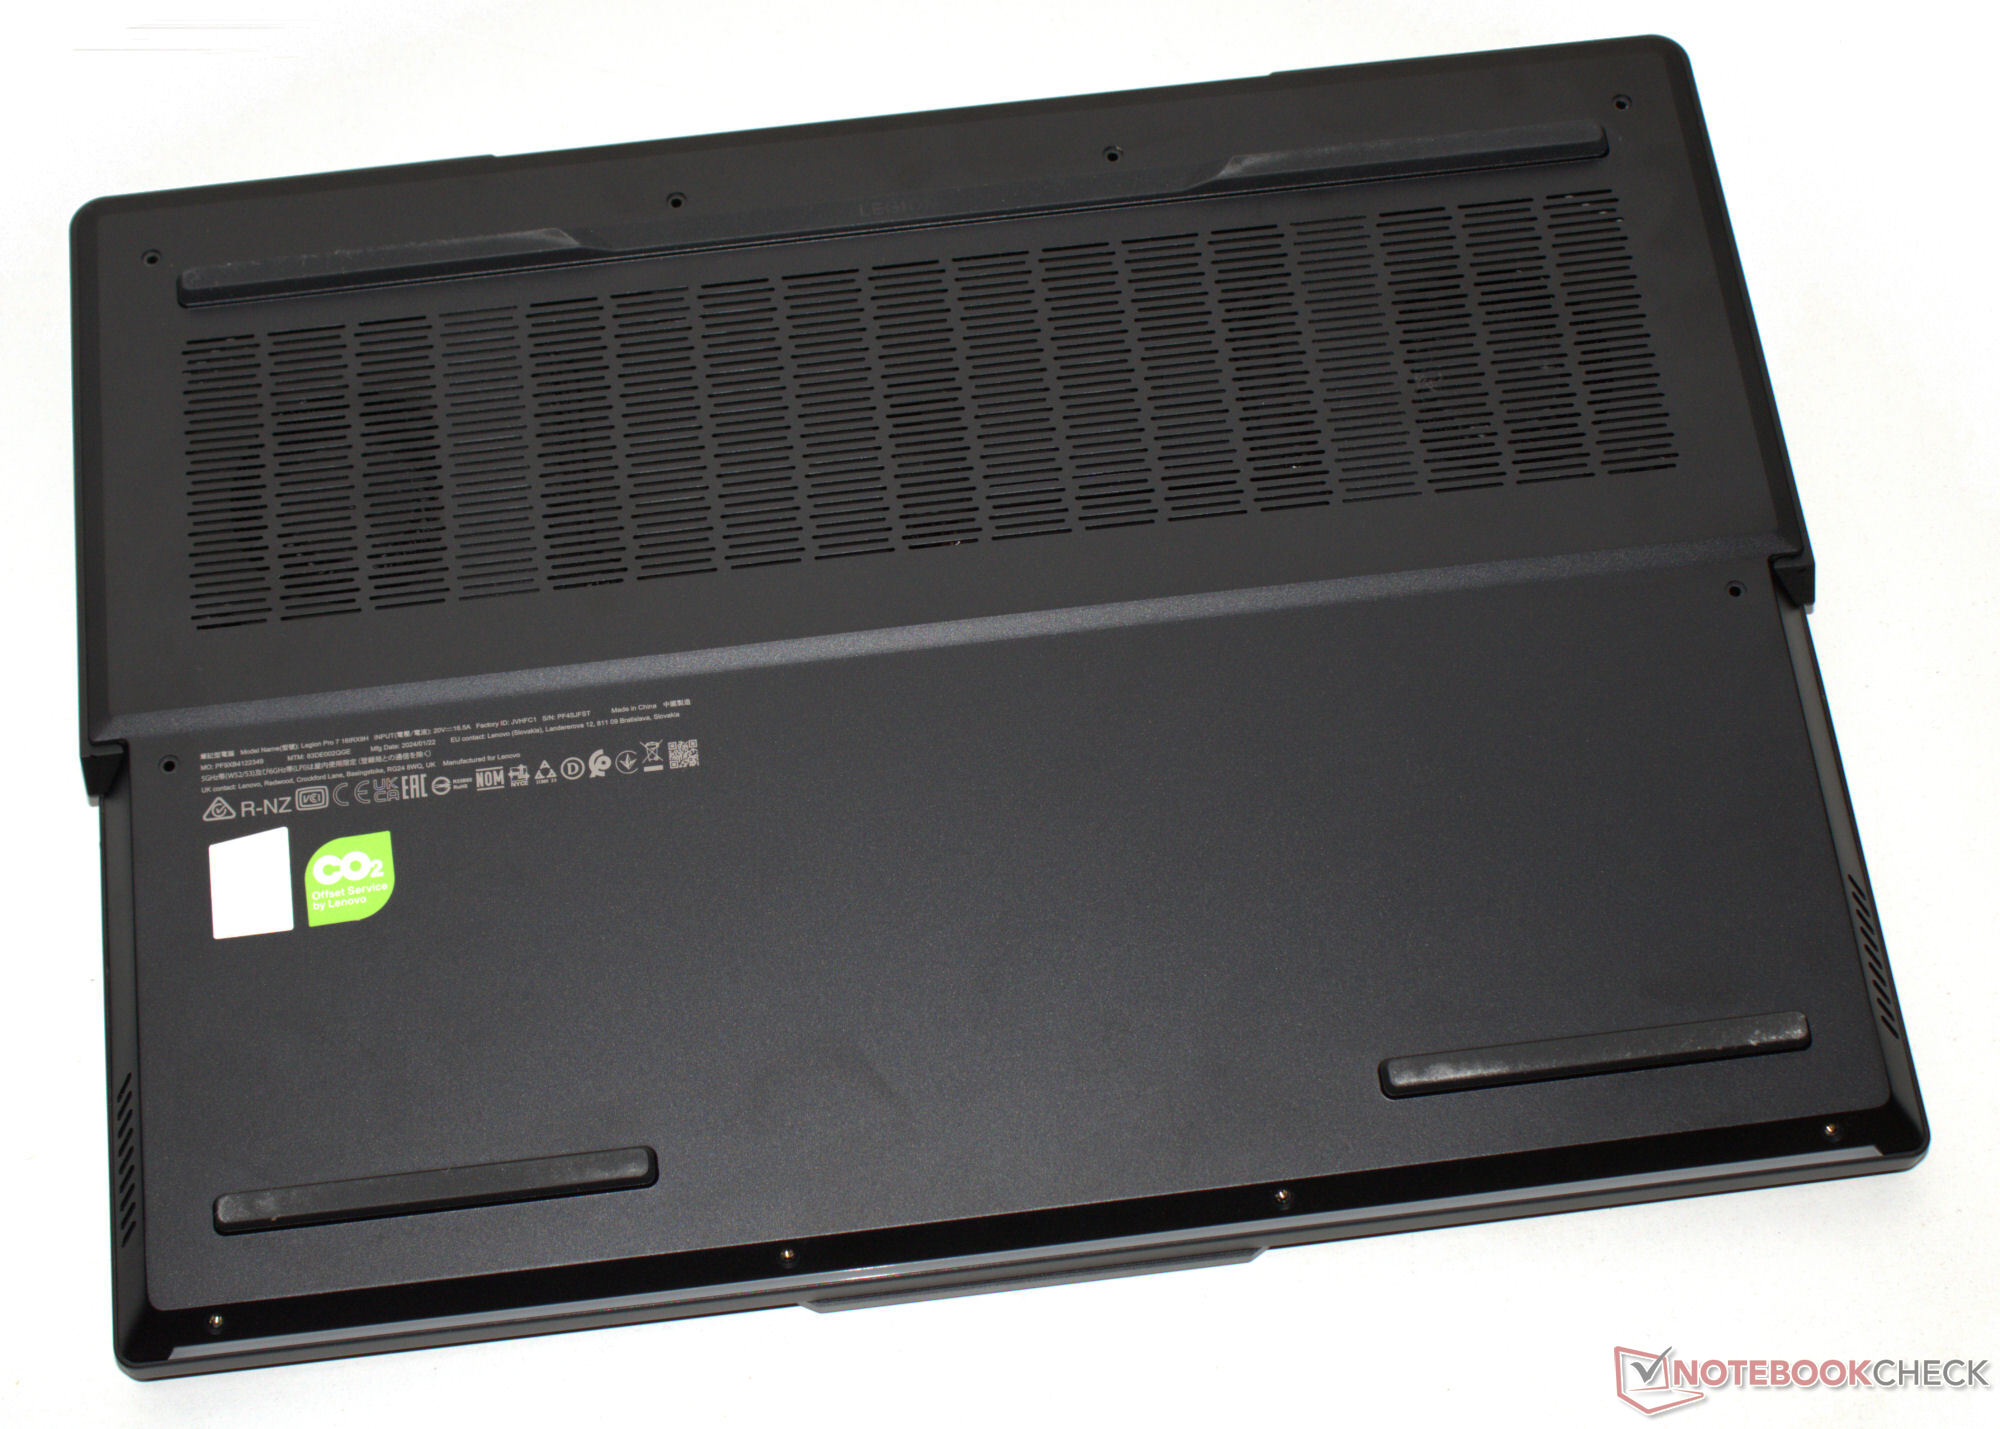
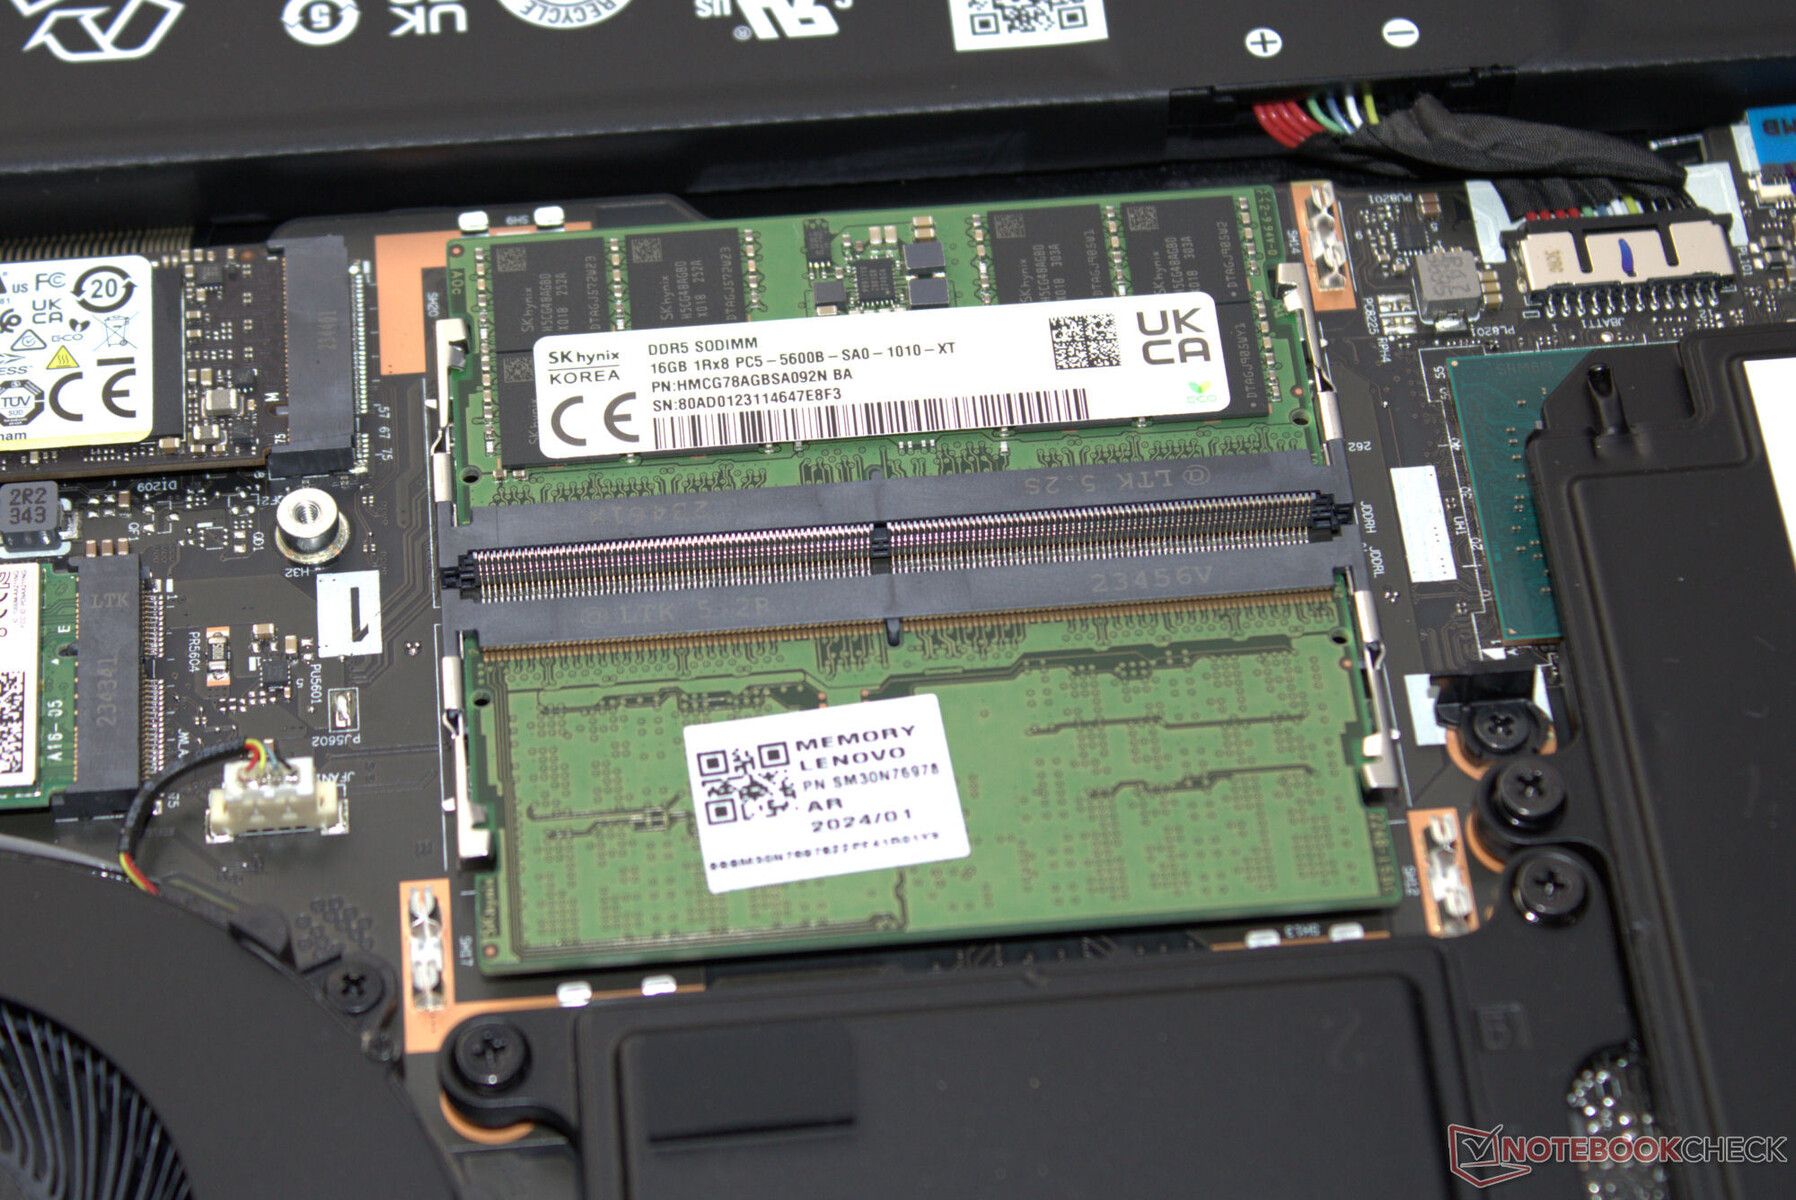
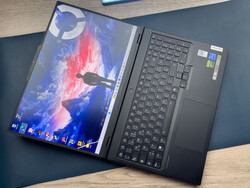
Hårdvaran i Legionär förpackad i ett robust, mattsvart aluminiumchassi med en slät yta. En bakgrundsbelysning på tangentbordet och en LED-remsa som är vänd mot användaren ger lite färgstark piff. De styva gångjärnen med en maximal öppningsvinkel på 180 grader förtjänar en tumme upp. Batteriet (fastskruvat, inte fastlimmat) och resten av interndelarna är åtkomliga när bottenluckan har tagits bort.
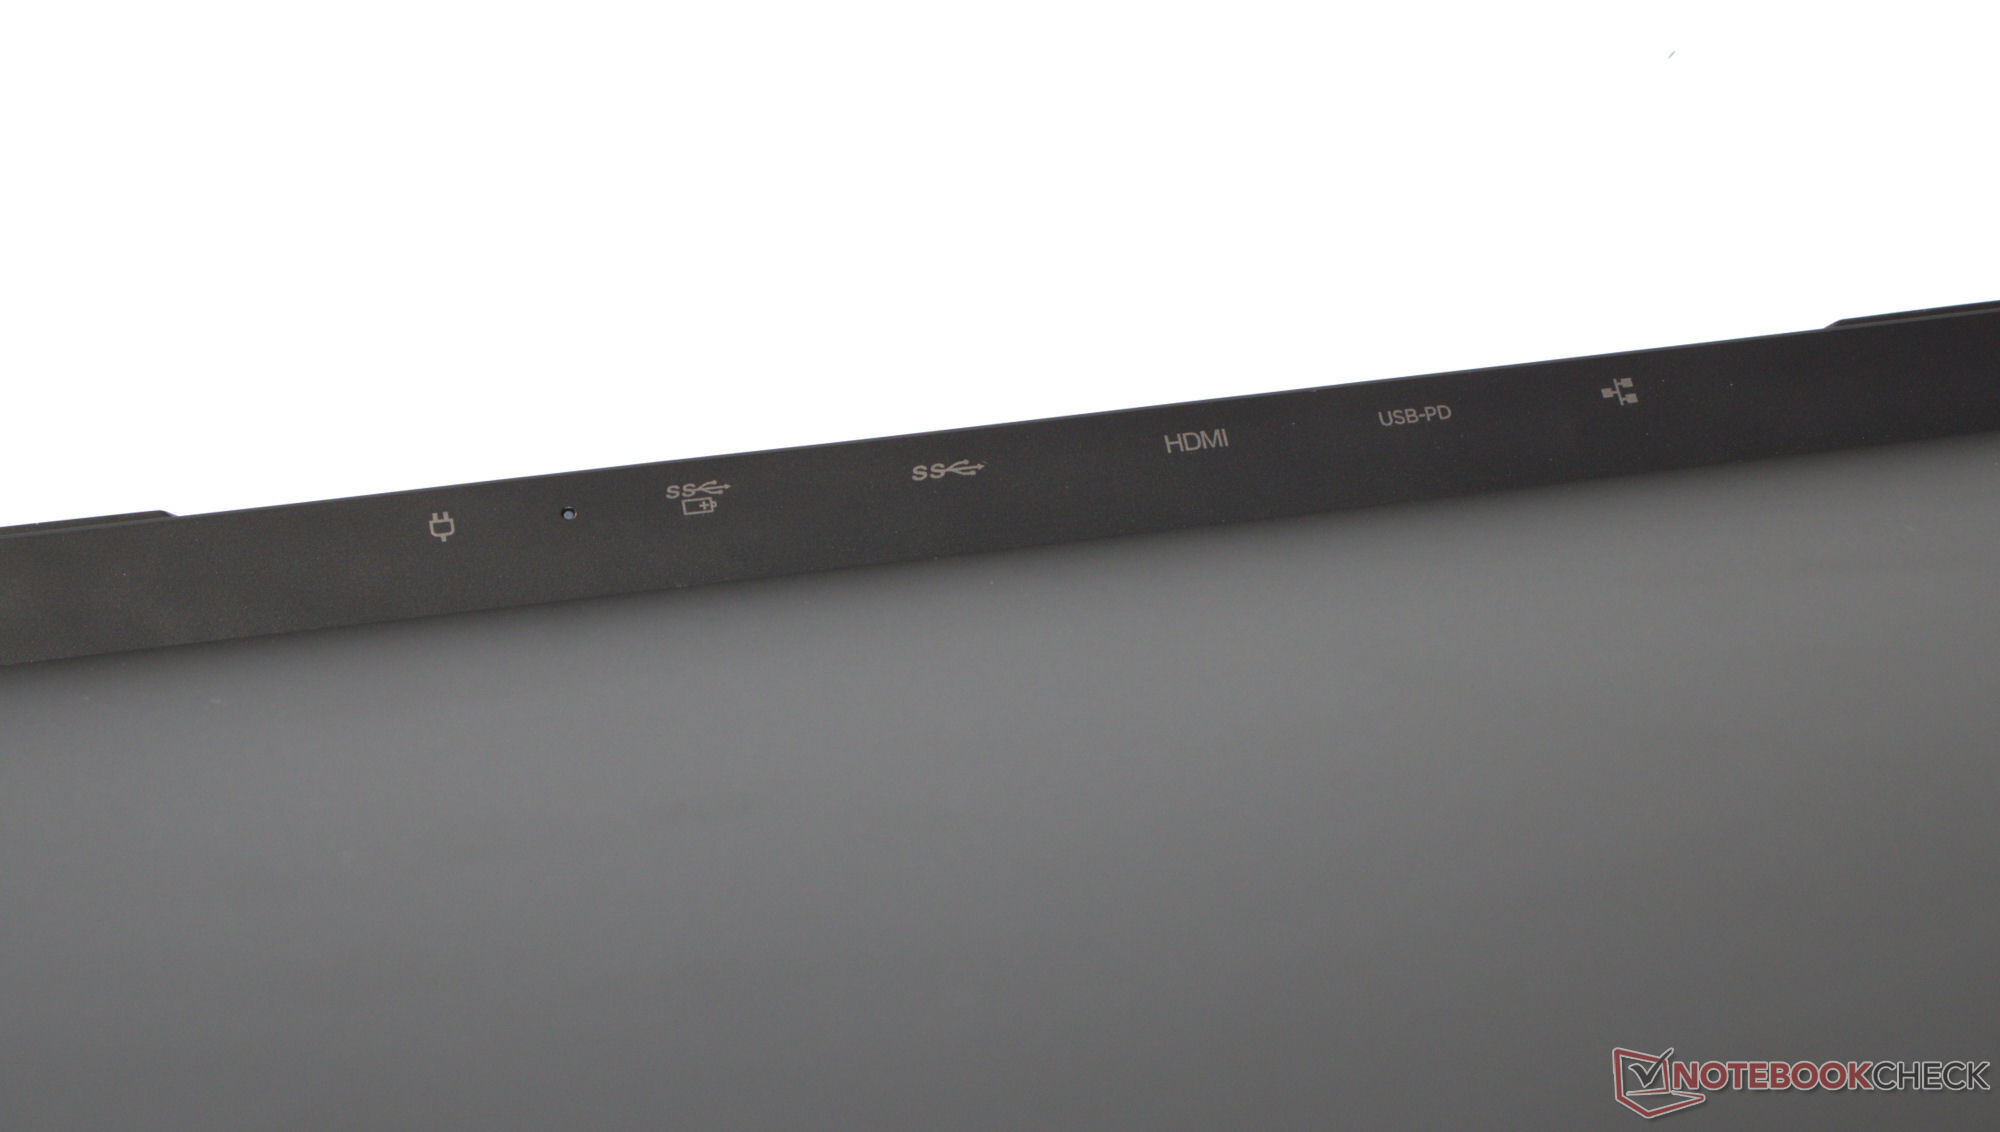
Den bärbara datorn saknar inte I/O, med fyra USB-A-portar (USB 3.2 Gen 1) och två USB-C-portar (1x Thunderbolt 4, 1 x USB 3.2 Gen 2; 1x PD, 2x DP). Det finns totalt tre videoutgångar (1x HDMI, 2x DP). Webbkameran på 2,1MP 1080p är utrustad med en sekretesslucka och ger mycket bra resultat. Det finns ingen minneskortsläsare ombord.
Under optimala förhållanden (dvs. inga andra Wi-Fi-enheter i närheten, kort avstånd mellan den bärbara datorn och serverdatorn) uppnådde Legion Pro 7 fantastiska Wi-Fi-datahastigheter. Den bärbara datorn använder ett Killer AX1675i Wi-Fi 6E-chip (aka Intel AX211). Trådbunden anslutning hanteras av en Realtek RTL8168/8111-styrenhet.
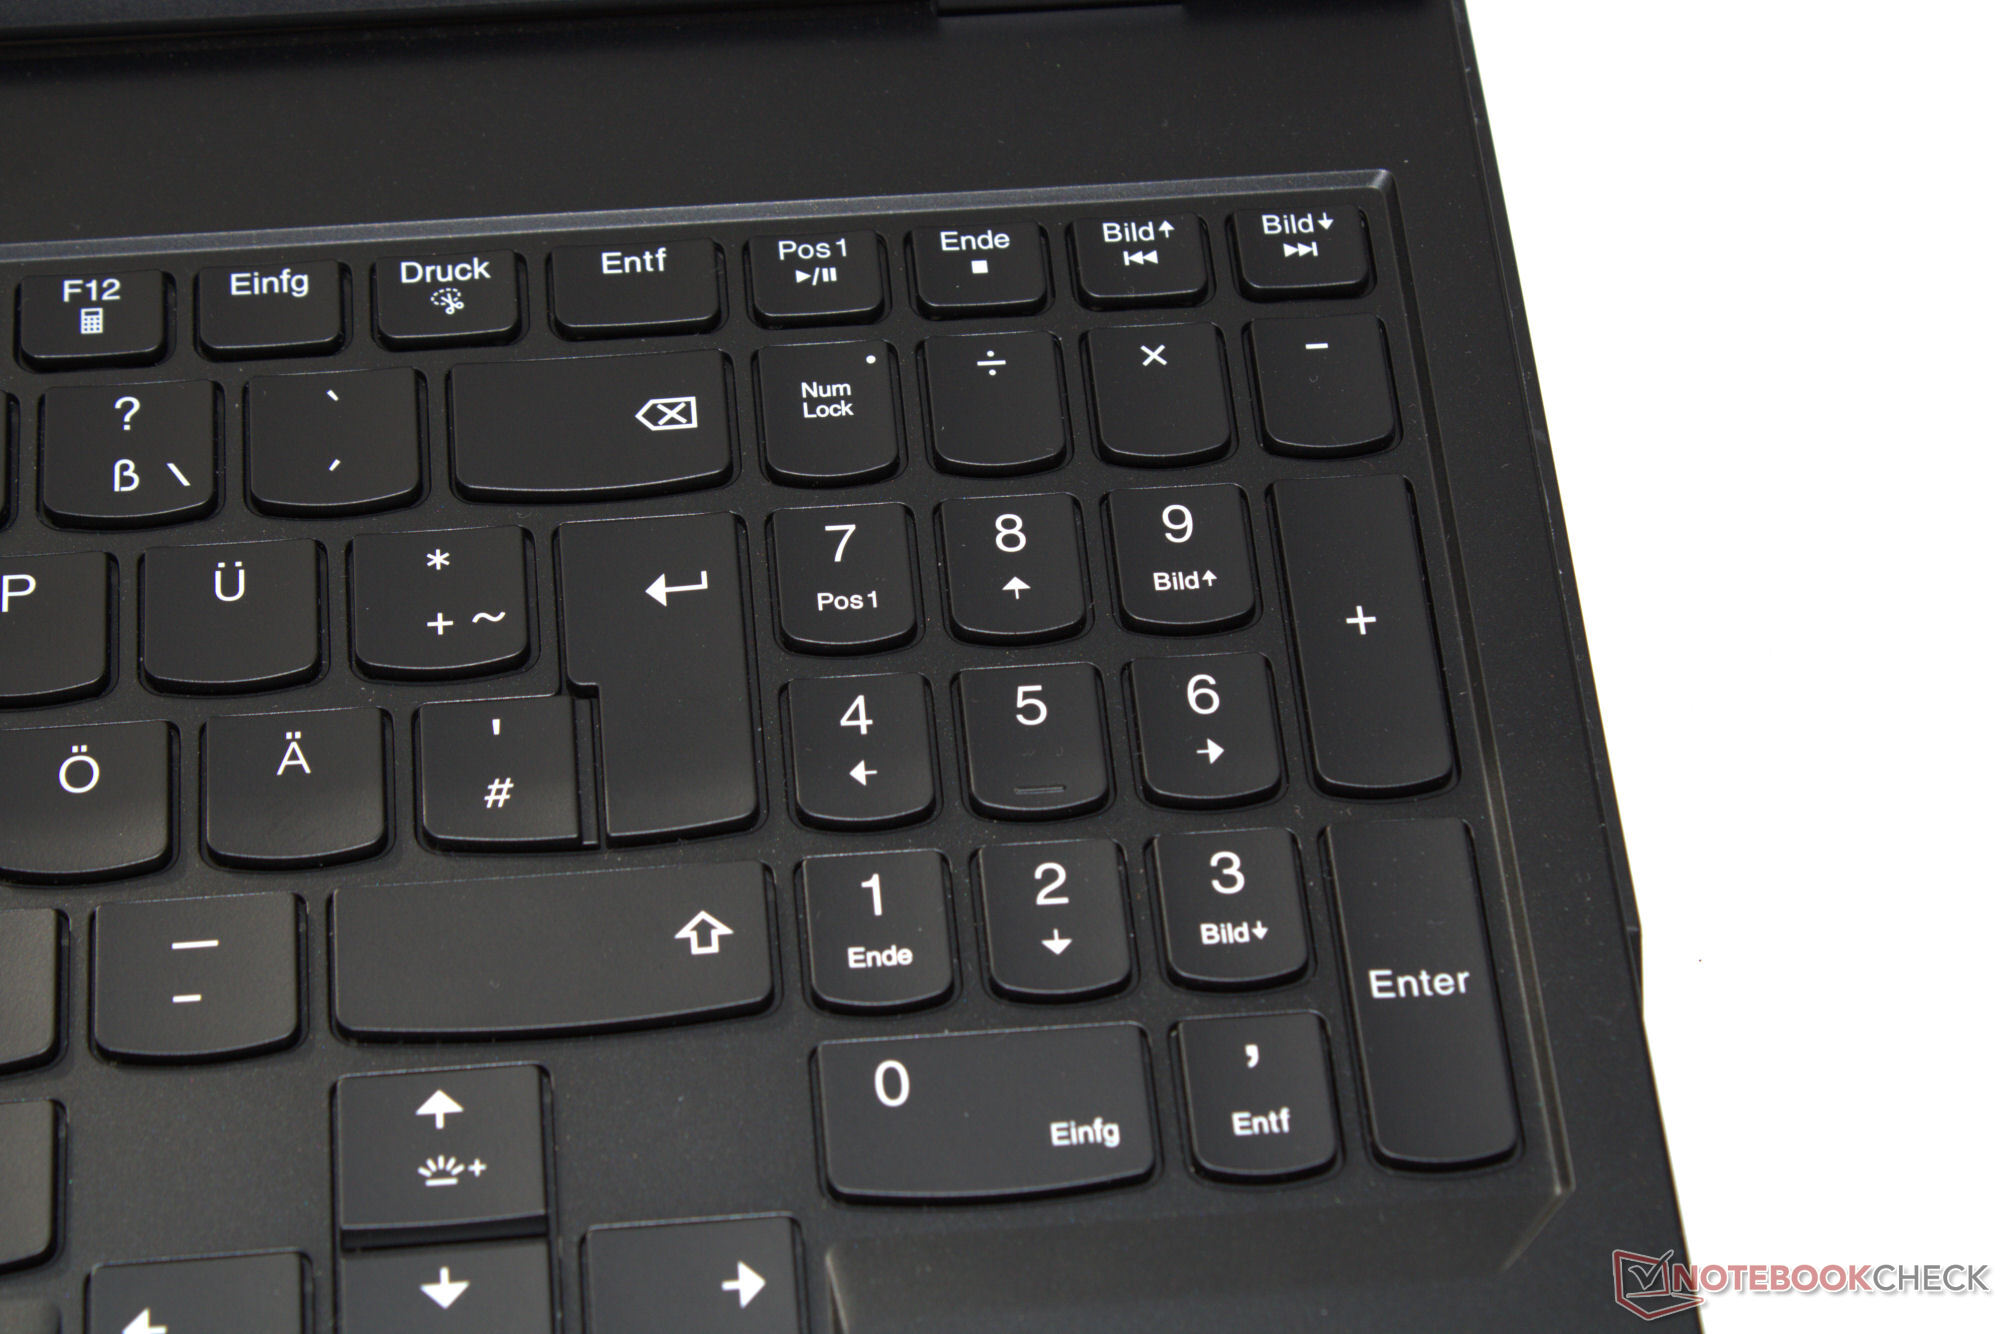
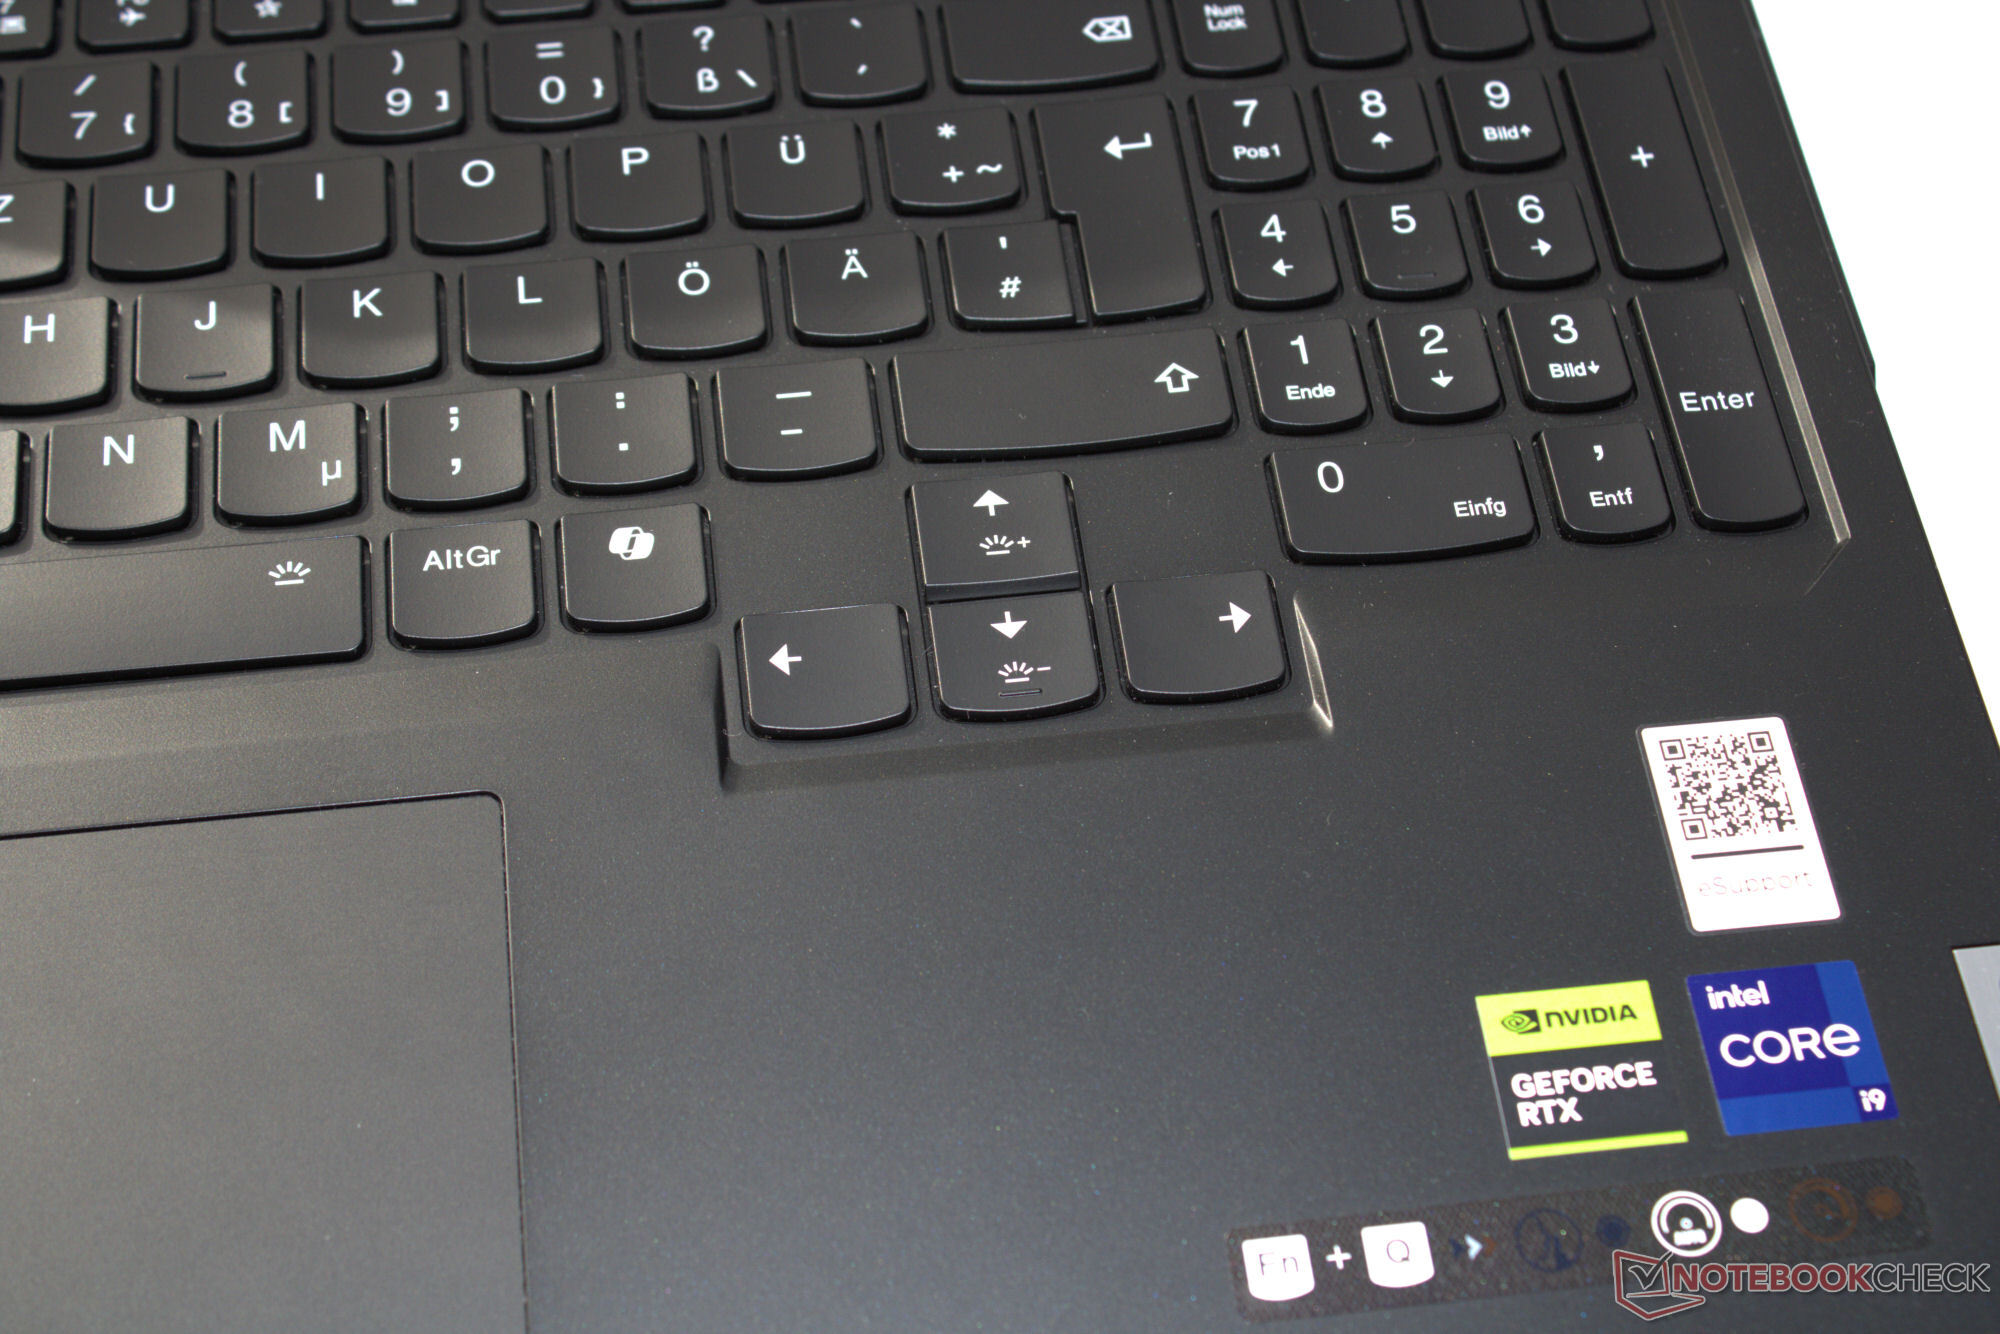
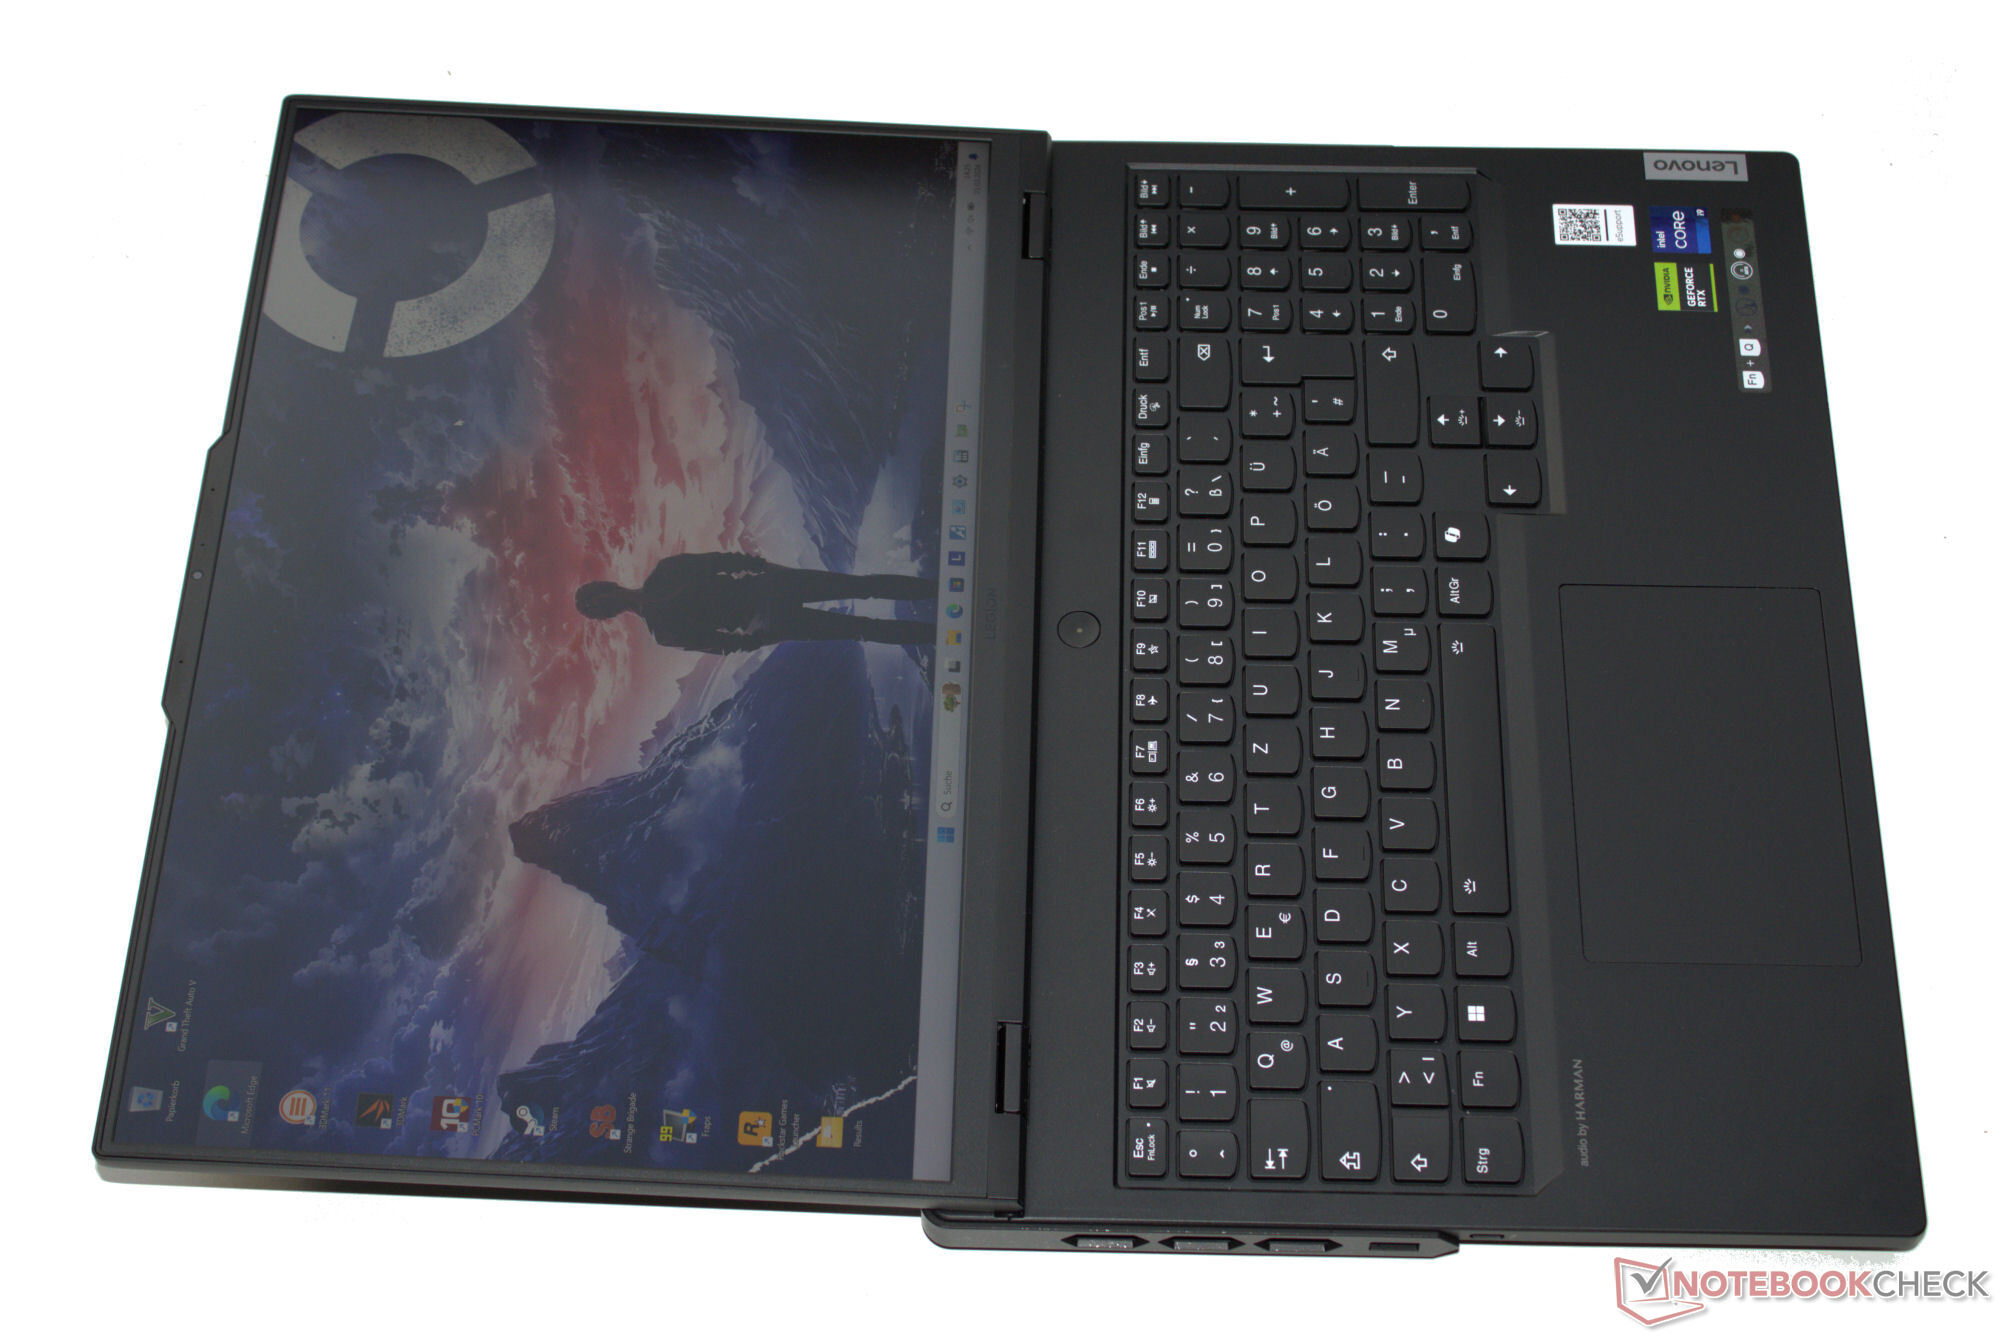


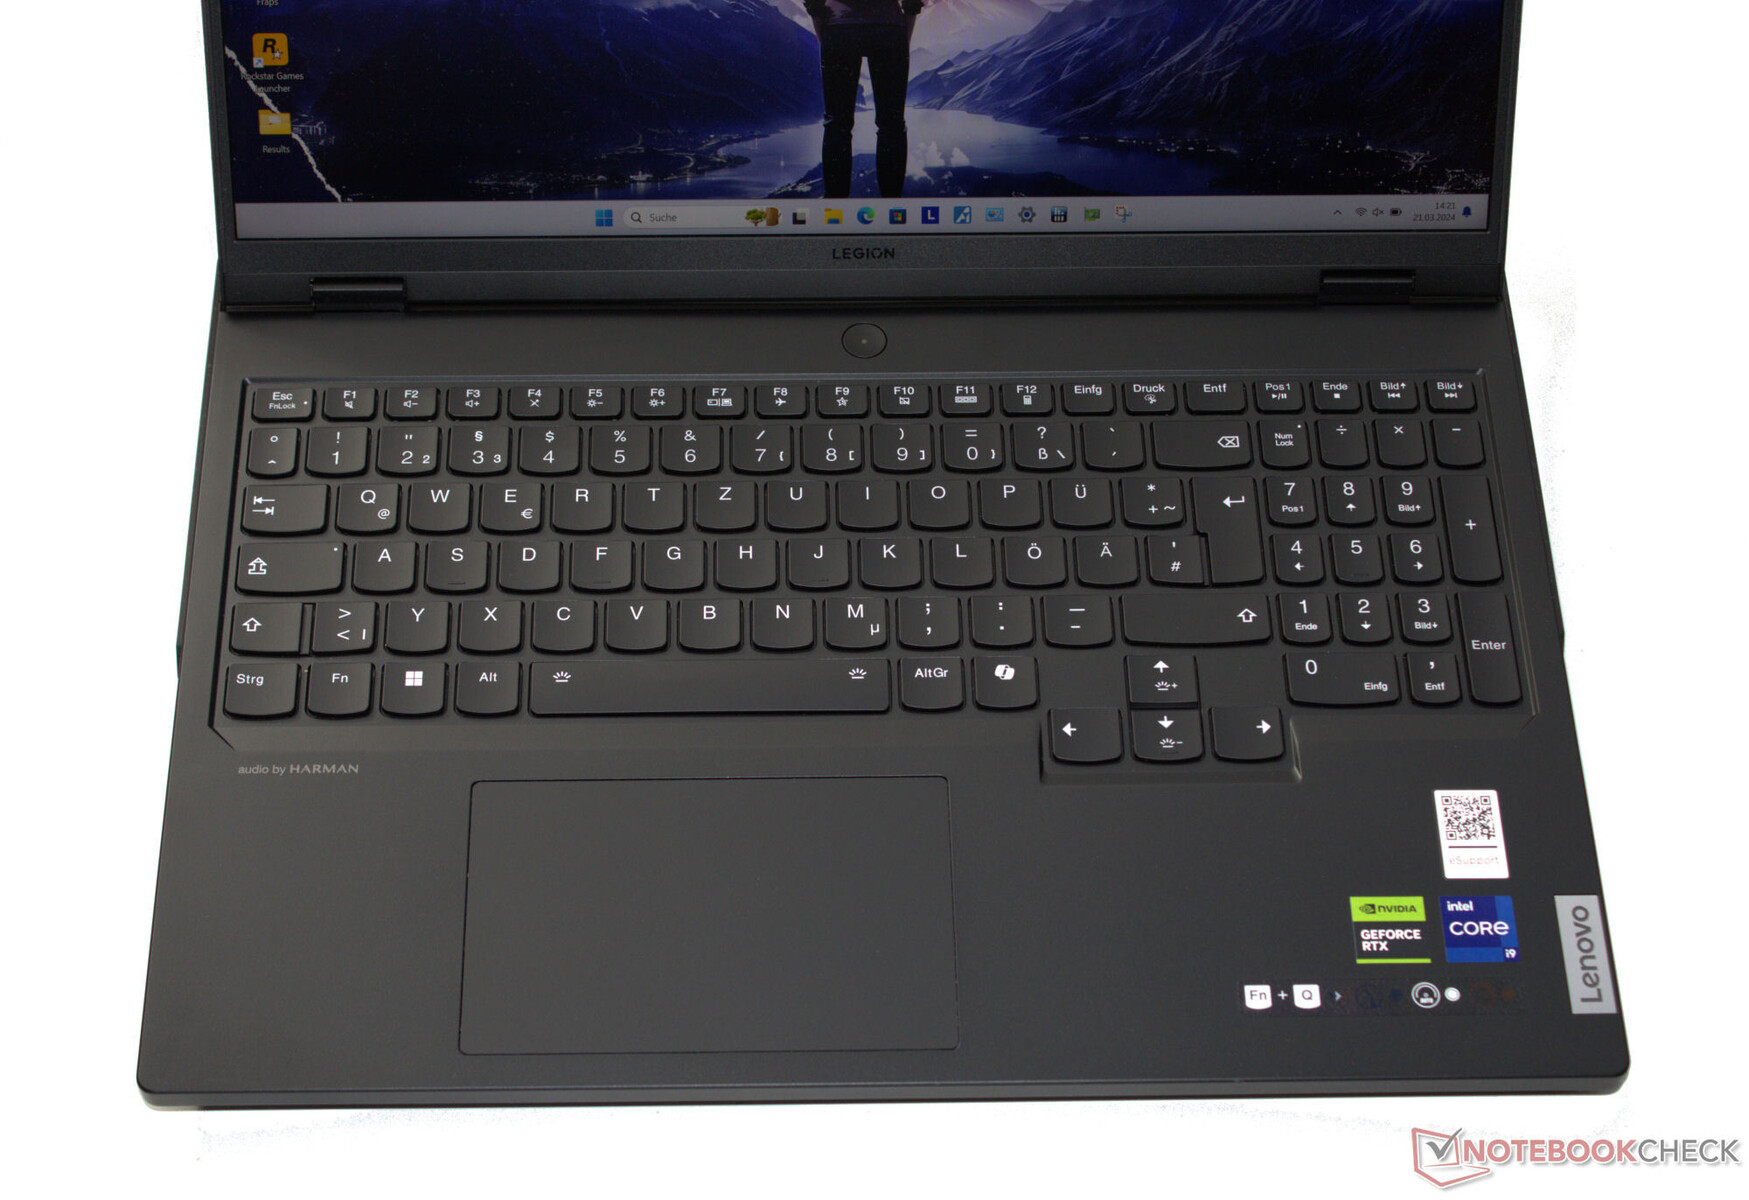
Inmatningsenheter - Utrustade med ett tangentbord
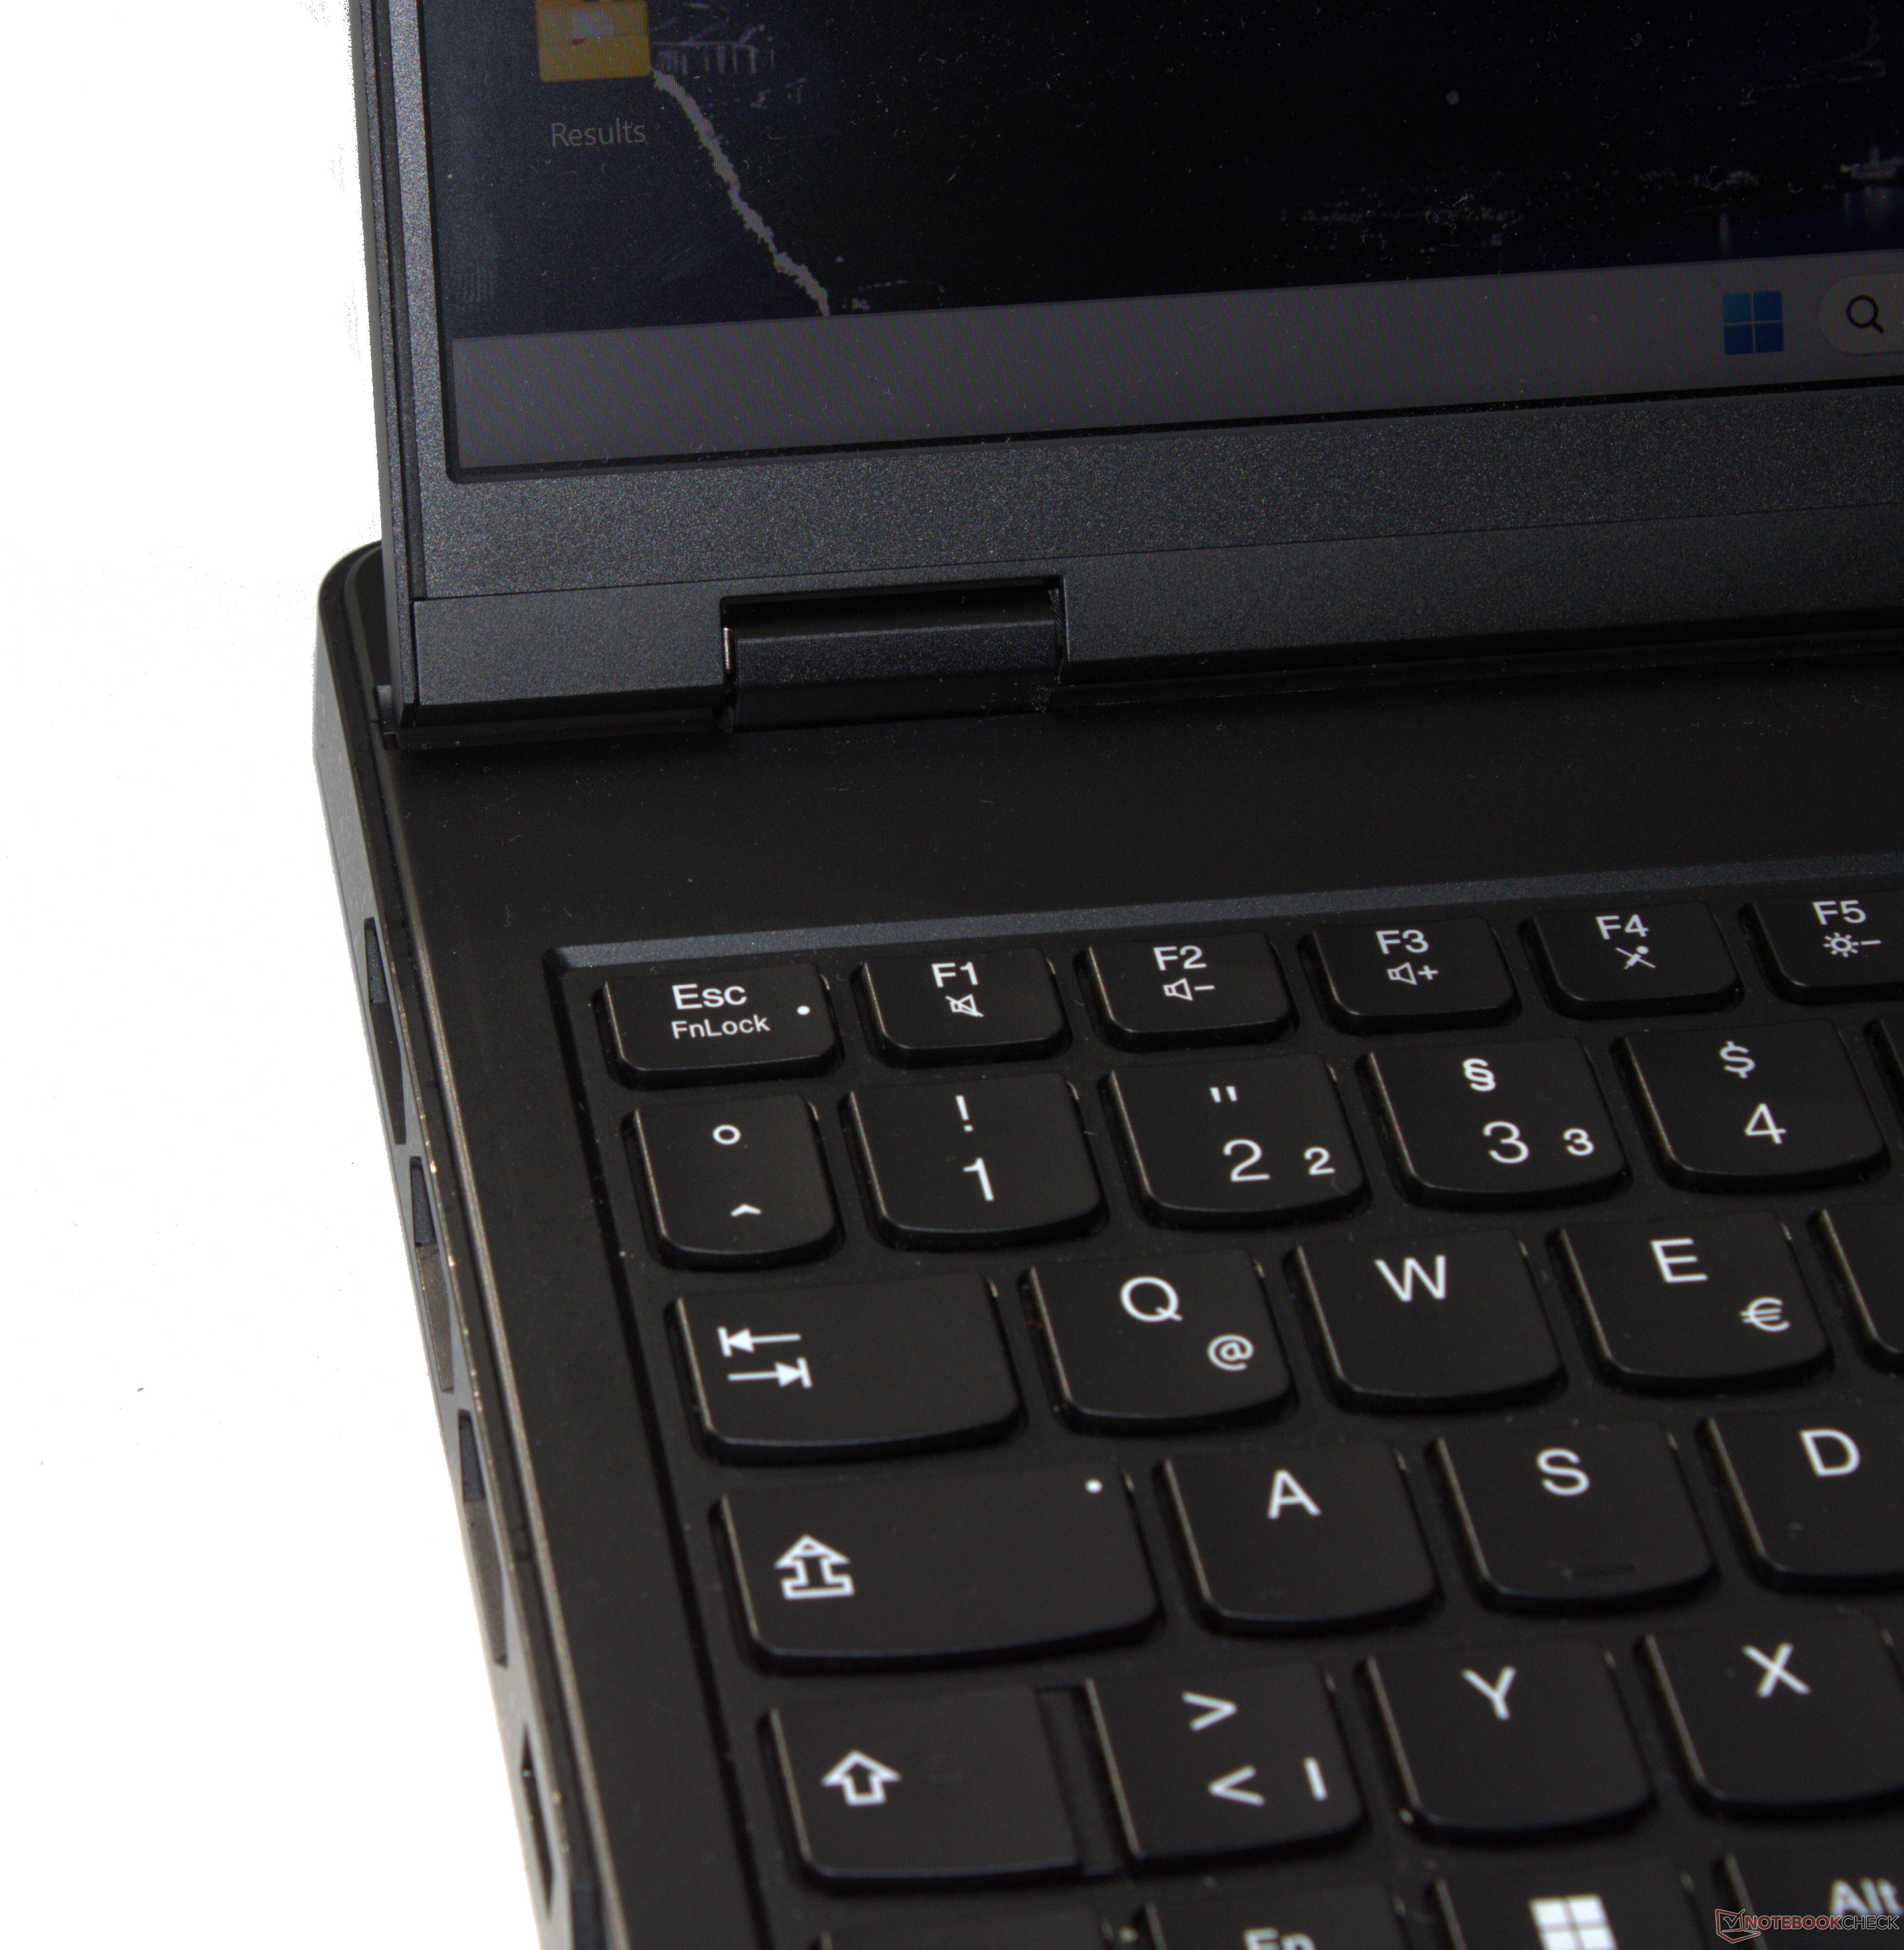
De konkava chiclet-tangenterna med RGB-belysning per tangent har ett behagligt fast motstånd och en tydlig aktiveringspunkt. Tangentbordet böjer sig en aning när du skriver, men det påverkar inte skrivupplevelsen i övrigt. Piltangenterna är i full storlek. För musstyrning har den bärbara datorn en multitouch-aktiverad klickplatta (ca 12 x 7,5 cm, eller 4,7 x 3,0 tum) med kort rörelseväg och en tydlig klickpunkt.
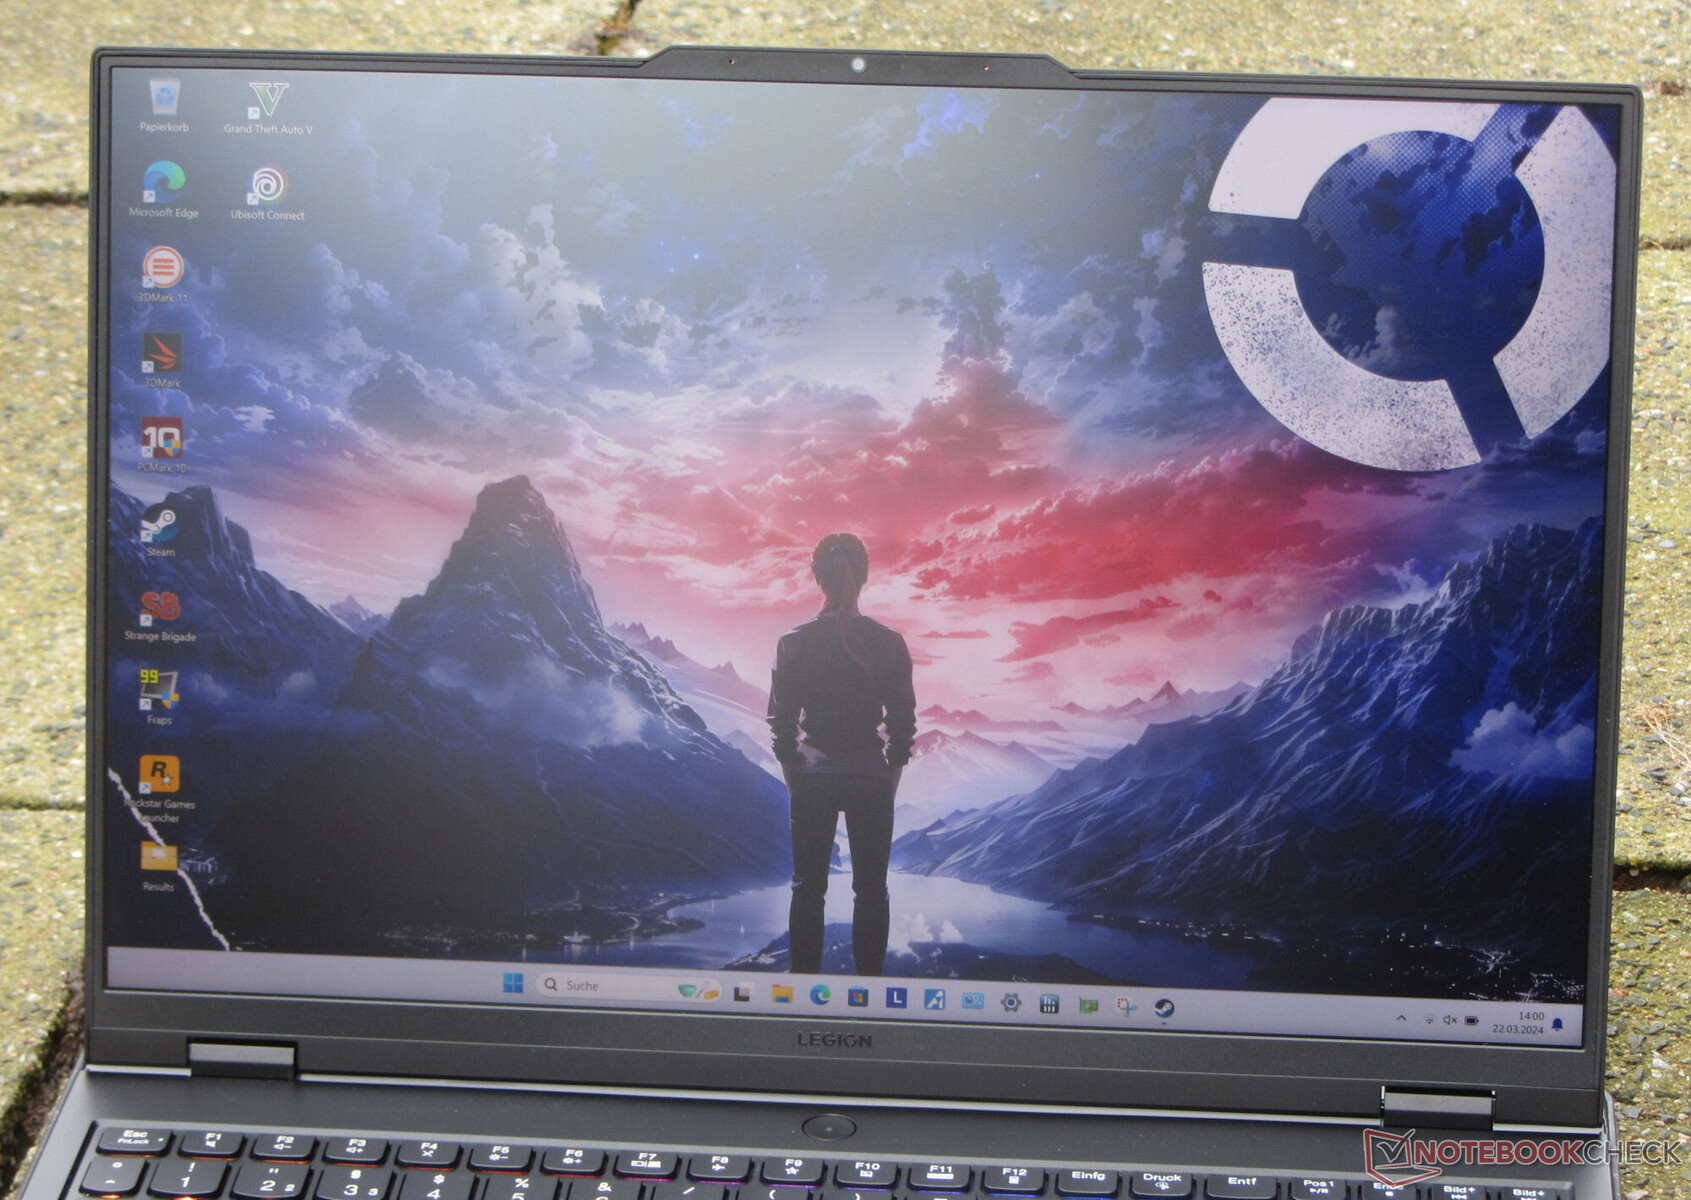
Display - 16:10, DCI-P3, Dolby Vision
Den 16-tums matta IPS-skärmen (upplösning 2 560 x 1 600) med ett bildförhållande på 16:10 har stöd för G-Sync, Dolby Vision, snabb responstid och ingen PWM-flimmer. Ljusstyrkan och kontrasten på 240 Hz-panelen nådde också nivåer som kan anses vara bra (> 300 cd/m² respektive 1 000:1). Lenovo erbjuder inga andra skärmalternativ.
| |||||||||||||||||||||||||
Distribution av ljusstyrkan: 88 %
Mitt på batteriet: 487 cd/m²
Kontrast: 1160:1 (Svärta: 0.42 cd/m²)
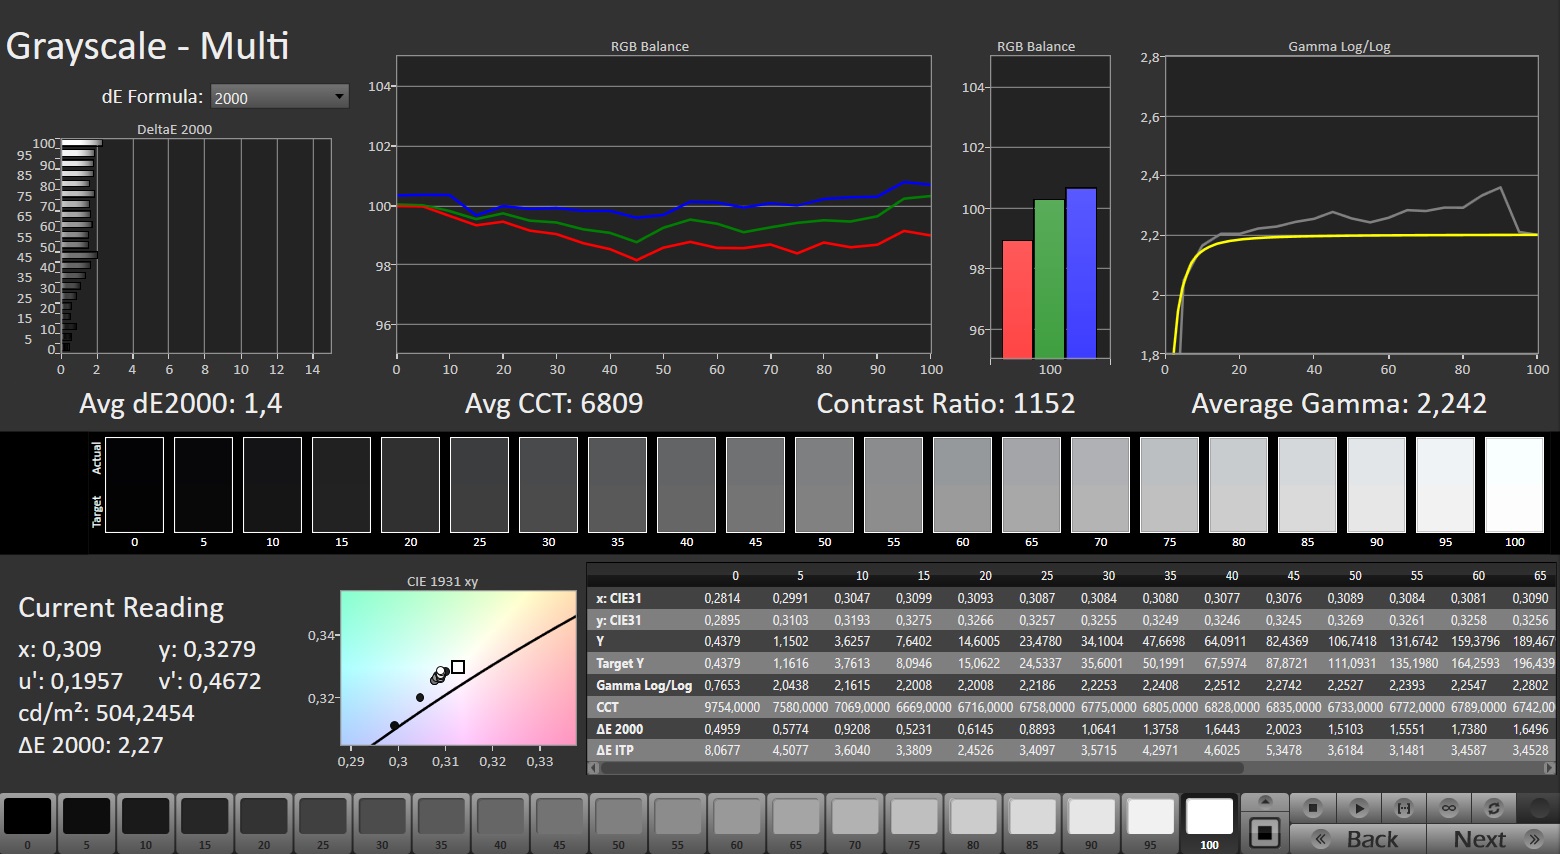
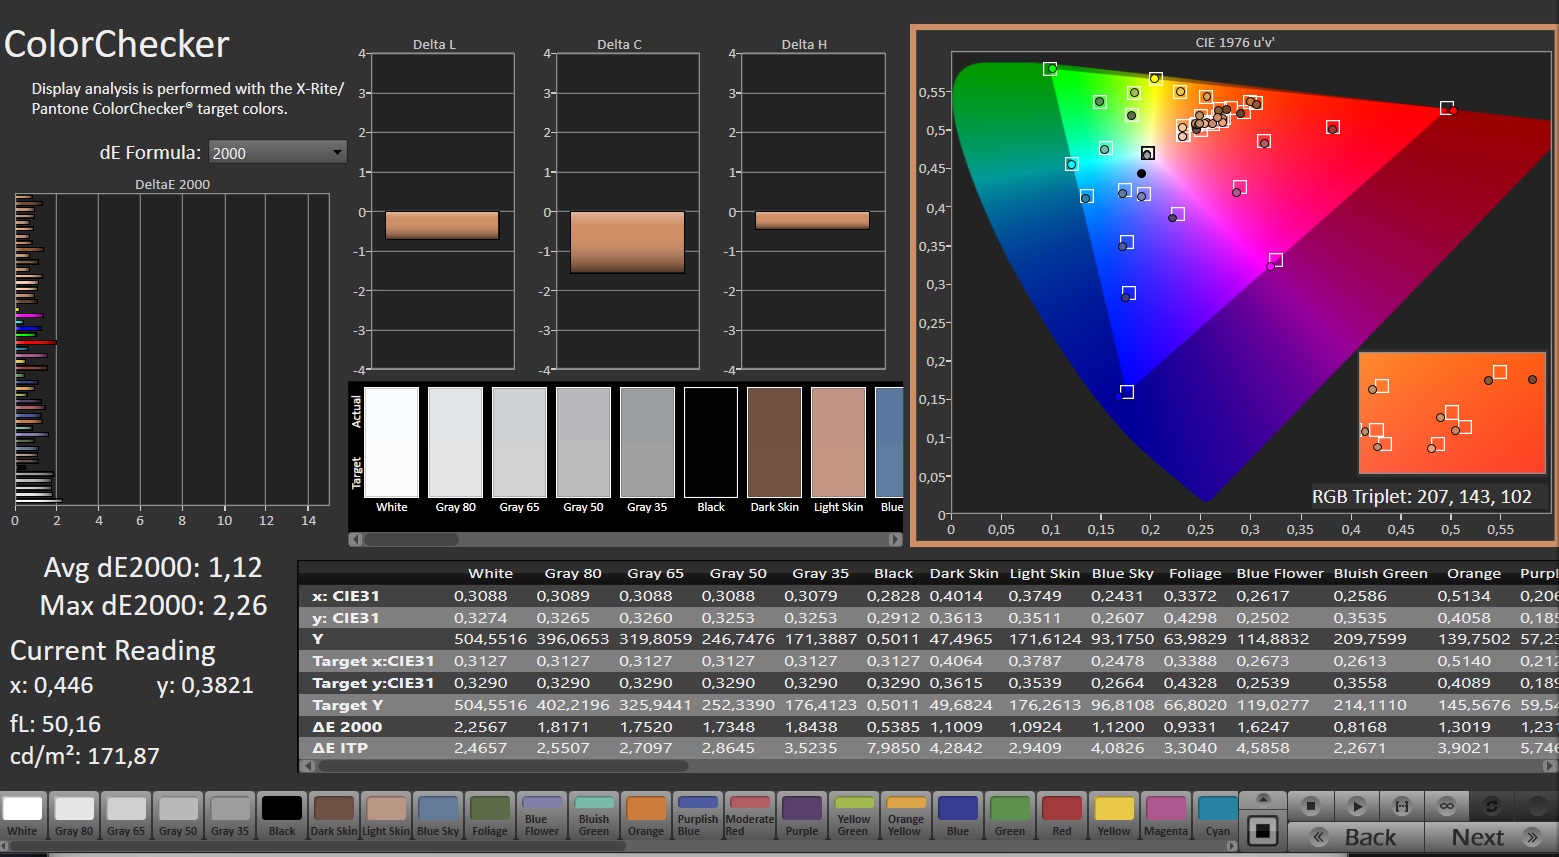
ΔE ColorChecker Calman: 1.12 | ∀{0.5-29.43 Ø4.72}
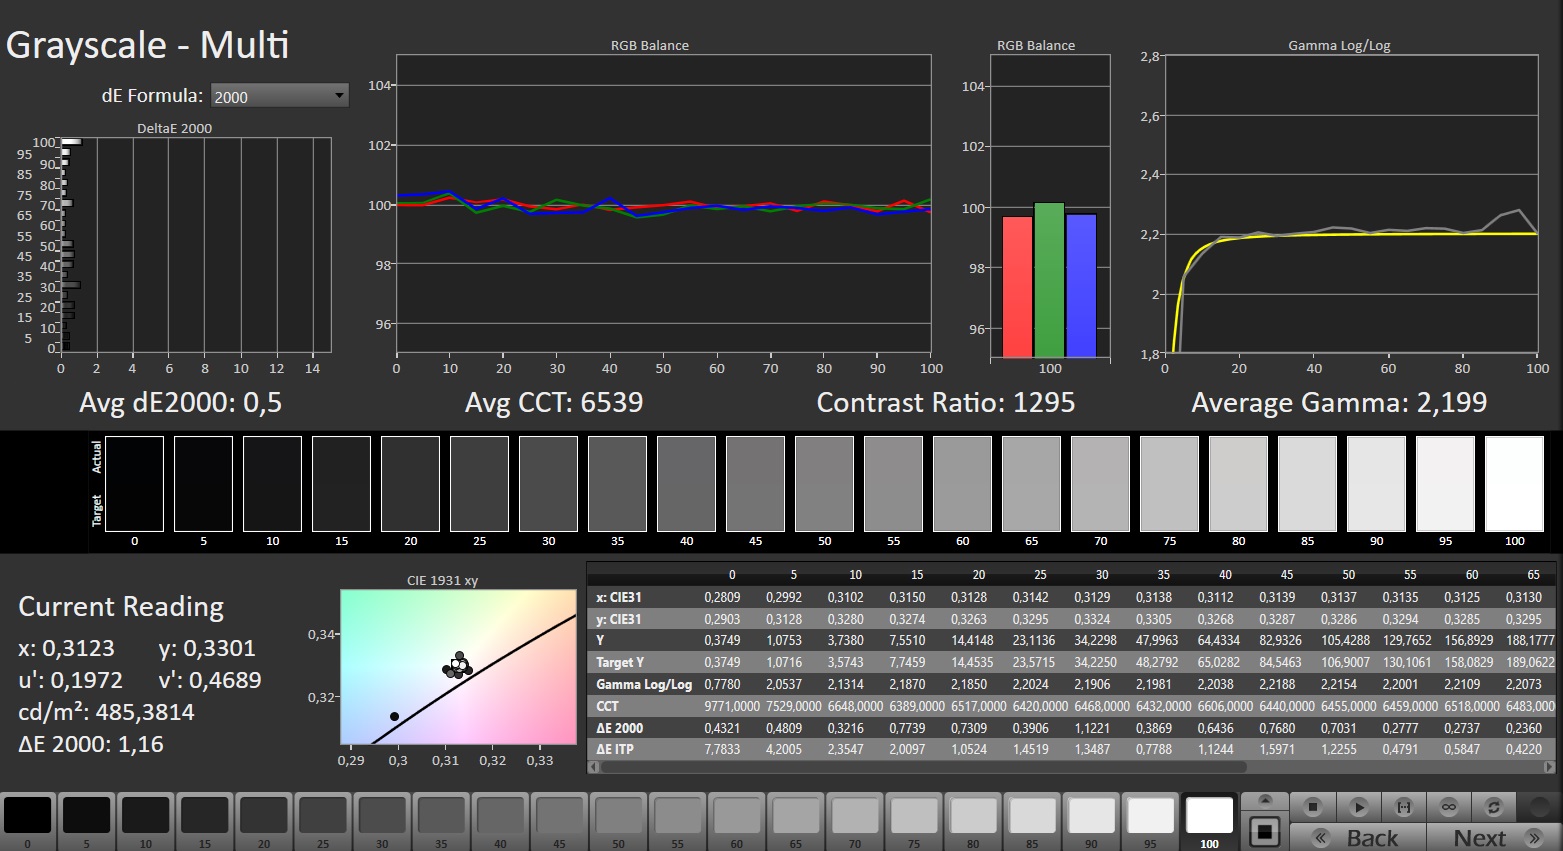
calibrated: 0.54
ΔE Greyscale Calman: 1.4 | ∀{0.09-98 Ø4.97}
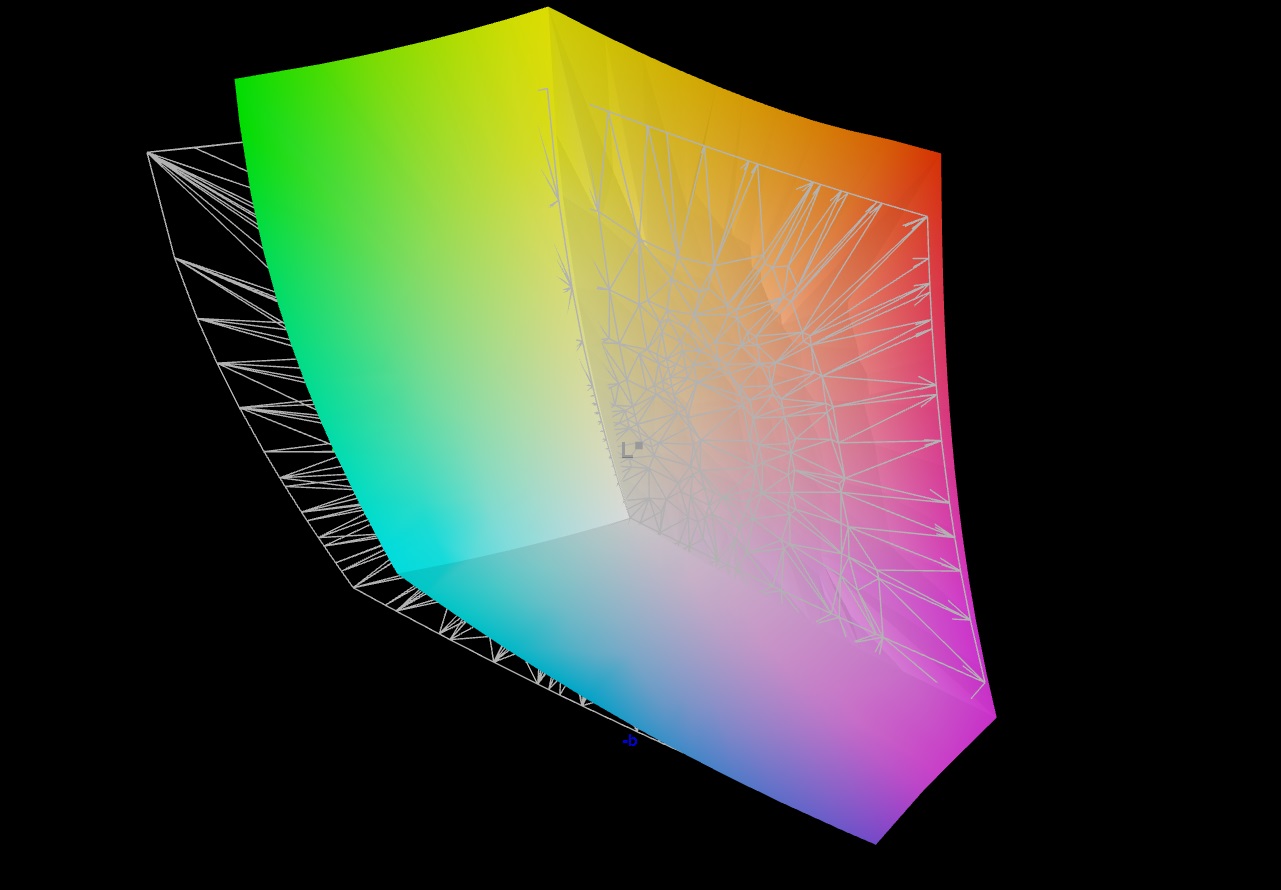
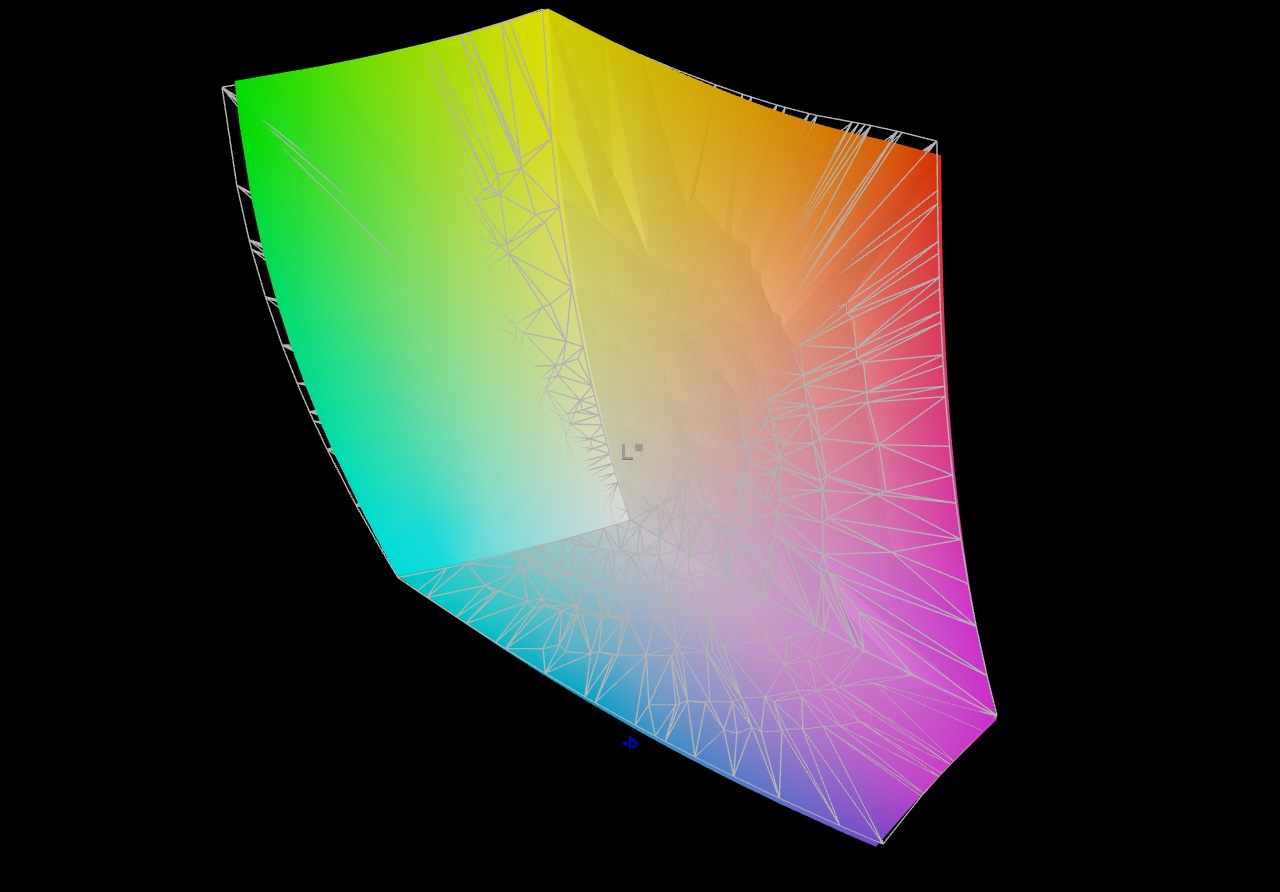
86.7% AdobeRGB 1998 (Argyll 3D)
99.9% sRGB (Argyll 3D)
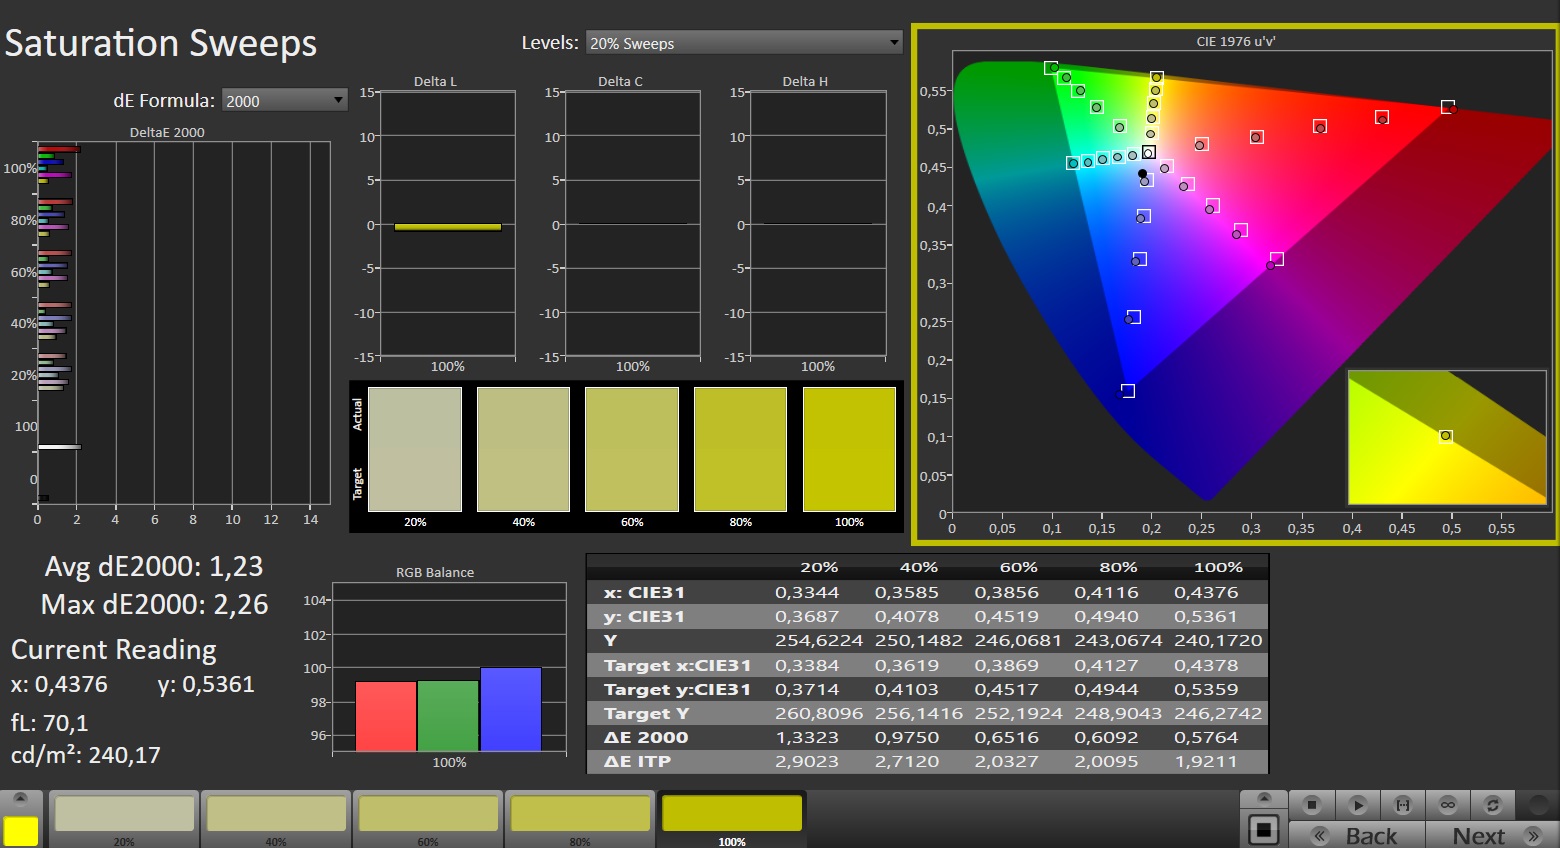
98.5% Display P3 (Argyll 3D)
Gamma: 2.242
CCT: 6809 K
| Lenovo Legion Pro 7 16IRX9H BOE CQ NE16QDM-NZB, IPS, 2560x1600, 16" | Alienware m16 R1 AMD BOE NE16NZ4, IPS, 2560x1600, 16" | MSI Vector 16 HX A14V Chi Mei N160GME-GTB, IPS, 2560x1600, 16" | HP Omen 16 (2024) BOE BOE0B7D, IPS, 2560x1440, 16.1" | Lenovo Legion Pro 7 16IRX8H MNG007DA2-3 (CSO1628), IPS, 2560x1600, 16" | |
|---|---|---|---|---|---|
| Display | 1% | -1% | -17% | -16% | |
| Display P3 Coverage (%) | 98.5 | 98.6 0% | 95.4 -3% | 68.6 -30% | 69.1 -30% |
| sRGB Coverage (%) | 99.9 | 99.9 0% | 99.7 0% | 98.6 -1% | 99.7 0% |
| AdobeRGB 1998 Coverage (%) | 86.7 | 88.9 3% | 85.4 -1% | 70.6 -19% | 71.2 -18% |
| Response Times | 3% | -21% | -36% | 0% | |
| Response Time Grey 50% / Grey 80% * (ms) | 12.6 ? | 5.1 ? 60% | 5.7 ? 55% | 14.1 ? -12% | 12.3 ? 2% |
| Response Time Black / White * (ms) | 5.8 ? | 9 ? -55% | 11.4 ? -97% | 9.3 ? -60% | 5.9 ? -2% |
| PWM Frequency (Hz) | |||||
| Screen | -109% | -73% | -46% | 3% | |
| Brightness middle (cd/m²) | 487 | 329 -32% | 557.2 14% | 292 -40% | 511 5% |
| Brightness (cd/m²) | 460 | 317 -31% | 506 10% | 291 -37% | 469 2% |
| Brightness Distribution (%) | 88 | 89 1% | 83 -6% | 85 -3% | 86 -2% |
| Black Level * (cd/m²) | 0.42 | 0.32 24% | 0.41 2% | 0.24 43% | 0.4 5% |
| Contrast (:1) | 1160 | 1028 -11% | 1359 17% | 1217 5% | 1278 10% |
| Colorchecker dE 2000 * | 1.12 | 3.71 -231% | 2.91 -160% | 2.36 -111% | 0.95 15% |
| Colorchecker dE 2000 max. * | 2.26 | 7.23 -220% | 5.94 -163% | 4.08 -81% | 2.07 8% |
| Colorchecker dE 2000 calibrated * | 0.54 | 2.82 -422% | 1.63 -202% | 0.93 -72% | 0.91 -69% |
| Greyscale dE 2000 * | 1.4 | 2.2 -57% | 3.8 -171% | 3 -114% | 0.6 57% |
| Gamma | 2.242 98% | 2.3 96% | 2.23 99% | 2.101 105% | 2.176 101% |
| CCT | 6809 95% | 6270 104% | 6408 101% | 5976 109% | 6545 99% |
| Totalt genomsnitt (program/inställningar) | -35% /
-69% | -32% /
-50% | -33% /
-38% | -4% /
-1% |
* ... mindre är bättre
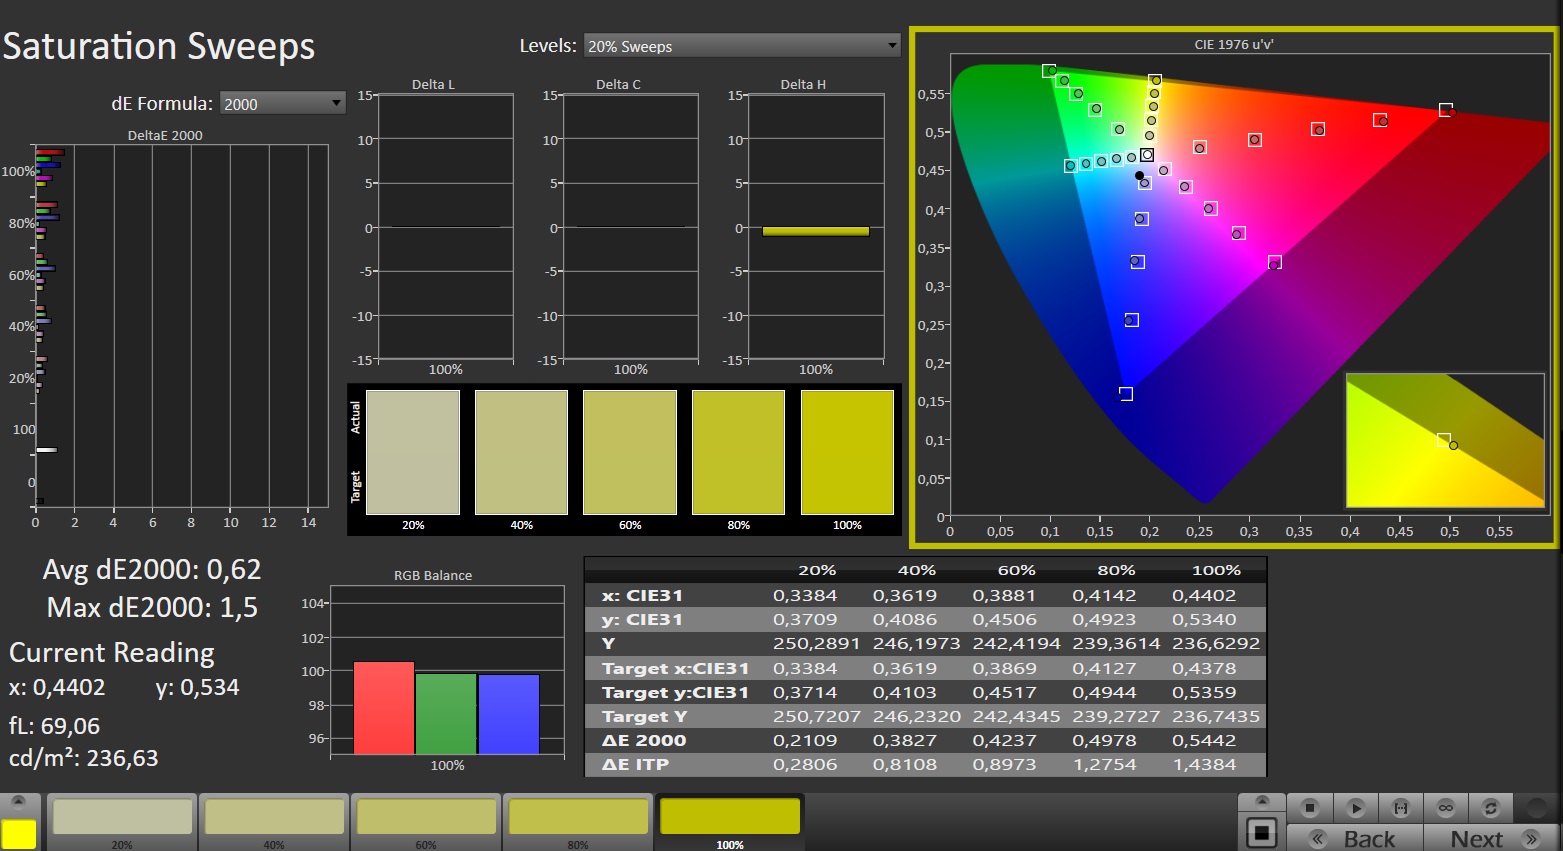
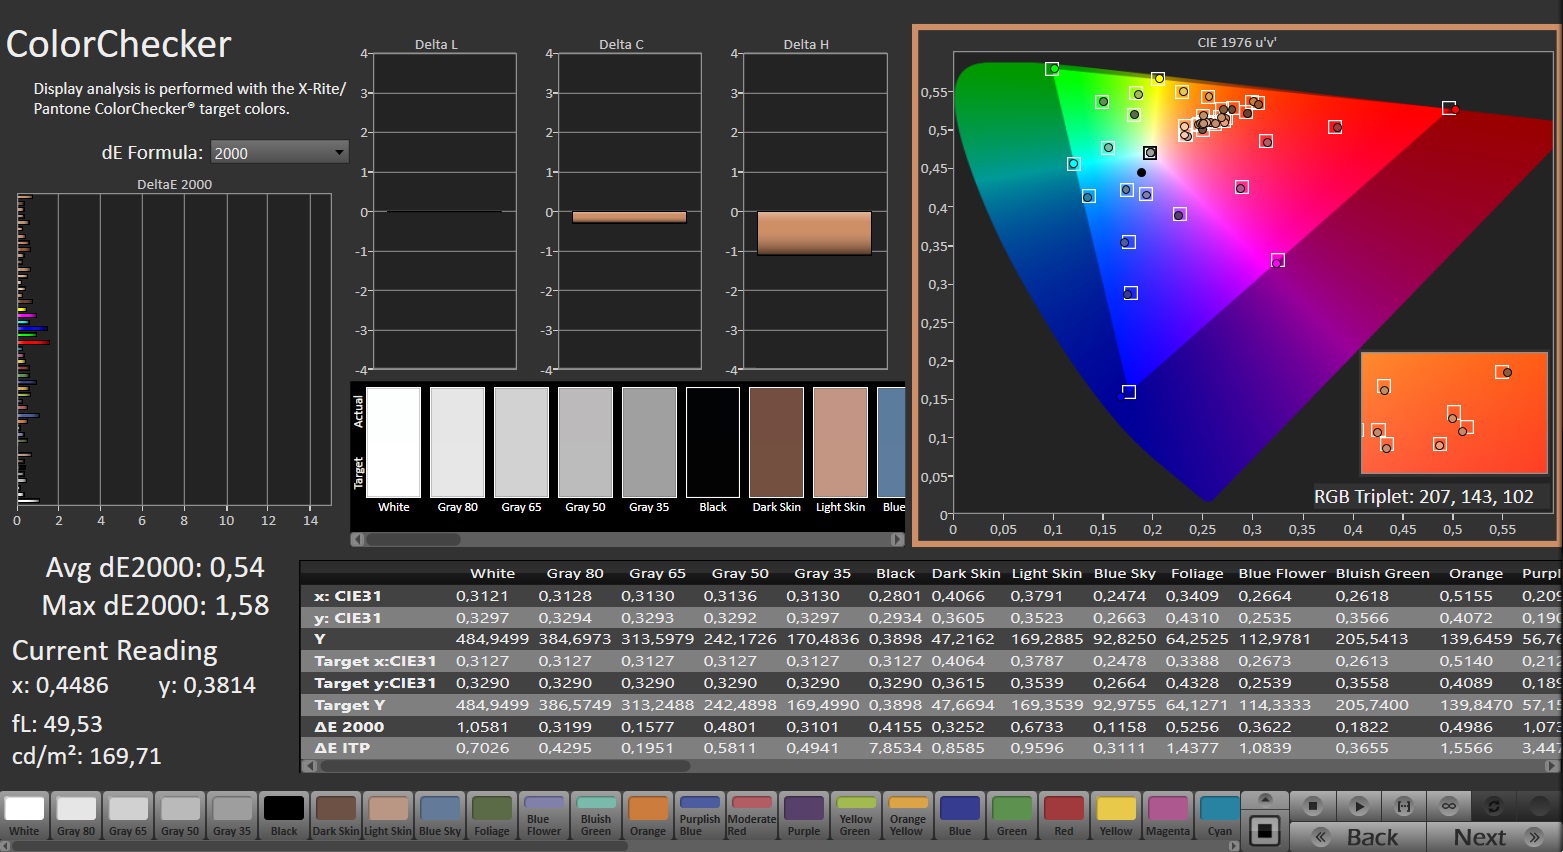
Skärmen hade redan från början en fantastisk färgåtergivning. Den gav ett Delta E på cirka 1,1, vilket uppfyller målnivån på under 3. Kalibrering av skärmen minskade den genomsnittliga färgskillnaden till 0,54 och gav en mer balanserad gråskala. Panelen kan helt täcka sRGB- och DCI-P3-färgrymderna, men inte AdobeRGB-färgrymden. Detta liknar vad som erbjuds av skärmarna på de flesta konkurrerande bärbara datorer.

Visa svarstider
| ↔ Svarstid svart till vitt | ||
|---|---|---|
| 5.8 ms ... stiga ↗ och falla ↘ kombinerat | ↗ 2.1 ms stiga | 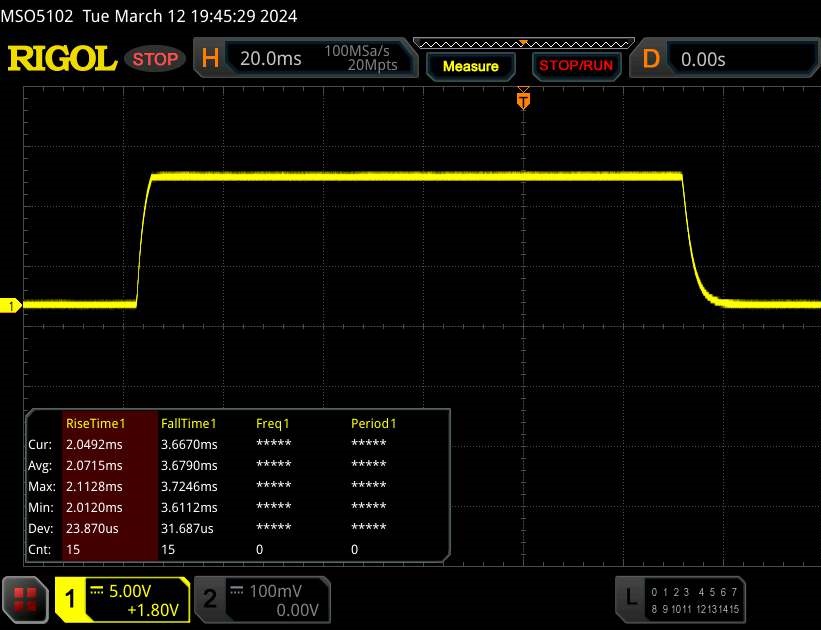 |
| ↘ 3.7 ms hösten | ||
| Skärmen visar väldigt snabba svarsfrekvenser i våra tester och borde vara mycket väl lämpad för fartfyllt spel. I jämförelse sträcker sig alla testade enheter från 0.1 (minst) till 240 (maximalt) ms. » 18 % av alla enheter är bättre. Det betyder att den uppmätta svarstiden är bättre än genomsnittet av alla testade enheter (19.8 ms). | ||
| ↔ Svarstid 50 % grått till 80 % grått | ||
| 12.6 ms ... stiga ↗ och falla ↘ kombinerat | ↗ 6 ms stiga | 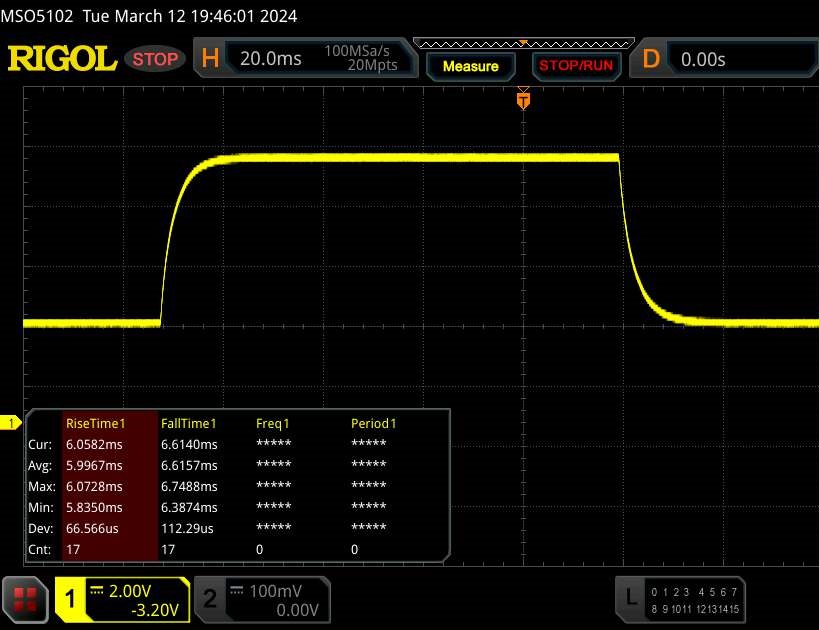 |
| ↘ 6.6 ms hösten | ||
| Skärmen visar bra svarsfrekvens i våra tester, men kan vara för långsam för konkurrenskraftiga spelare. I jämförelse sträcker sig alla testade enheter från 0.165 (minst) till 636 (maximalt) ms. » 26 % av alla enheter är bättre. Det betyder att den uppmätta svarstiden är bättre än genomsnittet av alla testade enheter (31 ms). | ||
Skärmflimmer / PWM (Puls-Width Modulation)
| Skärmflimmer / PWM upptäcktes inte | 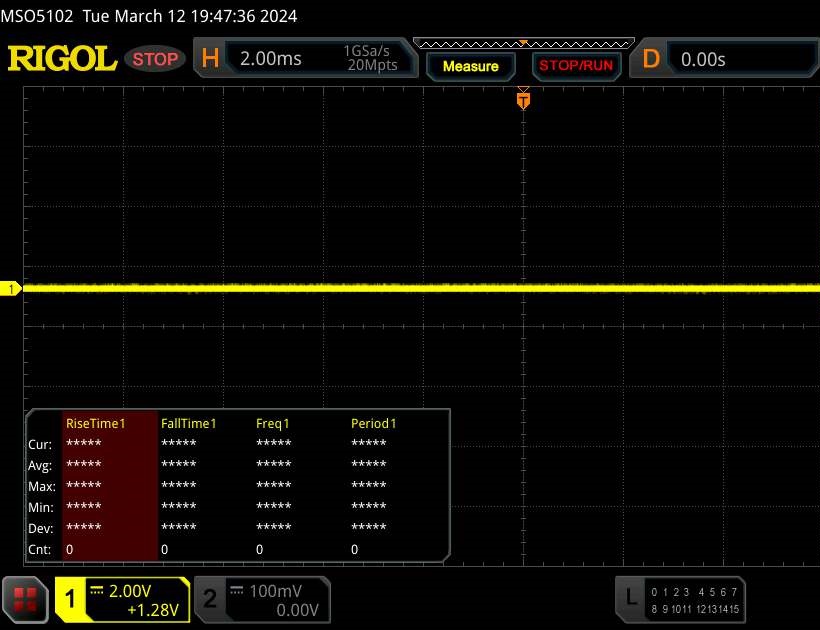 | ||
Som jämförelse: 52 % av alla testade enheter använder inte PWM för att dämpa skärmen. Om PWM upptäcktes mättes ett medelvärde av 7772 (minst: 5 - maximum: 343500) Hz. | |||
IPS-panelen har en bred betraktningsvinkel och är läsbar från alla positioner. Det är möjligt att använda skärmen utomhus, förutsatt att solen inte är alltför stark.
Leistung - Avancerad hårdvara från Intel och Nvidia
Lenovo Legion Pro 7 är en högpresterande 16-tums bärbar dator skapad för spelare och kreatörer. Den nödvändiga beräkningskraften kommer från Raptor Lake och Ada Lovelace. Vår granskningsmodell kan fås för något under 3 000 € (ca 3 245 USD) med en utbildningsrabatt. Inga andra varianter är ännu tillgängliga vid tidpunkten för denna recension.
Testförhållanden
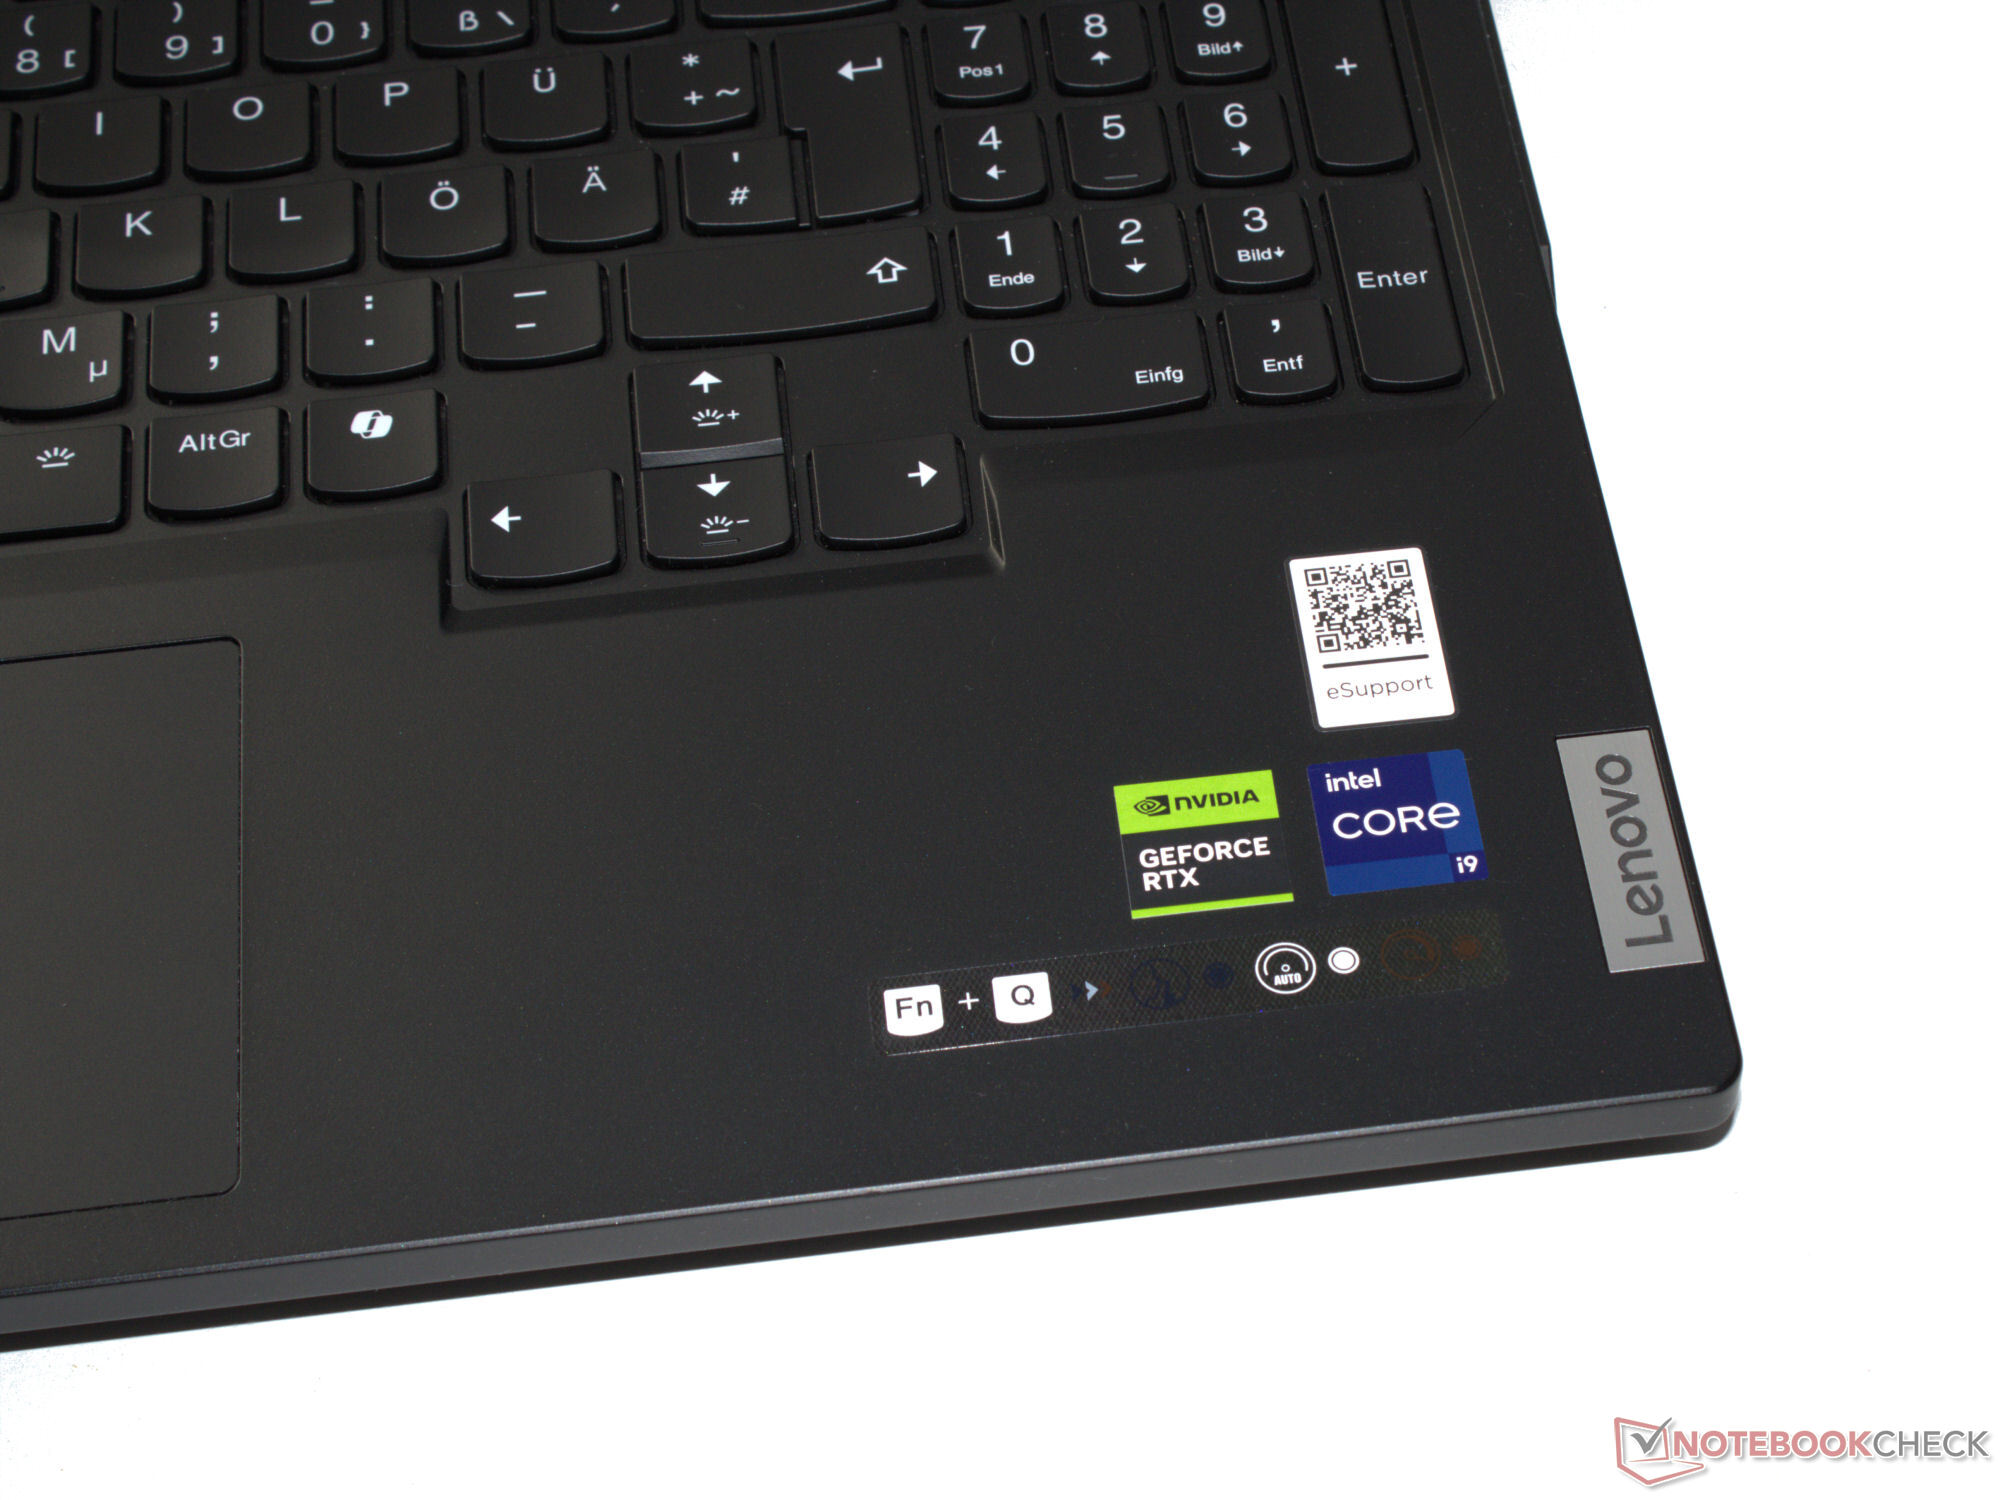
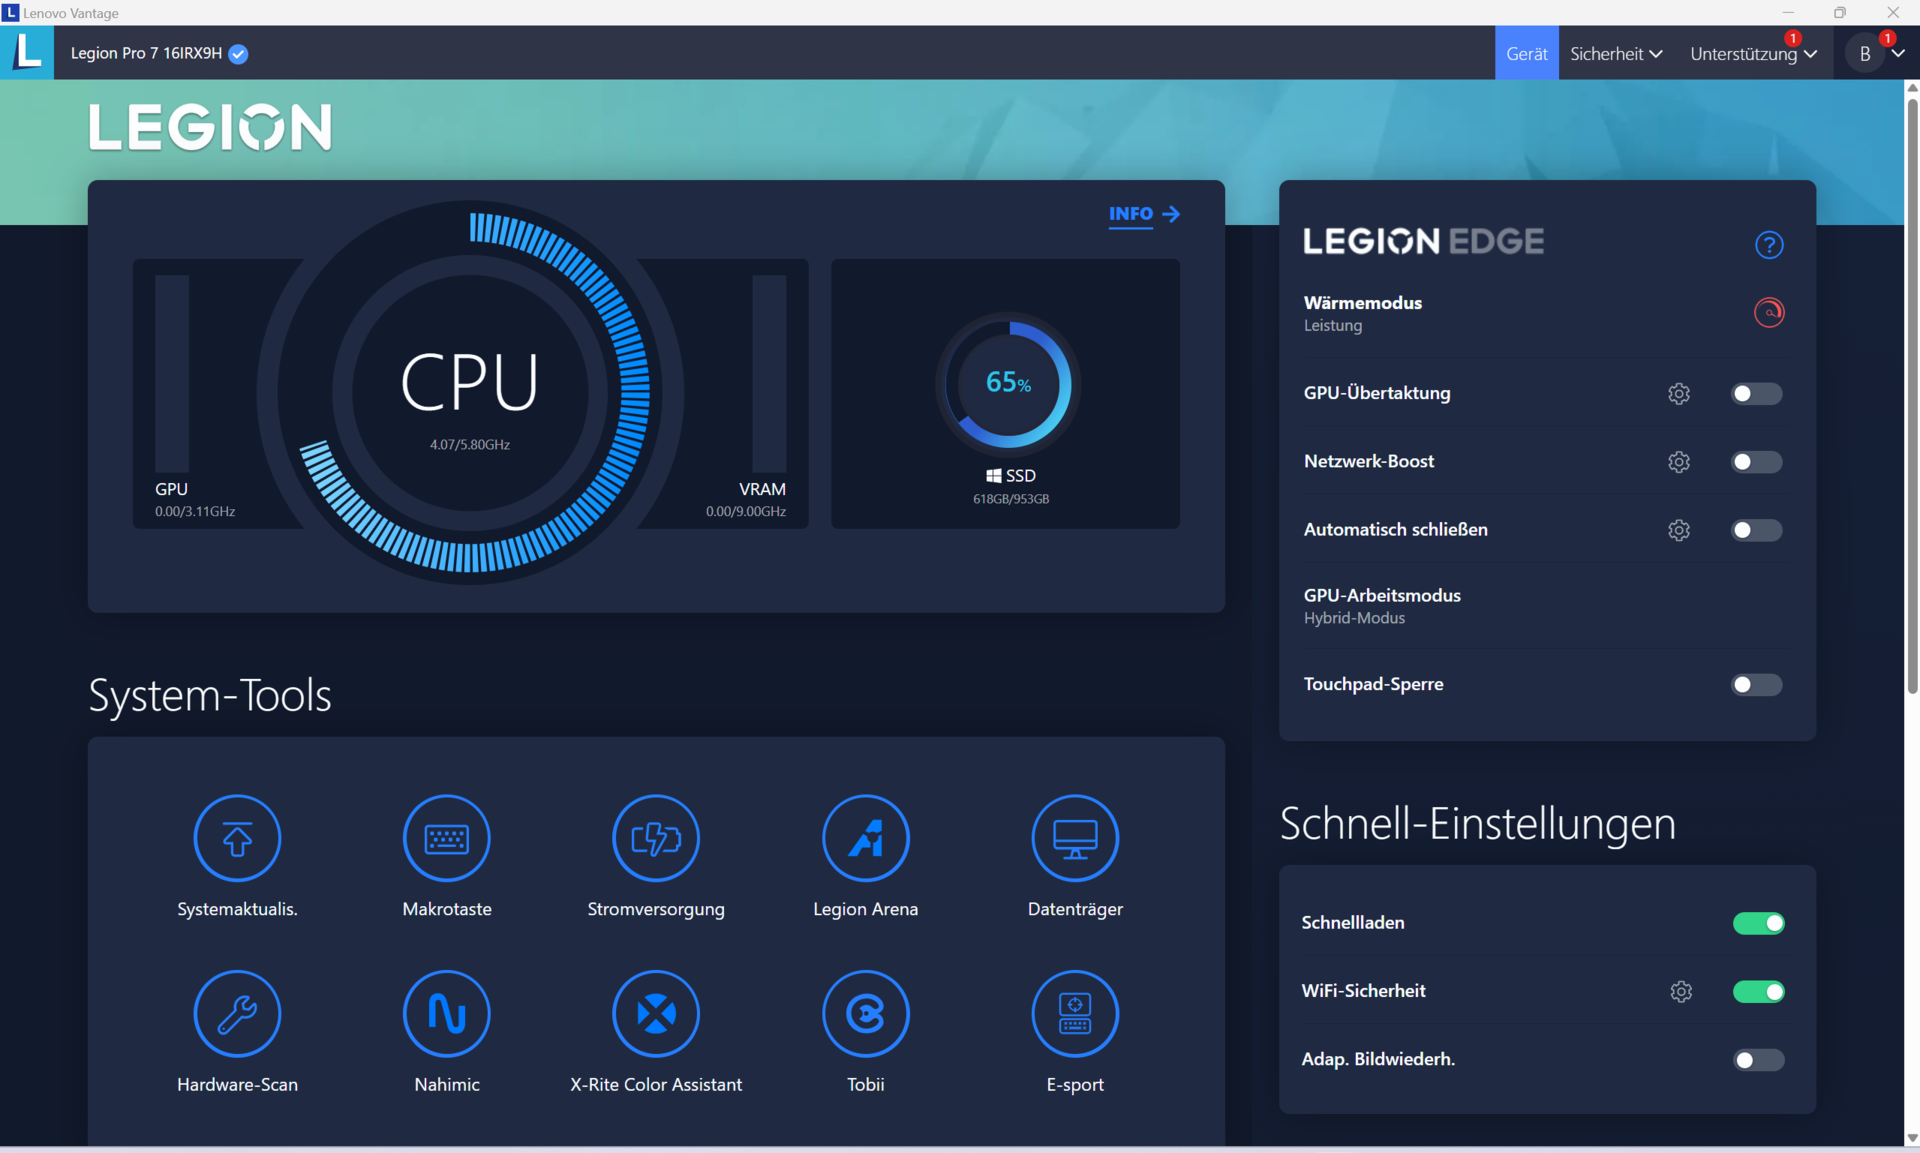
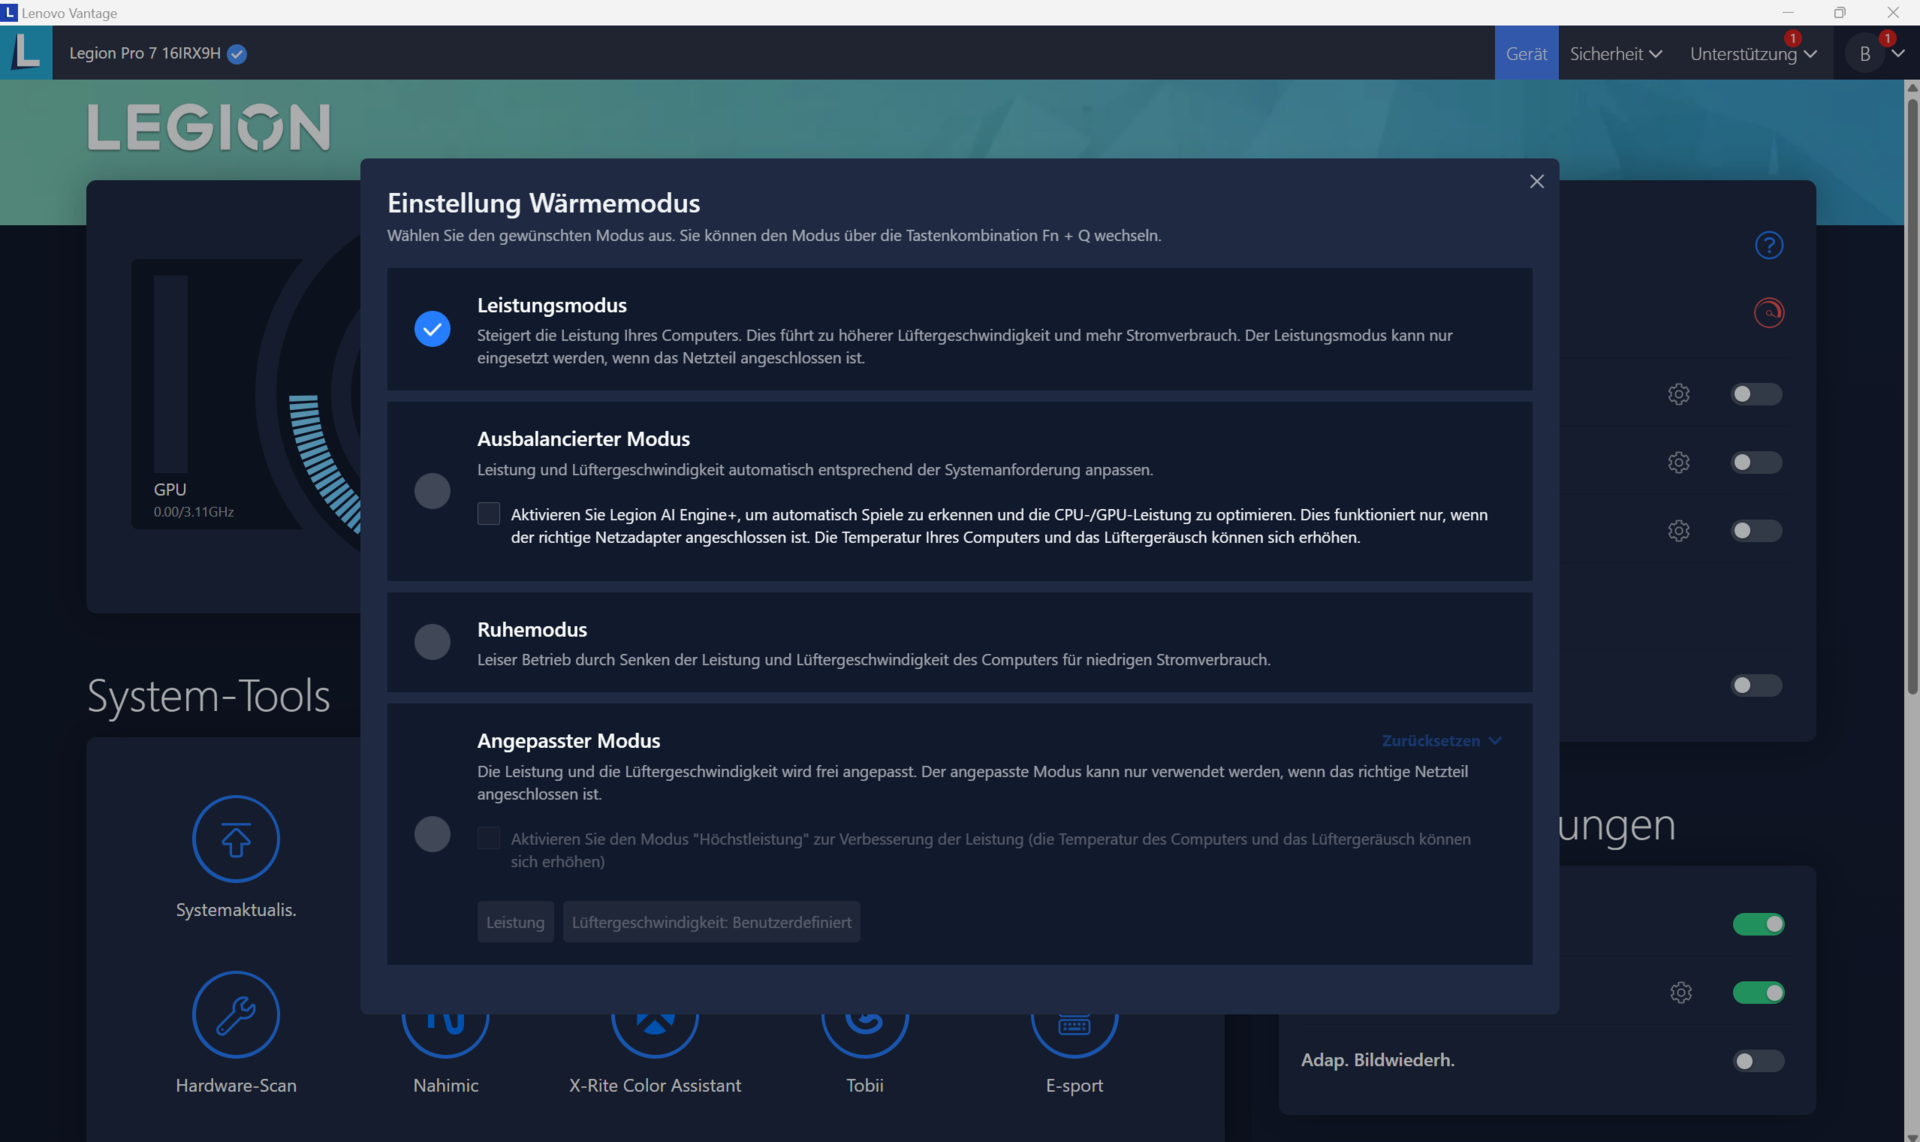
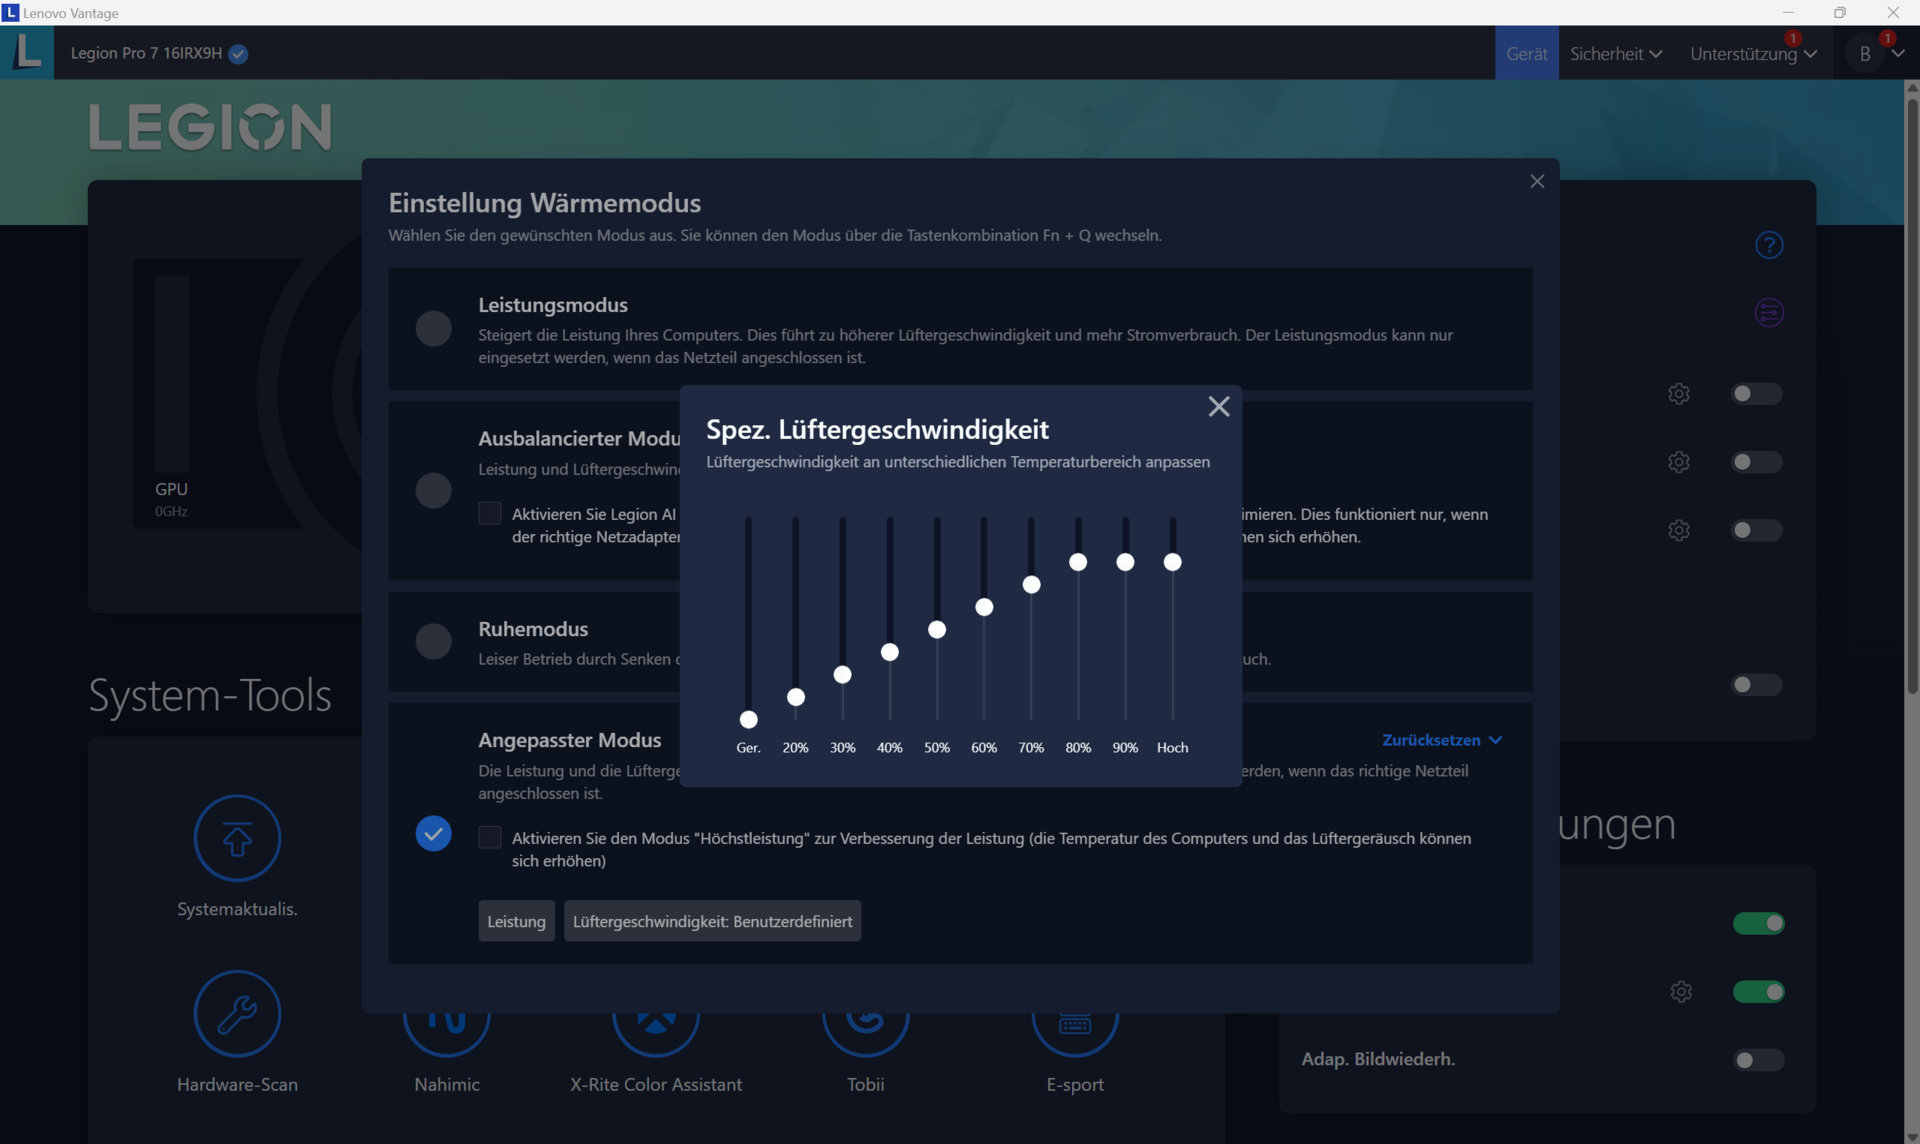
Notebook erbjuder tre tillverkarspecifika prestandalägen (se tabell). Du kan växla mellan dem med tangentkombinationen Fn + Q. Vi använde Performance- och Quiet-läget för våra benchmarks respektive batteritest.
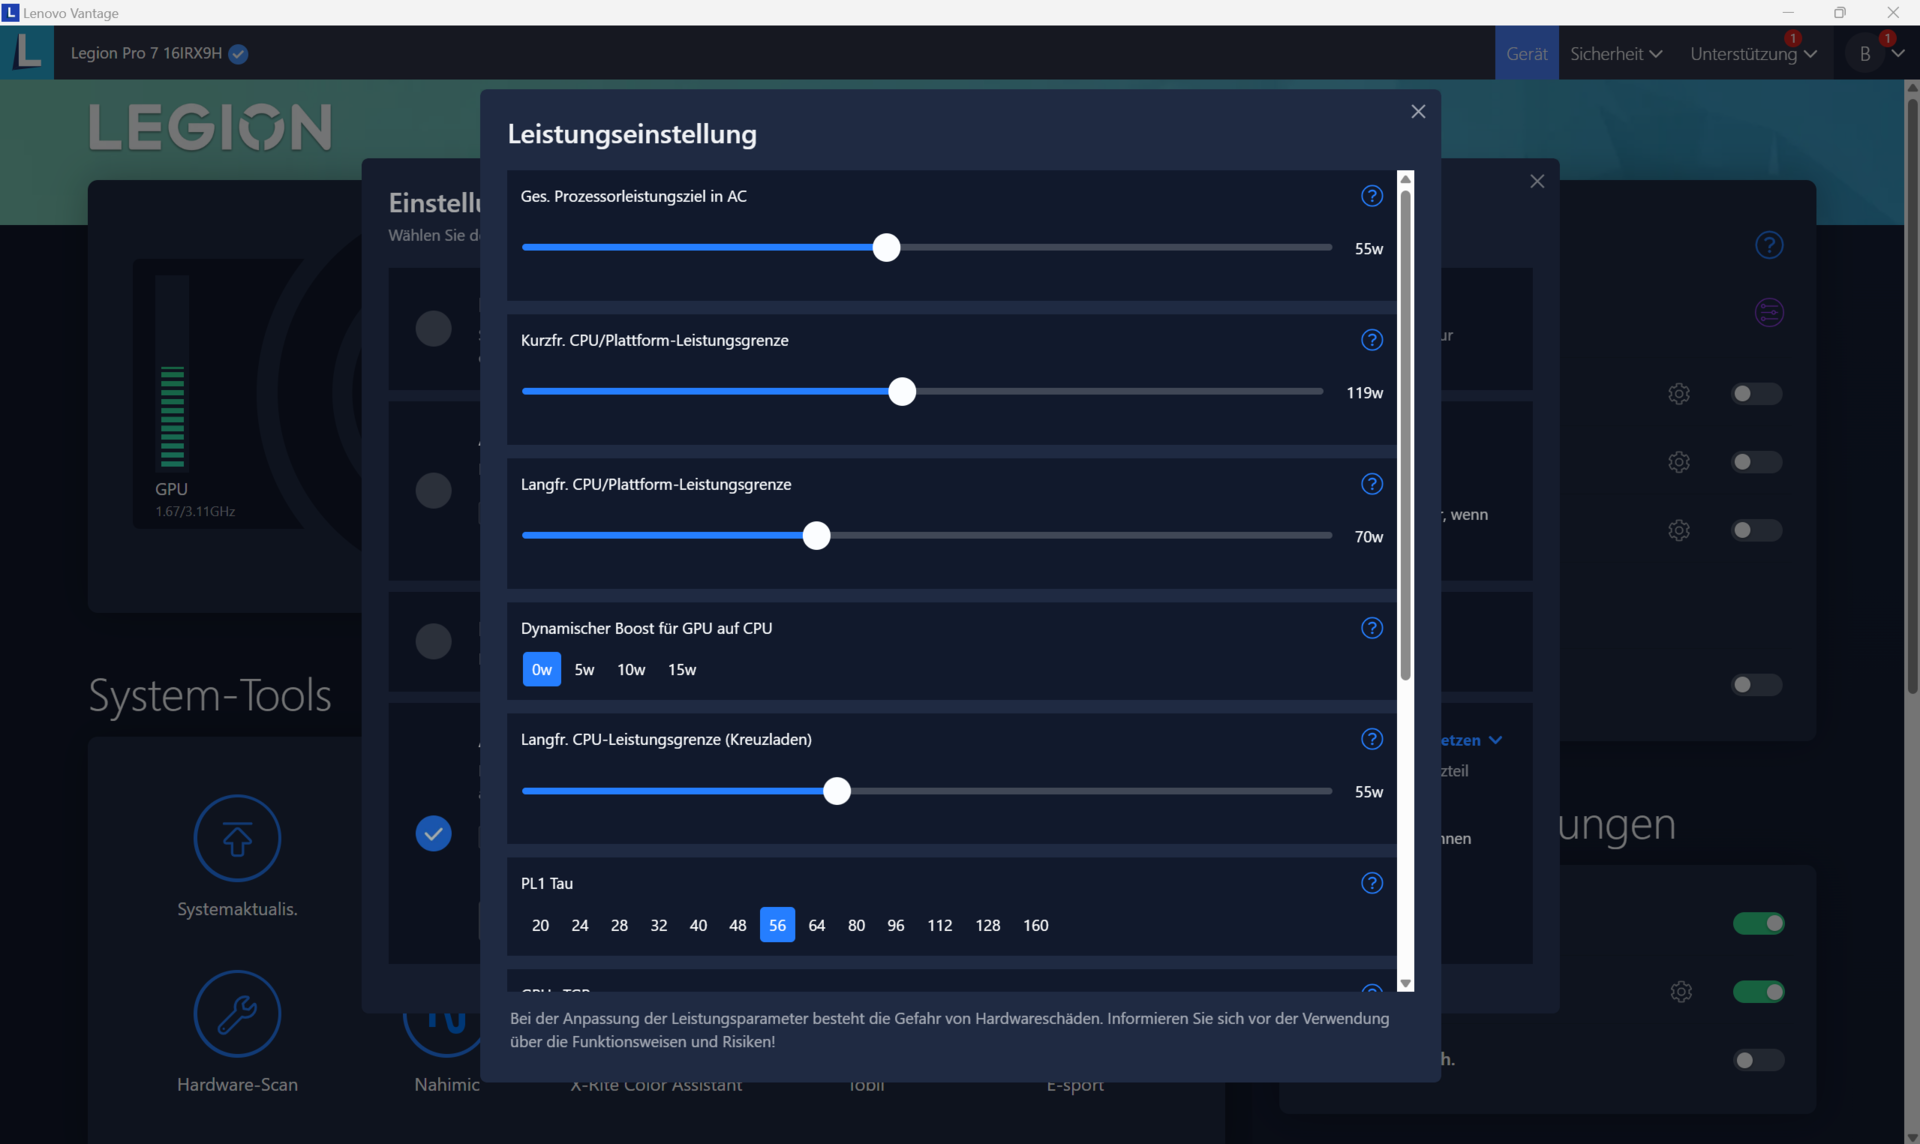
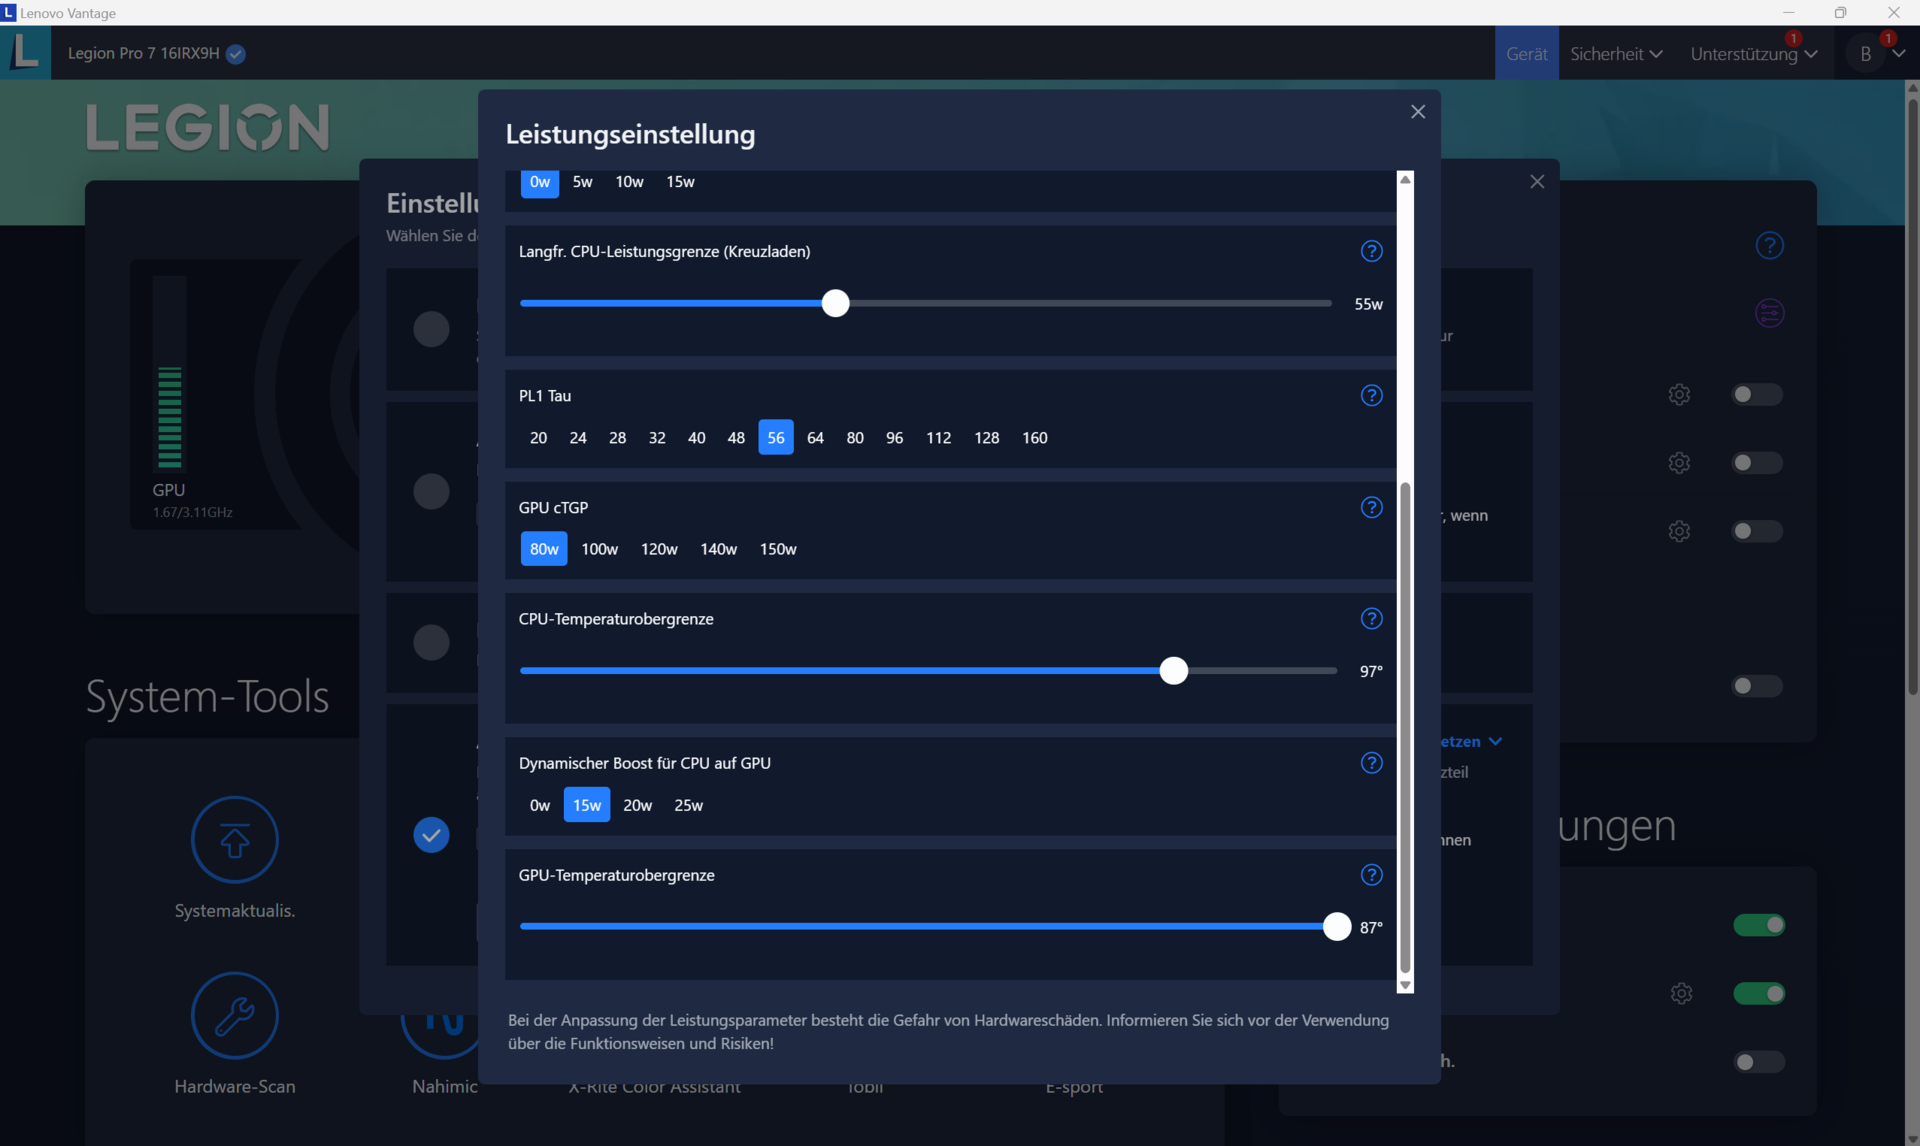
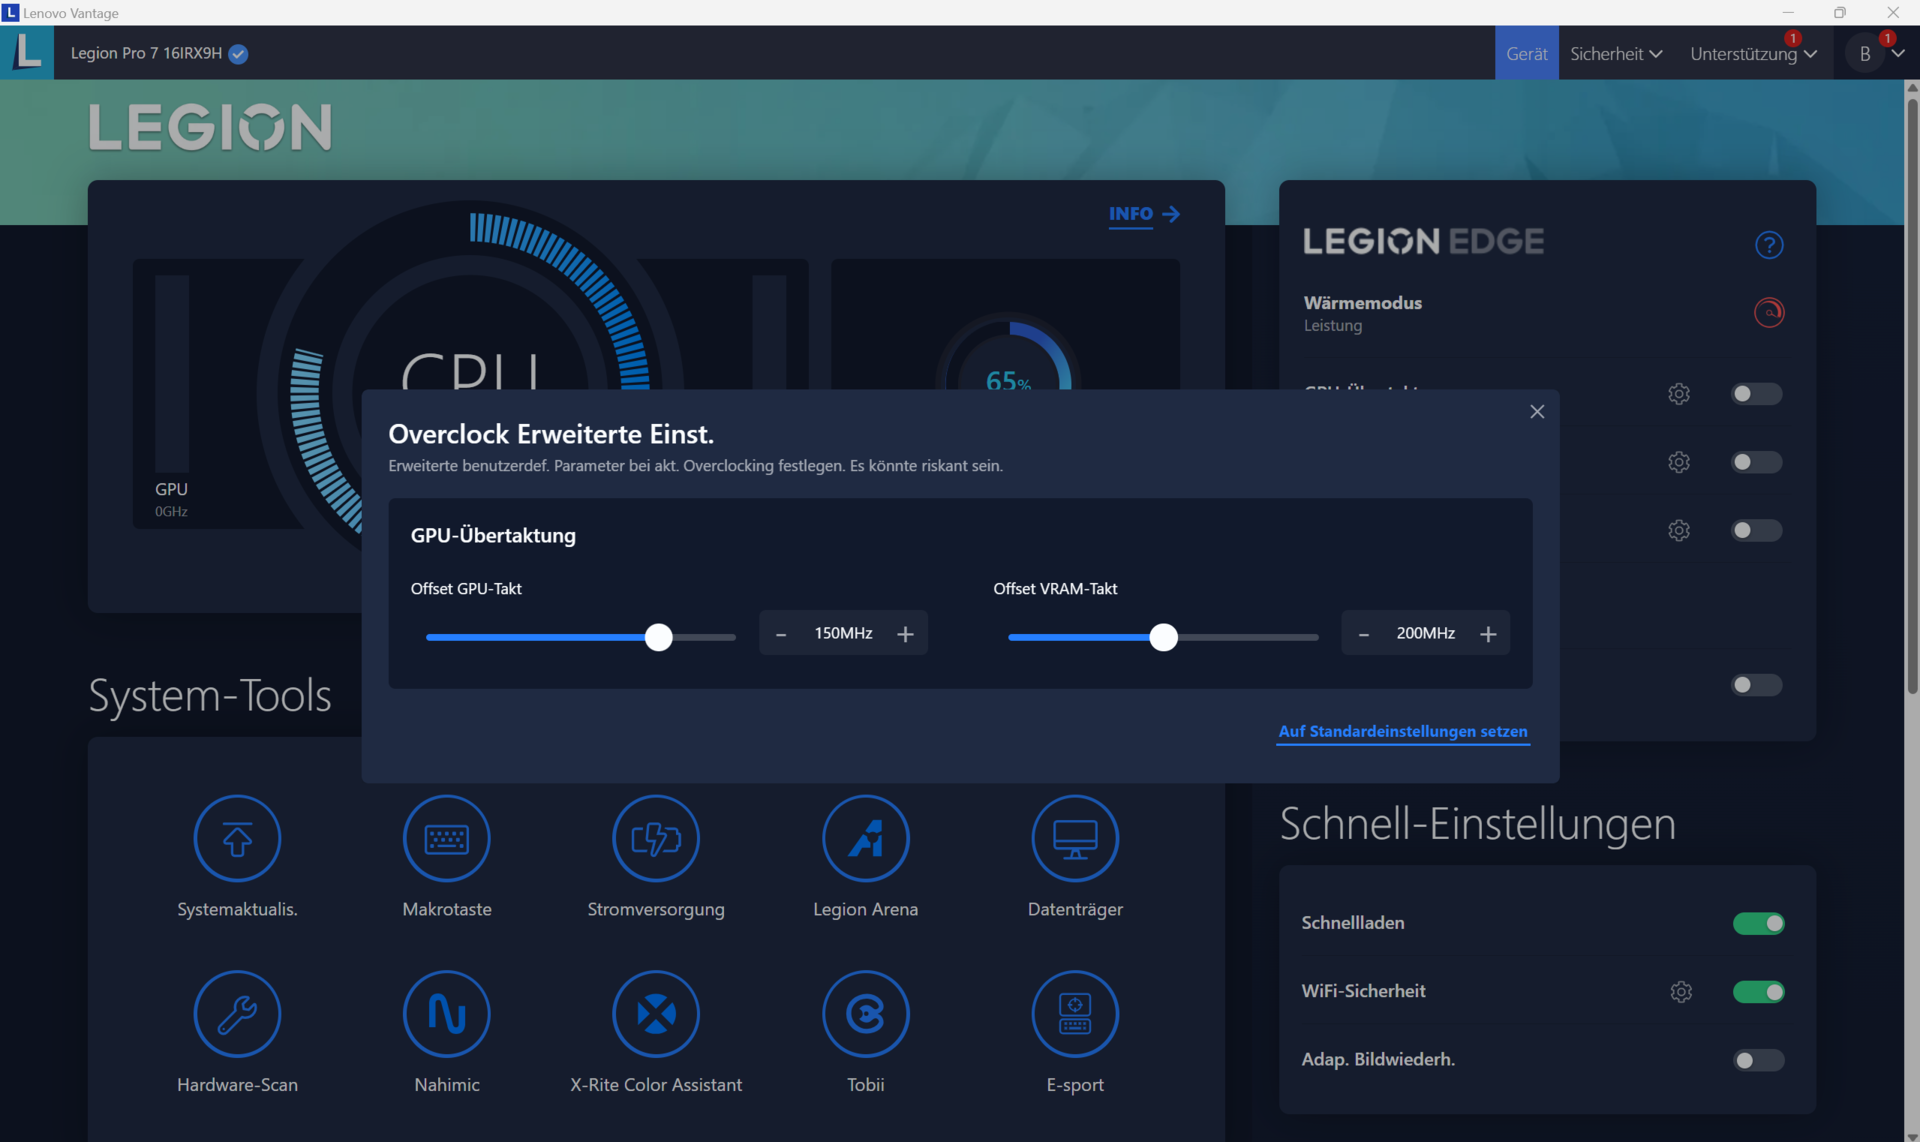
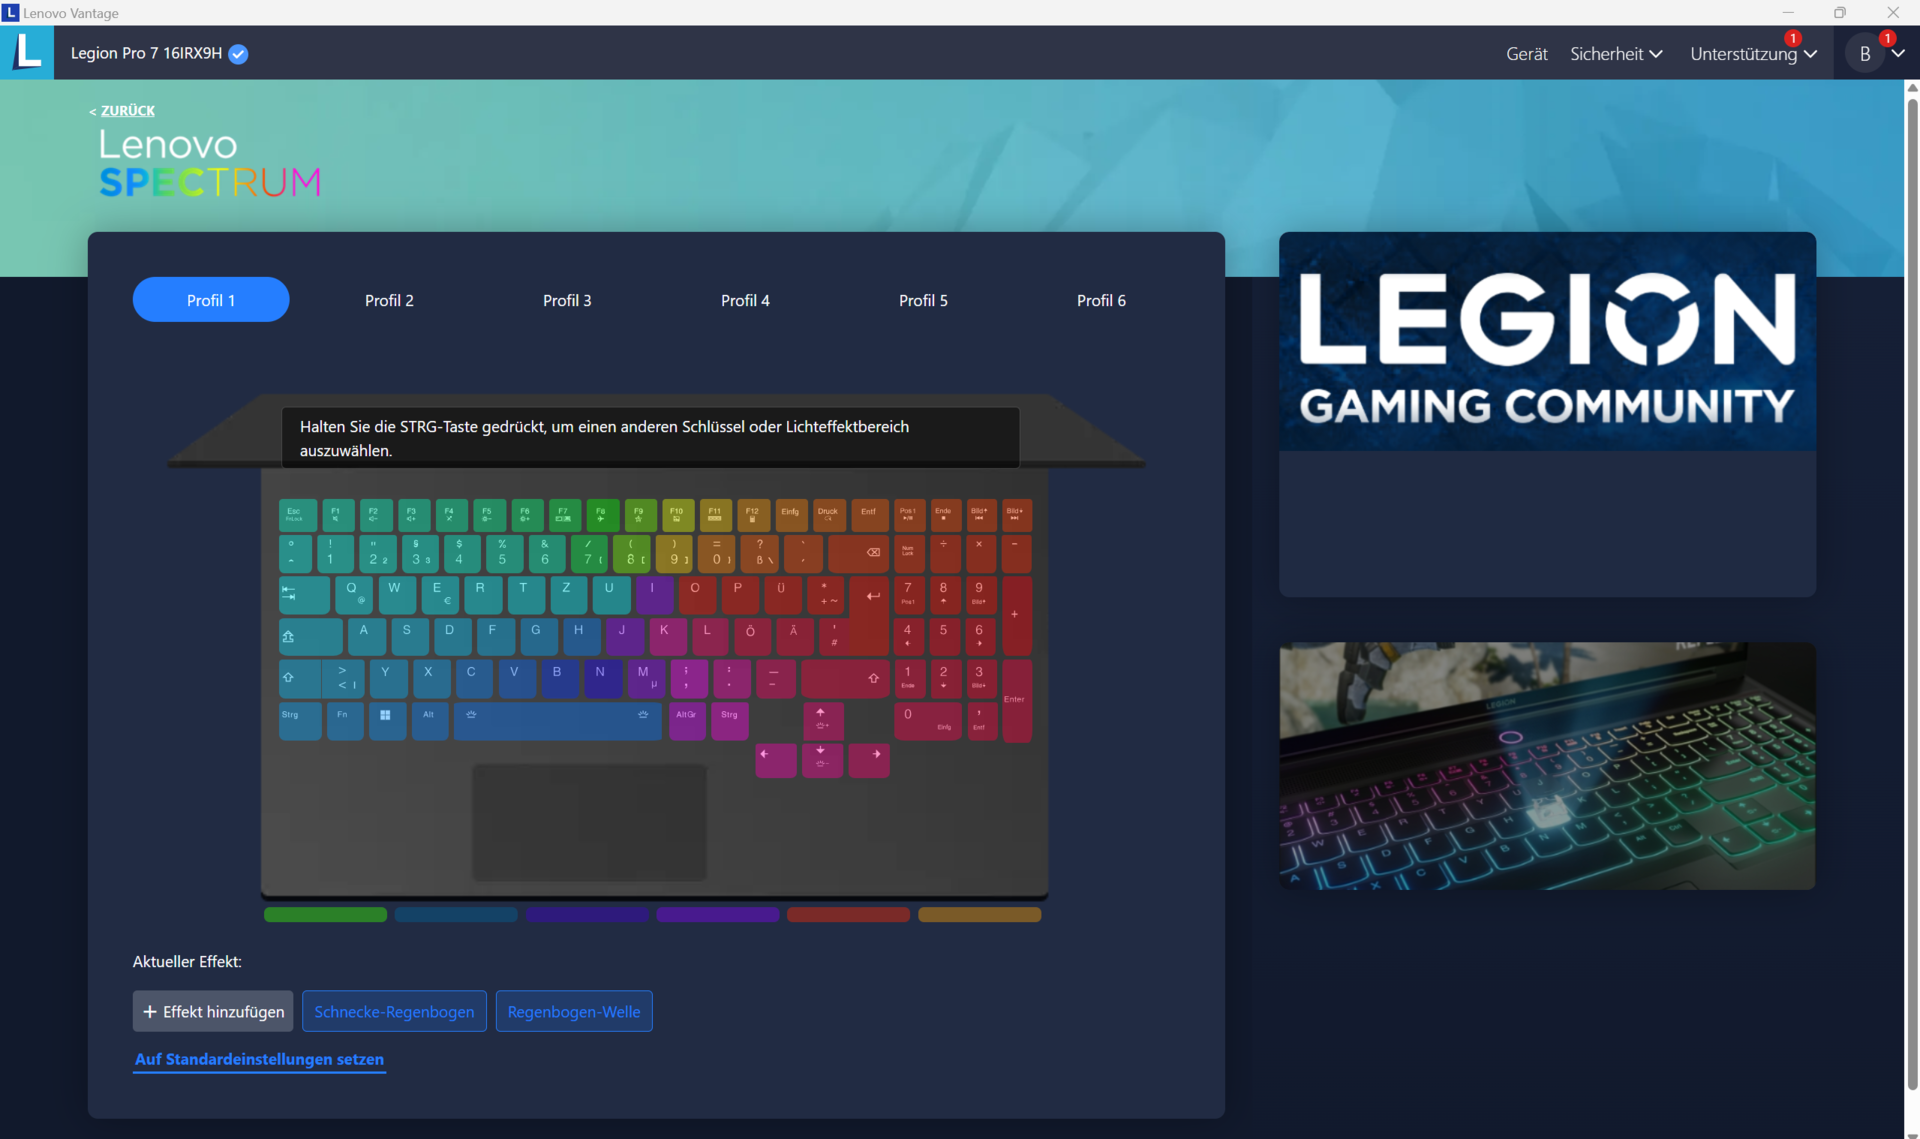
Det finns också ett fjärde läge tillgängligt i Lenovo Vantage (den bärbara datorns kontrollcenter): Anpassat läge. I det här läget kan du ange prestandainställningarna för processorn (effektgräns) och grafikkortet (TGP, Dynamic Boost och temperaturgräns) samt justera fläkthastigheten. Dessutom är det möjligt att överklocka GPU och grafikminne oberoende av vilken profil som valts.
| Prestandaläge | Balanserat läge | Tyst läge | |
|---|---|---|---|
| Effektgräns 1 (HWInfo) | 130 Watt | 80 Watt | 55 Watt |
| Effektgräns 2 (HWInfo) | 185 Watt | 119 Watt | 65 Watt |
| Buller (Witcher 3) | 54 dB(A) | 45 dB(A) | 33 dB(A) |
| Prestanda (Witcher 3) | ~184 fps | ~160 fps | 40 fps (låst) |
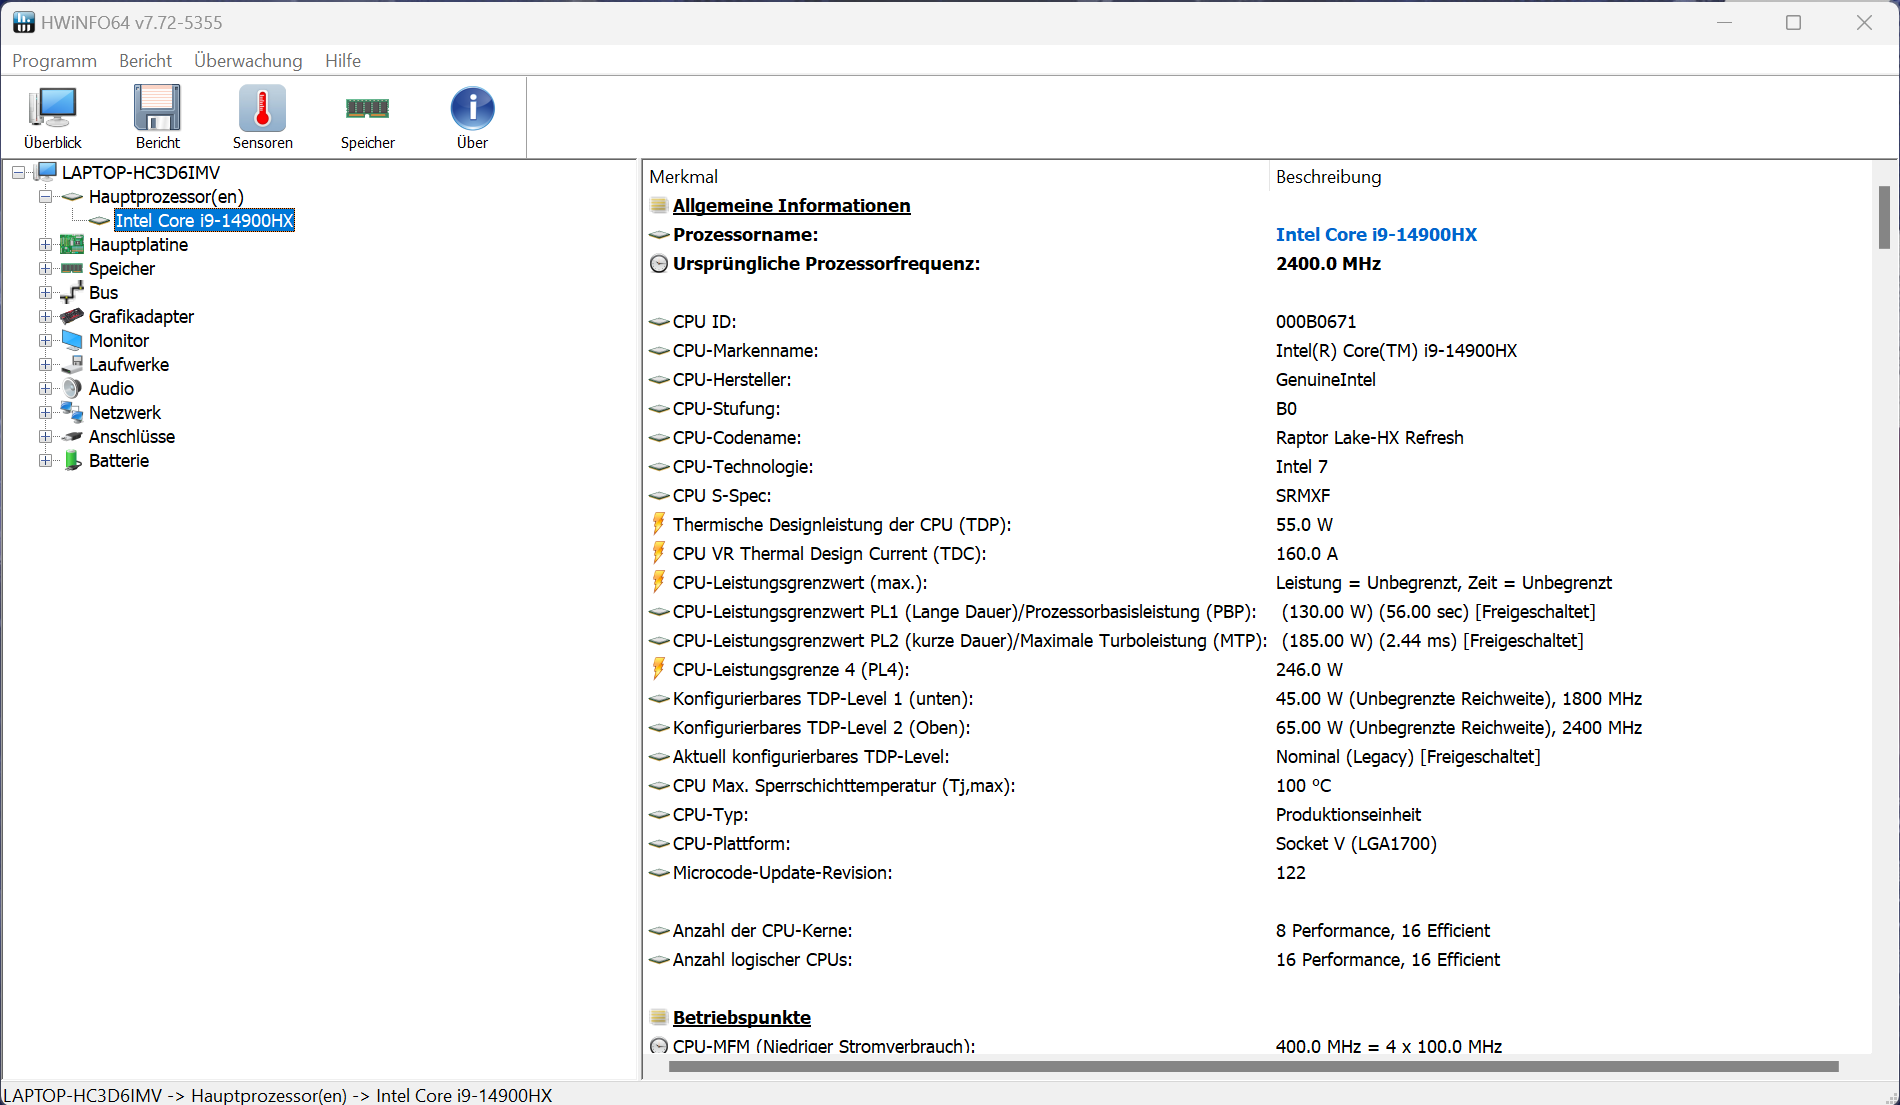
Processor
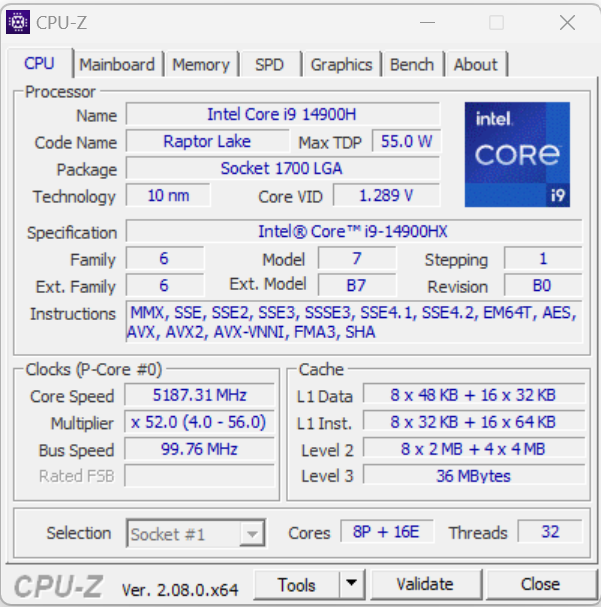
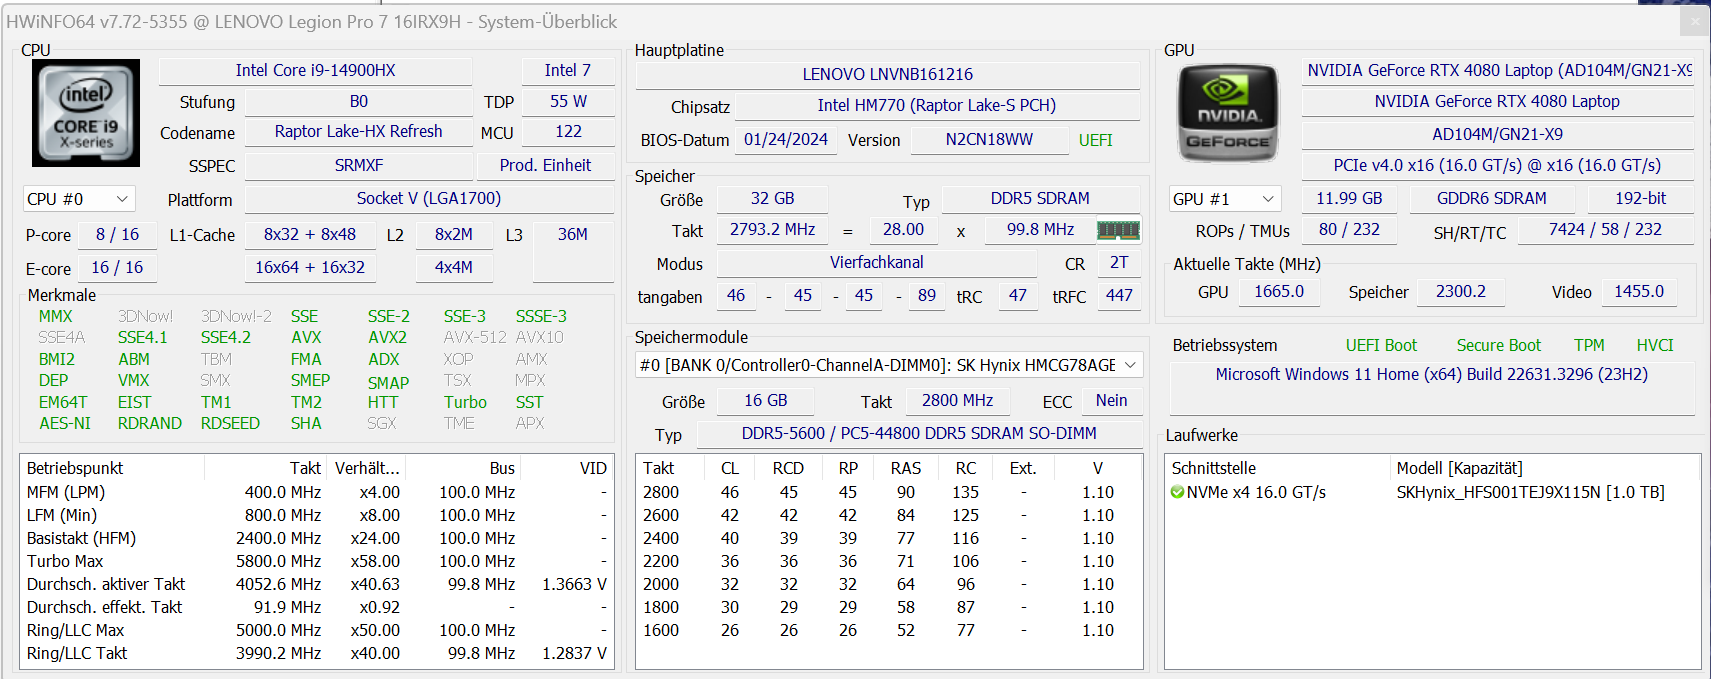
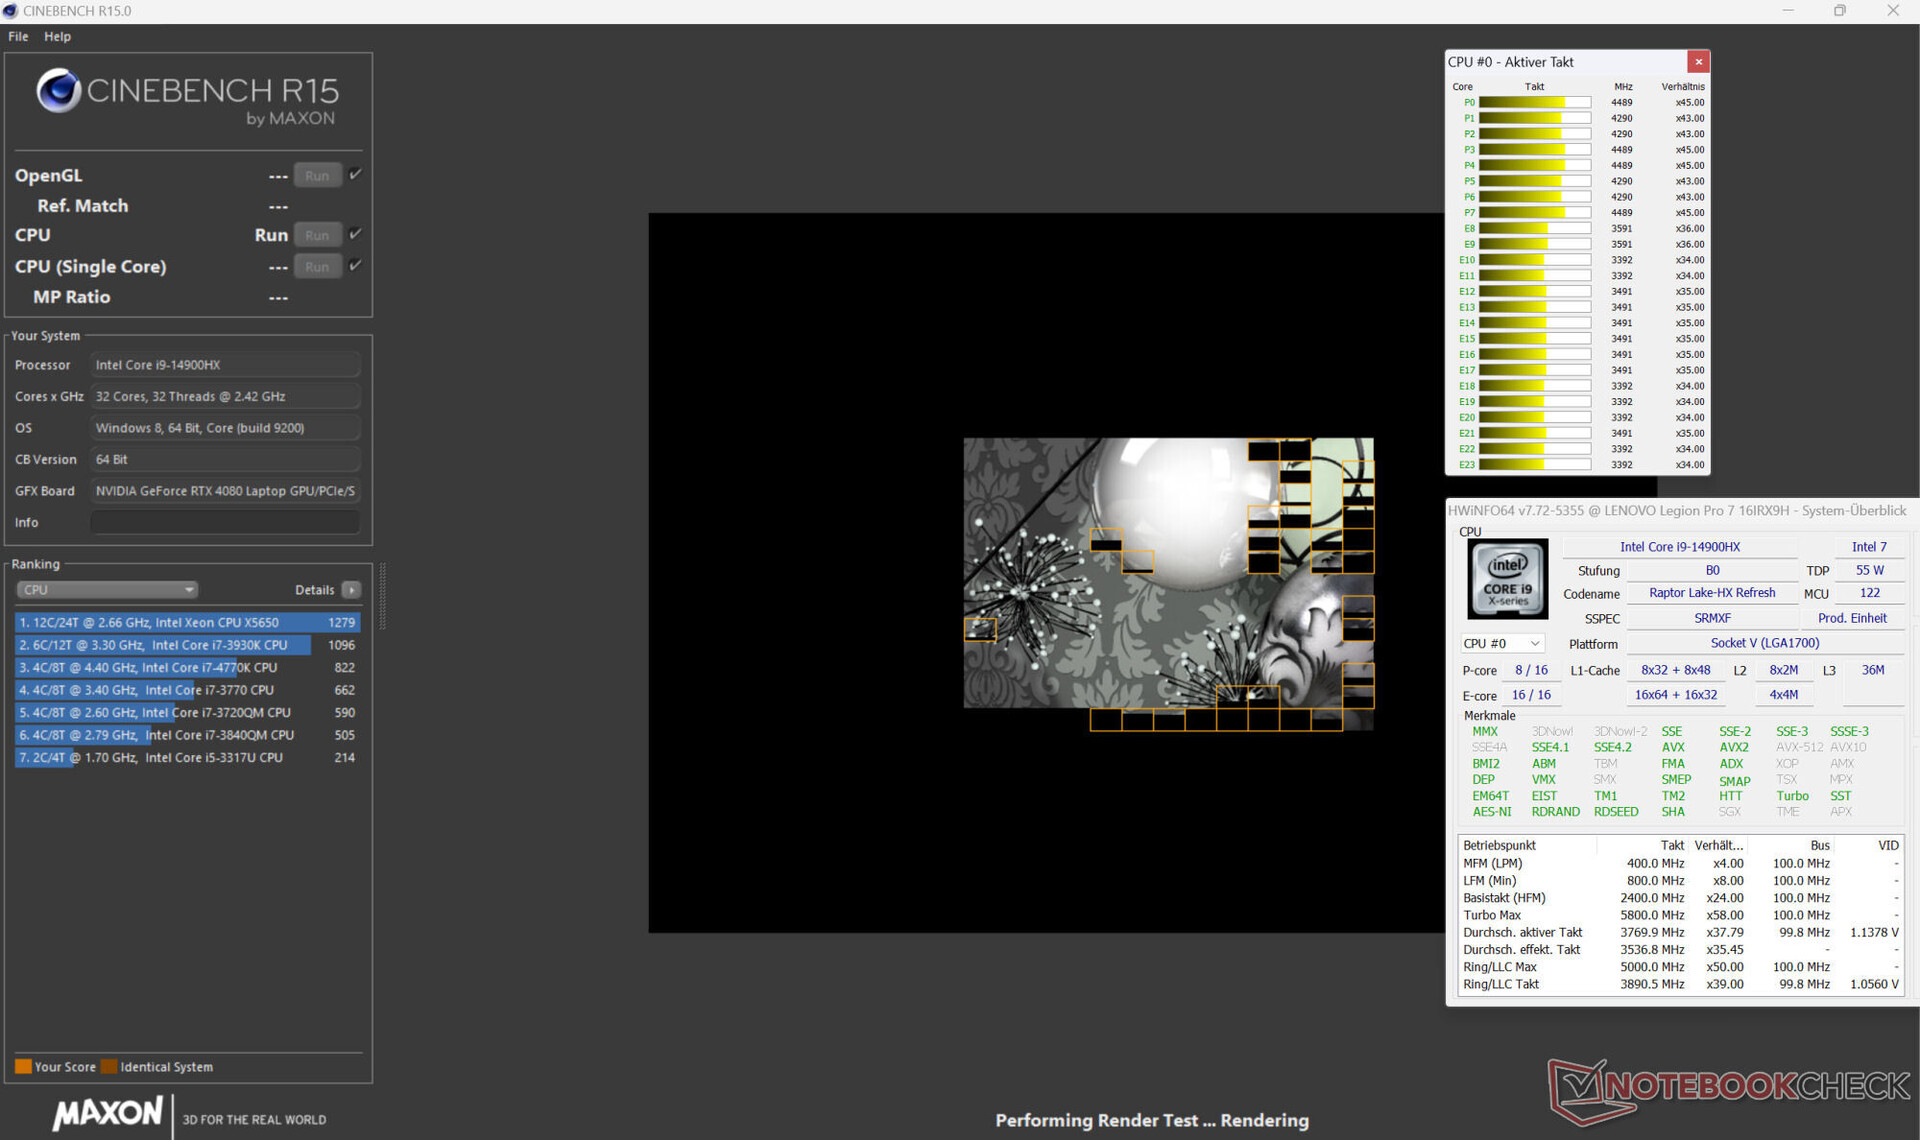
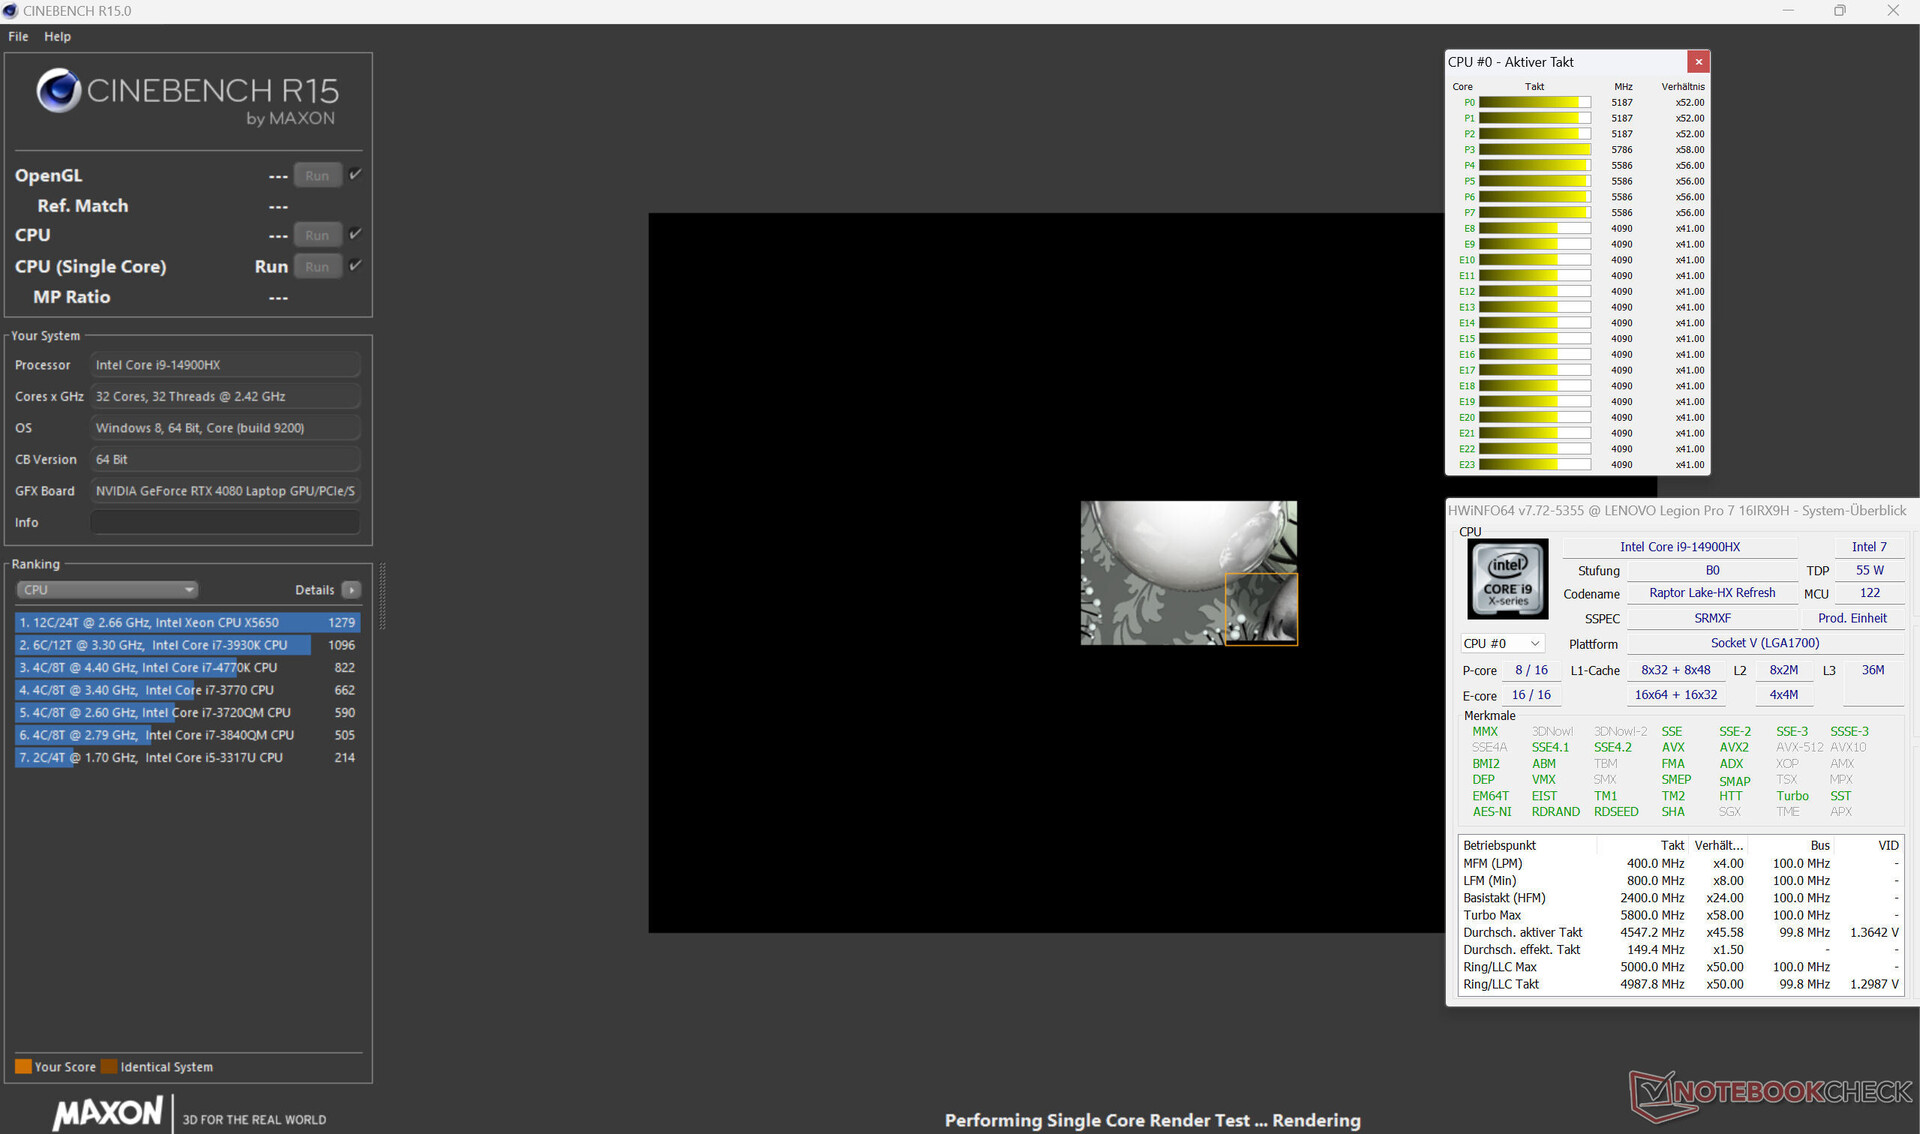
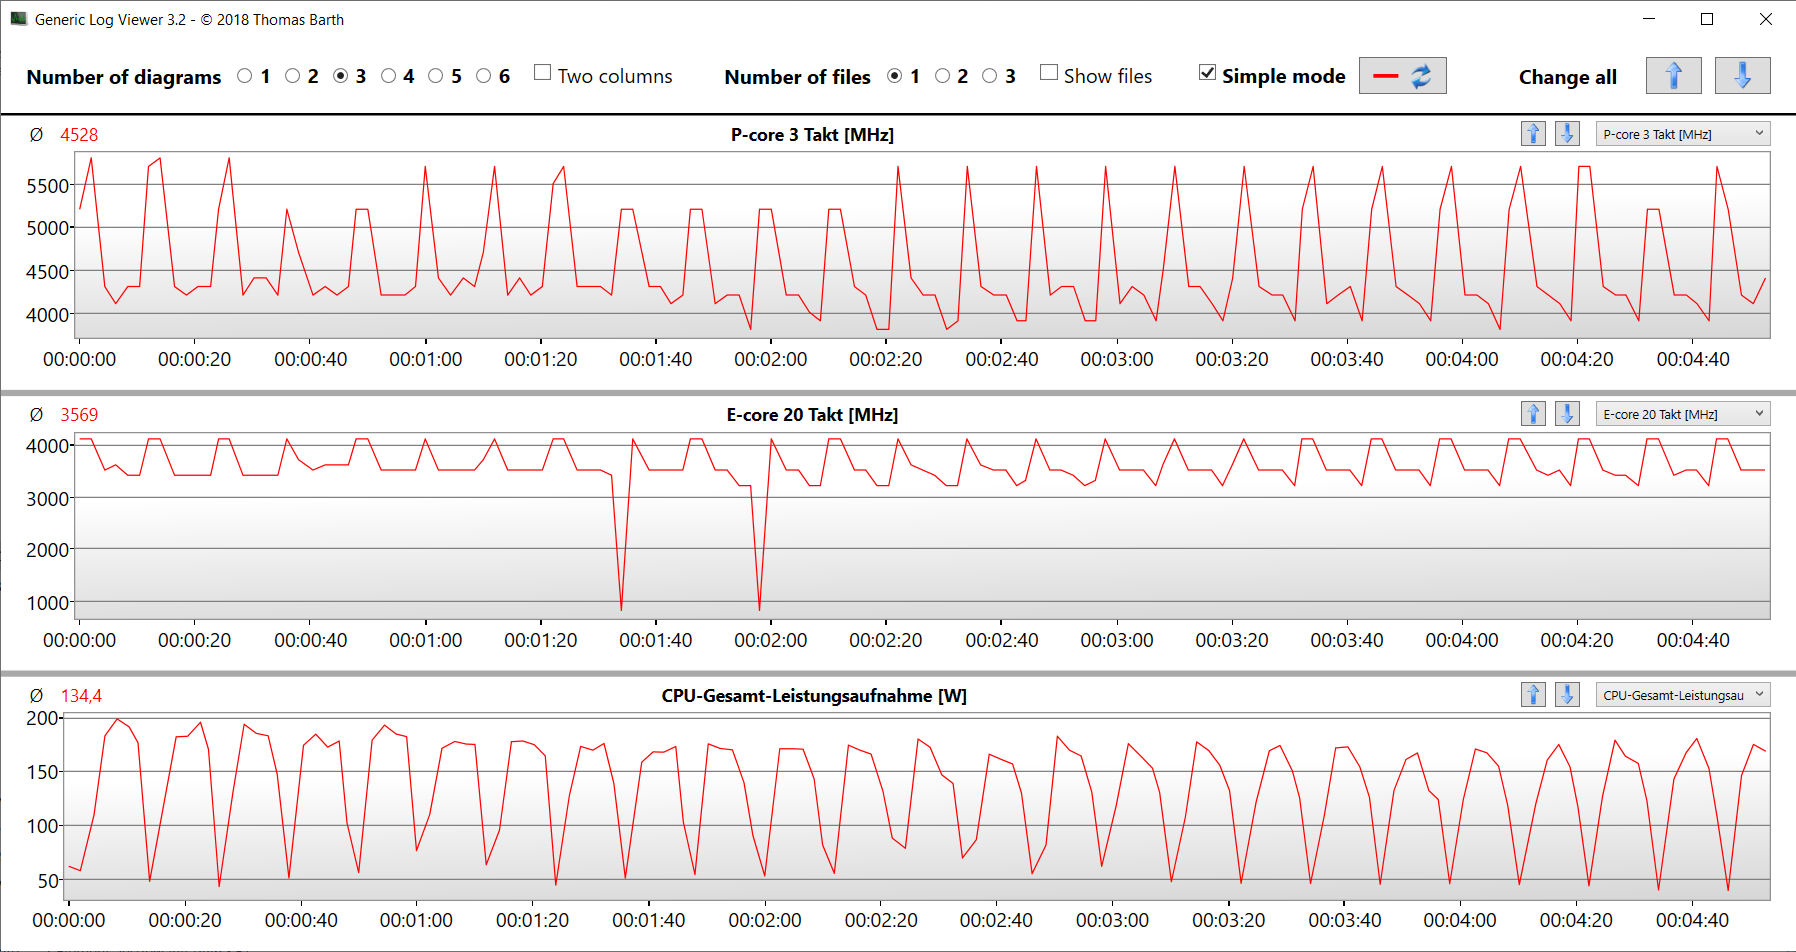
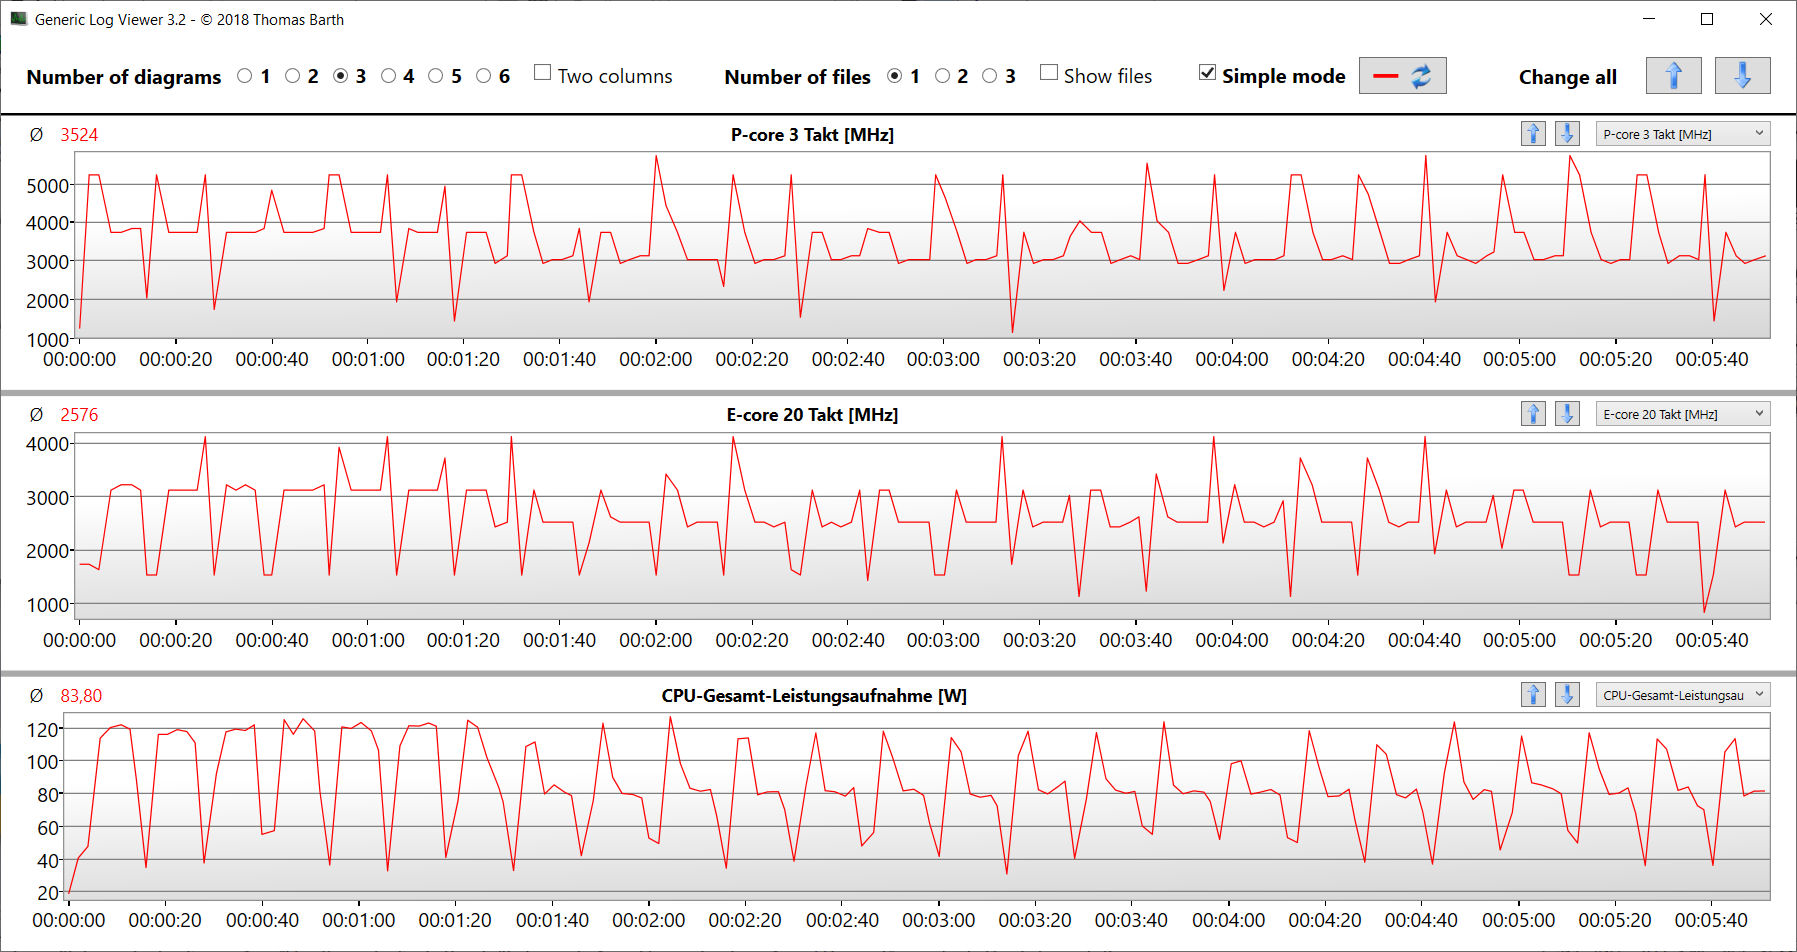
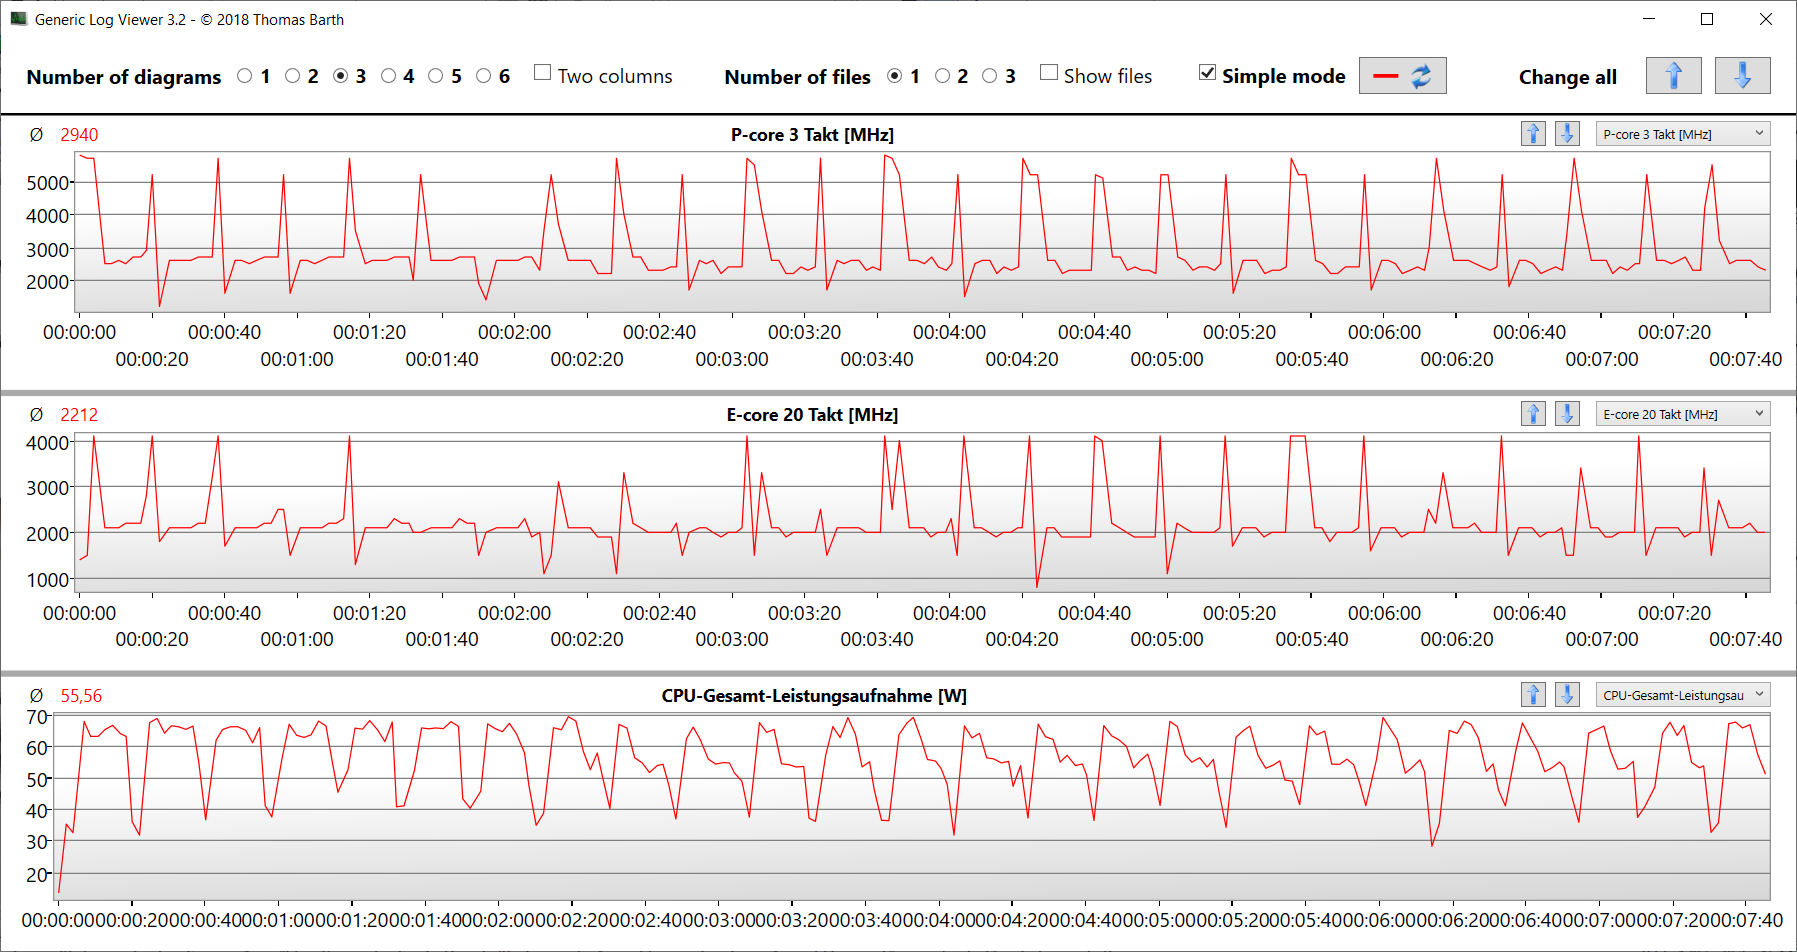
De 24 CPU-kärnorna (8P + 16E = 32 trådar) på Core i9-14900HX (Raptor Lake) nådde toppklockhastigheter på 5,8 GHz (P) och 4,1 GHz (E). Processorn hanterade ihållande flertrådsbelastning (körde Cinebench 15 i en loop) med konsekvent höga klockhastigheter. I prestandaläget ligger de uppnådda resultaten över vad processorn kan prestera i genomsnitt. Vid batteridrift minskade inte prestandan för en tråd särskilt mycket (307 poäng i CB15), men prestandan för flera trådar fick sig en rejäl törn (2 482 poäng i CB15).
Mer information om Core i9 finns på denna analys.
Cinebench R15 Multi Sustained load
* ... mindre är bättre
AIDA64: FP32 Ray-Trace | FPU Julia | CPU SHA3 | CPU Queen | FPU SinJulia | FPU Mandel | CPU AES | CPU ZLib | FP64 Ray-Trace | CPU PhotoWorxx
| Performance rating | |
| Alienware m16 R1 AMD | |
| MSI Vector 16 HX A14V | |
| Lenovo Legion Pro 7 16IRX9H | |
| Lenovo Legion Pro 7 16IRX8H | |
| Genomsnitt Intel Core i9-14900HX | |
| Genomsnitt av klass Gaming | |
| HP Omen 16 (2024) | |
| AIDA64 / FP32 Ray-Trace | |
| Alienware m16 R1 AMD | |
| Genomsnitt av klass Gaming (10227 - 85542, n=108, senaste 2 åren) | |
| MSI Vector 16 HX A14V | |
| Lenovo Legion Pro 7 16IRX9H | |
| Lenovo Legion Pro 7 16IRX8H | |
| Genomsnitt Intel Core i9-14900HX (13098 - 33474, n=36) | |
| HP Omen 16 (2024) | |
| AIDA64 / FPU Julia | |
| Alienware m16 R1 AMD | |
| MSI Vector 16 HX A14V | |
| Lenovo Legion Pro 7 16IRX9H | |
| Genomsnitt av klass Gaming (51376 - 238426, n=108, senaste 2 åren) | |
| Lenovo Legion Pro 7 16IRX8H | |
| Genomsnitt Intel Core i9-14900HX (67573 - 166040, n=36) | |
| HP Omen 16 (2024) | |
| AIDA64 / CPU SHA3 | |
| Alienware m16 R1 AMD | |
| Lenovo Legion Pro 7 16IRX9H | |
| MSI Vector 16 HX A14V | |
| Lenovo Legion Pro 7 16IRX8H | |
| Genomsnitt av klass Gaming (2180 - 9817, n=108, senaste 2 åren) | |
| Genomsnitt Intel Core i9-14900HX (3589 - 7979, n=36) | |
| HP Omen 16 (2024) | |
| AIDA64 / CPU Queen | |
| Alienware m16 R1 AMD | |
| Lenovo Legion Pro 7 16IRX9H | |
| MSI Vector 16 HX A14V | |
| Genomsnitt Intel Core i9-14900HX (118405 - 148966, n=36) | |
| Lenovo Legion Pro 7 16IRX8H | |
| HP Omen 16 (2024) | |
| Genomsnitt av klass Gaming (49785 - 173351, n=96, senaste 2 åren) | |
| AIDA64 / FPU SinJulia | |
| Alienware m16 R1 AMD | |
| Lenovo Legion Pro 7 16IRX9H | |
| MSI Vector 16 HX A14V | |
| Lenovo Legion Pro 7 16IRX8H | |
| Genomsnitt Intel Core i9-14900HX (10475 - 18517, n=36) | |
| Genomsnitt av klass Gaming (4424 - 33636, n=108, senaste 2 åren) | |
| HP Omen 16 (2024) | |
| AIDA64 / FPU Mandel | |
| Alienware m16 R1 AMD | |
| Genomsnitt av klass Gaming (25115 - 128721, n=108, senaste 2 åren) | |
| MSI Vector 16 HX A14V | |
| Lenovo Legion Pro 7 16IRX9H | |
| Lenovo Legion Pro 7 16IRX8H | |
| Genomsnitt Intel Core i9-14900HX (32543 - 83662, n=36) | |
| HP Omen 16 (2024) | |
| AIDA64 / CPU AES | |
| Genomsnitt Intel Core i9-14900HX (86964 - 241777, n=36) | |
| Lenovo Legion Pro 7 16IRX9H | |
| MSI Vector 16 HX A14V | |
| Lenovo Legion Pro 7 16IRX8H | |
| Alienware m16 R1 AMD | |
| Genomsnitt av klass Gaming (39258 - 247074, n=108, senaste 2 åren) | |
| HP Omen 16 (2024) | |
| AIDA64 / CPU ZLib | |
| Lenovo Legion Pro 7 16IRX9H | |
| MSI Vector 16 HX A14V | |
| Lenovo Legion Pro 7 16IRX8H | |
| Genomsnitt Intel Core i9-14900HX (1054 - 2292, n=36) | |
| Alienware m16 R1 AMD | |
| Genomsnitt av klass Gaming (574 - 2531, n=108, senaste 2 åren) | |
| HP Omen 16 (2024) | |
| AIDA64 / FP64 Ray-Trace | |
| Alienware m16 R1 AMD | |
| Genomsnitt av klass Gaming (5509 - 45446, n=108, senaste 2 åren) | |
| MSI Vector 16 HX A14V | |
| Lenovo Legion Pro 7 16IRX9H | |
| Lenovo Legion Pro 7 16IRX8H | |
| Genomsnitt Intel Core i9-14900HX (6809 - 18349, n=36) | |
| HP Omen 16 (2024) | |
| AIDA64 / CPU PhotoWorxx | |
| HP Omen 16 (2024) | |
| MSI Vector 16 HX A14V | |
| Lenovo Legion Pro 7 16IRX8H | |
| Lenovo Legion Pro 7 16IRX9H | |
| Genomsnitt Intel Core i9-14900HX (23903 - 54702, n=36) | |
| Genomsnitt av klass Gaming (12271 - 89891, n=108, senaste 2 åren) | |
| Alienware m16 R1 AMD | |
Systemets prestanda
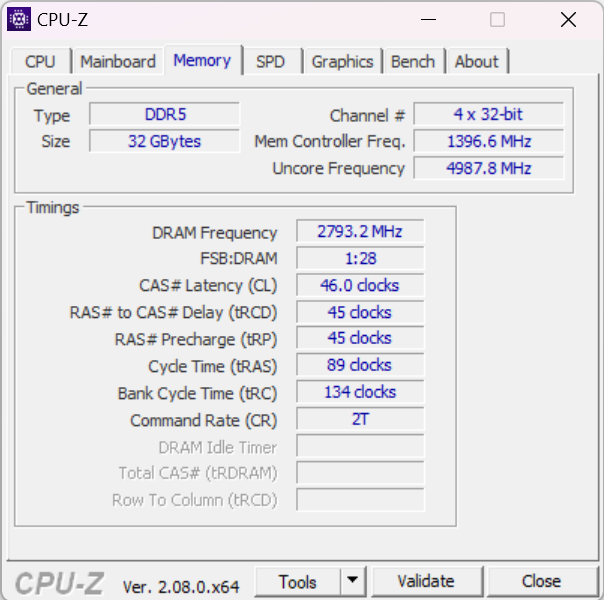
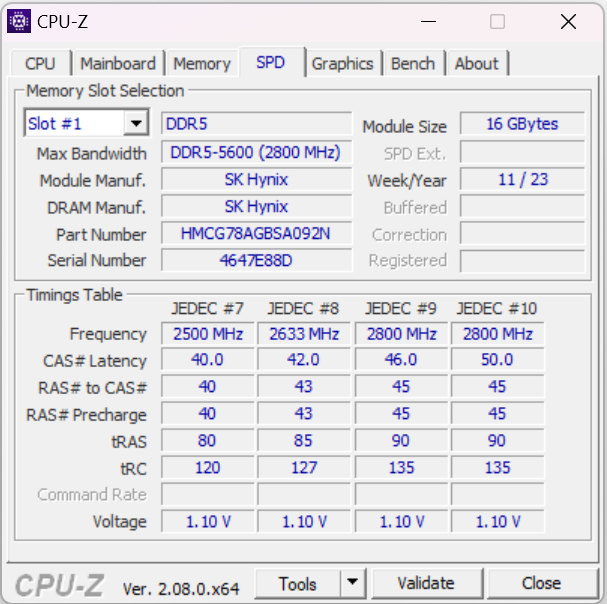
Det smidiga systemet saknar inte beräkningsprestanda. Legion Pro 7 kan utan problem hantera saker som spel, streaming och rendering. Minnets överföringshastigheter ligger på en normal nivå för DDR5-5600 RAM-minne.
CrossMark: Overall | Productivity | Creativity | Responsiveness
WebXPRT 3: Overall
WebXPRT 4: Overall
Mozilla Kraken 1.1: Total
| PCMark 10 / Score | |
| Lenovo Legion Pro 7 16IRX9H | |
| HP Omen 16 (2024) | |
| Alienware m16 R1 AMD | |
| Genomsnitt Intel Core i9-14900HX, NVIDIA GeForce RTX 4080 Laptop GPU (7703 - 9223, n=7) | |
| MSI Vector 16 HX A14V | |
| Genomsnitt av klass Gaming (5828 - 11574, n=96, senaste 2 åren) | |
| Lenovo Legion Pro 7 16IRX8H | |
| PCMark 10 / Essentials | |
| Lenovo Legion Pro 7 16IRX9H | |
| Lenovo Legion Pro 7 16IRX8H | |
| Genomsnitt Intel Core i9-14900HX, NVIDIA GeForce RTX 4080 Laptop GPU (11255 - 12600, n=7) | |
| Alienware m16 R1 AMD | |
| MSI Vector 16 HX A14V | |
| HP Omen 16 (2024) | |
| Genomsnitt av klass Gaming (8810 - 12600, n=100, senaste 2 åren) | |
| PCMark 10 / Productivity | |
| HP Omen 16 (2024) | |
| Lenovo Legion Pro 7 16IRX9H | |
| Genomsnitt av klass Gaming (6845 - 21327, n=98, senaste 2 åren) | |
| Lenovo Legion Pro 7 16IRX8H | |
| Alienware m16 R1 AMD | |
| Genomsnitt Intel Core i9-14900HX, NVIDIA GeForce RTX 4080 Laptop GPU (6662 - 11410, n=7) | |
| MSI Vector 16 HX A14V | |
| PCMark 10 / Digital Content Creation | |
| MSI Vector 16 HX A14V | |
| Alienware m16 R1 AMD | |
| Genomsnitt Intel Core i9-14900HX, NVIDIA GeForce RTX 4080 Laptop GPU (14211 - 16246, n=7) | |
| HP Omen 16 (2024) | |
| Lenovo Legion Pro 7 16IRX9H | |
| Genomsnitt av klass Gaming (7602 - 19657, n=98, senaste 2 åren) | |
| Lenovo Legion Pro 7 16IRX8H | |
| CrossMark / Overall | |
| Lenovo Legion Pro 7 16IRX9H | |
| HP Omen 16 (2024) | |
| MSI Vector 16 HX A14V | |
| Genomsnitt Intel Core i9-14900HX, NVIDIA GeForce RTX 4080 Laptop GPU (1992 - 2334, n=7) | |
| Alienware m16 R1 AMD | |
| Genomsnitt av klass Gaming (1366 - 2409, n=96, senaste 2 åren) | |
| CrossMark / Productivity | |
| Lenovo Legion Pro 7 16IRX9H | |
| HP Omen 16 (2024) | |
| MSI Vector 16 HX A14V | |
| Genomsnitt Intel Core i9-14900HX, NVIDIA GeForce RTX 4080 Laptop GPU (1812 - 2204, n=7) | |
| Alienware m16 R1 AMD | |
| Genomsnitt av klass Gaming (1386 - 2254, n=96, senaste 2 åren) | |
| CrossMark / Creativity | |
| Lenovo Legion Pro 7 16IRX9H | |
| MSI Vector 16 HX A14V | |
| Genomsnitt Intel Core i9-14900HX, NVIDIA GeForce RTX 4080 Laptop GPU (2327 - 2500, n=7) | |
| HP Omen 16 (2024) | |
| Genomsnitt av klass Gaming (1343 - 2729, n=96, senaste 2 åren) | |
| Alienware m16 R1 AMD | |
| CrossMark / Responsiveness | |
| Lenovo Legion Pro 7 16IRX9H | |
| HP Omen 16 (2024) | |
| MSI Vector 16 HX A14V | |
| Genomsnitt Intel Core i9-14900HX, NVIDIA GeForce RTX 4080 Laptop GPU (1520 - 2254, n=7) | |
| Alienware m16 R1 AMD | |
| Genomsnitt av klass Gaming (1226 - 2334, n=96, senaste 2 åren) | |
| WebXPRT 3 / Overall | |
| Lenovo Legion Pro 7 16IRX8H | |
| Lenovo Legion Pro 7 16IRX8H | |
| Alienware m16 R1 AMD | |
| Lenovo Legion Pro 7 16IRX9H | |
| Genomsnitt Intel Core i9-14900HX, NVIDIA GeForce RTX 4080 Laptop GPU (310 - 345, n=7) | |
| HP Omen 16 (2024) | |
| MSI Vector 16 HX A14V | |
| Genomsnitt av klass Gaming (220 - 532, n=101, senaste 2 åren) | |
| WebXPRT 4 / Overall | |
| Lenovo Legion Pro 7 16IRX9H | |
| Genomsnitt Intel Core i9-14900HX, NVIDIA GeForce RTX 4080 Laptop GPU (300 - 321, n=7) | |
| HP Omen 16 (2024) | |
| Lenovo Legion Pro 7 16IRX8H | |
| MSI Vector 16 HX A14V | |
| Genomsnitt av klass Gaming (165 - 354, n=101, senaste 2 åren) | |
| Alienware m16 R1 AMD | |
| Mozilla Kraken 1.1 / Total | |
| Alienware m16 R1 AMD | |
| Genomsnitt av klass Gaming (391 - 590, n=106, senaste 2 åren) | |
| Lenovo Legion Pro 7 16IRX8H | |
| Lenovo Legion Pro 7 16IRX8H | |
| MSI Vector 16 HX A14V | |
| Genomsnitt Intel Core i9-14900HX, NVIDIA GeForce RTX 4080 Laptop GPU (437 - 446, n=7) | |
| Lenovo Legion Pro 7 16IRX9H | |
| HP Omen 16 (2024) | |
* ... mindre är bättre
| PCMark 10 Score | 8923 poäng | |
Hjälp | ||
| AIDA64 / Memory Copy | |
| HP Omen 16 (2024) | |
| Lenovo Legion Pro 7 16IRX9H | |
| MSI Vector 16 HX A14V | |
| Genomsnitt Intel Core i9-14900HX (38028 - 83392, n=36) | |
| Genomsnitt av klass Gaming (21750 - 129946, n=108, senaste 2 åren) | |
| Alienware m16 R1 AMD | |
| AIDA64 / Memory Read | |
| HP Omen 16 (2024) | |
| Lenovo Legion Pro 7 16IRX9H | |
| MSI Vector 16 HX A14V | |
| Genomsnitt Intel Core i9-14900HX (43306 - 87568, n=36) | |
| Genomsnitt av klass Gaming (22956 - 118858, n=108, senaste 2 åren) | |
| Alienware m16 R1 AMD | |
| AIDA64 / Memory Write | |
| HP Omen 16 (2024) | |
| MSI Vector 16 HX A14V | |
| Genomsnitt av klass Gaming (22297 - 135096, n=108, senaste 2 åren) | |
| Genomsnitt Intel Core i9-14900HX (37146 - 80589, n=36) | |
| Lenovo Legion Pro 7 16IRX9H | |
| Alienware m16 R1 AMD | |
| AIDA64 / Memory Latency | |
| Genomsnitt av klass Gaming (75.3 - 259, n=108, senaste 2 åren) | |
| Alienware m16 R1 AMD | |
| Genomsnitt Intel Core i9-14900HX (76.1 - 105, n=36) | |
| HP Omen 16 (2024) | |
| MSI Vector 16 HX A14V | |
| Lenovo Legion Pro 7 16IRX9H | |
* ... mindre är bättre
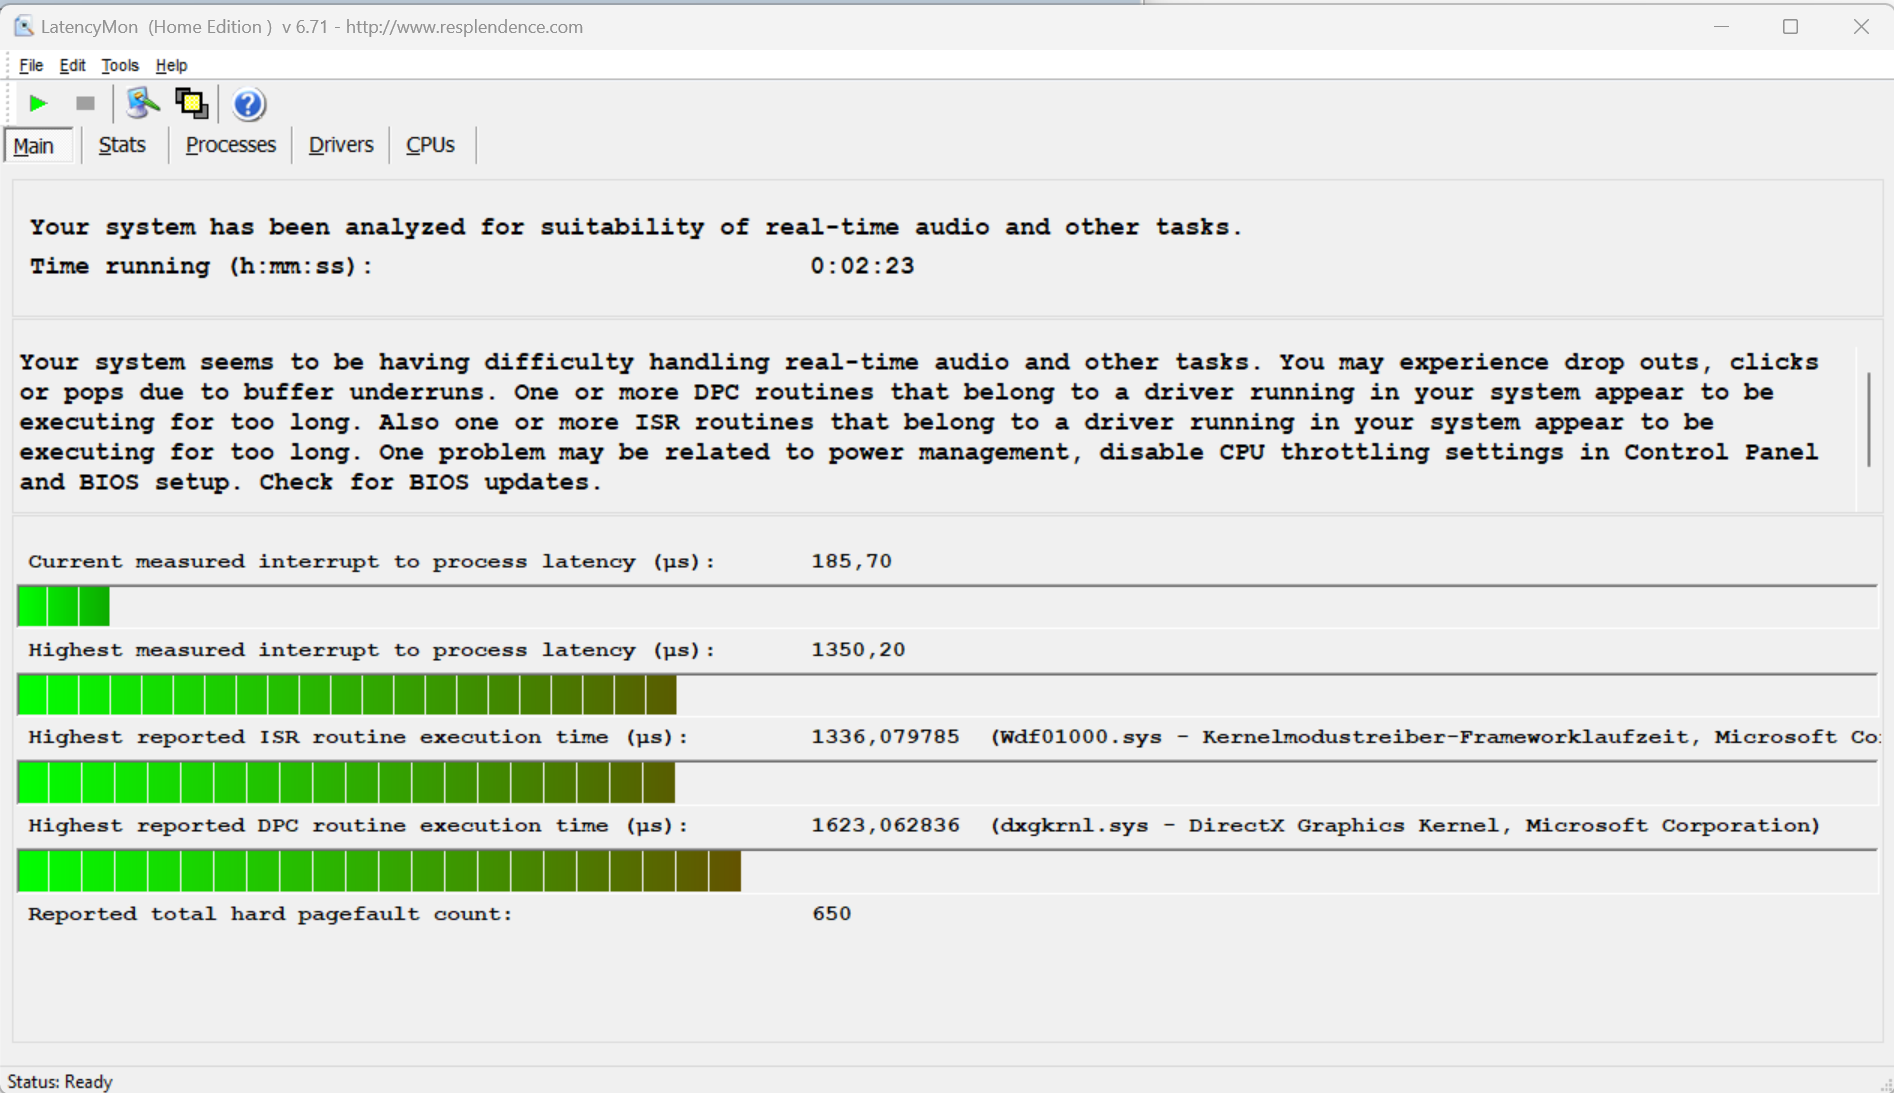
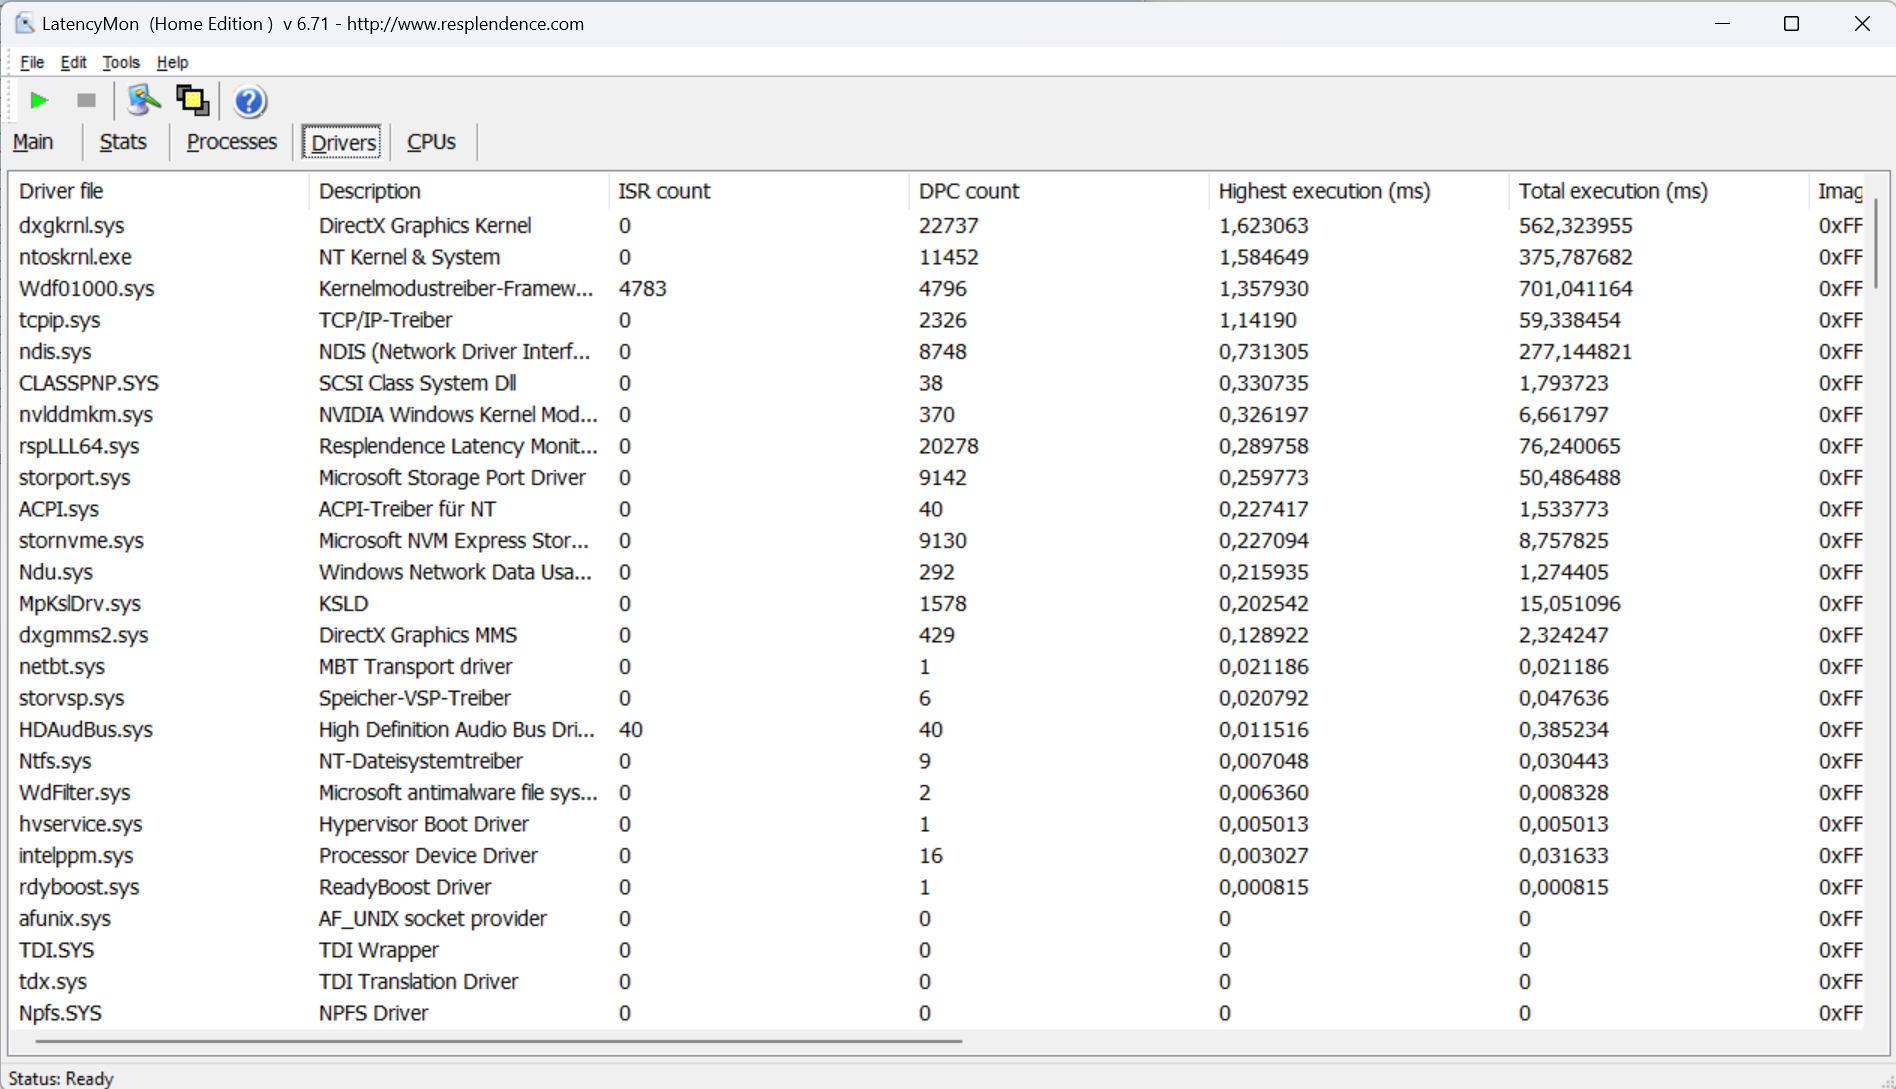
DPC-fördröjning
Latency Monitor upptäckte några problem under latens-testet (webbsurfning, uppspelning av 4K-video, Prime95 hög belastning). Systemet verkar inte vara lämpligt för video- och ljuduppgifter i realtid. Förhoppningsvis kommer framtida programuppdateringar att kunna förbättra situationen.
| DPC Latencies / LatencyMon - interrupt to process latency (max), Web, Youtube, Prime95 | |
| Alienware m16 R1 AMD | |
| MSI Vector 16 HX A14V | |
| Lenovo Legion Pro 7 16IRX9H | |
| HP Omen 16 (2024) | |
| Lenovo Legion Pro 7 16IRX8H | |
* ... mindre är bättre
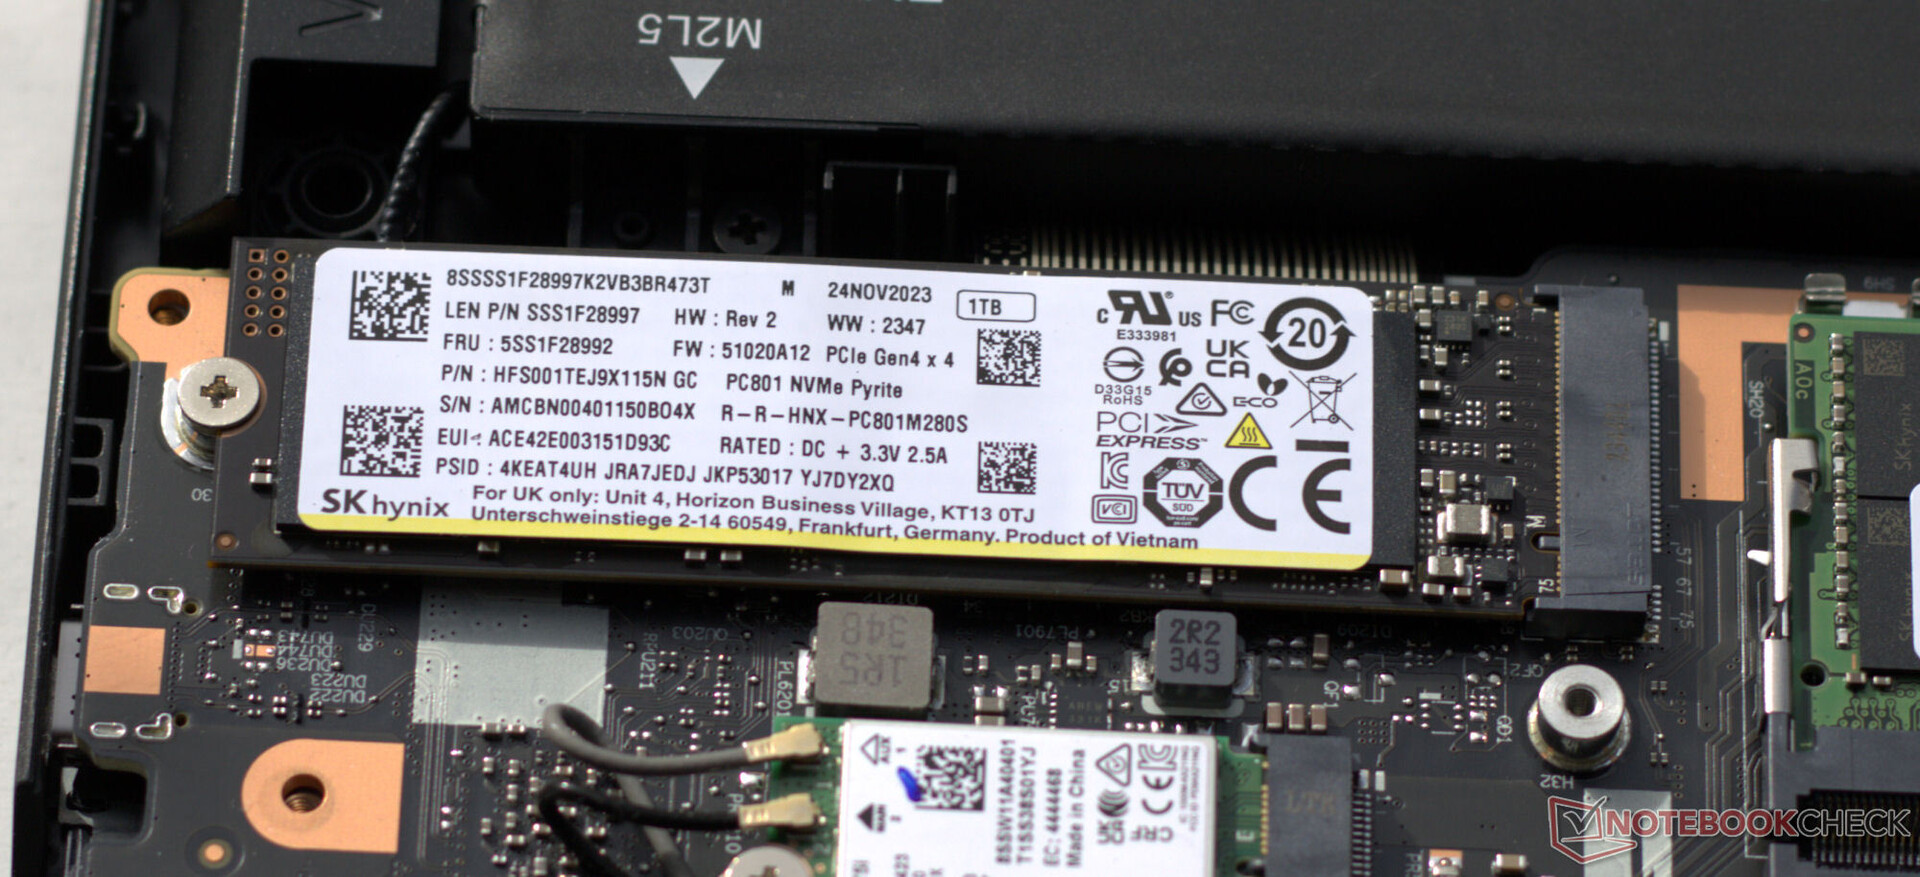
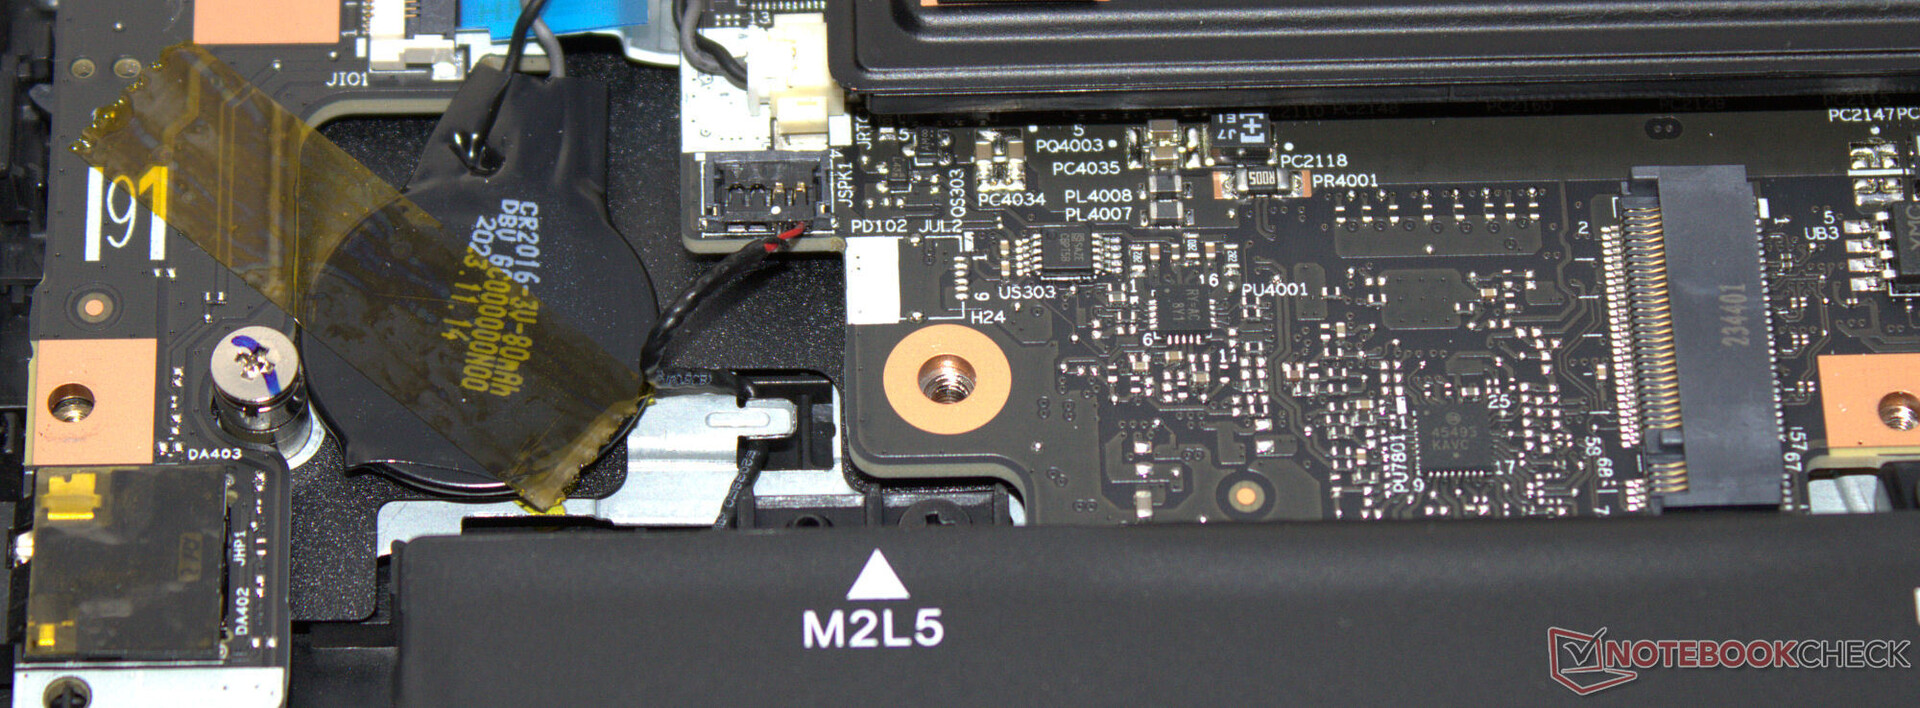
Masslagring
Legion har plats för totalt två PCIe 4.0 SSD-enheter. SK Hynix M.2 2280 SSD (1TB) i vår testenhet levererade utmärkta läs- och skrivhastigheter. En annan positiv sak är att termisk strypning inte förekom under våra tester.

* ... mindre är bättre
Sustained load Read: DiskSpd Read Loop, Queue Depth 8
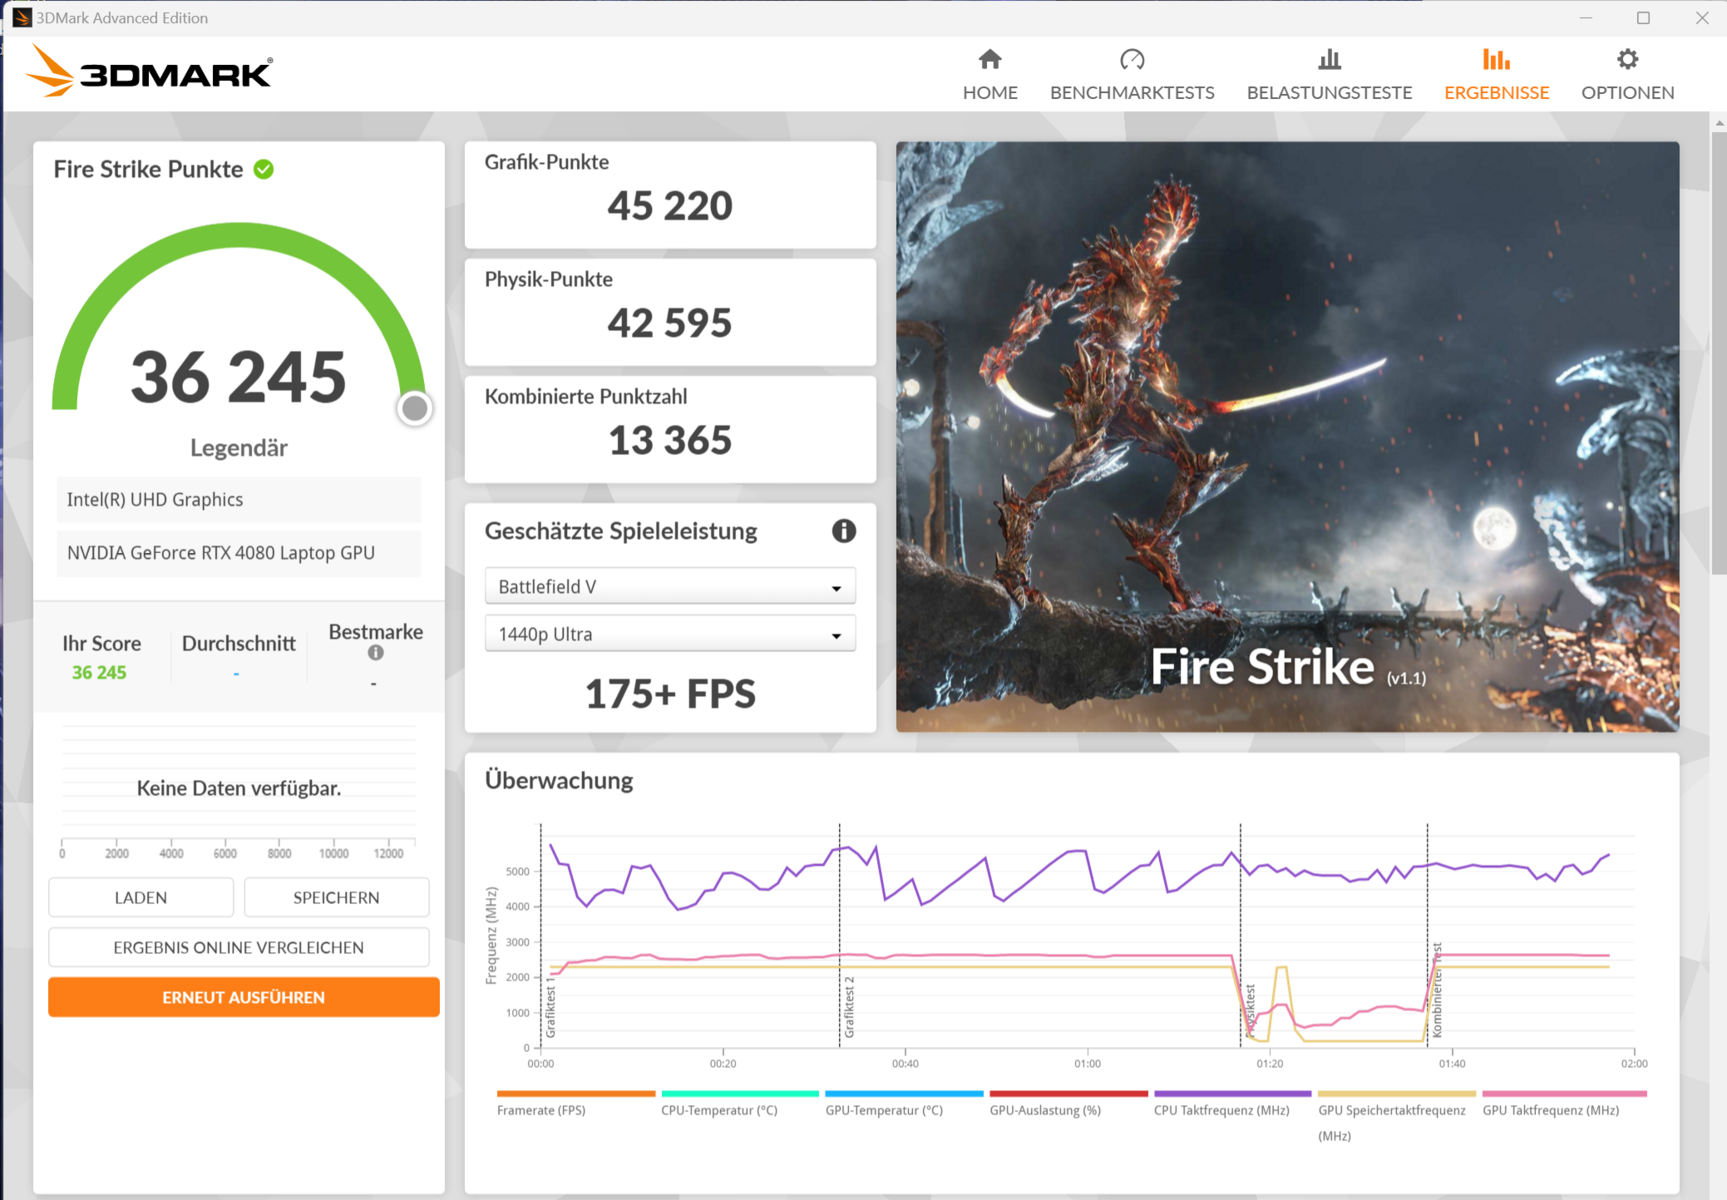
Grafikkort
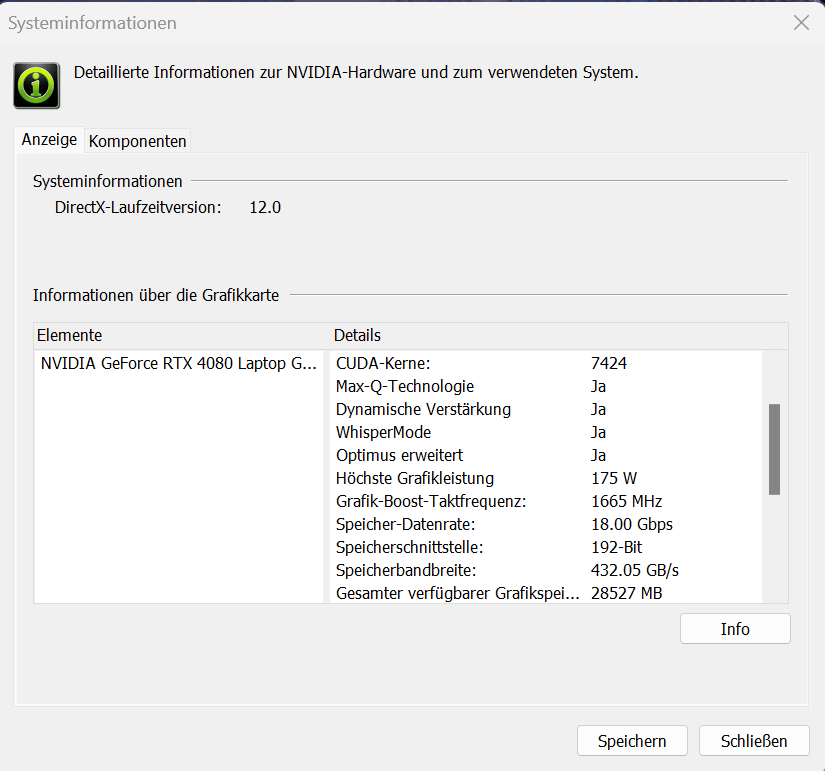
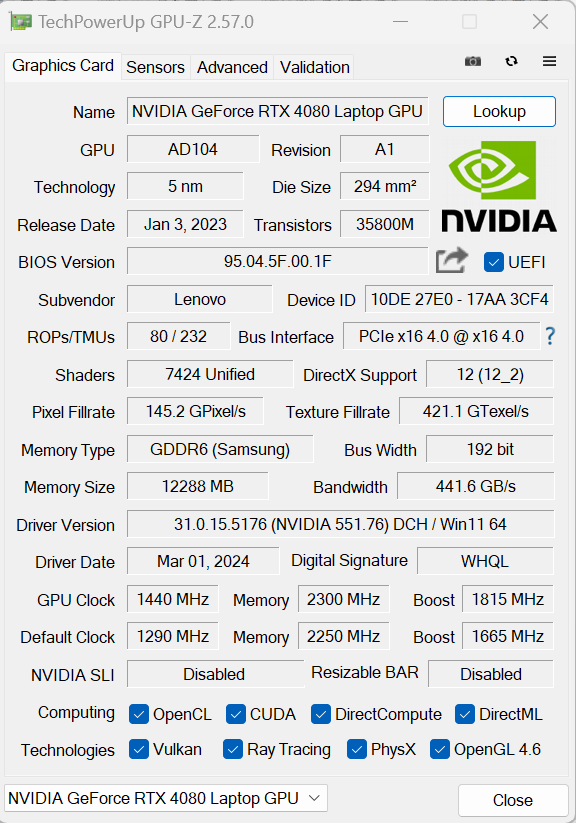
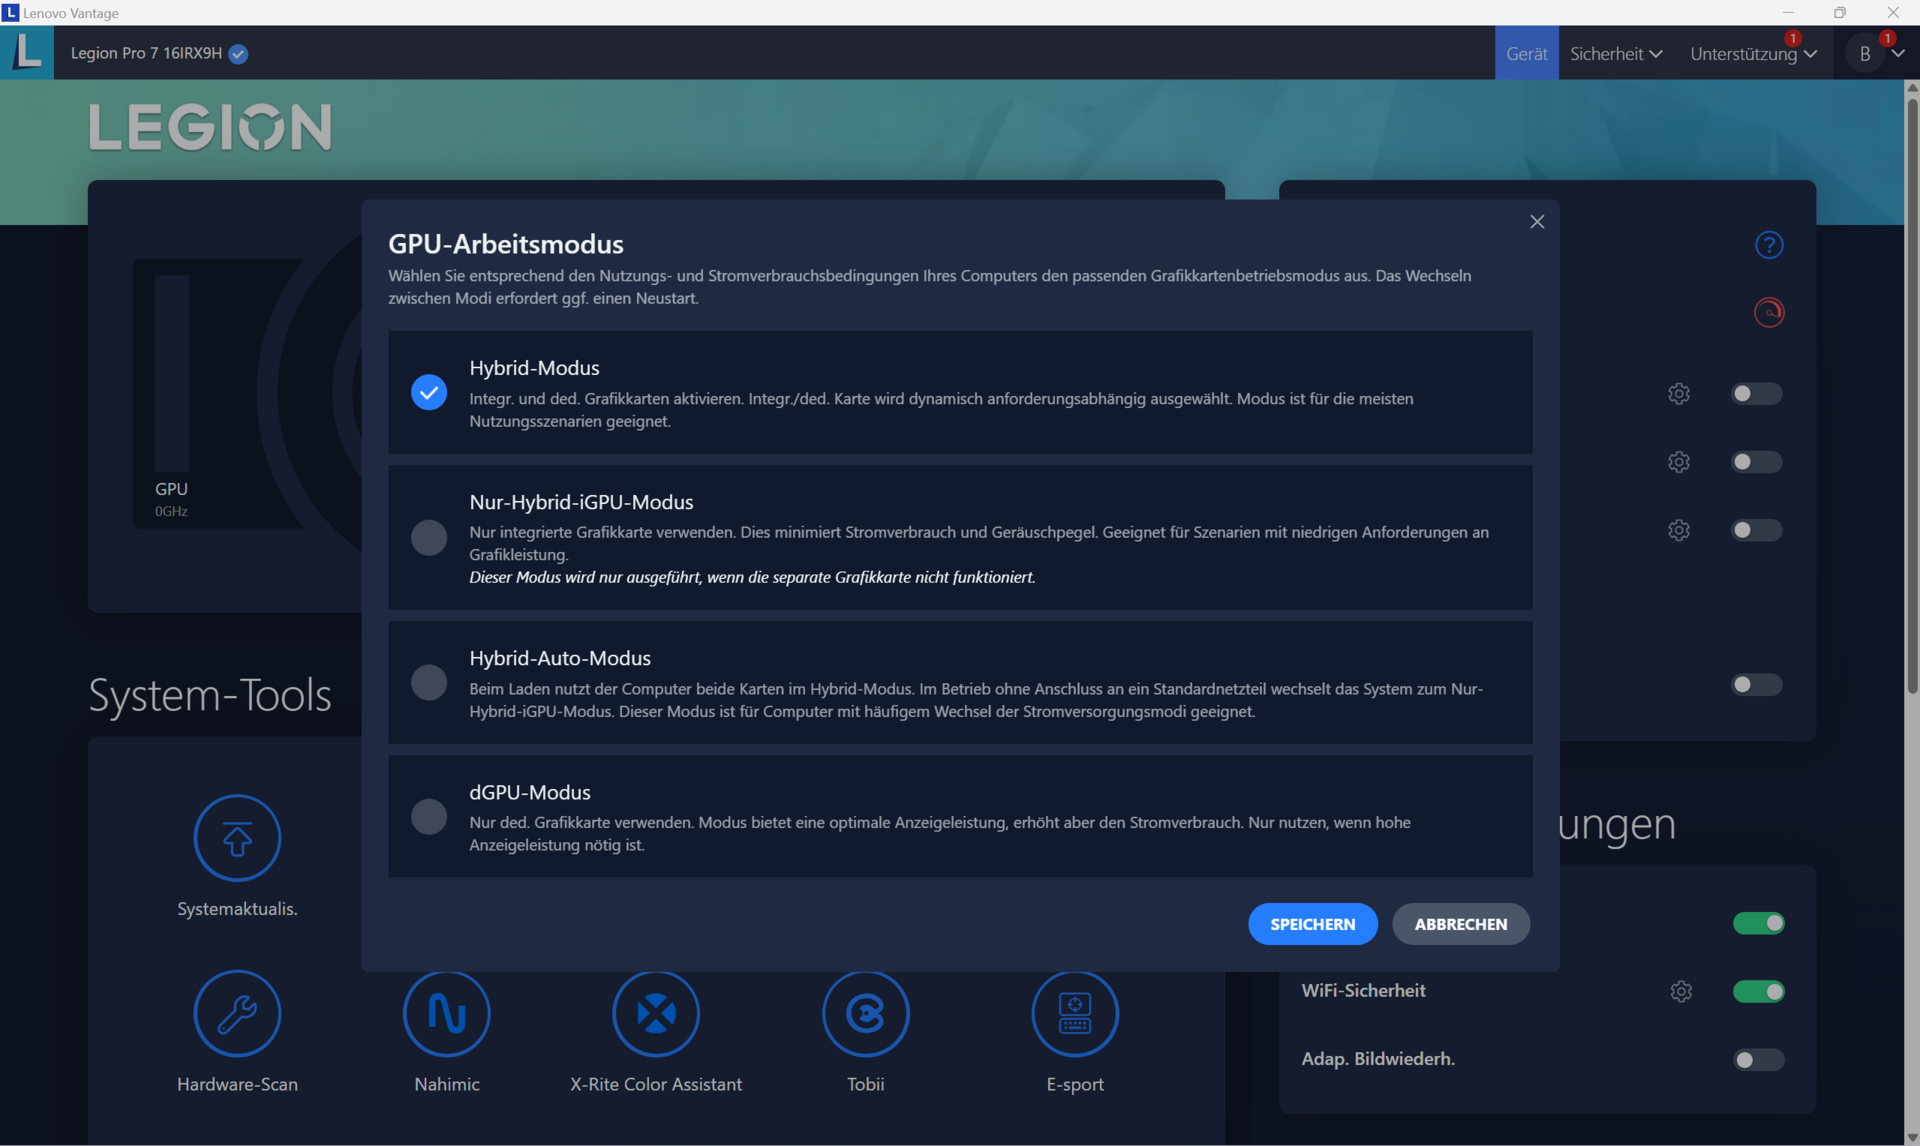
Lenovo har utrustat Legion Pro 7 med en GeForce RTX 4080 (7 424 shading-enheter, 192-bitars minnesbuss, 12 GB GDDR6, 175 watt), som är den nuvarande nummer två i Nvidias mobila GPU-sortiment. De benchmarkresultat och bildfrekvenser som uppnåtts i våra tester ligger över vad RTX 4080 Laptop kan prestera i genomsnitt. Vissa av dessa resultat är de bästa vi har sett från en RTX 4080 hittills. Att växla mellan dGPU-only och Optimus-läge kräver ingen omstart; Advanced Optimus stöds också.
Grafikkortet är tillräckligt kraftfullt för QHD-spel med höga till maximala inställningar. Med hjälp av DLSS 3 och Frame Generation kan du även spela i högre upplösningar vid maxinställningar och med ray tracing aktiverat - men bara i spel som stöder dessa funktioner.
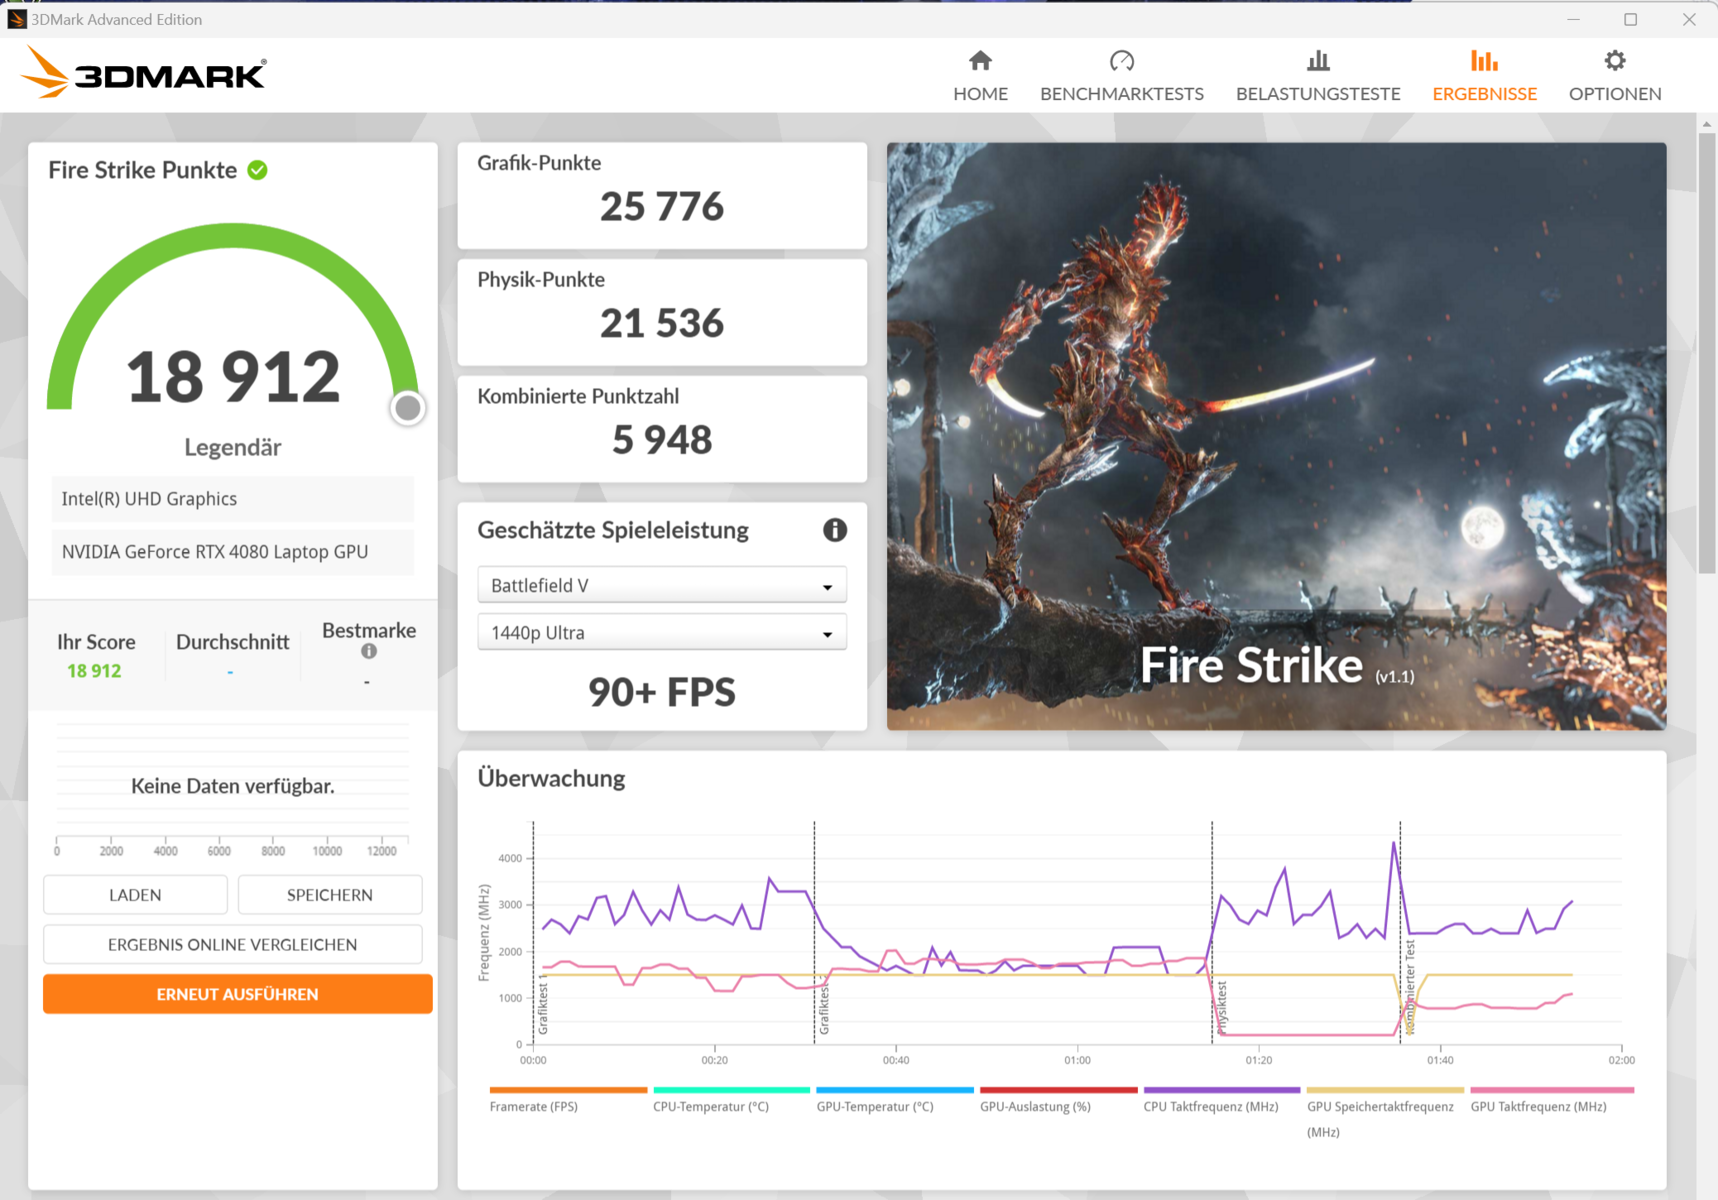
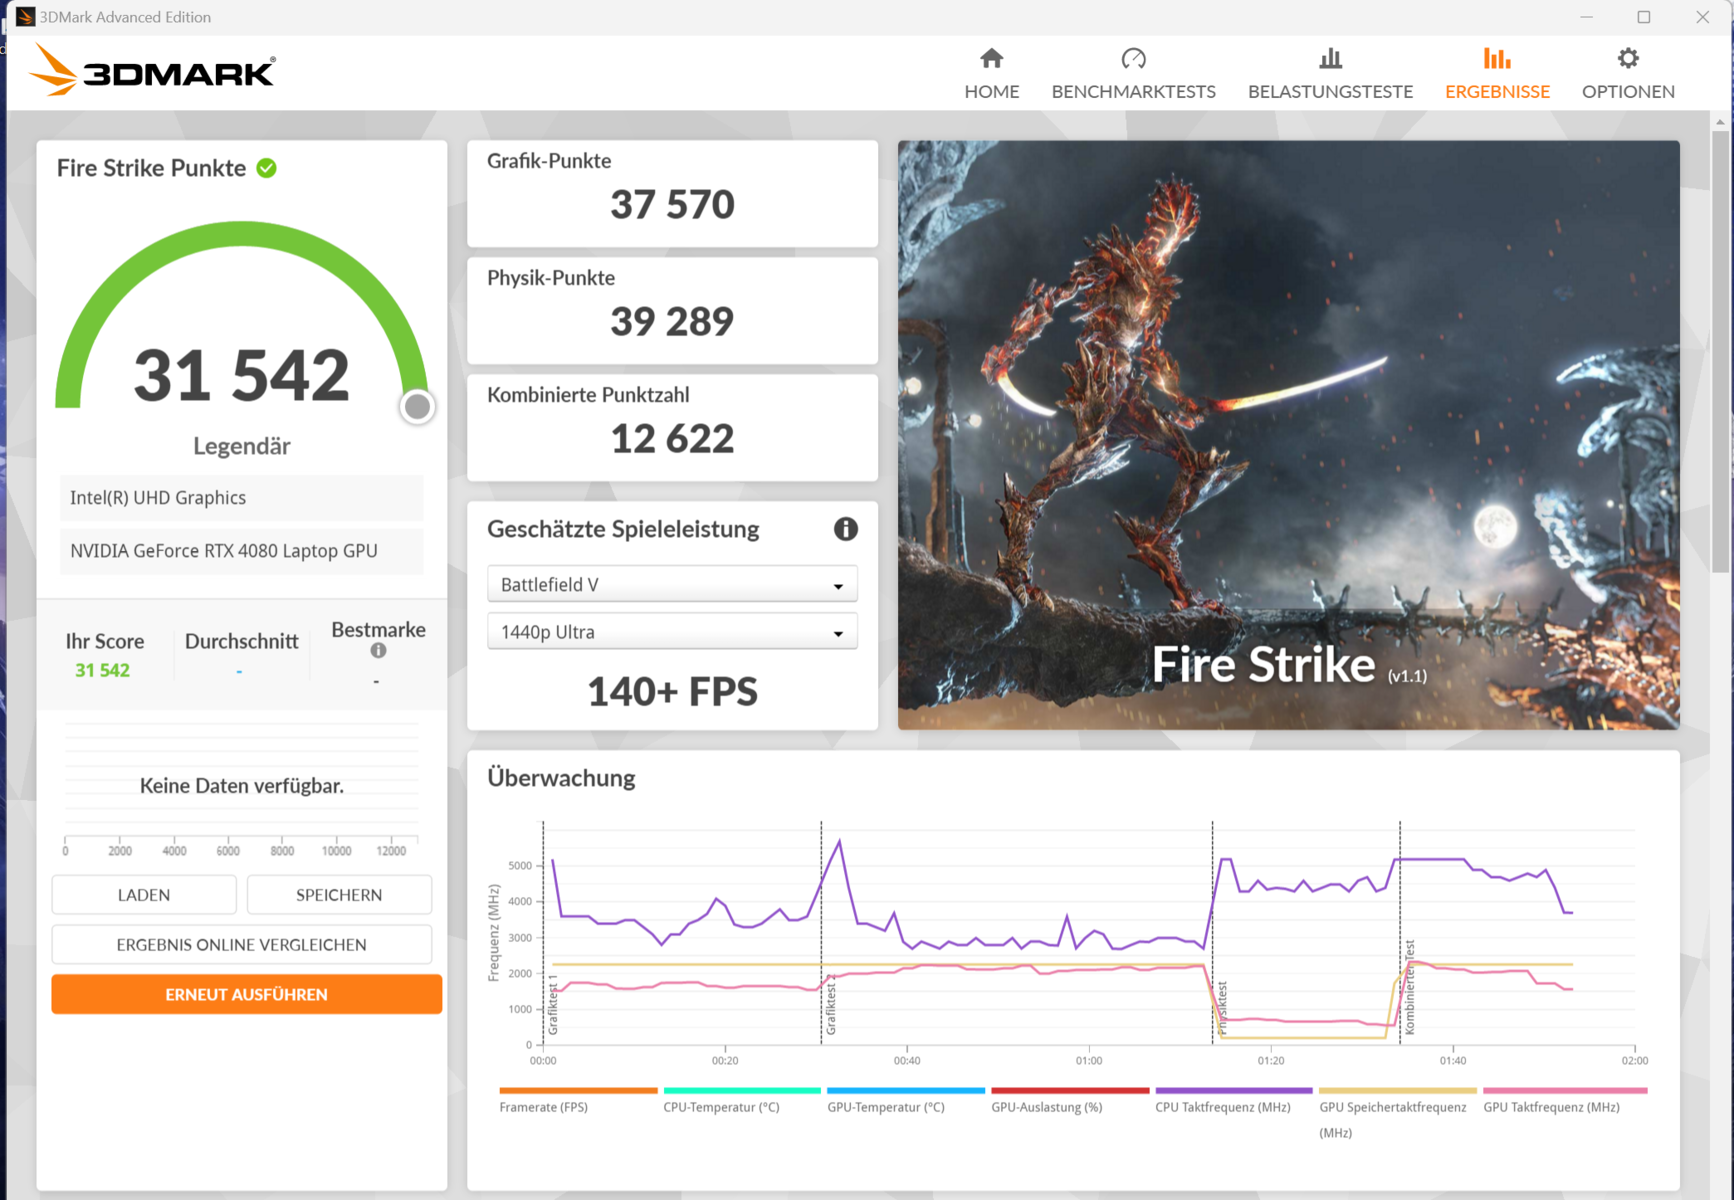
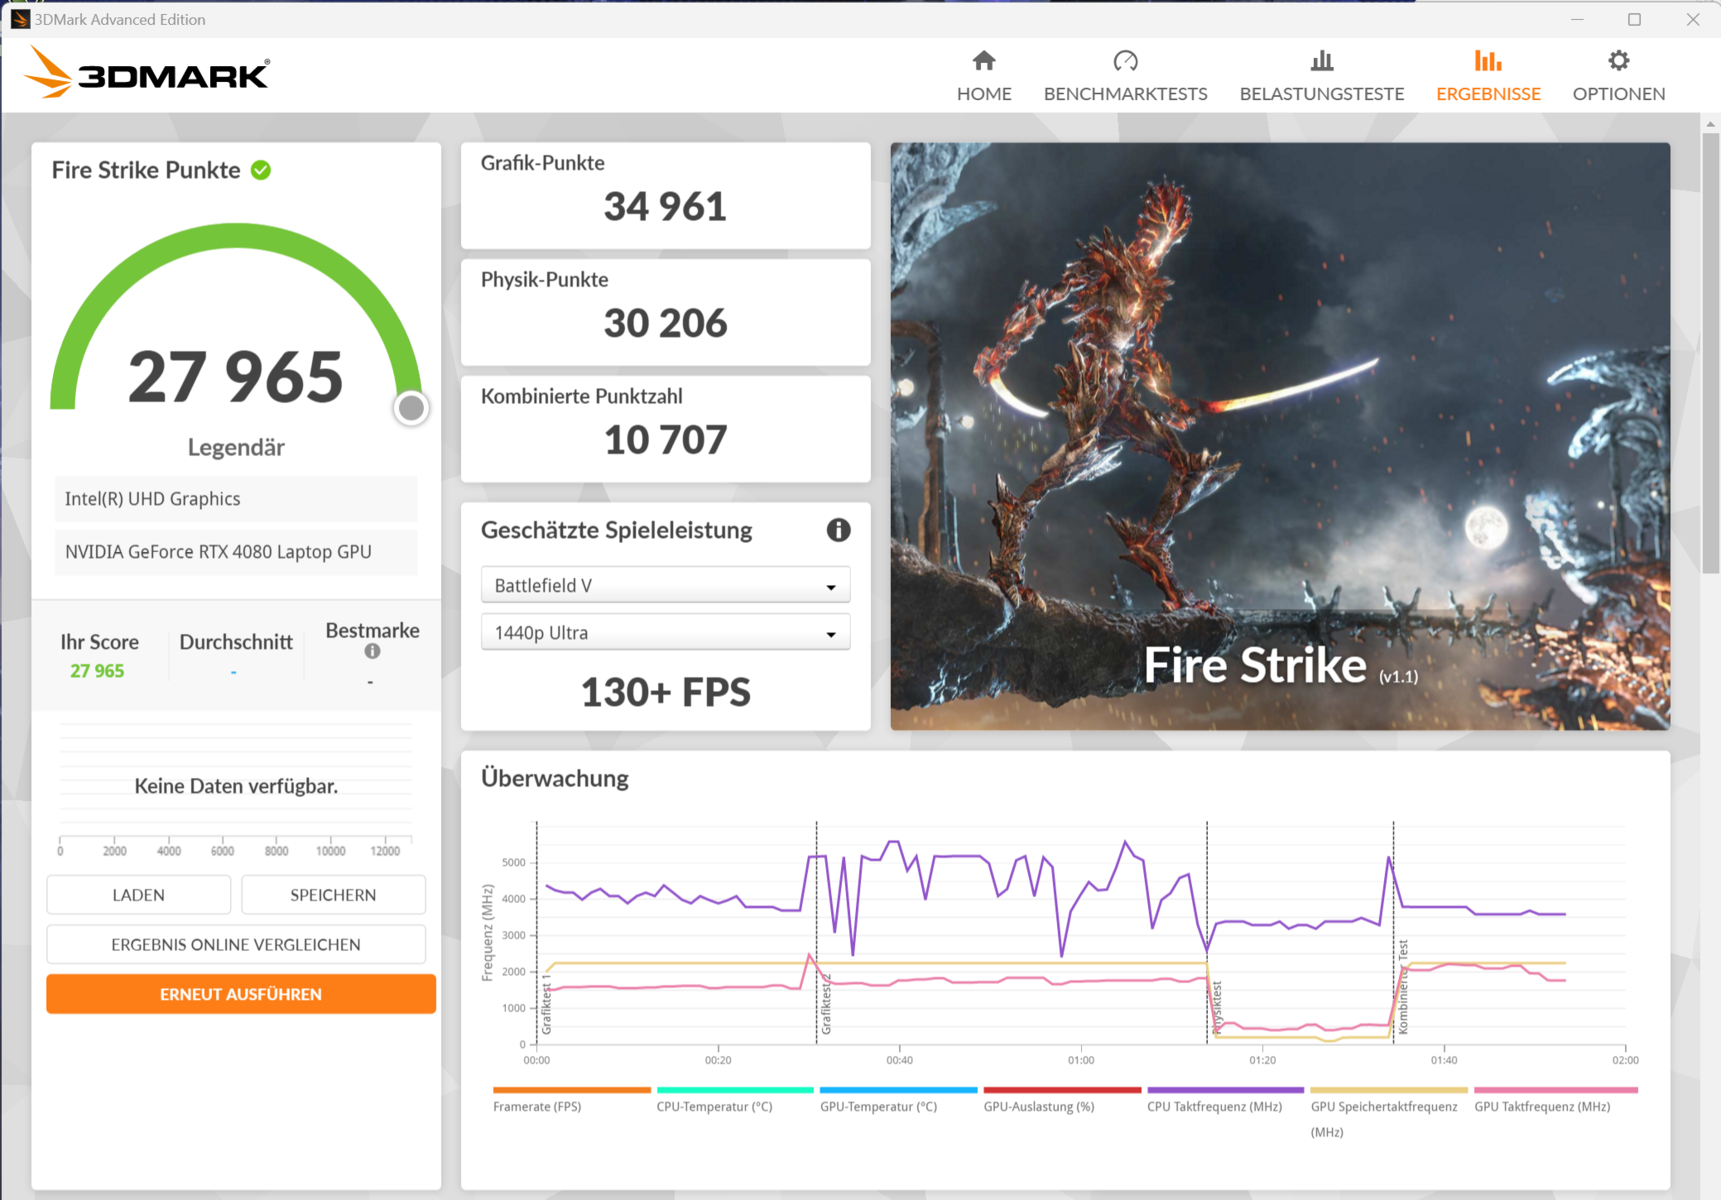
| 3DMark 11 Performance | 46847 poäng | |
| 3DMark Fire Strike Score | 36245 poäng | |
| 3DMark Time Spy Score | 19518 poäng | |
Hjälp | ||
* ... mindre är bättre
| Performance rating - Percent | |
| Lenovo Legion Pro 7 16IRX9H | |
| MSI Vector 16 HX A14V | |
| Alienware m16 R1 AMD -1! | |
| Genomsnitt NVIDIA GeForce RTX 4080 Laptop GPU | |
| Genomsnitt av klass Gaming | |
| HP Omen 16 (2024) | |
| The Witcher 3 - 1920x1080 Ultra Graphics & Postprocessing (HBAO+) | |
| Lenovo Legion Pro 7 16IRX9H | |
| MSI Vector 16 HX A14V | |
| Genomsnitt av klass Gaming (95 - 240, n=8, senaste 2 åren) | |
| Alienware m16 R1 AMD | |
| Genomsnitt NVIDIA GeForce RTX 4080 Laptop GPU (130.4 - 186.1, n=20) | |
| HP Omen 16 (2024) | |
| GTA V - 1920x1080 Highest AA:4xMSAA + FX AF:16x | |
| Lenovo Legion Pro 7 16IRX9H | |
| MSI Vector 16 HX A14V | |
| Genomsnitt NVIDIA GeForce RTX 4080 Laptop GPU (102.9 - 152.7, n=21) | |
| Genomsnitt av klass Gaming (48.3 - 186.9, n=99, senaste 2 åren) | |
| HP Omen 16 (2024) | |
| Final Fantasy XV Benchmark - 1920x1080 High Quality | |
| MSI Vector 16 HX A14V | |
| Lenovo Legion Pro 7 16IRX9H | |
| Alienware m16 R1 AMD | |
| Genomsnitt NVIDIA GeForce RTX 4080 Laptop GPU (129 - 182.1, n=23) | |
| Genomsnitt av klass Gaming (41 - 215, n=100, senaste 2 åren) | |
| HP Omen 16 (2024) | |
| Strange Brigade - 1920x1080 ultra AA:ultra AF:16 | |
| Alienware m16 R1 AMD | |
| MSI Vector 16 HX A14V | |
| Lenovo Legion Pro 7 16IRX9H | |
| Genomsnitt NVIDIA GeForce RTX 4080 Laptop GPU (239 - 357, n=22) | |
| Genomsnitt av klass Gaming (76.3 - 456, n=90, senaste 2 åren) | |
| HP Omen 16 (2024) | |
| Dota 2 Reborn - 1920x1080 ultra (3/3) best looking | |
| Lenovo Legion Pro 7 16IRX9H | |
| MSI Vector 16 HX A14V | |
| Alienware m16 R1 AMD | |
| Genomsnitt NVIDIA GeForce RTX 4080 Laptop GPU (133 - 194.7, n=23) | |
| HP Omen 16 (2024) | |
| Genomsnitt av klass Gaming (84.8 - 248, n=111, senaste 2 åren) | |
| Call of Duty Modern Warfare 3 2023 - 1920x1080 Extreme Preset | |
| Genomsnitt NVIDIA GeForce RTX 4080 Laptop GPU (153 - 171, n=3) | |
| Lenovo Legion Pro 7 16IRX9H | |
| Genomsnitt av klass Gaming (27 - 95, n=3, senaste 2 åren) | |
| Skull & Bones | |
| 1920x1080 Ultra High Preset AA:T | |
| Lenovo Legion Pro 7 16IRX9H | |
| Genomsnitt NVIDIA GeForce RTX 4080 Laptop GPU (96 - 115, n=3) | |
| 2560x1440 Ultra High Preset AA:T | |
| Lenovo Legion Pro 7 16IRX9H | |
| Genomsnitt NVIDIA GeForce RTX 4080 Laptop GPU (76 - 91, n=3) | |
| Assassin's Creed Mirage | |
| 1920x1080 Ultra High Preset (Adaptive Quality Off) | |
| Lenovo Legion Pro 7 16IRX9H | |
| Genomsnitt NVIDIA GeForce RTX 4080 Laptop GPU (129 - 157, n=3) | |
| 2560x1440 Ultra High Preset (Adaptive Quality Off) | |
| Lenovo Legion Pro 7 16IRX9H | |
| Genomsnitt NVIDIA GeForce RTX 4080 Laptop GPU (112 - 136, n=3) | |
| Avatar Frontiers of Pandora | |
| 1920x1080 Ultra Preset AA:T | |
| Genomsnitt NVIDIA GeForce RTX 4080 Laptop GPU (87 - 97, n=4) | |
| Lenovo Legion Pro 7 16IRX9H | |
| Genomsnitt av klass Gaming (n=1senaste 2 åren) | |
| 2560x1440 Ultra Preset AA:T | |
| Genomsnitt NVIDIA GeForce RTX 4080 Laptop GPU (59 - 66, n=4) | |
| Lenovo Legion Pro 7 16IRX9H | |
| Genomsnitt av klass Gaming (n=1senaste 2 åren) | |
| Last Epoch | |
| 1920x1080 Ultra Preset AA:T | |
| Lenovo Legion Pro 7 16IRX9H | |
| Genomsnitt NVIDIA GeForce RTX 4080 Laptop GPU (156.5 - 204, n=2) | |
| Genomsnitt av klass Gaming (n=1senaste 2 åren) | |
| 2560x1440 Ultra Preset AA:T | |
| Lenovo Legion Pro 7 16IRX9H | |
| Genomsnitt NVIDIA GeForce RTX 4080 Laptop GPU (127.4 - 139, n=2) | |
| Genomsnitt av klass Gaming (n=1senaste 2 åren) | |
| Alone in the Dark | |
| 1920x1080 Cinematic Preset | |
| Lenovo Legion Pro 7 16IRX9H | |
| Genomsnitt NVIDIA GeForce RTX 4080 Laptop GPU (120 - 176.4, n=2) | |
| 2560x1440 Cinematic Preset | |
| Lenovo Legion Pro 7 16IRX9H | |
| Genomsnitt NVIDIA GeForce RTX 4080 Laptop GPU (86 - 91.6, n=2) | |
| Horizon Forbidden West | |
| 1920x1080 Very High Preset AA:T | |
| Lenovo Legion Pro 7 16IRX9H | |
| Genomsnitt NVIDIA GeForce RTX 4080 Laptop GPU (89.2 - 103.5, n=2) | |
| Genomsnitt av klass Gaming (14.7 - 140.3, n=13, senaste 2 åren) | |
| 2560x1440 Very High Preset AA:T | |
| Lenovo Legion Pro 7 16IRX9H | |
| Genomsnitt NVIDIA GeForce RTX 4080 Laptop GPU (71 - 83.7, n=2) | |
| Genomsnitt av klass Gaming (39.6 - 100.9, n=10, senaste 2 åren) | |
Witcher 3 FPS chart
| låg | med. | hög | ultra | QHD | |
|---|---|---|---|---|---|
| GTA V (2015) | 187.2 | 186.6 | 186.5 | 152 | 135.3 |
| The Witcher 3 (2015) | 628.4 | 518.3 | 342.2 | 186.1 | 142.6 |
| Dota 2 Reborn (2015) | 229 | 211 | 197.3 | 183.5 | |
| Final Fantasy XV Benchmark (2018) | 232 | 211 | 173.1 | 139.3 | |
| X-Plane 11.11 (2018) | 196.4 | 162.3 | 127.5 | ||
| Strange Brigade (2018) | 538 | 446 | 377 | 339 | 243 |
| Cyberpunk 2077 (2023) | 152.3 | 137.2 | 126.7 | 118.3 | 79.1 |
| Assassin's Creed Mirage (2023) | 208 | 207 | 199 | 157 | 136 |
| Call of Duty Modern Warfare 3 2023 (2023) | 224 | 205 | 164 | 153 | 110 |
| Avatar Frontiers of Pandora (2023) | 141 | 130 | 114 | 89 | 59 |
| Skull & Bones (2024) | 161 | 151 | 135 | 112 | 89 |
| Last Epoch (2024) | 248 | 237 | 229 | 204 | 139 |
| Alone in the Dark (2024) | 249 | 230 | 214 | 176.4 | 91.6 |
| Horizon Forbidden West (2024) | 153.3 | 145.5 | 108.1 | 103.5 | 83.7 |
Utsläpp och energihantering - Lenovos bärbara dator kan köras tyst
Utsläpp av buller
Bullernivån nådde så högt som 56 dB(A) under belastning i Performance-läget. Balanserat läge ger en bra avvägning mellan buller och prestanda; Tyst läge skonar dina nerver men orsakar en avsevärd minskning av prestandan. Den bärbara datorn är vanligtvis tyst och ibland till och med ljudlös på tomgång och vid daglig användning (t.ex. kontorsapplikationer, surfning på Internet). Det är synd att vi märkte att ett (mjukt) elektroniskt gnällande ljud ibland kom från insidan av vår granskningsenhet.
Ljudnivå
| Låg belastning |
| 25 / 30 / 45 dB(A) |
| Hög belastning |
| 50 / 56 dB(A) |
 | ||
30 dB tyst 40 dB(A) hörbar 50 dB(A) högt ljud |
||
min: | ||
| Lenovo Legion Pro 7 16IRX9H i9-14900HX, GeForce RTX 4080 Laptop GPU | Alienware m16 R1 AMD R9 7845HX, GeForce RTX 4080 Laptop GPU | MSI Vector 16 HX A14V i9-14900HX, GeForce RTX 4080 Laptop GPU | HP Omen 16 (2024) i9-14900HX, GeForce RTX 4080 Laptop GPU | Lenovo Legion Pro 7 16IRX8H i9-13900HX, GeForce RTX 4080 Laptop GPU | |
|---|---|---|---|---|---|
| Noise | 13% | -7% | 7% | 4% | |
| av / miljö * (dB) | 24 | 22.9 5% | 23.2 3% | 25 -4% | 24 -0% |
| Idle Minimum * (dB) | 25 | 22.9 8% | 33.5 -34% | 29 -16% | 26 -4% |
| Idle Average * (dB) | 30 | 29.7 1% | 33.5 -12% | 30 -0% | 28 7% |
| Idle Maximum * (dB) | 45 | 29.7 34% | 33.5 26% | 31 31% | 34 24% |
| Load Average * (dB) | 50 | 29.8 40% | 52.1 -4% | 46 8% | 47 6% |
| Witcher 3 ultra * (dB) | 54 | 54.7 -1% | 62 -15% | 47 13% | 55 -2% |
| Load Maximum * (dB) | 56 | 54.7 2% | 62 -11% | 47 16% | 56 -0% |
* ... mindre är bättre
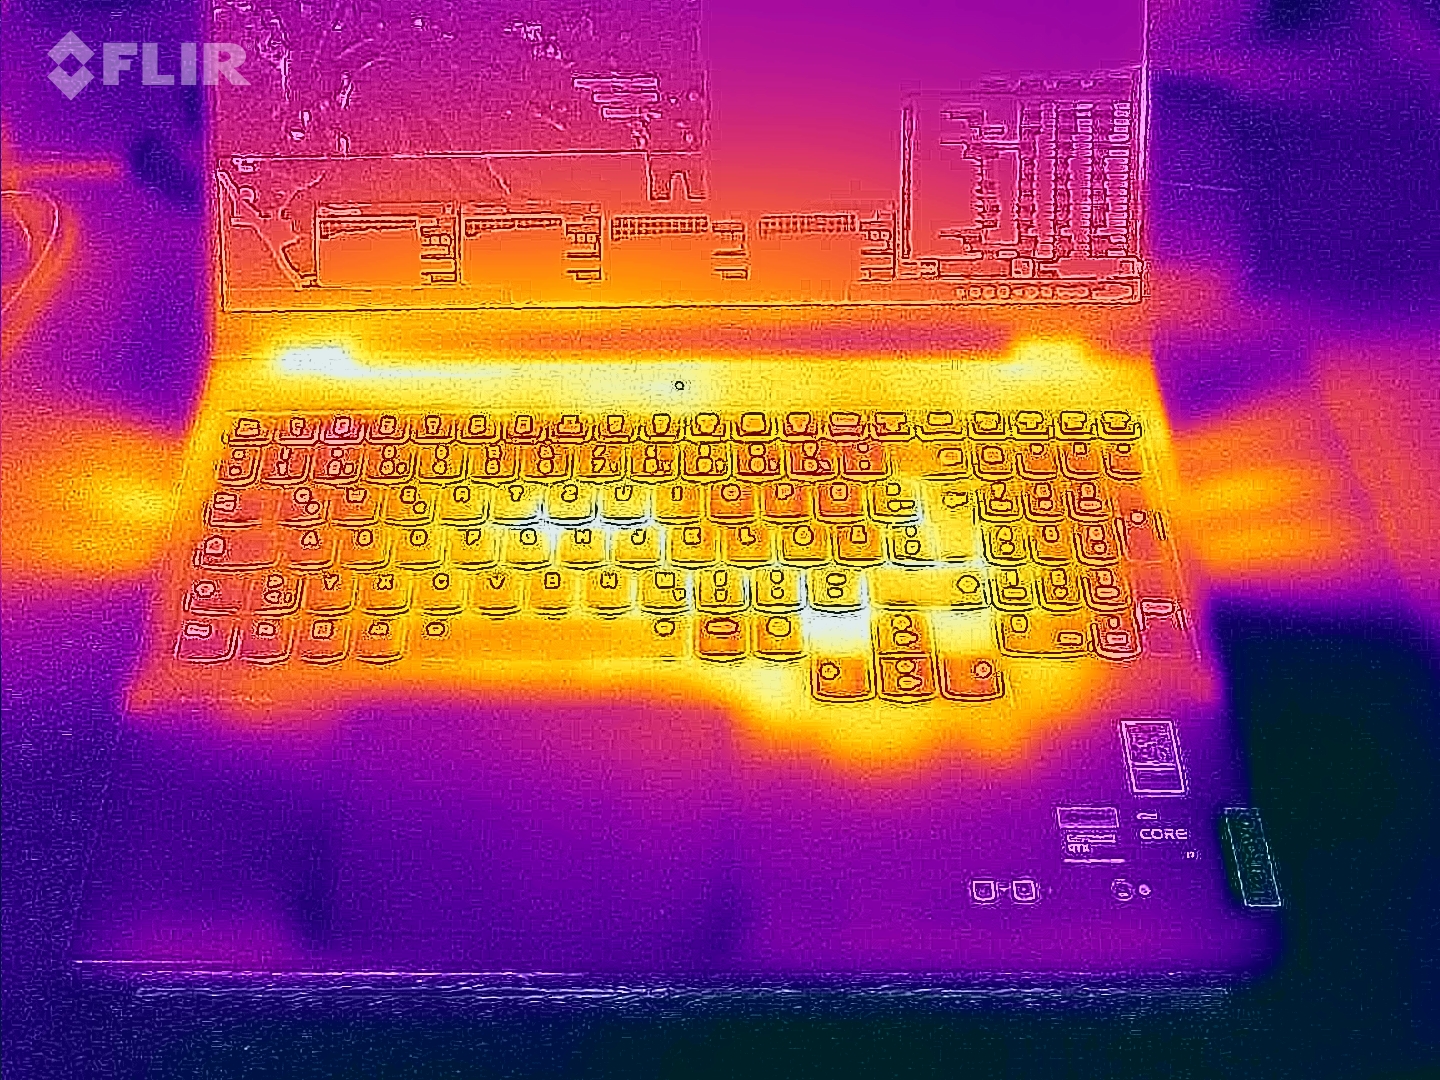
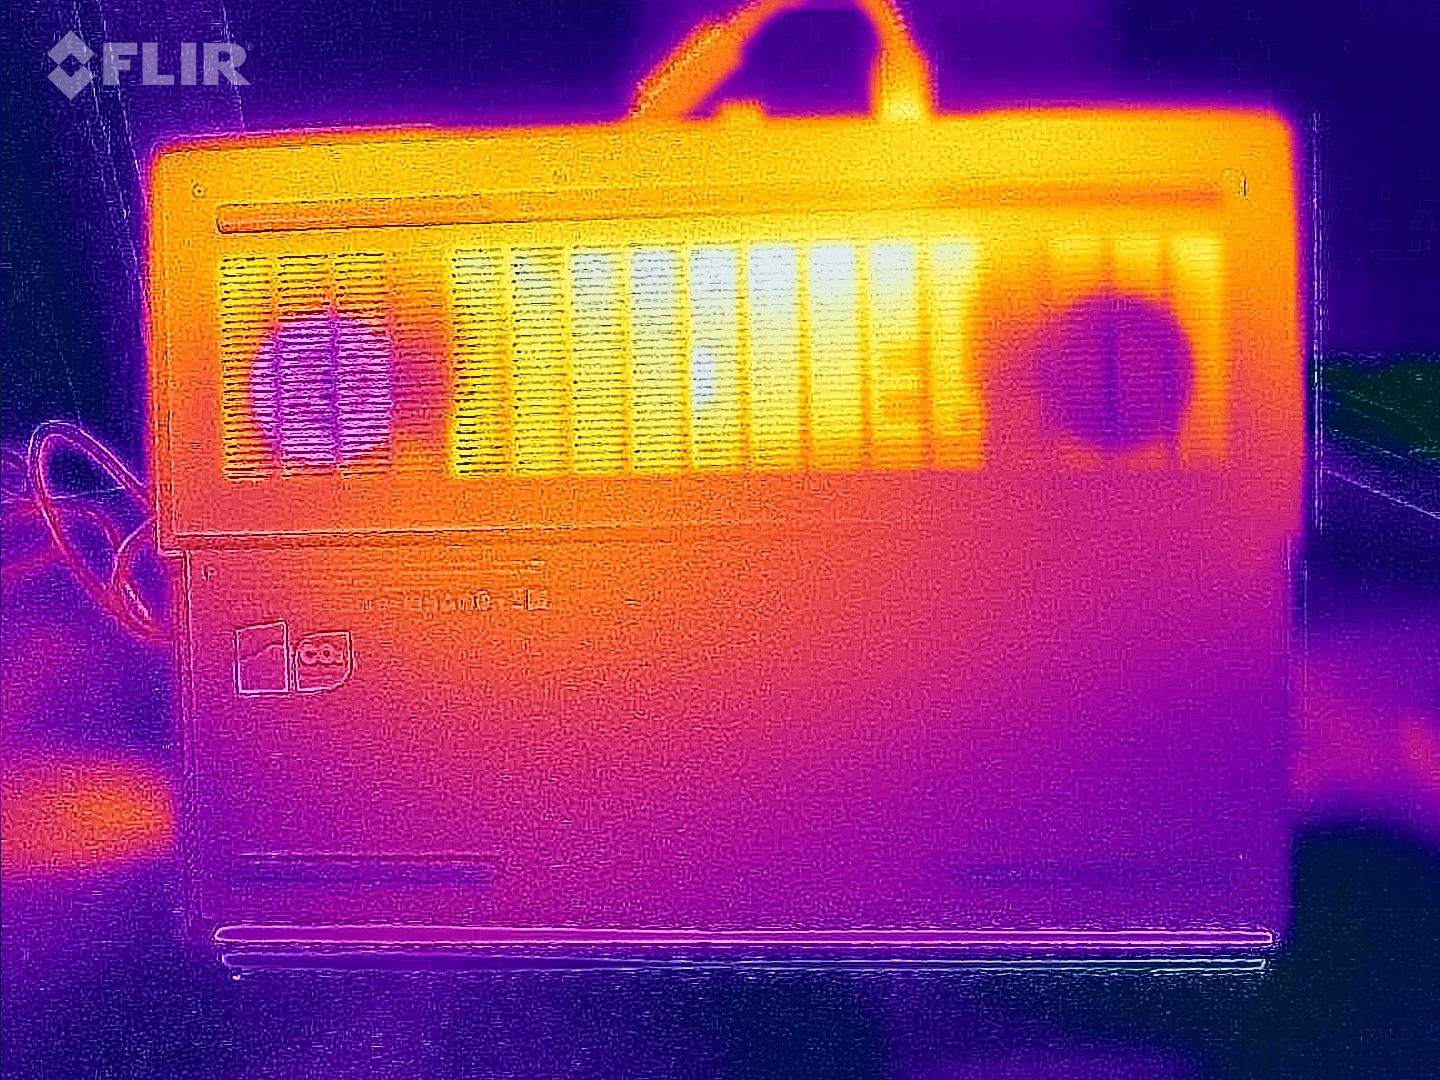
Temperatur
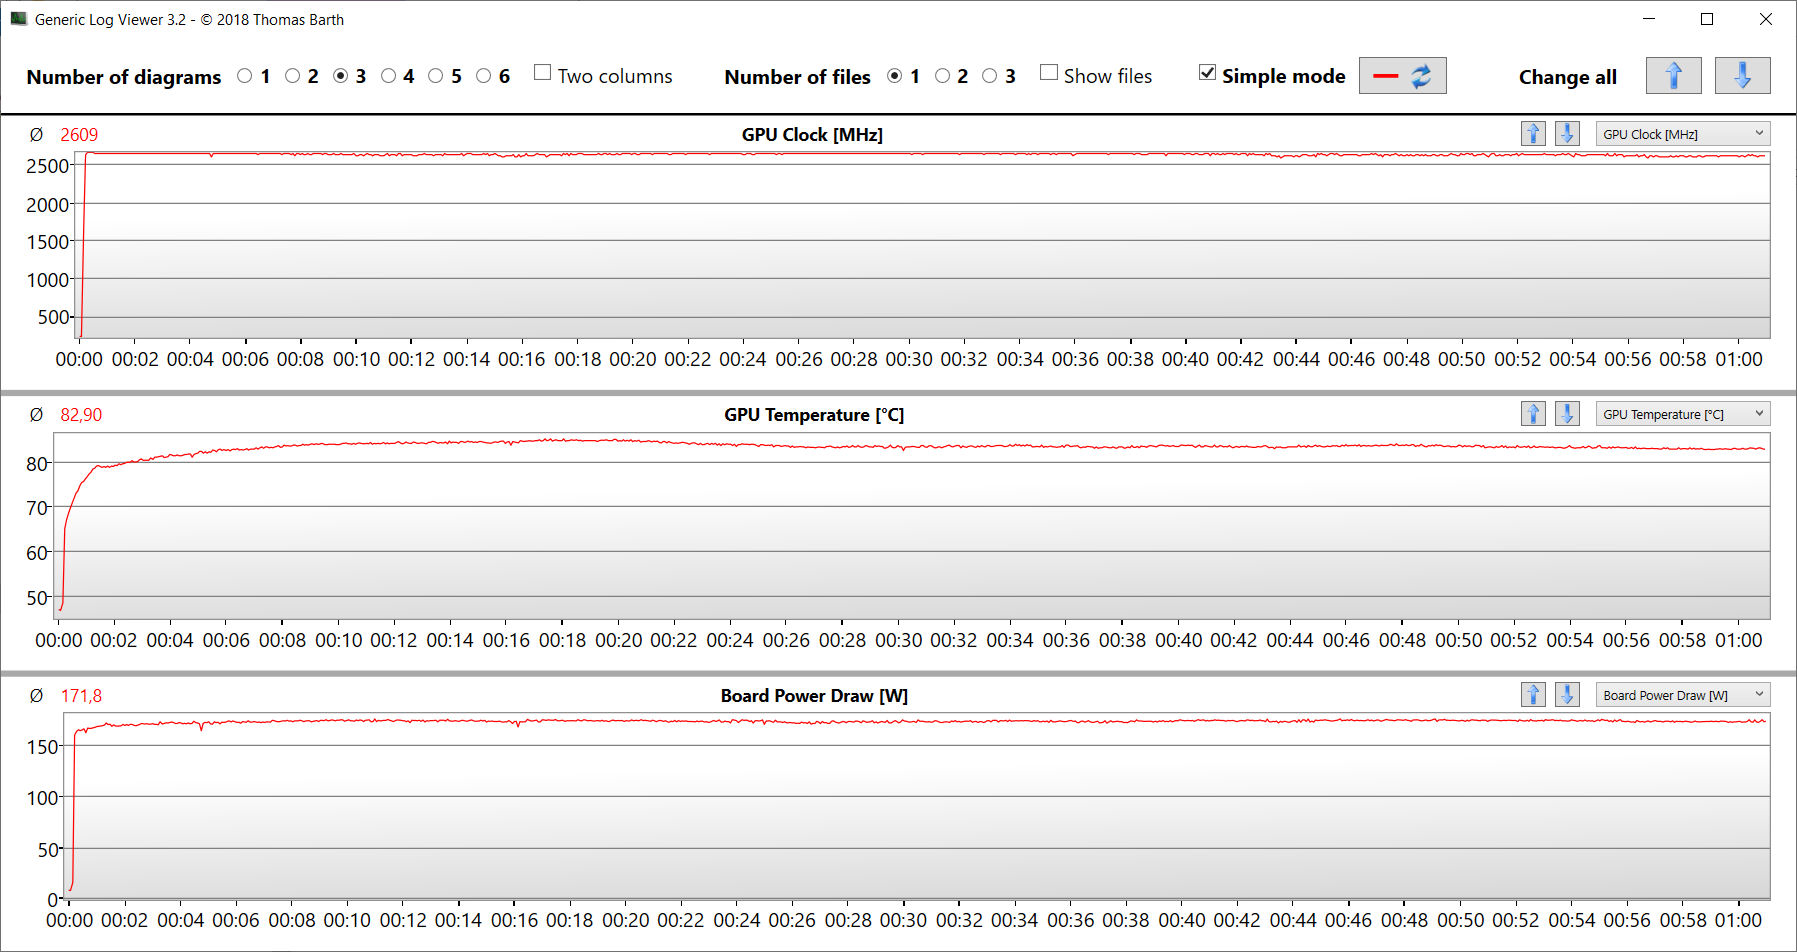
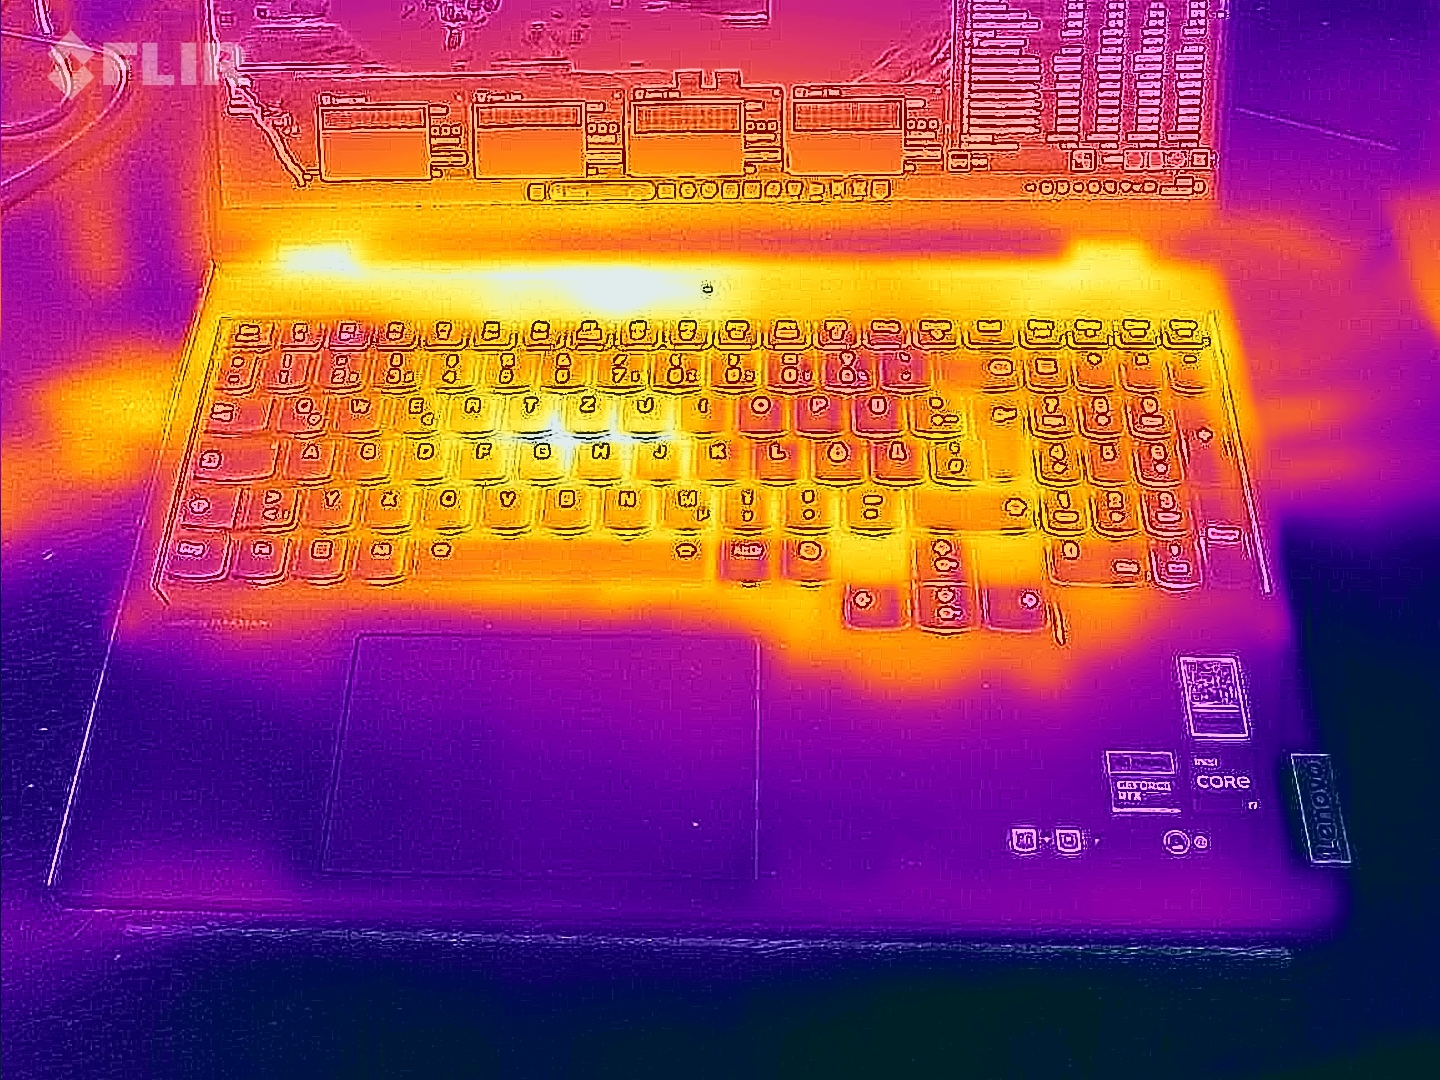
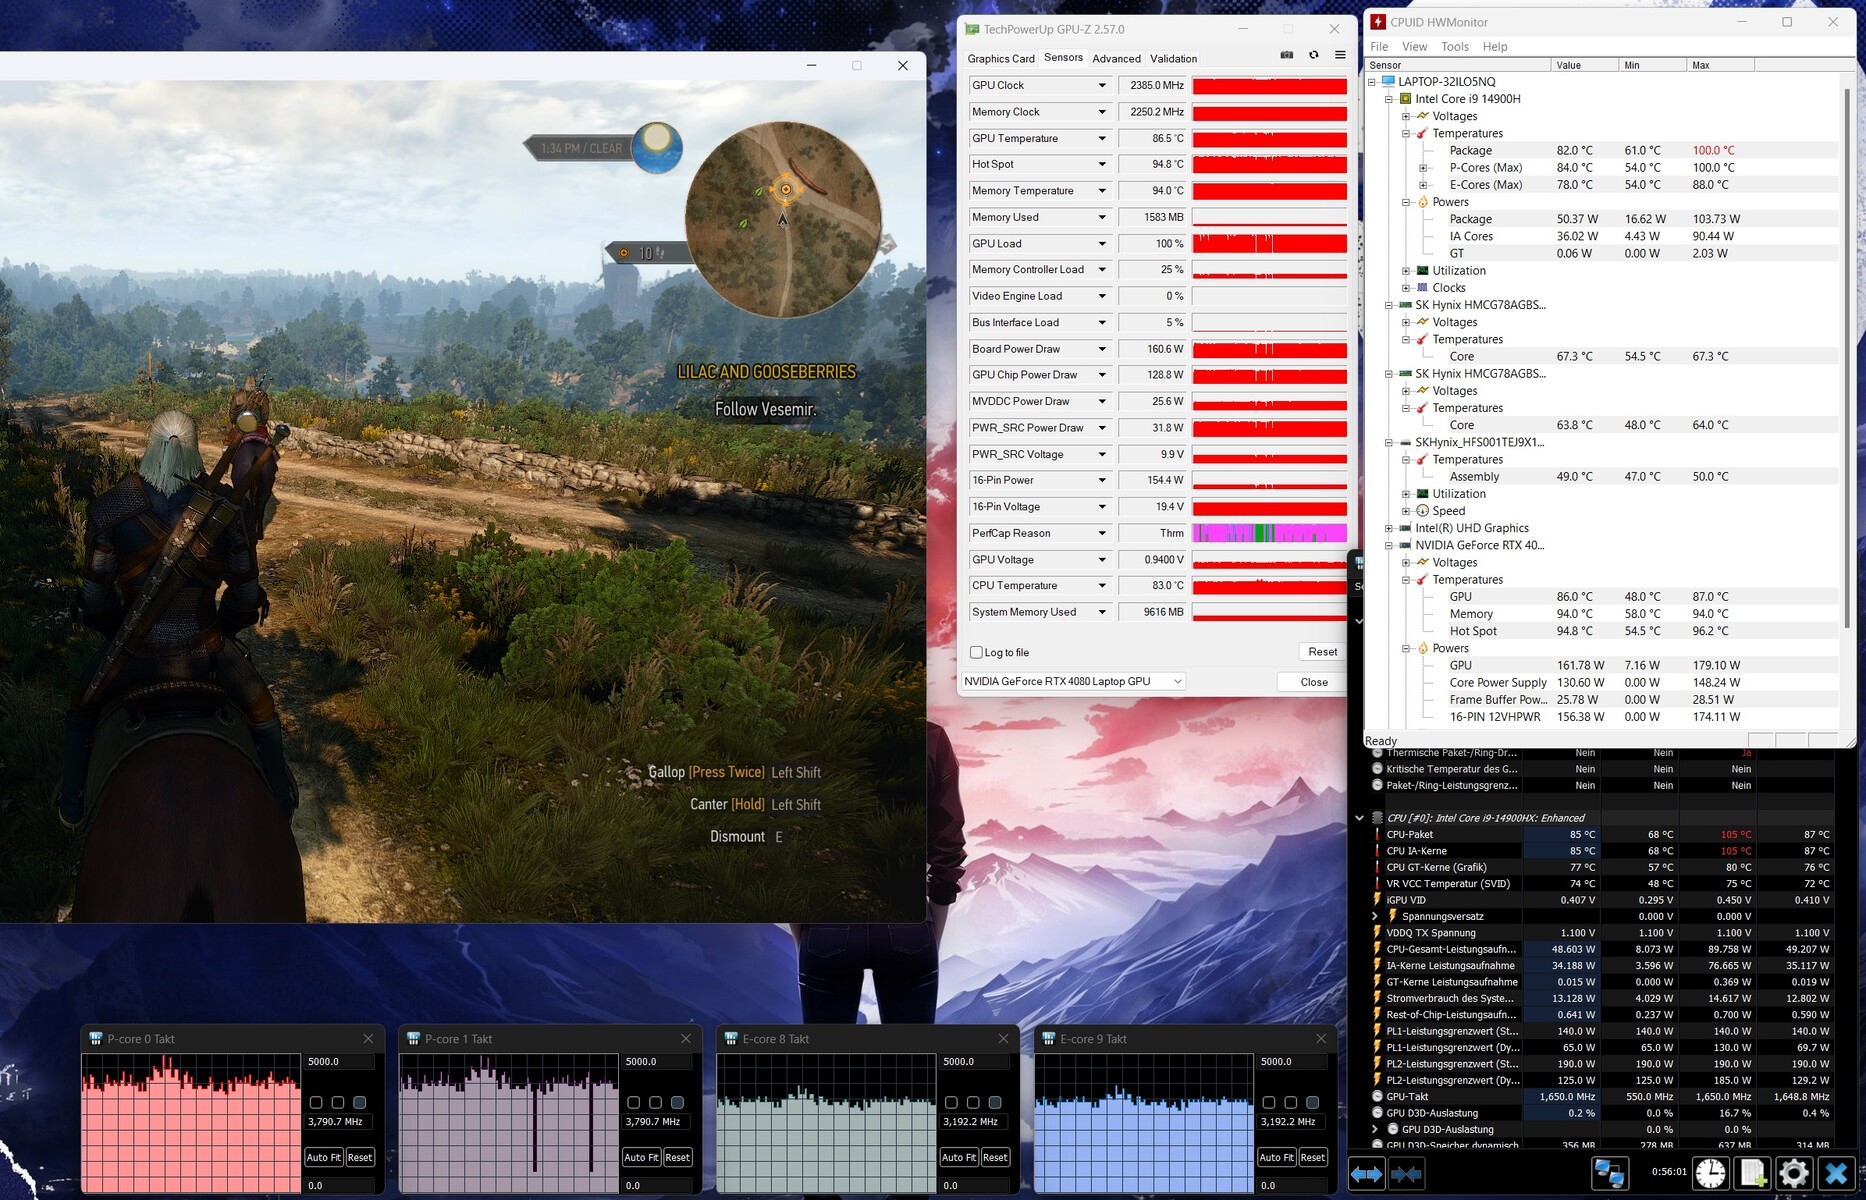
Den bärbara datorn blev märkbart varmare under stresstestet och Witcher 3 -testet. På vissa ställen på chassit översteg temperaturen till och med 50°C (122°F). Chassitemperaturen höll sig inom ett behagligt intervall vid daglig användning, t.ex. kontorsprogram och surfning på Internet.
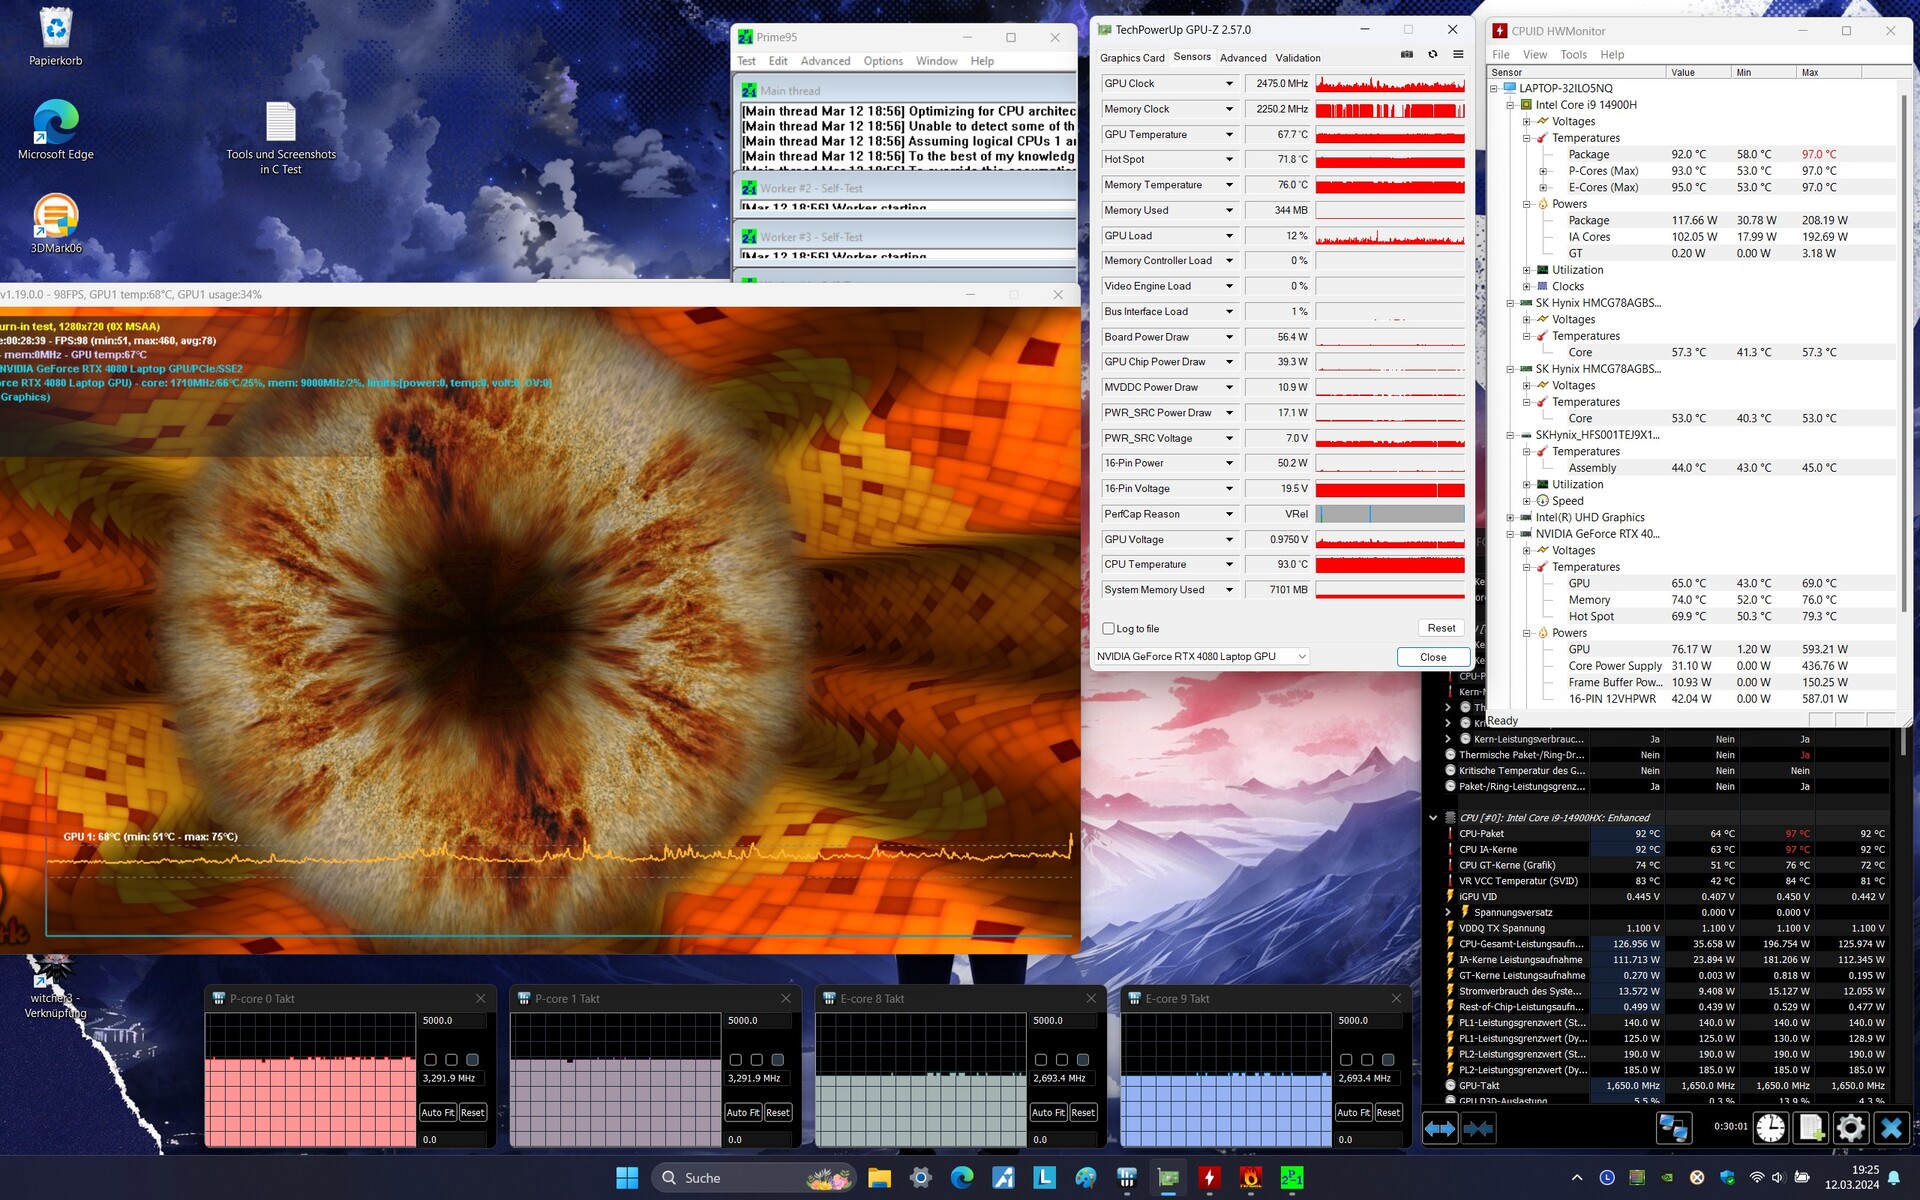
Vårt stresstest innebär att Prime95 och FurMark körs samtidigt under en längre period och är utformat för att avgöra ett systems stabilitet under full belastning. Både CPU och GPU kunde bibehålla höga klockhastigheter under testet.
(-) Den maximala temperaturen på ovansidan är 46 °C / 115 F, jämfört med genomsnittet av 40.4 °C / 105 F , allt från 21.2 till 68.8 °C för klassen Gaming.
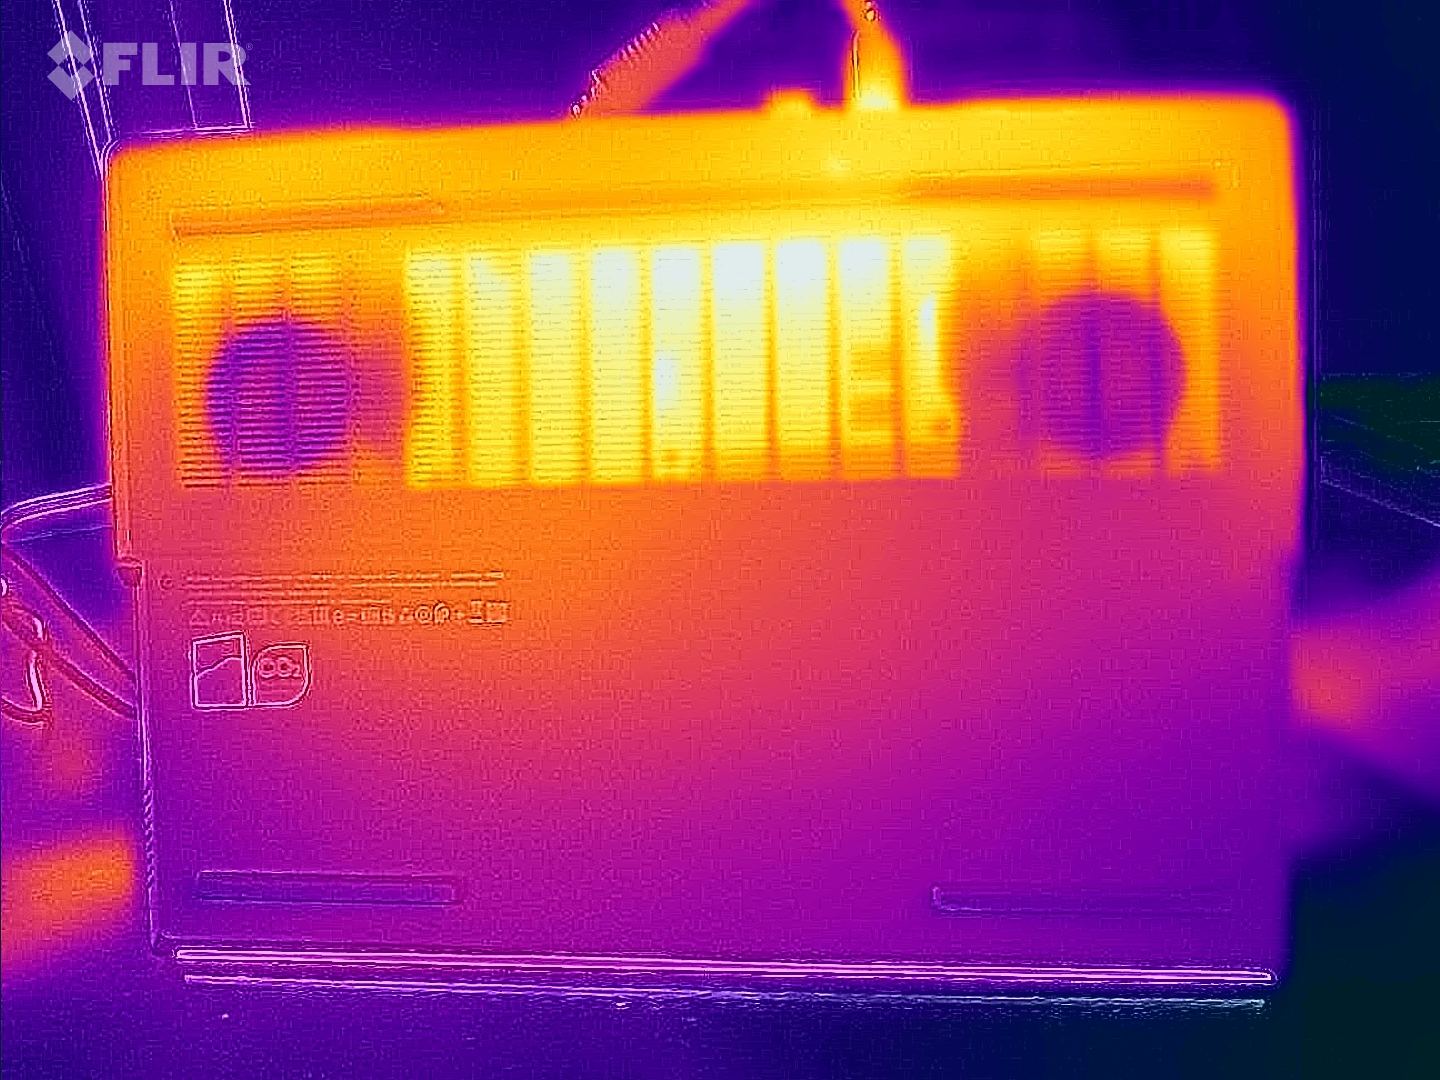
(-) Botten värms upp till maximalt 49 °C / 120 F, jämfört med genomsnittet av 43.2 °C / 110 F
(±) Vid tomgångsbruk är medeltemperaturen för ovansidan 33.3 °C / 92 F, jämfört med enhetsgenomsnittet på 33.9 °C / ### class_avg_f### F.
(-) När du spelar The Witcher 3 är medeltemperaturen för ovansidan 42.7 °C / 109 F, jämfört med enhetsgenomsnittet på 33.9 °C / ## #class_avg_f### F.
(-) Handledsstöden och pekplattan kan bli väldigt varma vid beröring med maximalt 40 °C / 104 F.
(-) Medeltemperaturen för handledsstödsområdet på liknande enheter var 28.8 °C / 83.8 F (-11.2 °C / -20.2 F).
| Lenovo Legion Pro 7 16IRX9H i9-14900HX, GeForce RTX 4080 Laptop GPU | Alienware m16 R1 AMD R9 7845HX, GeForce RTX 4080 Laptop GPU | MSI Vector 16 HX A14V i9-14900HX, GeForce RTX 4080 Laptop GPU | HP Omen 16 (2024) i9-14900HX, GeForce RTX 4080 Laptop GPU | Lenovo Legion Pro 7 16IRX8H i9-13900HX, GeForce RTX 4080 Laptop GPU | |
|---|---|---|---|---|---|
| Heat | 5% | 26% | 12% | 1% | |
| Maximum Upper Side * (°C) | 46 | 48 -4% | 36.4 21% | 47 -2% | 48 -4% |
| Maximum Bottom * (°C) | 49 | 39 20% | 35.6 27% | 57 -16% | 49 -0% |
| Idle Upper Side * (°C) | 38 | 37 3% | 26.6 30% | 25 34% | 40 -5% |
| Idle Bottom * (°C) | 37 | 36.2 2% | 27 27% | 26 30% | 33 11% |
* ... mindre är bättre
Högtalare
Stereohögtalarna ger överlag ett bra ljud.
Lenovo Legion Pro 7 16IRX9H ljudanalys
(+) | högtalare kan spela relativt högt (84 dB)
Bas 100 - 315 Hz
(±) | reducerad bas - i genomsnitt 8.9% lägre än medianen
(±) | linjäriteten för basen är genomsnittlig (7.4% delta till föregående frekvens)
Mellan 400 - 2000 Hz
(+) | balanserad mellan - endast 2.8% från medianen
(+) | mids är linjära (4% delta till föregående frekvens)
Högsta 2 - 16 kHz
(+) | balanserade toppar - endast 3% från medianen
(+) | toppar är linjära (5% delta till föregående frekvens)
Totalt 100 - 16 000 Hz
(+) | det totala ljudet är linjärt (8.4% skillnad mot median)
Jämfört med samma klass
» 2% av alla testade enheter i den här klassen var bättre, 1% liknande, 97% sämre
» Den bästa hade ett delta på 6%, genomsnittet var 18%, sämst var 132%
Jämfört med alla testade enheter
» 2% av alla testade enheter var bättre, 1% liknande, 97% sämre
» Den bästa hade ett delta på 4%, genomsnittet var 24%, sämst var 134%
HP Omen 16 (2024) ljudanalys
(±) | högtalarljudstyrkan är genomsnittlig men bra (78 dB)
Bas 100 - 315 Hz
(-) | nästan ingen bas - i genomsnitt 15.2% lägre än medianen
(±) | linjäriteten för basen är genomsnittlig (14.3% delta till föregående frekvens)
Mellan 400 - 2000 Hz
(+) | balanserad mellan - endast 4.8% från medianen
(+) | mids är linjära (5% delta till föregående frekvens)
Högsta 2 - 16 kHz
(+) | balanserade toppar - endast 2% från medianen
(+) | toppar är linjära (4.1% delta till föregående frekvens)
Totalt 100 - 16 000 Hz
(+) | det totala ljudet är linjärt (14.7% skillnad mot median)
Jämfört med samma klass
» 28% av alla testade enheter i den här klassen var bättre, 7% liknande, 64% sämre
» Den bästa hade ett delta på 6%, genomsnittet var 18%, sämst var 132%
Jämfört med alla testade enheter
» 19% av alla testade enheter var bättre, 4% liknande, 77% sämre
» Den bästa hade ett delta på 4%, genomsnittet var 24%, sämst var 134%
Strömförbrukning
Det finns inga överraskningar när det gäller strömförbrukningen. Användningsnivåerna ligger på en typisk nivå för den inbyggda hårdvaran. Legion Pro 7 klarade vårt Witcher 3 -test och stresstest med en konsekvent nivå av strömförbrukning. Den medföljande 330-wattsladdaren är tillräckligt kraftfull för den bärbara datorn.
| Av/Standby | |
| Låg belastning | |
| Hög belastning |
|
Förklaring:
min: | |
Power consumption Witcher 3 / Stress test
Power consumption with external monitor
Batteriets livslängd
Den 16-tums bärbara datorn klarade 6h 13min i vårt realistiska Wi-Fi-test, som simulerar en belastning genom åtkomst till webbplatser med hjälp av ett skript. Legion har den bästa batteritiden bland alla enheter i vår jämförelse.
För
Emot
Omdöme - Potent bärbar dator i high-end

Med Legion Pro 7 har Lenovo levererat en kraftfull 16-tums notebook för gamers och kreatörer. Den bärbara datorn har en passande 16-tums QHD+-skärm (2 560 x 1 600 pixlar, DCI-P3, G-Sync, HDR, 240 Hz) med ett arbetsvänligt 16:10-bildförhållande.
Lenovo Legion Pro 7 16IRX9H erbjuder mycket kraft till ett rimligt pris.
GeForce RTX 4080 och Core i9-14900HX inuti lyckades uppnå sina nya bästa resultat i några av testerna - båda chipen kan utan tvekan köras på full gas konstant. Det går inte att komma runt den höga värmeutvecklingen och bullret som är vanligt i den här klassen av bärbara datorer. Det finns dock ett tyst läge för att lindra detta - på bekostnad av prestanda.
Två USB-C-portar (1x Thunderbolt 4, 1x USB 3.2 Gen 2) gör det enklare för dig att integrera den bärbara datorn i en befintlig arbetsinstallation och öppnar upp för expansionsalternativ (t.ex. extern GPU, dockor). Båda portarna kan mata ut en DisplayPort-signal, och en av dem har även stöd för Power Delivery. Batteritiden är ganska anständig.
MSI Vector 16 HX A14V är ett alternativ som är värt att överväga. Den är i nivå med Legion prestandamässigt, men har en något sämre batteritid.
Pris och tillgänglighet
I Europa är Lenovo Legion Pro 7-modellen som visas här tillgänglig från 2 999 € (3 245 USD) Campuspoint.de und Notebooksbilliger.de efter att ha räknat in särskilda rabatter för studenter och lärare.
Den nya Legion Pro 7 finns ännu inte tillgänglig i USA, men föregångaren kan köpas för ca 2 490 USD på Amazon US. Just den här modellen har en Core i9-13900HX av den senaste generationen, men är i övrigt i stort sett densamma.
Lenovo Legion Pro 7 16IRX9H
- 03/25/2024 v7 (old)
Sascha Mölck
Genomskinlighet
Valet av enheter som ska granskas görs av vår redaktion. Testprovet gavs till författaren som ett lån av tillverkaren eller återförsäljaren för denna recension. Långivaren hade inget inflytande på denna recension och inte heller fick tillverkaren en kopia av denna recension innan publiceringen. Det fanns ingen skyldighet att publicera denna recension. Som ett oberoende medieföretag är Notebookcheck inte föremål för auktoritet från tillverkare, återförsäljare eller förlag.
This is how Notebookcheck is testingEvery year, Notebookcheck independently reviews hundreds of laptops and smartphones using standardized procedures to ensure that all results are comparable. We have continuously developed our test methods for around 20 years and set industry standards in the process. In our test labs, high-quality measuring equipment is utilized by experienced technicians and editors. These tests involve a multi-stage validation process. Our complex rating system is based on hundreds of well-founded measurements and benchmarks, which maintains objectivity.
Price comparison

