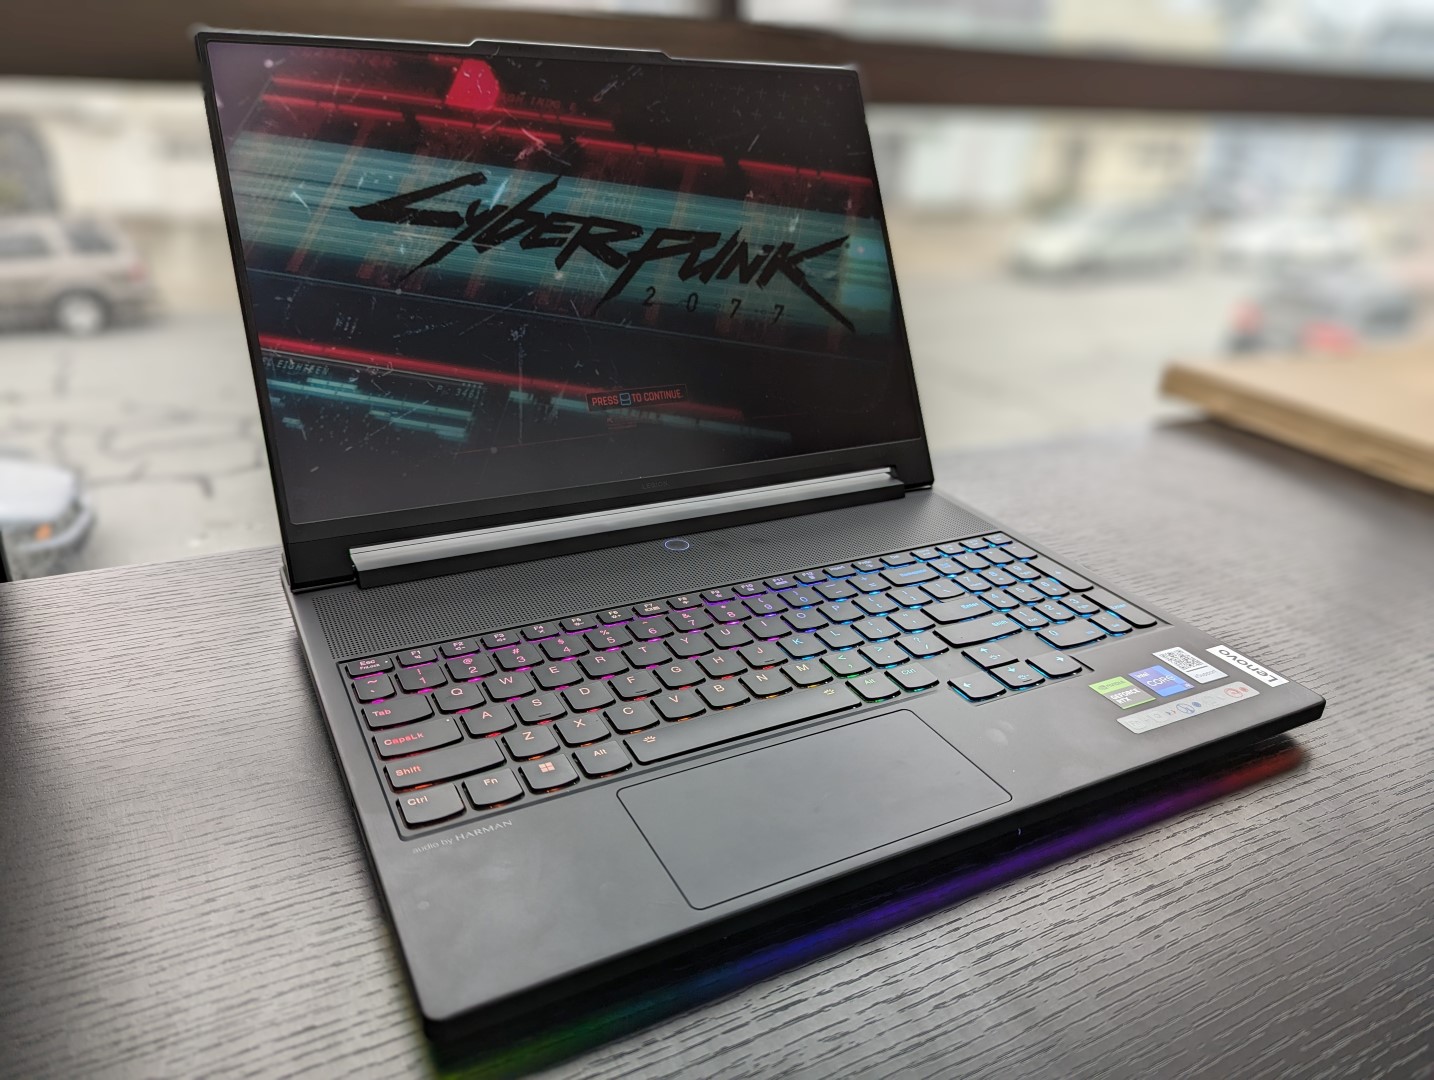
Legion 9i Gen 8 16IRX8 recension: Lenovos mest ambitiösa bärbara speldator hittills

Avtäcktes för bara några veckor sedan på IFA 2023är nya Legion 9i 16 den mest avancerade Legion -modellen som finns tillgänglig, och överträffar Legion 5-serien i mellanklassen och Legion 7-serien i den övre mellanklassen. Det är den första Legion 9-produkten på flera år efter den mediokra Legion Y920 år 2017. Den senaste modellen utmärker sig med sin mini-LED-display och integrerade termiska vätskekylare.
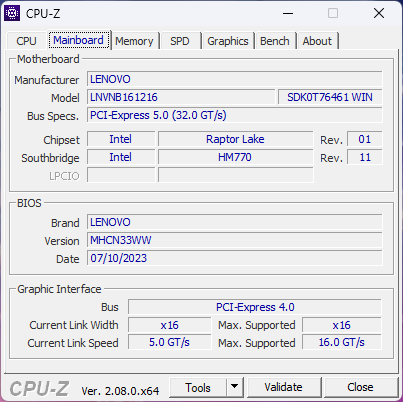
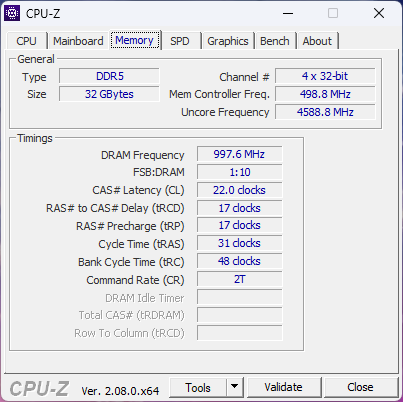
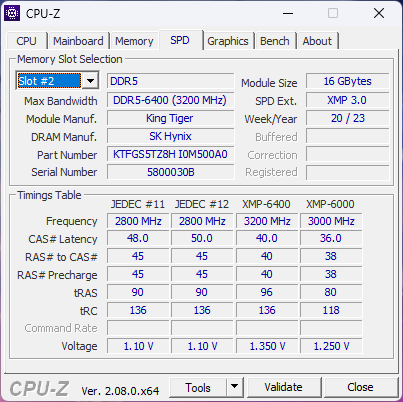
Vår granskningsenhet har konfigurerats med allt och diskbänken för att inkludera en 13:e generationens Core i9-13980HX CPU, 175 W GeForce RTX 4090 GPU, 1 TB PCIe4 x4 NVMe SSD i RAID 0 och 3,2K (3200 x 2000) mini-LED 165 Hz skärm med DCI-P3 färger för strax under $4000 USD i detaljhandeln. Alla alternativ levereras för närvarande med samma Core i9-processor och mini-LED-skärm medan endast GPU:n kan konfigureras ner till RTX 4080.
Alternativ till Legion 9i 16 inkluderar andra 16-tums bärbara speldatorer som Razer Blade 16, Asus ROG Strix G16, HP Omen Transcend 16och Alienware x16 R1.
Fler Lenovo recensioner:
Potentiella konkurrenter i jämförelse
Gradering | Datum | Modell | Vikt | Höjd | Storlek | Upplösning | Pris |
|---|---|---|---|---|---|---|---|
| 90.2 % v7 (old) | 10/2023 | Lenovo Legion 9 16IRX8 i9-13980HX, GeForce RTX 4090 Laptop GPU | 2.6 kg | 22.7 mm | 16.00" | 3200x2000 | |
| 87.7 % v7 (old) | 08/2023 | Lenovo Legion Slim 5 16APH8 R7 7840HS, GeForce RTX 4060 Laptop GPU | 2.4 kg | 25.2 mm | 16.00" | 2560x1600 | |
| 89.8 % v7 (old) | 03/2023 | Razer Blade 16 Early 2023 RTX 4090 i9-13950HX, GeForce RTX 4090 Laptop GPU | 2.5 kg | 21.99 mm | 16.00" | 3840x2400 | |
| 88.4 % v7 (old) | 03/2023 | Asus ROG Strix G16 G614JZ i9-13980HX, GeForce RTX 4080 Laptop GPU | 2.4 kg | 30.4 mm | 16.00" | 2560x1600 | |
| 87.9 % v7 (old) | 08/2023 | HP Omen Transcend 16 i9-13900HX, GeForce RTX 4070 Laptop GPU | 2.3 kg | 19.8 mm | 16.00" | 2560x1600 | |
| 88.4 % v7 (old) | 06/2023 | Alienware x16 R1 i9-13900HK, GeForce RTX 4080 Laptop GPU | 2.6 kg | 18.57 mm | 16.00" | 2560x1600 |
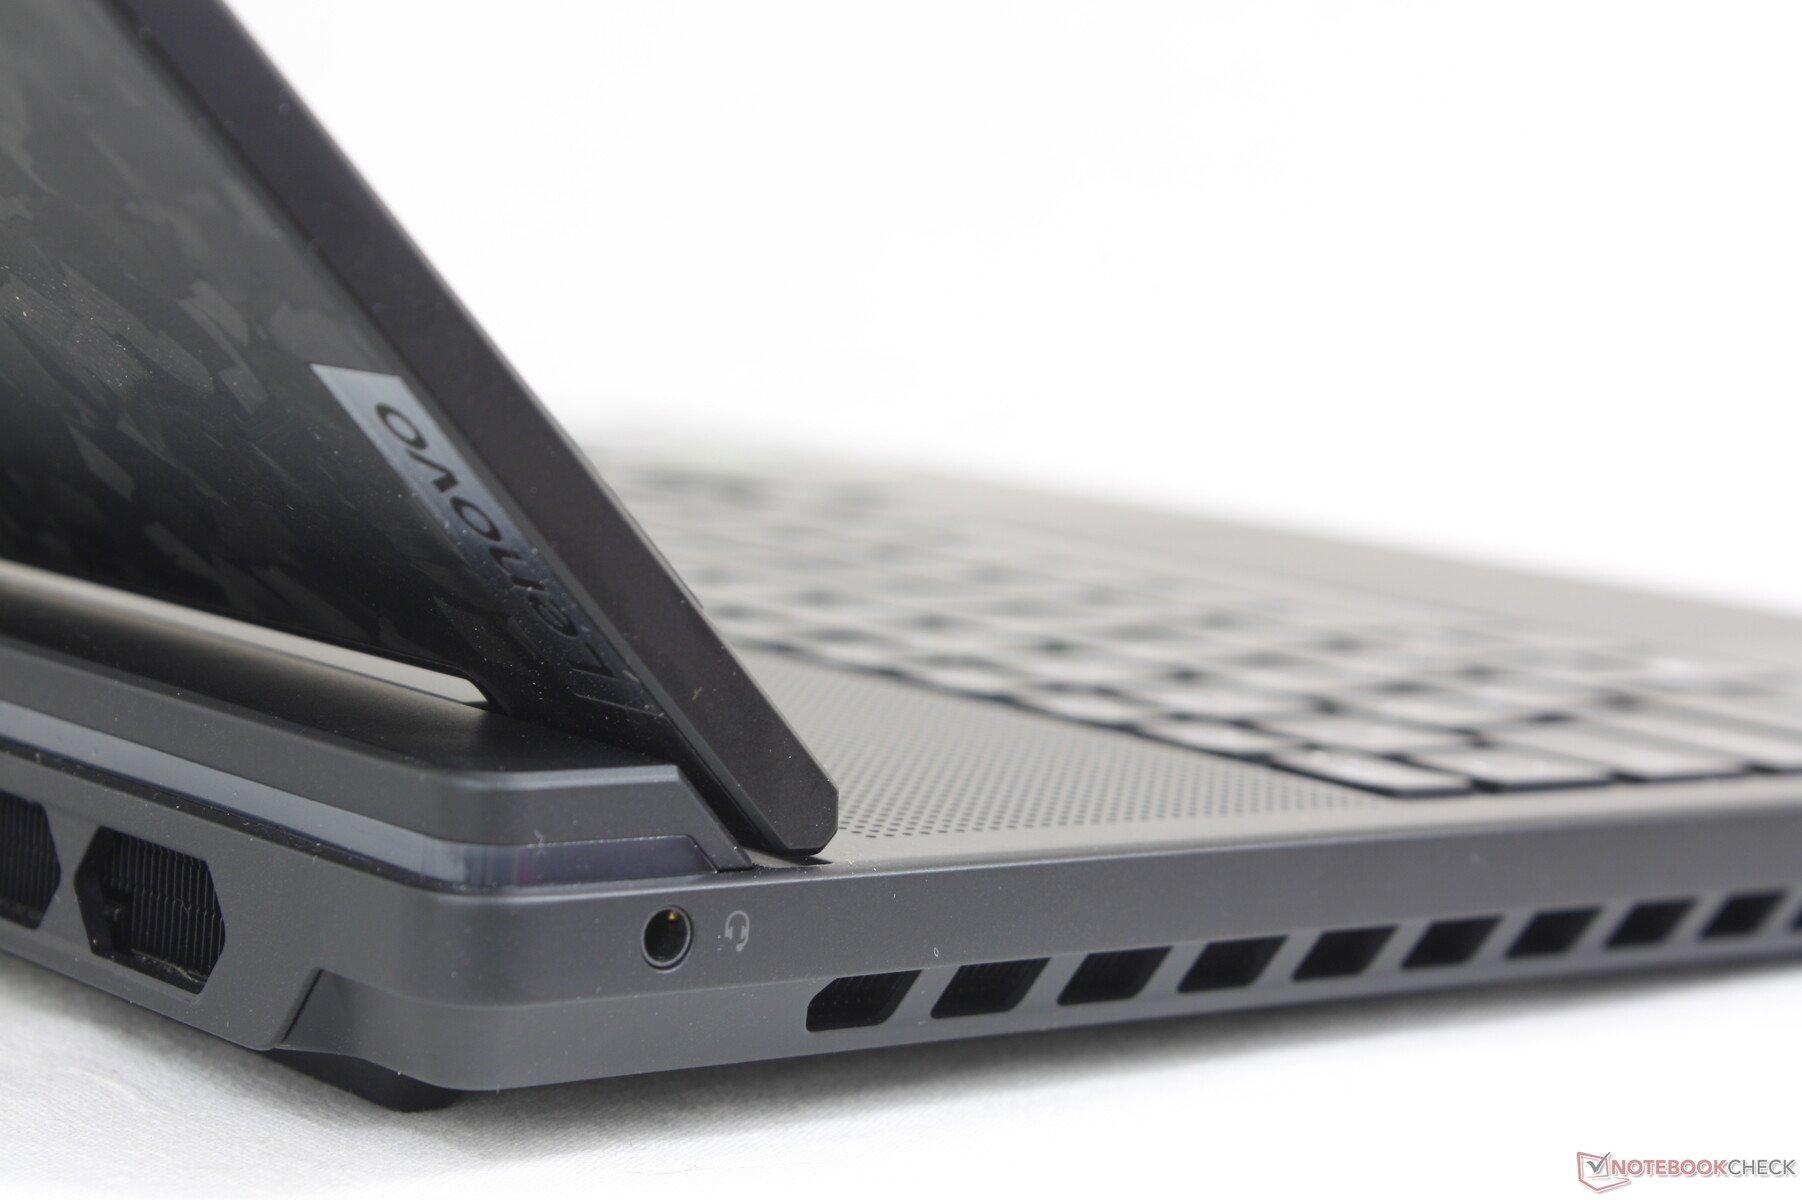
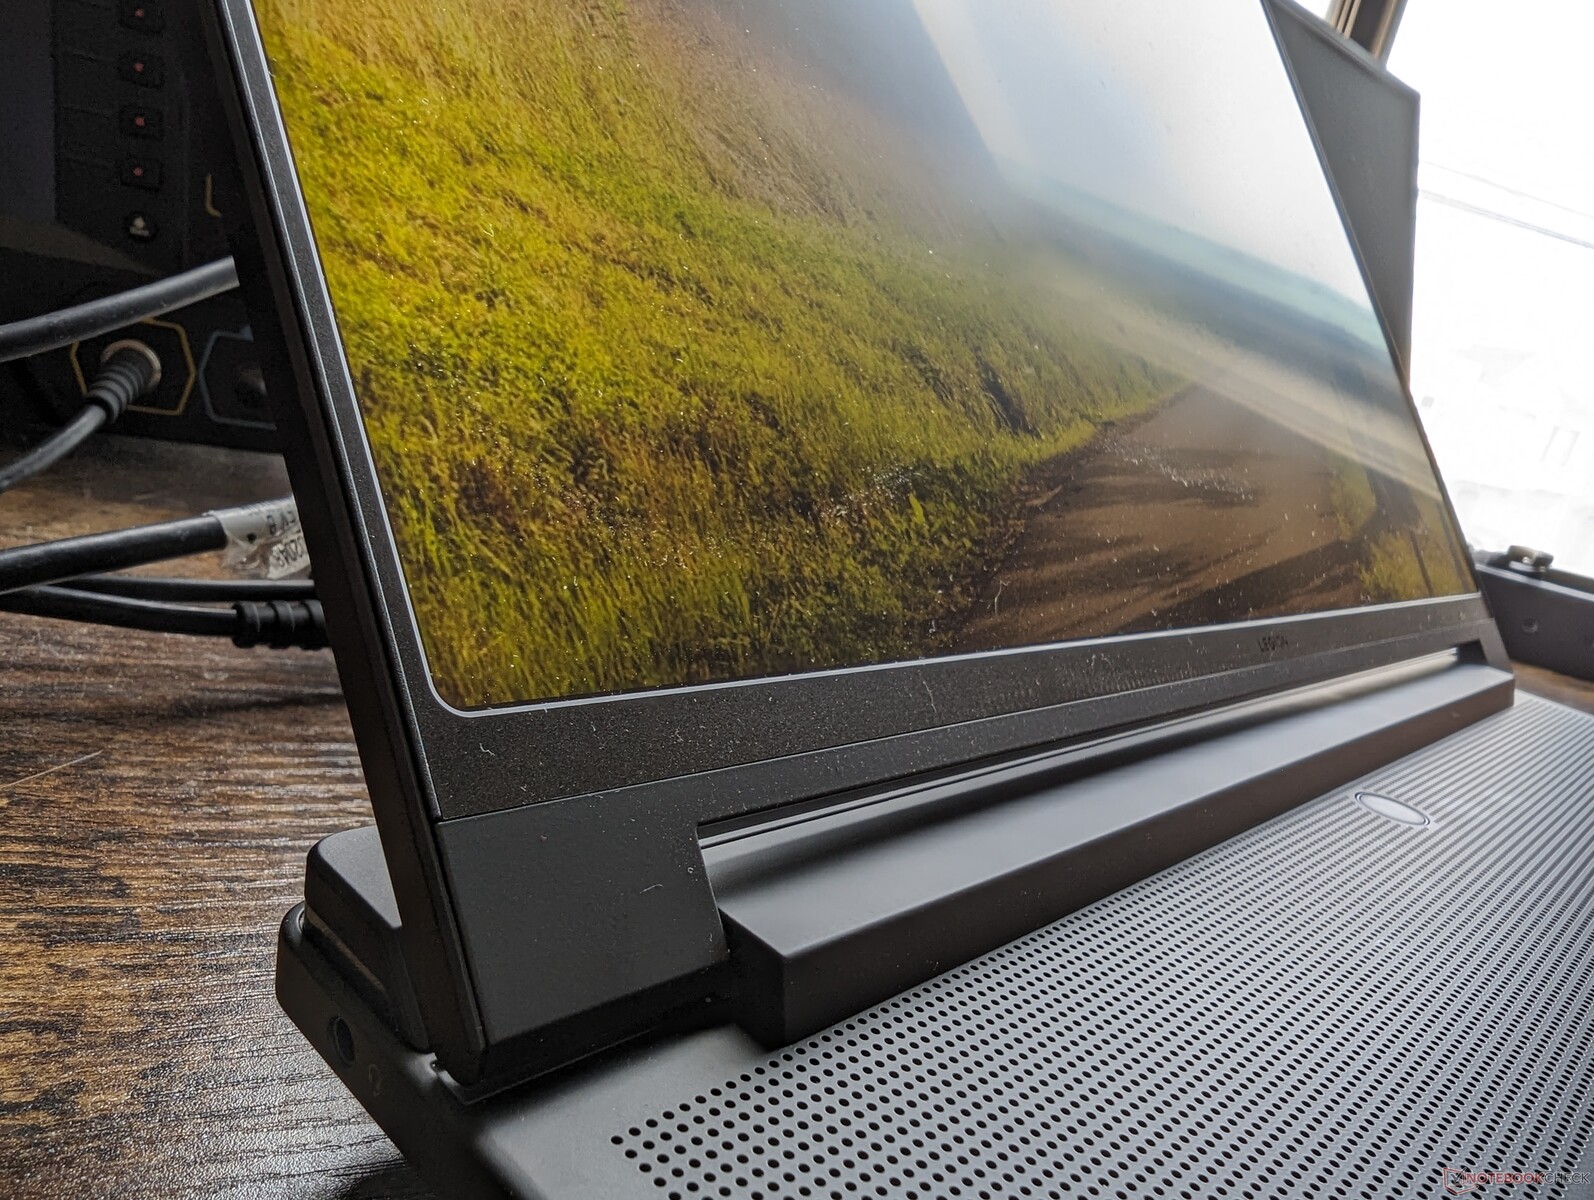
Case - En vidareutvecklad design Legion
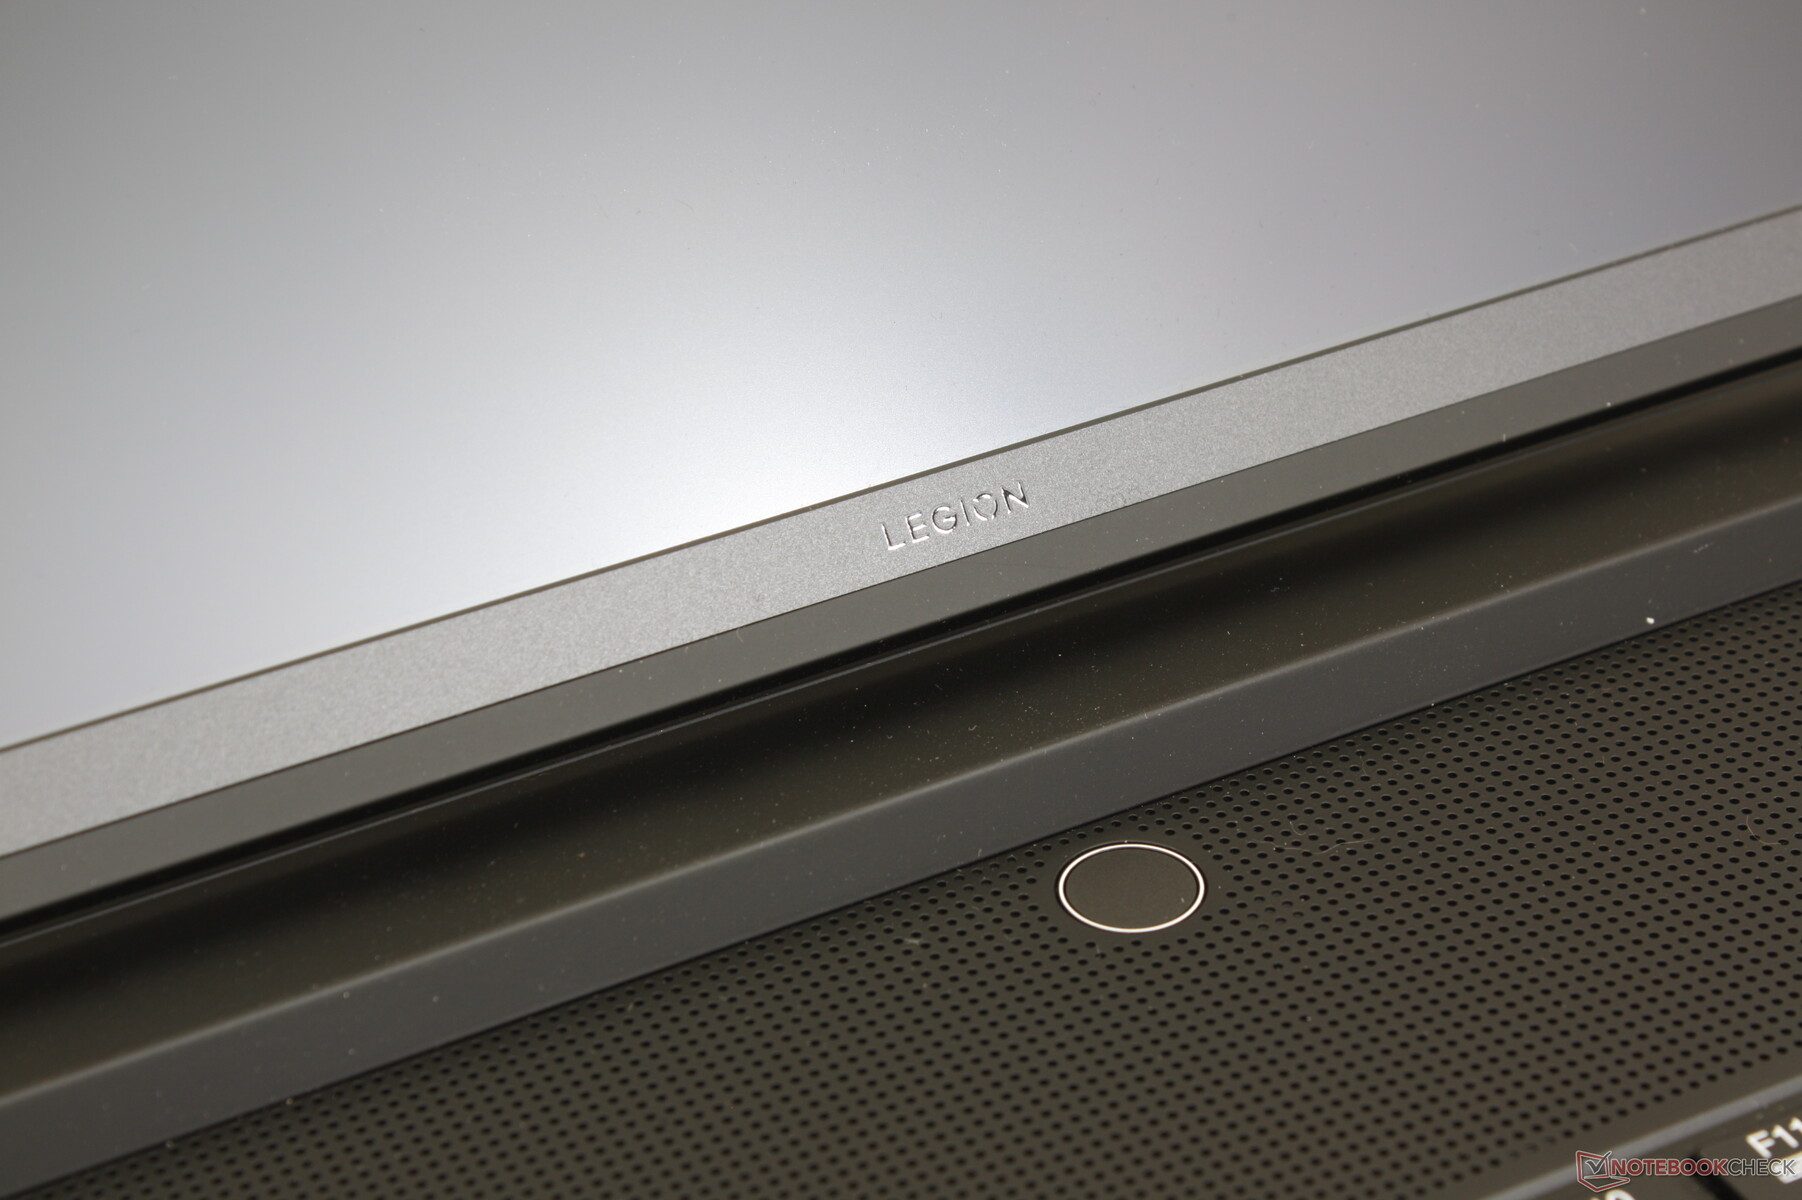
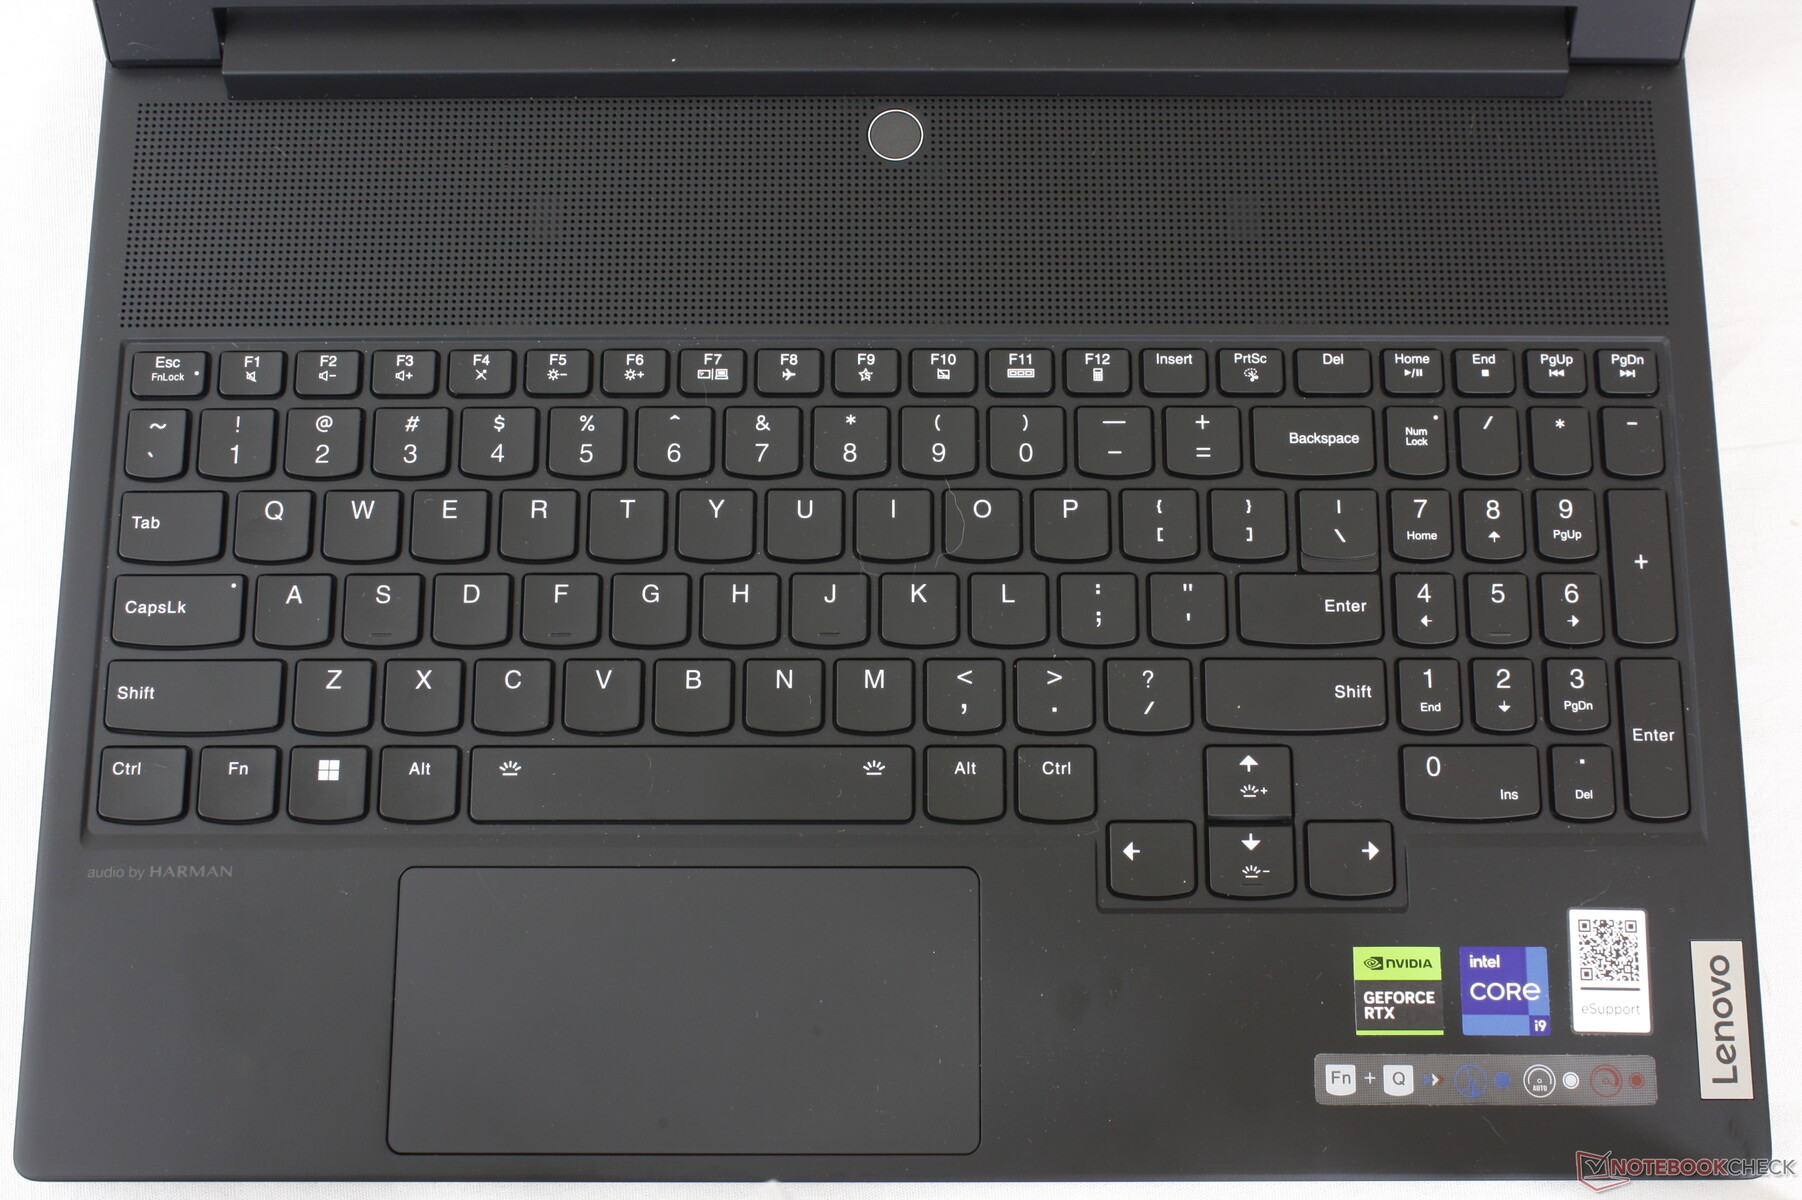
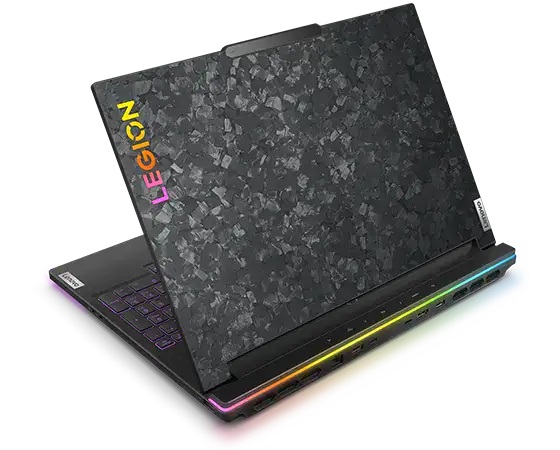
Legion 9i 16 använder liknande matta magnesiummaterial som på Legion 7-serien, men de är visuellt mycket olika. För det första har tangentbordet flyttats framåt för att komma närmare användaren, i likhet med Asus Zephyrus S GX531, för att ge plats åt fler ventilationsgaller och en större kyllösning. För det andra bidrar ett unikt kolfibermönster runt det yttre locket till att minska uppkomsten av fingeravtryck samtidigt som det bidrar till gamer-estetiken. Och slutligen har den utskjutande baksidan blivit tjockare för att bättre rymma alla interna förändringar och mer krävande hårdvara.
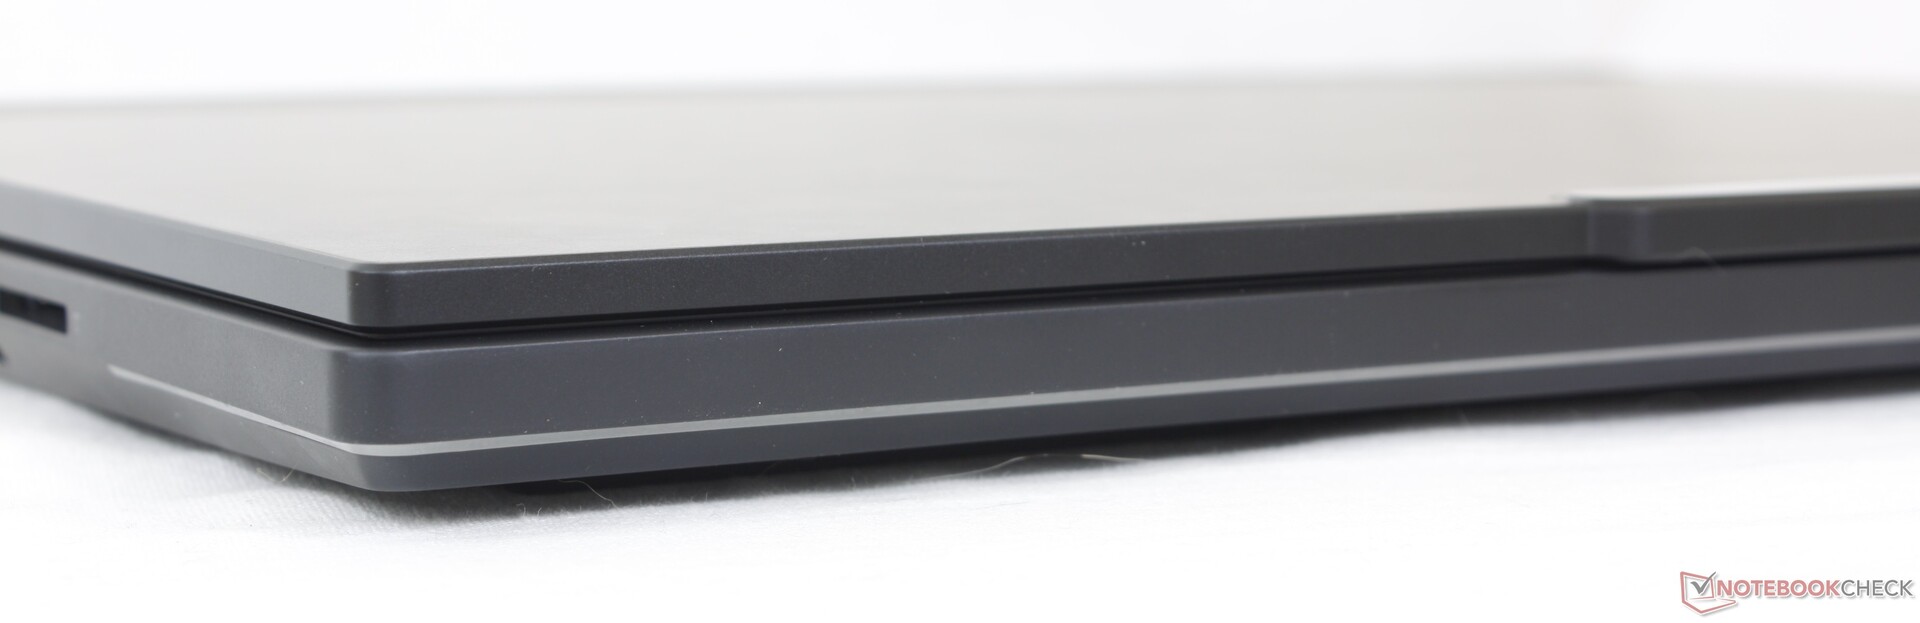
Chassikvaliteten är utmärkt med endast lite eftergivlighet när man försöker vrida locket eller trycka ned tangentbordets mittpunkt eller handledsstödet. Det känns inte bättre eller sämre än
Legion 7 16 eller Alienware x16 R1 när det gäller styvhet, särskilt eftersom de alla väger ungefär samma. Gångjärnen förblir dock relativt små jämfört med de mycket större gångjärnen i Asus Strix-serien eller den senasteMSI Raider GE68. De kan vara tillfredsställande när de är nya, men bara tiden kommer att visa hur bra de kommer att klara sig på lång sikt.
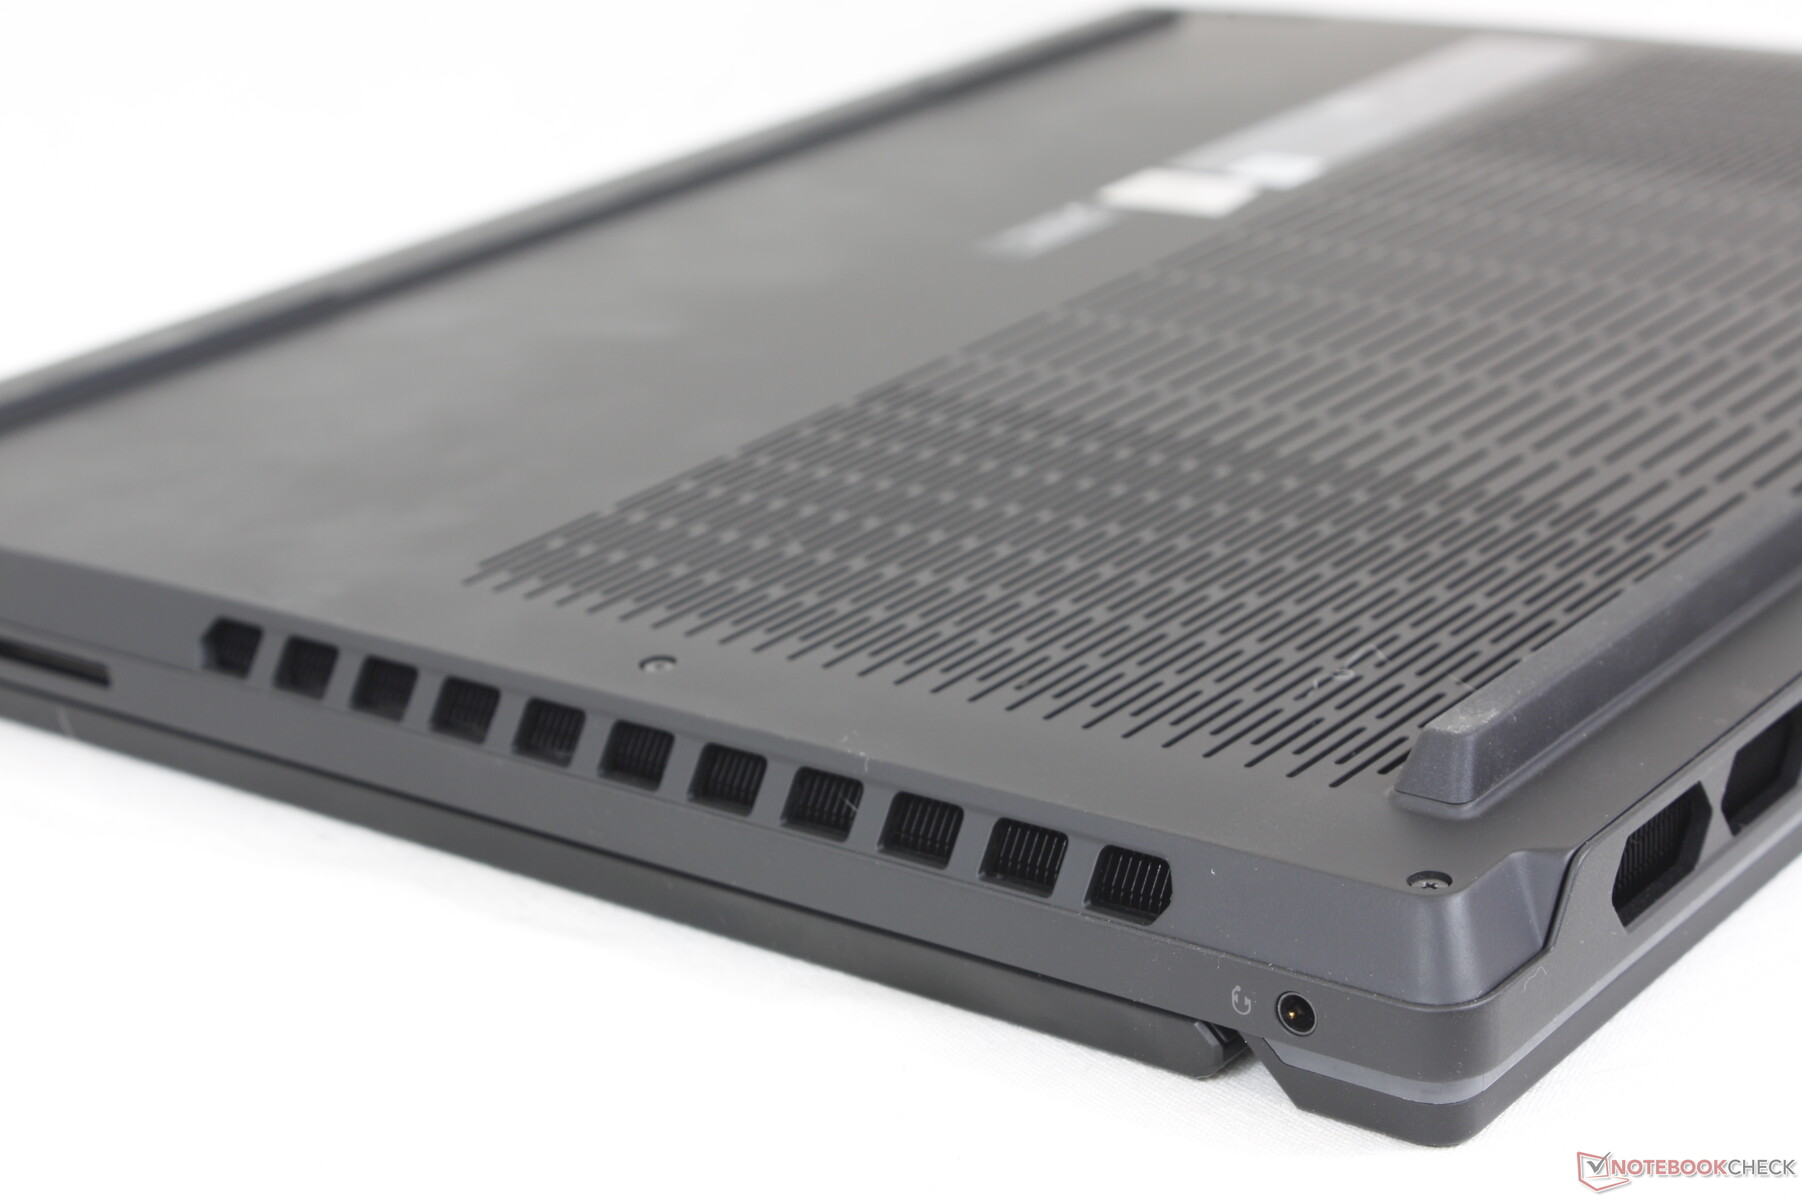
Den förlängda baksidan och de krävande Core i9/RTX 4090-internkretsarna har lett till ett större och tjockare chassi än Legion 7 16. Skillnaderna är märkbara eftersom Legion 9i 16 är större än många andra 16-tums bärbara speldatorer som ROG Strix G16, Blade 16eller Omen Transcend 16. Hög prestanda och avancerade funktioner går på bekostnad av bärbarheten i det här avseendet.
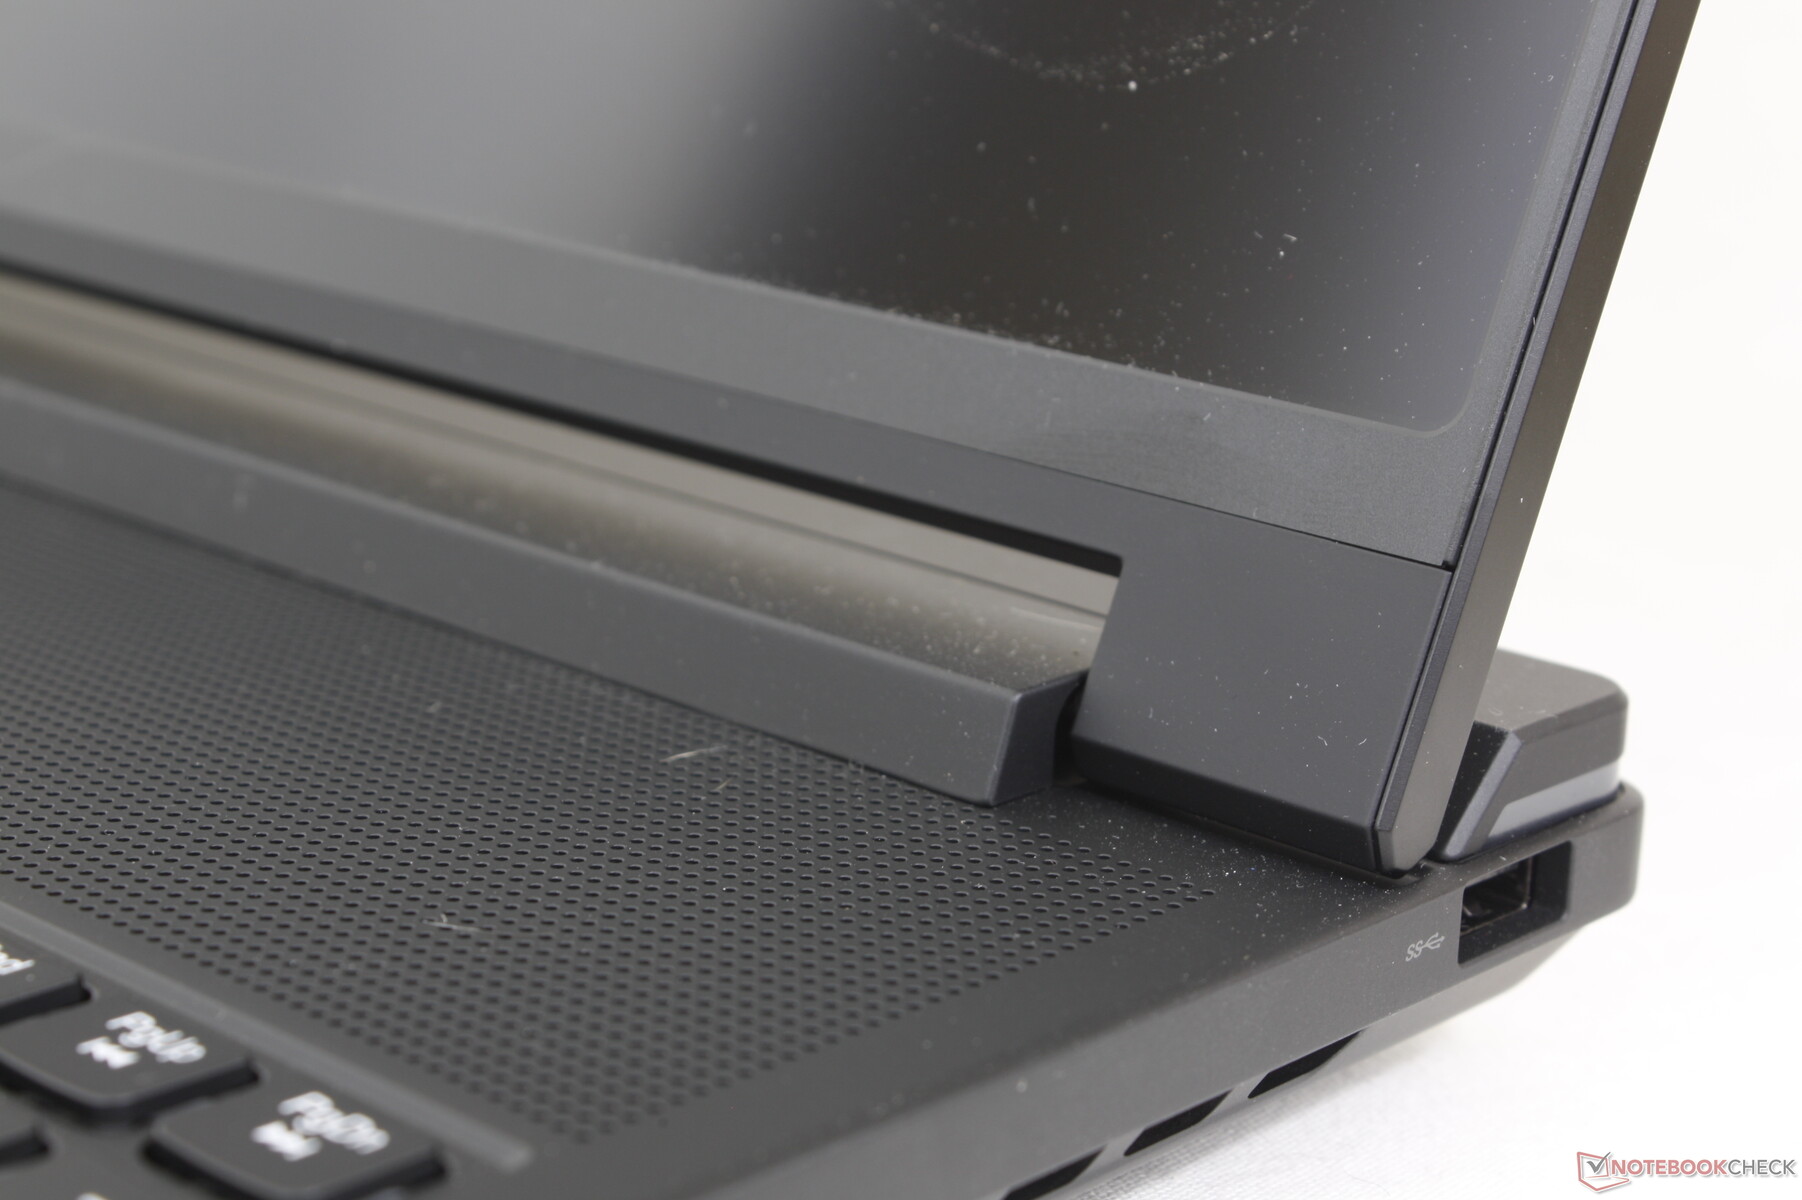
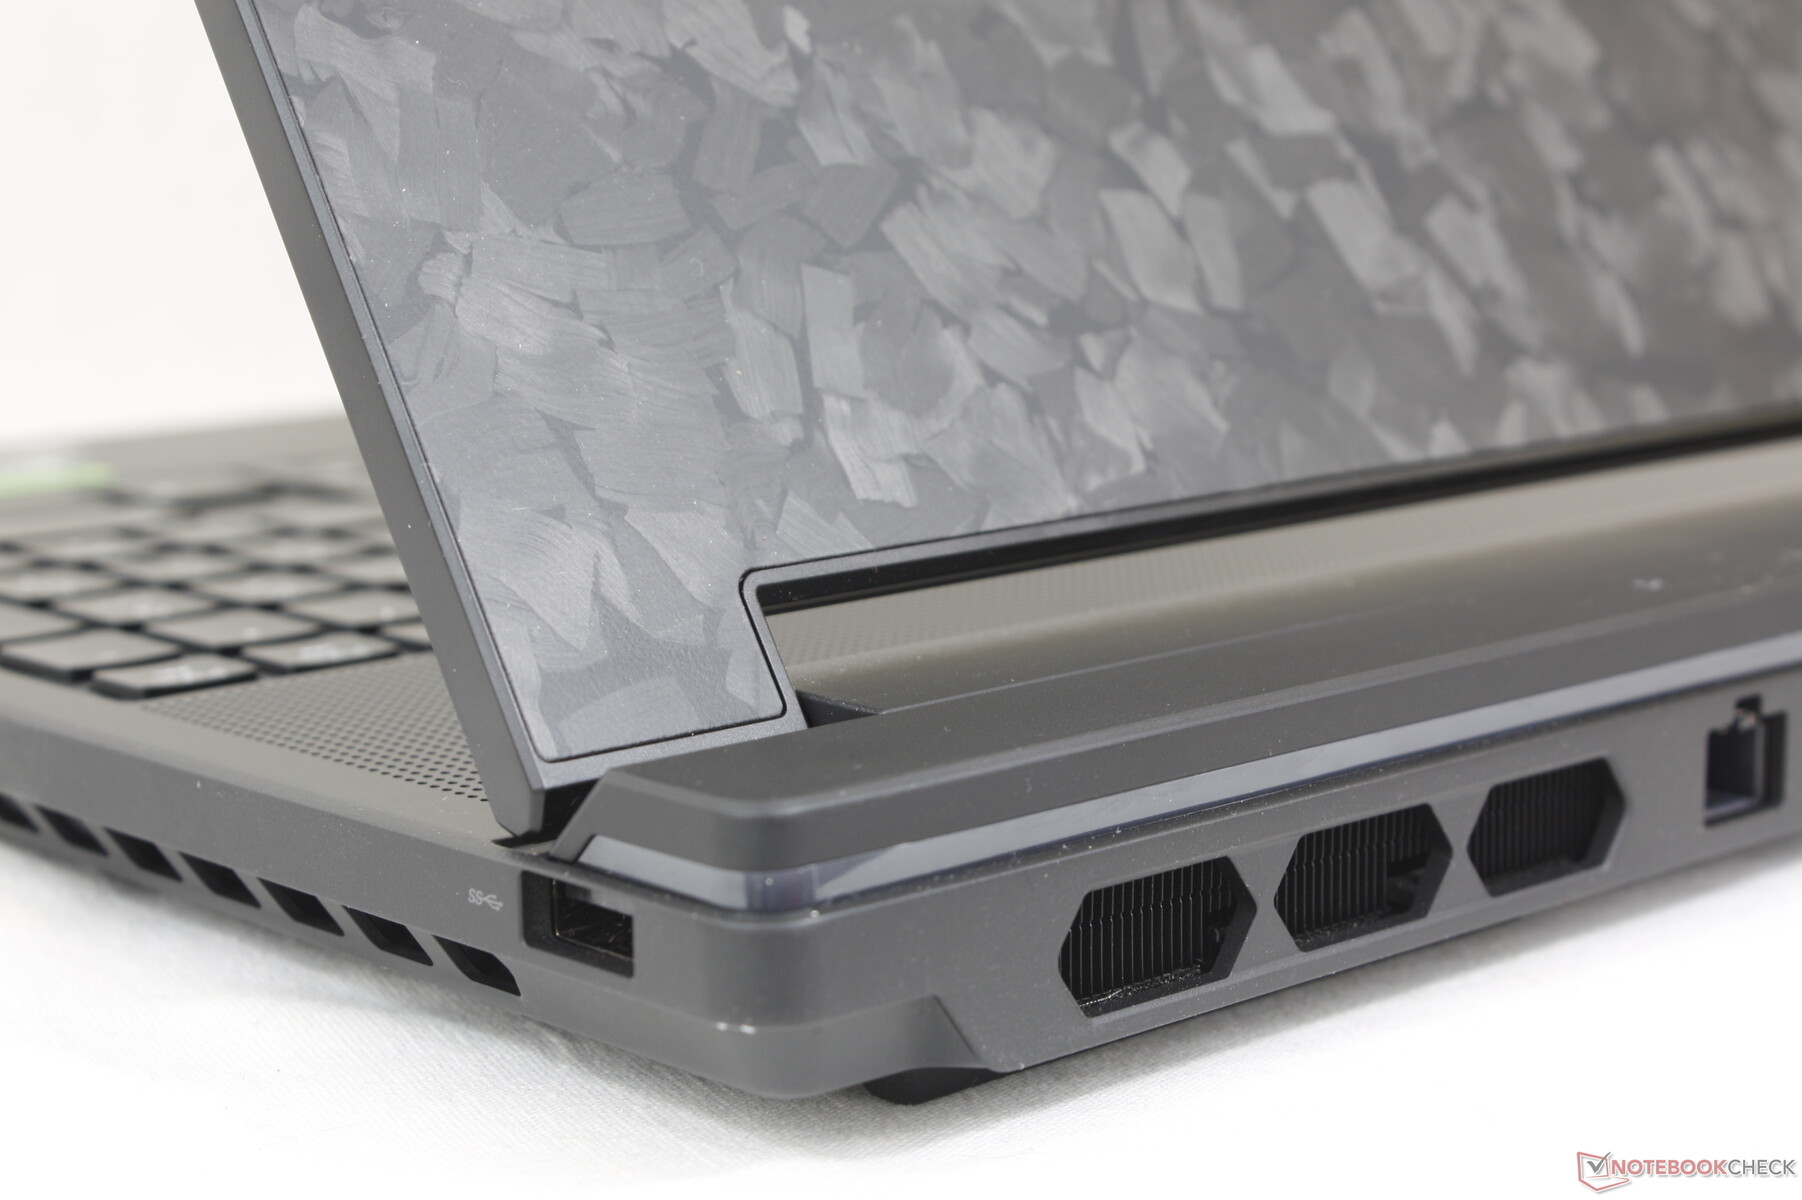
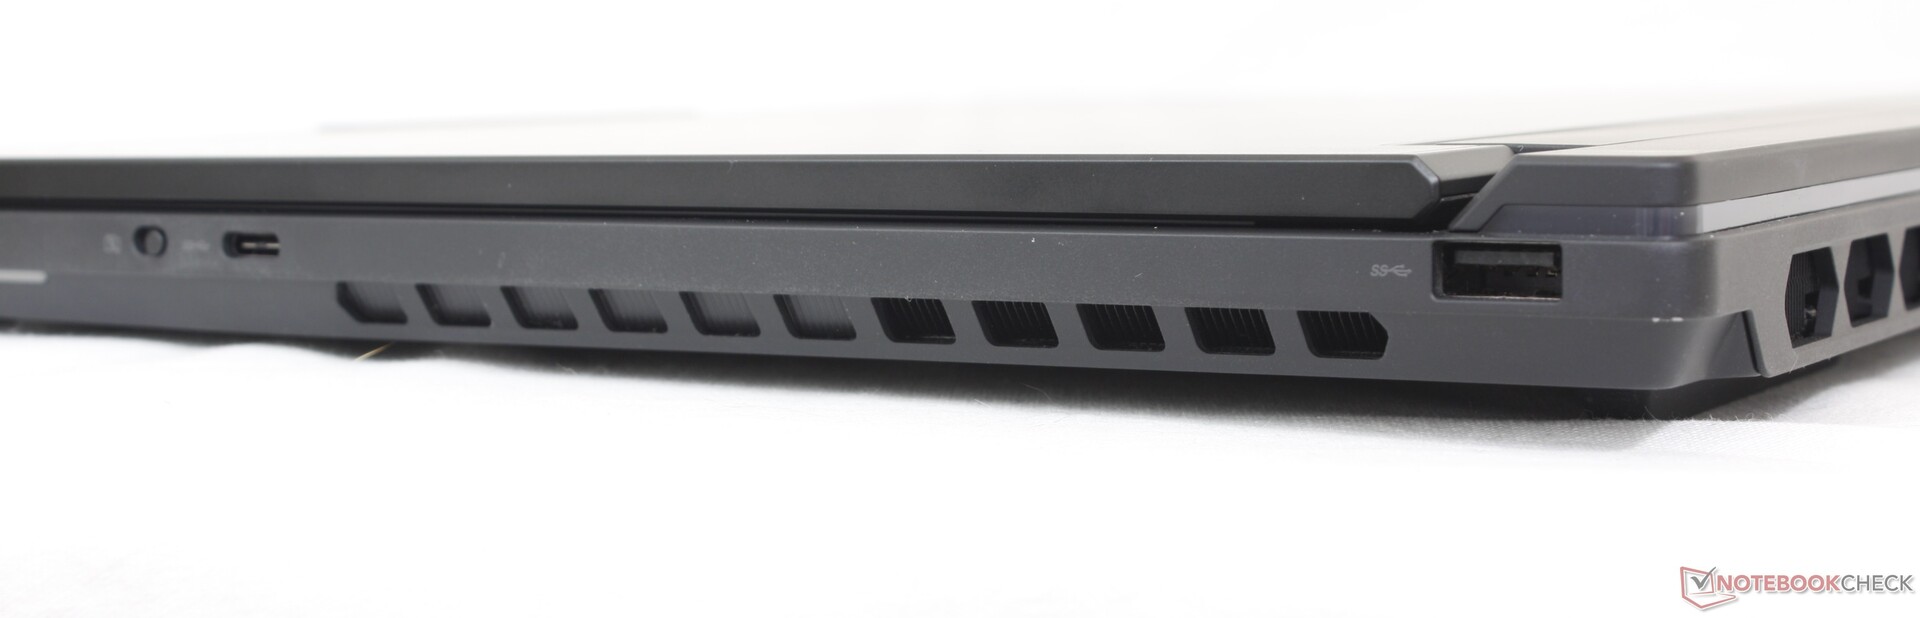
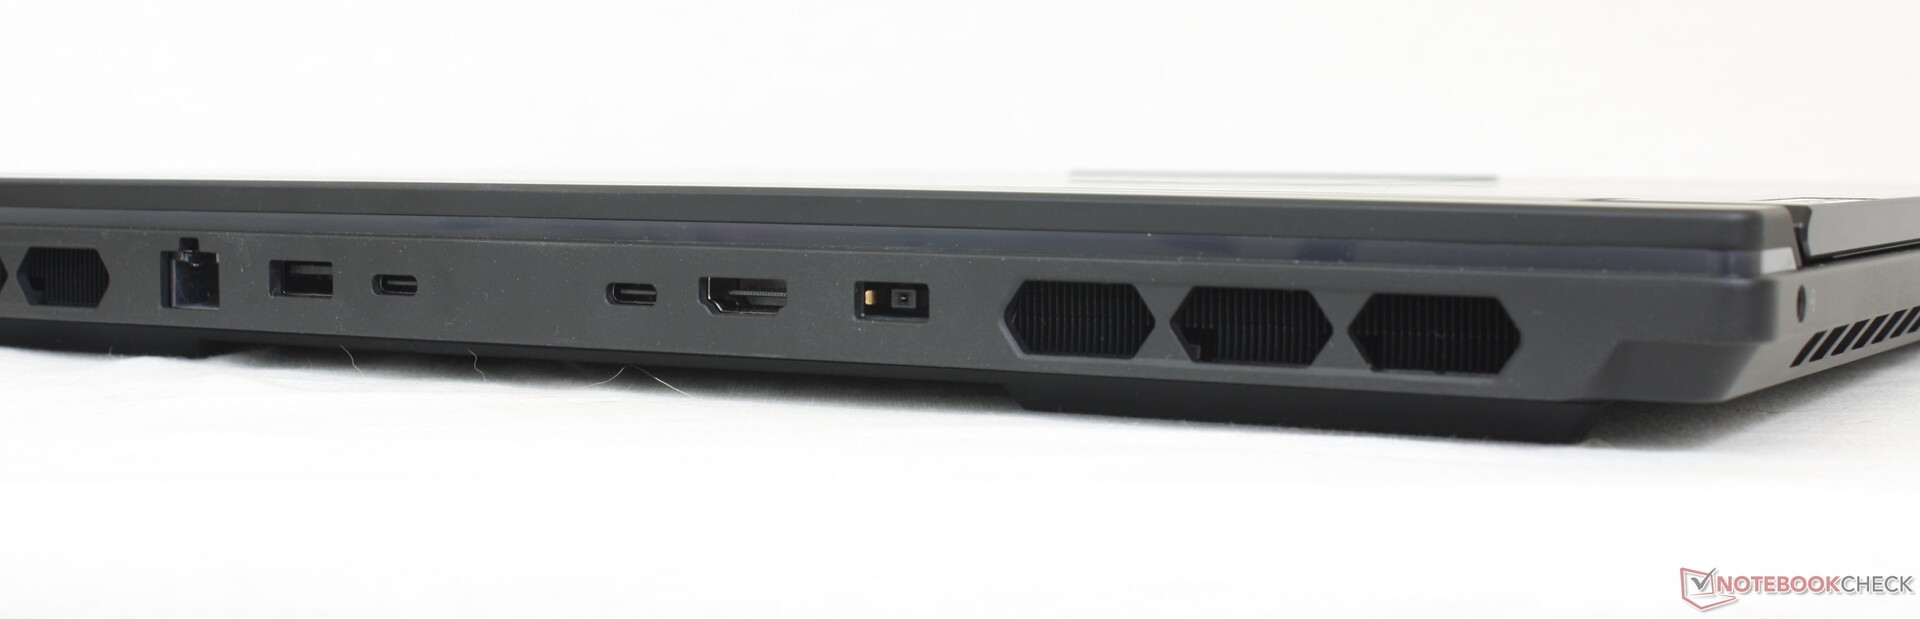
Anslutningsmöjligheter - många att välja mellan
Portalternativen är rikliga med de flesta av dem placerade längs baksidan istället för sidorna. Till skillnad från de bakre portarna på Alienware X16 R1 är portarna på Lenovo dock individuellt märkta med LED-indikatorer för enklare åtkomst.
Endast de två bakre USB-C-portarna kan användas för externa bildskärmar eller för att ladda den bärbara datorn via Power Delivery. Den tredje USB-C-porten längs den högra kanten är endast avsedd för data och laddning av externa enheter.
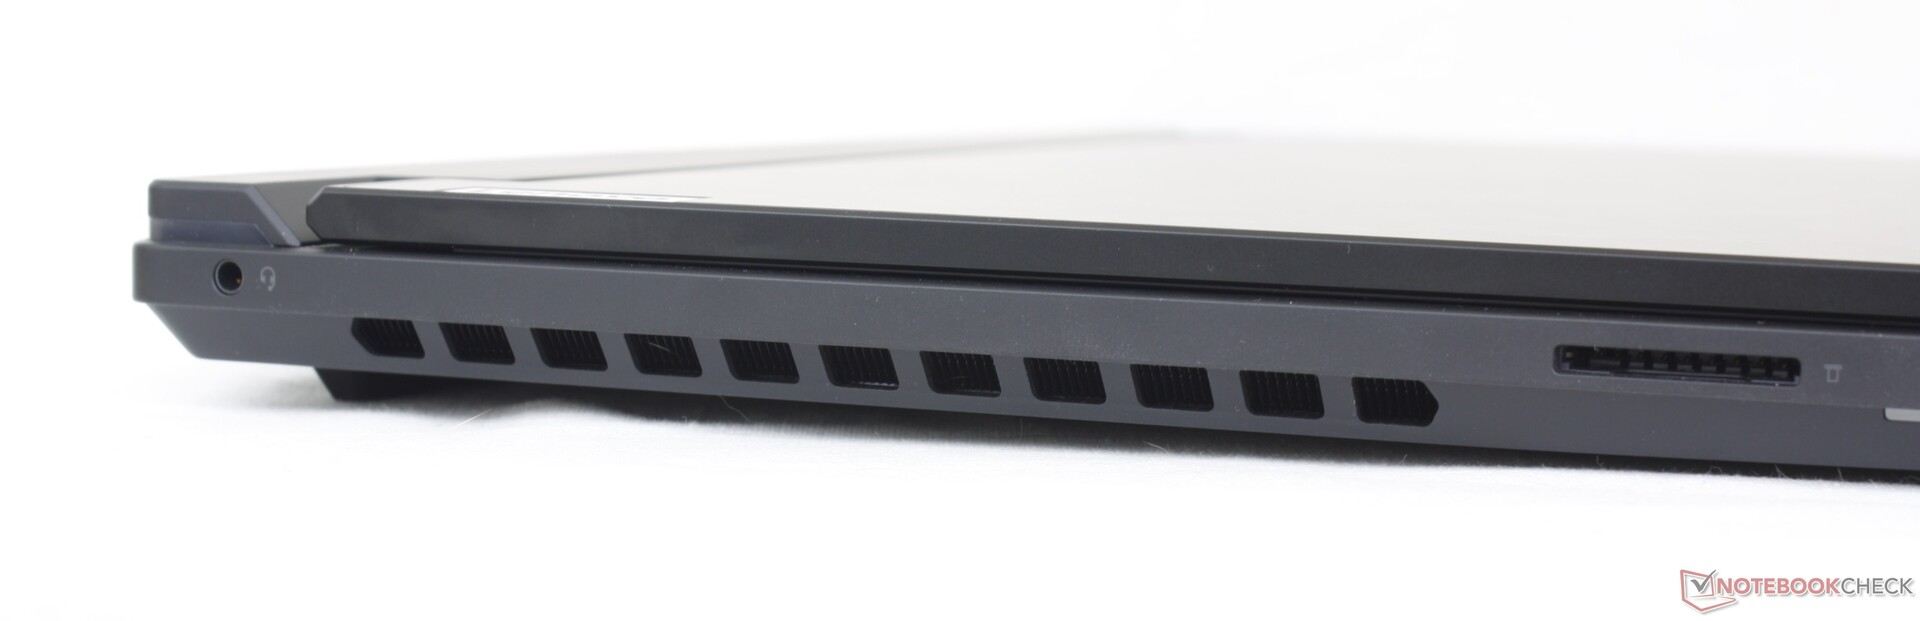
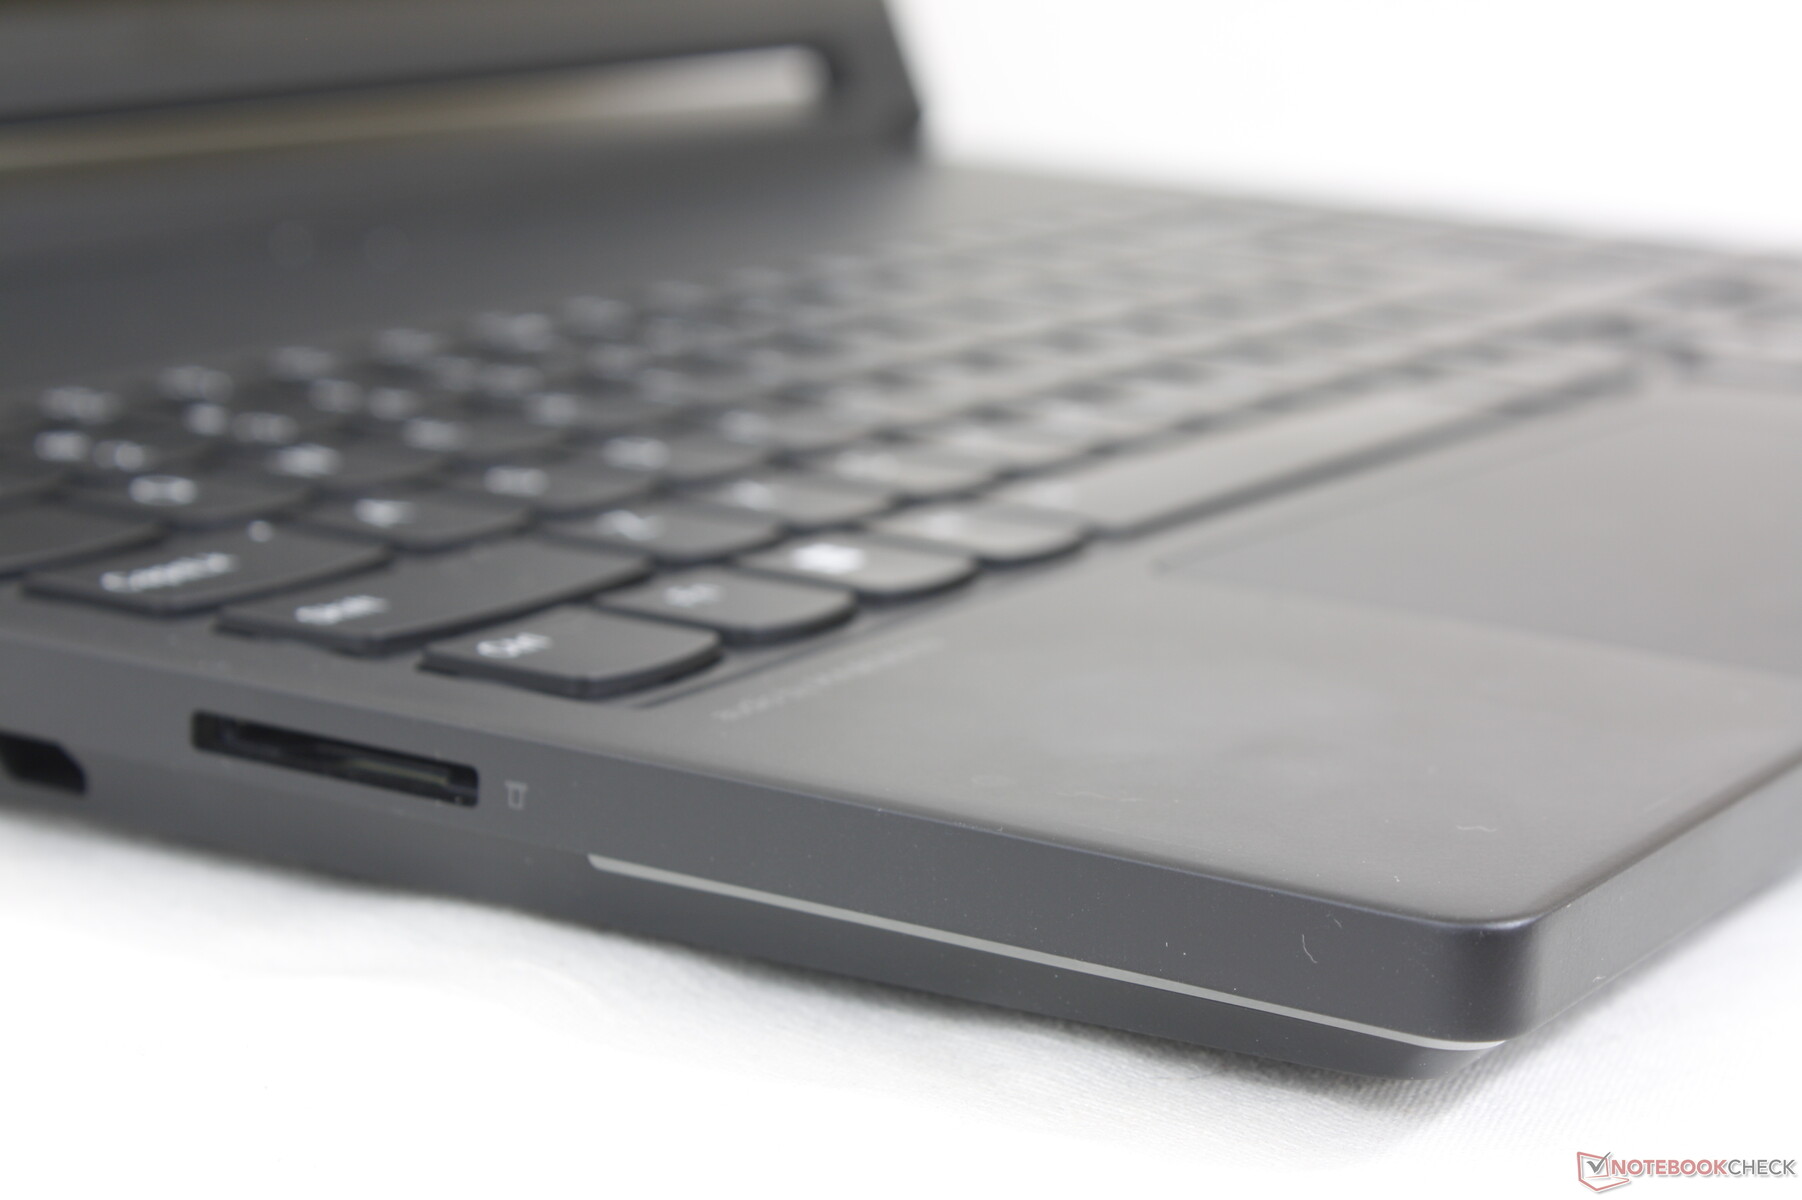
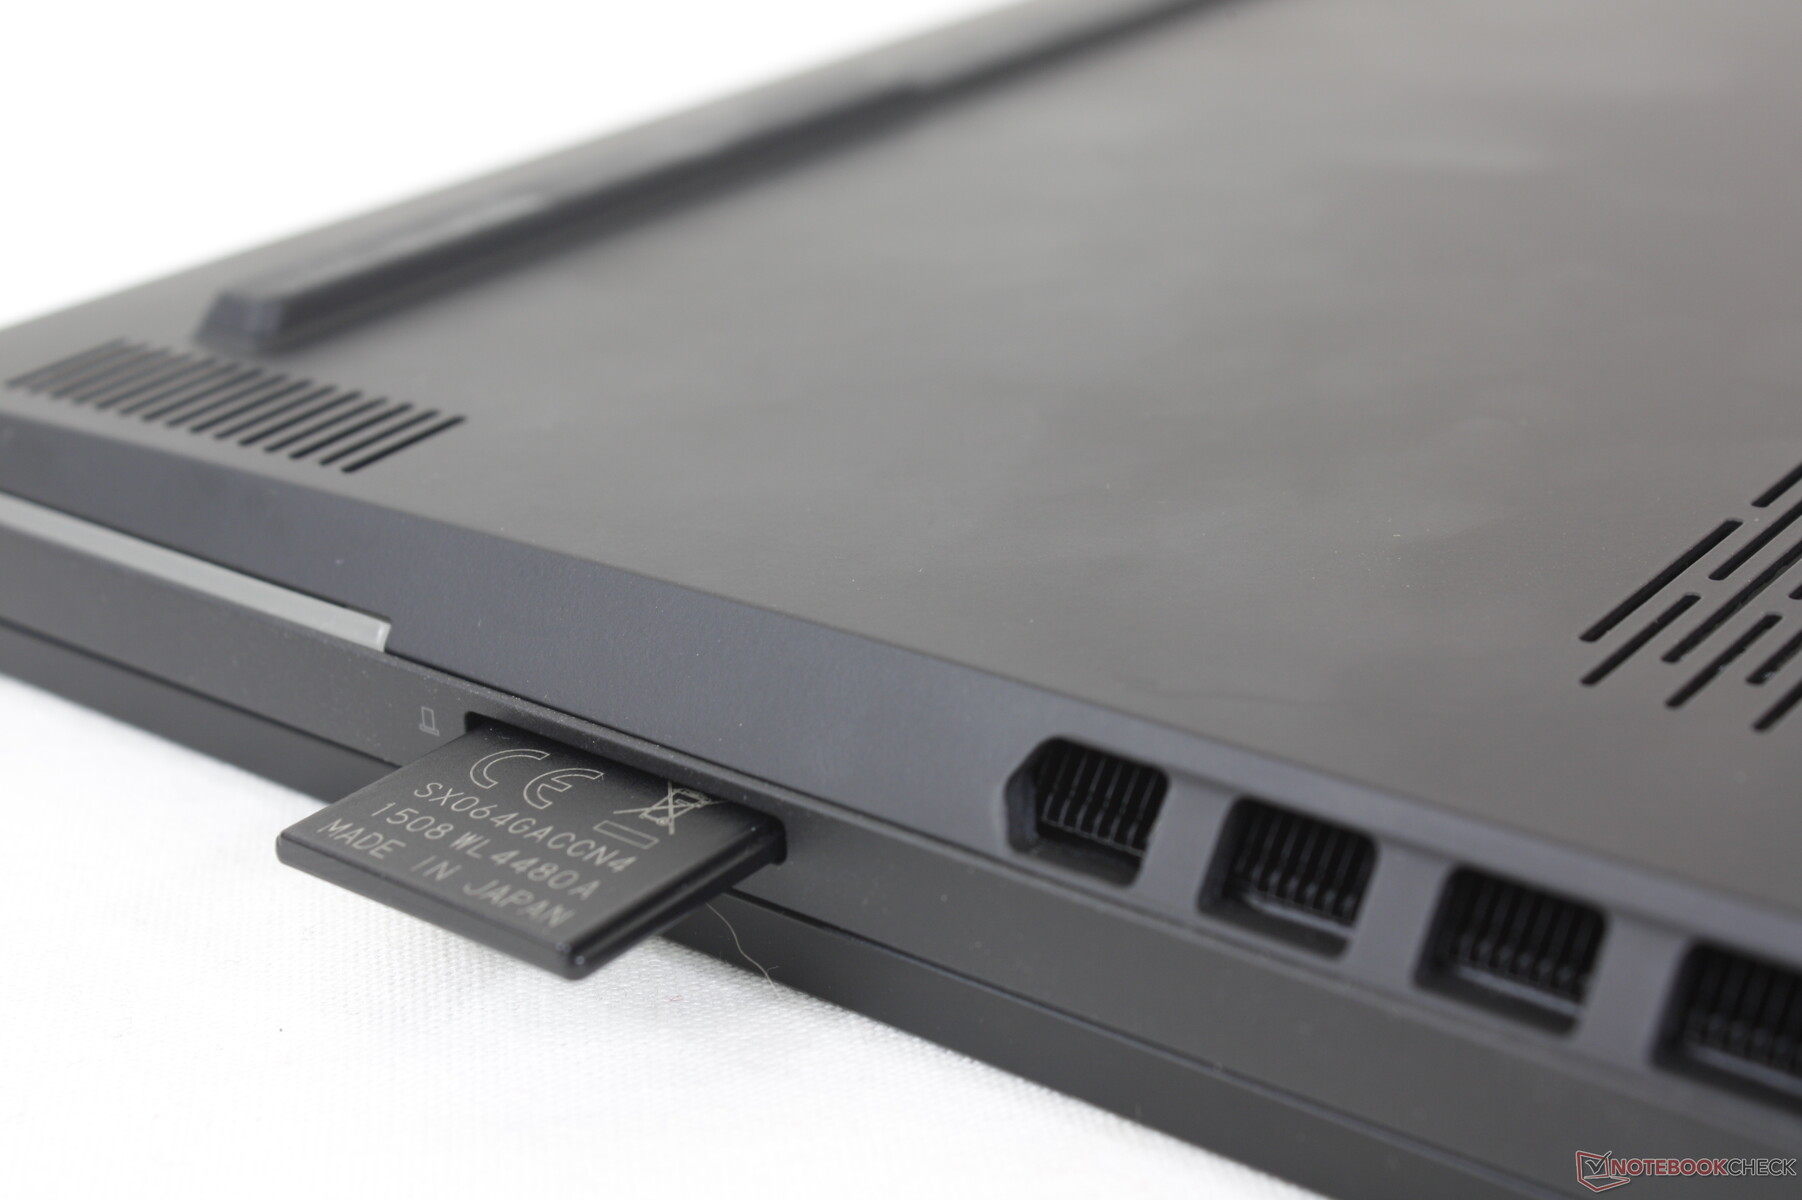
SD-kortläsare
Den integrerade SD-läsaren är ett sätt att locka både innehållsskapare och hardcore-spelare till Legion 9i. Överföringshastigheterna är dock inte så bra, med mindre än hälften av hastigheten hos SD-läsaren påRazer Blade 16.
| SD Card Reader | |
| average JPG Copy Test (av. of 3 runs) | |
| Razer Blade 16 Early 2023 RTX 4090 (Angelbird AV PRO 128 GB V60) | |
| Lenovo Legion 9 16IRX8 (Toshiba Exceria Pro SDXC 64 GB UHS-II) | |
| Alienware x16 R1 (AV PRO microSD 128 GB V60) | |
| Lenovo Legion Slim 5 16APH8 (PNY EliteX-Pro60 V60 256 GB) | |
| maximum AS SSD Seq Read Test (1GB) | |
| Alienware x16 R1 (AV PRO microSD 128 GB V60) | |
| Razer Blade 16 Early 2023 RTX 4090 (Angelbird AV PRO 128 GB V60) | |
| Lenovo Legion 9 16IRX8 (Toshiba Exceria Pro SDXC 64 GB UHS-II) | |
| Lenovo Legion Slim 5 16APH8 (PNY EliteX-Pro60 V60 256 GB) | |
Kommunikation
Killer AX1675i levereras som standard vilket är spelmärket för den vanliga AX211. Wi-Fi 6E och Bluetooth 5.3 stöds och vi upplevde inga anslutningsproblem när vi parade ihop den med vårt Asus AXE11000 6 GHz-nätverk.
Webbkamera
Webbkameran på 2 MP är standard för kategorin bärbara speldatorer. Även om det finns en integrerad kameraknapp, finns det ingen IR-sensor.

")
")
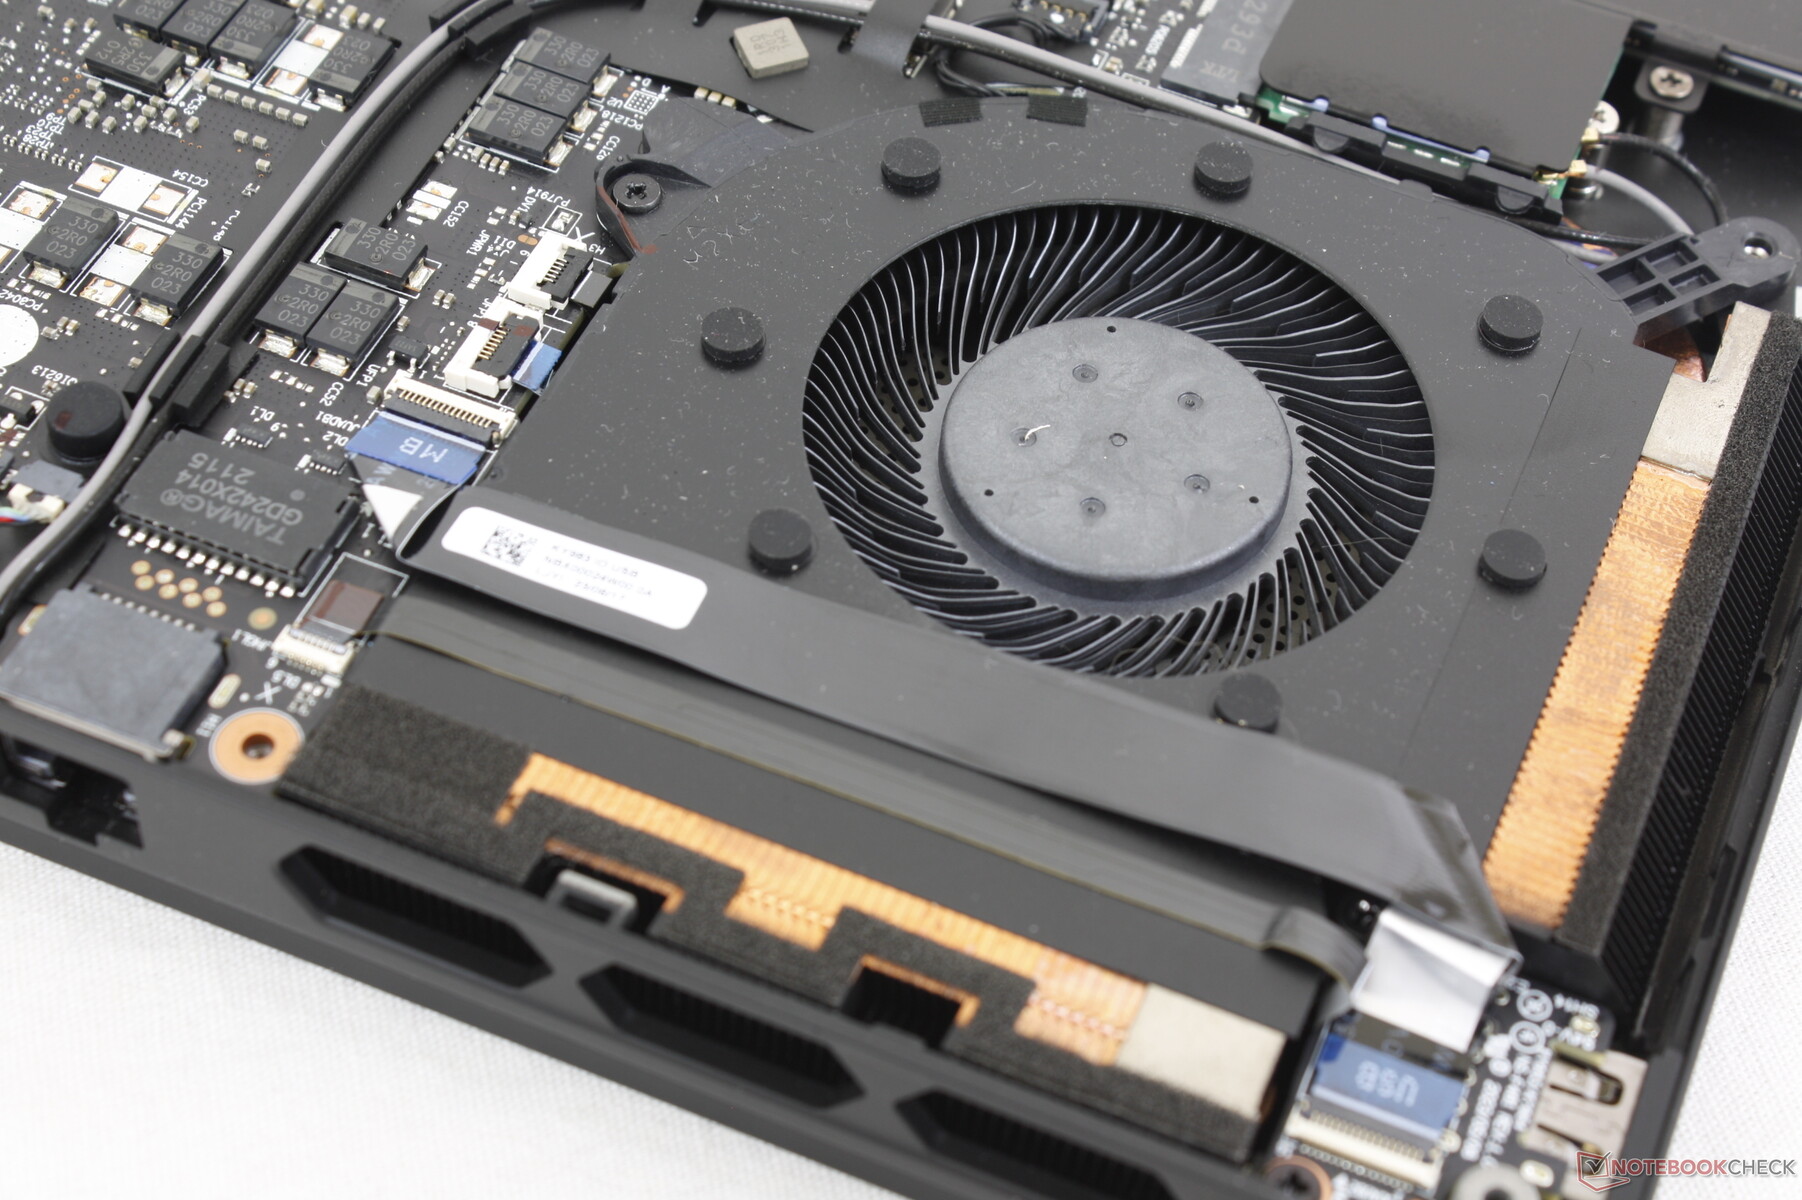
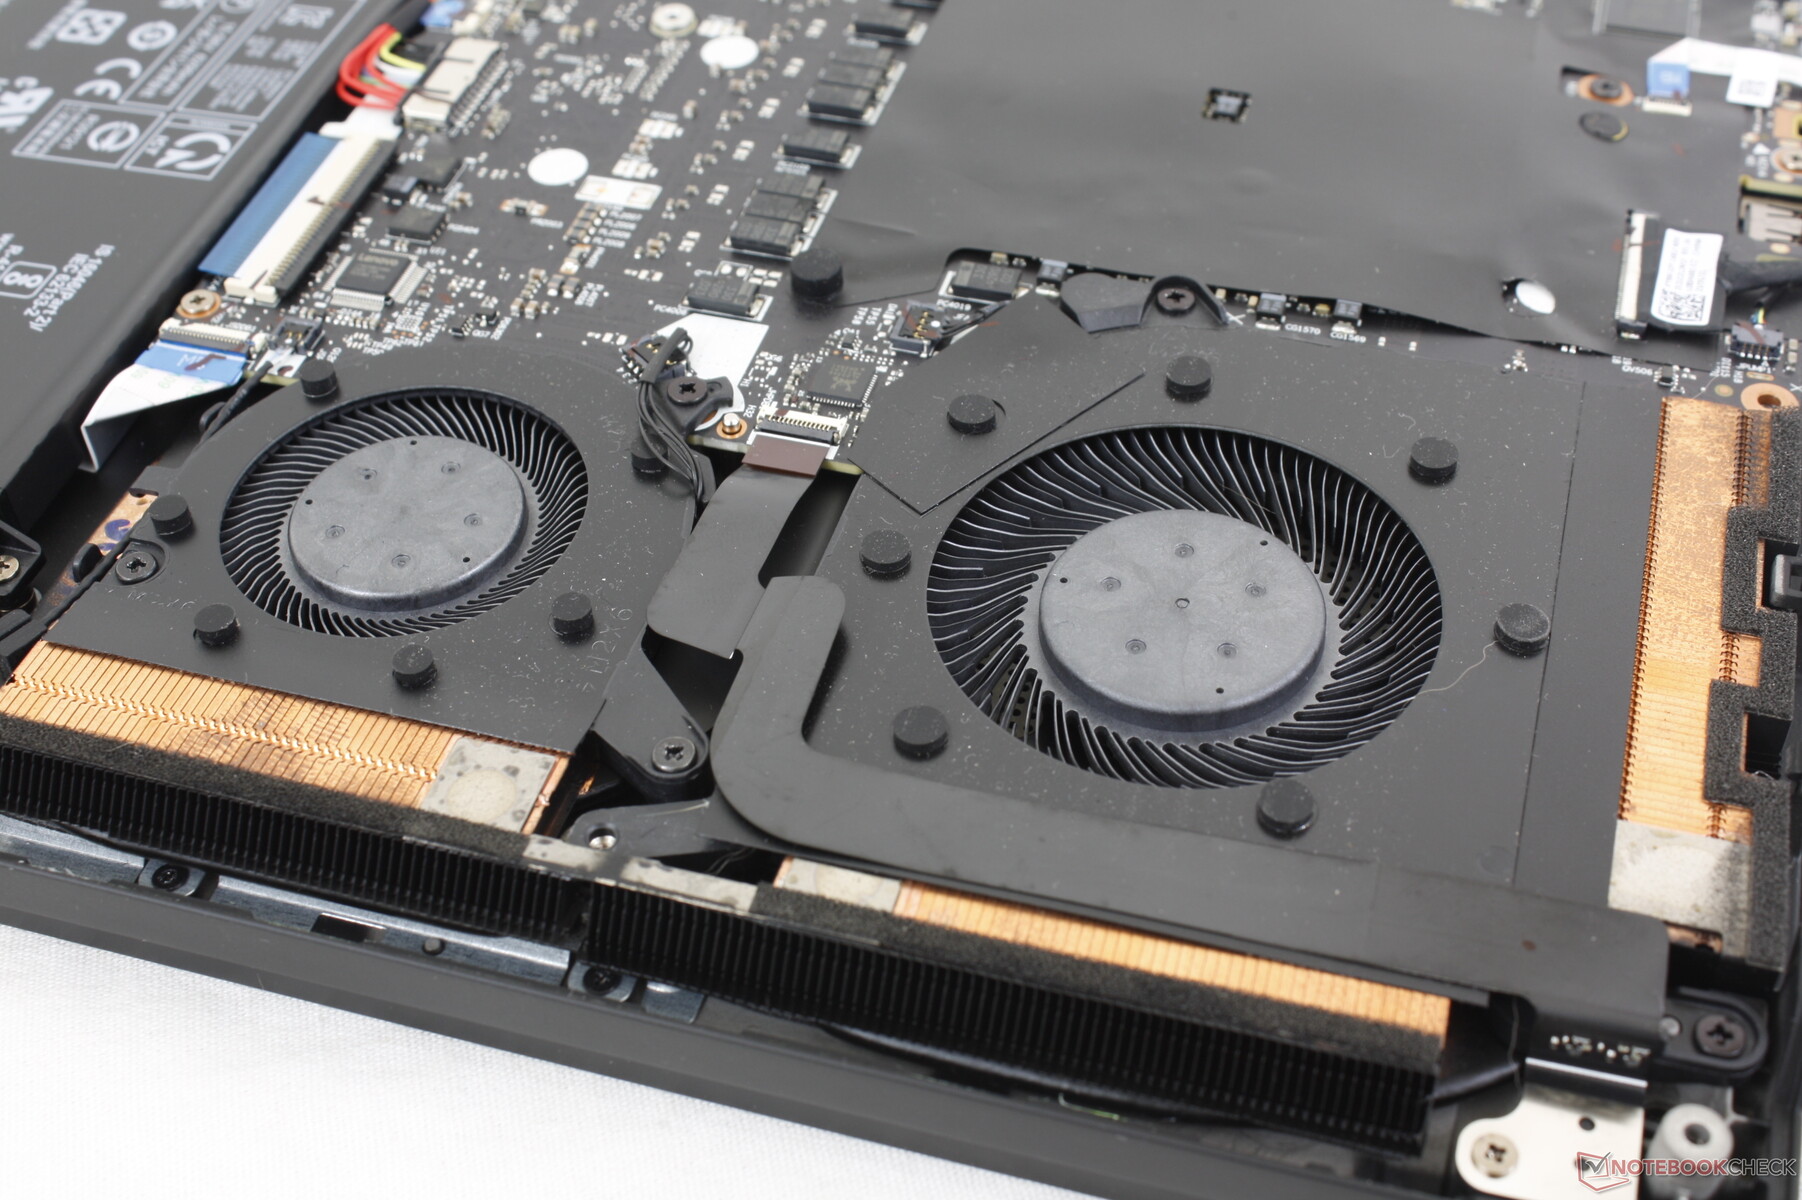
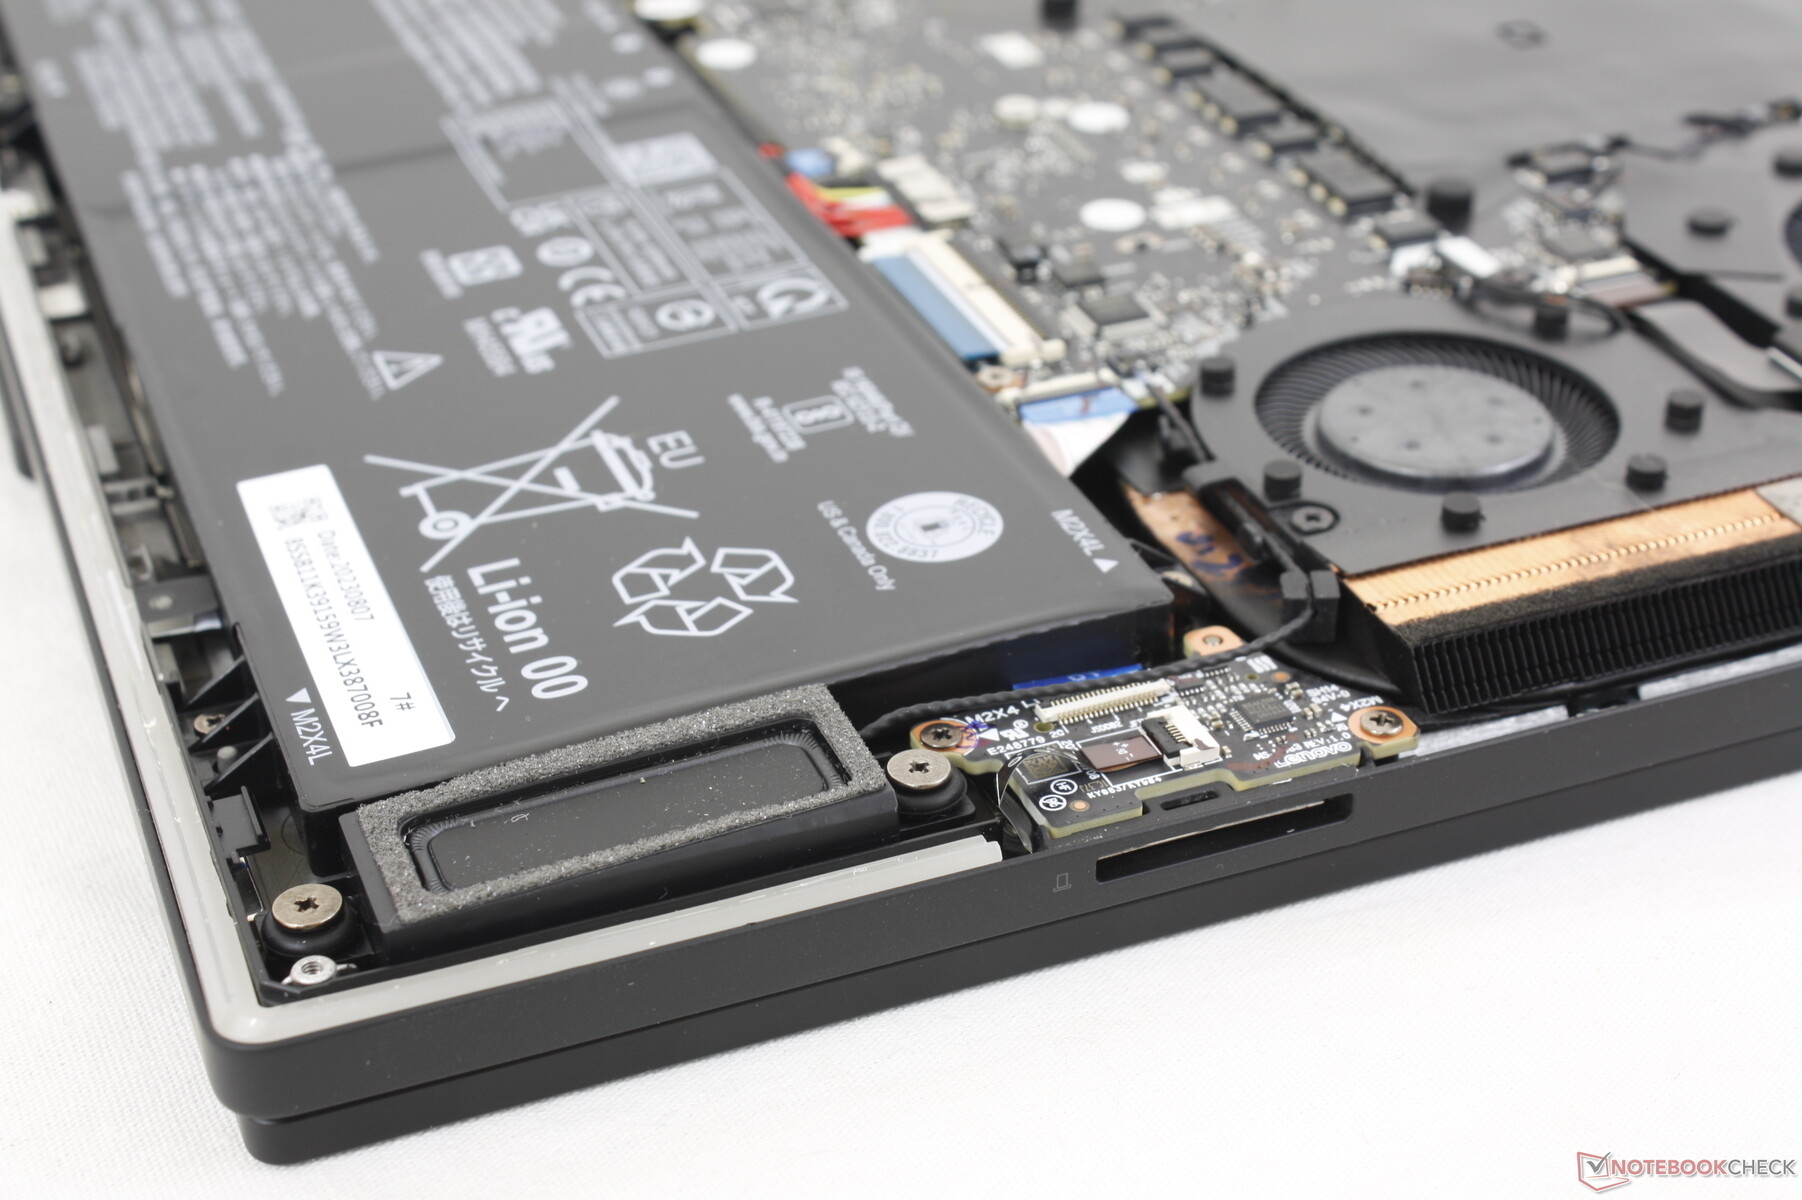
Underhåll
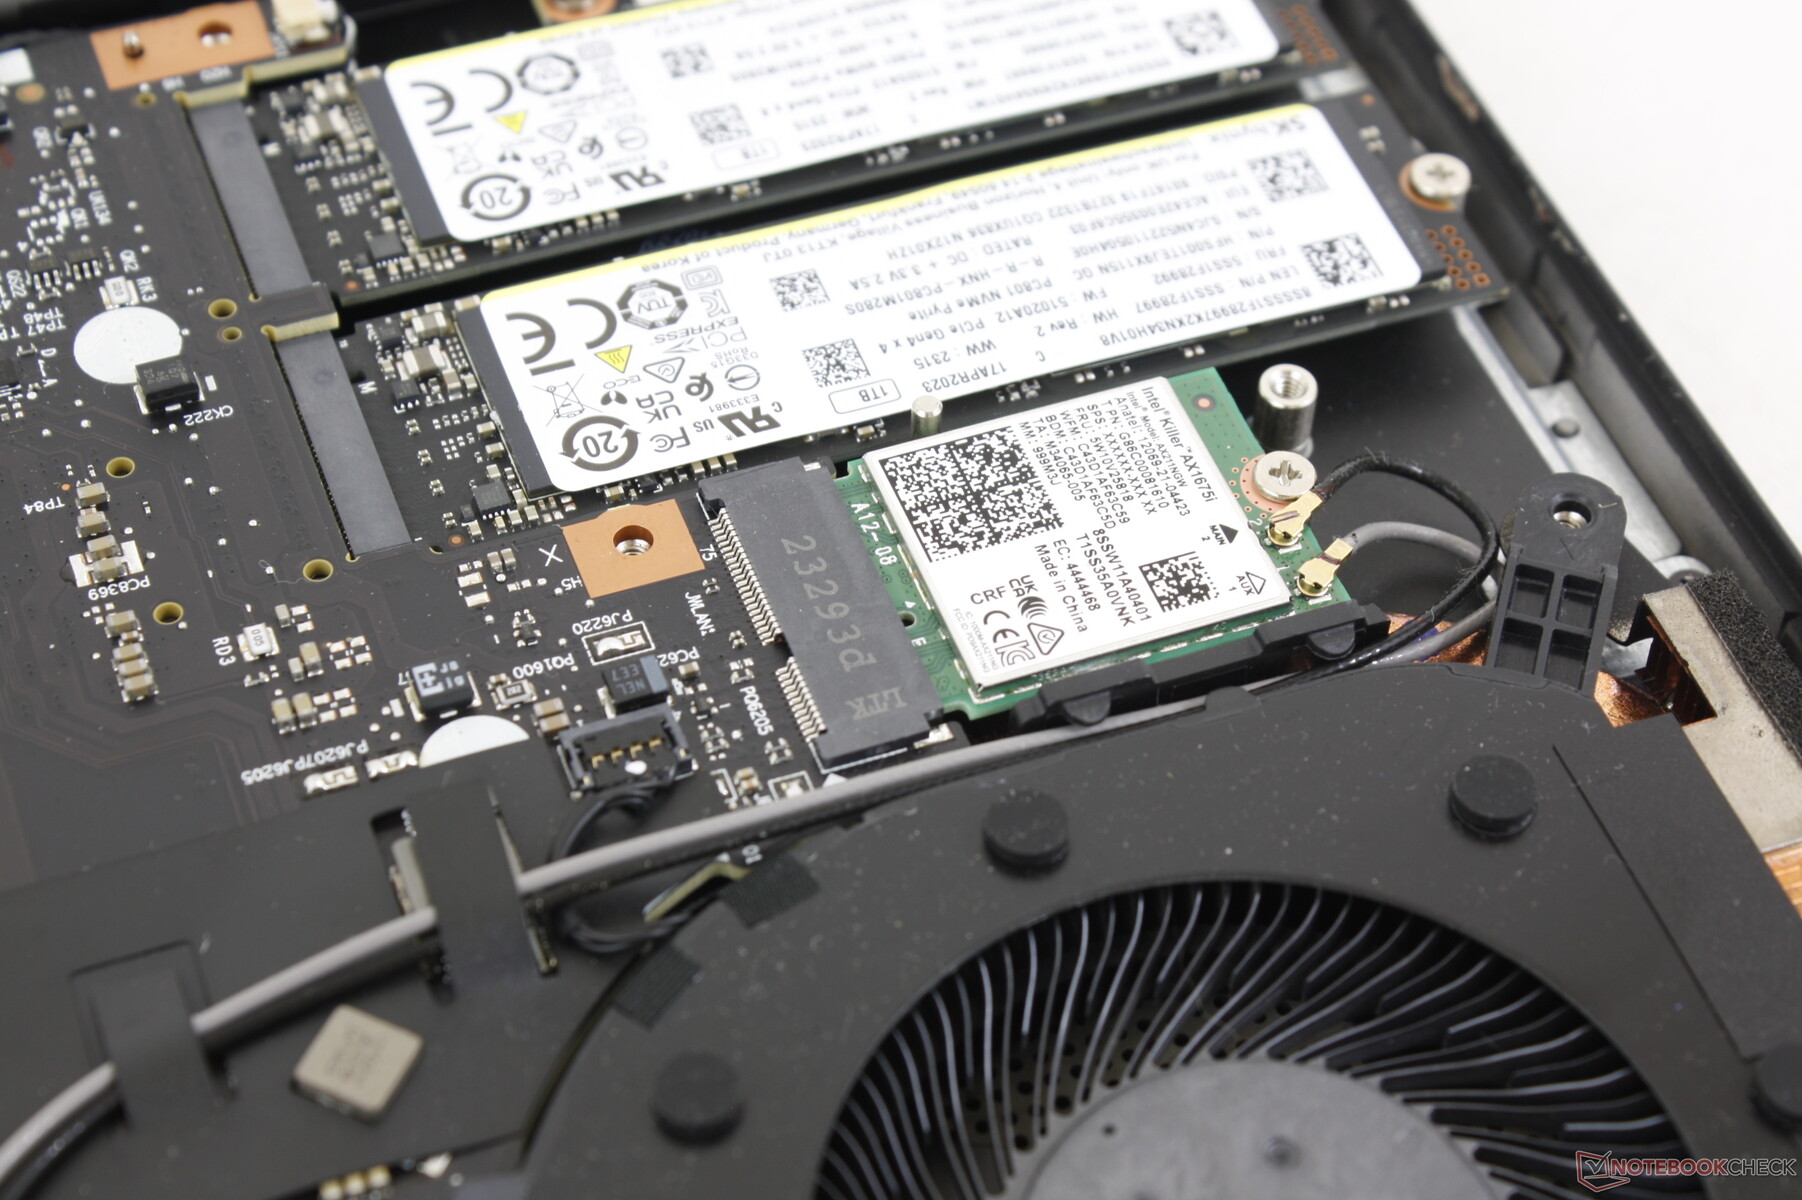
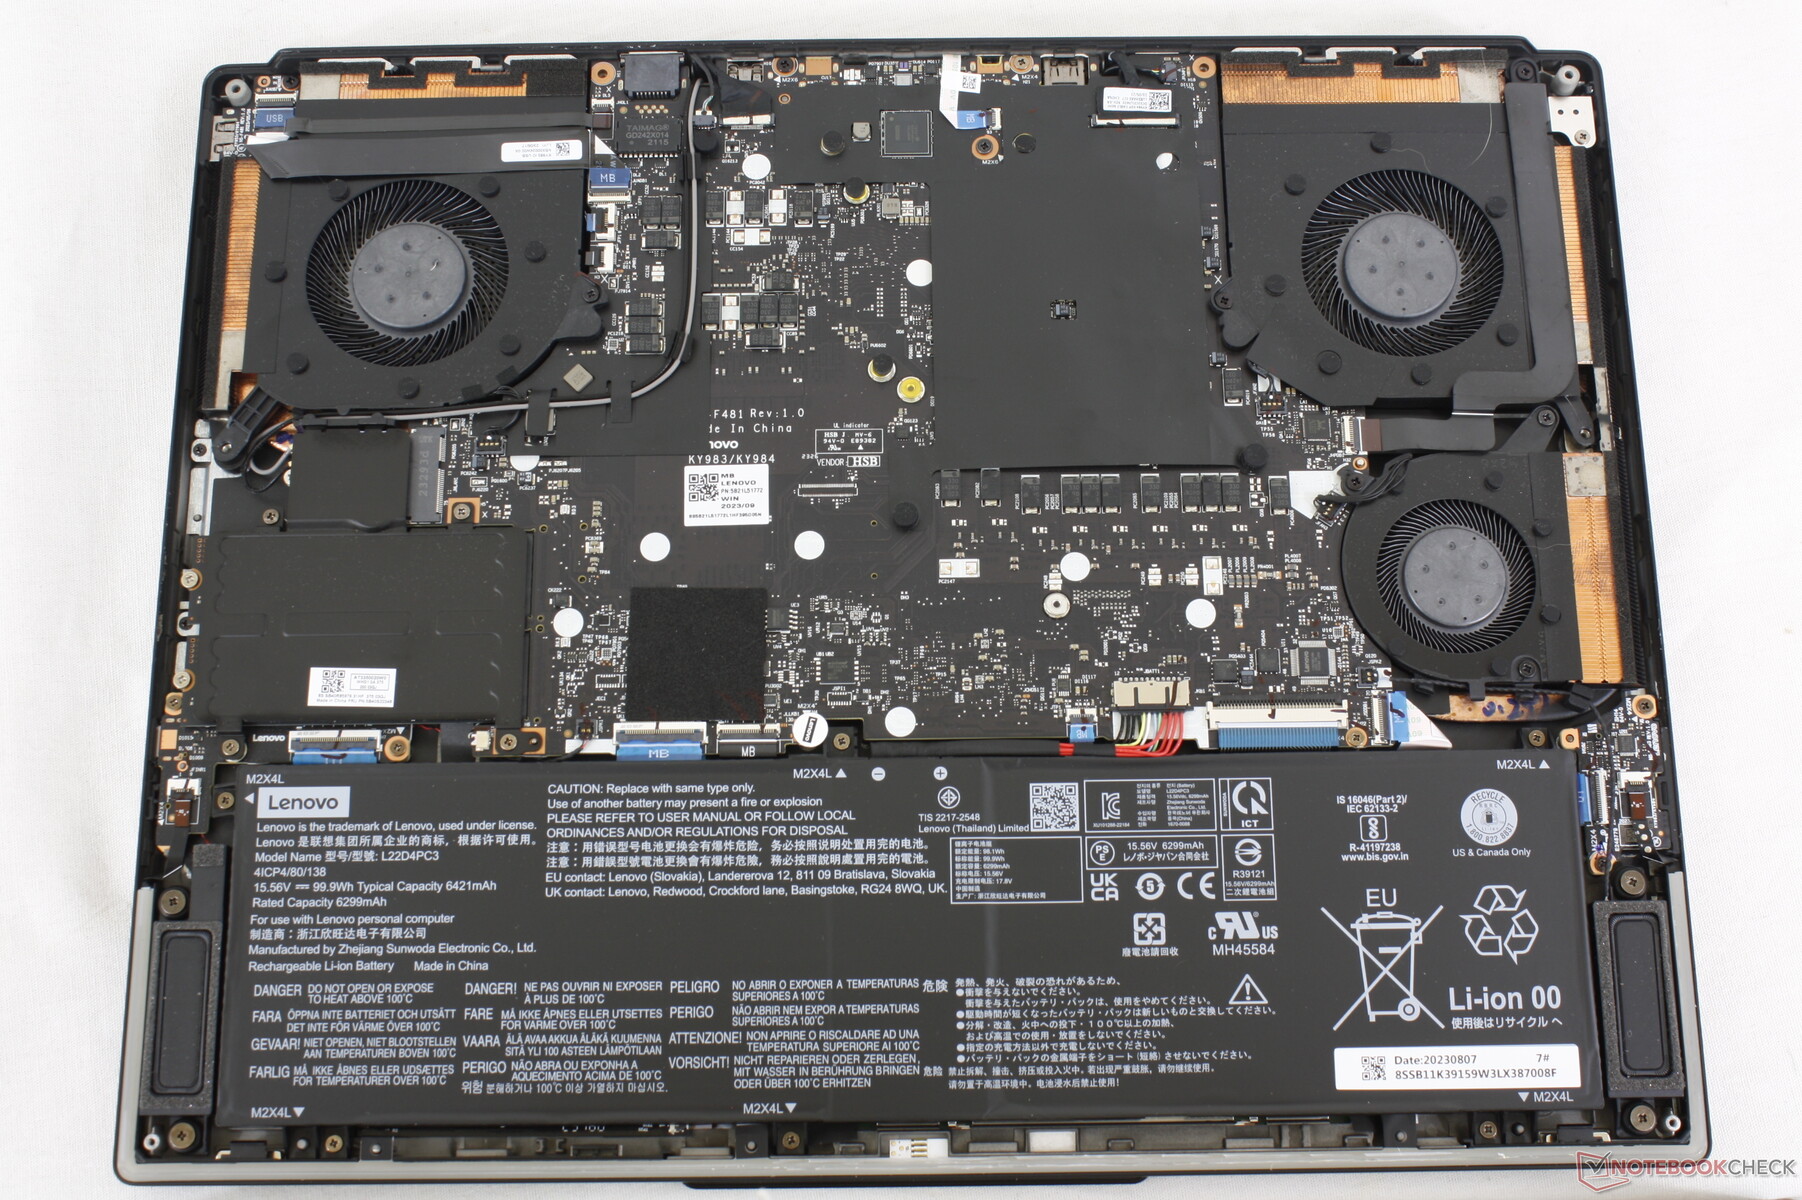
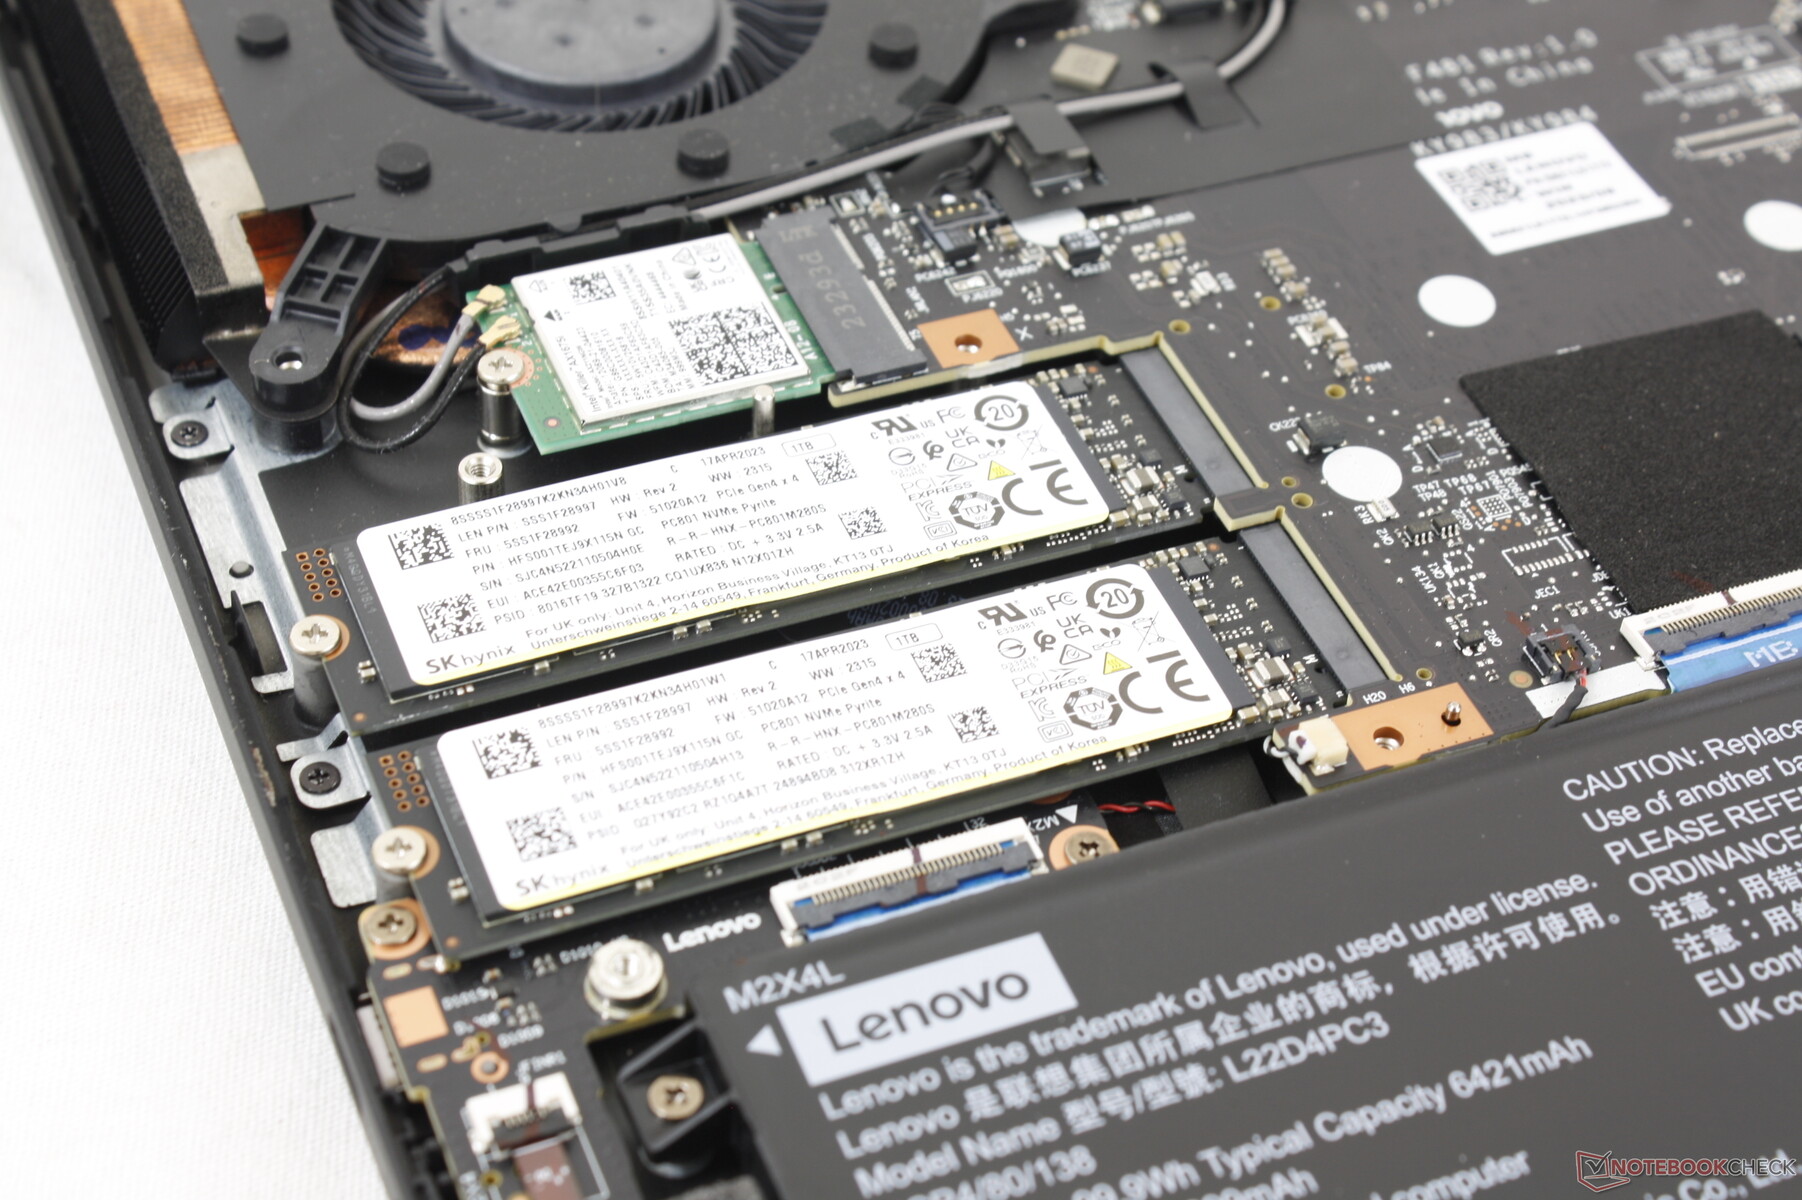
Bottenpanelen är säkrad med 8 Phillips-skruvar för relativt enkel borttagning. Till skillnad från de flesta andra bärbara datorer är moderkortet på Legion 9 16 upp och nedvänt, vilket innebär att ytterligare demontering krävs för att komma åt RAM-modulerna för kylningslösningen. Åtminstone de två M.2 2280 SSD-kortplatserna är lättillgängliga.
Tillbehör och garanti
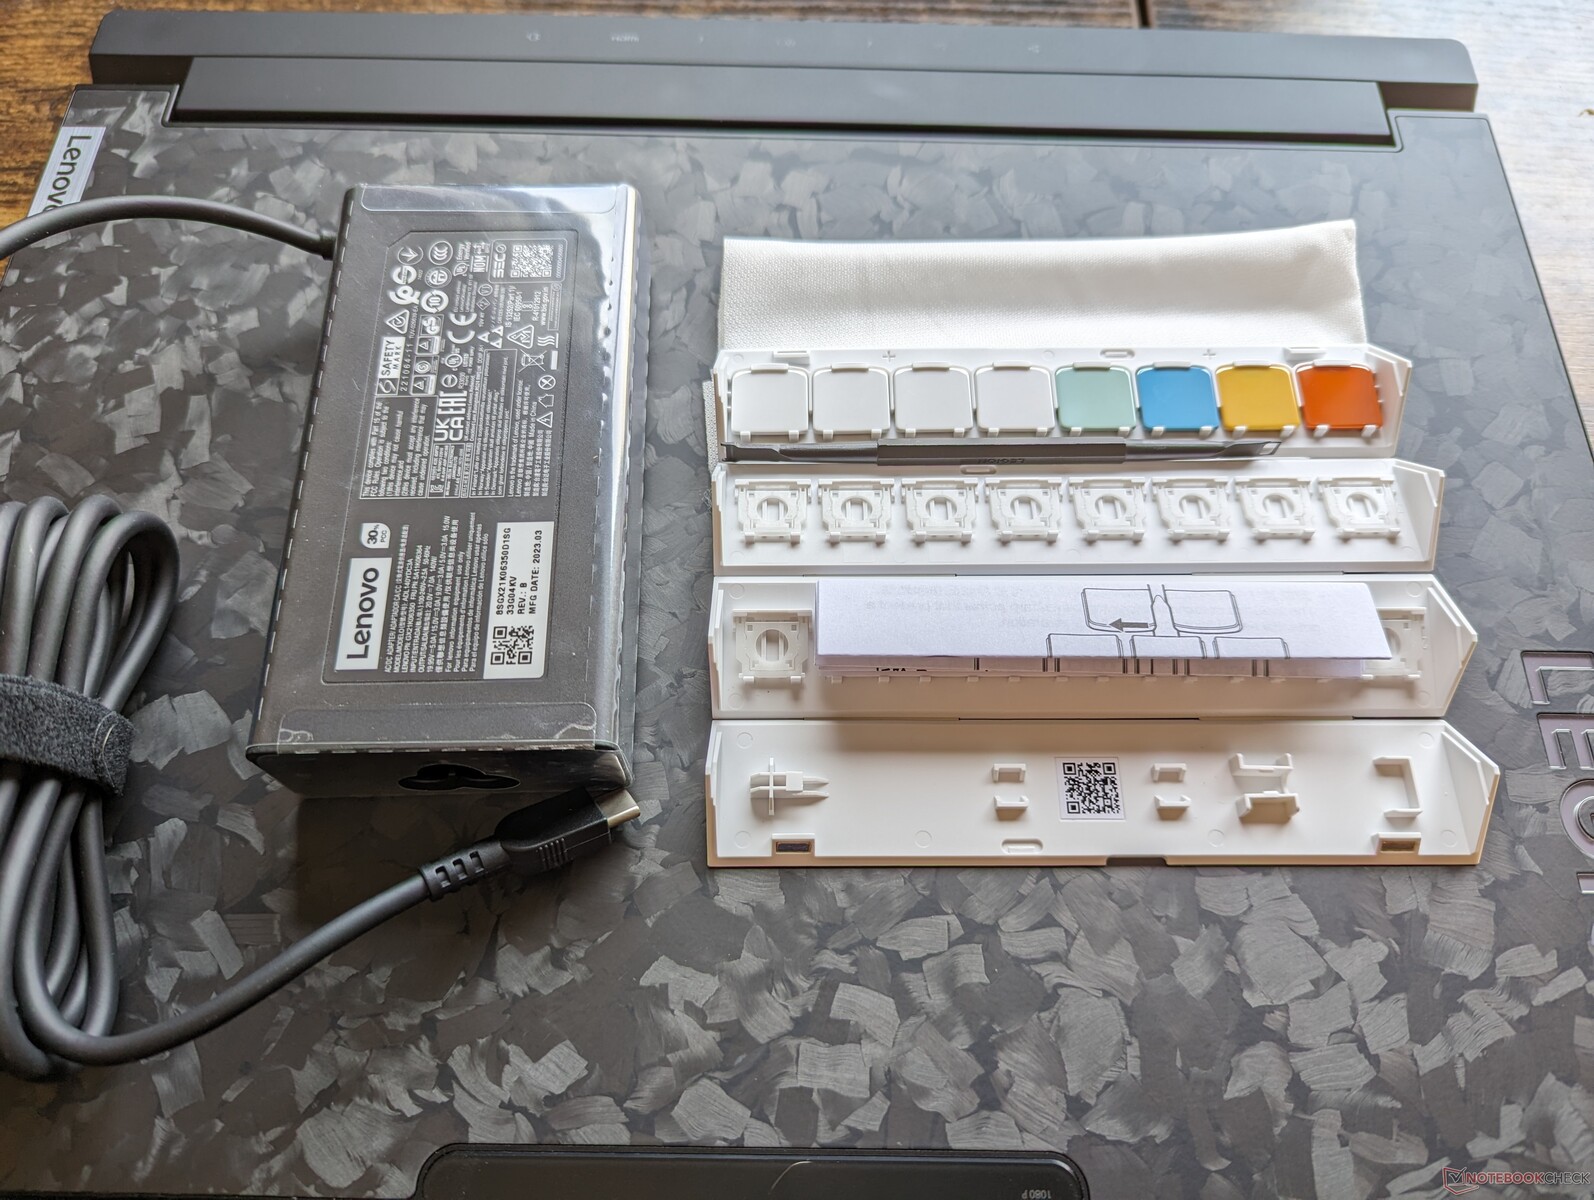
Förutom den vanliga proprietära nätadaptern och pappersarbetet innehåller detaljhandelsförpackningen också en mycket praktisk universell 140 W USB-C-adapter som kan användas för att ladda den här bärbara datorn och de flesta andra USB-C-enheter och 8 tangentknappar.
Den ettåriga begränsade standardtillverkargarantin gäller vid köp i USA.
Inmatningsenheter - Bekvämt tangentbord med trång klickplatta
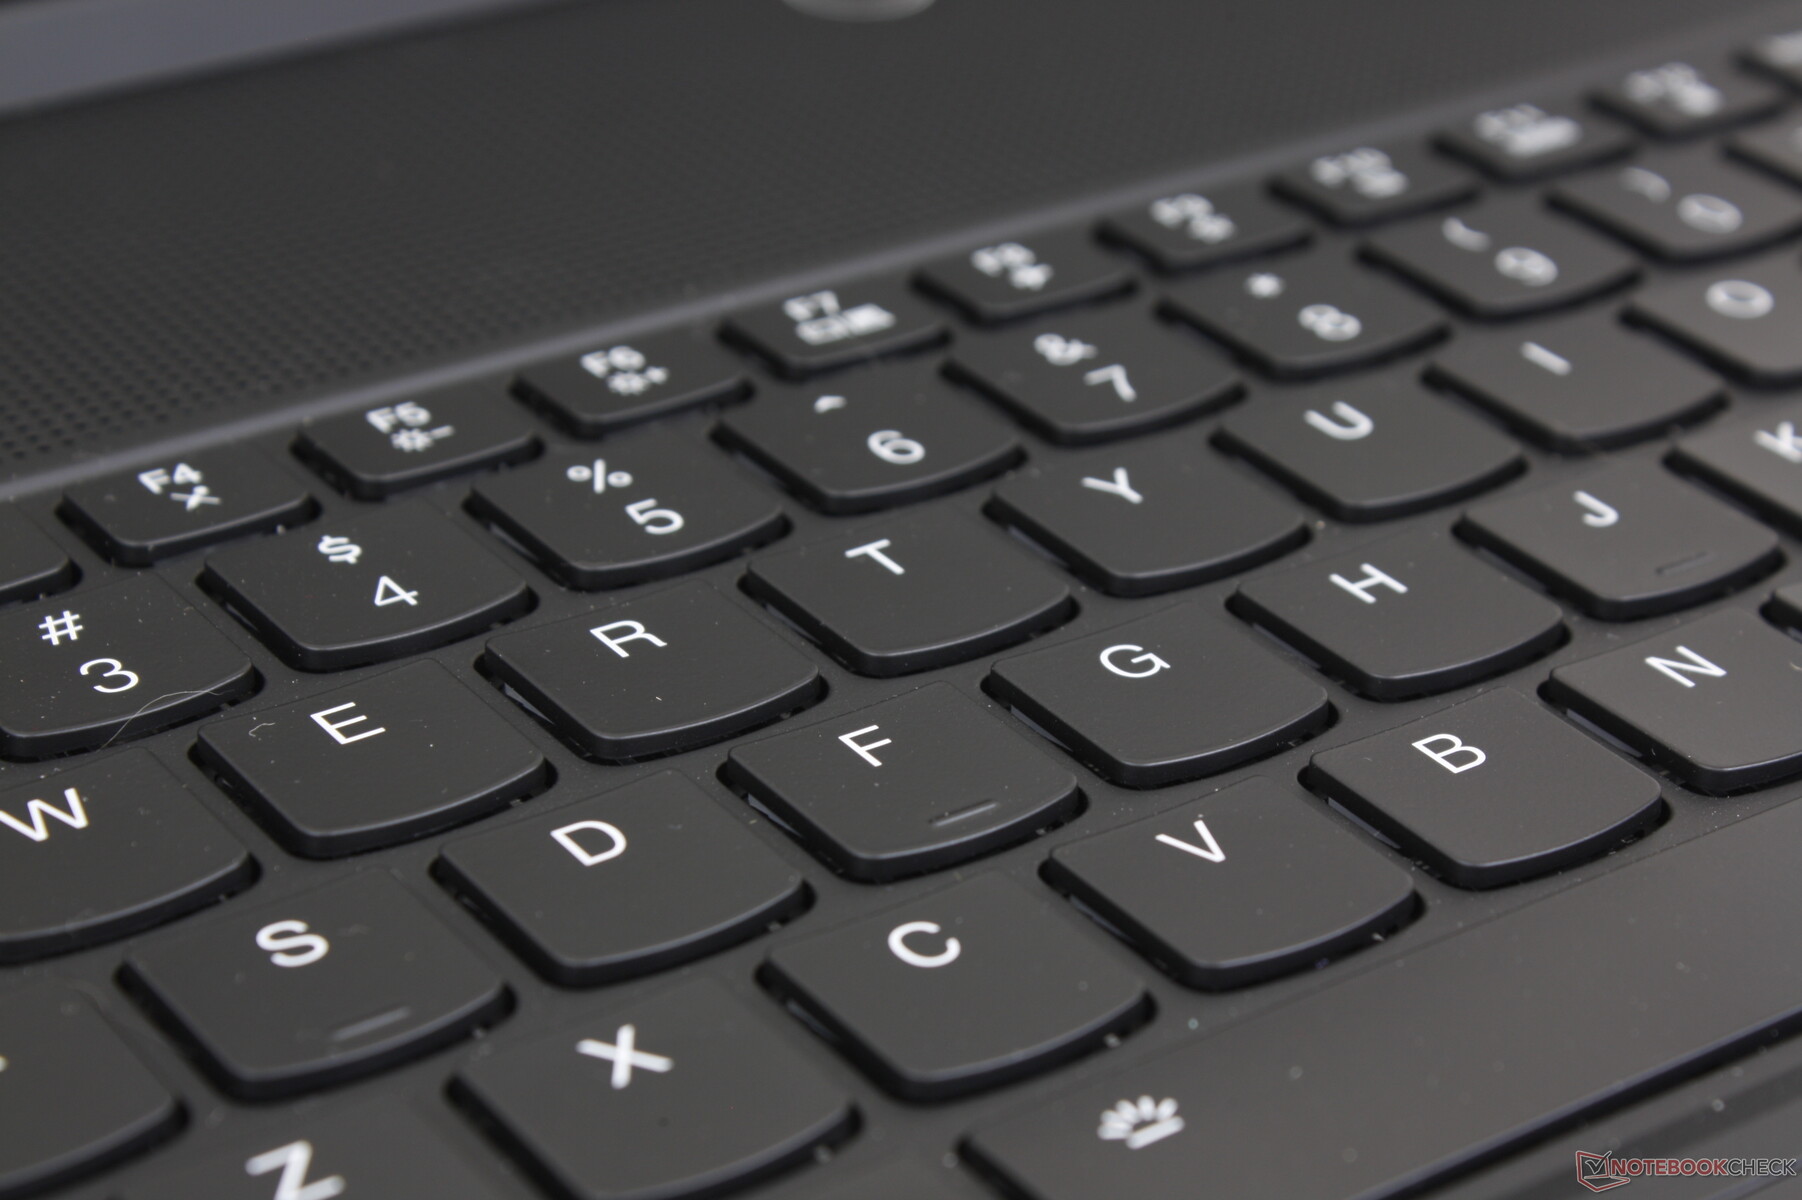
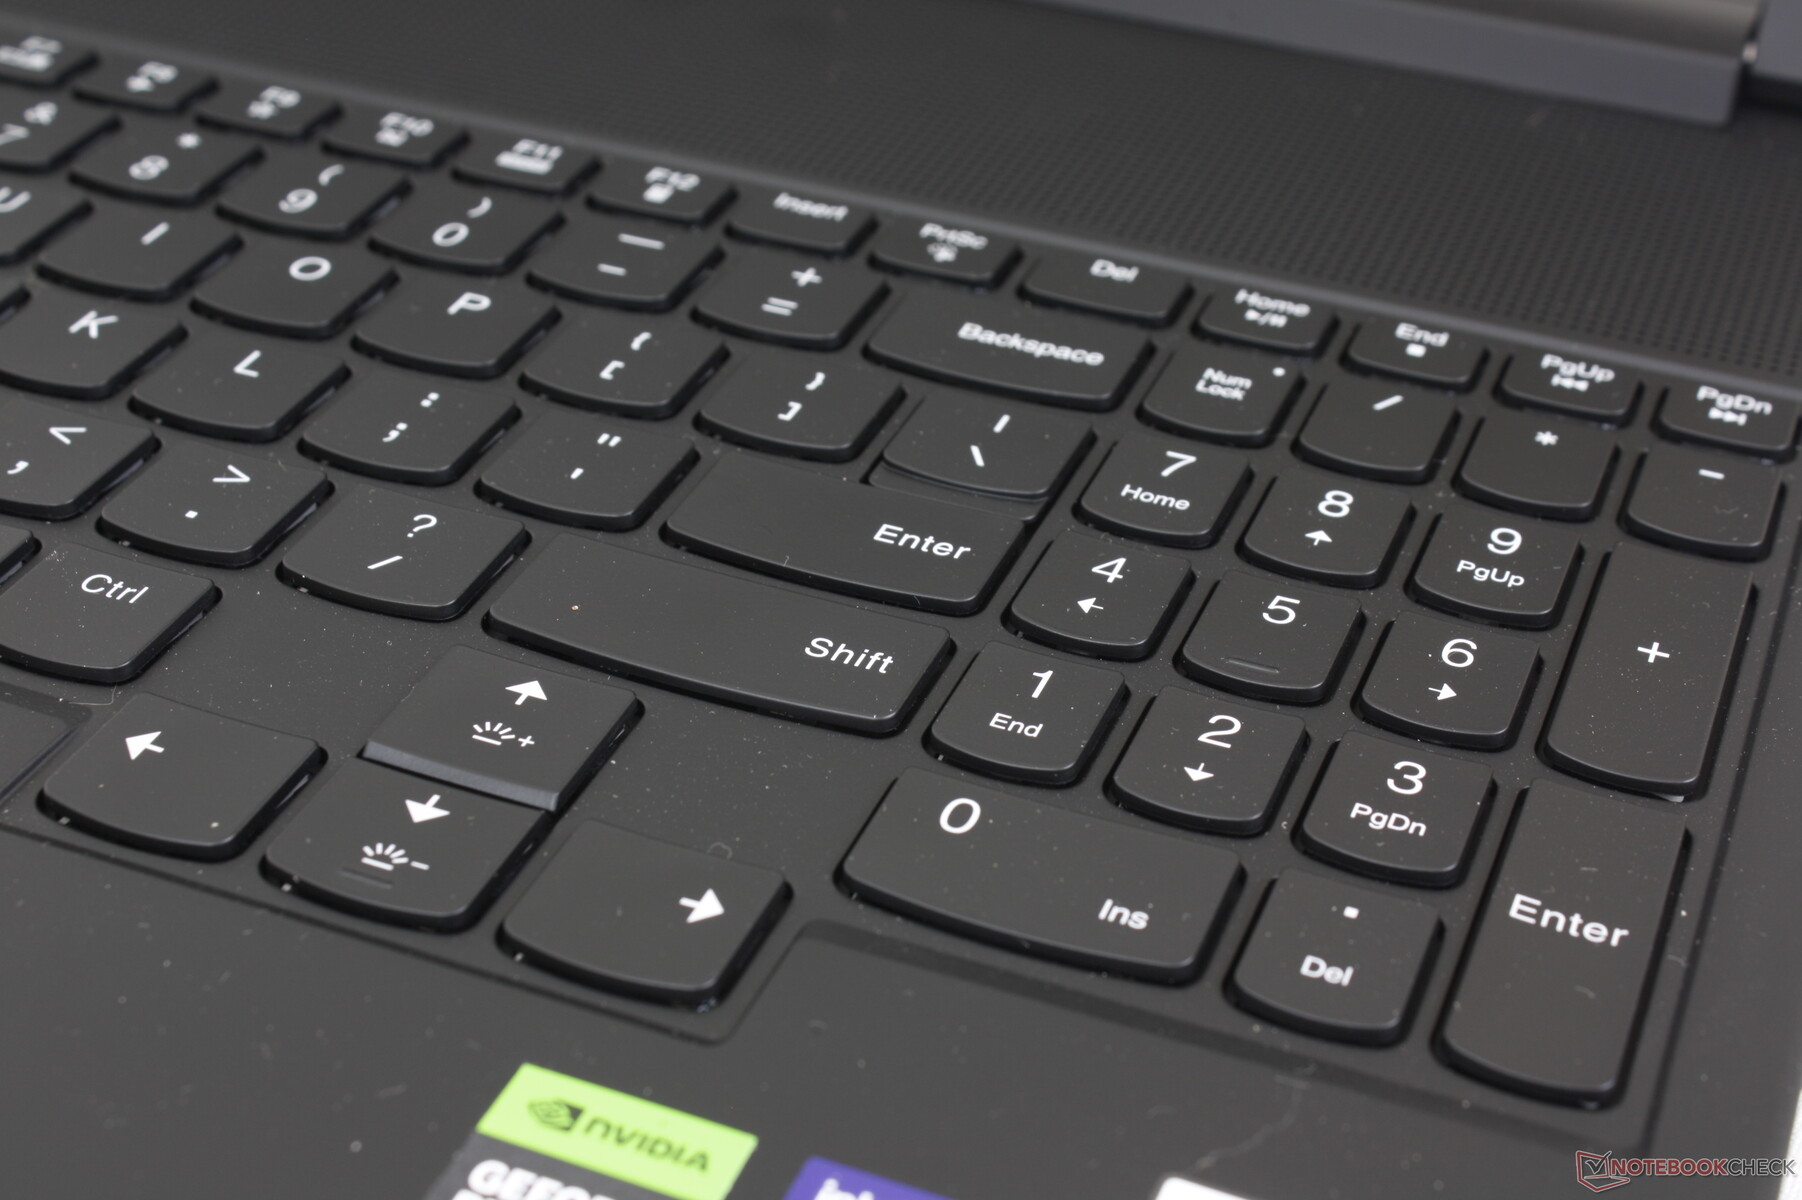
Tangentbord
TrueStrike-tangentbordet har 1,5 mm slaglängd och är därmed något djupare än tangenterna på de flesta Ultrabooks. Återkopplingen är förvånansvärt skarp och bekväm för membranbaserade tangenter, vilket visar att du inte behöver några avancerade mekaniska brytare för en bra skrivupplevelse. De fasta tangenterna är högre än tangenterna på Blade 16 eller Asus Zephyrus M16 men definitivt fortfarande inte lika klickande som de mekaniska tangenterna på modeller som Schenker XMG Neo 15 eller Alienware m18.
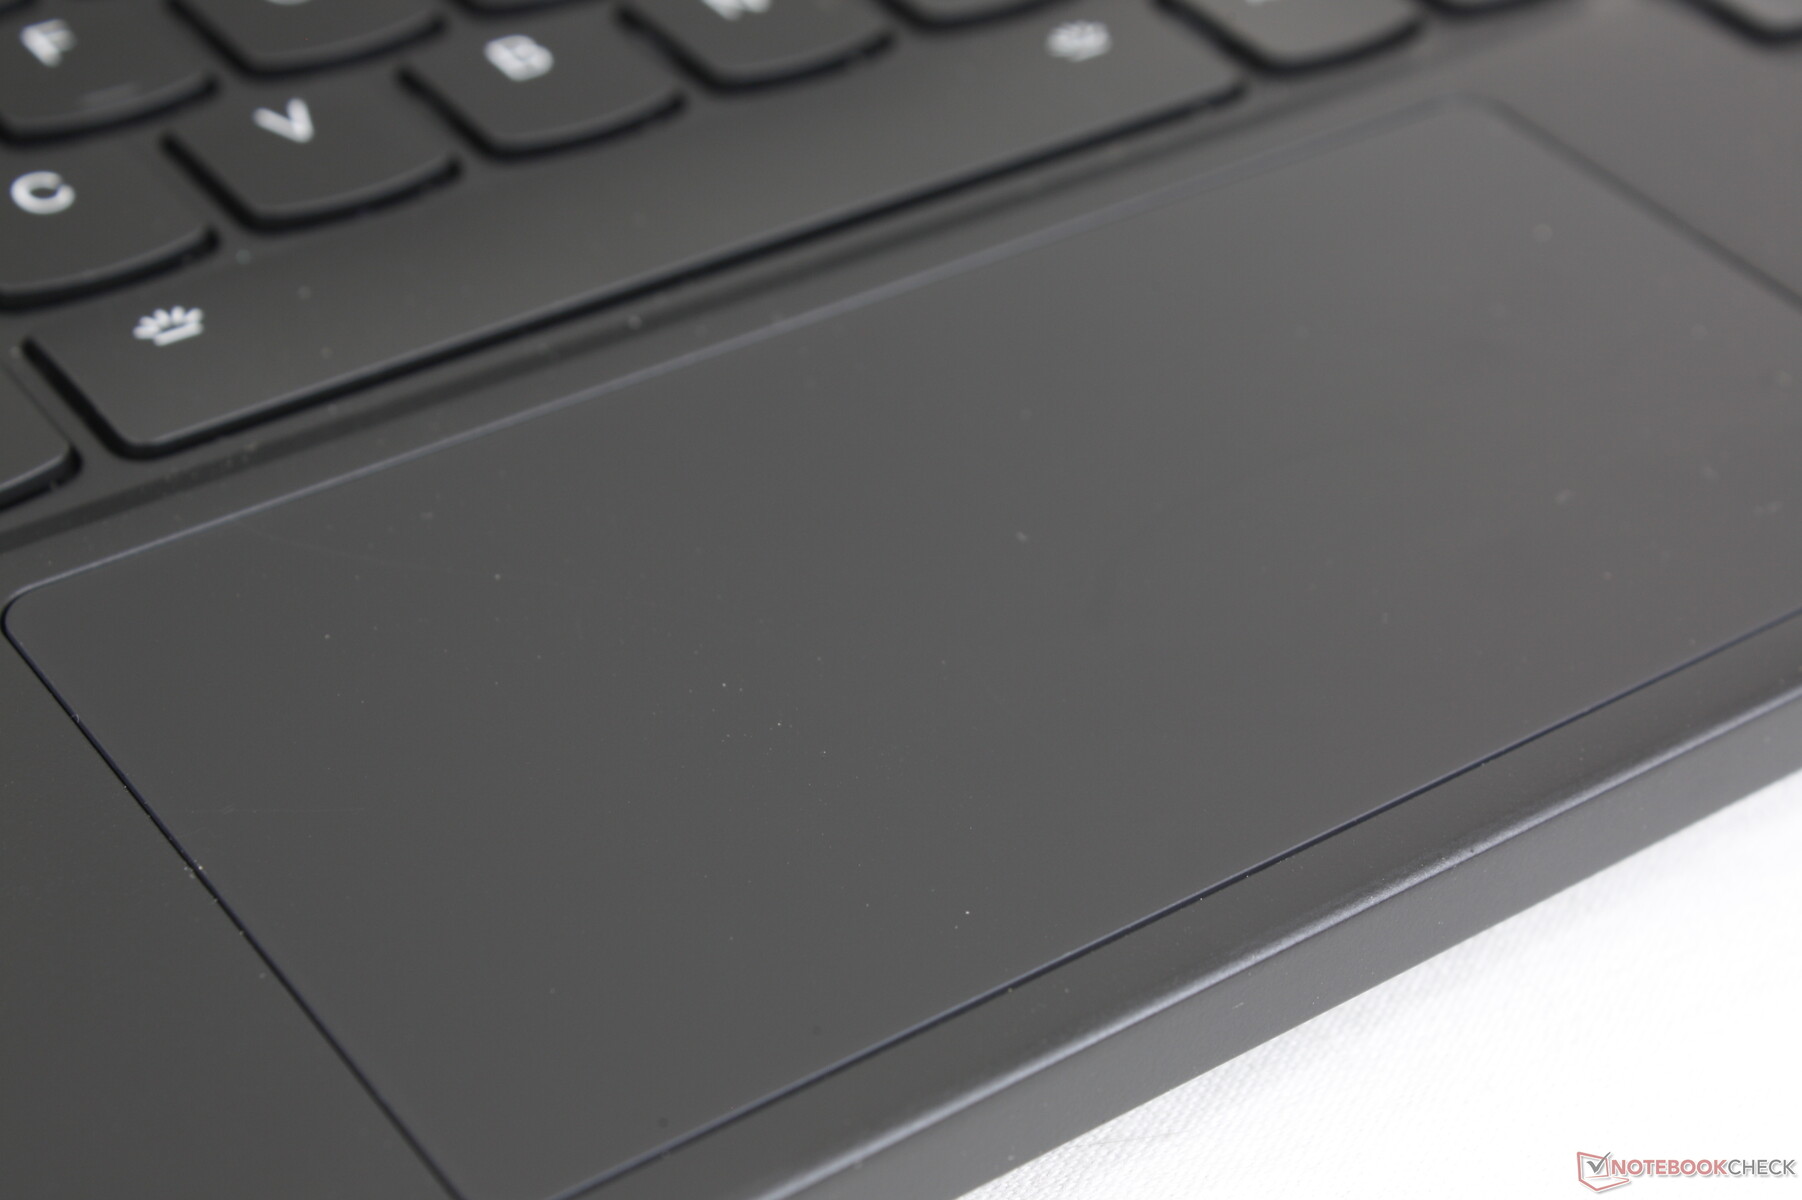
Pekplatta
Klickplattan har reducerats i storlek till bara (12 x 5,9 cm) på grund av tangentbordets placering. Vertikala markörrörelser på den höga 16:10-skärmen känns trånga som ett resultat, särskilt jämfört med bärbara speldatorer med mycket större klickplattor som Razer Blade 16lenovo räknar med att spelare använder sina egna USB- eller Bluetooth-möss för de allra flesta scenarier.
Att glida och klicka är annars smidigt och med ett tillfredsställande klick trots den lilla ytan. Markörens rörelser kunde dock ibland frysa på vår enhet när vi använde klickplattan medan samma problem inte uppstod när vi använde en extern mus. Vi rekommenderar att du dubbelkontrollerar klickplattan vid köp för att säkerställa att den är fri från defekter.
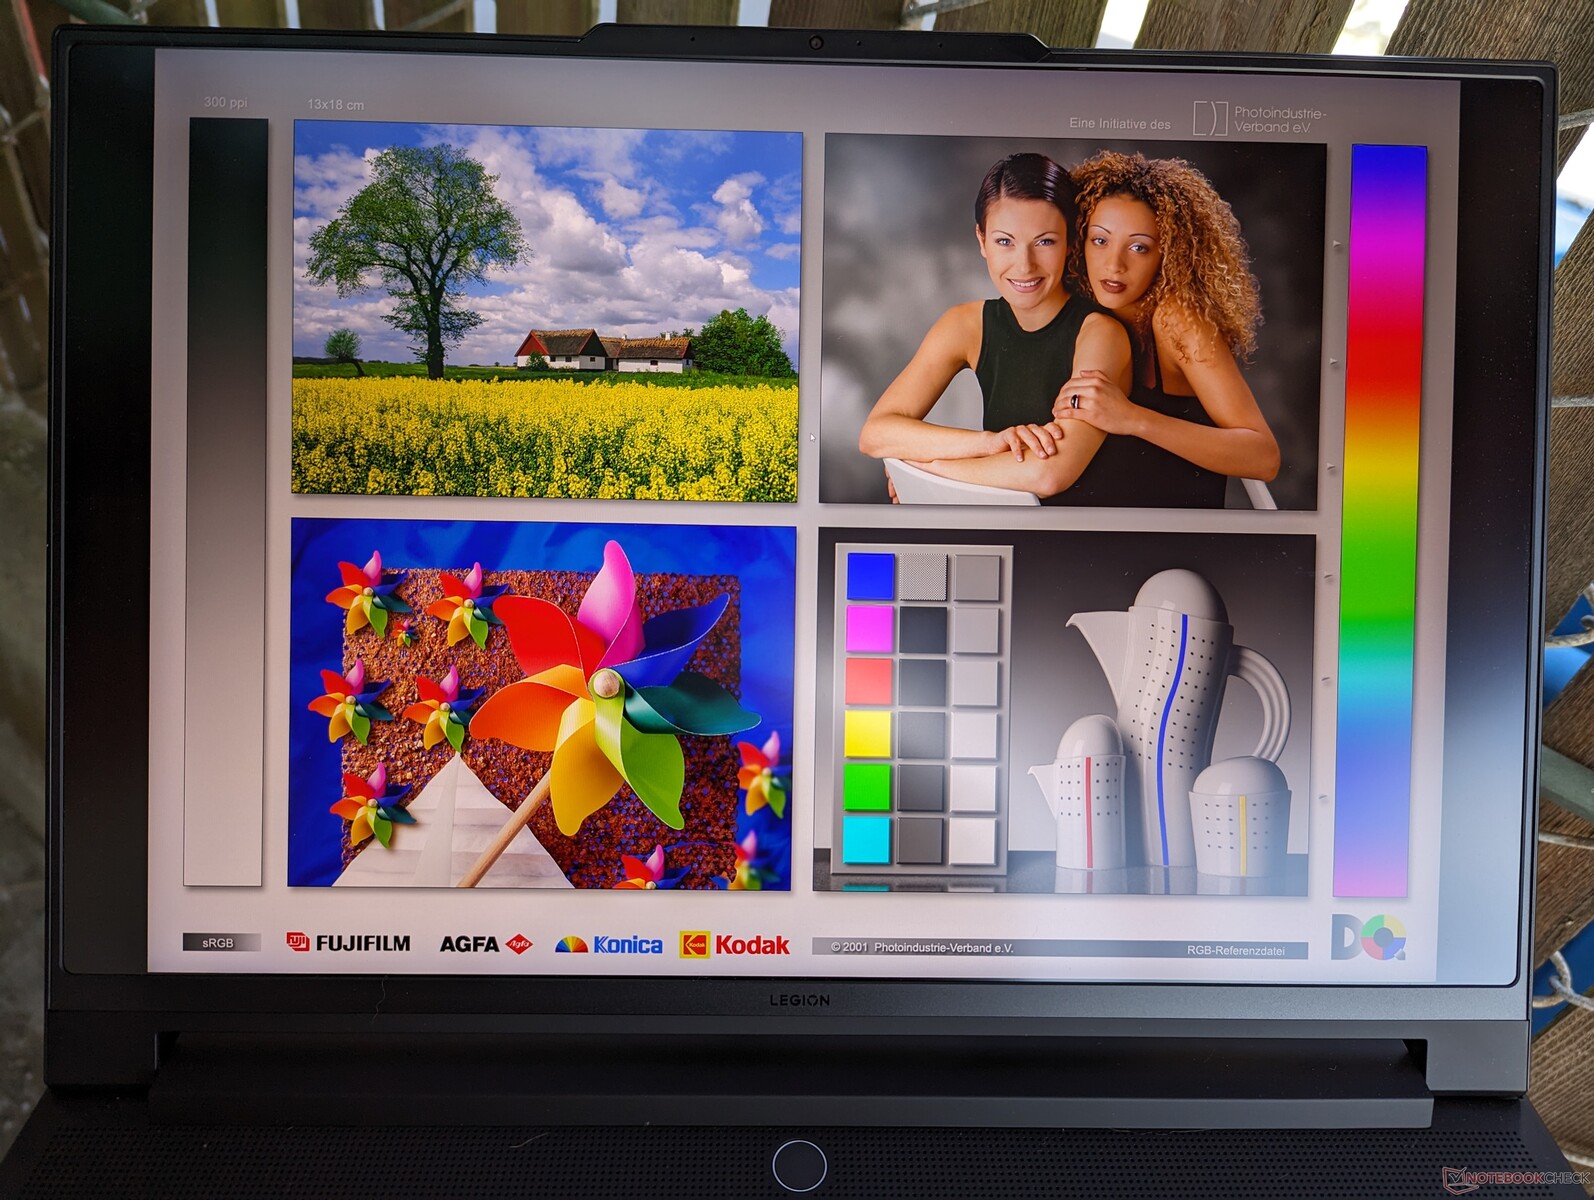
Display - den största attraktionen

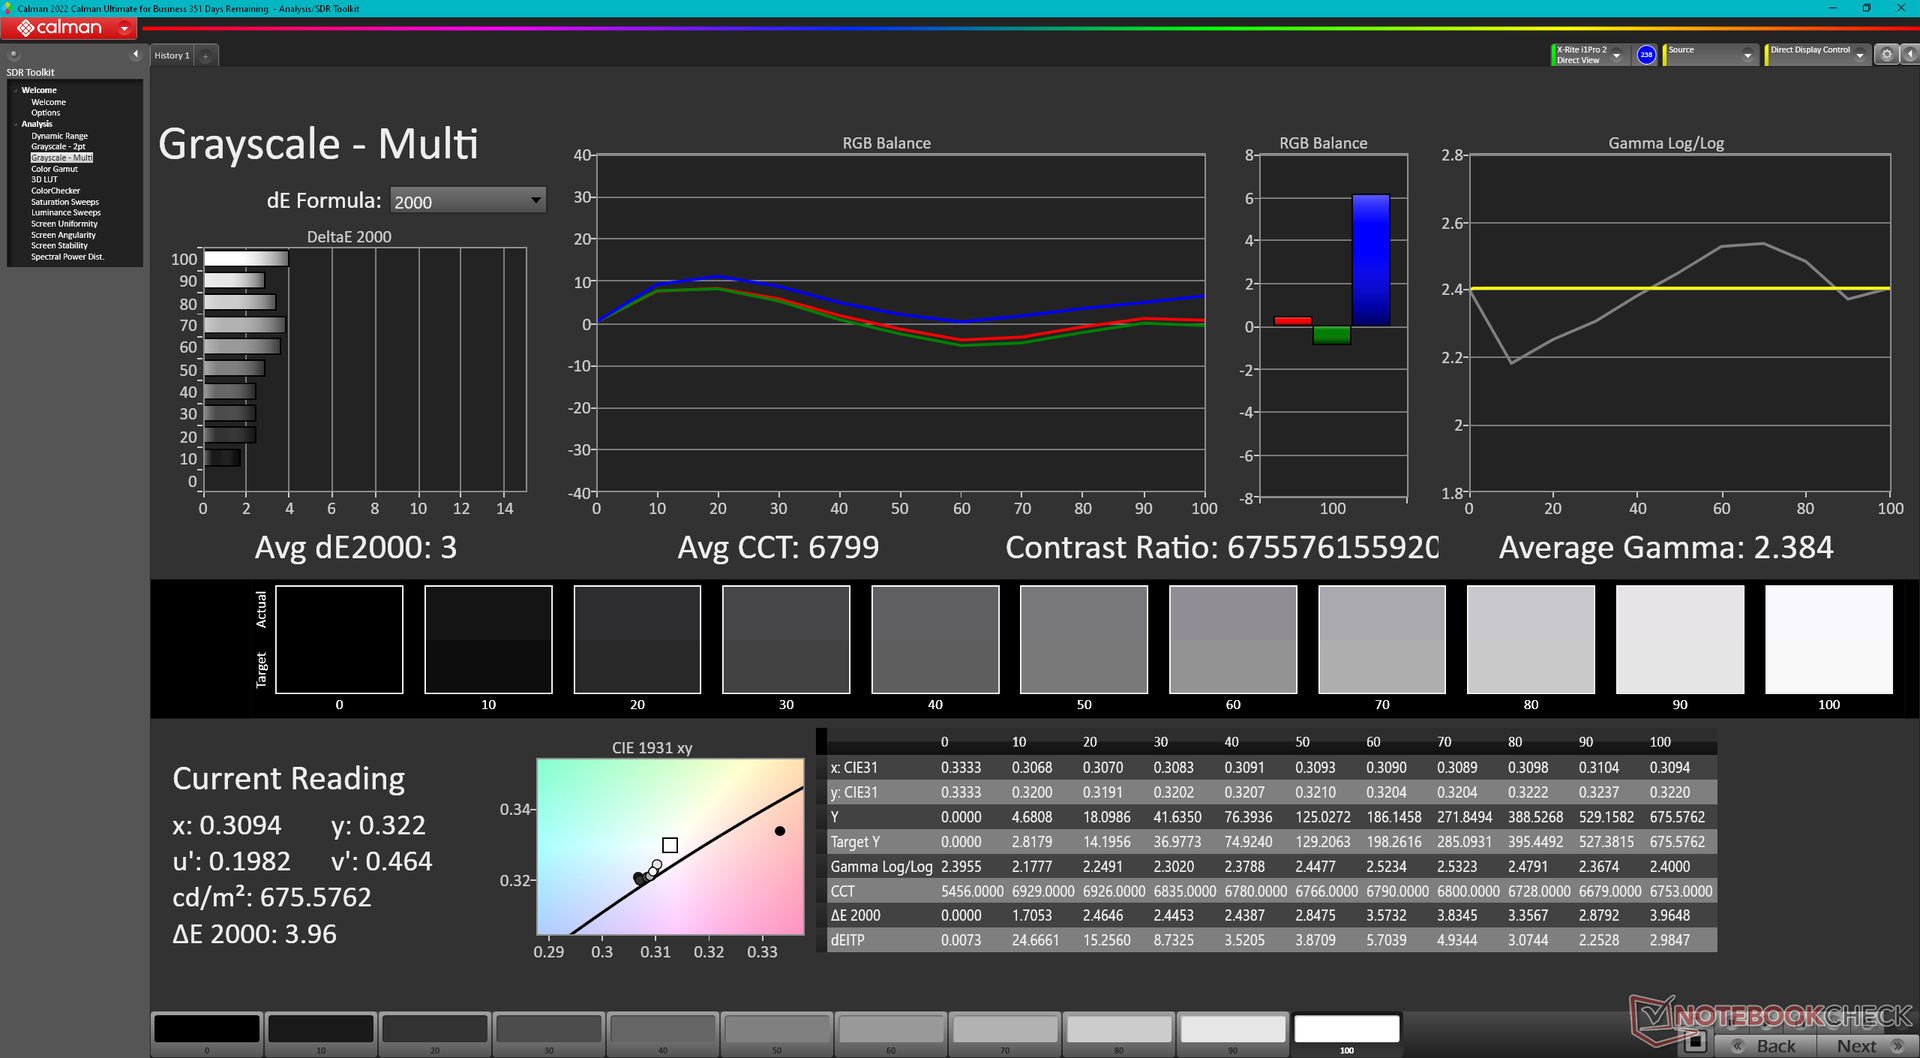
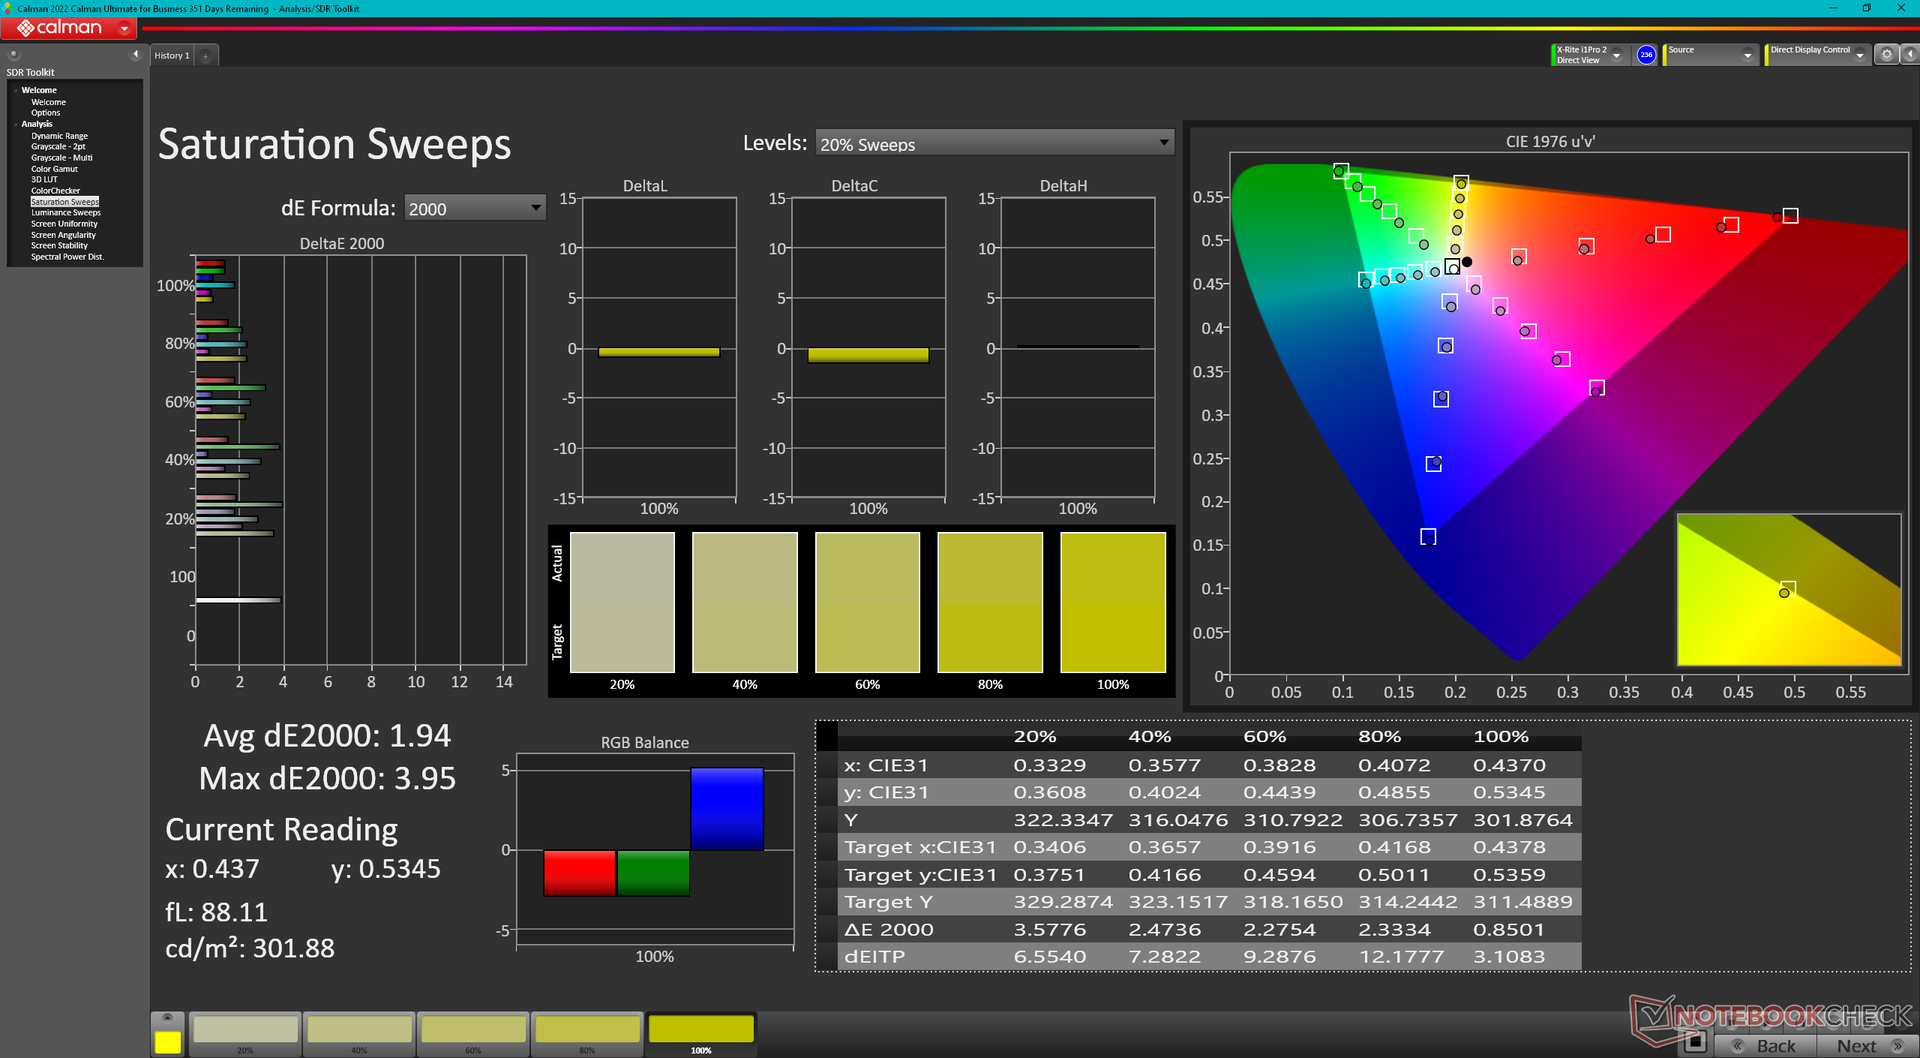
Jämfört med traditionella IPS och OLED erbjuder mini-LED bättre svartnivåer än de förstnämnda och ännu högre maximal ljusstyrka än de sistnämnda för generellt bättre HDR-stöd. I det här fallet annonserar Lenovo en maximal ljusstyrka på 1200 nits för HDR1000-stöd, vilket är sällsynt att se på bärbara datorskärmar. Vi kan bekräfta en maximal ljusstyrka på 1025 nits i verkligheten när HDR-läget är aktiverat eller 675 nits när SDR-innehåll visas. De flesta IPS- och OLED-paneler på bärbara speldatorer ligger vanligtvis mellan 300 och 500 nits i jämförelse. Därför bör du spela upp innehåll i HDR-läge när det är möjligt för att bättre utnyttja fördelarna med mini-LED.
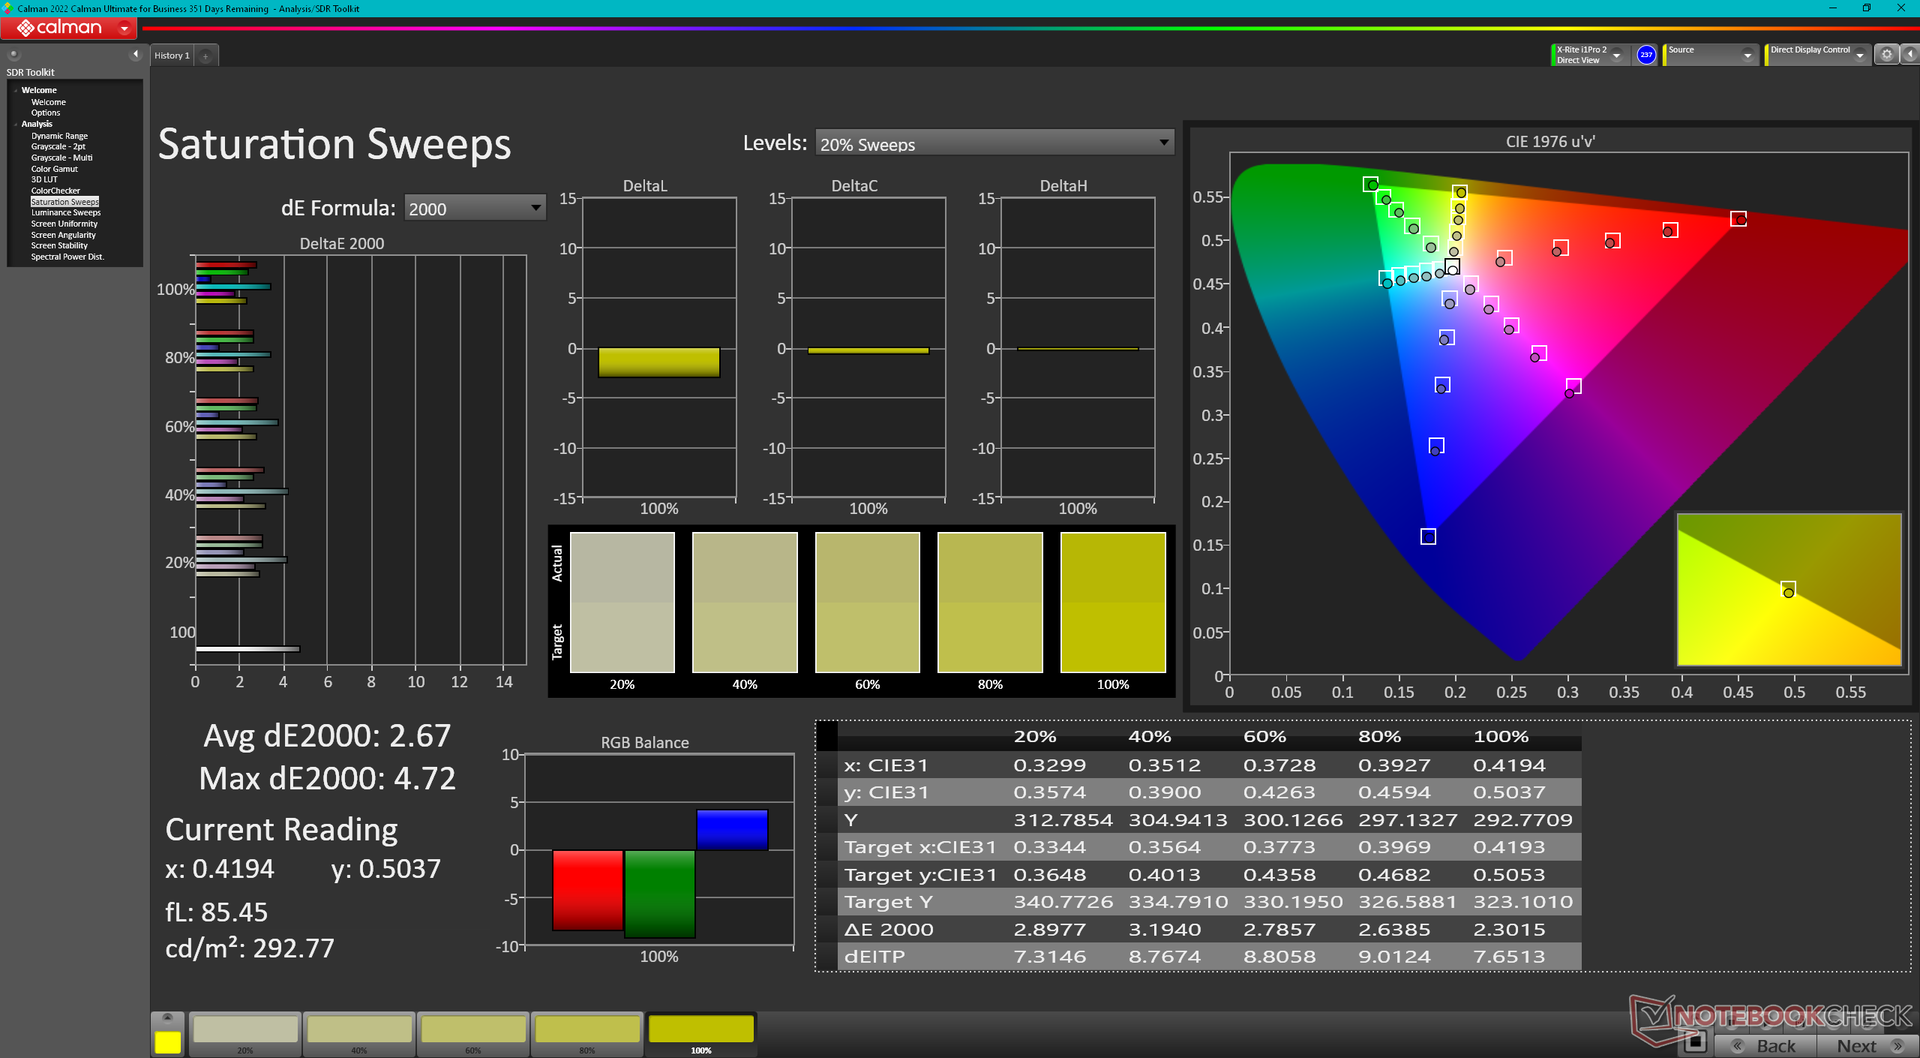
Förutom de mycket höga ljusstyrkenivåerna har panelen även G-Sync, fullständiga DCI-P3-färger, snabb 165 Hz uppdateringsfrekvens och snabba svarstider för att passa för både innehållsskapande och speländamål.
| |||||||||||||||||||||||||
Distribution av ljusstyrkan: 96 %
Mitt på batteriet: 674.9 cd/m²
Kontrast: 16873:1 (Svärta: 0.04 cd/m²)
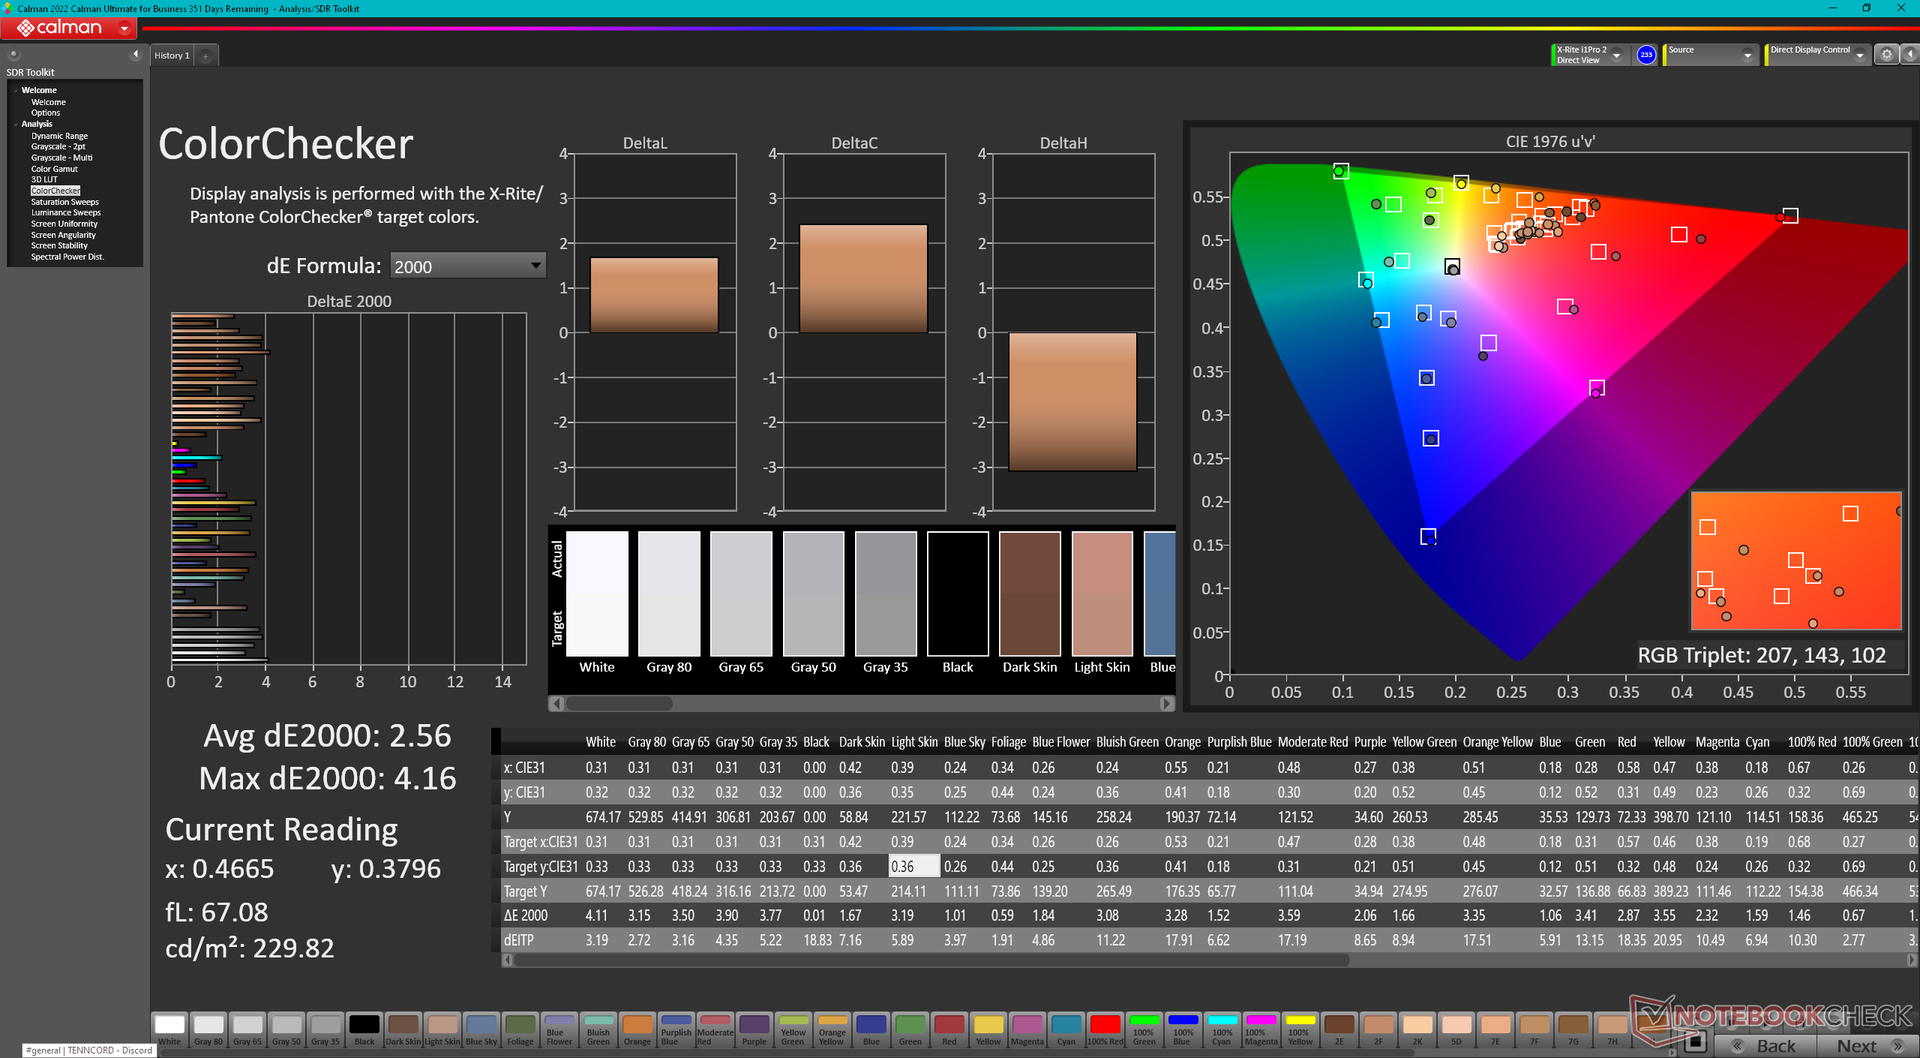
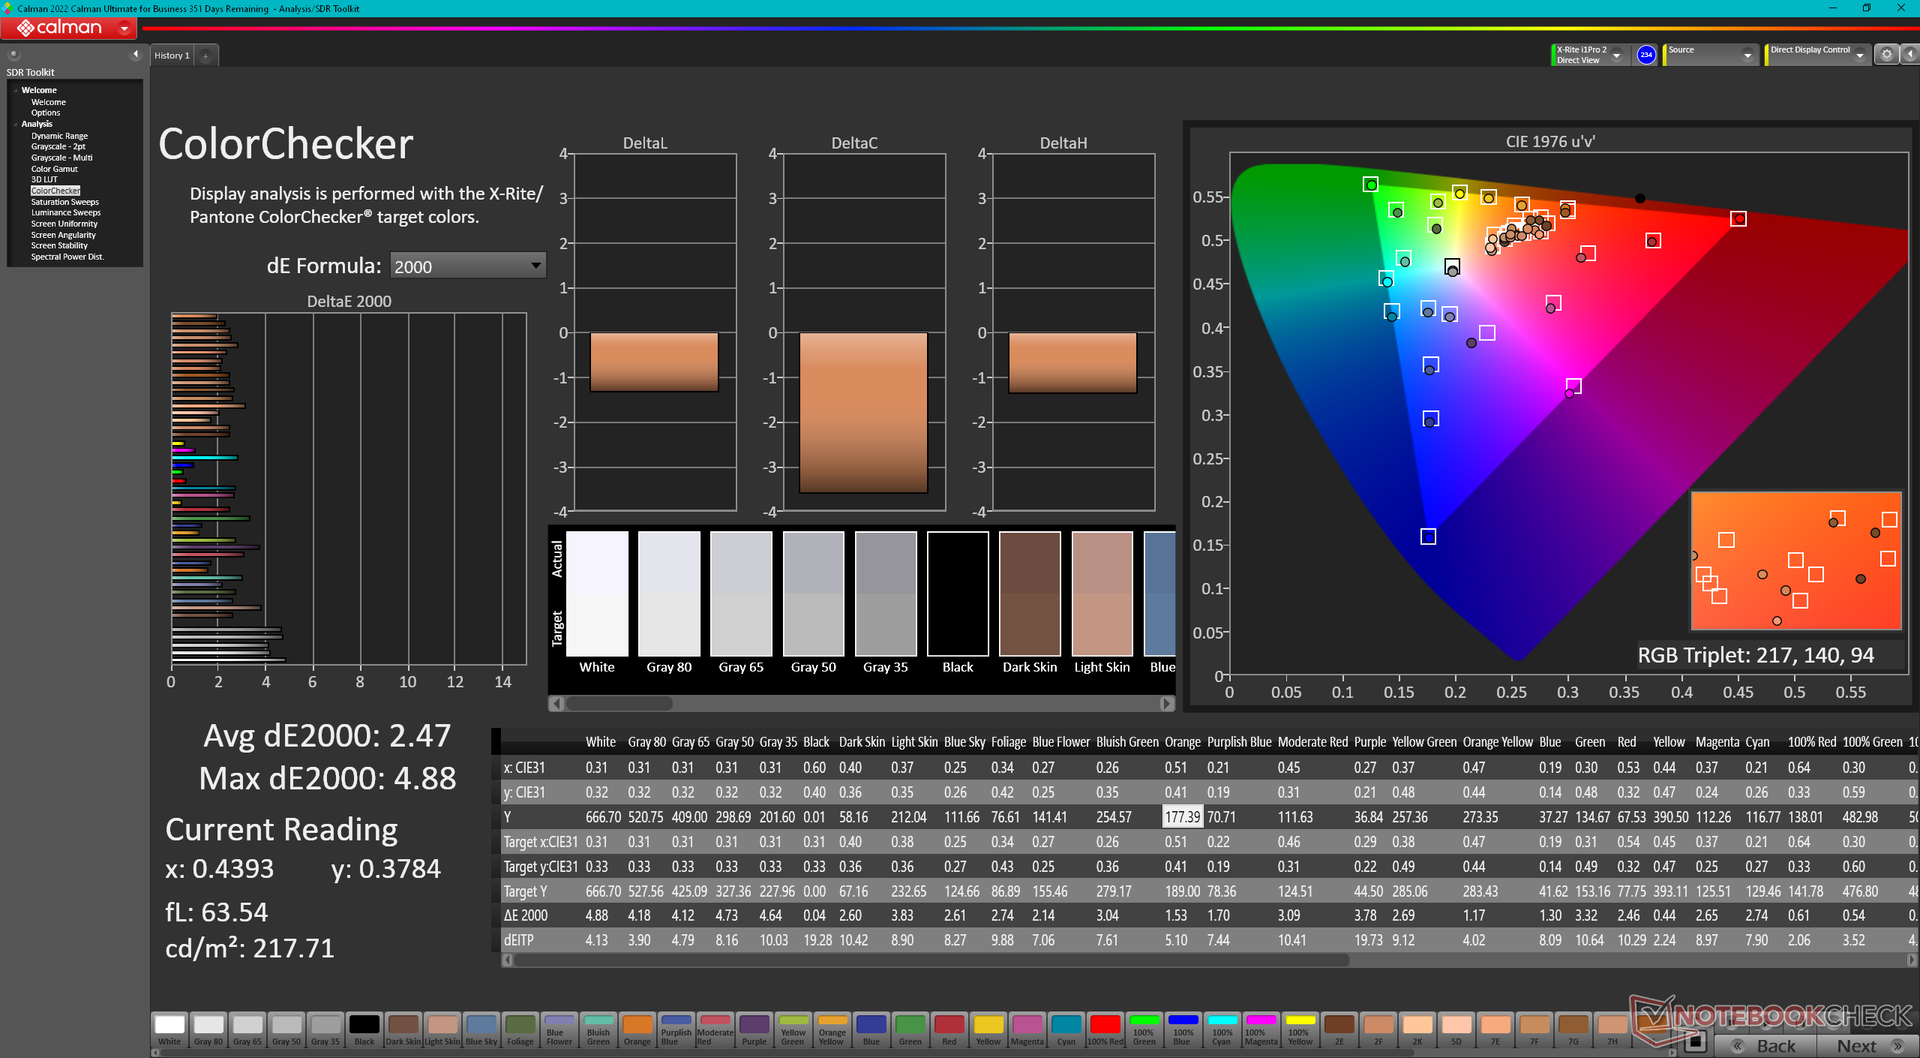
ΔE ColorChecker Calman: 2.56 | ∀{0.5-29.43 Ø4.71}
calibrated: 2.47
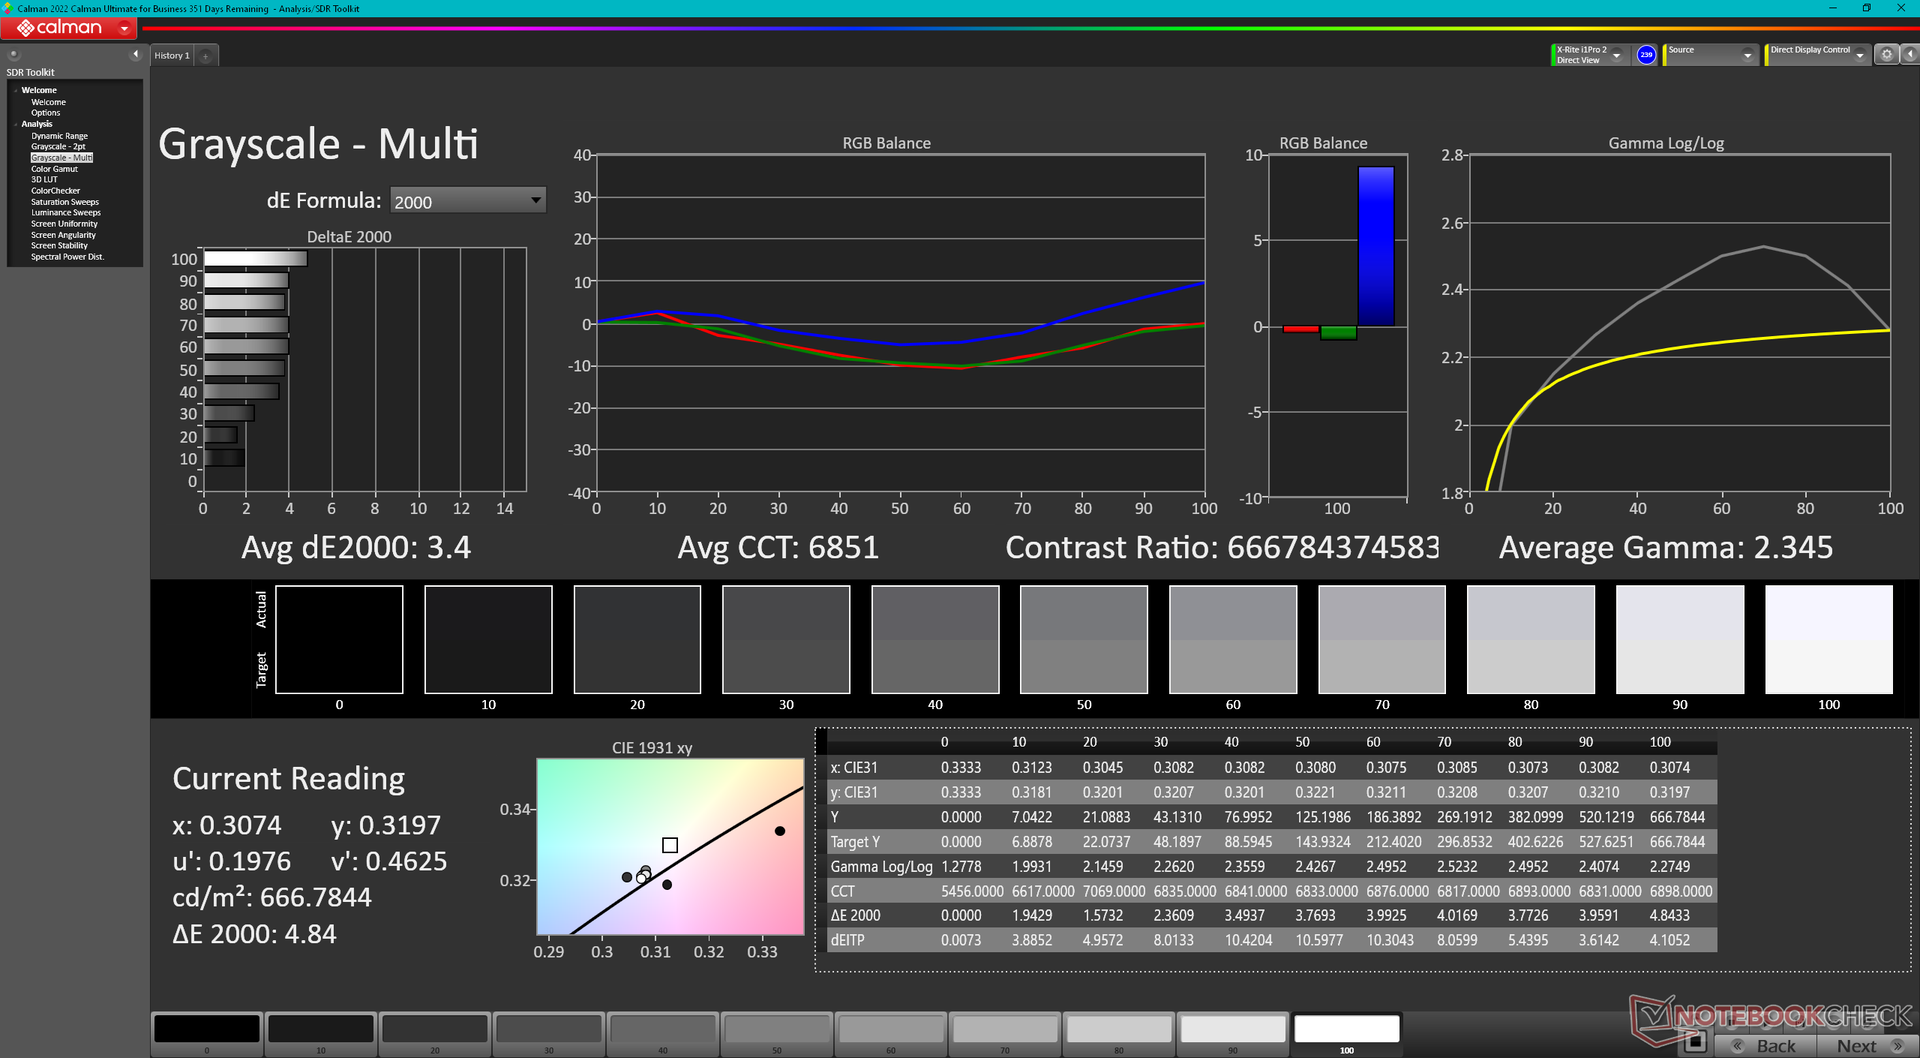
ΔE Greyscale Calman: 3 | ∀{0.09-98 Ø4.96}
87% AdobeRGB 1998 (Argyll 3D)
99.9% sRGB (Argyll 3D)
97.2% Display P3 (Argyll 3D)
Gamma: 2.38
CCT: 6799 K
| Lenovo Legion 9 16IRX8 CSOT T3 MNG007ZA2-2, Mini-LED, 3200x2000, 16" | Lenovo Legion Slim 5 16APH8 BOE NJ NE160QDM-NYC, IPS, 2560x1600, 16" | Razer Blade 16 Early 2023 RTX 4090 AUO B160ZAN01.U, mini-LED, 3840x2400, 16" | Asus ROG Strix G16 G614JZ TL160ADMP03-0, IPS, 2560x1600, 16" | HP Omen Transcend 16 AUOA3A6, Mini-LED, 2560x1600, 16" | Alienware x16 R1 BOE NE16NZ4, IPS, 2560x1600, 16" | |
|---|---|---|---|---|---|---|
| Display | -16% | 2% | -1% | 1% | 1% | |
| Display P3 Coverage (%) | 97.2 | 69.3 -29% | 99.9 3% | 97 0% | 99.2 2% | 99.2 2% |
| sRGB Coverage (%) | 99.9 | 100 0% | 100 0% | 99.9 0% | 100 0% | 100 0% |
| AdobeRGB 1998 Coverage (%) | 87 | 70 -20% | 90.9 4% | 84.9 -2% | 87.6 1% | 88.6 2% |
| Response Times | 27% | -206% | 53% | -121% | 37% | |
| Response Time Grey 50% / Grey 80% * (ms) | 13.3 ? | 10.7 ? 20% | 10.2 ? 23% | 5.1 ? 62% | 26.4 ? -98% | 5.1 ? 62% |
| Response Time Black / White * (ms) | 11.6 ? | 7.8 ? 33% | 62.04 ? -435% | 6.6 ? 43% | 28.2 ? -143% | 10.3 ? 11% |
| PWM Frequency (Hz) | 4742 | 2420 ? | 3506 ? | |||
| Screen | -109% | 62% | -111% | -26% | -73% | |
| Brightness middle (cd/m²) | 674.9 | 371.6 -45% | 730 8% | 470 -30% | 791.1 17% | 302.2 -55% |
| Brightness (cd/m²) | 682 | 343 -50% | 729 7% | 459 -33% | 800 17% | 285 -58% |
| Brightness Distribution (%) | 96 | 84 -12% | 94 -2% | 93 -3% | 95 -1% | 89 -7% |
| Black Level * (cd/m²) | 0.04 | 0.44 -1000% | 0.0045 89% | 0.42 -950% | 0.04 -0% | 0.26 -550% |
| Contrast (:1) | 16873 | 845 -95% | 162222 861% | 1119 -93% | 19778 17% | 1162 -93% |
| Colorchecker dE 2000 * | 2.56 | 1.52 41% | 5.65 -121% | 1.86 27% | 4.37 -71% | 1.63 36% |
| Colorchecker dE 2000 max. * | 4.16 | 2.68 36% | 10.11 -143% | 3.87 7% | 10.39 -150% | 4.13 1% |
| Colorchecker dE 2000 calibrated * | 2.47 | 0.33 87% | 1.85 25% | 0.93 62% | 1.04 58% | 1.17 53% |
| Greyscale dE 2000 * | 3 | 1.2 60% | 8.1 -170% | 2.7 10% | 6.5 -117% | 2.5 17% |
| Gamma | 2.38 92% | 2.1 105% | 1.98 111% | 2.246 98% | 2.28 96% | 2.23 99% |
| CCT | 6799 96% | 6503 100% | 5874 111% | 6711 97% | 6000 108% | 6590 99% |
| Totalt genomsnitt (program/inställningar) | -33% /
-70% | -47% /
11% | -20% /
-64% | -49% /
-33% | -12% /
-41% |
* ... mindre är bättre
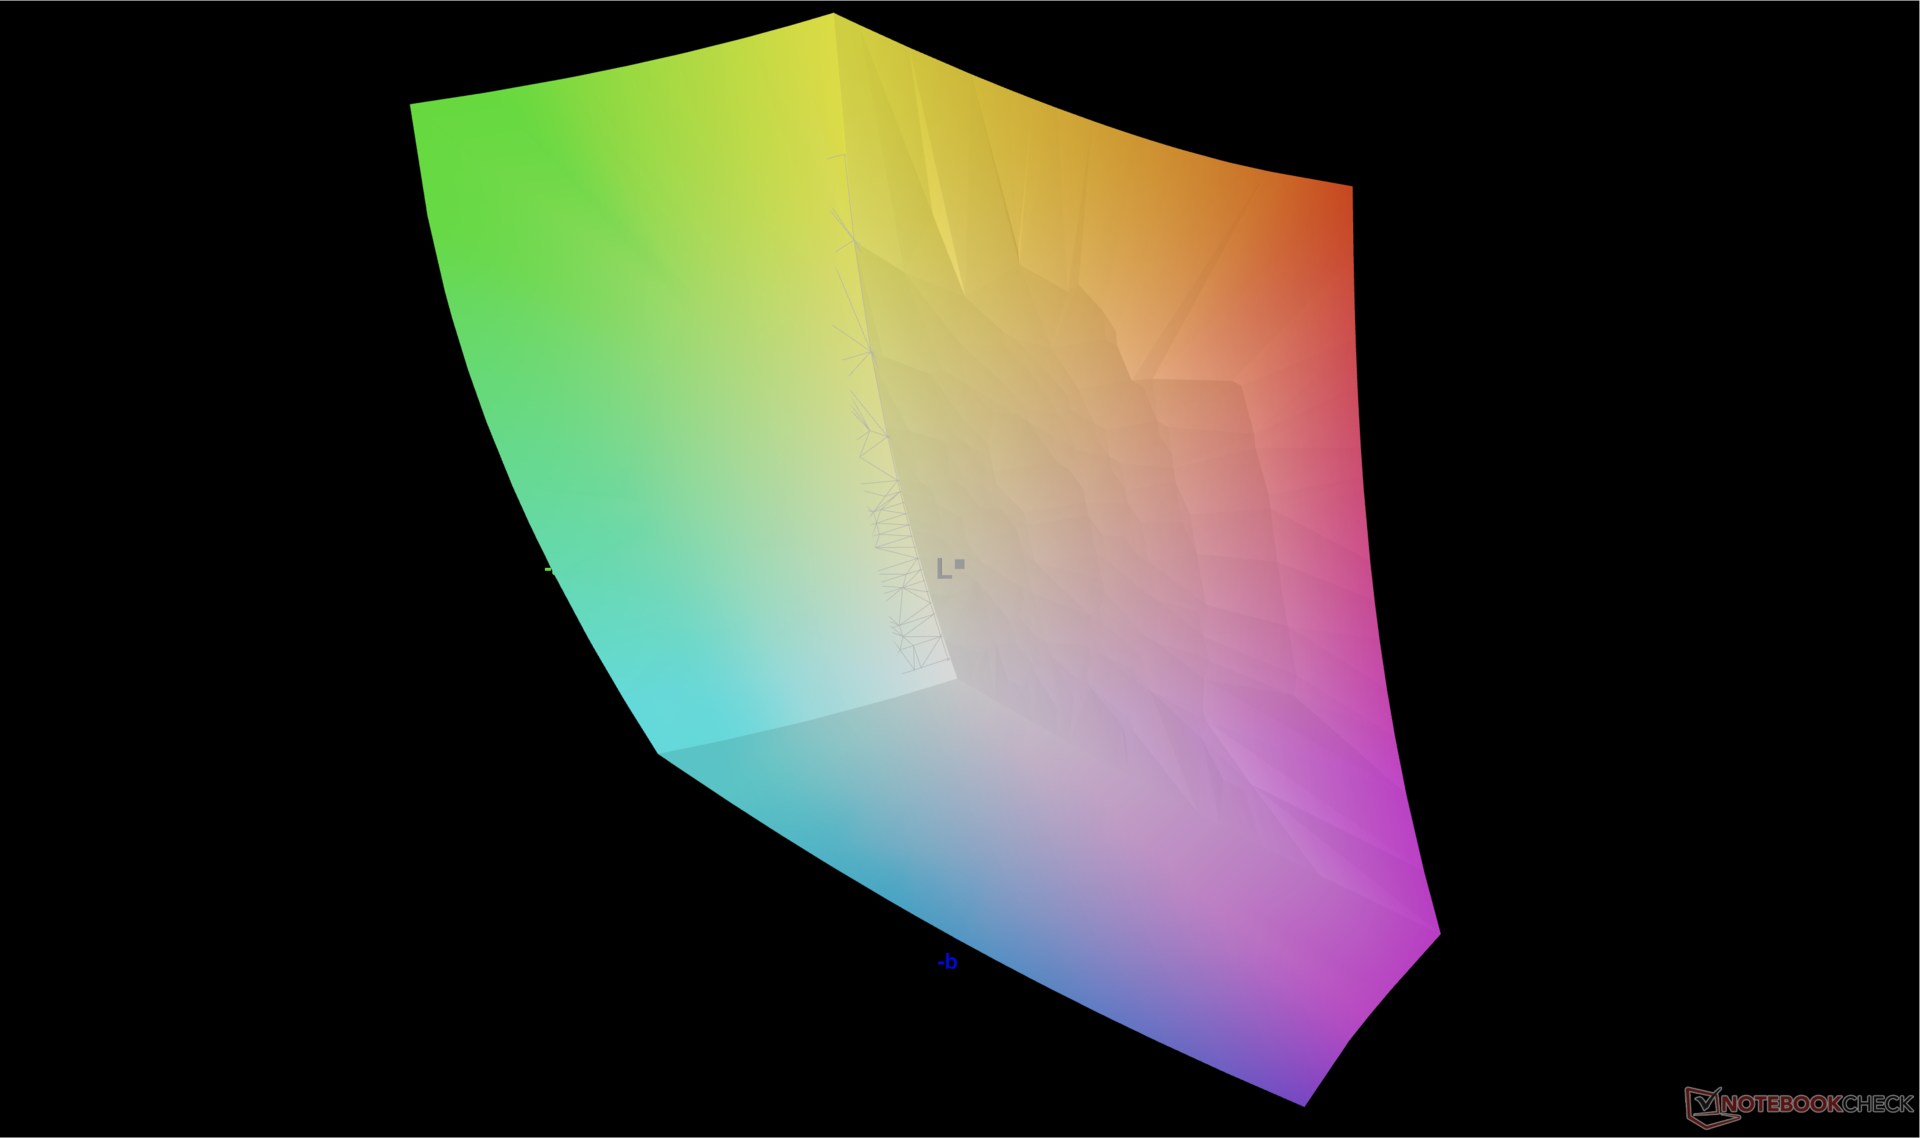
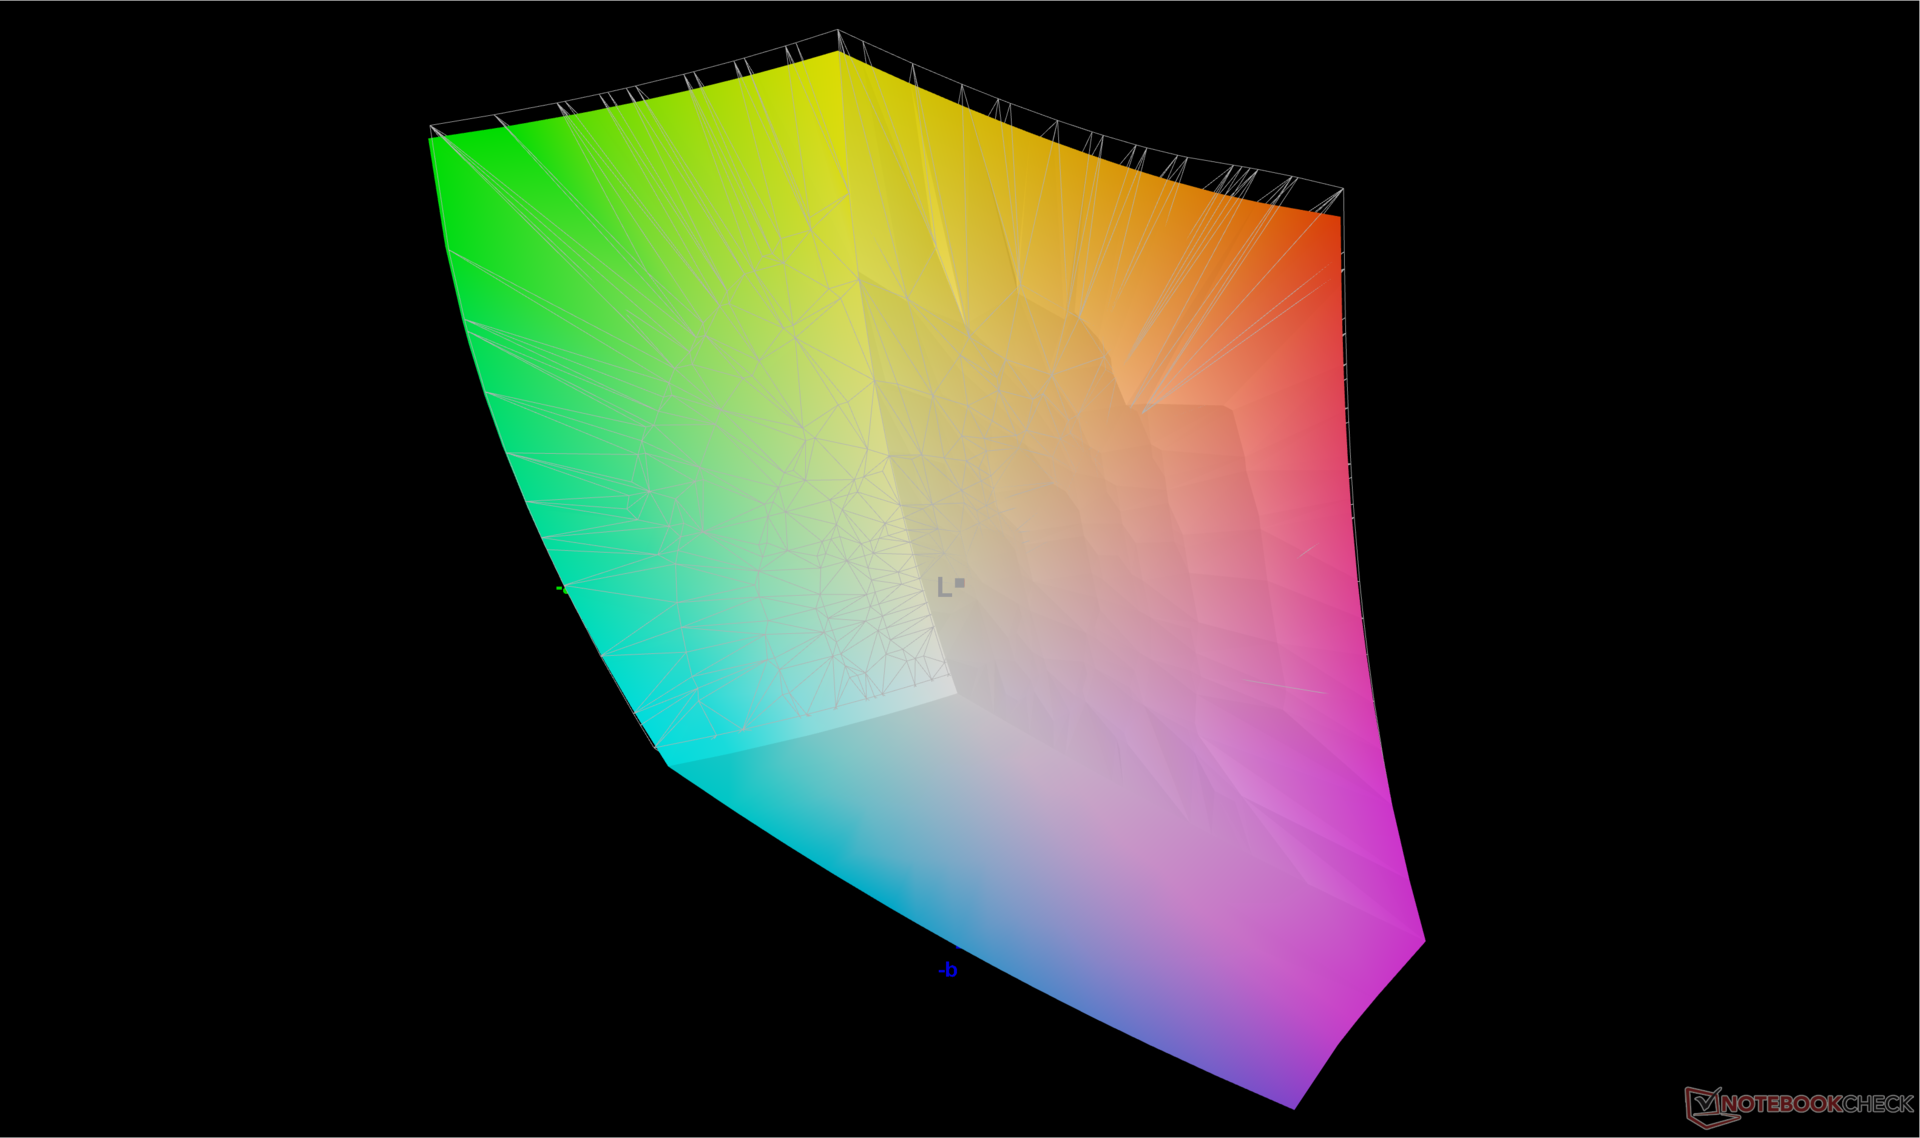
Skärmen är väl kalibrerad mot P3-standarden med genomsnittliga DeltaE-värden för gråskala och färg på bara 3 respektive 2,56.
Visa svarstider
| ↔ Svarstid svart till vitt | ||
|---|---|---|
| 11.6 ms ... stiga ↗ och falla ↘ kombinerat | ↗ 5.1 ms stiga | 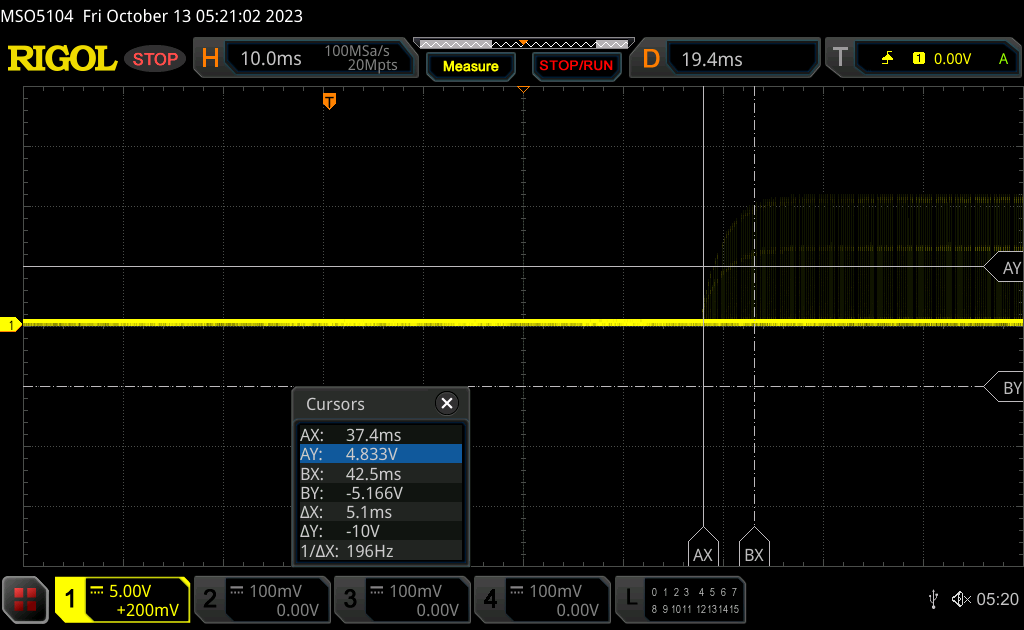 |
| ↘ 6.5 ms hösten | ||
| Skärmen visar bra svarsfrekvens i våra tester, men kan vara för långsam för konkurrenskraftiga spelare. I jämförelse sträcker sig alla testade enheter från 0.1 (minst) till 240 (maximalt) ms. » 31 % av alla enheter är bättre. Det betyder att den uppmätta svarstiden är bättre än genomsnittet av alla testade enheter (19.8 ms). | ||
| ↔ Svarstid 50 % grått till 80 % grått | ||
| 13.3 ms ... stiga ↗ och falla ↘ kombinerat | ↗ 5.7 ms stiga | 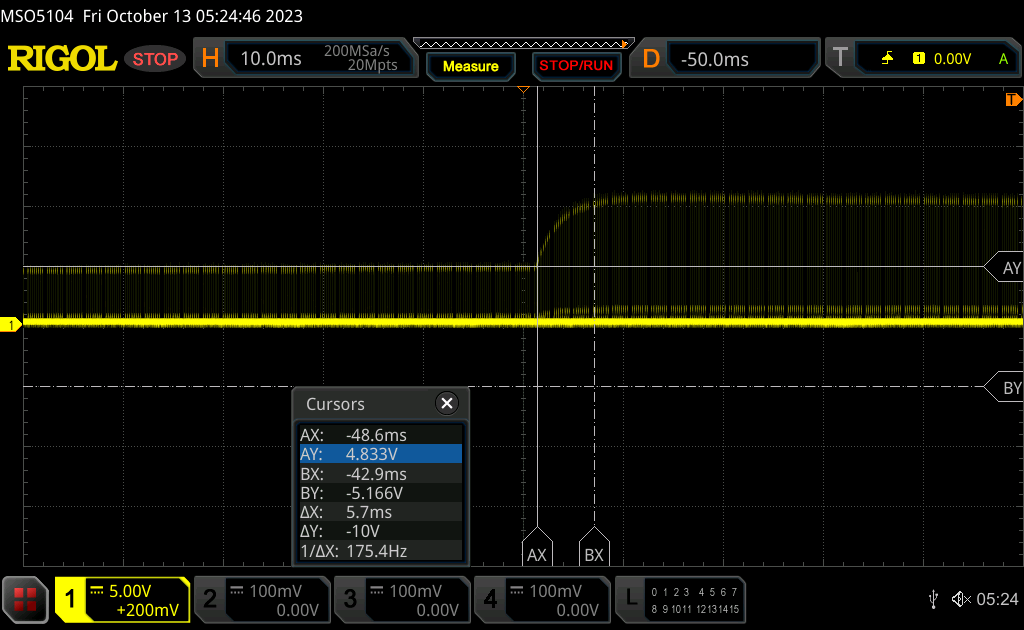 |
| ↘ 7.6 ms hösten | ||
| Skärmen visar bra svarsfrekvens i våra tester, men kan vara för långsam för konkurrenskraftiga spelare. I jämförelse sträcker sig alla testade enheter från 0.165 (minst) till 636 (maximalt) ms. » 27 % av alla enheter är bättre. Det betyder att den uppmätta svarstiden är bättre än genomsnittet av alla testade enheter (31 ms). | ||
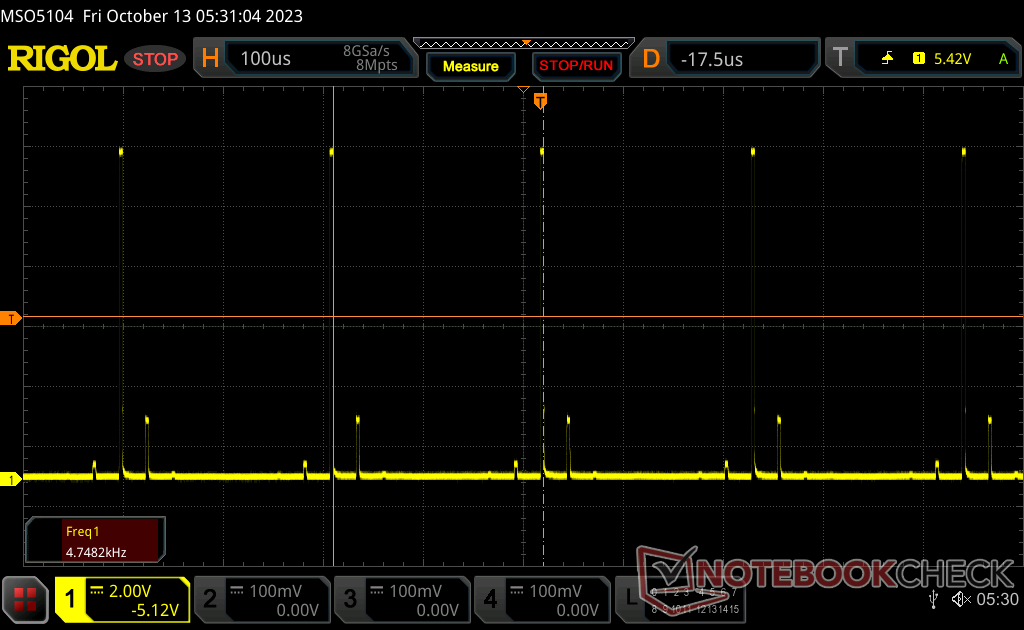
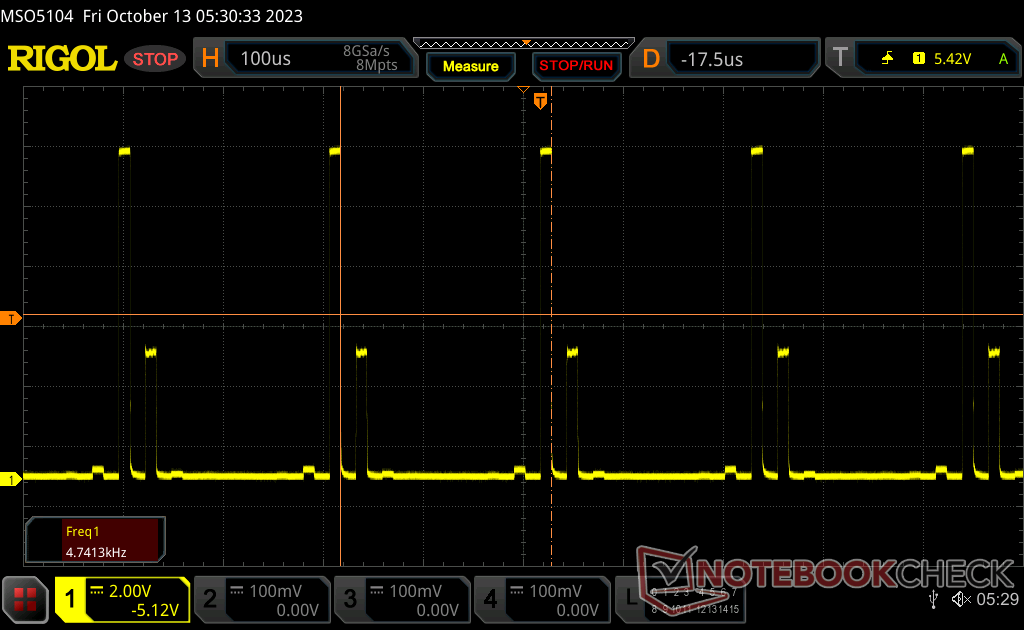
Skärmflimmer / PWM (Puls-Width Modulation)
| Skärmflimmer / PWM upptäckt | 4742 Hz | 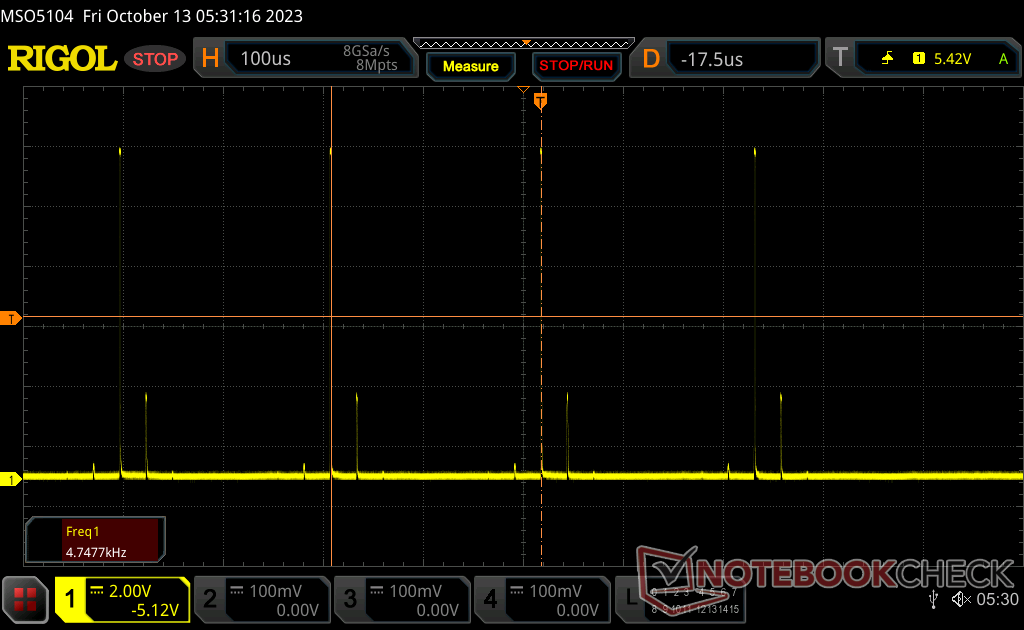 | |
Displayens bakgrundsbelysning flimrar vid 4742 Hz (i värsta fall, t.ex. med PWM) . Frekvensen för 4742 Hz är ganska hög, så de flesta användare som är känsliga för PWM bör inte märka något flimmer. Som jämförelse: 52 % av alla testade enheter använder inte PWM för att dämpa skärmen. Om PWM upptäcktes mättes ett medelvärde av 7757 (minst: 5 - maximum: 343500) Hz. | |||
Flimmer förekommer vid alla ljusstyrkor med en konstant frekvens på 4752 Hz.


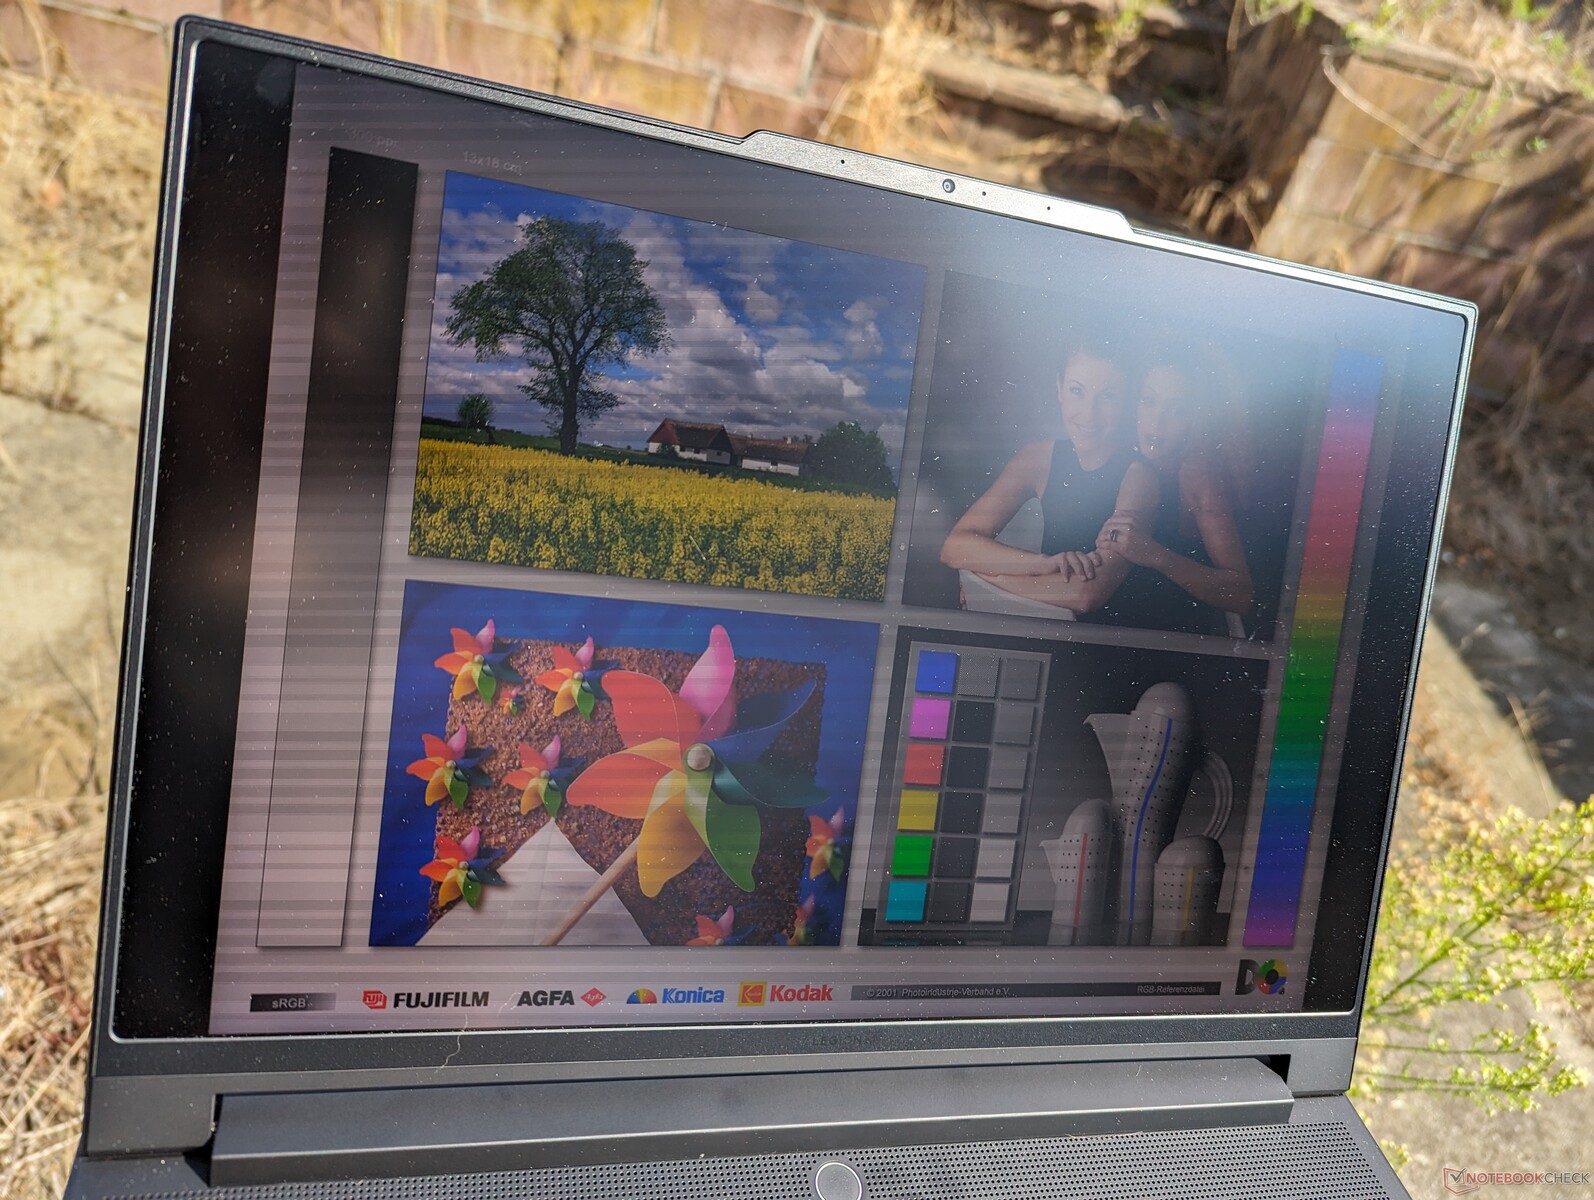
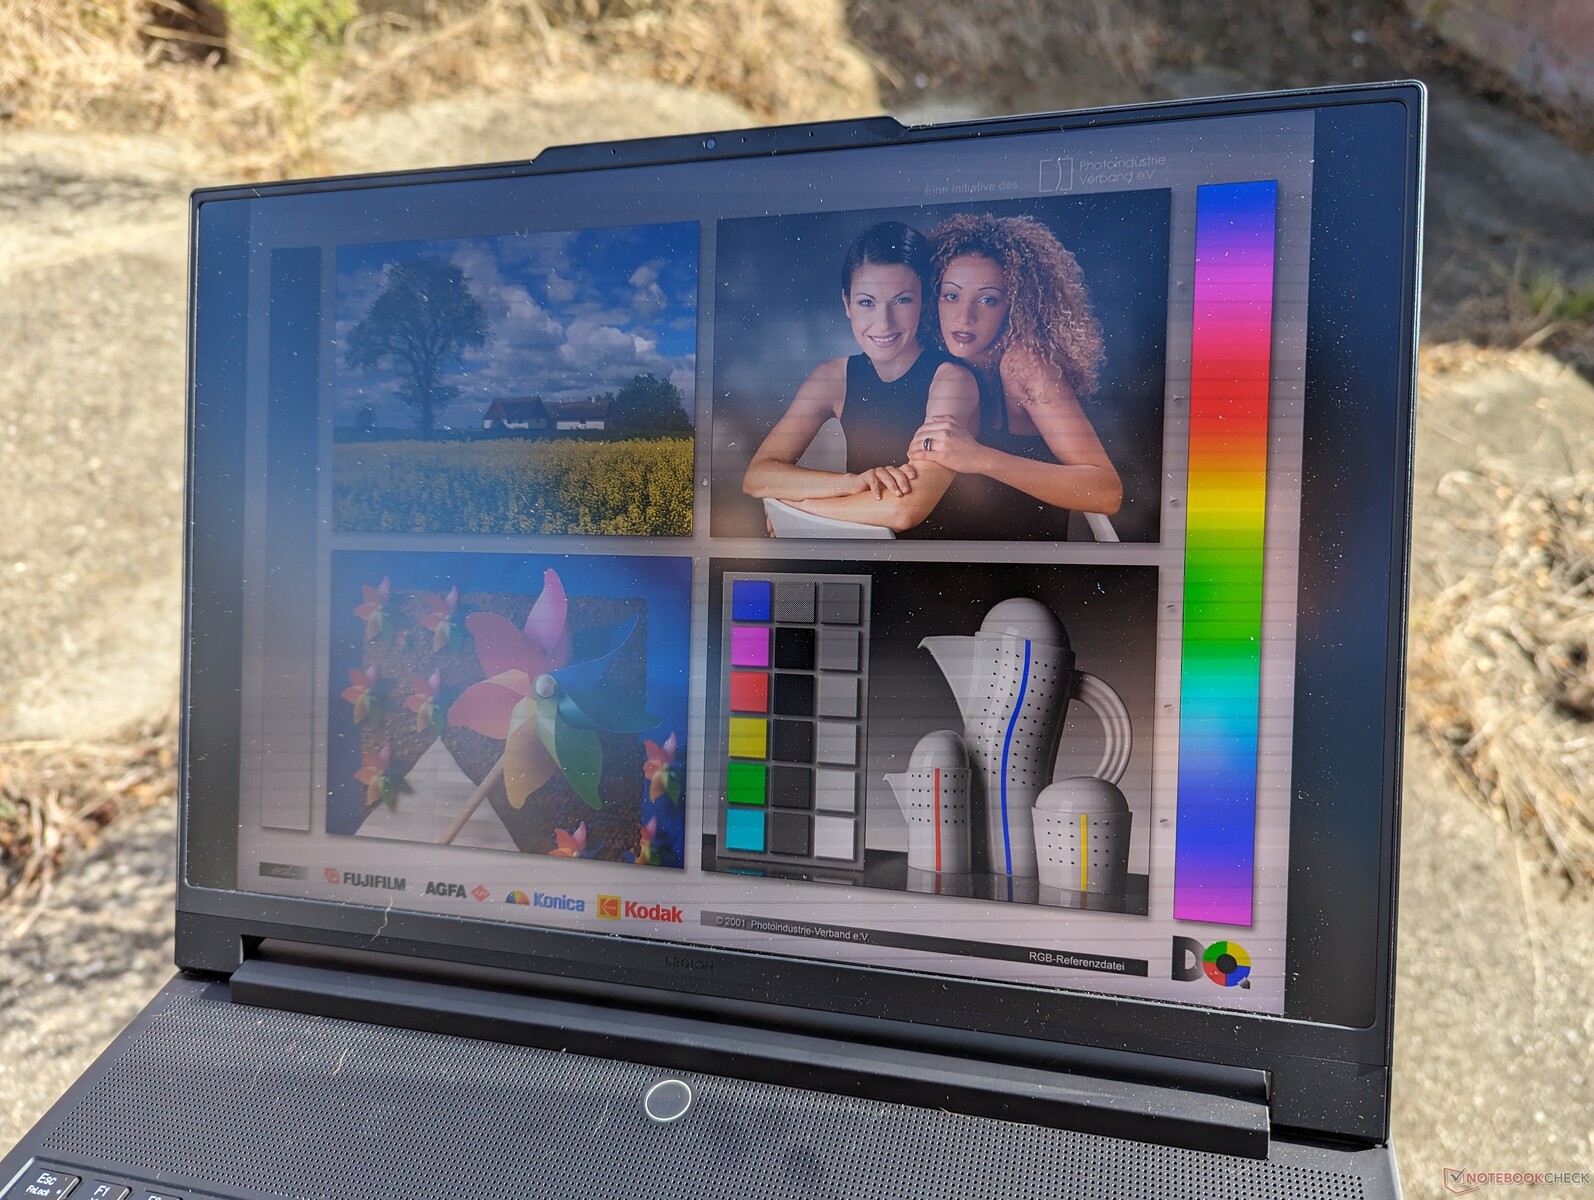
Sikten utomhus är utmärkt för en bärbar speldator tack vare den tidigare nämnda höga maximala ljusstyrkan hos mini-LED. Systemets tunga vikt och korta batteritid begränsar dock fortfarande den bärbara datorn till scenarier inomhus.
Prestanda - ingen Core i7 tillåten
Villkor för testning
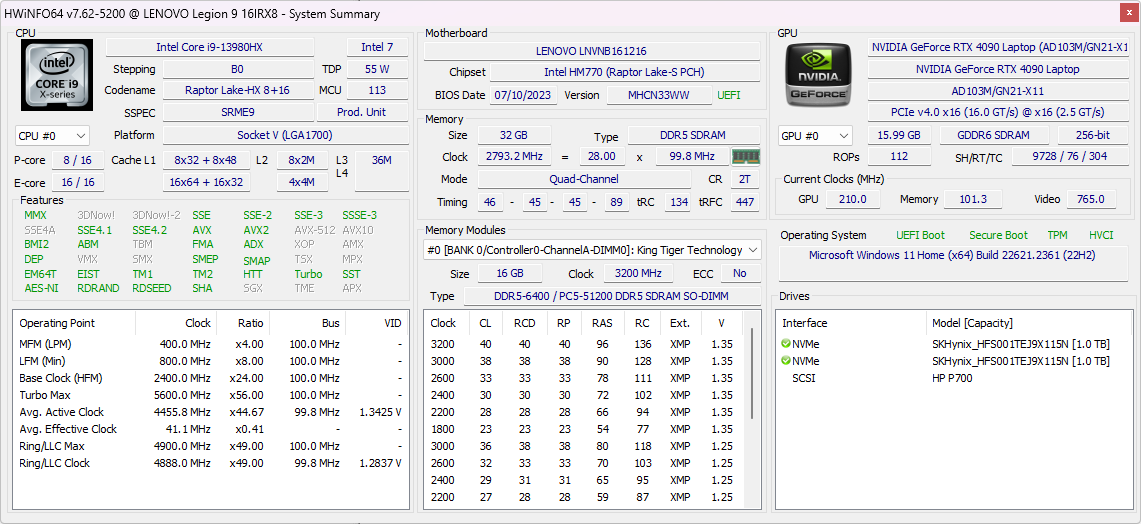
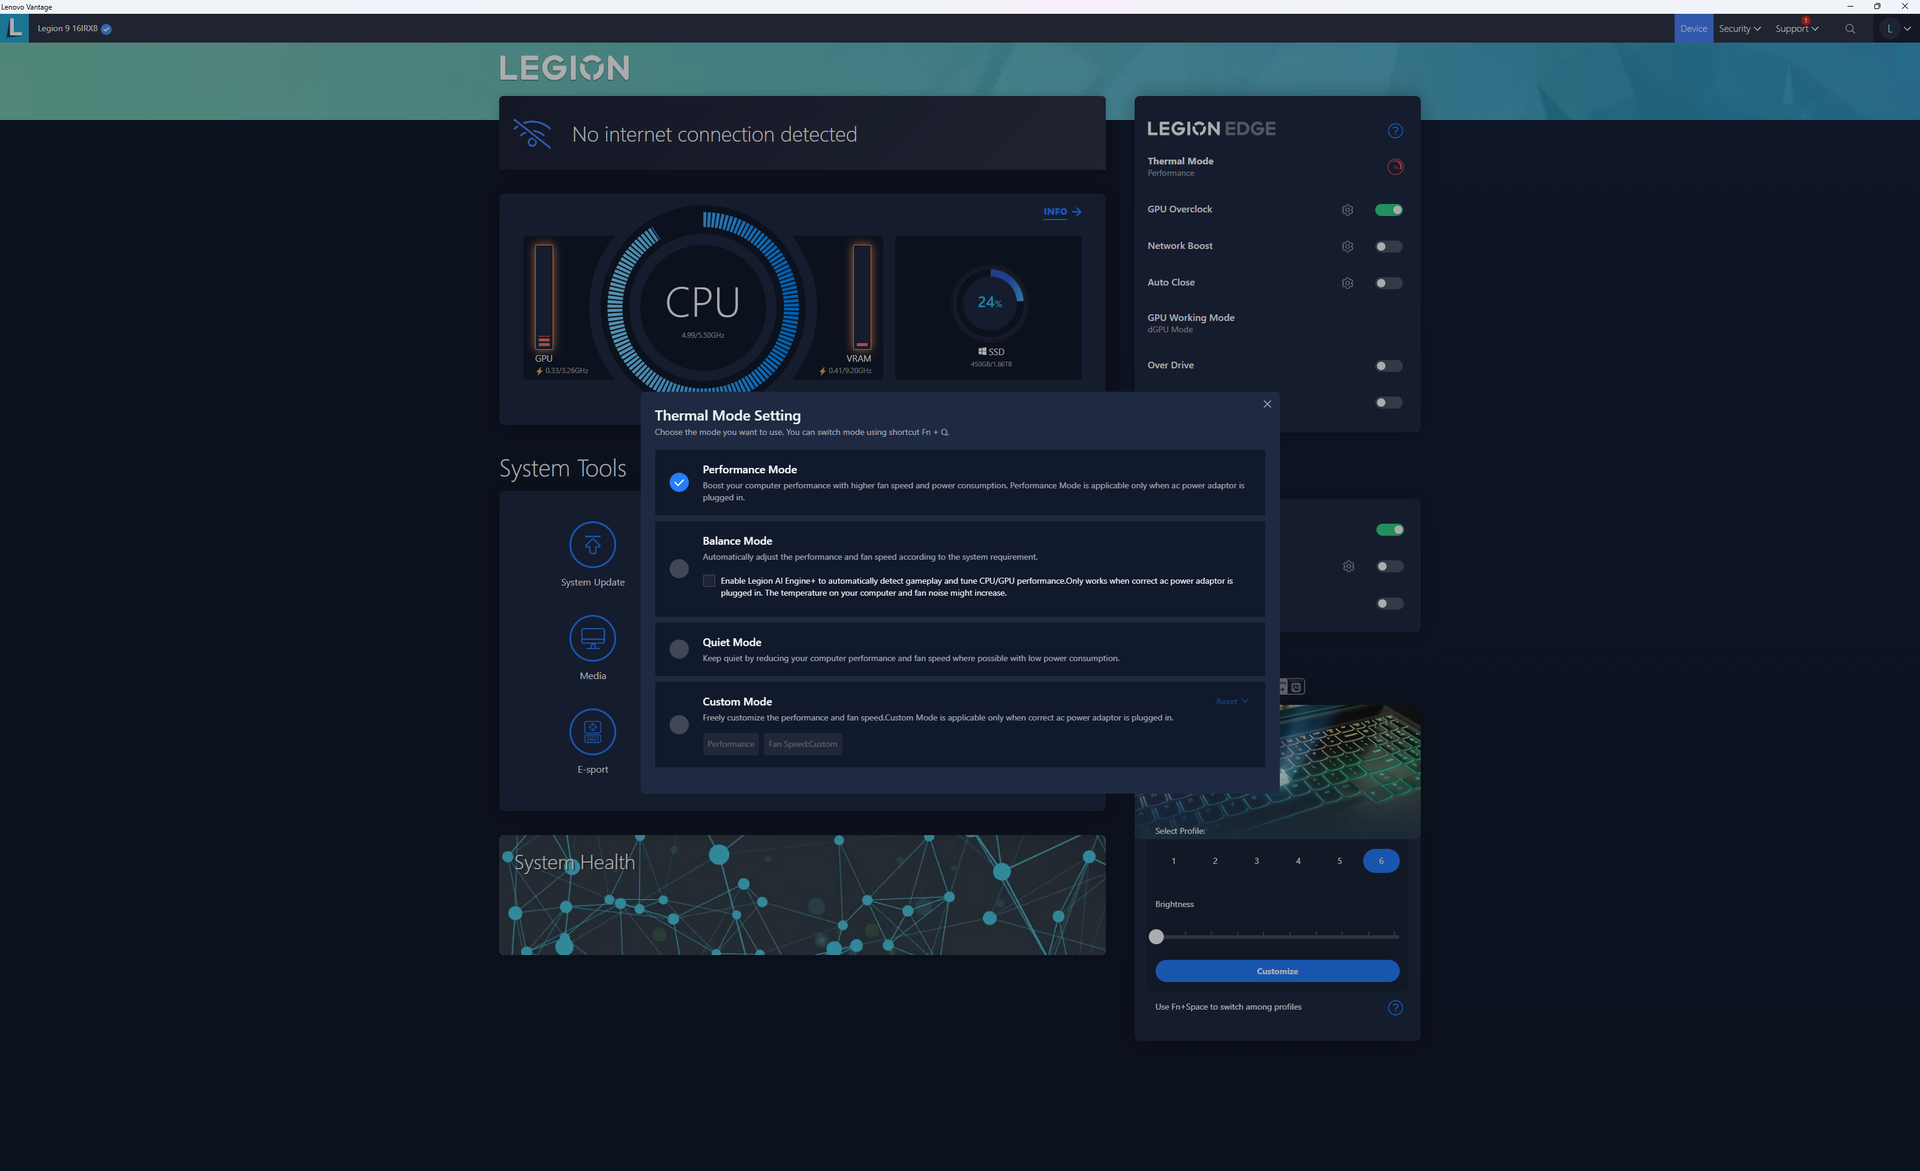
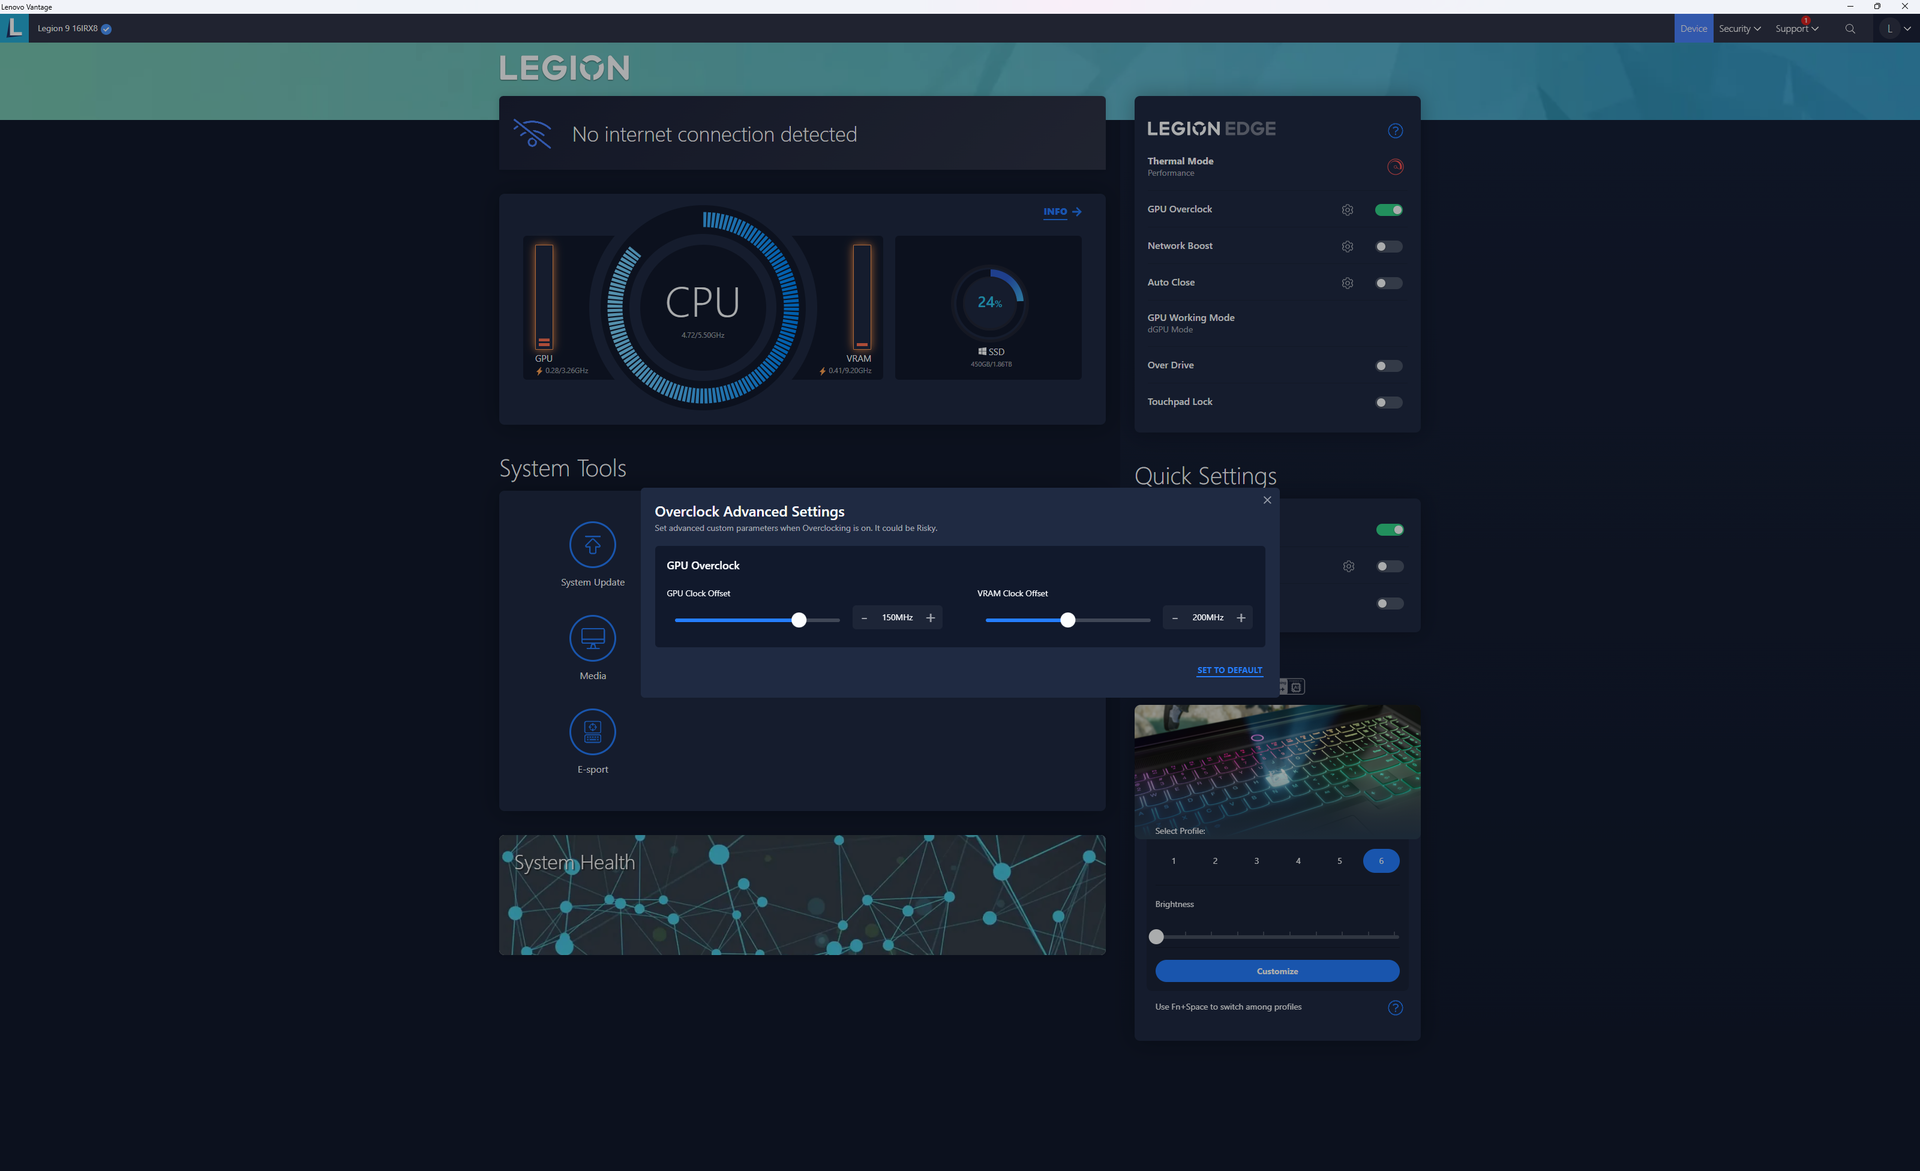
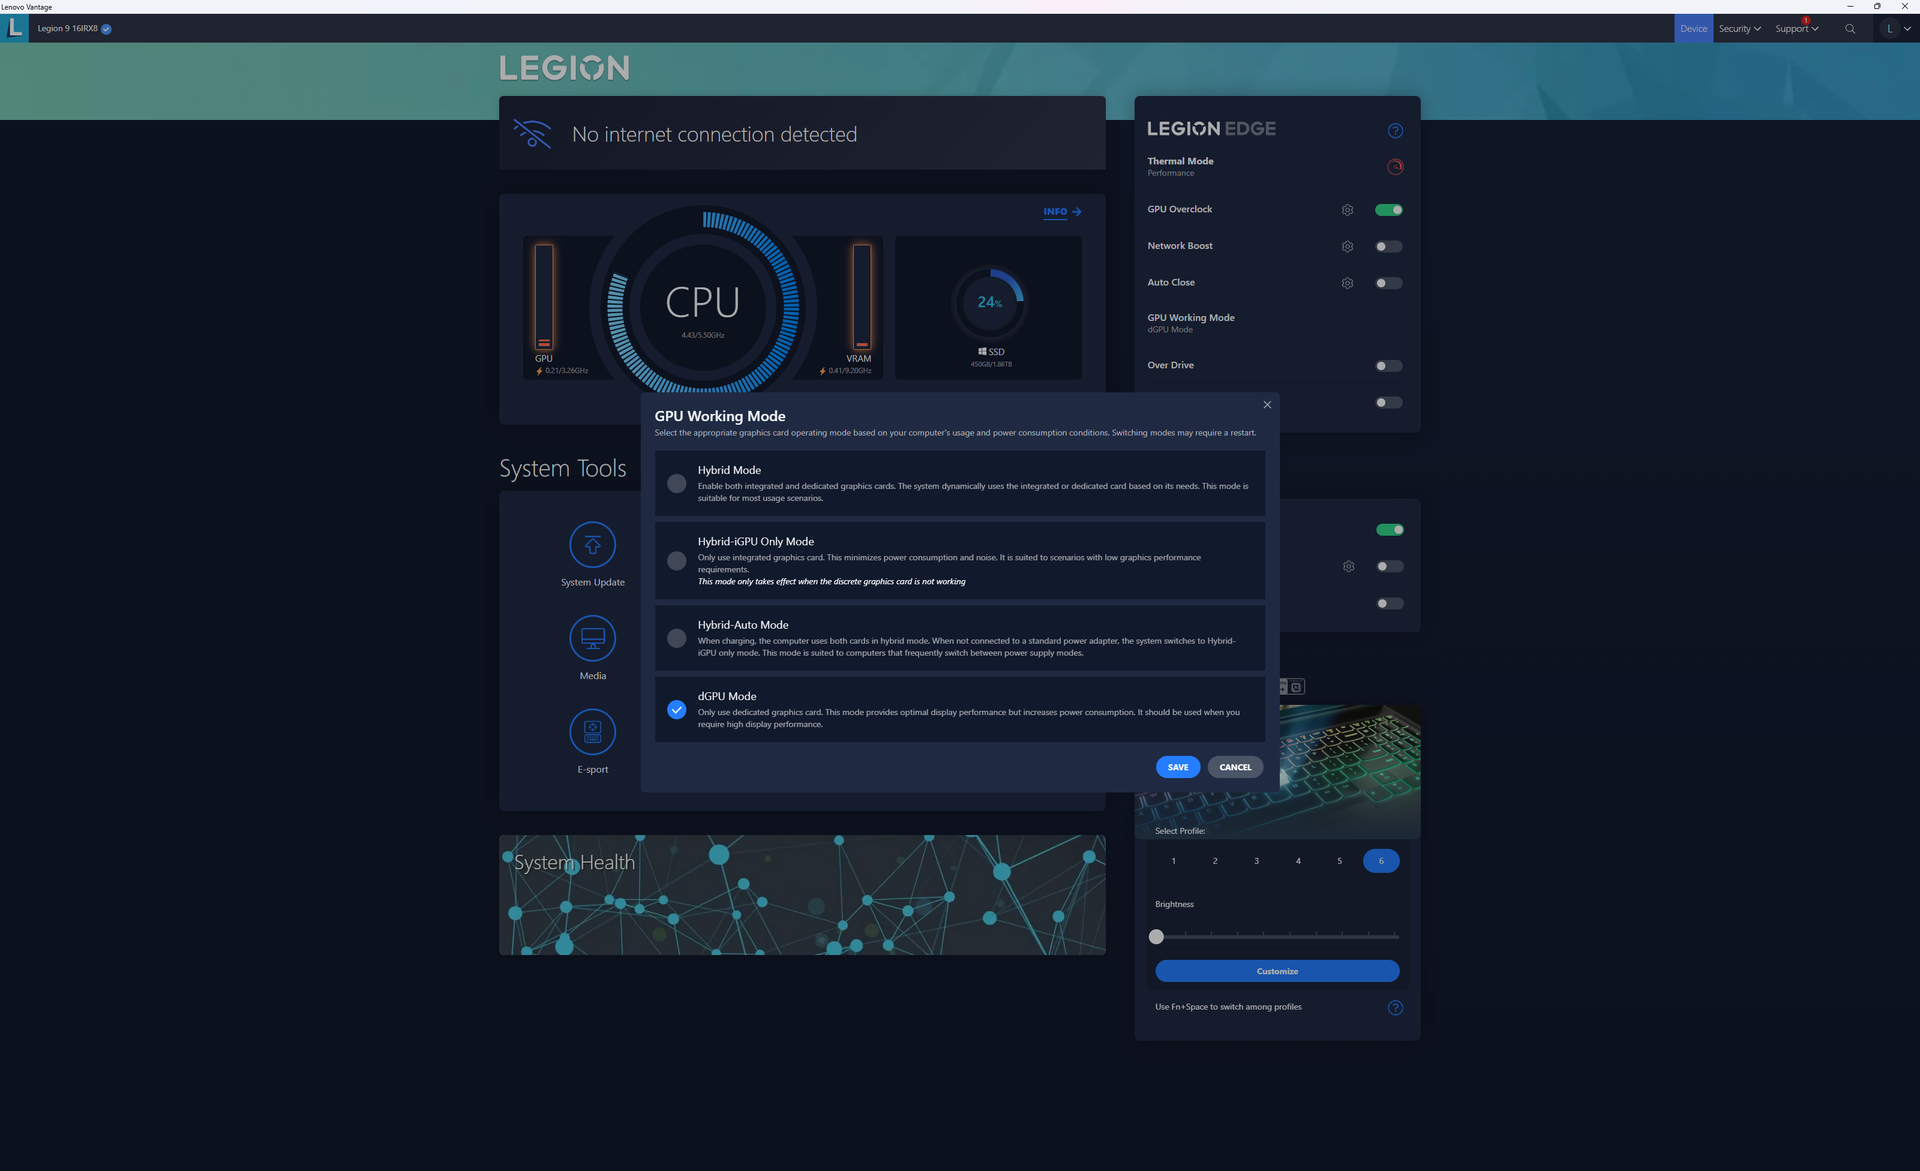
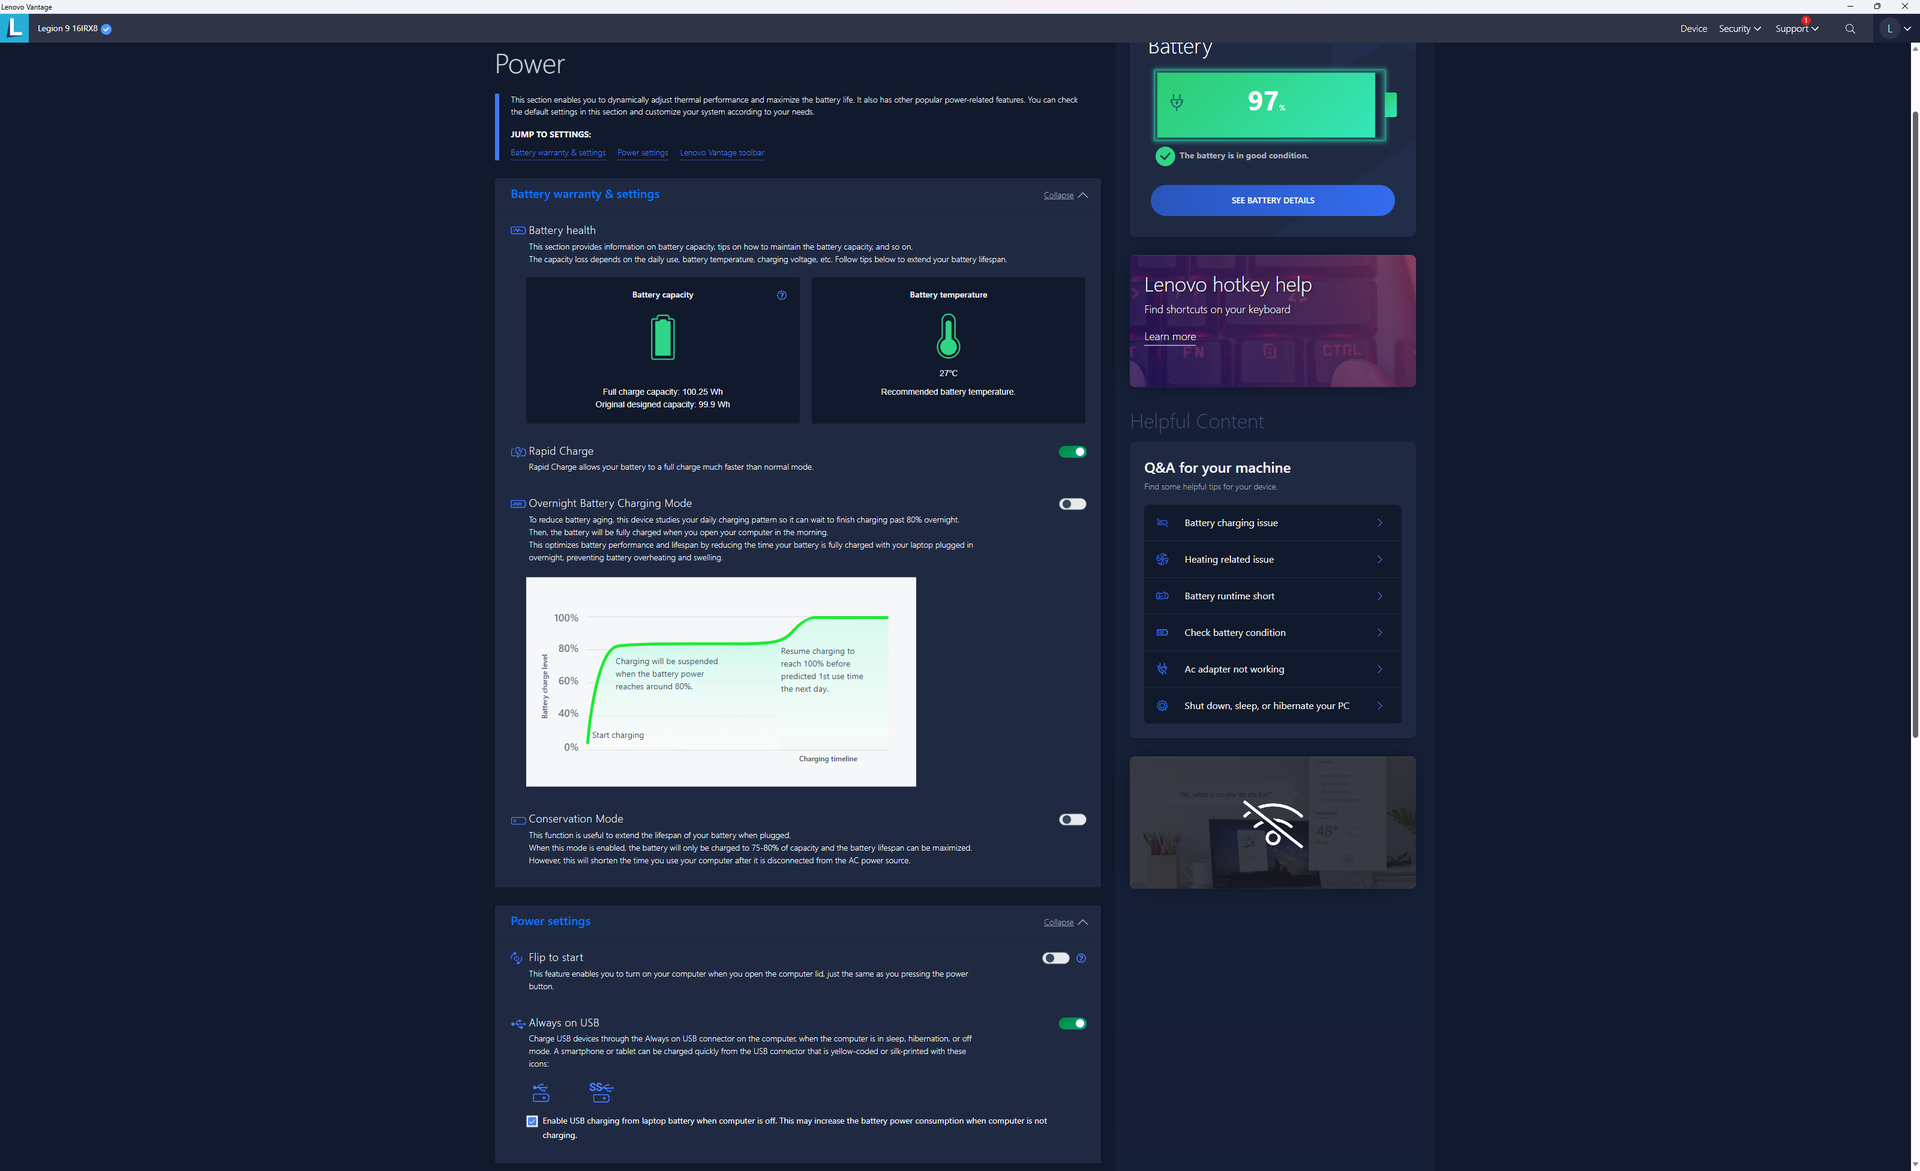
Vi ställde in vår enhet till Performance-läge och dGPU-läge via Lenovo Vantage innan vi körde riktmärkena nedan. GPU Overclock är också aktiverat som standard på +150 MHz GPU och +200 MHz VRAM, precis som på andra avancerade Legion -modeller. Vi rekommenderar att du bekantar dig med Vantage för att justera energiprofiler och andra extrainställningar.
Advanced Optimus, MUX och G-Sync stöds alla till skillnad från de senaste Legion Slim 5 14.
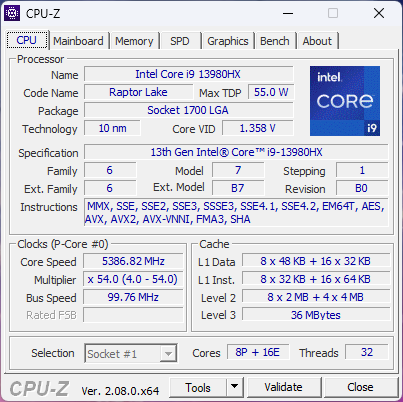
Processor
CPU-prestandan är utmärkt med resultat som är cirka 80 till 90 procent snabbare i flertrådade arbetsbelastningar än den vanliga Core i7-13700H. Den Core i9-13980HX är en av Intels snabbaste mobila processorer just nu, men den ligger fortfarande efter den konkurrerandeRyzen 9 7945HX i de flesta flertrådade benchmarks med cirka 10 procent.
Prestandan är bara 5 procent snabbare än Core i9-13950HX baserat på vår tid med 2023 Razer Blade 16. Tyvärr erbjuder Lenovo inte några andra CPU-alternativ än Core i9-13980HX för dem som kanske hade velat spara några hundra dollar.
Cinebench R15 Multi Loop
Cinebench R23: Multi Core | Single Core
Cinebench R20: CPU (Multi Core) | CPU (Single Core)
Cinebench R15: CPU Multi 64Bit | CPU Single 64Bit
Blender: v2.79 BMW27 CPU
7-Zip 18.03: 7z b 4 | 7z b 4 -mmt1
Geekbench 5.5: Multi-Core | Single-Core
HWBOT x265 Benchmark v2.2: 4k Preset
LibreOffice : 20 Documents To PDF
R Benchmark 2.5: Overall mean
* ... mindre är bättre
AIDA64: FP32 Ray-Trace | FPU Julia | CPU SHA3 | CPU Queen | FPU SinJulia | FPU Mandel | CPU AES | CPU ZLib | FP64 Ray-Trace | CPU PhotoWorxx
| Performance rating | |
| Lenovo Legion 9 16IRX8 | |
| Genomsnitt Intel Core i9-13980HX | |
| Asus ROG Strix G16 G614JZ | |
| HP Omen Transcend 16 | |
| Razer Blade 16 Early 2023 RTX 4090 | |
| Lenovo Legion Slim 5 16APH8 | |
| Alienware x16 R1 | |
| AIDA64 / FP32 Ray-Trace | |
| Lenovo Legion Slim 5 16APH8 | |
| Asus ROG Strix G16 G614JZ | |
| Lenovo Legion 9 16IRX8 | |
| Genomsnitt Intel Core i9-13980HX (21332 - 29553, n=9) | |
| HP Omen Transcend 16 | |
| Alienware x16 R1 | |
| Razer Blade 16 Early 2023 RTX 4090 | |
| AIDA64 / FPU Julia | |
| Lenovo Legion 9 16IRX8 | |
| Genomsnitt Intel Core i9-13980HX (108001 - 148168, n=9) | |
| Asus ROG Strix G16 G614JZ | |
| Lenovo Legion Slim 5 16APH8 | |
| HP Omen Transcend 16 | |
| Razer Blade 16 Early 2023 RTX 4090 | |
| Alienware x16 R1 | |
| AIDA64 / CPU SHA3 | |
| Lenovo Legion 9 16IRX8 | |
| Asus ROG Strix G16 G614JZ | |
| Genomsnitt Intel Core i9-13980HX (5264 - 7142, n=9) | |
| Razer Blade 16 Early 2023 RTX 4090 | |
| HP Omen Transcend 16 | |
| Lenovo Legion Slim 5 16APH8 | |
| Alienware x16 R1 | |
| AIDA64 / CPU Queen | |
| Asus ROG Strix G16 G614JZ | |
| Genomsnitt Intel Core i9-13980HX (126758 - 143409, n=9) | |
| Razer Blade 16 Early 2023 RTX 4090 | |
| Lenovo Legion 9 16IRX8 | |
| HP Omen Transcend 16 | |
| Lenovo Legion Slim 5 16APH8 | |
| Alienware x16 R1 | |
| AIDA64 / FPU SinJulia | |
| Asus ROG Strix G16 G614JZ | |
| Genomsnitt Intel Core i9-13980HX (13785 - 17117, n=9) | |
| Lenovo Legion 9 16IRX8 | |
| Lenovo Legion Slim 5 16APH8 | |
| HP Omen Transcend 16 | |
| Razer Blade 16 Early 2023 RTX 4090 | |
| Alienware x16 R1 | |
| AIDA64 / FPU Mandel | |
| Lenovo Legion 9 16IRX8 | |
| Genomsnitt Intel Core i9-13980HX (53398 - 73758, n=9) | |
| Asus ROG Strix G16 G614JZ | |
| Lenovo Legion Slim 5 16APH8 | |
| HP Omen Transcend 16 | |
| Razer Blade 16 Early 2023 RTX 4090 | |
| Alienware x16 R1 | |
| AIDA64 / CPU AES | |
| Razer Blade 16 Early 2023 RTX 4090 | |
| Asus ROG Strix G16 G614JZ | |
| Lenovo Legion 9 16IRX8 | |
| Genomsnitt Intel Core i9-13980HX (105169 - 136520, n=9) | |
| HP Omen Transcend 16 | |
| Alienware x16 R1 | |
| Lenovo Legion Slim 5 16APH8 | |
| AIDA64 / CPU ZLib | |
| Lenovo Legion 9 16IRX8 | |
| Asus ROG Strix G16 G614JZ | |
| Genomsnitt Intel Core i9-13980HX (1513 - 2039, n=9) | |
| Razer Blade 16 Early 2023 RTX 4090 | |
| HP Omen Transcend 16 | |
| Alienware x16 R1 | |
| Lenovo Legion Slim 5 16APH8 | |
| AIDA64 / FP64 Ray-Trace | |
| Lenovo Legion Slim 5 16APH8 | |
| Lenovo Legion 9 16IRX8 | |
| Asus ROG Strix G16 G614JZ | |
| Genomsnitt Intel Core i9-13980HX (11431 - 16325, n=9) | |
| HP Omen Transcend 16 | |
| Alienware x16 R1 | |
| Razer Blade 16 Early 2023 RTX 4090 | |
| AIDA64 / CPU PhotoWorxx | |
| Razer Blade 16 Early 2023 RTX 4090 | |
| Lenovo Legion 9 16IRX8 | |
| HP Omen Transcend 16 | |
| Alienware x16 R1 | |
| Genomsnitt Intel Core i9-13980HX (37069 - 52949, n=9) | |
| Asus ROG Strix G16 G614JZ | |
| Lenovo Legion Slim 5 16APH8 | |
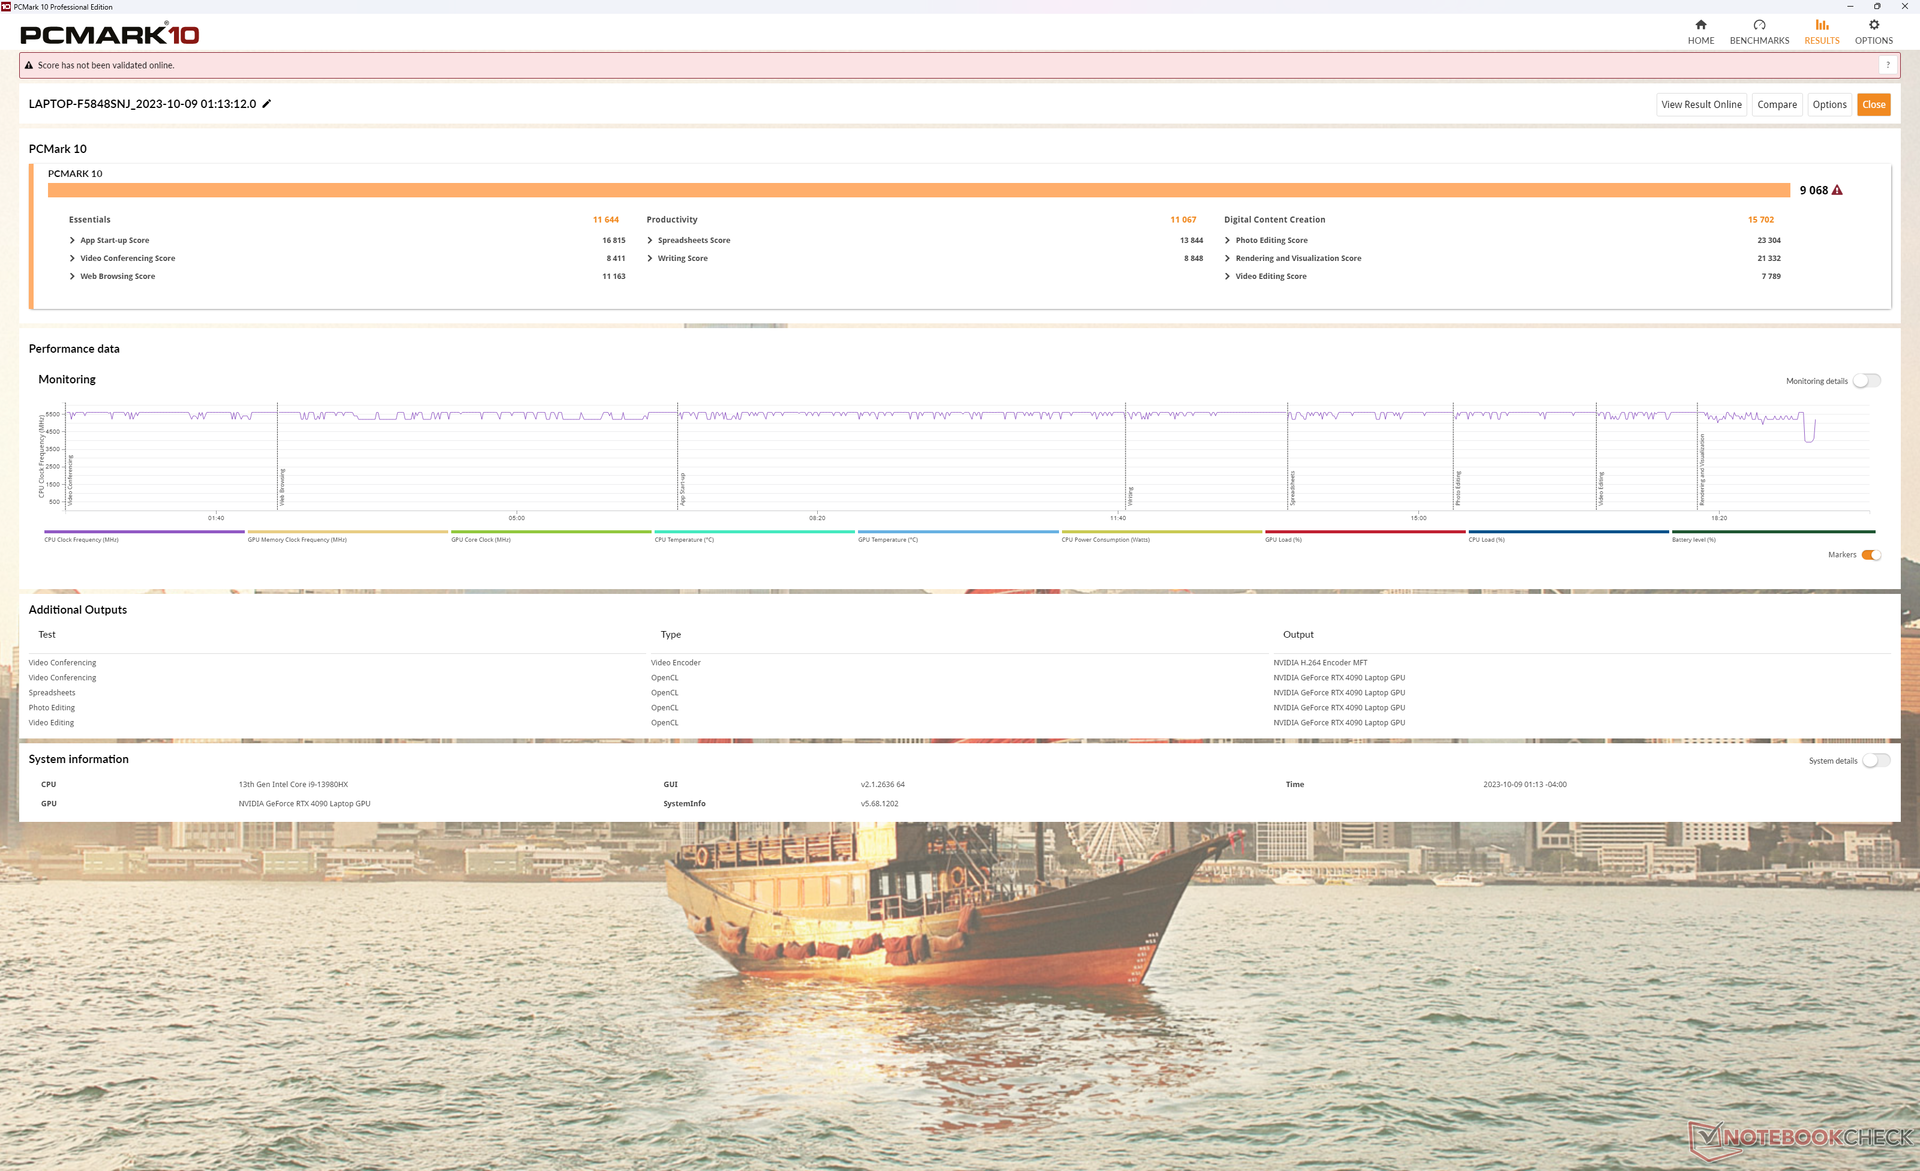
Systemets prestanda
PCMark-resultaten är några av de högsta för en bärbar speldator oavsett storlek, vilket till stor del beror på vår 13:e generationens Core HX-processor, RTX 4090 GPU och särskilt RAID 0 PCIe4 x4-konfigurationen. Trots detta upplevde vi fortfarande problem med att vakna från viloläge där skärmen ibland förblev tom och "frusen" under ovanligt långa tidsperioder. Vi misstänker att detta kan bero på hur modellen jonglerar mellan de många olika GPU-lägena.
CrossMark: Overall | Productivity | Creativity | Responsiveness
| PCMark 10 / Score | |
| Lenovo Legion 9 16IRX8 | |
| Genomsnitt Intel Core i9-13980HX, NVIDIA GeForce RTX 4090 Laptop GPU (8650 - 9068, n=4) | |
| Alienware x16 R1 | |
| HP Omen Transcend 16 | |
| Lenovo Legion Slim 5 16APH8 | |
| Razer Blade 16 Early 2023 RTX 4090 | |
| Asus ROG Strix G16 G614JZ | |
| PCMark 10 / Essentials | |
| Asus ROG Strix G16 G614JZ | |
| Lenovo Legion 9 16IRX8 | |
| Genomsnitt Intel Core i9-13980HX, NVIDIA GeForce RTX 4090 Laptop GPU (11215 - 11644, n=3) | |
| HP Omen Transcend 16 | |
| Lenovo Legion Slim 5 16APH8 | |
| Alienware x16 R1 | |
| Razer Blade 16 Early 2023 RTX 4090 | |
| PCMark 10 / Productivity | |
| Lenovo Legion 9 16IRX8 | |
| Genomsnitt Intel Core i9-13980HX, NVIDIA GeForce RTX 4090 Laptop GPU (10125 - 11067, n=3) | |
| Lenovo Legion Slim 5 16APH8 | |
| Alienware x16 R1 | |
| HP Omen Transcend 16 | |
| Razer Blade 16 Early 2023 RTX 4090 | |
| Asus ROG Strix G16 G614JZ | |
| PCMark 10 / Digital Content Creation | |
| Lenovo Legion 9 16IRX8 | |
| Genomsnitt Intel Core i9-13980HX, NVIDIA GeForce RTX 4090 Laptop GPU (15052 - 16012, n=3) | |
| Alienware x16 R1 | |
| HP Omen Transcend 16 | |
| Razer Blade 16 Early 2023 RTX 4090 | |
| Lenovo Legion Slim 5 16APH8 | |
| Asus ROG Strix G16 G614JZ | |
| CrossMark / Overall | |
| Asus ROG Strix G16 G614JZ | |
| Genomsnitt Intel Core i9-13980HX, NVIDIA GeForce RTX 4090 Laptop GPU (1935 - 2176, n=4) | |
| Razer Blade 16 Early 2023 RTX 4090 | |
| HP Omen Transcend 16 | |
| Alienware x16 R1 | |
| Lenovo Legion 9 16IRX8 | |
| Lenovo Legion Slim 5 16APH8 | |
| CrossMark / Productivity | |
| Asus ROG Strix G16 G614JZ | |
| Razer Blade 16 Early 2023 RTX 4090 | |
| Genomsnitt Intel Core i9-13980HX, NVIDIA GeForce RTX 4090 Laptop GPU (1764 - 2005, n=4) | |
| Alienware x16 R1 | |
| HP Omen Transcend 16 | |
| Lenovo Legion 9 16IRX8 | |
| Lenovo Legion Slim 5 16APH8 | |
| CrossMark / Creativity | |
| Asus ROG Strix G16 G614JZ | |
| Genomsnitt Intel Core i9-13980HX, NVIDIA GeForce RTX 4090 Laptop GPU (2267 - 2469, n=4) | |
| HP Omen Transcend 16 | |
| Lenovo Legion 9 16IRX8 | |
| Razer Blade 16 Early 2023 RTX 4090 | |
| Alienware x16 R1 | |
| Lenovo Legion Slim 5 16APH8 | |
| CrossMark / Responsiveness | |
| Asus ROG Strix G16 G614JZ | |
| Alienware x16 R1 | |
| Razer Blade 16 Early 2023 RTX 4090 | |
| Genomsnitt Intel Core i9-13980HX, NVIDIA GeForce RTX 4090 Laptop GPU (1556 - 1904, n=4) | |
| Lenovo Legion 9 16IRX8 | |
| HP Omen Transcend 16 | |
| Lenovo Legion Slim 5 16APH8 | |
| PCMark 10 Score | 9068 poäng | |
Hjälp | ||
| AIDA64 / Memory Copy | |
| Razer Blade 16 Early 2023 RTX 4090 | |
| Lenovo Legion 9 16IRX8 | |
| HP Omen Transcend 16 | |
| Alienware x16 R1 | |
| Genomsnitt Intel Core i9-13980HX (62189 - 80776, n=9) | |
| Lenovo Legion Slim 5 16APH8 | |
| Asus ROG Strix G16 G614JZ | |
| AIDA64 / Memory Read | |
| Lenovo Legion 9 16IRX8 | |
| Razer Blade 16 Early 2023 RTX 4090 | |
| HP Omen Transcend 16 | |
| Genomsnitt Intel Core i9-13980HX (62624 - 89096, n=9) | |
| Asus ROG Strix G16 G614JZ | |
| Alienware x16 R1 | |
| Lenovo Legion Slim 5 16APH8 | |
| AIDA64 / Memory Write | |
| Alienware x16 R1 | |
| Lenovo Legion Slim 5 16APH8 | |
| Razer Blade 16 Early 2023 RTX 4090 | |
| Lenovo Legion 9 16IRX8 | |
| HP Omen Transcend 16 | |
| Genomsnitt Intel Core i9-13980HX (59912 - 79917, n=9) | |
| Asus ROG Strix G16 G614JZ | |
| AIDA64 / Memory Latency | |
| Alienware x16 R1 | |
| Lenovo Legion Slim 5 16APH8 | |
| HP Omen Transcend 16 | |
| Asus ROG Strix G16 G614JZ | |
| Genomsnitt Intel Core i9-13980HX (79.4 - 93.2, n=9) | |
| Razer Blade 16 Early 2023 RTX 4090 | |
| Lenovo Legion 9 16IRX8 | |
* ... mindre är bättre
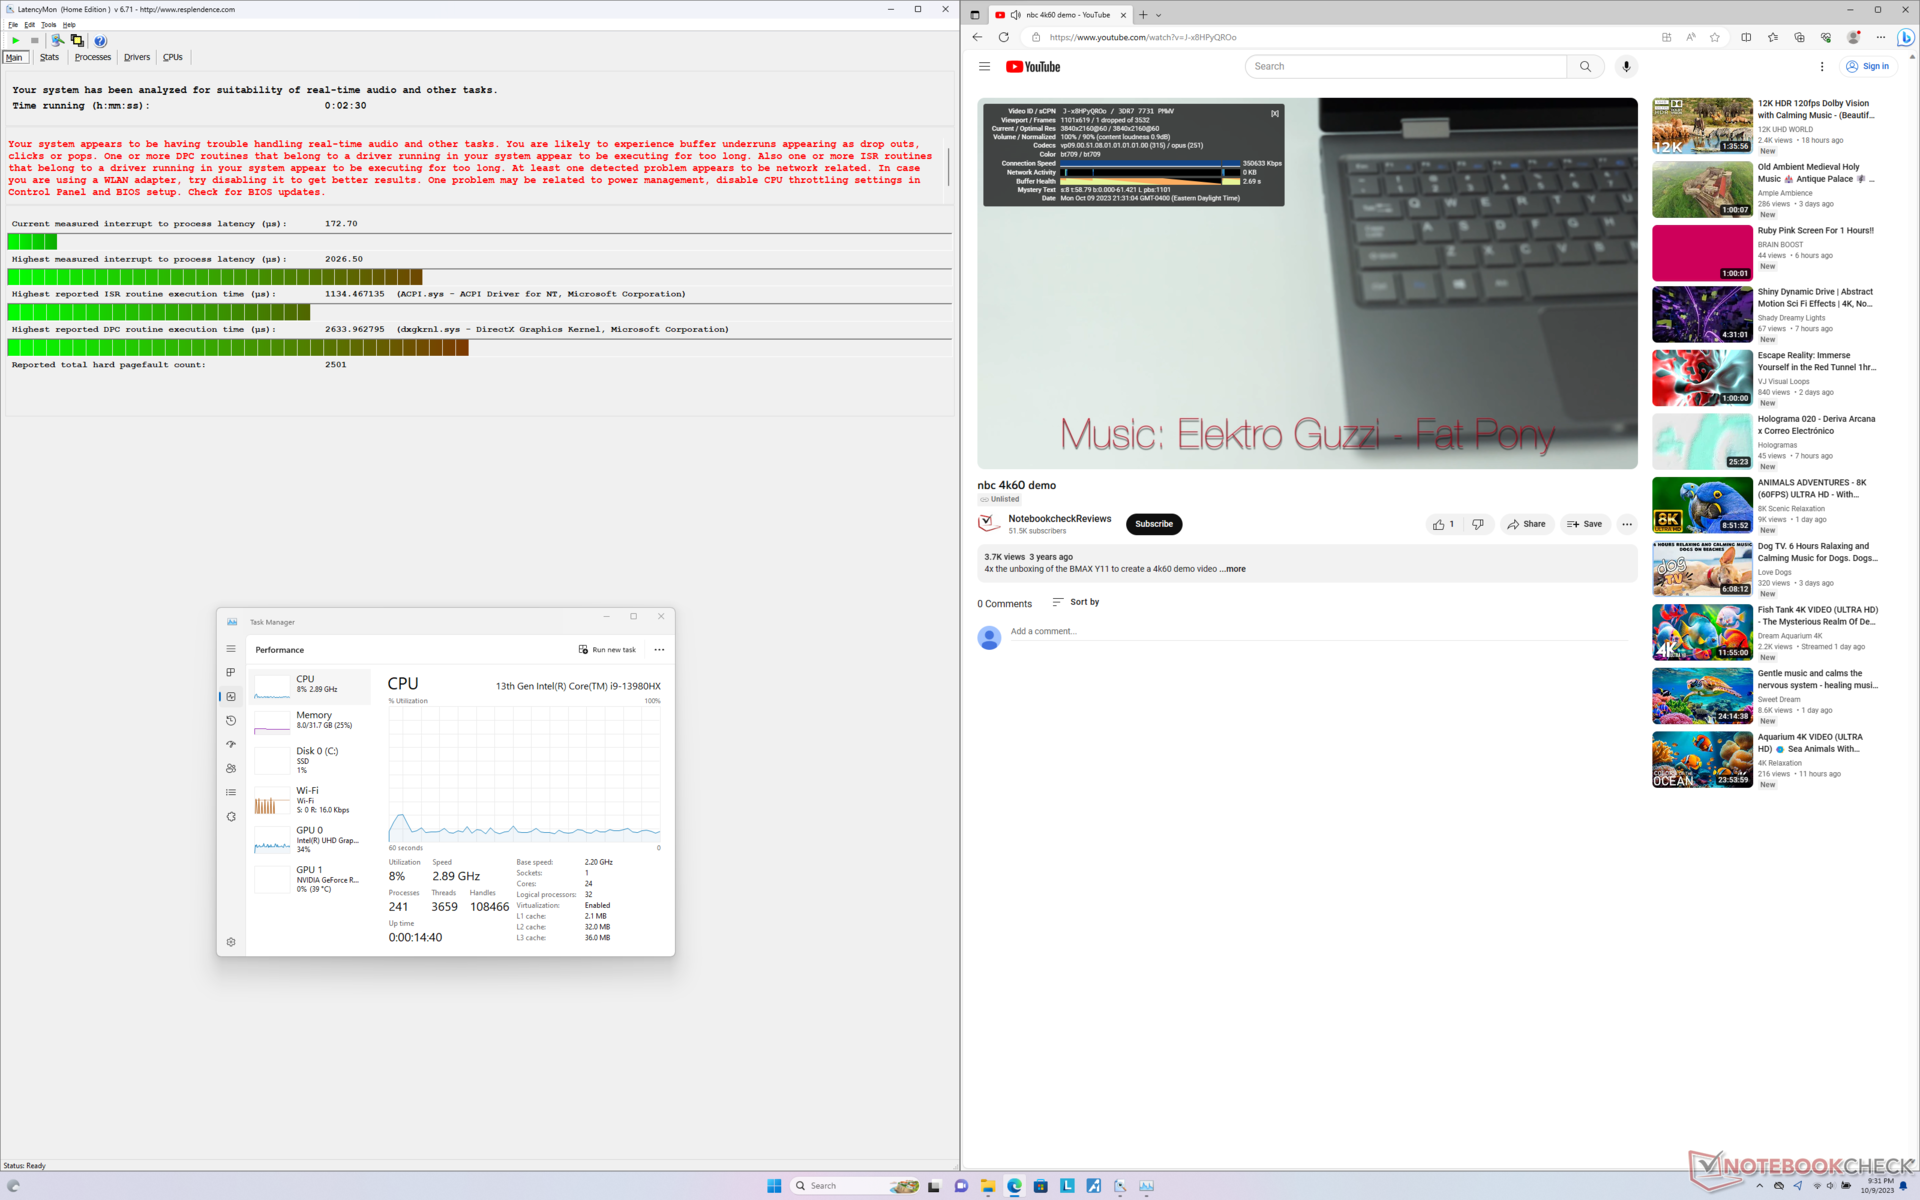
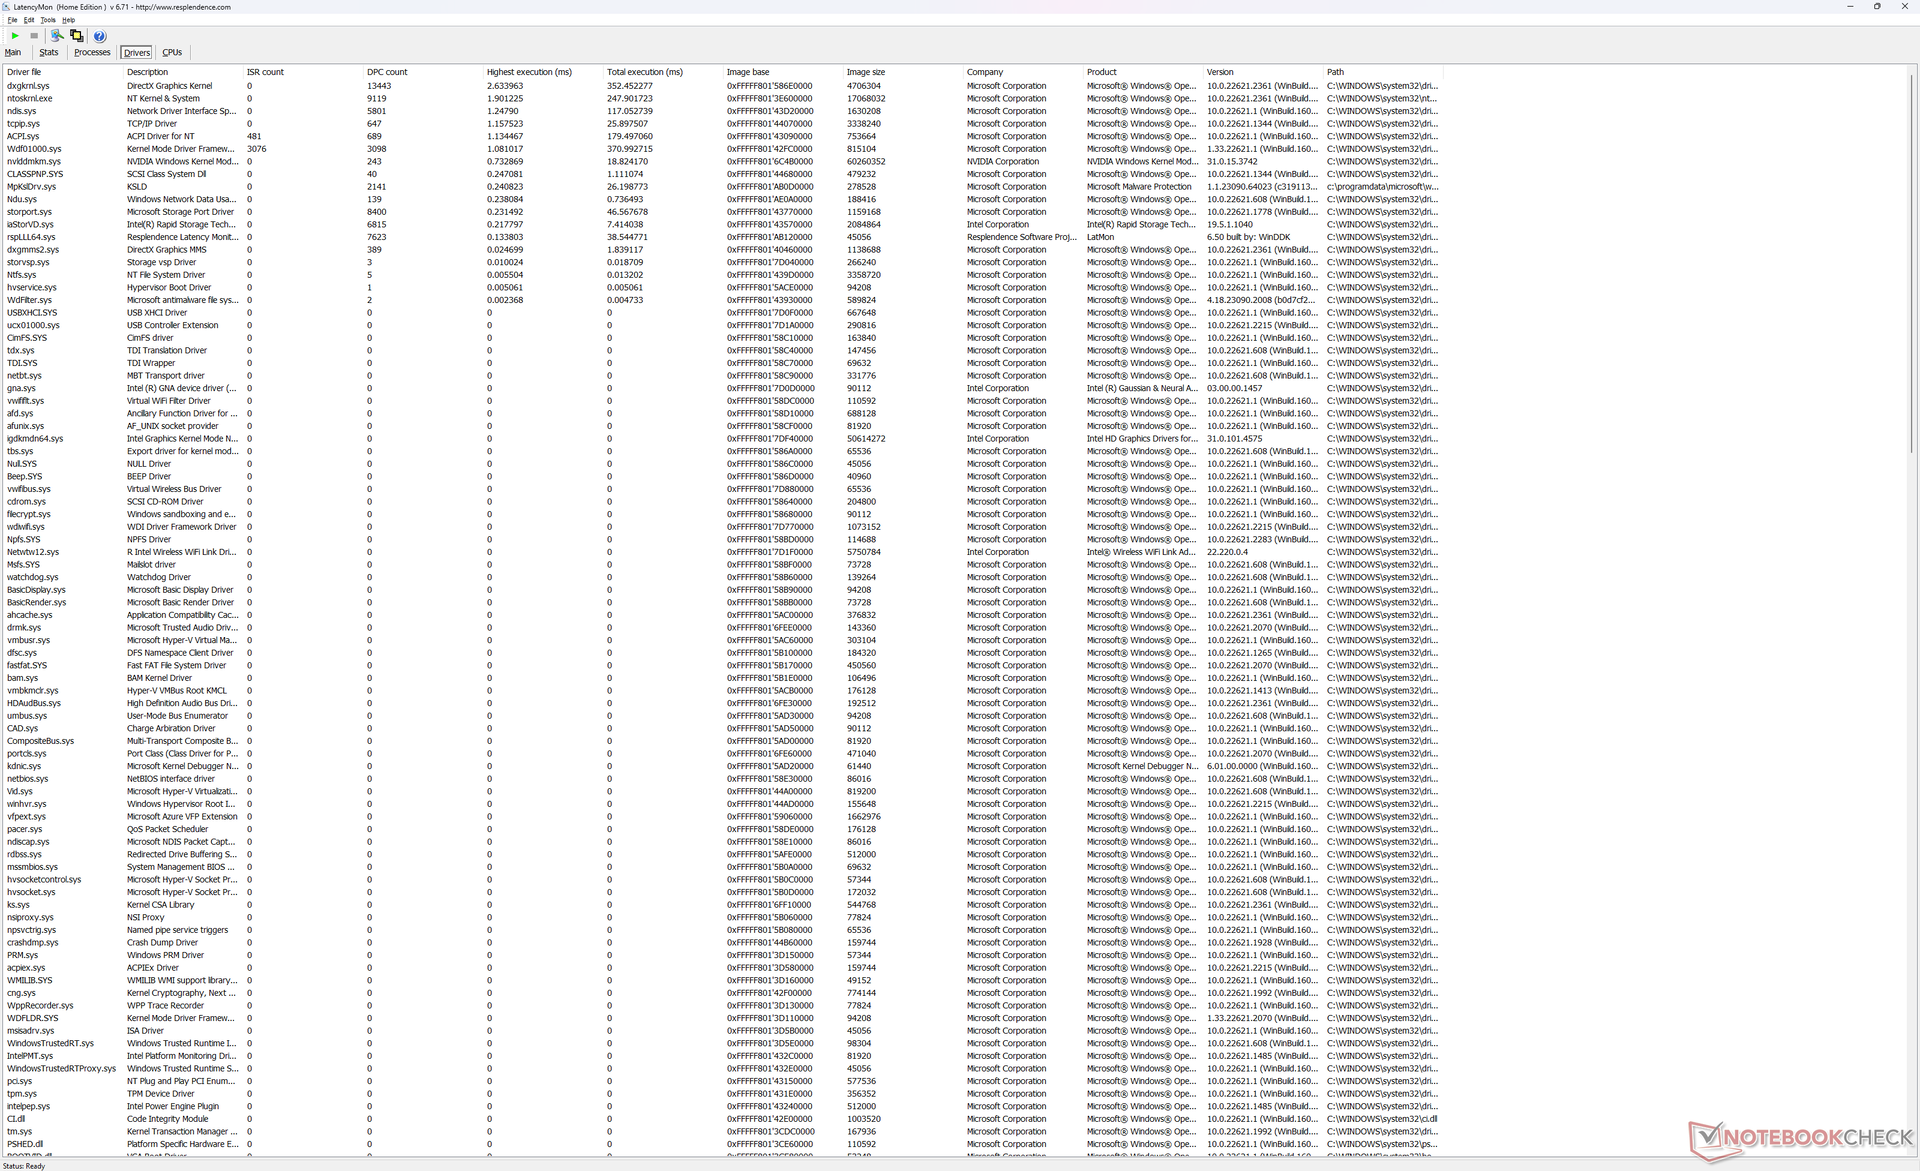
DPC-fördröjning
LatencyMon avslöjar DPC-problem när flera webbläsarflikar öppnas på vår hemsida. uppspelning av 4K-video vid 60 FPS är nästan perfekt med bara en tappad bildruta inspelad under ett intervall på en minut.
| DPC Latencies / LatencyMon - interrupt to process latency (max), Web, Youtube, Prime95 | |
| Razer Blade 16 Early 2023 RTX 4090 | |
| Razer Blade 16 Early 2023 RTX 4090 | |
| Asus ROG Strix G16 G614JZ | |
| Lenovo Legion 9 16IRX8 | |
| HP Omen Transcend 16 | |
| Alienware x16 R1 | |
| Lenovo Legion Slim 5 16APH8 | |
* ... mindre är bättre
Lagringsenheter
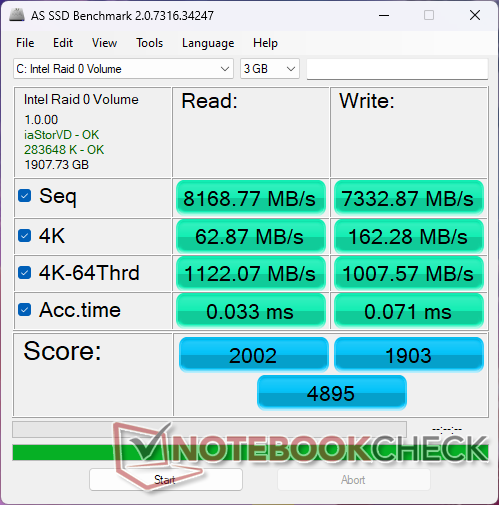
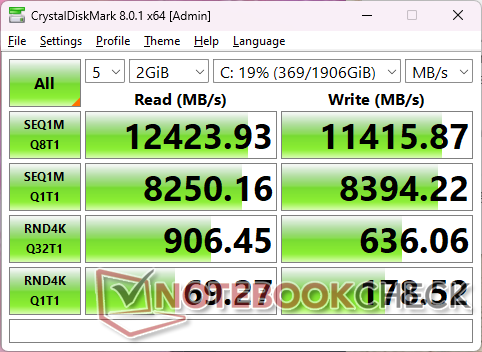
Vår enhet är konfigurerad med två SK hynix HFS001TEJ9X115N PCIe4 x4 NVMe SSD-enheter i RAID 0-konfiguration för vansinnigt snabba sekventiella läs- och skrivhastigheter på över 12000 MB/s respektive 11000 MB/s. Tyvärr är enheterna benägna att strypas när de körs med så höga hastigheter under längre perioder. Våra DiskSpd loop-testresultat nedan visar att läshastigheterna för en av enheterna faller till ca 4600 MB/s efter ca 4 minuter.

| Drive Performance rating - Percent | |
| Alienware x16 R1 | |
| Lenovo Legion 9 16IRX8 | |
| Razer Blade 16 Early 2023 RTX 4090 | |
| Asus ROG Strix G16 G614JZ | |
| HP Omen Transcend 16 | |
| Lenovo Legion Slim 5 16APH8 | |
* ... mindre är bättre
Disk Throttling: DiskSpd Read Loop, Queue Depth 8
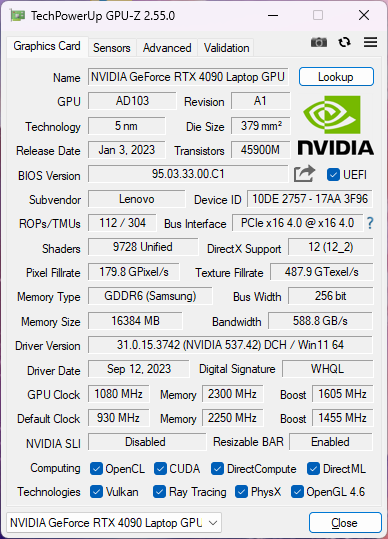
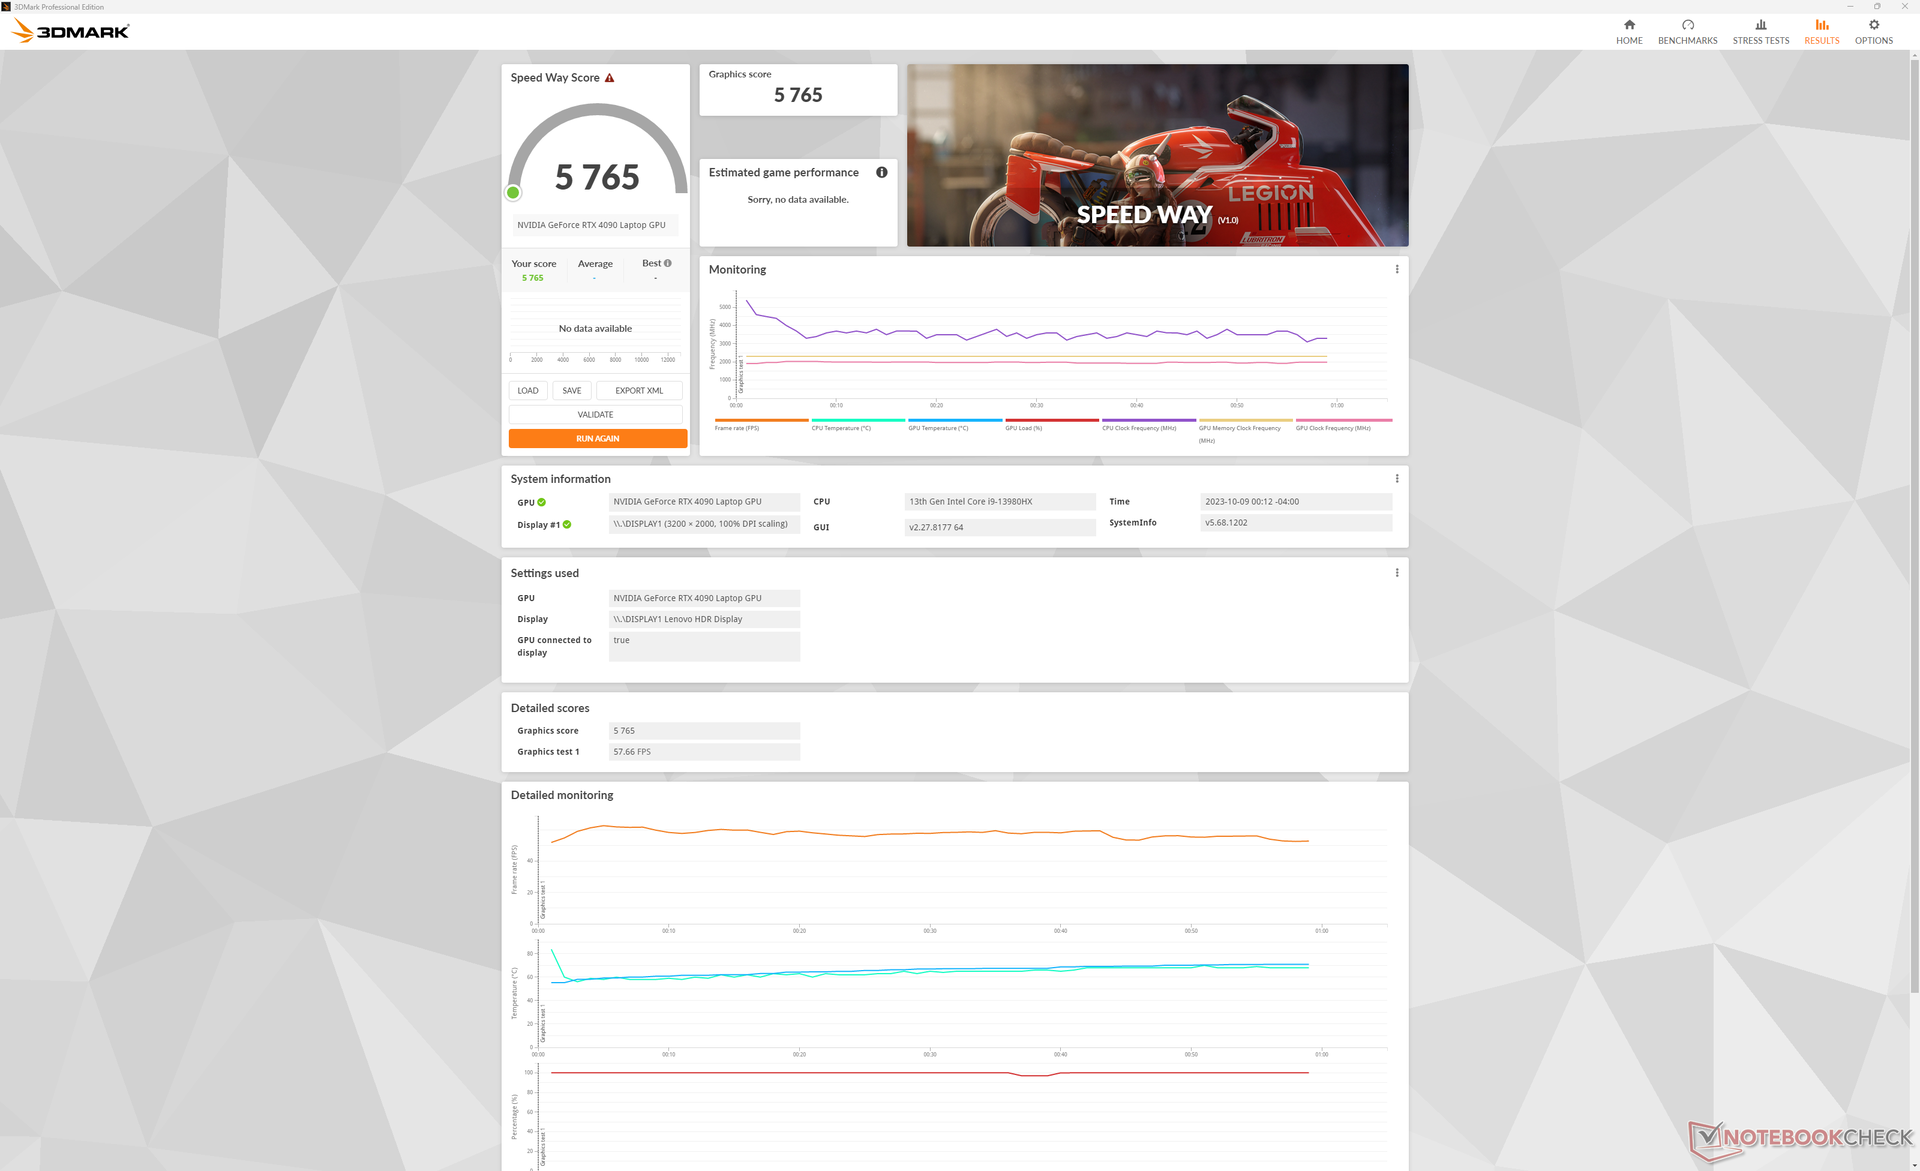
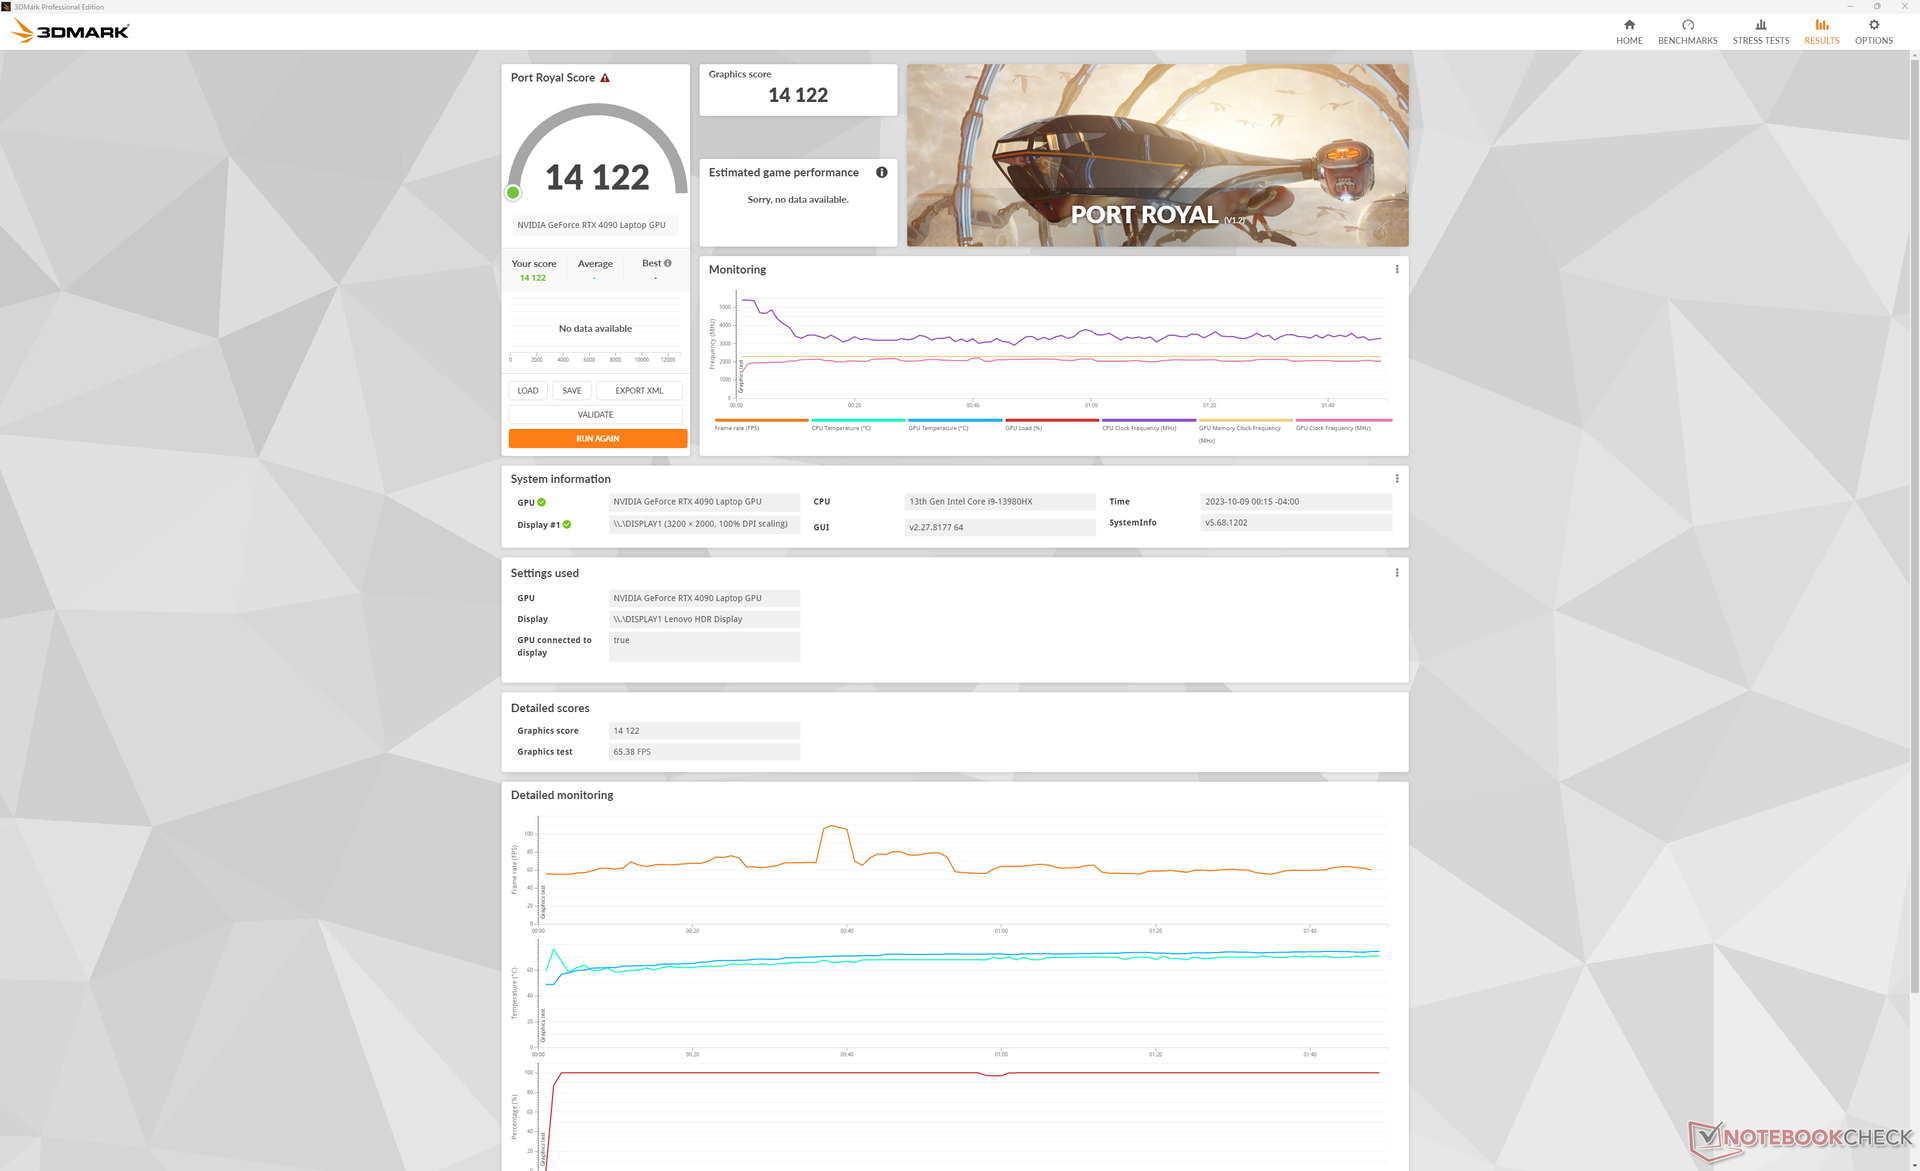
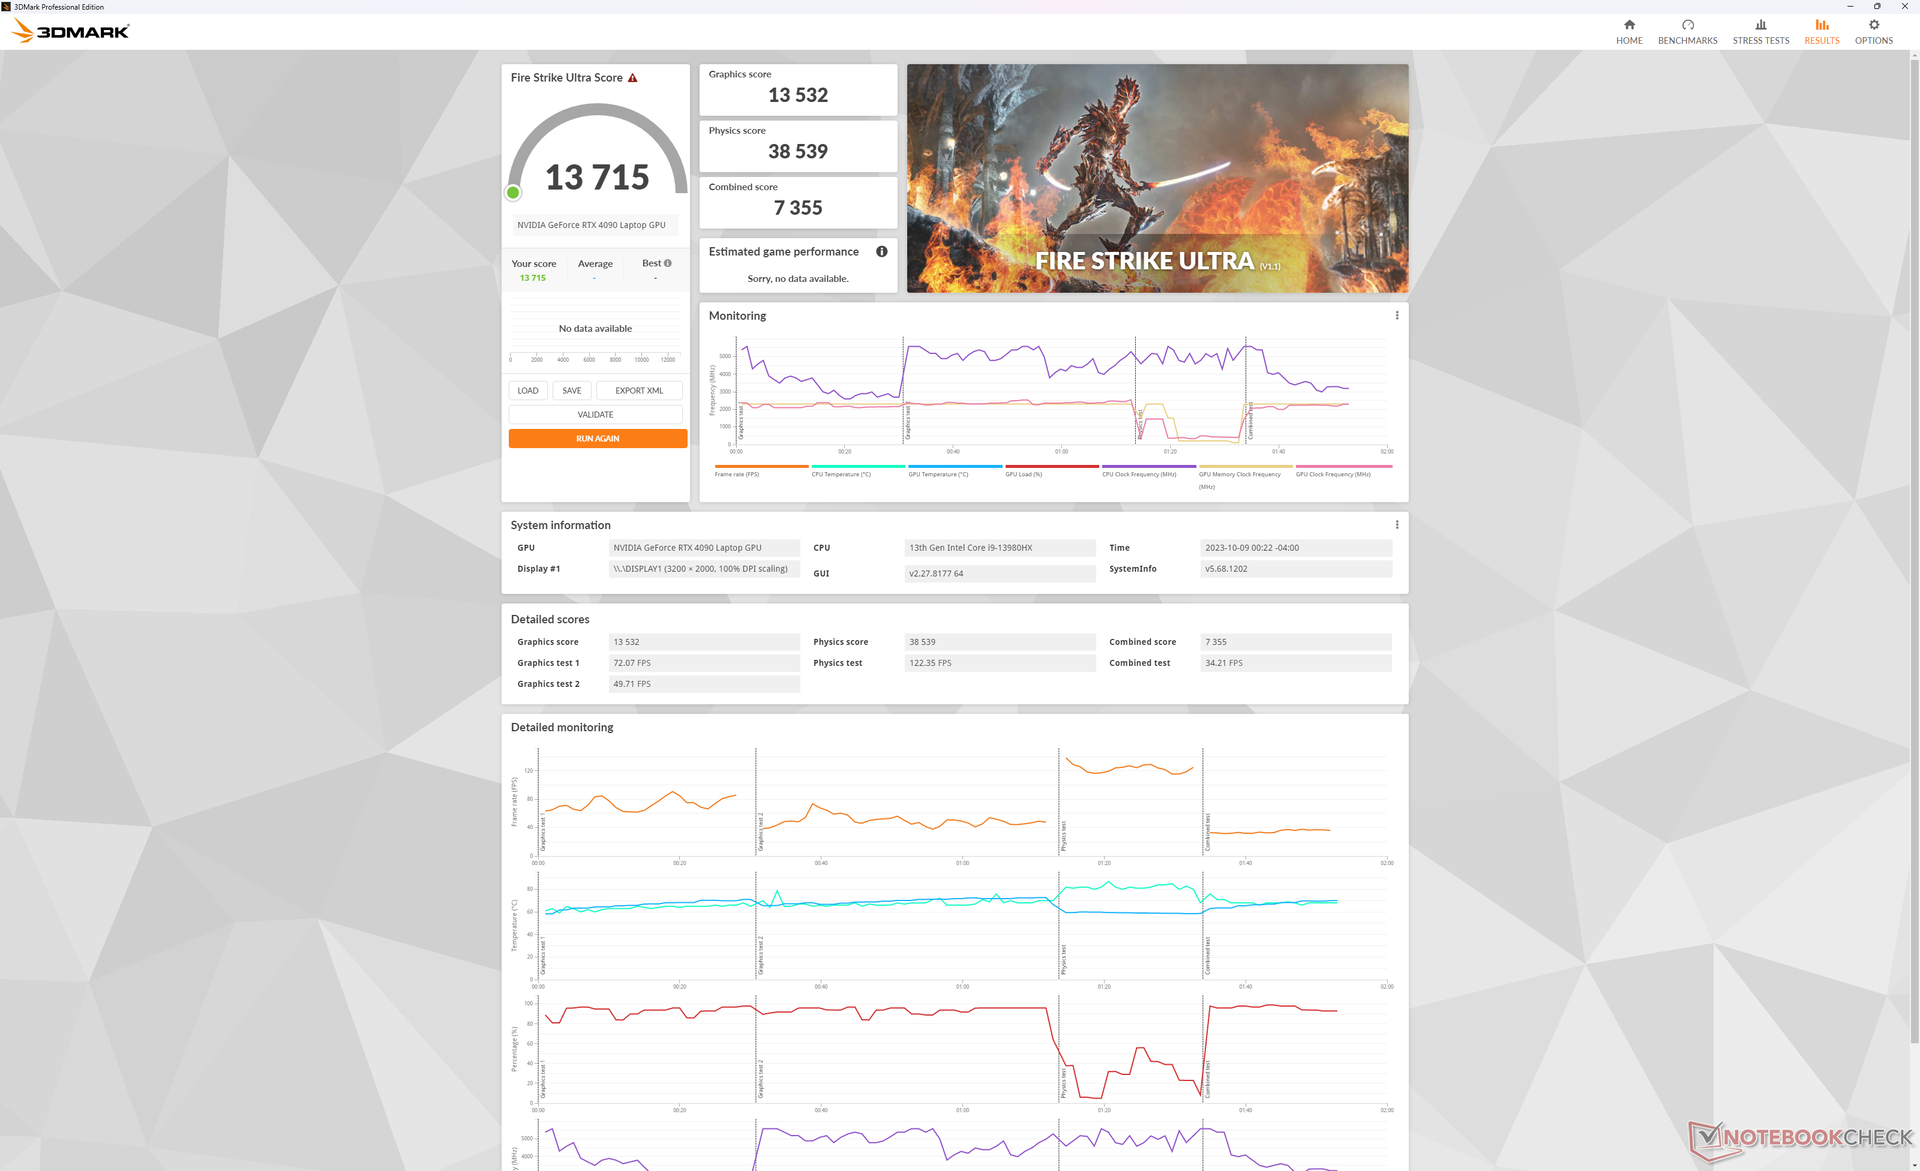
GPU-prestanda - 175 W TGP Graphics
Våra 175 W mobila GeForce RTX 4090 presterar inom bara 1 till 2 procentenheter från den genomsnittliga bärbara datorn i vår databas med samma GPU. Resultaten är imponerande med tanke på hur stora vissa RTX 4090-bärbara datorer kan vara, t.ex.MSI Raider GE78 HX 13VI.
Om man ser till helheten är den mobila RTX 4090 cirka 40 procent långsammare än en "riktig" stationär RTX 4090. I själva verket erbjuder den endast blygsamma fördelar på bara 5 till 10 procent jämfört med mobil RTX 4080 konfiguration.
Att köra med energiprofilen Balanserad med överklockning avstängd skulle minska grafikprestandan med cirka 17 procent enligt vår Fire Strike resultattabell nedan.
| Strömförsörjningsprofil | Grafisk poäng | Poäng för fysik | Kombinerat resultat |
| Prestanda-läge | 46386 | 38687 | 11456 |
| Balanserat läge (med GPU-överklockning av) | 38285 (-17%) | 39020 (-0%) | 12715 (-0%) |
| Batteridrift | 22176 (-52%) | 21072 (-46%) | 6306 (-45%) |
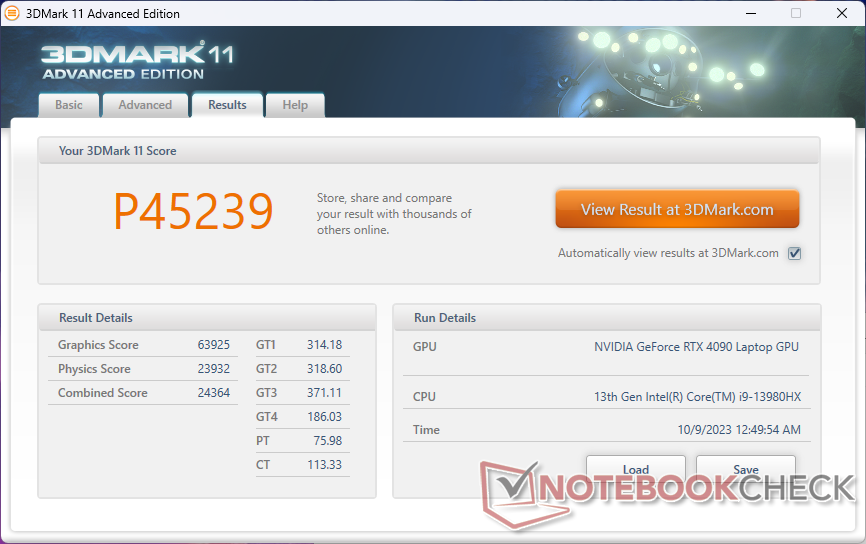
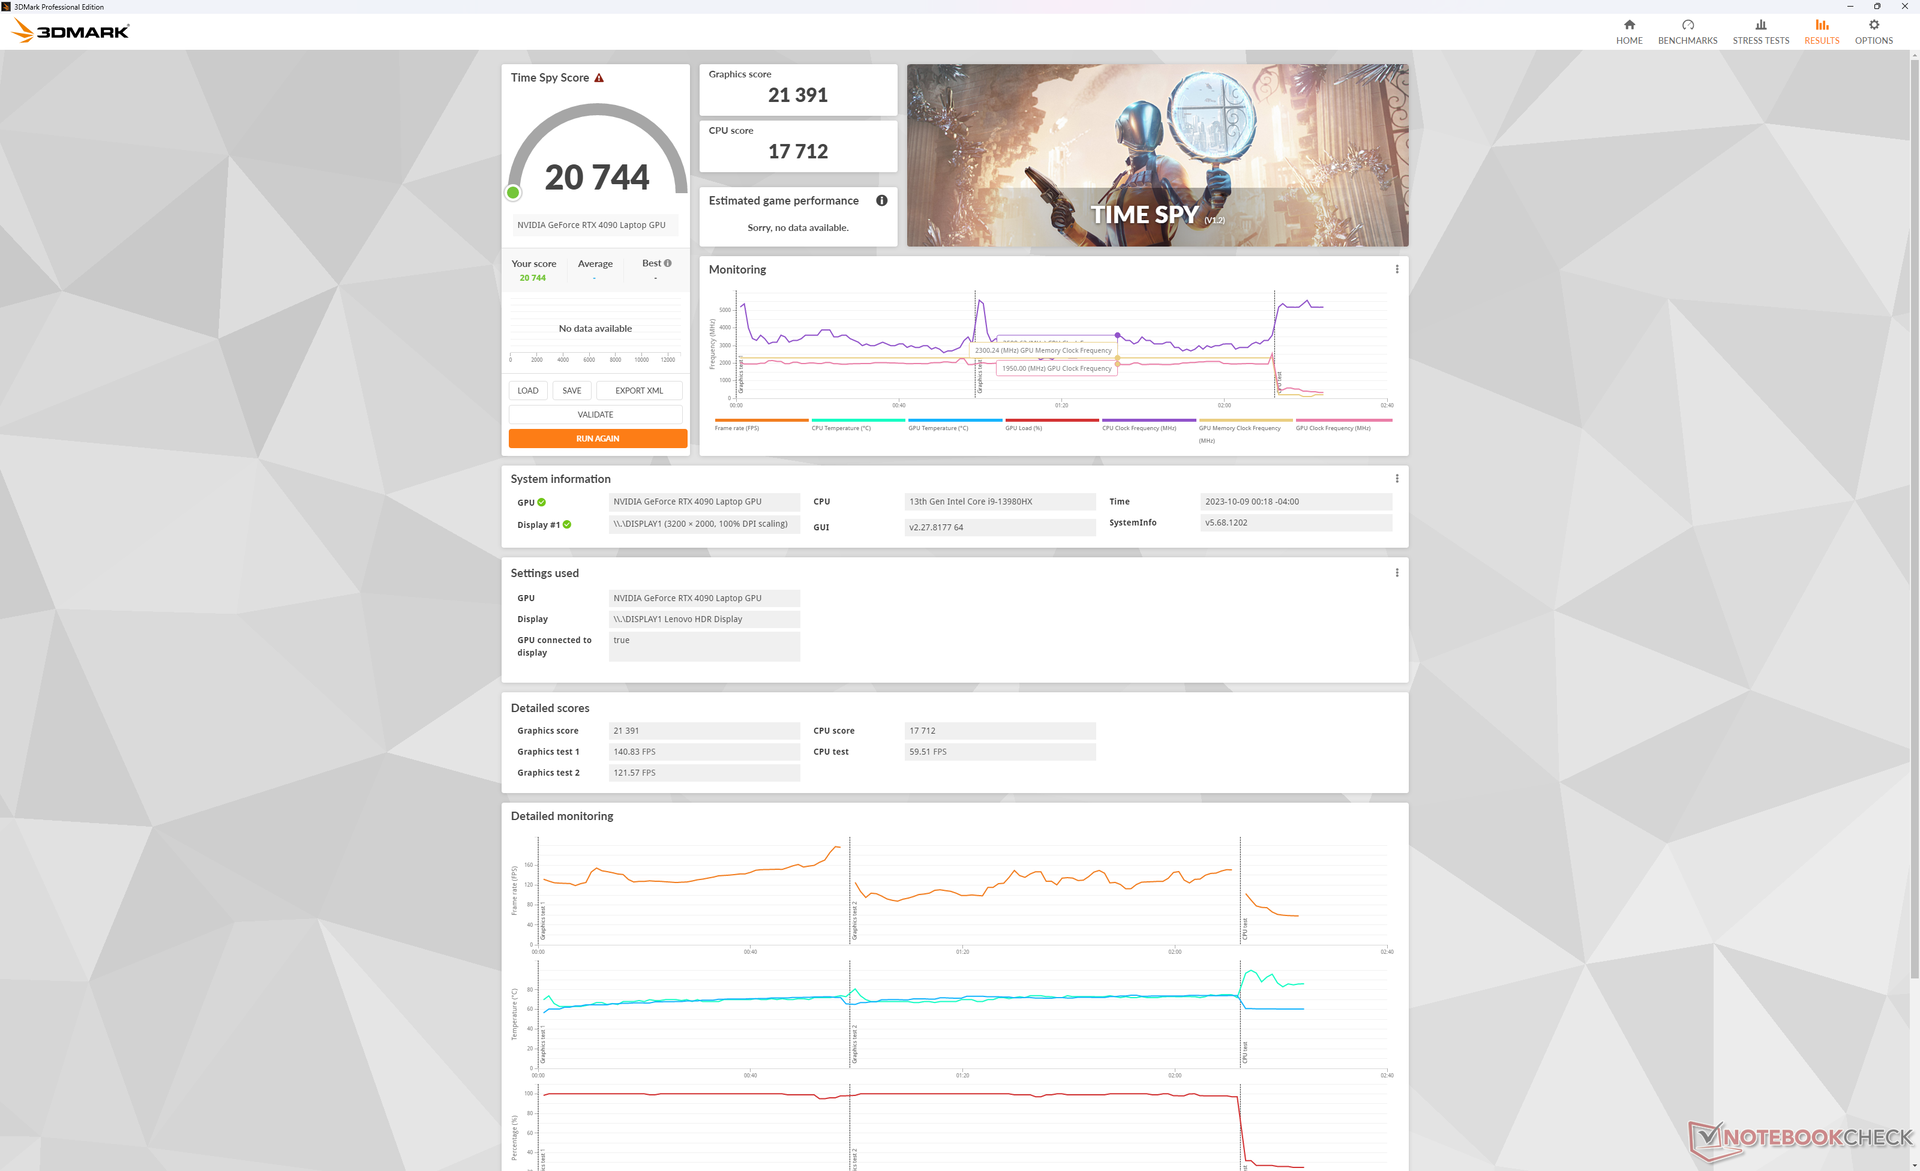
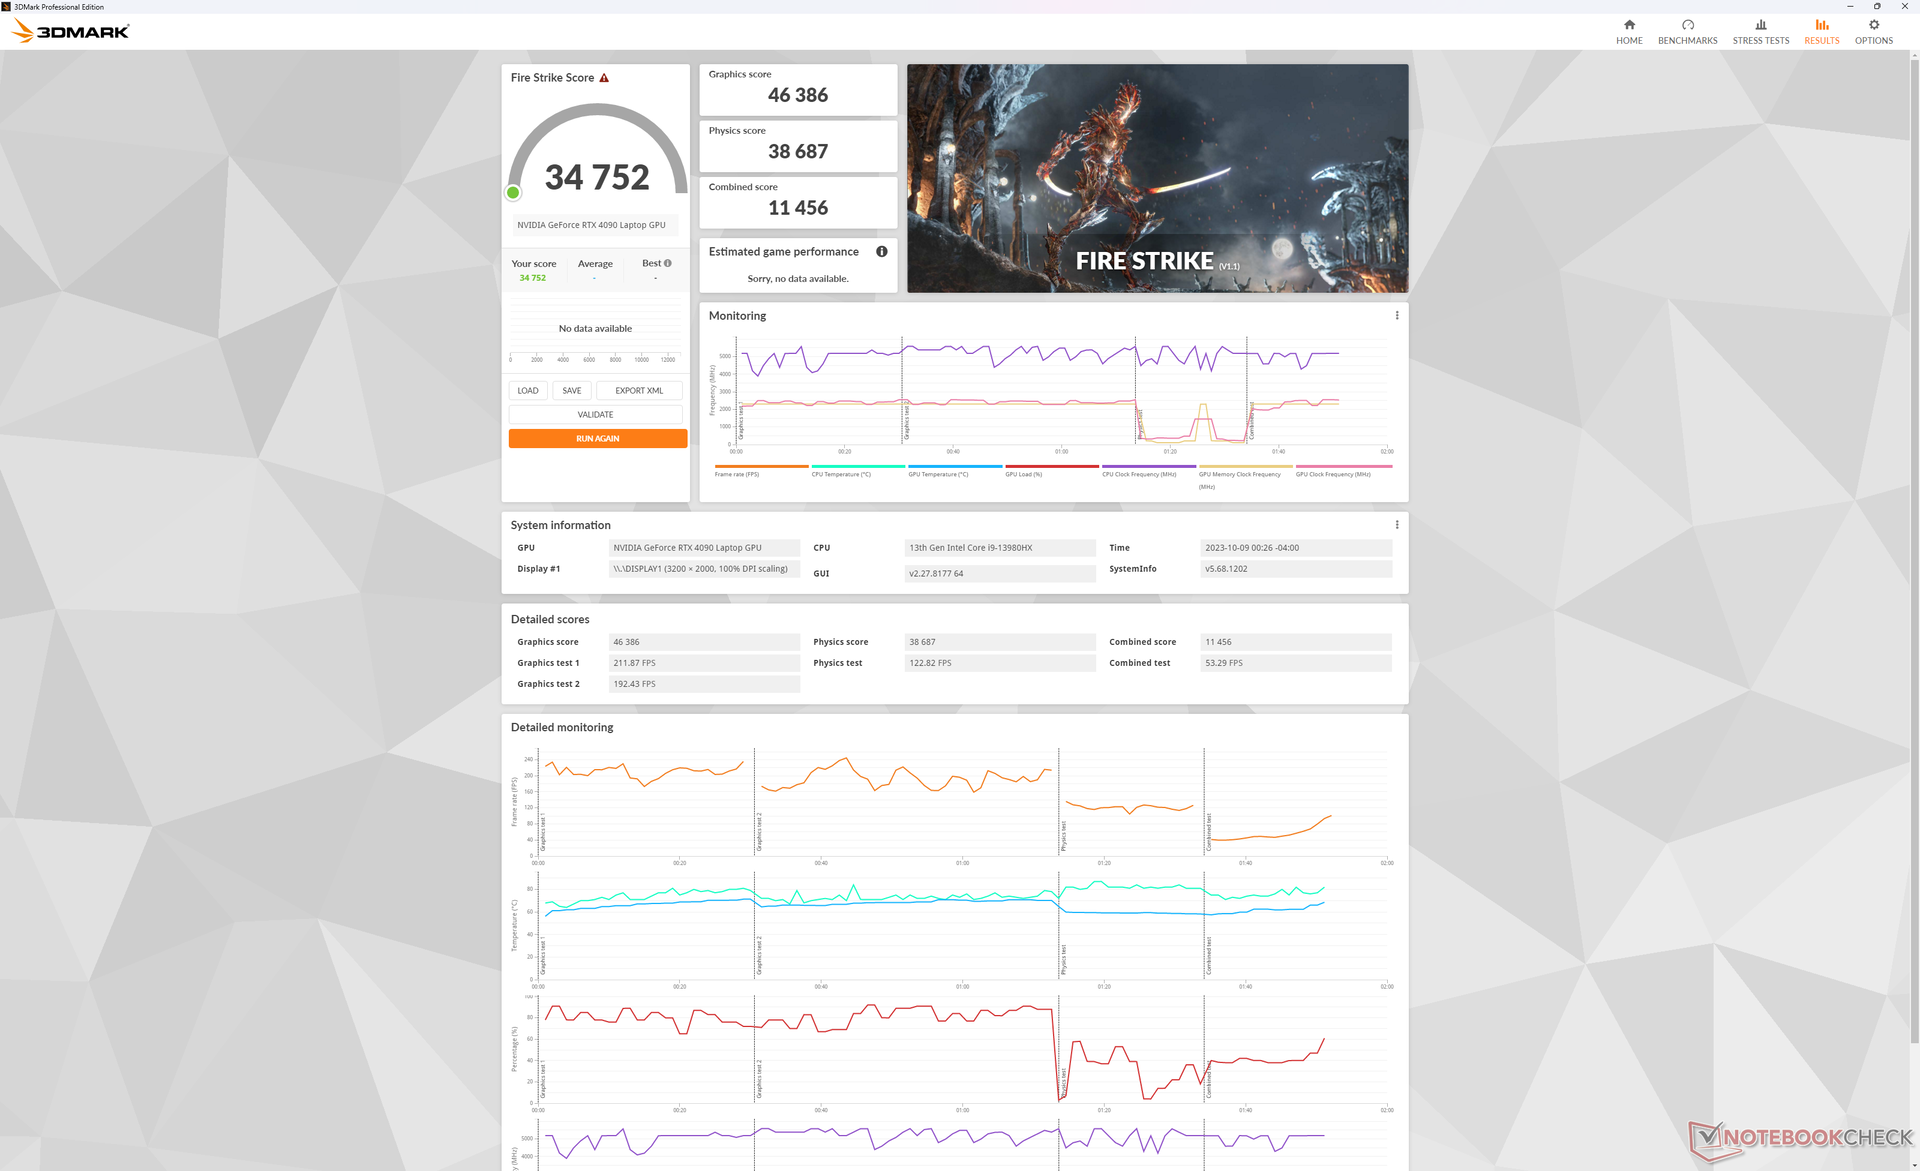
| 3DMark 11 Performance | 45239 poäng | |
| 3DMark Fire Strike Score | 34752 poäng | |
| 3DMark Time Spy Score | 20744 poäng | |
Hjälp | ||
* ... mindre är bättre
Spelprestanda
Alla spel körs mycket bra på QHD eller högre, inklusive krävande titlar som Cyberpunk 2077 eller Ratchet and Clank. Observera att G-Sync endast kan aktiveras om det är inställt på dGPU-läge eftersom det annars är inaktiverat om det är inställt på Hybrid eller integrerad grafik.
| Ratchet & Clank Rift Apart | |
| 1920x1080 Low Preset | |
| Lenovo Legion 9 16IRX8 | |
| Genomsnitt NVIDIA GeForce RTX 4090 Laptop GPU (n=1) | |
| MSI Raider GE68HX 13VF | |
| 1920x1080 Medium Preset AA:T | |
| Genomsnitt NVIDIA GeForce RTX 4090 Laptop GPU (155.6 - 161.8, n=2) | |
| Lenovo Legion 9 16IRX8 | |
| MSI Raider GE68HX 13VF | |
| 1920x1080 High Preset AA:T | |
| Genomsnitt NVIDIA GeForce RTX 4090 Laptop GPU (135.4 - 136.6, n=2) | |
| Lenovo Legion 9 16IRX8 | |
| MSI Raider GE68HX 13VF | |
| 1920x1080 Very High Preset AA:T | |
| Genomsnitt NVIDIA GeForce RTX 4090 Laptop GPU (111.1 - 115.4, n=2) | |
| Lenovo Legion 9 16IRX8 | |
| MSI Raider GE68HX 13VF | |
| 2560x1440 Very High Preset AA:T | |
| Genomsnitt NVIDIA GeForce RTX 4090 Laptop GPU (98.7 - 107.1, n=2) | |
| Lenovo Legion 9 16IRX8 | |
Witcher 3 FPS Chart
| låg | med. | hög | ultra | QHD | |
|---|---|---|---|---|---|
| GTA V (2015) | 187.1 | 186.3 | 184.8 | 150.7 | 145.3 |
| The Witcher 3 (2015) | 671.8 | 569 | 408.2 | 208.7 | 165 |
| Dota 2 Reborn (2015) | 244 | 217 | 208 | 193.1 | |
| Final Fantasy XV Benchmark (2018) | 231 | 207 | 181.3 | 158.4 | |
| X-Plane 11.11 (2018) | 214 | 185.9 | 140.1 | ||
| Far Cry 5 (2018) | 195 | 176 | 167 | 158 | 157 |
| Strange Brigade (2018) | 487 | 409 | 390 | 387 | 312 |
| Cyberpunk 2077 1.6 (2022) | 146.9 | 142.9 | 129.5 | 131.4 | 98.8 |
| Tiny Tina's Wonderlands (2022) | 377.6 | 290.4 | 226.2 | 186.4 | 137.8 |
| F1 22 (2022) | 336 | 333 | 286 | 130.8 | 90.9 |
| Ratchet & Clank Rift Apart (2023) | 163.4 | 155.6 | 135.4 | 111.1 | 98.7 |
| Cyberpunk 2077 (2023) | 131.22 | 89.55 | |||
| Alan Wake 2 (2023) | 121.1 | 83.7 | |||
| Avatar Frontiers of Pandora (2023) | 100 | 69 |
Utsläpp
Buller från systemet
Fläktarna går nästan aldrig på tomgång och därför bör man alltid förvänta sig lite oljud. De tenderar att ligga runt 30,4 dB(A) mot en tyst bakgrund på 23,7 dB(A) under de vanligaste belastningarna som webbsurfning eller videostreaming även när de är inställda på tyst läge. Detta intervall är typiskt för de flesta andra bärbara speldatorer under liknande förhållanden, men Legion 9i 16 pulserar inte lika ofta förutsatt att du kör på Balanced iGPU-läge eller lägre.
Fläktljudet ökar markant till 52,2 dB(A) när du spelar i Performance-läget, vilket är det förväntade intervallet för avancerade bärbara speldatorer. Bullret minskar något till 49,5 dB(A) om man istället spelar i läget Balanced, men kom ihåg att grafikunderskottet är 17 procent jämfört med Performance-läget som nämndes ovan. Hörlurar när du spelar rekommenderas i båda fallen.
Ljudnivå
| Låg belastning |
| 24 / 24 / 30.4 dB(A) |
| Hög belastning |
| 30.4 / 54.9 dB(A) |
 | ||
30 dB tyst 40 dB(A) hörbar 50 dB(A) högt ljud |
||
min: | ||
| Lenovo Legion 9 16IRX8 GeForce RTX 4090 Laptop GPU, i9-13980HX, 2x SK Hynix HFS001TEJ9X115N (RAID 0) | Lenovo Legion Slim 5 16APH8 GeForce RTX 4060 Laptop GPU, R7 7840HS, SK hynix PC801 HFS512GEJ9X115N | Razer Blade 16 Early 2023 RTX 4090 GeForce RTX 4090 Laptop GPU, i9-13950HX, SSSTC CA6-8D1024 | Asus ROG Strix G16 G614JZ GeForce RTX 4080 Laptop GPU, i9-13980HX, WD PC SN560 SDDPNQE-1T00 | HP Omen Transcend 16 GeForce RTX 4070 Laptop GPU, i9-13900HX, SK hynix PC801 HFS002TEJ9X101N | Alienware x16 R1 GeForce RTX 4080 Laptop GPU, i9-13900HK, SK hynix PC801 HFS001TEJ9X101N | |
|---|---|---|---|---|---|---|
| Noise | 1% | 3% | -11% | -13% | -1% | |
| av / miljö * (dB) | 23.7 | 22.9 3% | 20.84 12% | 25 -5% | 22.9 3% | 22.7 4% |
| Idle Minimum * (dB) | 24 | 23.1 4% | 23.65 1% | 26 -8% | 29.1 -21% | 23.1 4% |
| Idle Average * (dB) | 24 | 23.1 4% | 23.65 1% | 28 -17% | 29.1 -21% | 25.8 -8% |
| Idle Maximum * (dB) | 30.4 | 27.7 9% | 23.65 22% | 30 1% | 29.1 4% | 25.8 15% |
| Load Average * (dB) | 30.4 | 33.3 -10% | 43.35 -43% | 48 -58% | 45.7 -50% | 39.3 -29% |
| Witcher 3 ultra * (dB) | 52.2 | 54 -3% | 46.7 11% | 49 6% | 54.3 -4% | 49.9 4% |
| Load Maximum * (dB) | 54.9 | 54 2% | 46.72 15% | 52 5% | 54.3 1% | 54.8 -0% |
* ... mindre är bättre
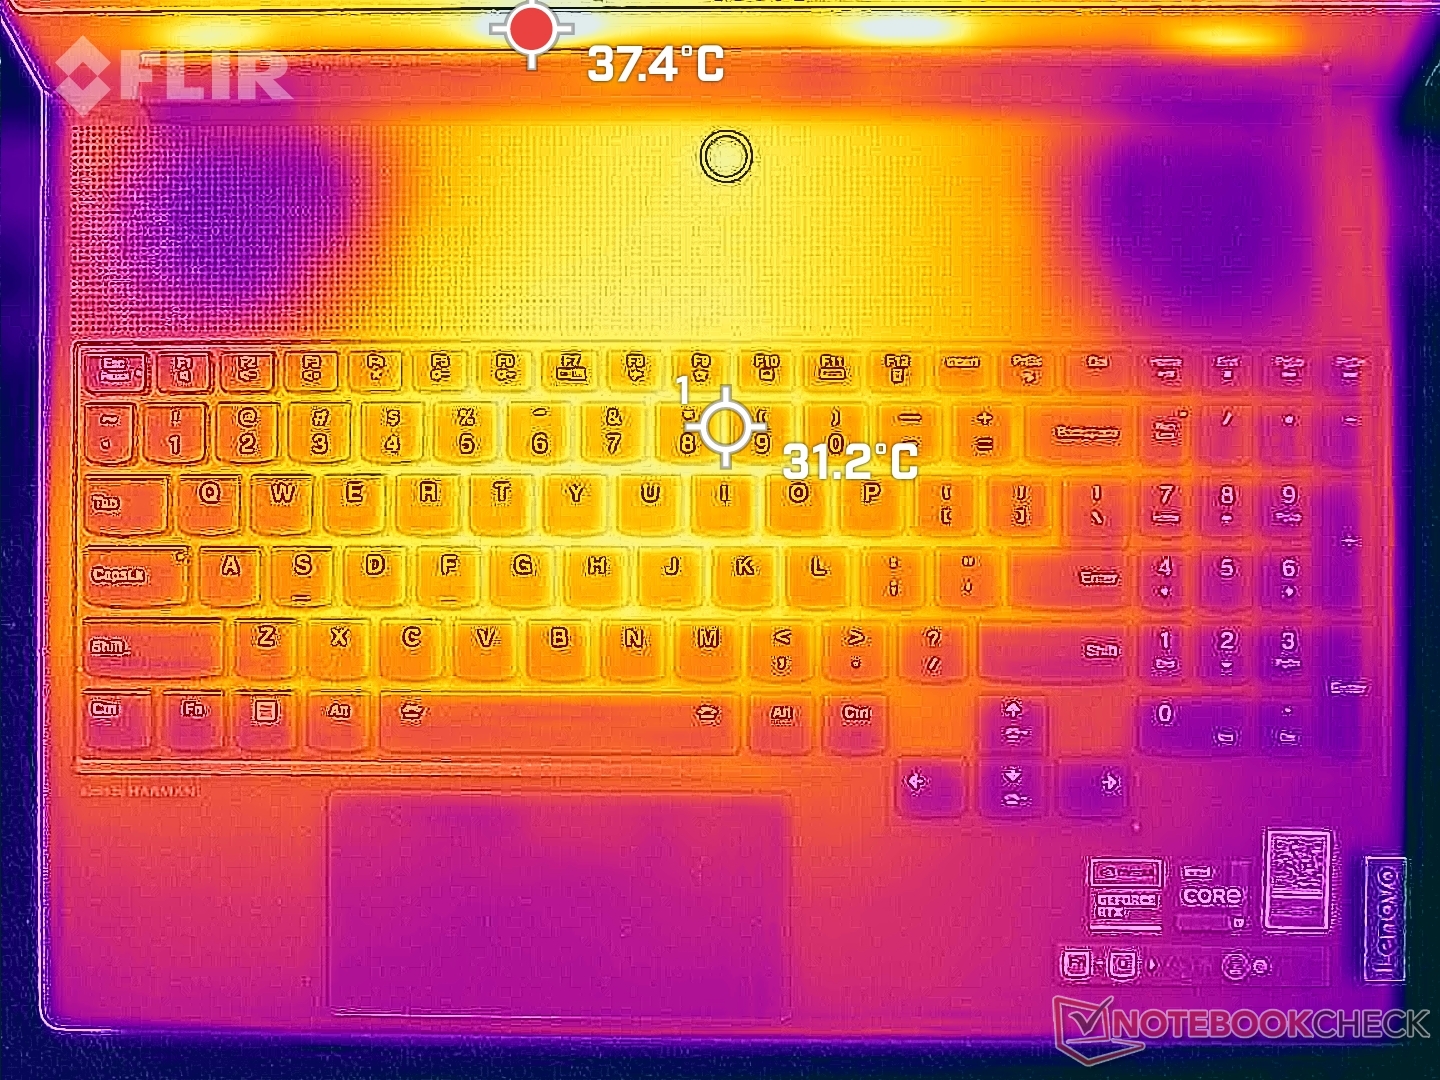
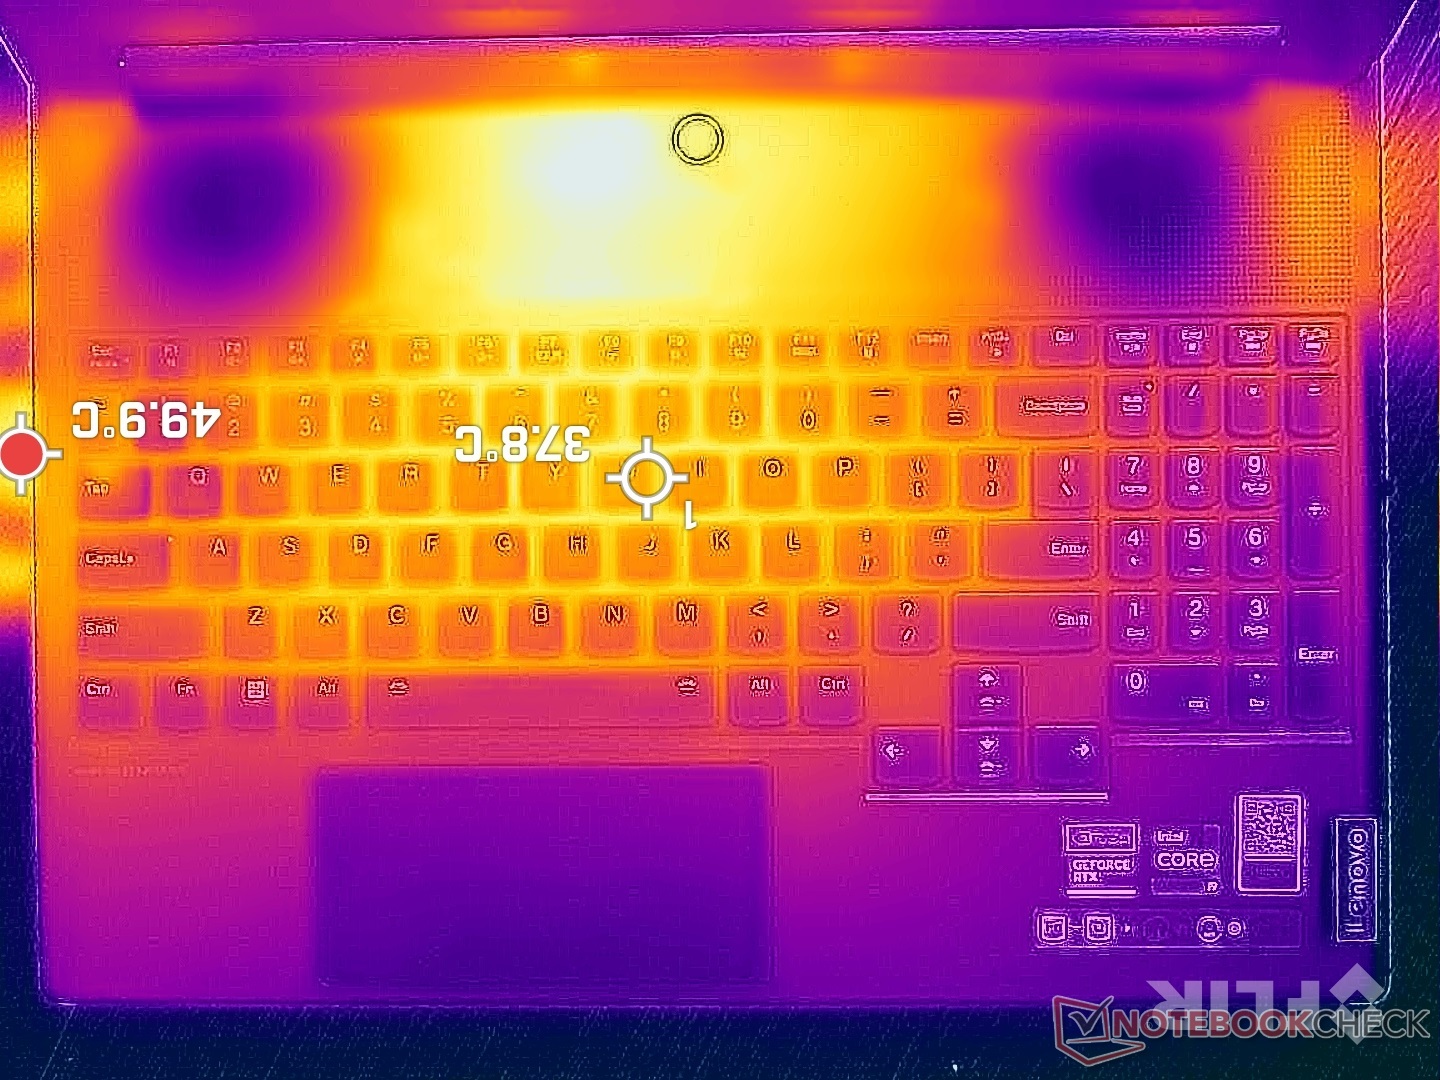
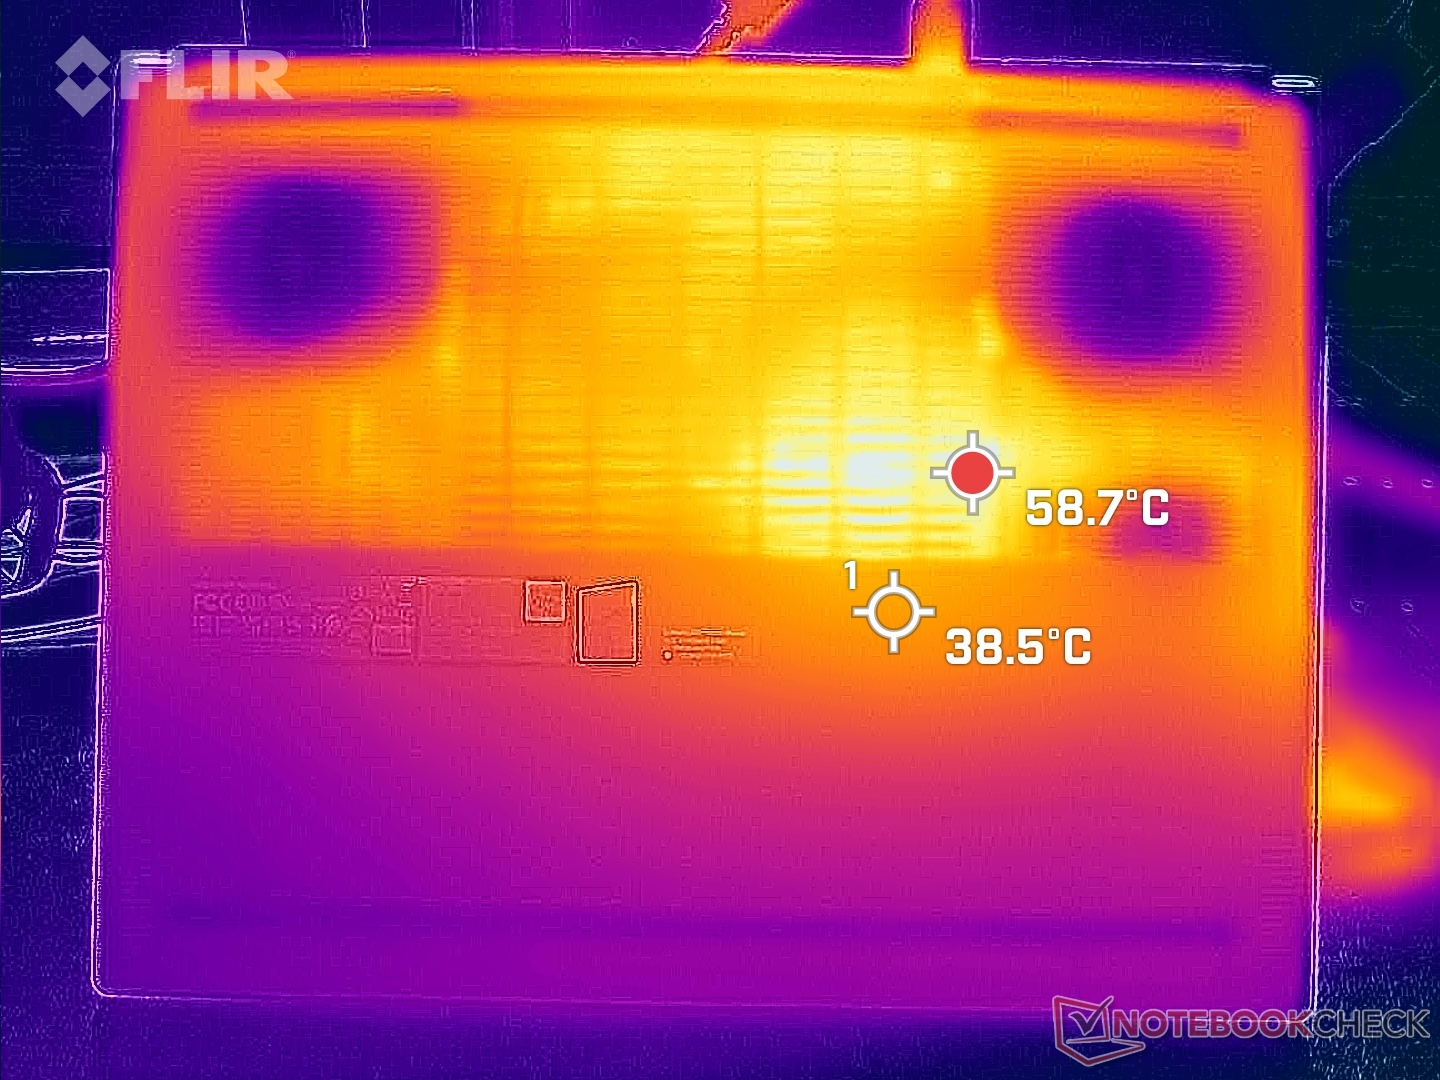
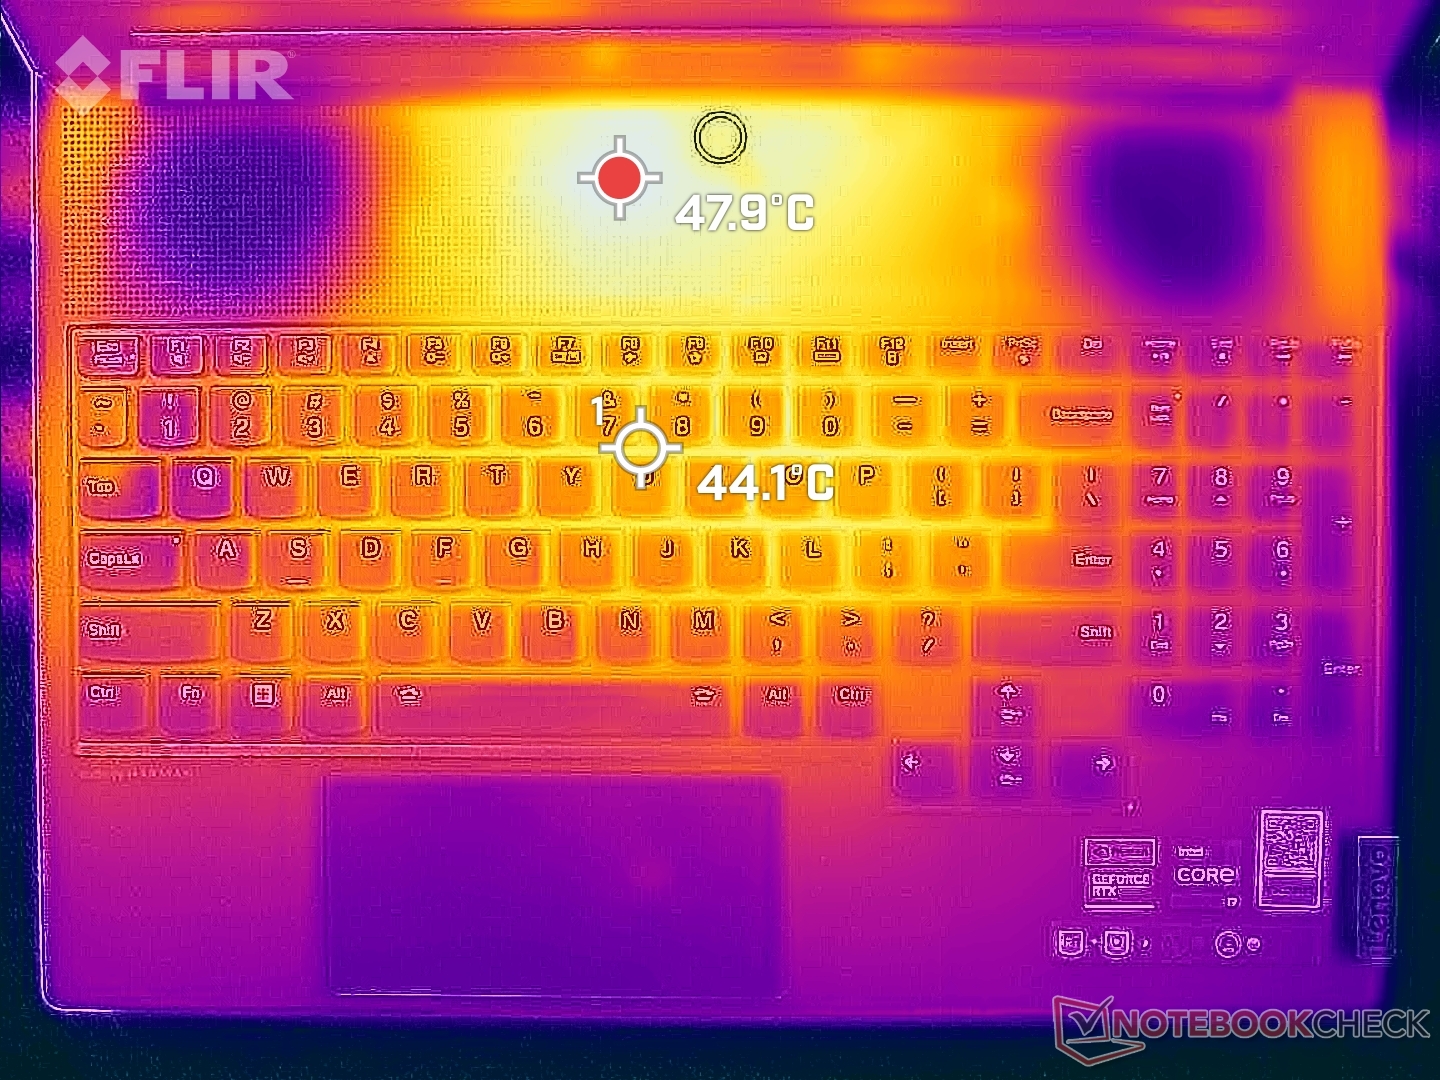
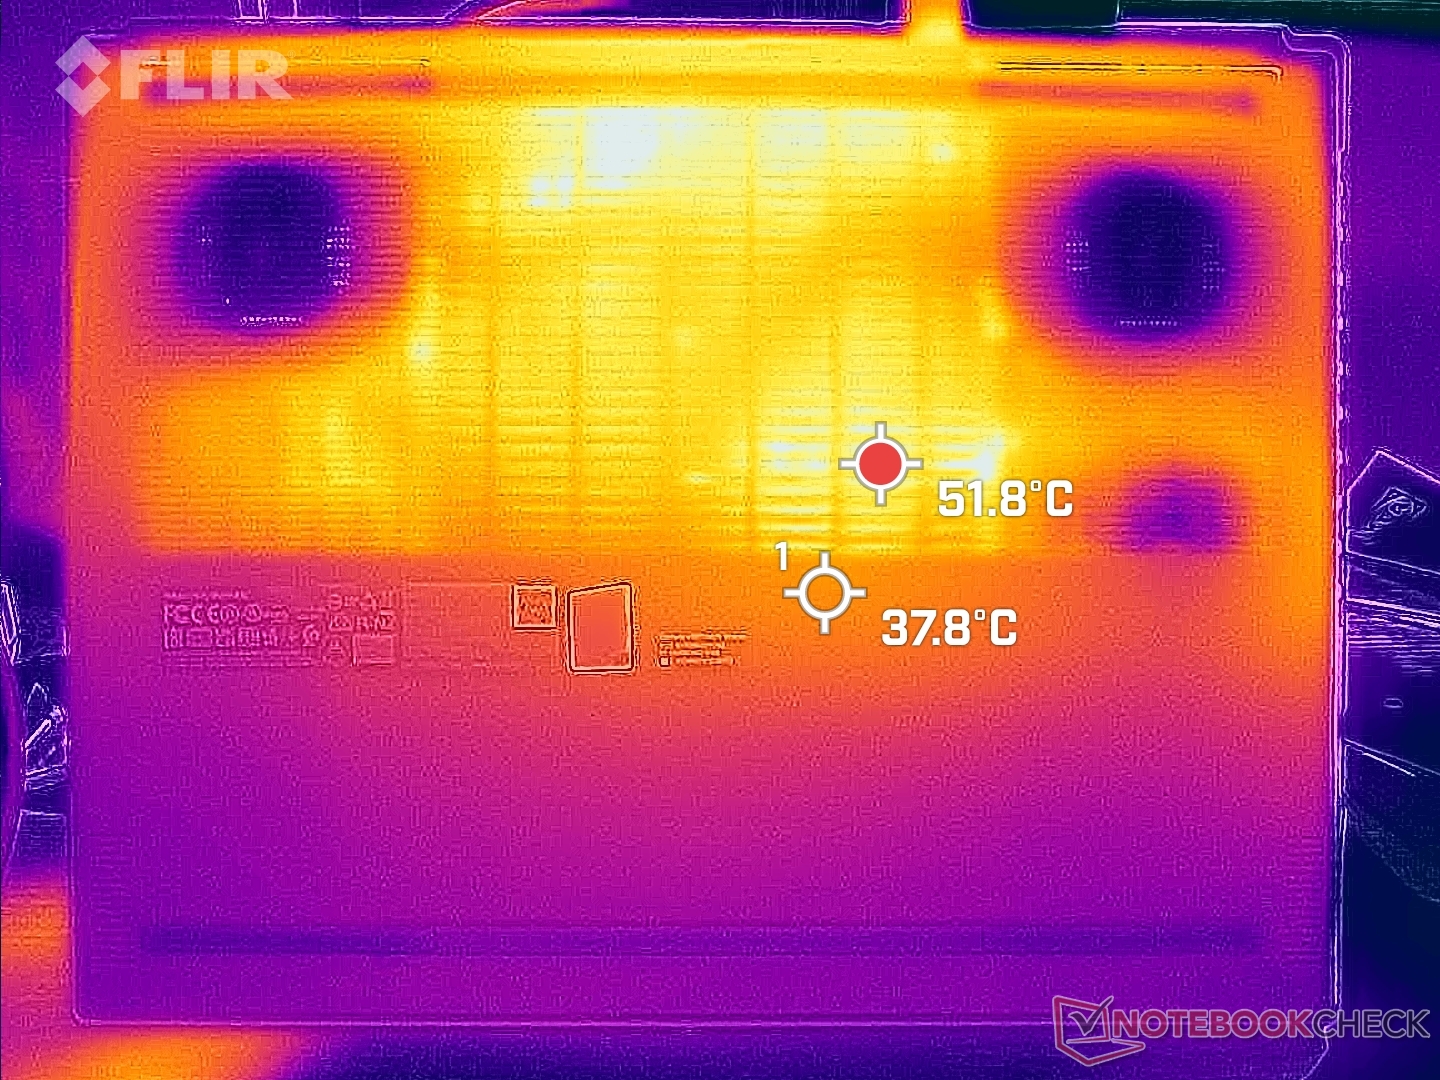
Temperatur
Yttemperaturerna är ganska varma trots den avancerade termiken. När du spelar kan WASD-tangenterna och tangentbordets mitt vara så varma som 42 C respektive 46 C, vilket är något varmare än vad vi observerade på Alienware x16 R1. Många andra bärbara speldatorer som Razer Blade 16 drar in frisk luft från WASD-tangenterna för att hålla den delen av tangentbordet svalt för bekvämare spel, men detta är inte fallet för vår Legion 9 16-design, vilket framgår av temperaturkartorna nedan.
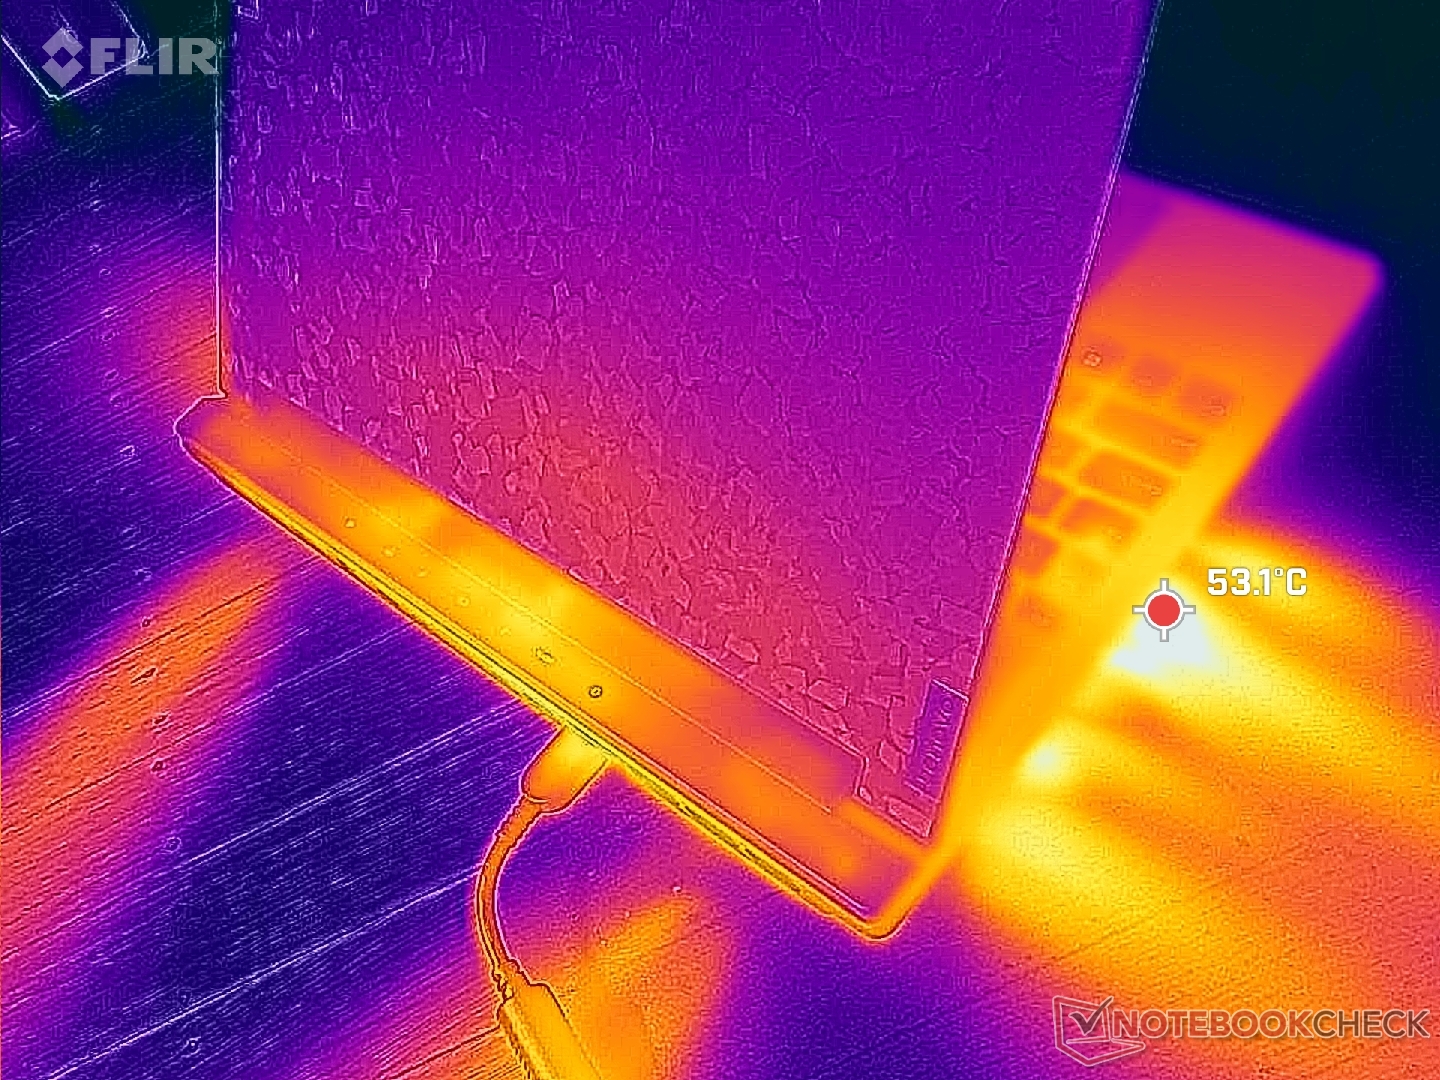
(-) Den maximala temperaturen på ovansidan är 49.6 °C / 121 F, jämfört med genomsnittet av 40.4 °C / 105 F , allt från 21.2 till 68.8 °C för klassen Gaming.
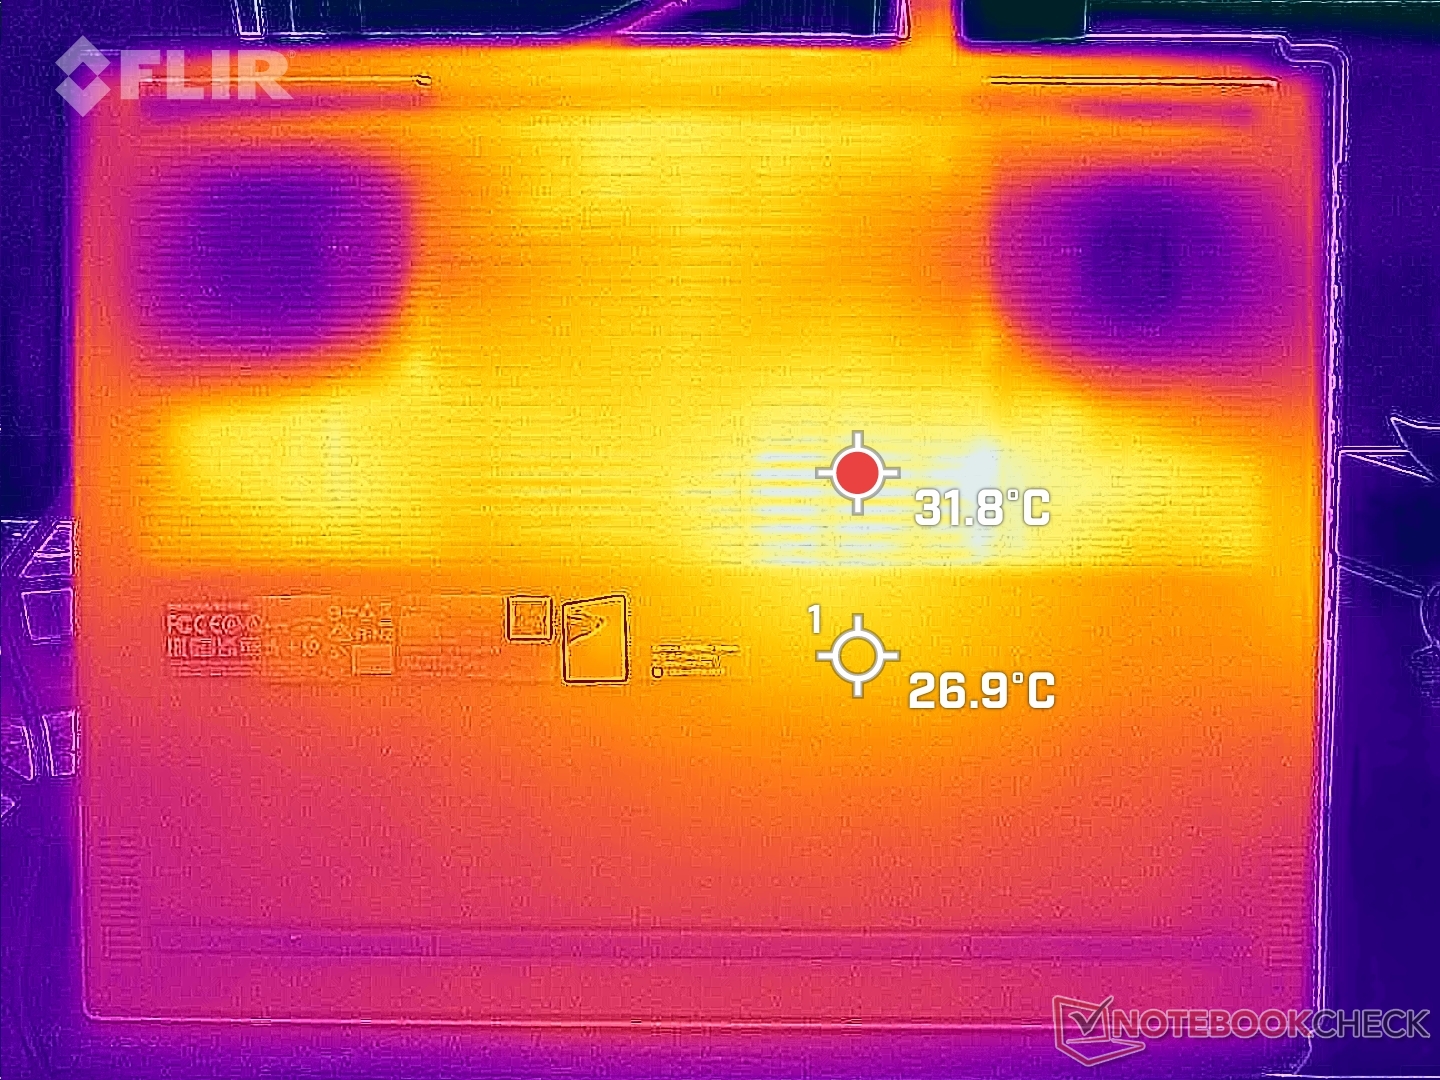
(-) Botten värms upp till maximalt 48.6 °C / 119 F, jämfört med genomsnittet av 43.2 °C / 110 F
(+) Vid tomgångsbruk är medeltemperaturen för ovansidan 30 °C / 86 F, jämfört med enhetsgenomsnittet på 33.9 °C / ### class_avg_f### F.
(-) När du spelar The Witcher 3 är medeltemperaturen för ovansidan 38.1 °C / 101 F, jämfört med enhetsgenomsnittet på 33.9 °C / ## #class_avg_f### F.
(+) Handledsstöden och pekplattan når maximal hudtemperatur (33.6 °C / 92.5 F) och är därför inte varma.
(-) Medeltemperaturen för handledsstödsområdet på liknande enheter var 28.8 °C / 83.8 F (-4.8 °C / -8.7 F).
| Lenovo Legion 9 16IRX8 Intel Core i9-13980HX, NVIDIA GeForce RTX 4090 Laptop GPU | Lenovo Legion Slim 5 16APH8 AMD Ryzen 7 7840HS, NVIDIA GeForce RTX 4060 Laptop GPU | Razer Blade 16 Early 2023 RTX 4090 Intel Core i9-13950HX, NVIDIA GeForce RTX 4090 Laptop GPU | Asus ROG Strix G16 G614JZ Intel Core i9-13980HX, NVIDIA GeForce RTX 4080 Laptop GPU | HP Omen Transcend 16 Intel Core i9-13900HX, NVIDIA GeForce RTX 4070 Laptop GPU | Alienware x16 R1 Intel Core i9-13900HK, NVIDIA GeForce RTX 4080 Laptop GPU | |
|---|---|---|---|---|---|---|
| Heat | 18% | 2% | -1% | 5% | -2% | |
| Maximum Upper Side * (°C) | 49.6 | 40.6 18% | 52 -5% | 54 -9% | 47.4 4% | 47.2 5% |
| Maximum Bottom * (°C) | 48.6 | 42 14% | 47.6 2% | 55 -13% | 54.4 -12% | 47.8 2% |
| Idle Upper Side * (°C) | 33.2 | 27.8 16% | 33 1% | 29 13% | 28.4 14% | 36.8 -11% |
| Idle Bottom * (°C) | 34.2 | 26.6 22% | 30.6 11% | 33 4% | 29.2 15% | 35.8 -5% |
* ... mindre är bättre
Stresstest
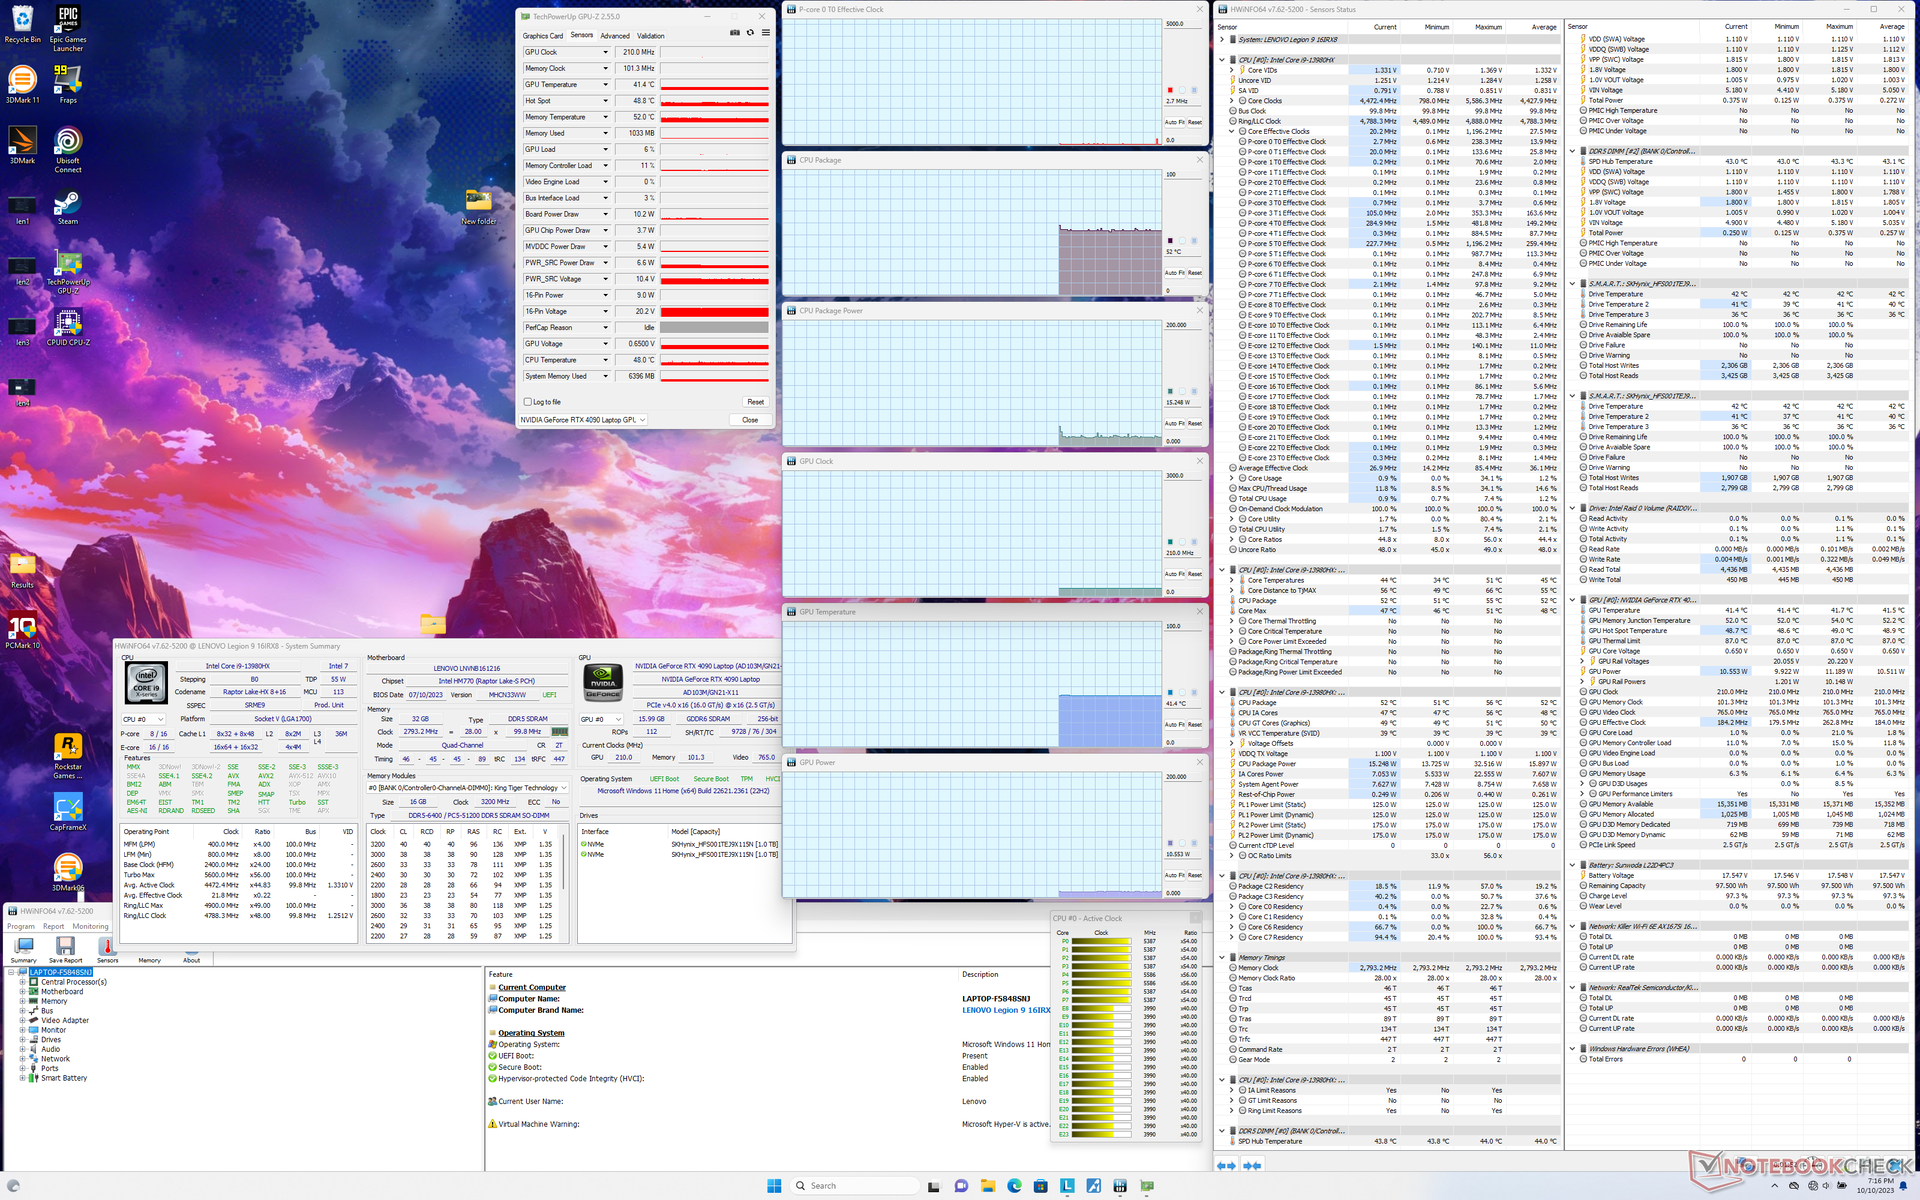
CPU-klockfrekvensen och kortets strömförbrukning vid Prime95-stress skulle stiga till 3,6 GHz respektive 138 W, innan den sjönk och stabiliserades på 3,0 GHz och 125 W efter ungefär en minut av testet. Kärntemperaturen stabiliserades vid 83 C jämfört med 100 C på den större Alienware m18 R1 utrustad med exakt samma Core i9-13980HX.
GPU-prestandan beror i hög grad på vilken effektprofil som valts, vilket nämns ovan i avsnittet GPU-prestanda. När du kör Witcher 3 i Performance-läget skulle till exempel Nvidia GPU stabilisera sig på 2265 MHz och 160 W jämfört med bara 1650 MHz och 104 W i Balanced-läget med GPU Overclock off. GPU-temperaturen stabiliseras på 78 C jämfört med 71 C på Blade 16 med samma RTX 4090 GPU.
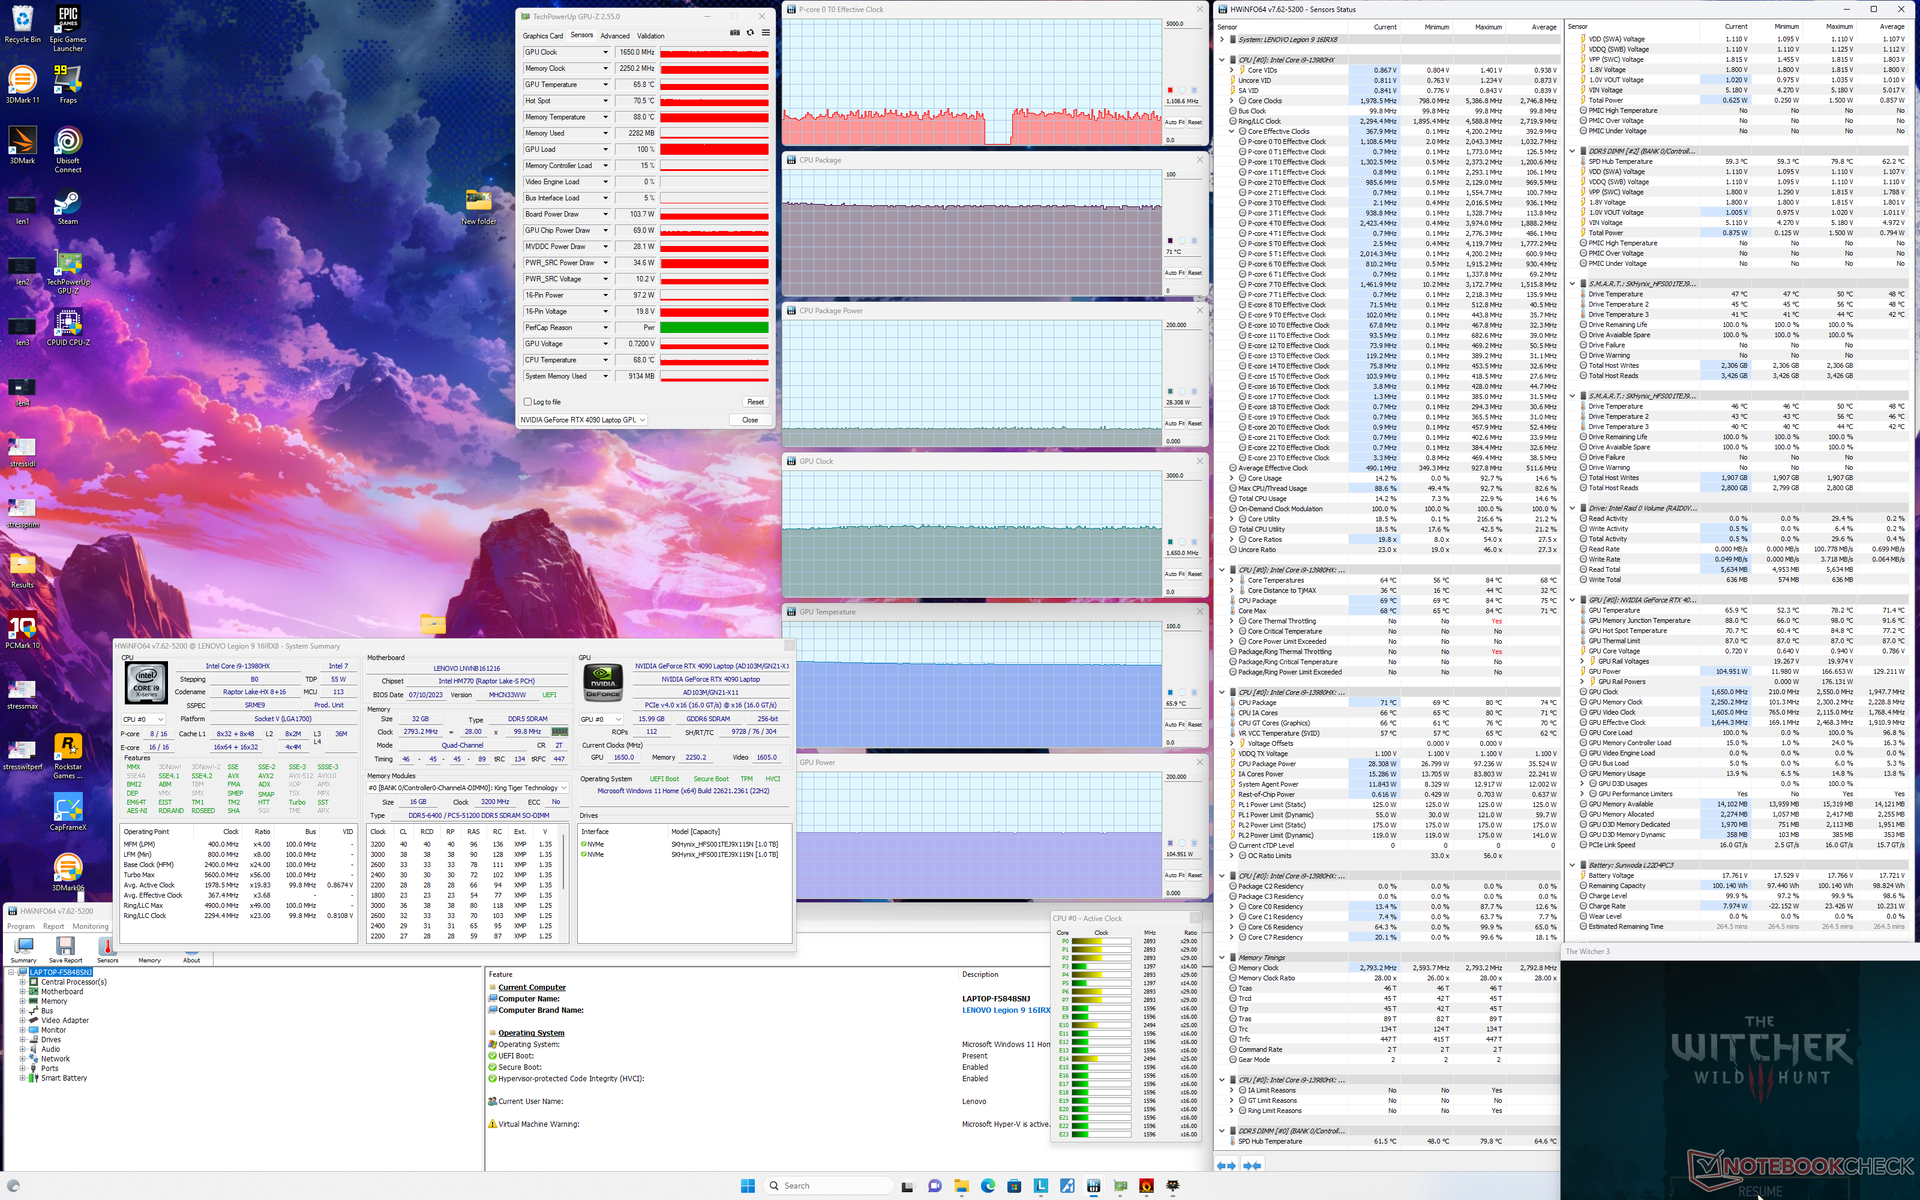
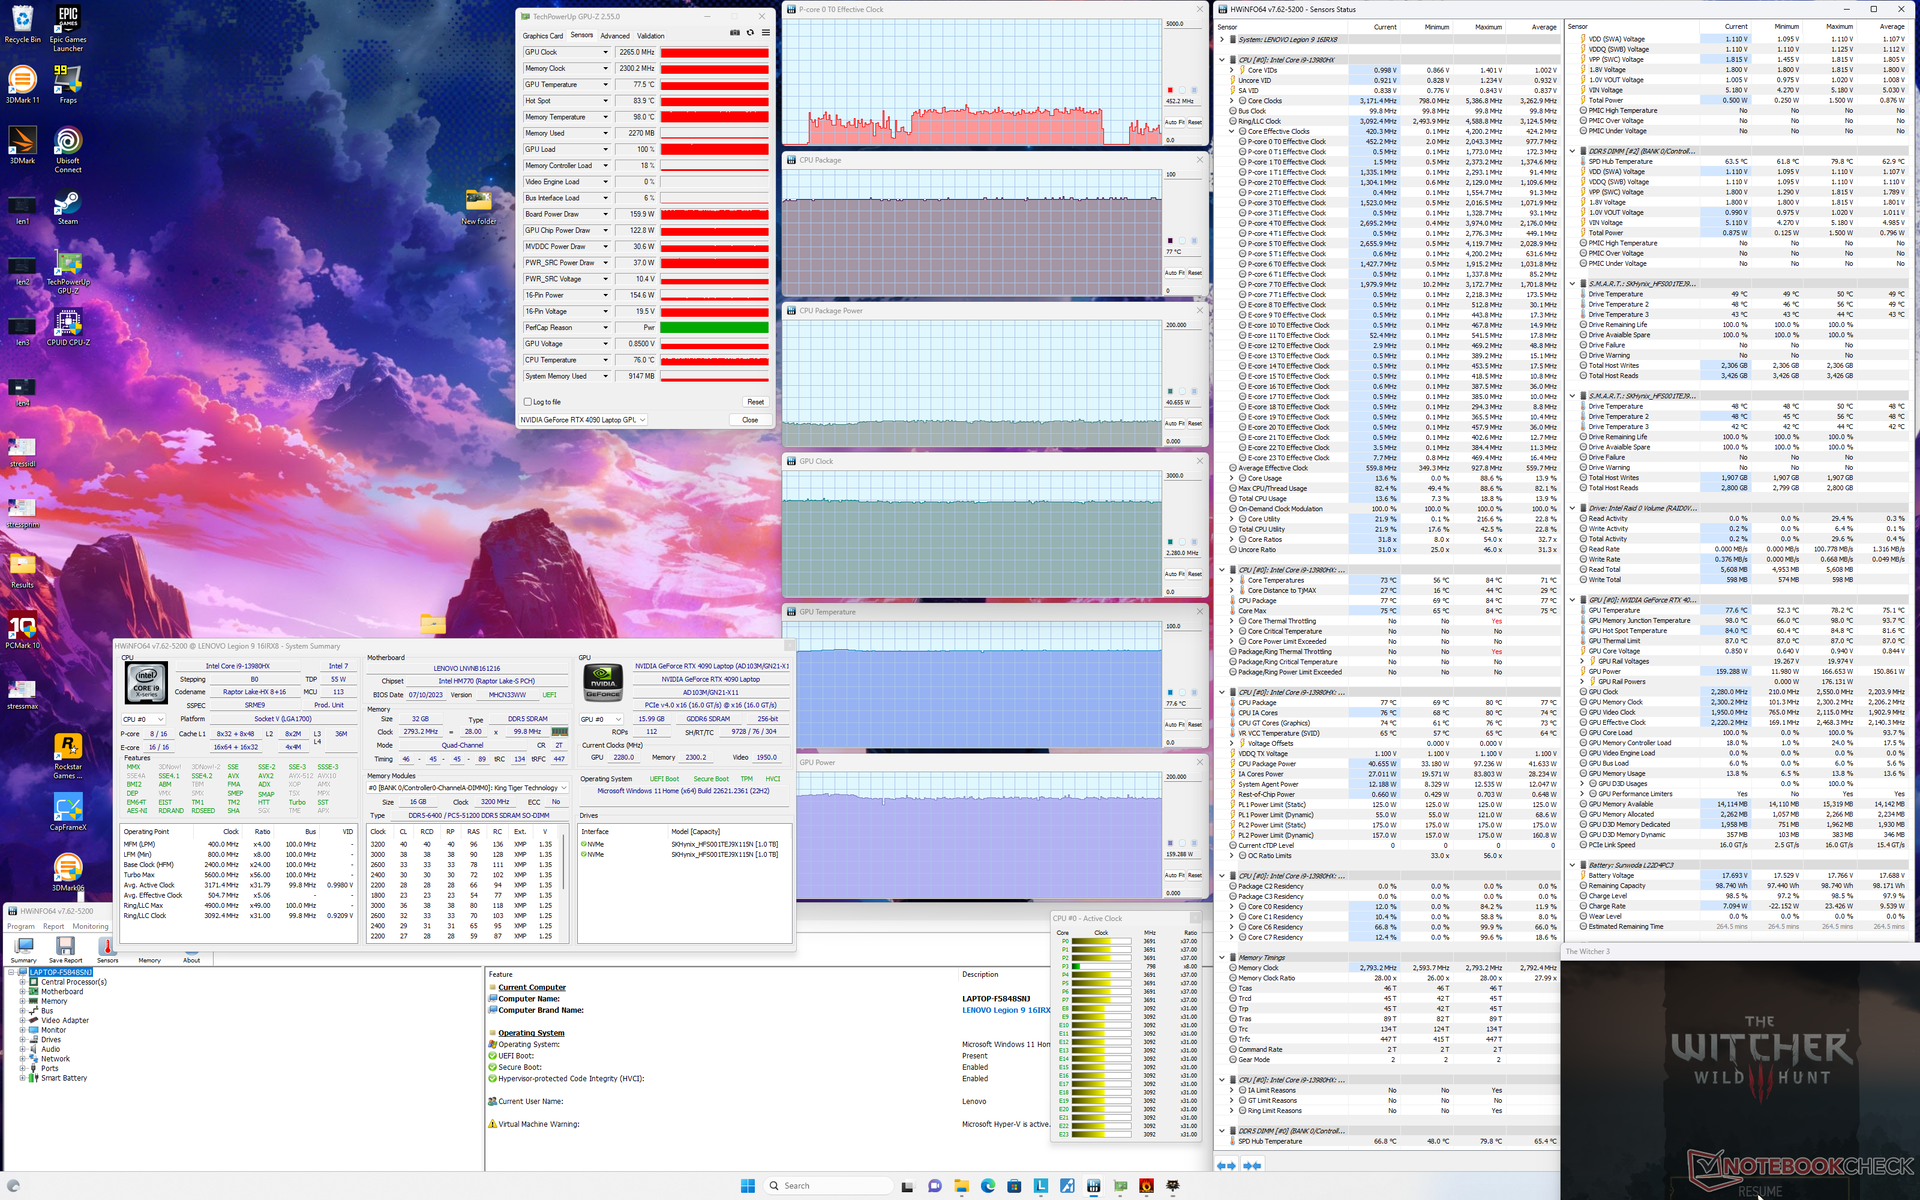
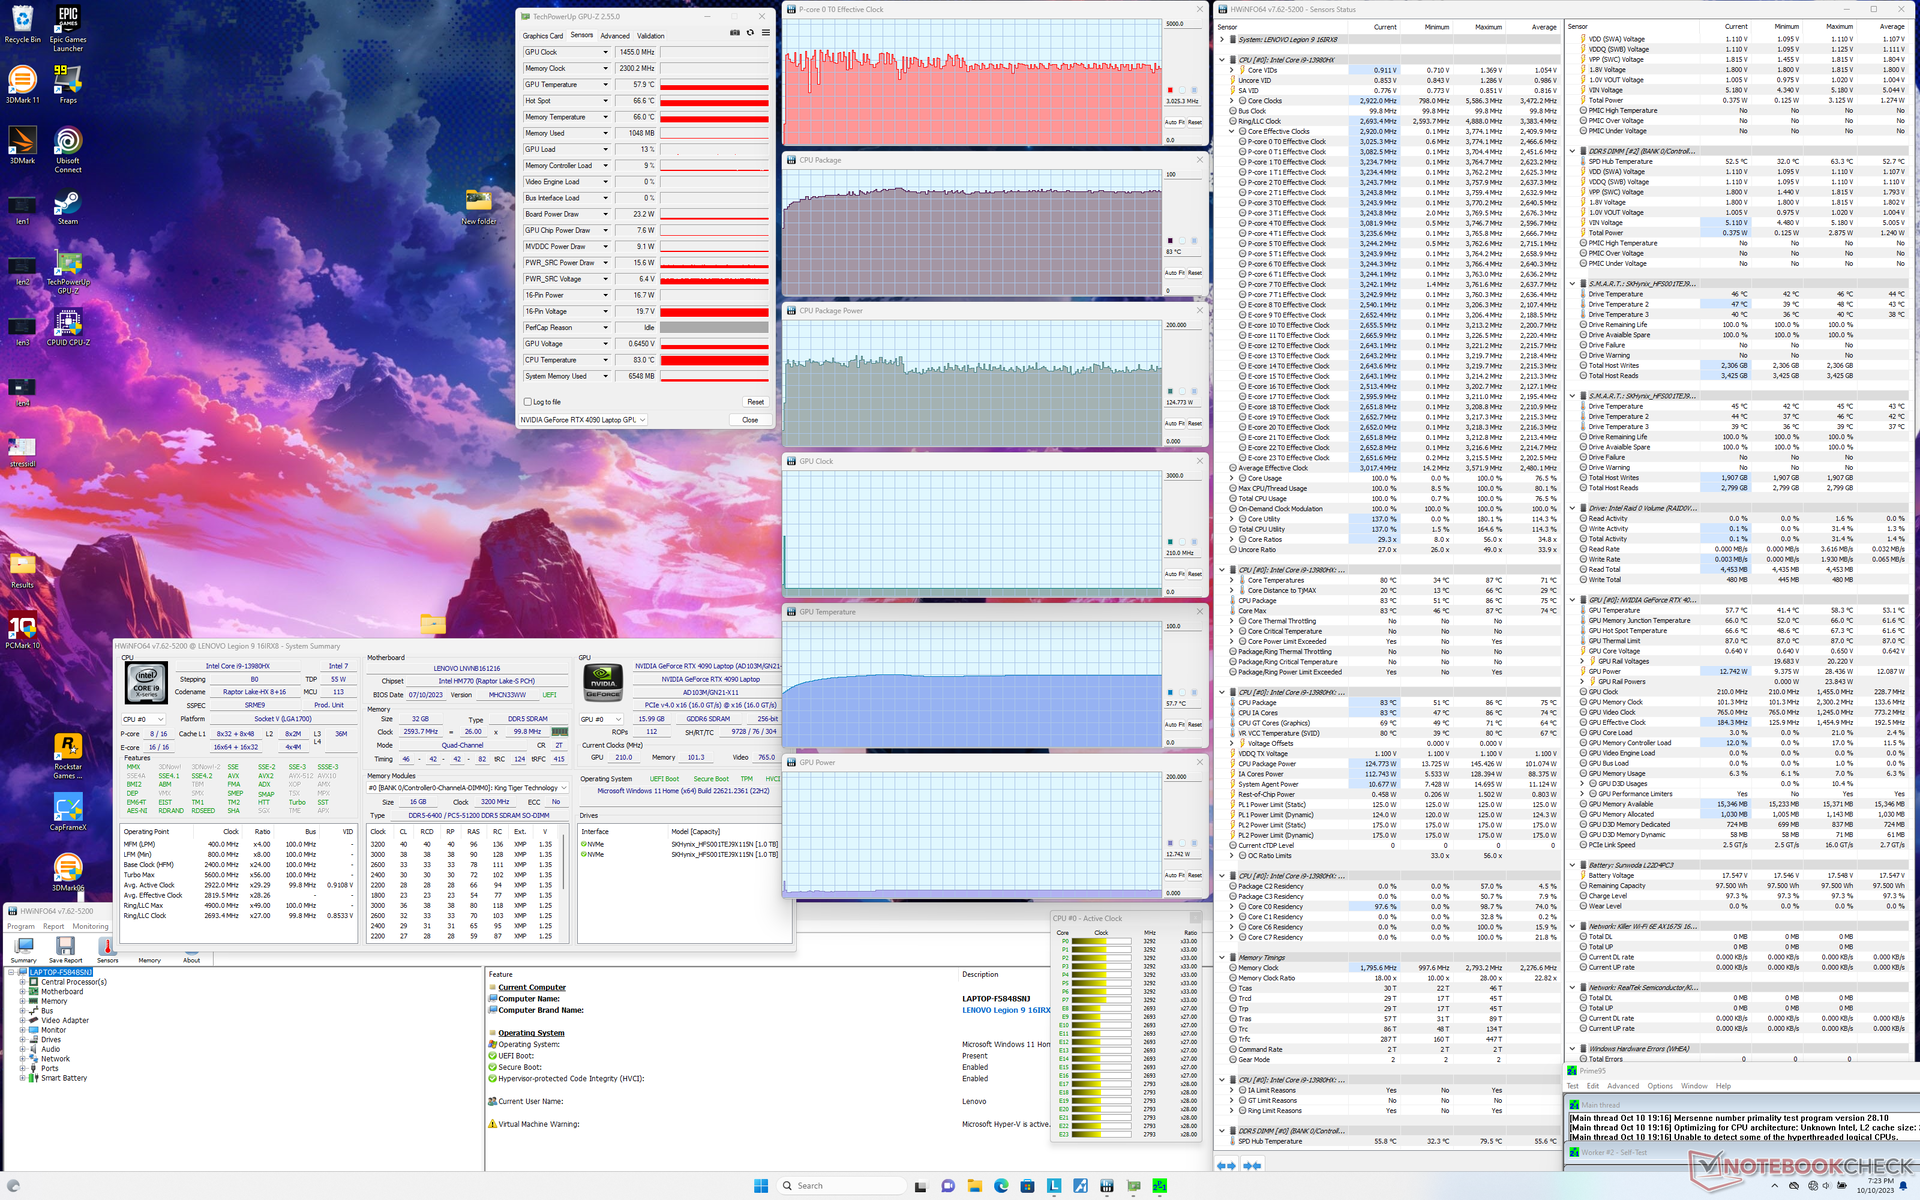
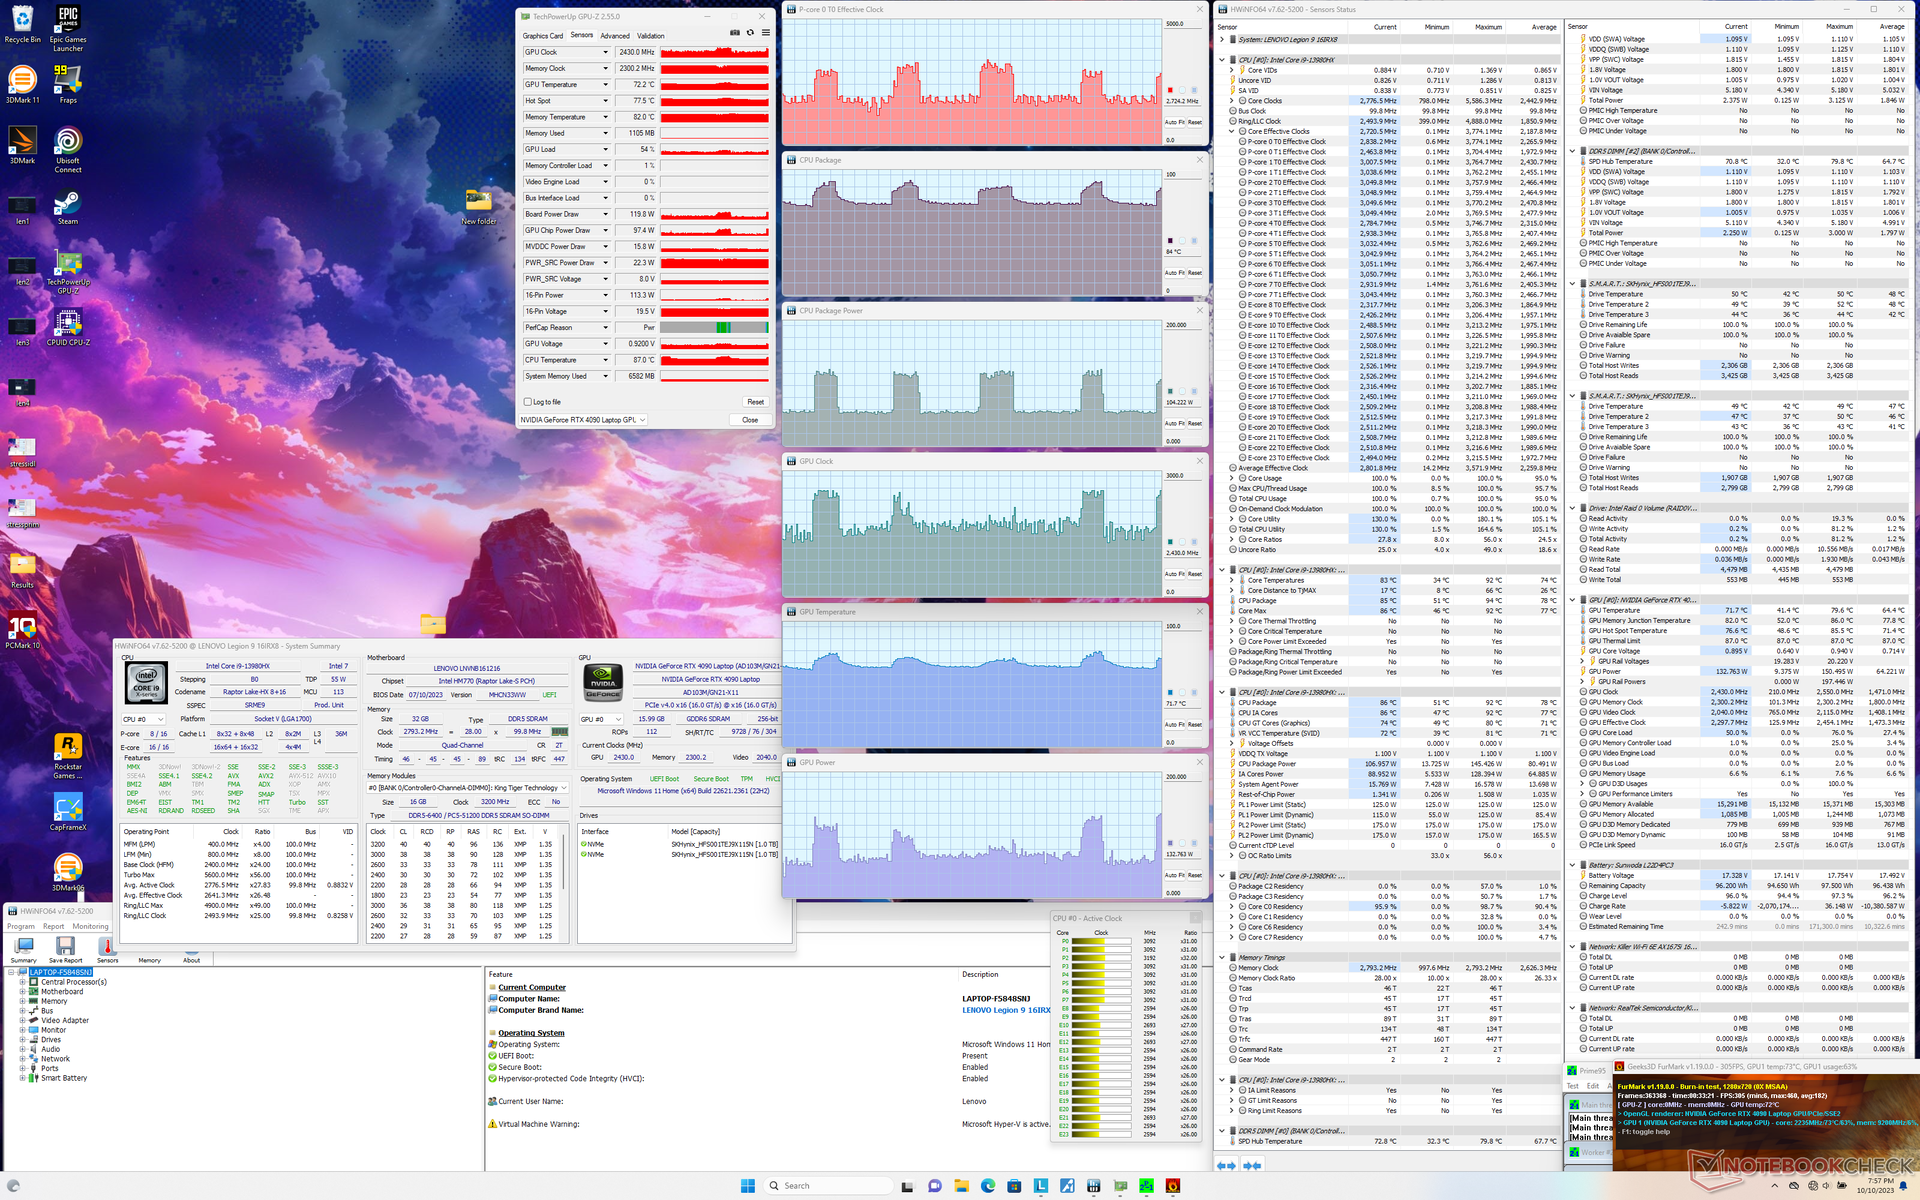
| CPU-klocka (GHz) | GPU-klocka (MHz) | Genomsnittlig CPU-temperatur (°C) | Genomsnittlig GPU-temperatur (°C) | |
| System i viloläge | -- | -- | 52 | 41 |
| Prime95 Stress | 3.0 | -- | 83 | 58 |
| Prime95 + FurMark Stress | 1.6 - 3.4 | 1365 - 2535 | 74 - 86 | 72 - 78 |
| Witcher 3 Stress (balanserat läge med GPU-överklockning av) | ~1,1 | 1650 | 71 | 66 |
| Witcher 3 Stress (prestandaläge) | ~1.1 | 2265 | 77 | 78 |
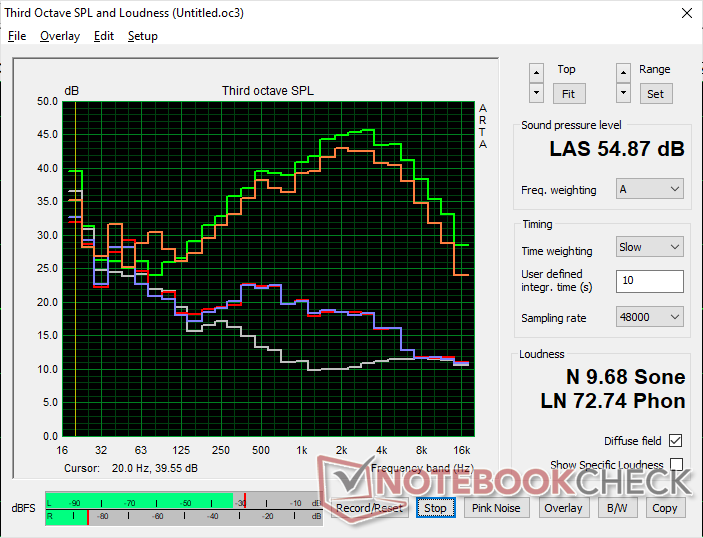
Högtalare
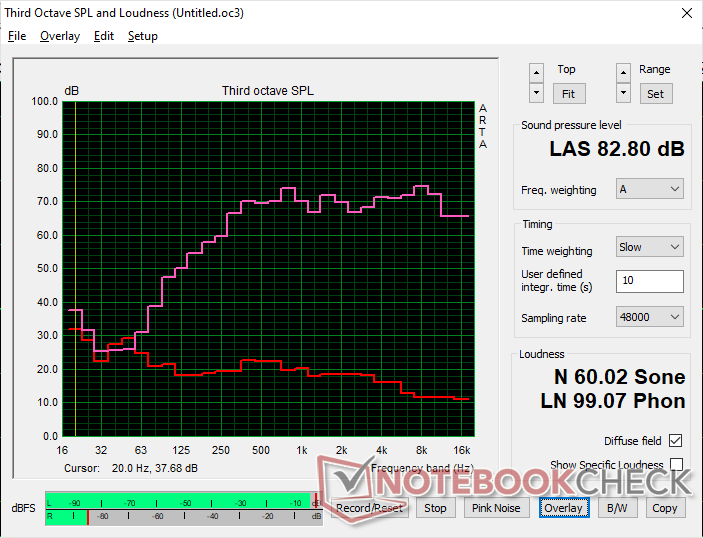
Lenovo Legion 9 16IRX8 ljudanalys
(+) | högtalare kan spela relativt högt (82.8 dB)
Bas 100 - 315 Hz
(±) | reducerad bas - i genomsnitt 13.5% lägre än medianen
(±) | linjäriteten för basen är genomsnittlig (9% delta till föregående frekvens)
Mellan 400 - 2000 Hz
(+) | balanserad mellan - endast 1.5% från medianen
(+) | mids är linjära (5.7% delta till föregående frekvens)
Högsta 2 - 16 kHz
(+) | balanserade toppar - endast 2.4% från medianen
(+) | toppar är linjära (3.7% delta till föregående frekvens)
Totalt 100 - 16 000 Hz
(+) | det totala ljudet är linjärt (11% skillnad mot median)
Jämfört med samma klass
» 7% av alla testade enheter i den här klassen var bättre, 3% liknande, 89% sämre
» Den bästa hade ett delta på 6%, genomsnittet var 18%, sämst var 132%
Jämfört med alla testade enheter
» 6% av alla testade enheter var bättre, 2% liknande, 92% sämre
» Den bästa hade ett delta på 4%, genomsnittet var 23%, sämst var 134%
Apple MacBook Pro 16 2021 M1 Pro ljudanalys
(+) | högtalare kan spela relativt högt (84.7 dB)
Bas 100 - 315 Hz
(+) | bra bas - bara 3.8% från medianen
(+) | basen är linjär (5.2% delta till föregående frekvens)
Mellan 400 - 2000 Hz
(+) | balanserad mellan - endast 1.3% från medianen
(+) | mids är linjära (2.1% delta till föregående frekvens)
Högsta 2 - 16 kHz
(+) | balanserade toppar - endast 1.9% från medianen
(+) | toppar är linjära (2.7% delta till föregående frekvens)
Totalt 100 - 16 000 Hz
(+) | det totala ljudet är linjärt (4.6% skillnad mot median)
Jämfört med samma klass
» 0% av alla testade enheter i den här klassen var bättre, 0% liknande, 100% sämre
» Den bästa hade ett delta på 5%, genomsnittet var 17%, sämst var 45%
Jämfört med alla testade enheter
» 0% av alla testade enheter var bättre, 0% liknande, 100% sämre
» Den bästa hade ett delta på 4%, genomsnittet var 23%, sämst var 134%
Energiförvaltning
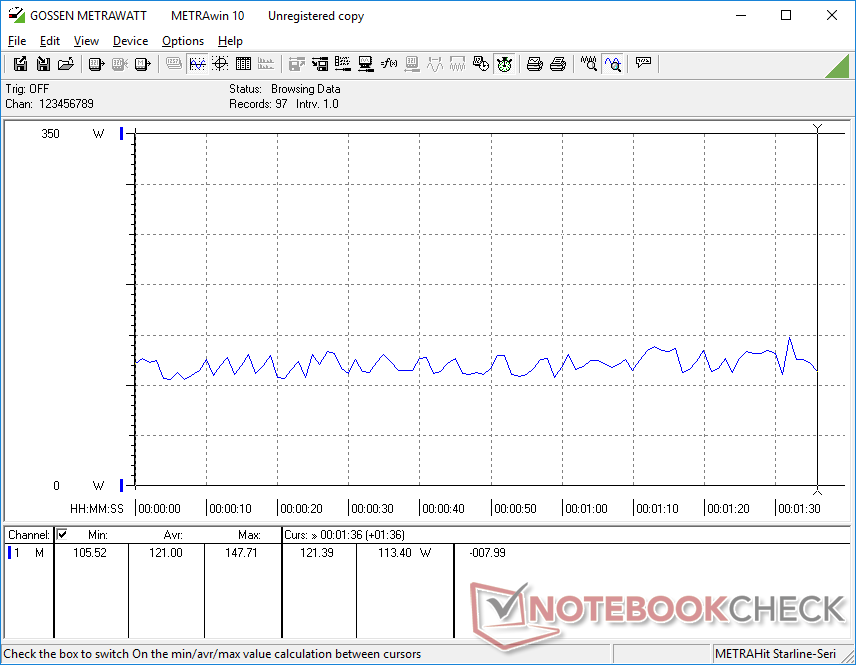
Strömförbrukning
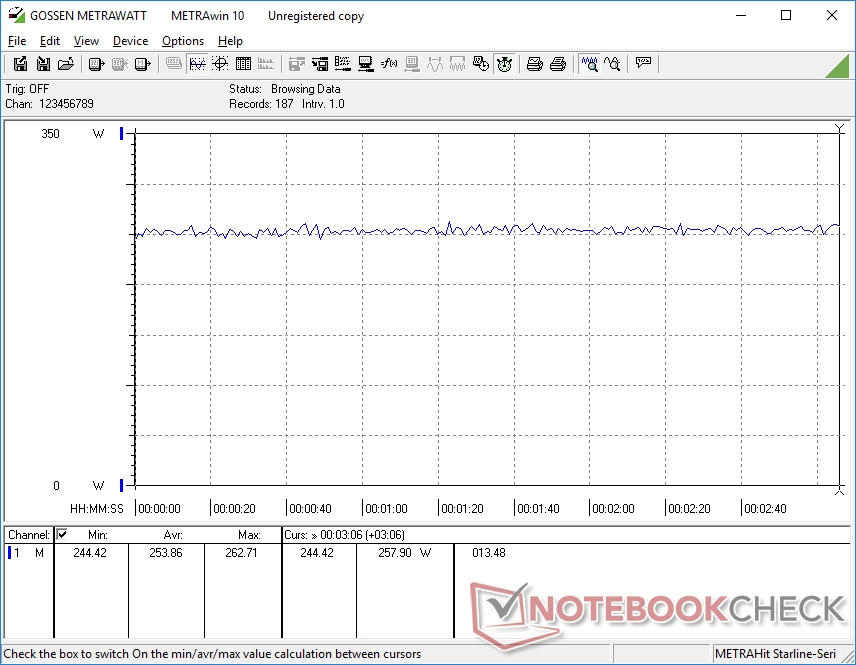
Strömförbrukningen är mycket hög oavsett ströminställning. Tomgångskörning på skrivbordet i Power Saver iGPU-läge och med lägsta ljusstyrka skulle fortfarande kräva 32 W jämfört med bara 9 W till 10 W på Legion Slim 5 16 eller Asus ROG Strix G16 alla med IPS-paneler. Förbrukningen beror inte bara på ljusstyrkan utan även på färgen, precis som för en OLED-panel. En helt vit skärm på vår Legion 9i 16, till exempel, skulle kräva cirka 13 W mer än en helt svart skärm även när den är inställd på maximal ljusstyrka för båda färgerna. IPS-paneler skulle bara kräva några få watt som mest oavsett vilken färg som jämförs.
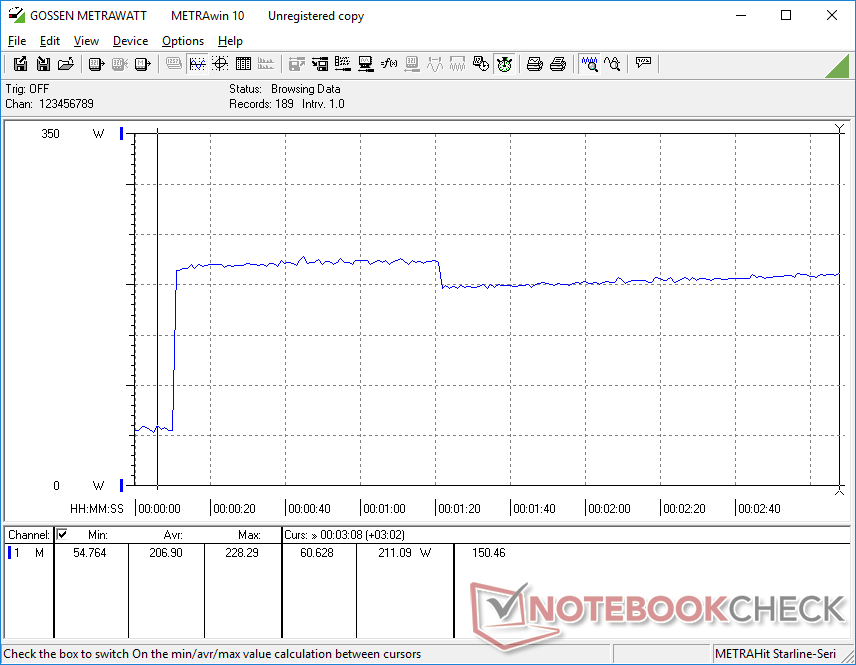
Att köra Prime95 på en extern bildskärm visar mycket liknande förbrukningsnivåer mellan vår Lenovo-enhet och Asus ROG Strix Scar 17 som drivs av den konkurrerande Ryzen 9 7945HX som visas i jämförelsegraferna nedan. Prestanda per watt är dock fortfarande i AMD:s favör eftersom Ryzen 9 7945HX överglänser vår Core i9-13980HX i flertrådade arbetsbelastningar trots deras liknande strömbehov.
Förbrukningen vid spel är något högre med cirka 10 procent jämfört med Asus ROG Strix Scar 17 SE med den äldre RTX 3080 Ti. Den 40 till 75 procent högre grafikprestandan med vår RTX 4090 kompenserar dock mer än väl för den mindre ökningen i förbrukning. Den mycket höga prestandan per watt i den mobila Ada Lovelace-serien är imponerande och oöverträffad just nu.
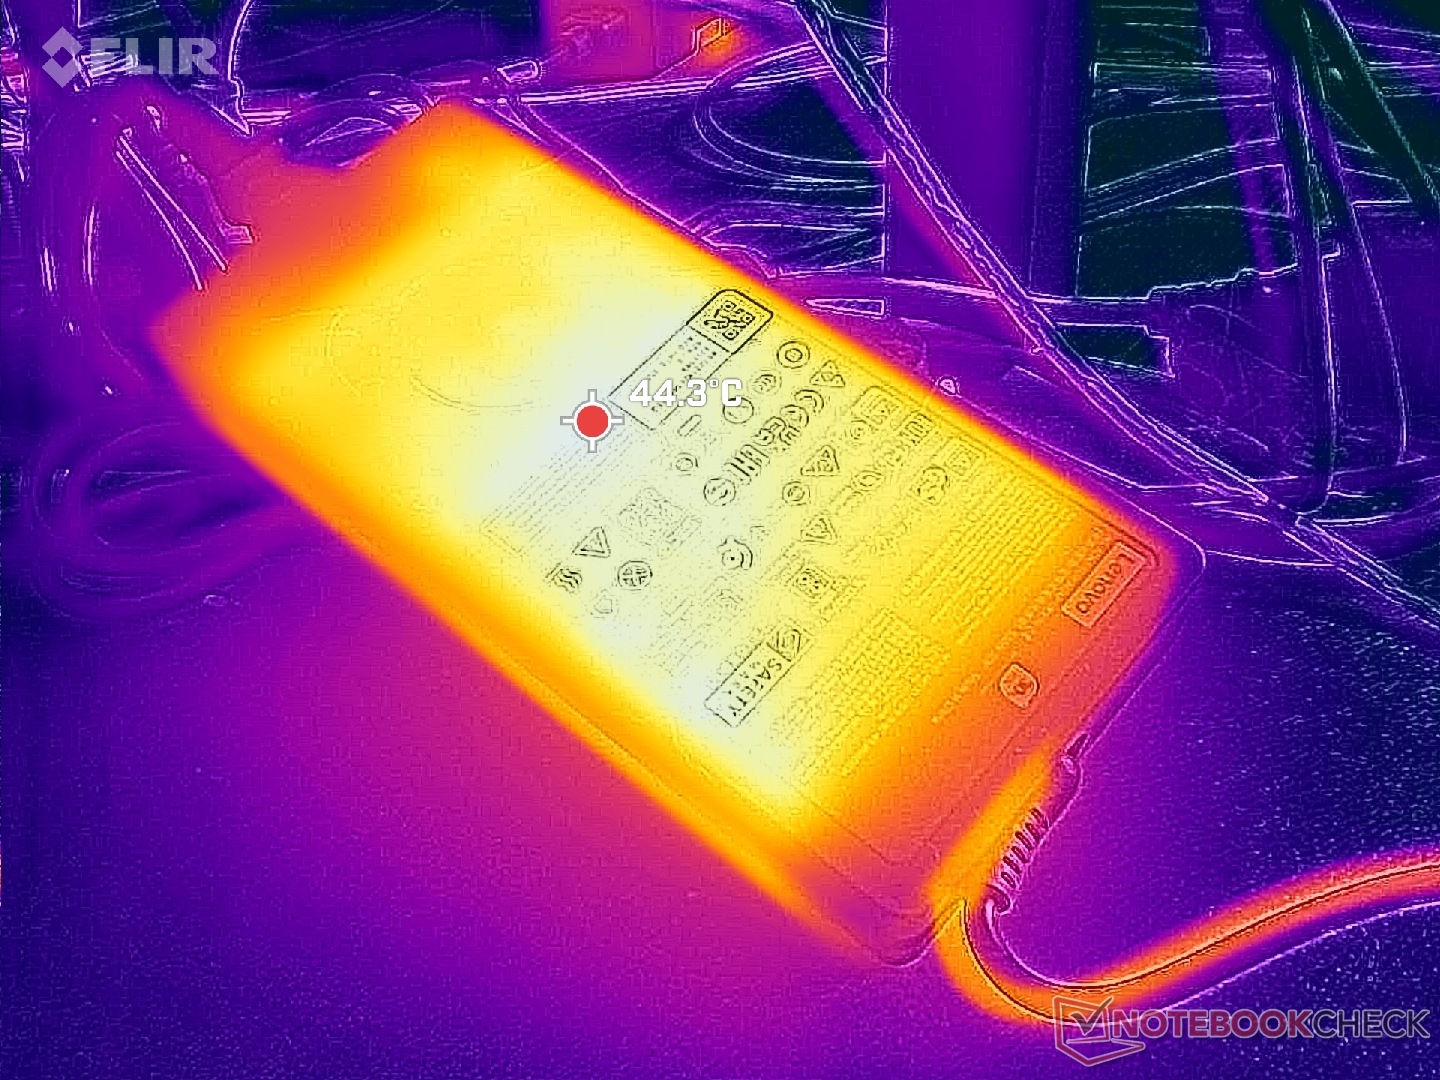
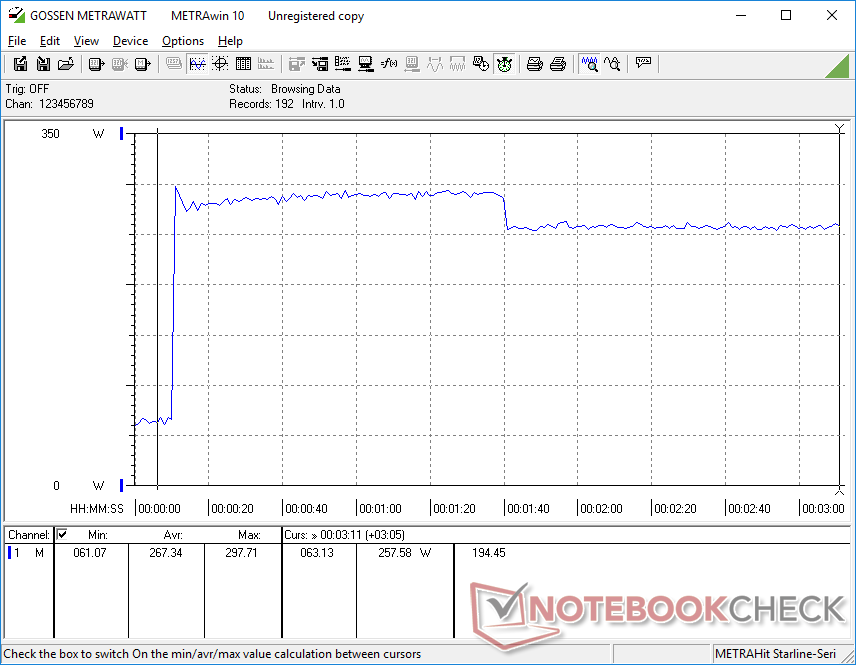
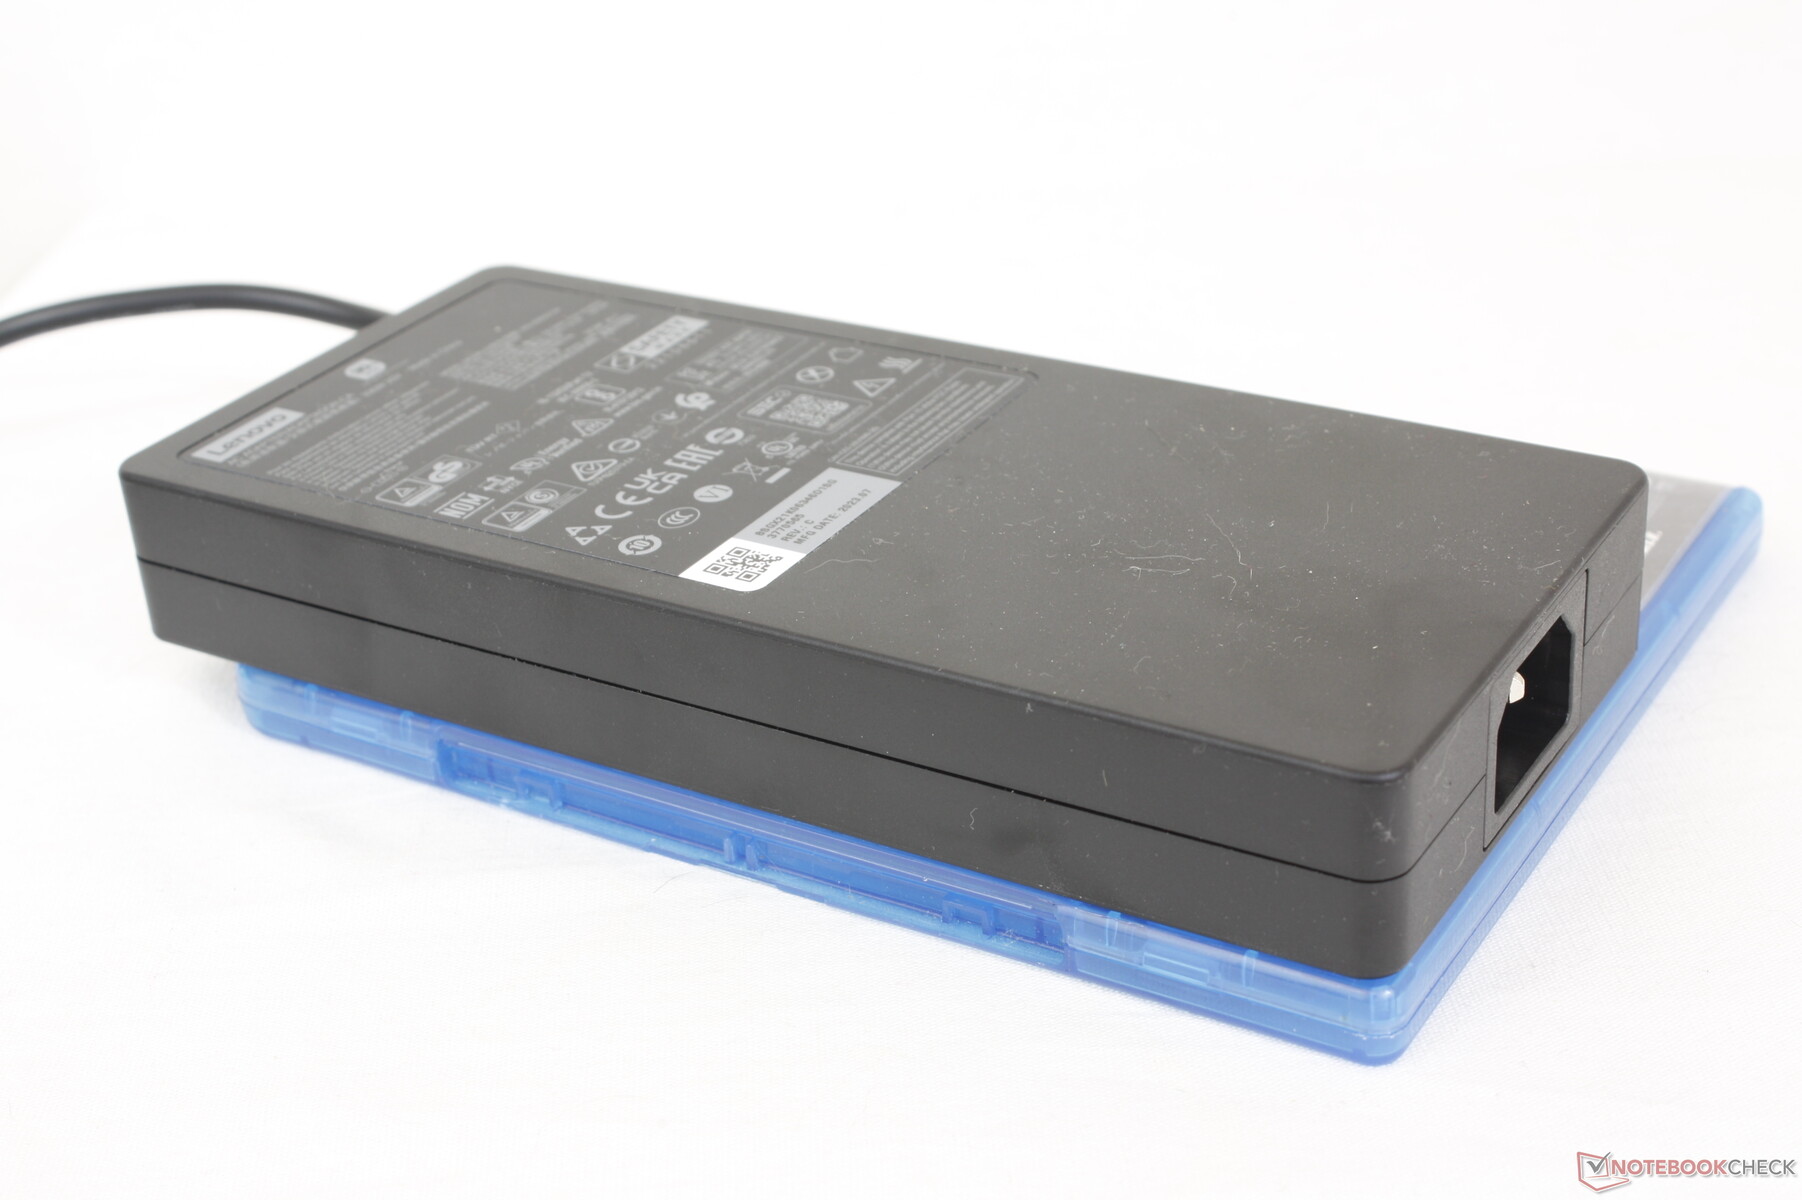
Vi kan mäta en maximal förbrukning på 298 W från den medelstora (18,5 x 2,6 x 8,3 cm) 330 W AC-adaptern när både CPU och GPU är 100 procent utnyttjade. Denna hastighet är endast tillfällig på grund av termiska begränsningar.
| Av/Standby | |
| Låg belastning | |
| Hög belastning |
|
Förklaring:
min: | |
| Lenovo Legion 9 16IRX8 i9-13980HX, GeForce RTX 4090 Laptop GPU, 2x SK Hynix HFS001TEJ9X115N (RAID 0), Mini-LED, 3200x2000, 16" | Lenovo Legion Slim 5 16APH8 R7 7840HS, GeForce RTX 4060 Laptop GPU, SK hynix PC801 HFS512GEJ9X115N, IPS, 2560x1600, 16" | Razer Blade 16 Early 2023 RTX 4090 i9-13950HX, GeForce RTX 4090 Laptop GPU, SSSTC CA6-8D1024, mini-LED, 3840x2400, 16" | Asus ROG Strix G16 G614JZ i9-13980HX, GeForce RTX 4080 Laptop GPU, WD PC SN560 SDDPNQE-1T00, IPS, 2560x1600, 16" | HP Omen Transcend 16 i9-13900HX, GeForce RTX 4070 Laptop GPU, SK hynix PC801 HFS002TEJ9X101N, Mini-LED, 2560x1600, 16" | Alienware x16 R1 i9-13900HK, GeForce RTX 4080 Laptop GPU, SK hynix PC801 HFS001TEJ9X101N, IPS, 2560x1600, 16" | |
|---|---|---|---|---|---|---|
| Power Consumption | 53% | 9% | 28% | 18% | 12% | |
| Idle Minimum * (Watt) | 32.3 | 9.4 71% | 27.5 15% | 10 69% | 19.2 41% | 25.2 22% |
| Idle Average * (Watt) | 42.6 | 15.5 64% | 34.4 19% | 16 62% | 22.7 47% | 29.9 30% |
| Idle Maximum * (Watt) | 57.9 | 24.4 58% | 35.4 39% | 27 53% | 55.4 4% | 49.8 14% |
| Load Average * (Watt) | 121 | 74.1 39% | 147.8 -22% | 129 -7% | 128.4 -6% | 105.4 13% |
| Witcher 3 ultra * (Watt) | 254 | 112.9 56% | 256 -1% | 247 3% | 206 19% | 263 -4% |
| Load Maximum * (Watt) | 297.7 | 206.5 31% | 286.7 4% | 342 -15% | 292 2% | 313.8 -5% |
* ... mindre är bättre
Power Consumption Witcher 3 / Stresstest
Power Consumption external Monitor
Batteritid
Körtiderna är dåliga vilket korrelerar med våra höga strömförbrukningssiffror ovan. Vi kan bara surfa på webben i 160 minuter även när vi är inställda på balanserat iGPU-läge. Andra bärbara mini-LED-datorer, som HP Omen Transcend 16skulle också uppvisa mycket korta drifttider trots sina stora 90+ Wh-batteripaket.
Laddningen är åtminstone mycket snabb, ungefär en timme när Lenovo Rapid Charge är aktiverat, jämfört med 90 minuter eller längre på de flesta andra bärbara speldatorer. USB-C-adaptrar från tredje part kan också ladda systemet, om än långsammare och med icke garanterad kompatibilitet.
| Lenovo Legion 9 16IRX8 i9-13980HX, GeForce RTX 4090 Laptop GPU, 99.9 Wh | Lenovo Legion Slim 5 16APH8 R7 7840HS, GeForce RTX 4060 Laptop GPU, 80 Wh | Razer Blade 16 Early 2023 RTX 4090 i9-13950HX, GeForce RTX 4090 Laptop GPU, 95.2 Wh | Asus ROG Strix G16 G614JZ i9-13980HX, GeForce RTX 4080 Laptop GPU, 90 Wh | HP Omen Transcend 16 i9-13900HX, GeForce RTX 4070 Laptop GPU, 97 Wh | Alienware x16 R1 i9-13900HK, GeForce RTX 4080 Laptop GPU, 90 Wh | |
|---|---|---|---|---|---|---|
| Batteridrifttid | 86% | 78% | 135% | 23% | -9% | |
| Reader / Idle (h) | 6.7 | 11.7 75% | 6.3 -6% | 7.3 9% | ||
| WiFi v1.3 (h) | 2.7 | 7.1 163% | 5.8 115% | 9.7 259% | 4.2 56% | 2.5 -7% |
| Load (h) | 1 | 1.2 20% | 1.4 40% | 1.1 10% | 1.2 20% | 0.7 -30% |
| H.264 (h) | 8.4 | |||||
| Witcher 3 ultra (h) | 1.6 |
För
Emot
Dom - Den bästa Legion som kan köpas för pengar
Om du är ute efter en Core i9-processor, RTX 4090 GPU och mini-LED-skärm är Legion 9i 16 absolut värt att överväga. Jämfört med andra bärbara mini-LED gaming-datorer som HP Omen Transcend 16, Razer Blade 16eller Asus Zephyrus M16erbjuder Lenovo snabbare grafik än HP, lägre priser än Razer och en högre inbyggd upplösning än Asus. Både specifikationerna och den fysiska designen är ett rejält steg upp från den redan utmärkta Legion Pro 7-serien.
Alla uppgraderingar har naturligtvis lett till ett större och tyngre chassi. Om du vill ha CPU- och skärmfunktionerna från Lenovo men i en mer portabel formfaktor, kan den dyrare Blade 16 vara värt det. Den integrerade vätskekylningen låter intressant på papper, men det verkar inte ha gjort för en lättare, tystare eller till och med svalare design. Förvänta dig att Lenovo kör lika högt som de flesta andra bärbara speldatorer i samma storlekskategori.
Legion 9i 16 har alla de snygga specifikationerna och ett nytt utseende som entusiaster kan uppskatta så länge du kan förbise den korta batteritiden och det relativt stora chassit.
Du måste verkligen vilja ha mini-LED om du vill ha Legion 9 16 eftersom den inte erbjuder några andra skärmalternativ på gott och ont. Mini-LED är som bäst när HDR är aktiverat för att utnyttja den maximala ljusstyrkan på 1000 nit. Annars är panelen mycket krävande för batteriet och har inga andra stora fördelar jämfört med billigare paneler som IPS eller OLED.
Pris och tillgänglighet
Lenovo levererar nu sin Legion 9i Gen 8-modell från 3420 USD om den är konfigurerad med GeForce RTX 4080 upp till 4000 USD om den är fullt konfigurerad med RTX 4090 och ytterligare lagringsutrymme.
Lenovo Legion 9 16IRX8
- 10/15/2023 v7 (old)
Allen Ngo
Genomskinlighet
Valet av enheter som ska granskas görs av vår redaktion. Testprovet gavs till författaren som ett lån av tillverkaren eller återförsäljaren för denna recension. Långivaren hade inget inflytande på denna recension och inte heller fick tillverkaren en kopia av denna recension innan publiceringen. Det fanns ingen skyldighet att publicera denna recension. Som ett oberoende medieföretag är Notebookcheck inte föremål för auktoritet från tillverkare, återförsäljare eller förlag.
This is how Notebookcheck is testingEvery year, Notebookcheck independently reviews hundreds of laptops and smartphones using standardized procedures to ensure that all results are comparable. We have continuously developed our test methods for around 20 years and set industry standards in the process. In our test labs, high-quality measuring equipment is utilized by experienced technicians and editors. These tests involve a multi-stage validation process. Our complex rating system is based on hundreds of well-founded measurements and benchmarks, which maintains objectivity.
Price comparison

