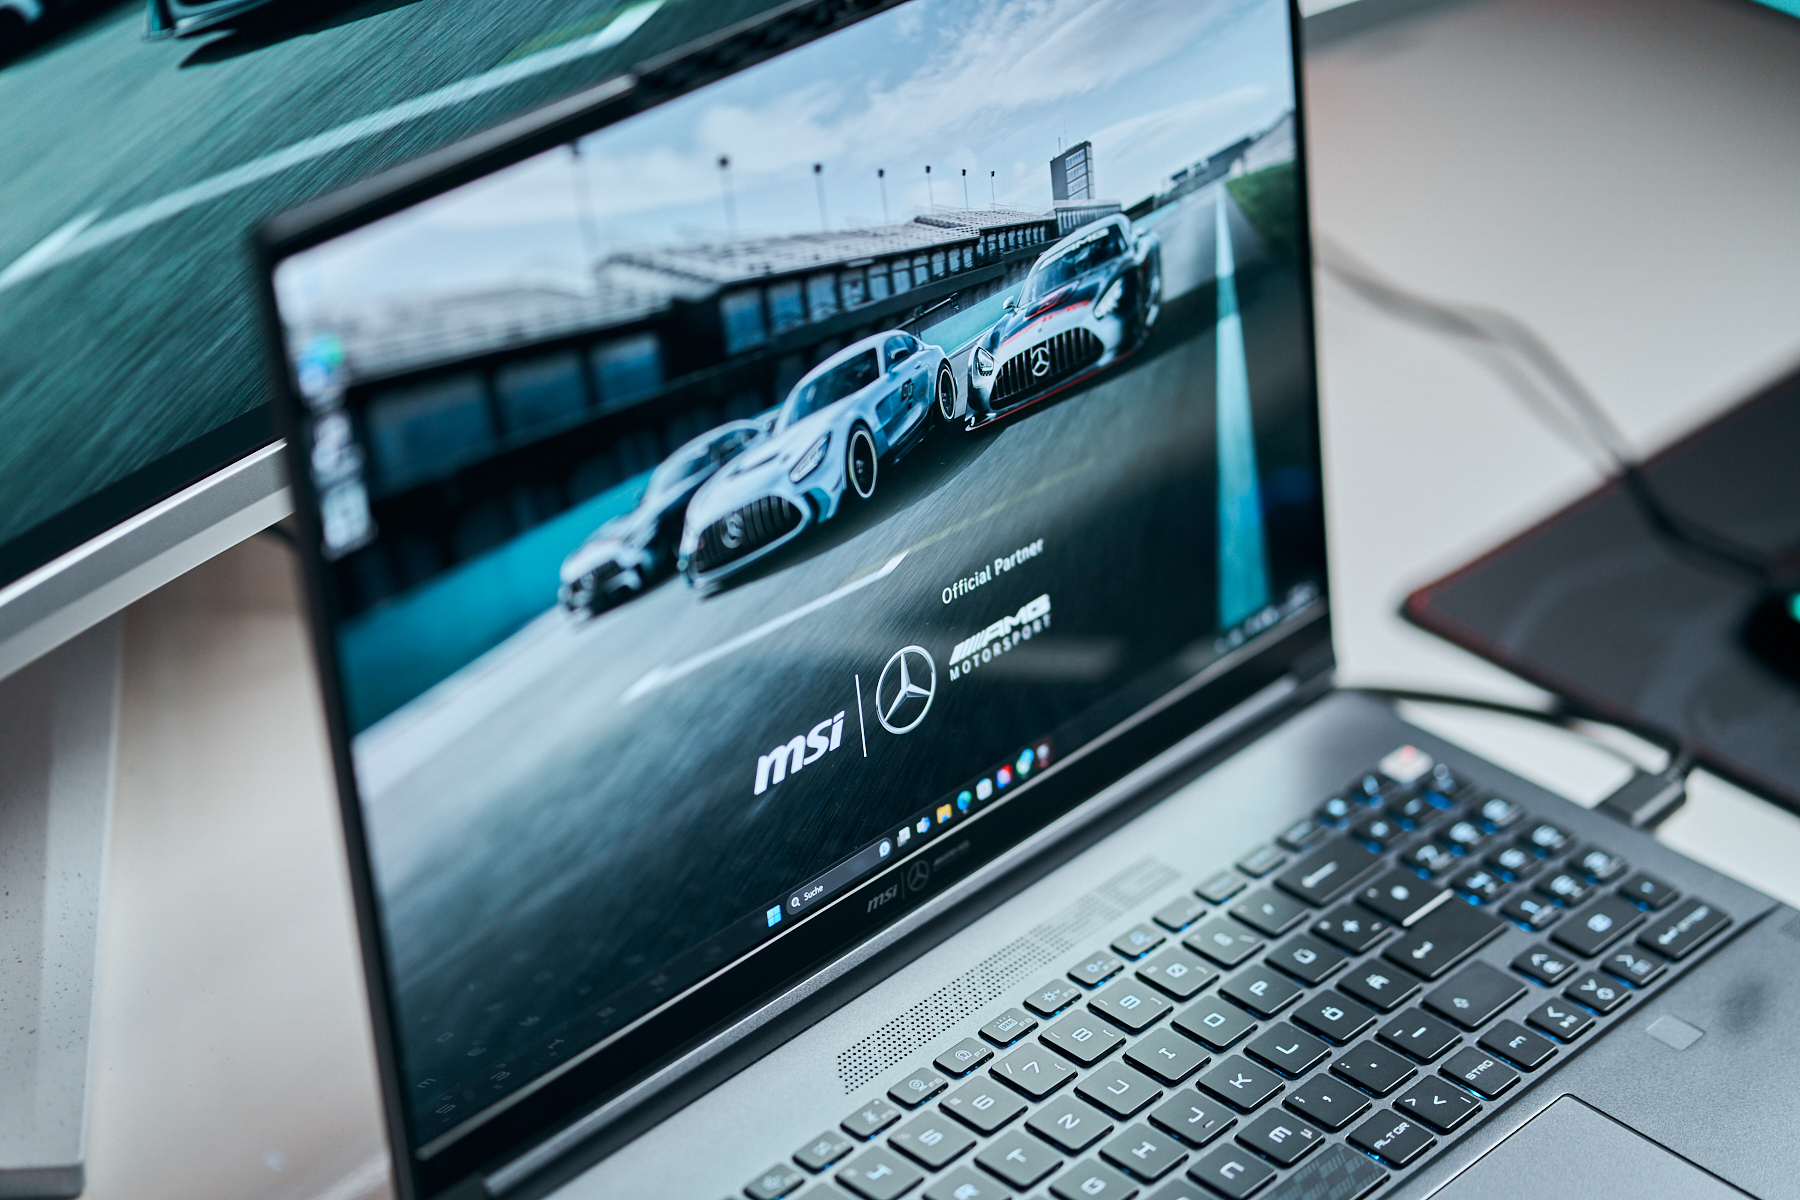
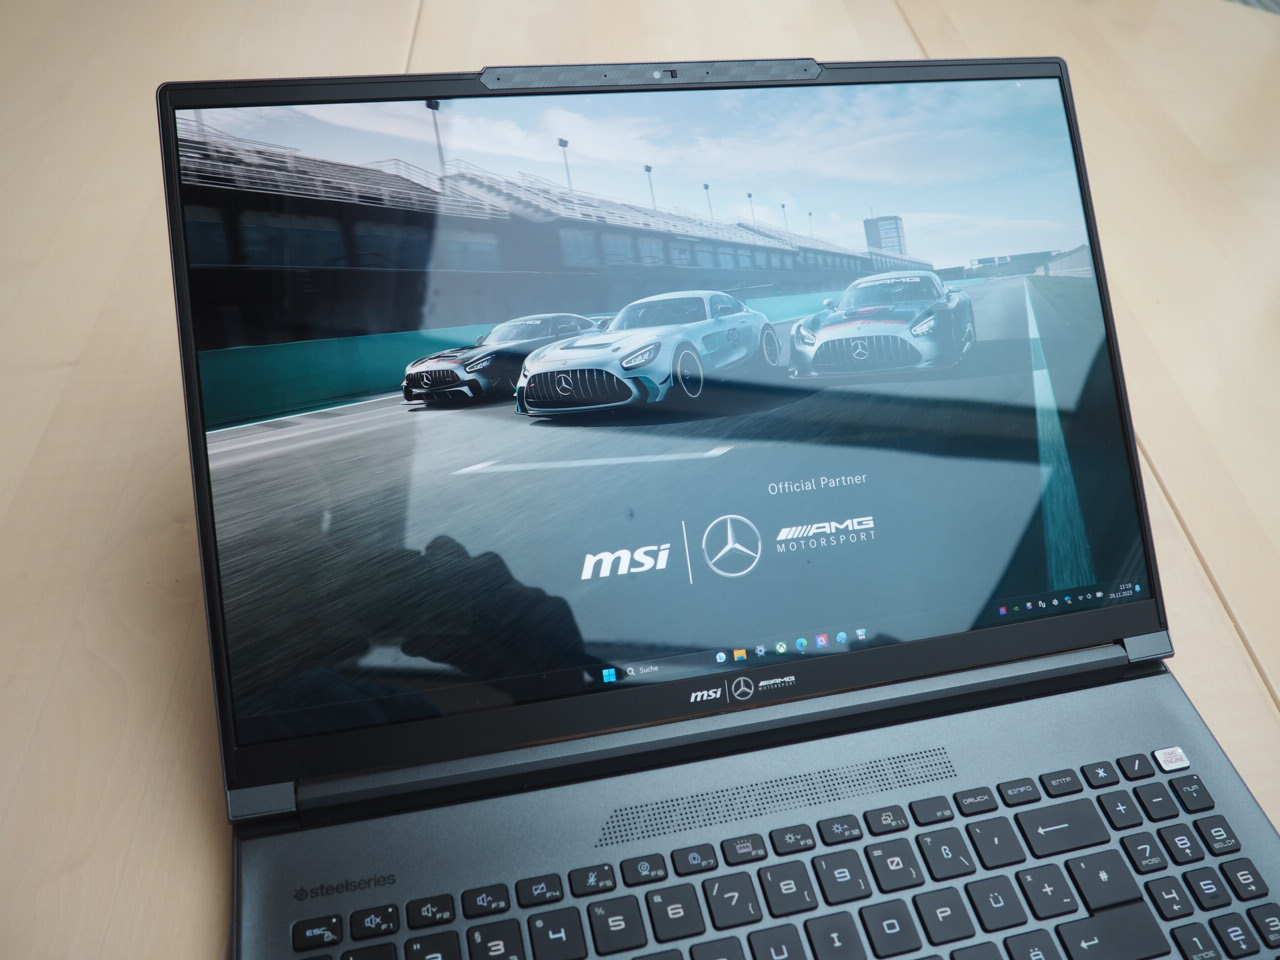
MSI Stealth 16 Mercedes-AMG Motorsport bärbar dator i recension: Mobil racerbil med OLED-skärm

Medan den "vanliga" Stealth 16 har en Core i7-13700Hgår Mercedes-AMG Motorsport-modellen upp i nivå med den något snabbare Core i9-13900H. I stället för den matta QHD+ IPS-panelen med 240 Hz har Motorsport Edition en blank UHD+ OLED-skärm med en uppdateringsfrekvens på 60 Hz. Grafikkortet (RTX 4070), RAM-minne (2x 16 GB DDR5) och SSD-kapacitet (2 TB) är identiska med toppmodellen. Eftersom höljet, inmatningsenheterna och anslutningarna är desamma, med endast ett fåtal optiska detaljer som skiljer dem åt, kommer vi inte att återkomma till specifika kategorier i den här artikeln. Du kan hänvisa till relevant information i recensionen av Stealth 16 Studio. Motorsport Edition kostar för närvarande 2 899 USD, en anmärkningsvärd investering för en RTX 4070-notebook.
Konkurrenterna till Stealth 16 inkluderar andra 16-tums bärbara speldatorer med RTX 4070, som t.ex HP Omen Transcend 16, den Lenovo Legion Pro 5 16ARX8och Schenkers bärbara datorer XMG Pro 16 Studio och XMG Core 16. Dessa modeller är listade i tabellerna för jämförelse
Potentiella konkurrenter i jämförelse
Gradering | Datum | Modell | Vikt | Höjd | Storlek | Upplösning | Pris |
|---|---|---|---|---|---|---|---|
| 89.1 % v7 (old) | 11/2023 | MSI Stealth 16 Mercedes-AMG Motorsport A13VG i9-13900H, GeForce RTX 4070 Laptop GPU | 1.9 kg | 20 mm | 16.00" | 3840x2400 | |
| 88.8 % v7 (old) | 07/2023 | MSI Stealth 16 Studio A13VG i7-13700H, GeForce RTX 4070 Laptop GPU | 2 kg | 19.95 mm | 16.00" | 2560x1600 | |
| 87.9 % v7 (old) | 10/2023 | Schenker XMG Pro 16 Studio (Mid 23) i9-13900H, GeForce RTX 4070 Laptop GPU | 2.6 kg | 19.9 mm | 16.00" | 2560x1600 | |
| 87.9 % v7 (old) | 08/2023 | HP Omen Transcend 16 i9-13900HX, GeForce RTX 4070 Laptop GPU | 2.3 kg | 19.8 mm | 16.00" | 2560x1600 | |
| 88.4 % v7 (old) | 05/2023 | Lenovo Legion Pro 5 16ARX8 R7 7745HX, GeForce RTX 4070 Laptop GPU | 2.5 kg | 26.8 mm | 16.00" | 2560x1600 | |
| 89.2 % v7 (old) | 10/2023 | Schenker XMG CORE 16 (L23) R7 7840HS, GeForce RTX 4070 Laptop GPU | 2.4 kg | 26.1 mm | 16.00" | 2560x1600 |
Fall
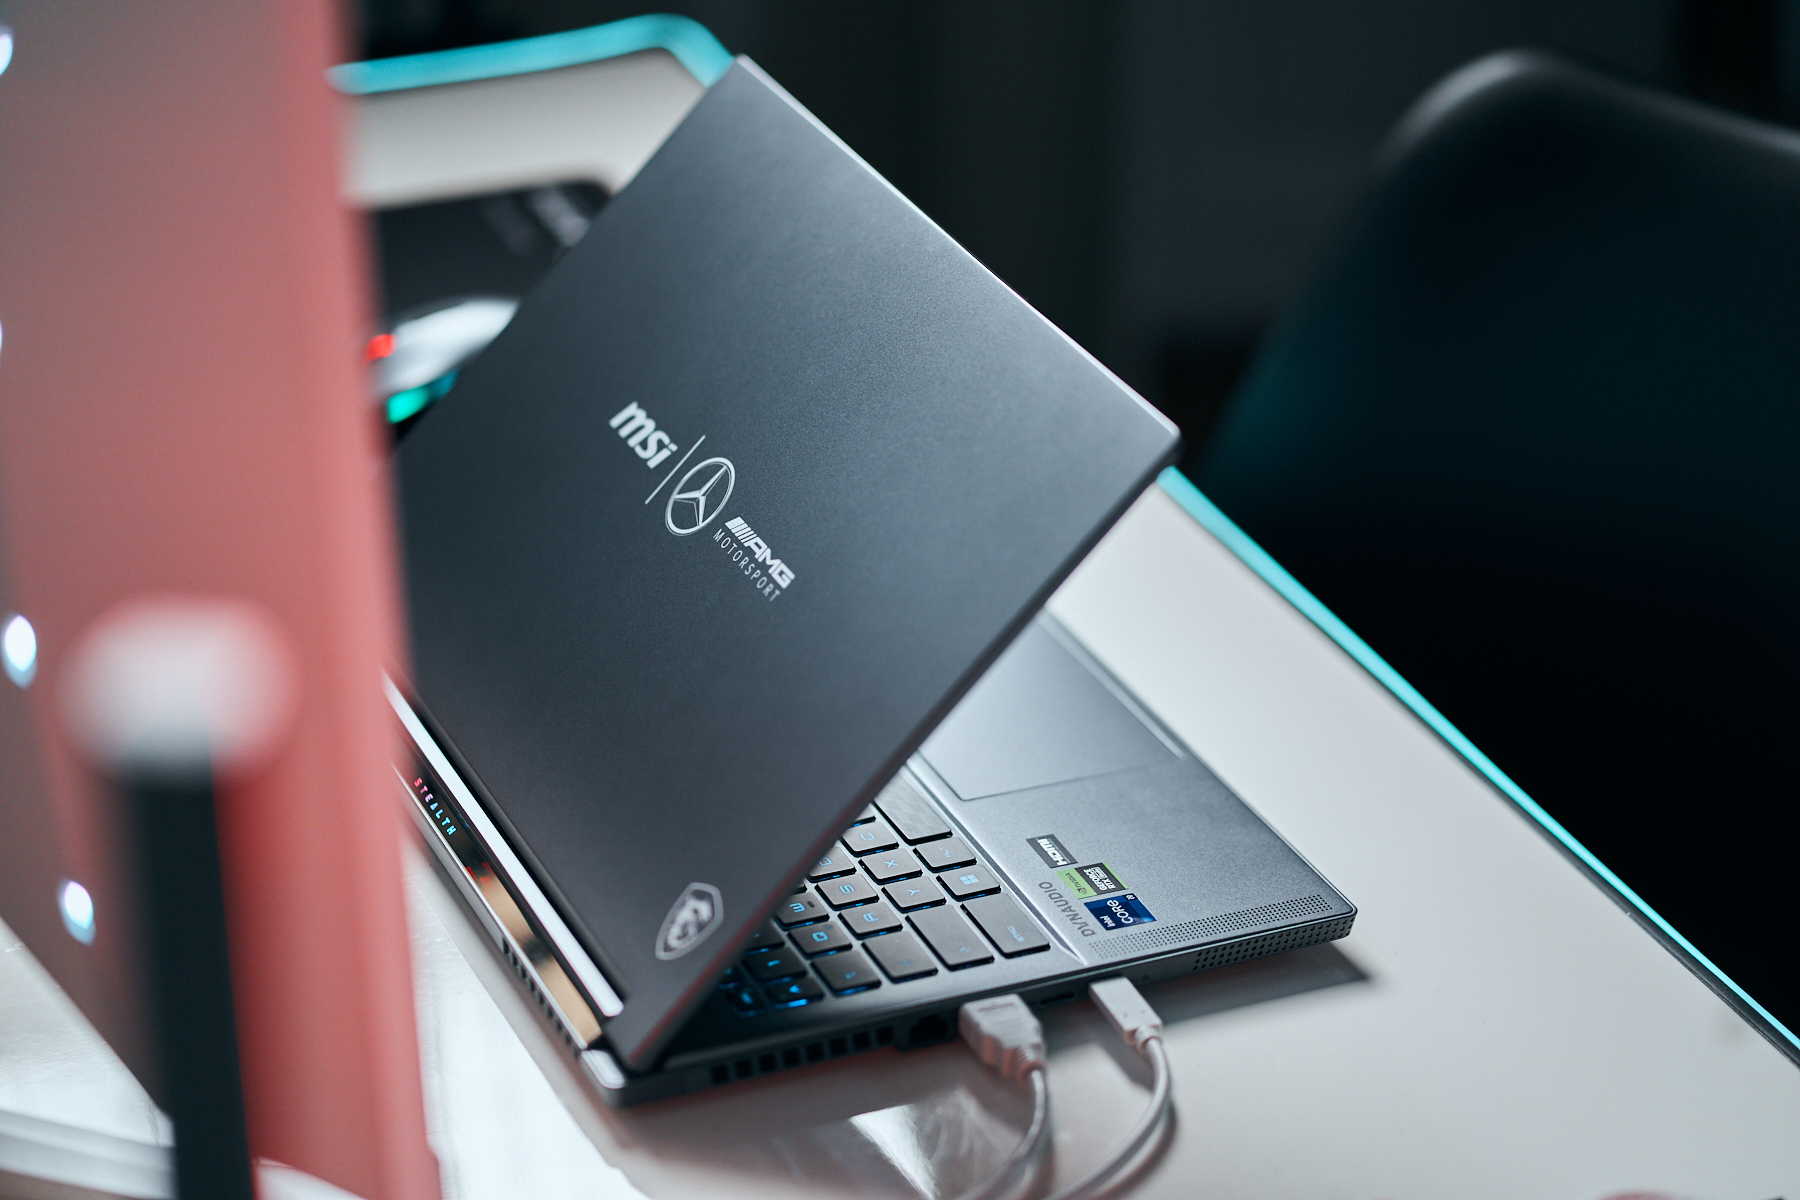
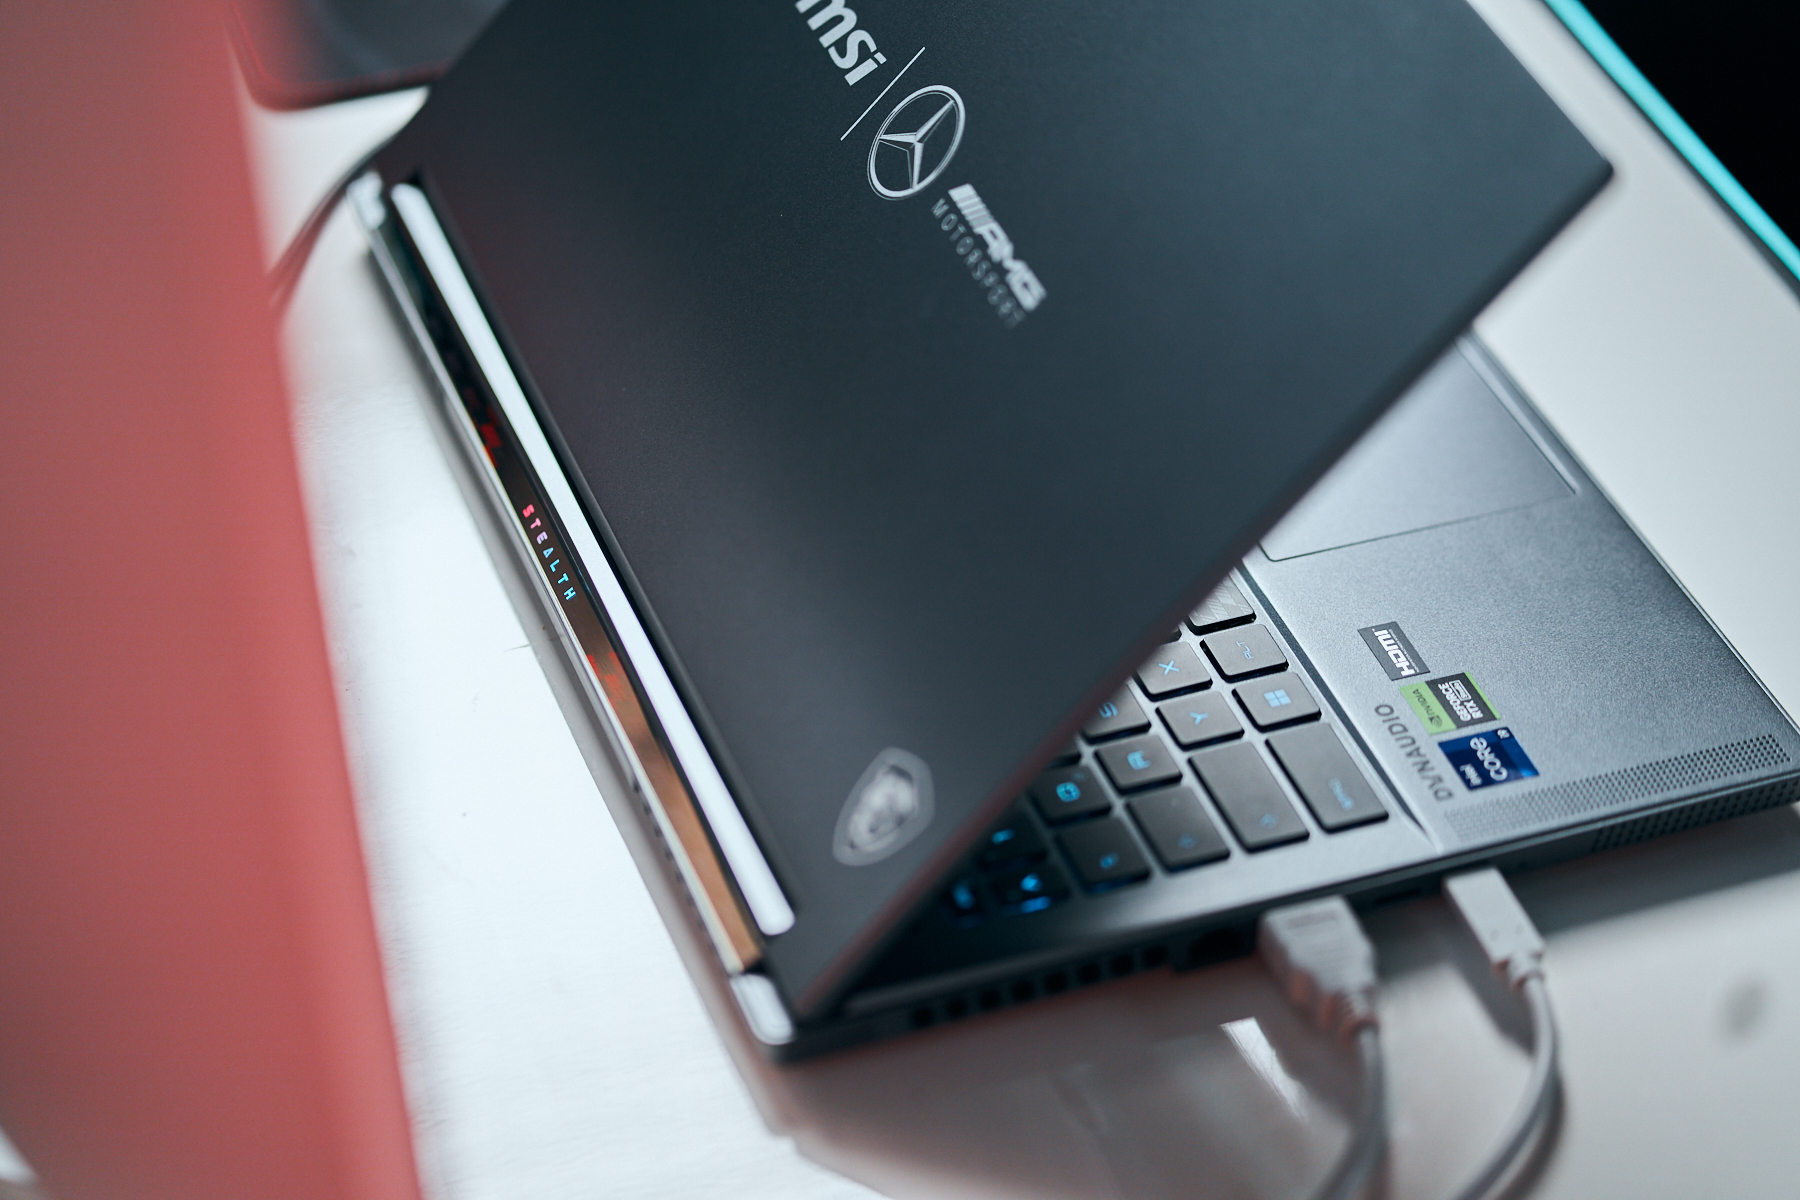
MSI har lagt ner mycket arbete på den visuella utformningen av specialutgåvan och har införlivat referenser till biltillverkaren i hela fodralet. Dessa inkluderar olika AMG-bokstäver (lock, front, displayram, ventilationsgaller, bas), samt andra designelement som påminner om motorsport. Exempel på detta är en flaggliknande design på webbkamerafältet, mellanslagstangenten och gummifötterna, tillsammans med en strömknapp med texten "Start Engine".


Anslutningsmöjligheter
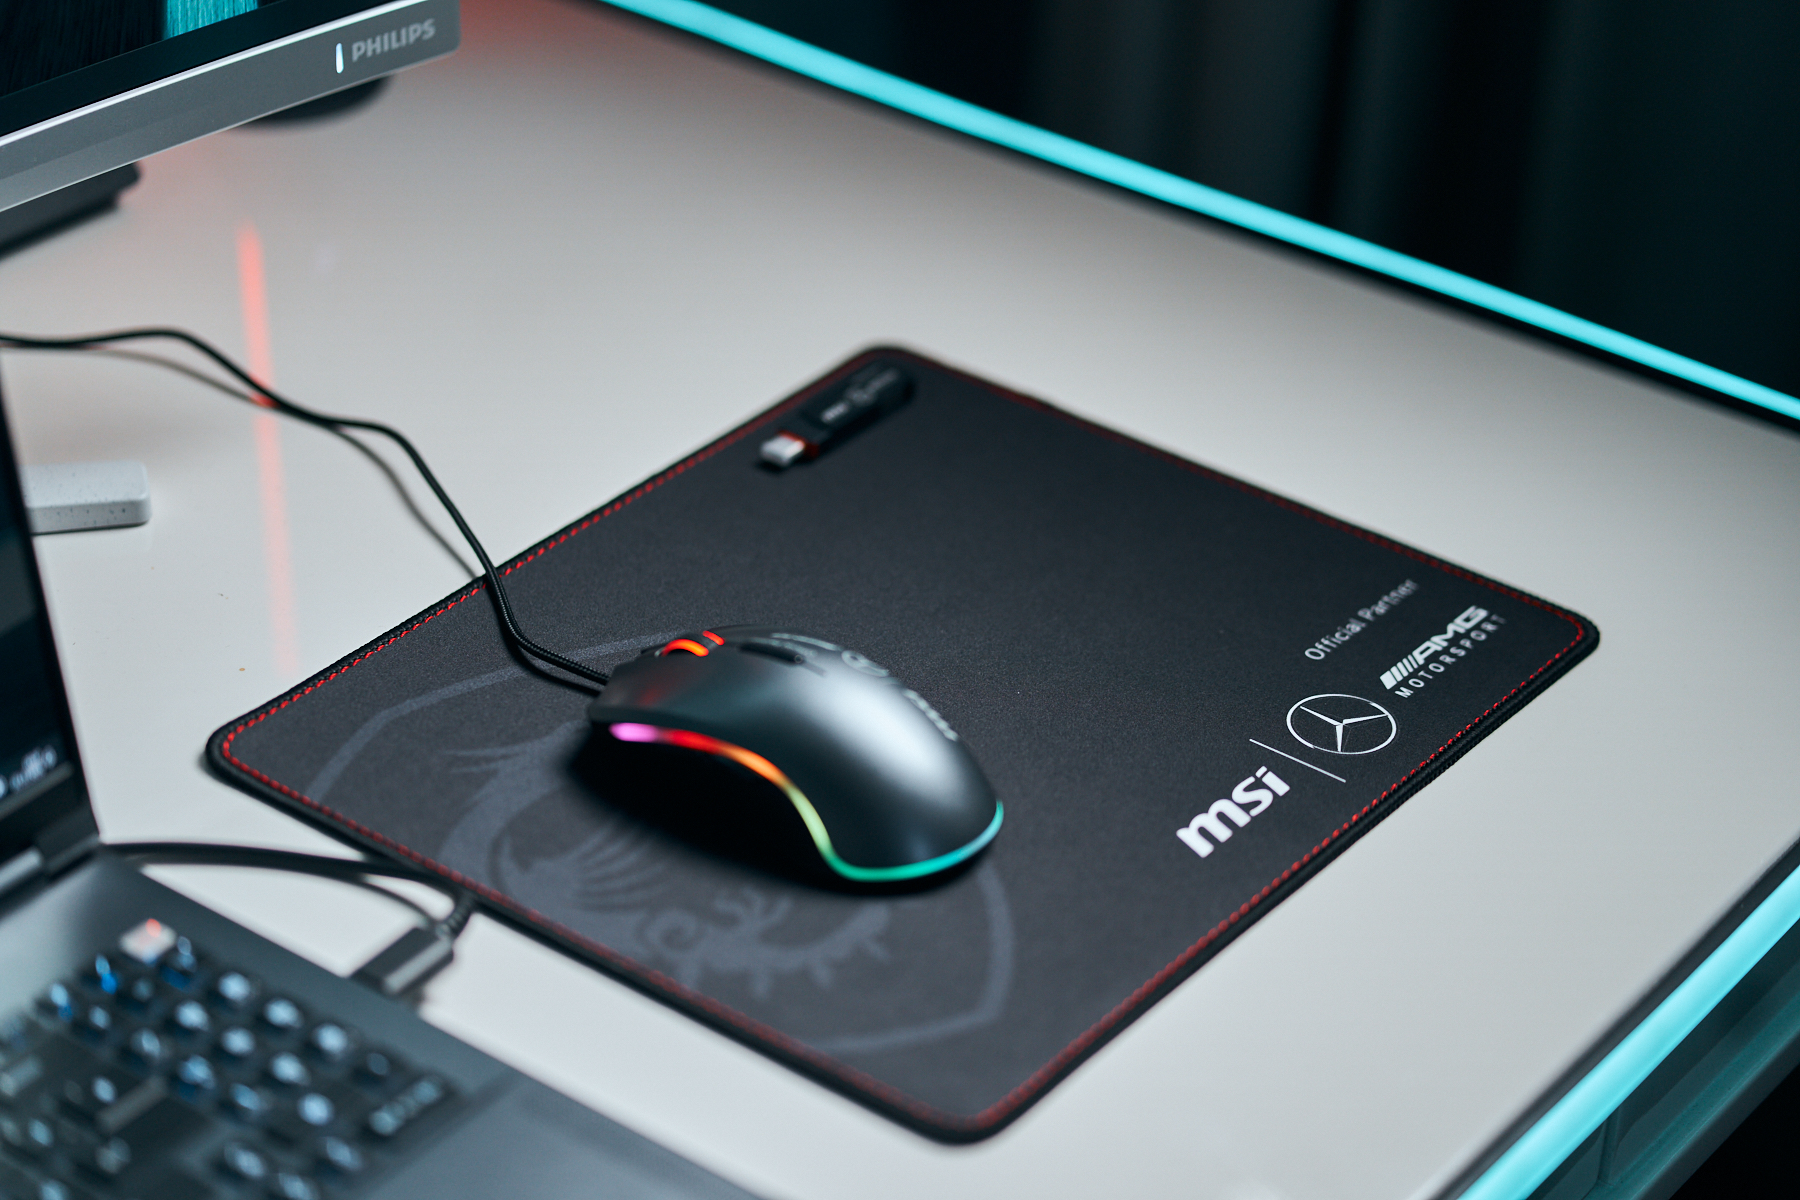
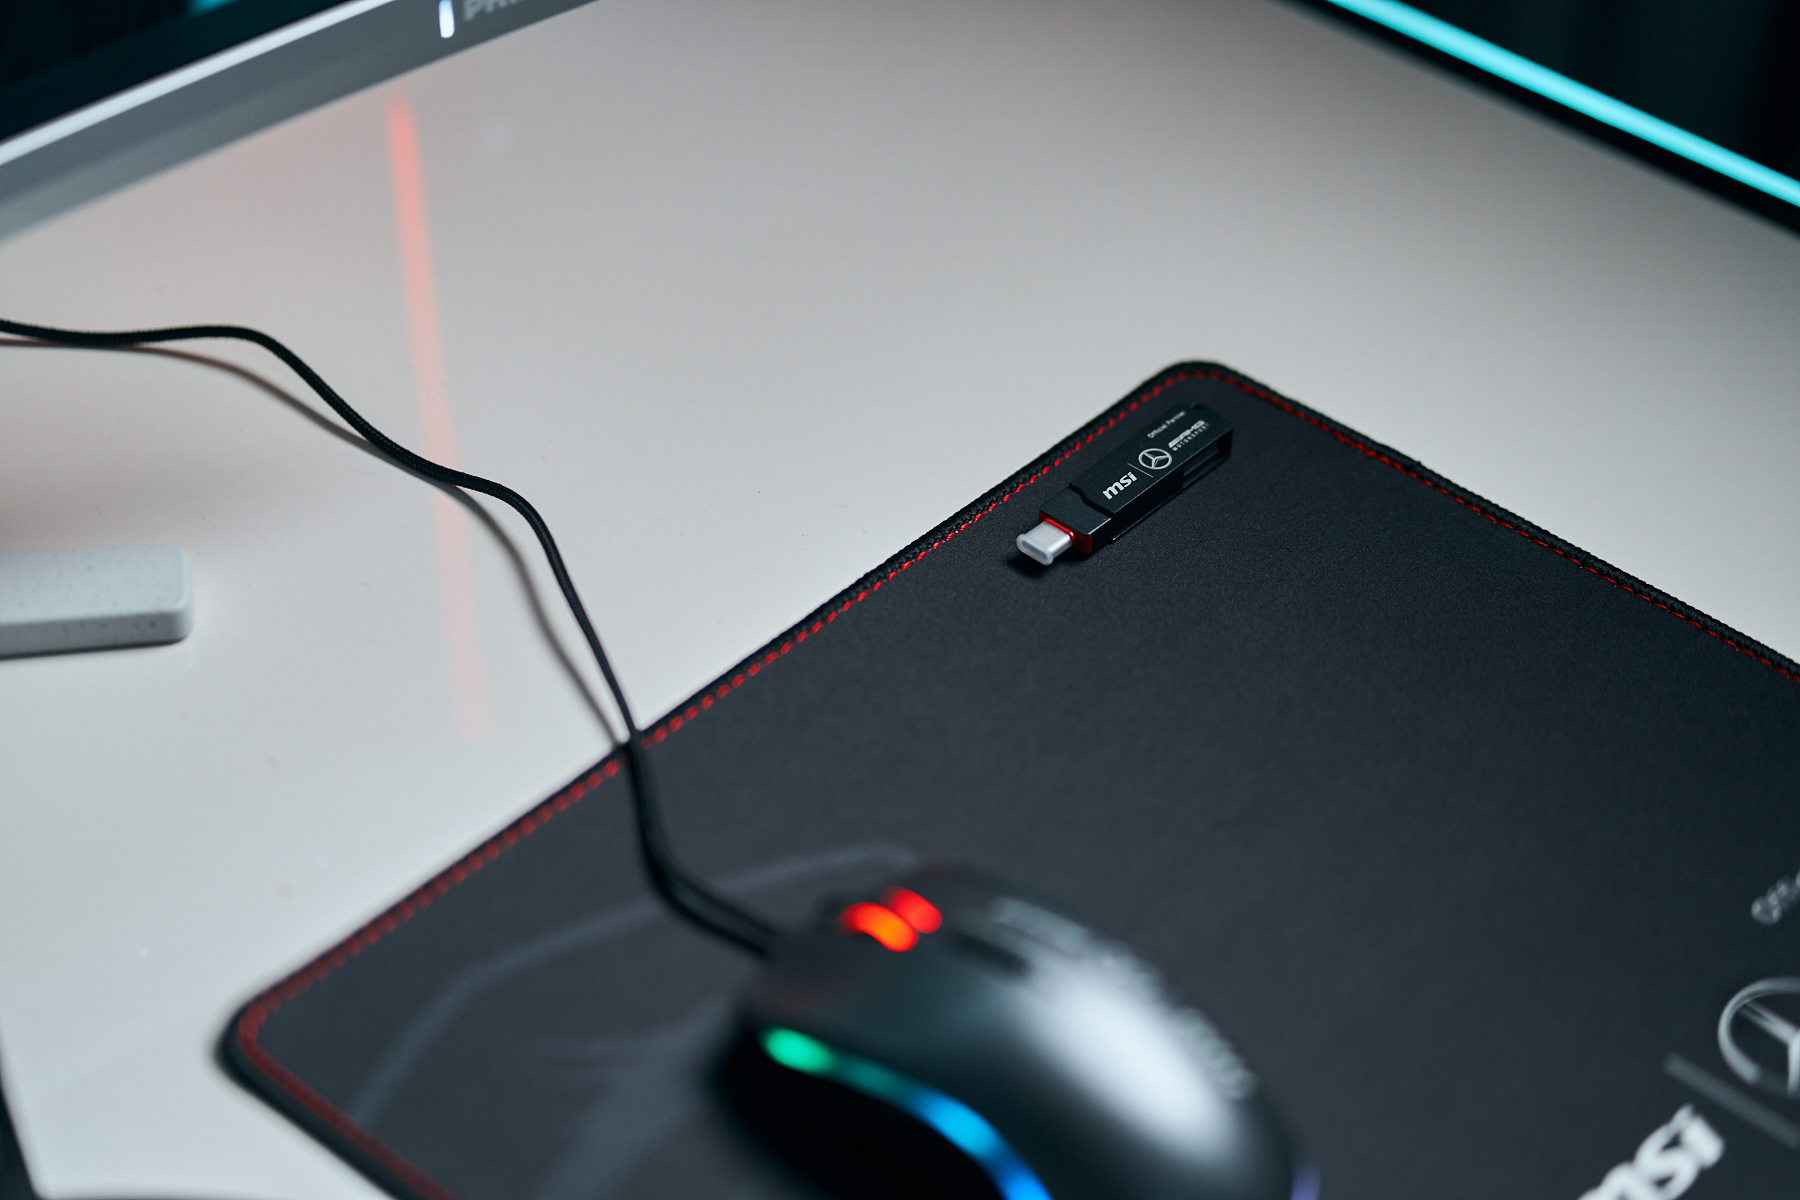
När det gäller utrustningen är den överdådiga leveransomfattningen särskilt anmärkningsvärd. Mercedes-versionen innehåller förutom notebooken och nätaggregatet på 240 watt även en mus, en musmatta, ett USB-minne och en tillbehörsväska.
SD-kortläsare
| SD Card Reader | |
| average JPG Copy Test (av. of 3 runs) | |
| MSI Stealth 16 Mercedes-AMG Motorsport A13VG (AV PRO microSD 128 GB V60) | |
| MSI Stealth 16 Studio A13VG | |
| Genomsnitt av klass Gaming (20.9 - 210, n=54, senaste 2 åren) | |
| Schenker XMG Pro 16 Studio (Mid 23) (AV PRO microSD 128 GB V60) | |
| Schenker XMG CORE 16 (L23) | |
| maximum AS SSD Seq Read Test (1GB) | |
| MSI Stealth 16 Mercedes-AMG Motorsport A13VG (AV PRO microSD 128 GB V60) | |
| MSI Stealth 16 Studio A13VG | |
| Genomsnitt av klass Gaming (25.5 - 261, n=51, senaste 2 åren) | |
| Schenker XMG Pro 16 Studio (Mid 23) (AV PRO microSD 128 GB V60) | |
| Schenker XMG CORE 16 (L23) | |
Kommunikation
Webbkamera


Display
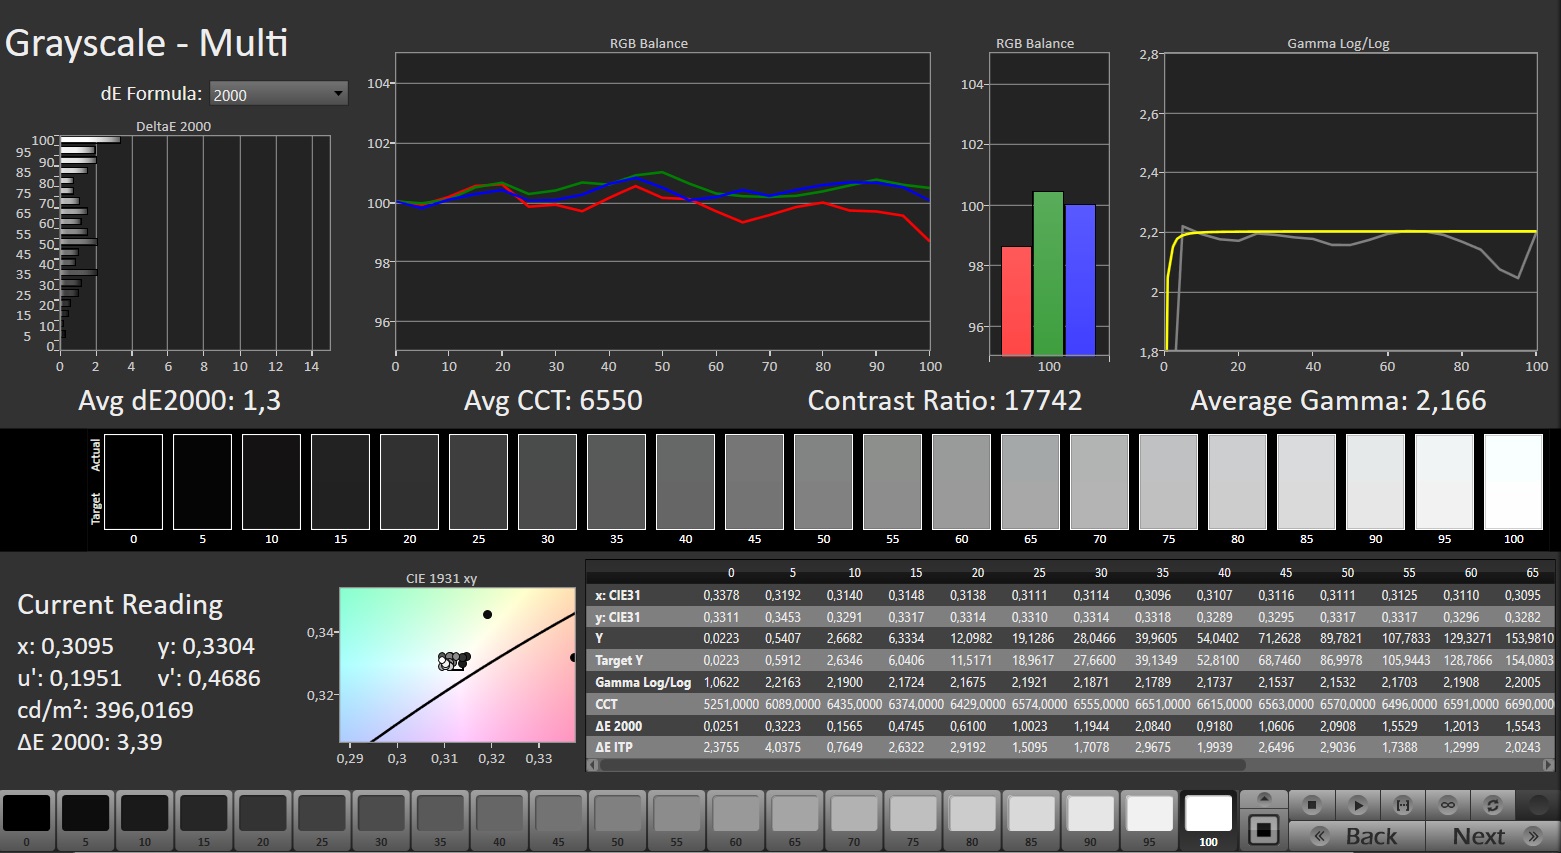
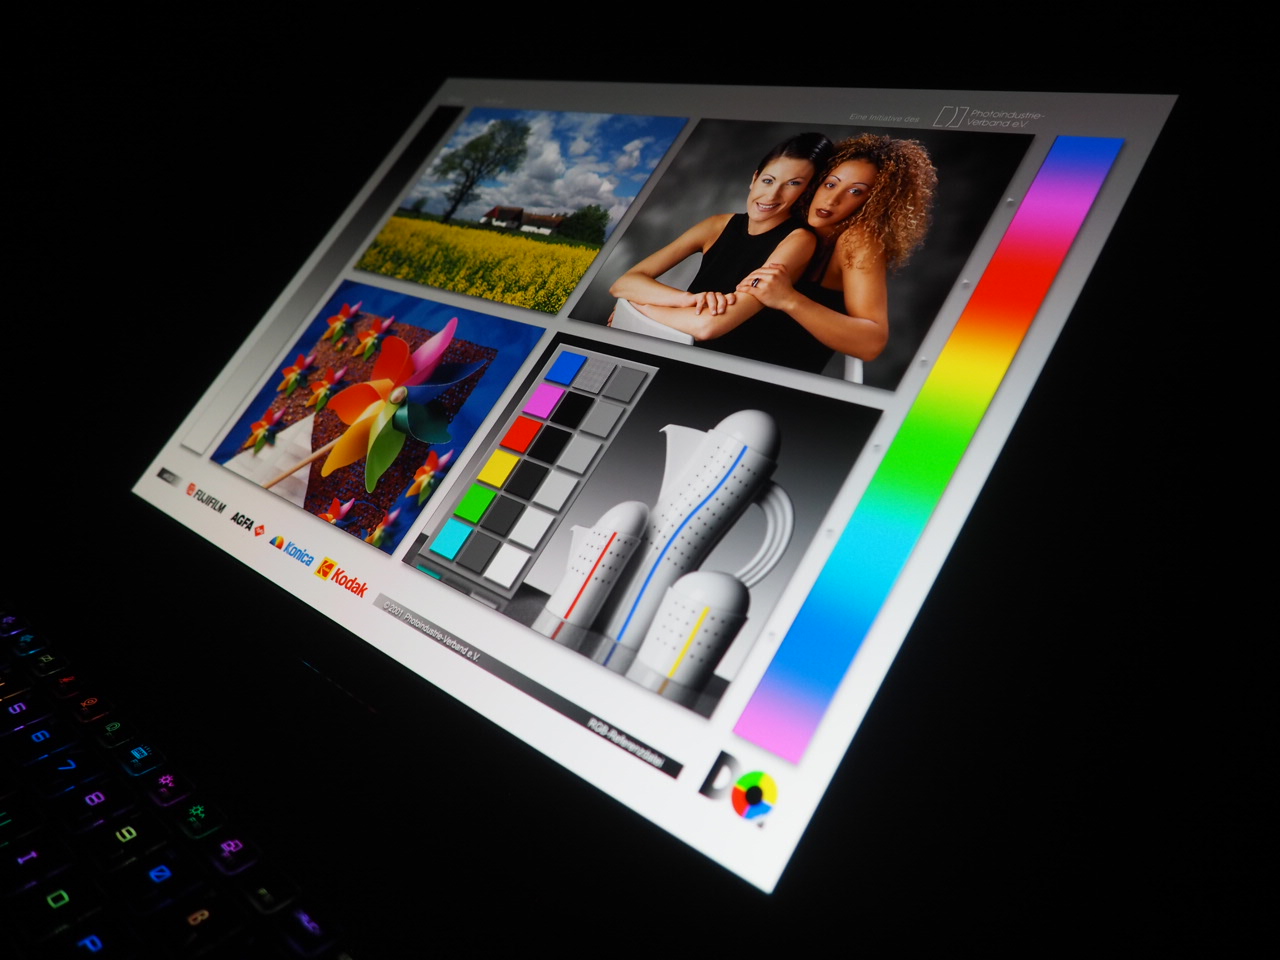
Som tidigare nämnts har specialutgåvan en OLED-panel som ger en extremt skarp bild tack vare den höga upplösningen på 3.840 x 2.400 pixlar i 16:10-format.
| |||||||||||||||||||||||||
Distribution av ljusstyrkan: 96 %
Mitt på batteriet: 382 cd/m²
Kontrast: ∞:1 (Svärta: 0 cd/m²)
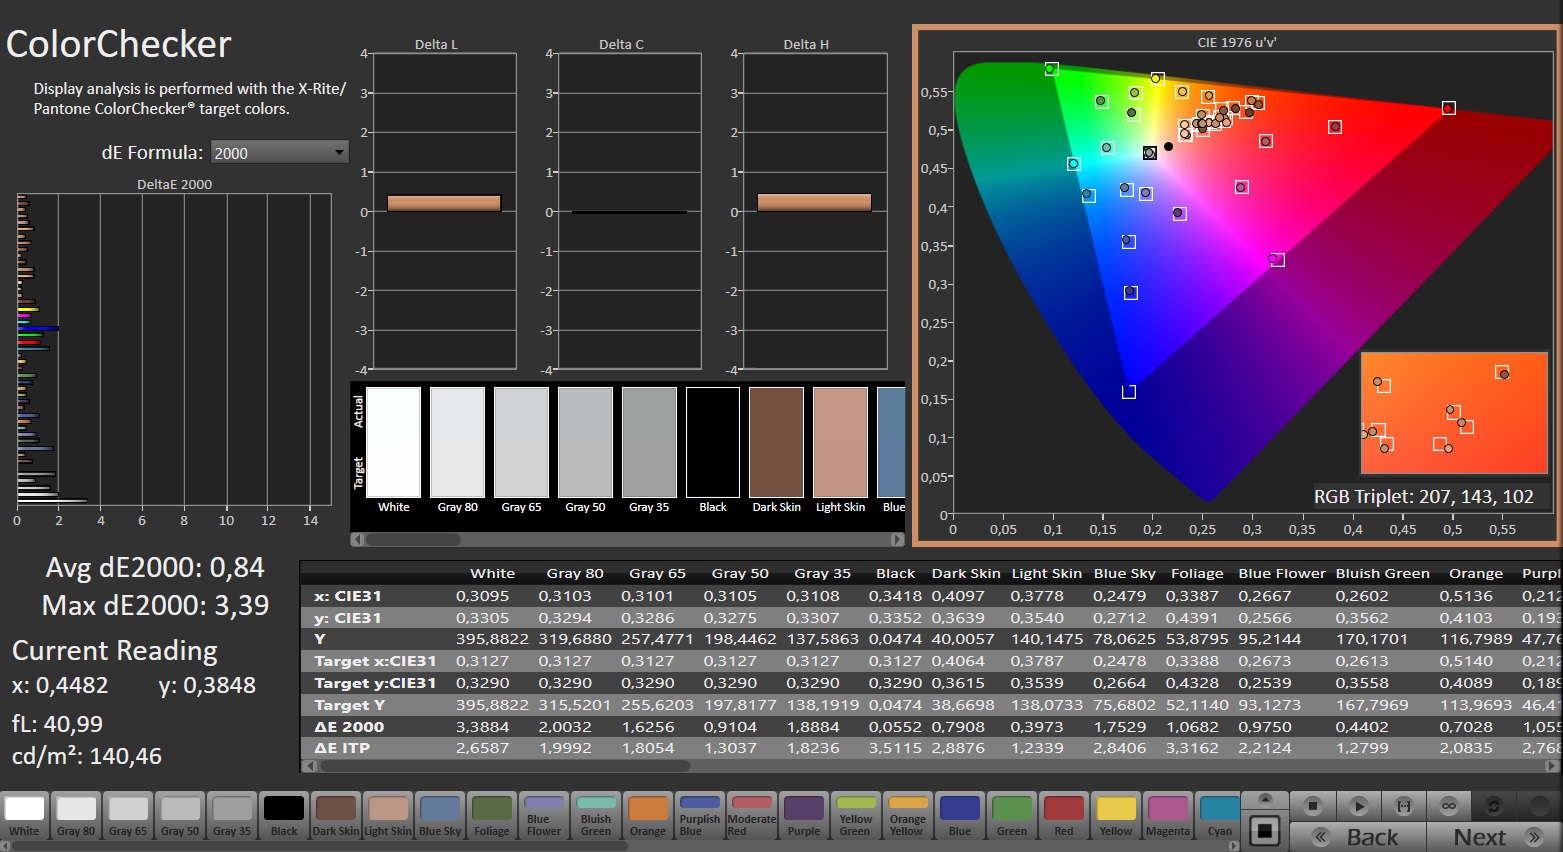
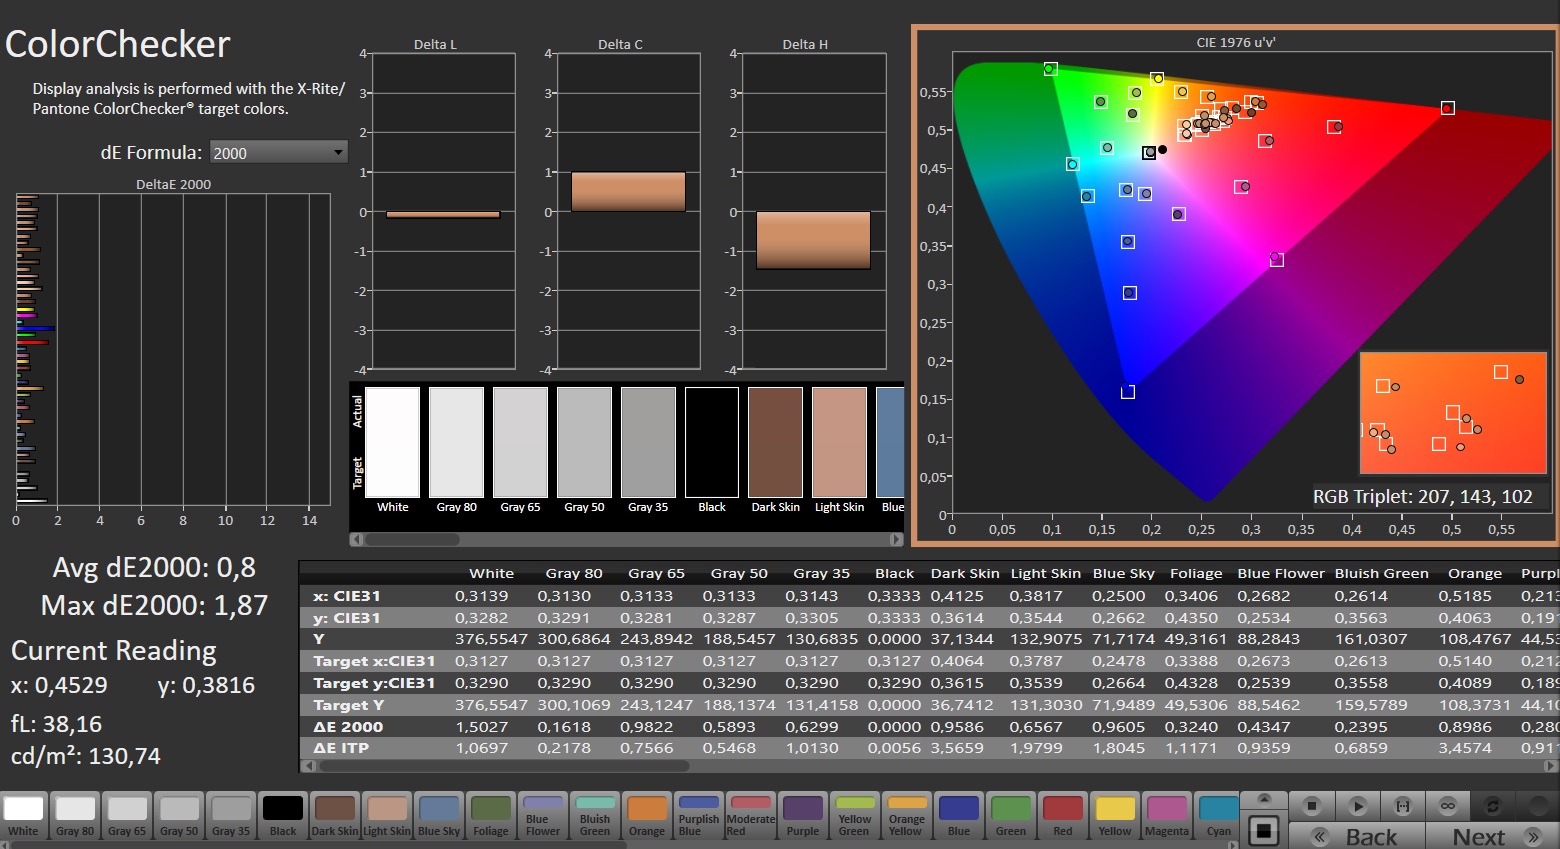
ΔE ColorChecker Calman: 0.84 | ∀{0.5-29.43 Ø4.71}
calibrated: 0.8
ΔE Greyscale Calman: 1.3 | ∀{0.09-98 Ø4.96}
88.4% AdobeRGB 1998 (Argyll 3D)
99.9% sRGB (Argyll 3D)
99.2% Display P3 (Argyll 3D)
Gamma: 2.166
CCT: 6550 K
| MSI Stealth 16 Mercedes-AMG Motorsport A13VG ATNA60YV09-0 (SDC4191), OLED, 3840x2400, 16" | MSI Stealth 16 Studio A13VG AUO26A9, IPS, 2560x1600, 16" | Schenker XMG Pro 16 Studio (Mid 23) BOE CQ NE160QDM-NZ1, IPS, 2560x1600, 16" | HP Omen Transcend 16 AUOA3A6, Mini-LED, 2560x1600, 16" | Lenovo Legion Pro 5 16ARX8 CSOT T3 MNG007DA1-Q, IPS, 2560x1600, 16" | Schenker XMG CORE 16 (L23) BOE0AF0 (), IPS, 2560x1600, 16" | |
|---|---|---|---|---|---|---|
| Display | -2% | -18% | -0% | -16% | -18% | |
| Display P3 Coverage (%) | 99.2 | 96.4 -3% | 69.4 -30% | 99.2 0% | 70.4 -29% | 68.3 -31% |
| sRGB Coverage (%) | 99.9 | 99.7 0% | 98.2 -2% | 100 0% | 99.6 0% | 98.6 -1% |
| AdobeRGB 1998 Coverage (%) | 88.4 | 84.8 -4% | 70.1 -21% | 87.6 -1% | 72.6 -18% | 69.6 -21% |
| Response Times | -280% | -628% | -1955% | -513% | -615% | |
| Response Time Grey 50% / Grey 80% * (ms) | 1.5 ? | 4.4 ? -193% | 12.2 ? -713% | 26.4 ? -1660% | 7 ? -367% | 13.2 ? -780% |
| Response Time Black / White * (ms) | 1.2 ? | 5.6 ? -367% | 7.7 ? -542% | 28.2 ? -2250% | 9.1 ? -658% | 6.6 ? -450% |
| PWM Frequency (Hz) | 60 ? | 3506 ? | ||||
| Screen | -127% | -74% | -120% | 2% | -75% | |
| Brightness middle (cd/m²) | 382 | 424 11% | 349 -9% | 791.1 107% | 355.3 -7% | 376 -2% |
| Brightness (cd/m²) | 383 | 411 7% | 348 -9% | 800 109% | 340 -11% | 358 -7% |
| Brightness Distribution (%) | 96 | 88 -8% | 93 -3% | 95 -1% | 91 -5% | 88 -8% |
| Black Level * (cd/m²) | 0.37 | 0.32 | 0.04 | 0.32 | 0.33 | |
| Colorchecker dE 2000 * | 0.84 | 3.04 -262% | 1.98 -136% | 4.37 -420% | 1.13 -35% | 2.74 -226% |
| Colorchecker dE 2000 max. * | 3.39 | 7.5 -121% | 7.56 -123% | 10.39 -206% | 2.78 18% | 6.78 -100% |
| Colorchecker dE 2000 calibrated * | 0.8 | 3.04 -280% | 1.45 -81% | 1.04 -30% | 0.32 60% | 0.88 -10% |
| Greyscale dE 2000 * | 1.3 | 4.34 -234% | 3.3 -154% | 6.5 -400% | 1.4 -8% | 3.57 -175% |
| Gamma | 2.166 102% | 2.32 95% | 2.137 103% | 2.28 96% | 2.24 98% | 2.4 92% |
| CCT | 6550 99% | 6952 93% | 6672 97% | 6000 108% | 6372 102% | 7246 90% |
| Contrast (:1) | 1146 | 1091 | 19778 | 1110 | 1139 | |
| Totalt genomsnitt (program/inställningar) | -136% /
-121% | -240% /
-152% | -692% /
-396% | -176% /
-88% | -236% /
-151% |
* ... mindre är bättre
Skärmen levererar också en bra till mycket bra prestanda i olika aspekter. Med nästan 100 % täckning av sRGB eller DCI-P3 och 88 % täckning av AdobeRGB är den enastående när det gäller färgrymder. Dessutom är färgnoggrannheten förstklassig, vilket eliminerar behovet av kalibrering, till skillnad från vissa konkurrenter. Skärmens enastående svartnivå, nästan 0,0 cd/m², bidrar till en imponerande kontrast som är karakteristisk för OLED och överträffar traditionella IPS-paneler. Samma överlägsenhet gäller för betraktningsvinkelns stabilitet och svarstiden, vilket gör bärbara OLED-datorer till den aktuella referensen i dessa avseenden.

Köparna måste dock räkna med de typiska nackdelarna, inklusive låg frekvens och flimmer. Skärmen flimrar vid 60 Hz under 90% ljusstyrka och vid 240 Hz under 50%. Dessa värden kan utgöra problem för personer som är känsliga för sådana faktorer.
Den glansiga ytan, som ibland ger upphov till kraftiga reflexer, kan vara ett problem för många användare vid daglig användning. Trots en respektabel genomsnittlig ljusstyrka på 383 cd/m² är Stealth 16:s lämplighet för utomhusbruk eller väl upplysta miljöer något begränsad.
Visa svarstider
| ↔ Svarstid svart till vitt | ||
|---|---|---|
| 1.2 ms ... stiga ↗ och falla ↘ kombinerat | ↗ 0.6 ms stiga | 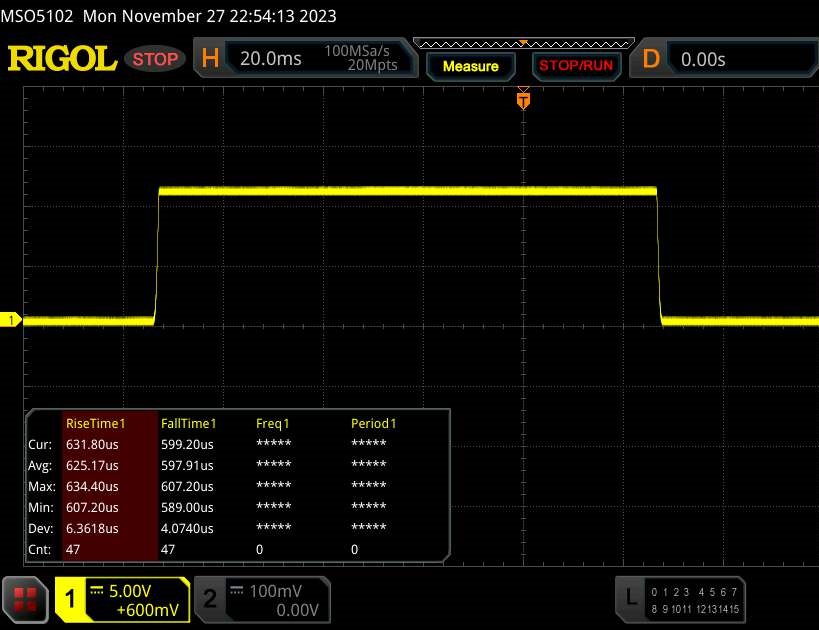 |
| ↘ 0.6 ms hösten | ||
| Skärmen visar väldigt snabba svarsfrekvenser i våra tester och borde vara mycket väl lämpad för fartfyllt spel. I jämförelse sträcker sig alla testade enheter från 0.1 (minst) till 240 (maximalt) ms. » 6 % av alla enheter är bättre. Det betyder att den uppmätta svarstiden är bättre än genomsnittet av alla testade enheter (19.8 ms). | ||
| ↔ Svarstid 50 % grått till 80 % grått | ||
| 1.5 ms ... stiga ↗ och falla ↘ kombinerat | ↗ 0.8 ms stiga | 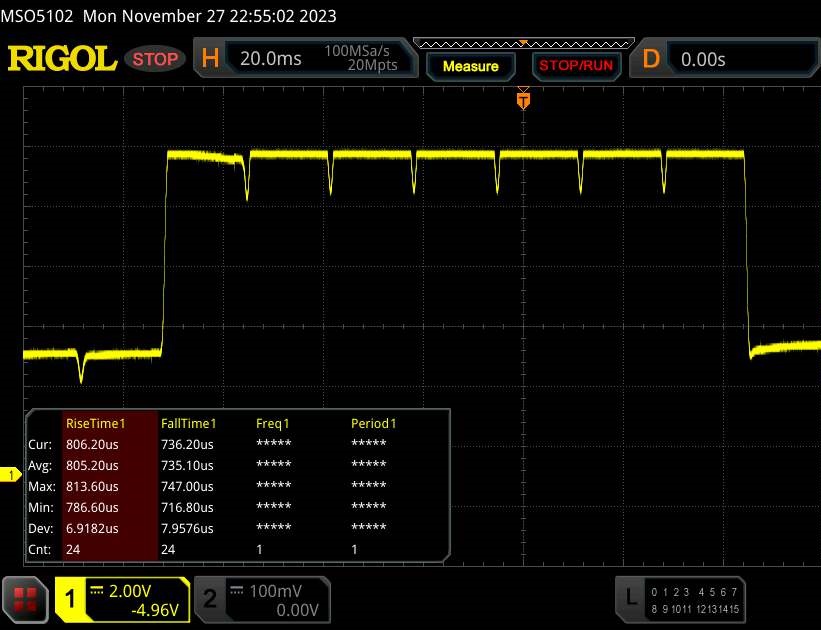 |
| ↘ 0.7 ms hösten | ||
| Skärmen visar väldigt snabba svarsfrekvenser i våra tester och borde vara mycket väl lämpad för fartfyllt spel. I jämförelse sträcker sig alla testade enheter från 0.165 (minst) till 636 (maximalt) ms. » 7 % av alla enheter är bättre. Det betyder att den uppmätta svarstiden är bättre än genomsnittet av alla testade enheter (31 ms). | ||
Skärmflimmer / PWM (Puls-Width Modulation)
| Skärmflimmer / PWM upptäckt | 60 Hz | ≤ 90 % ljusstyrka inställning | 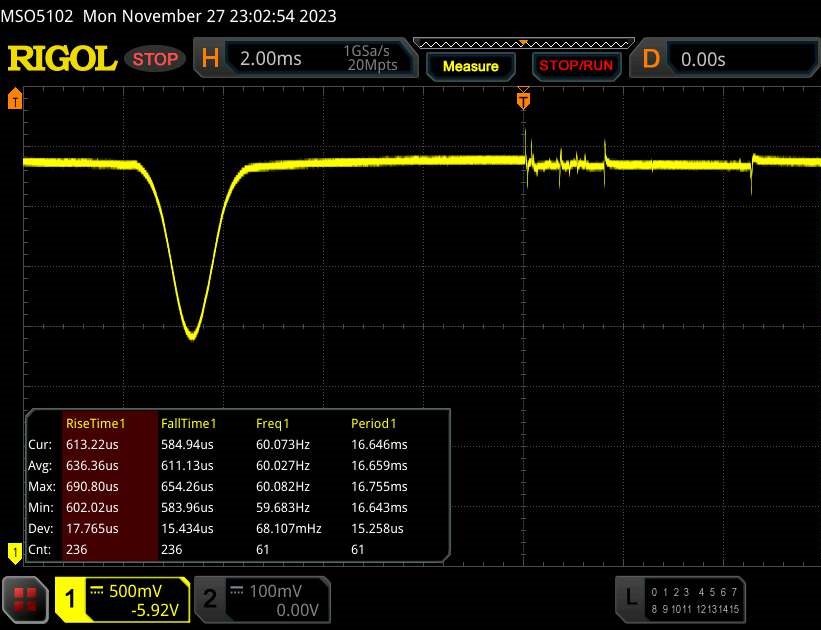 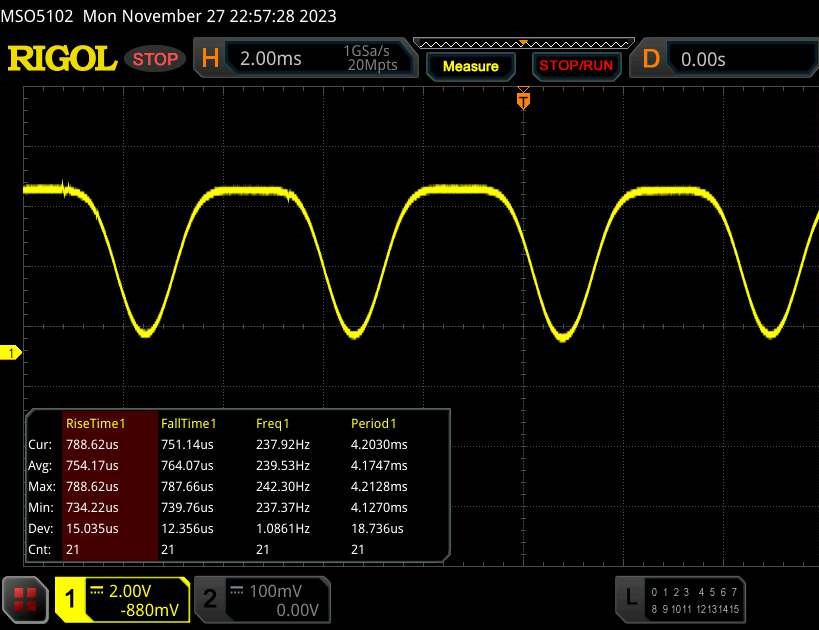 |
Displayens bakgrundsbelysning flimrar vid 60 Hz (i värsta fall, t.ex. med PWM) Flimrande upptäckt vid en ljusstyrkeinställning på 90 % och lägre. Det ska inte finnas något flimmer eller PWM över denna ljusstyrkeinställning. Frekvensen för 60 Hz är mycket låg, så flimmer kan orsaka ögon- och huvudvärk efter långvarig användning. Som jämförelse: 52 % av alla testade enheter använder inte PWM för att dämpa skärmen. Om PWM upptäcktes mättes ett medelvärde av 7757 (minst: 5 - maximum: 343500) Hz. | |||
Prestanda
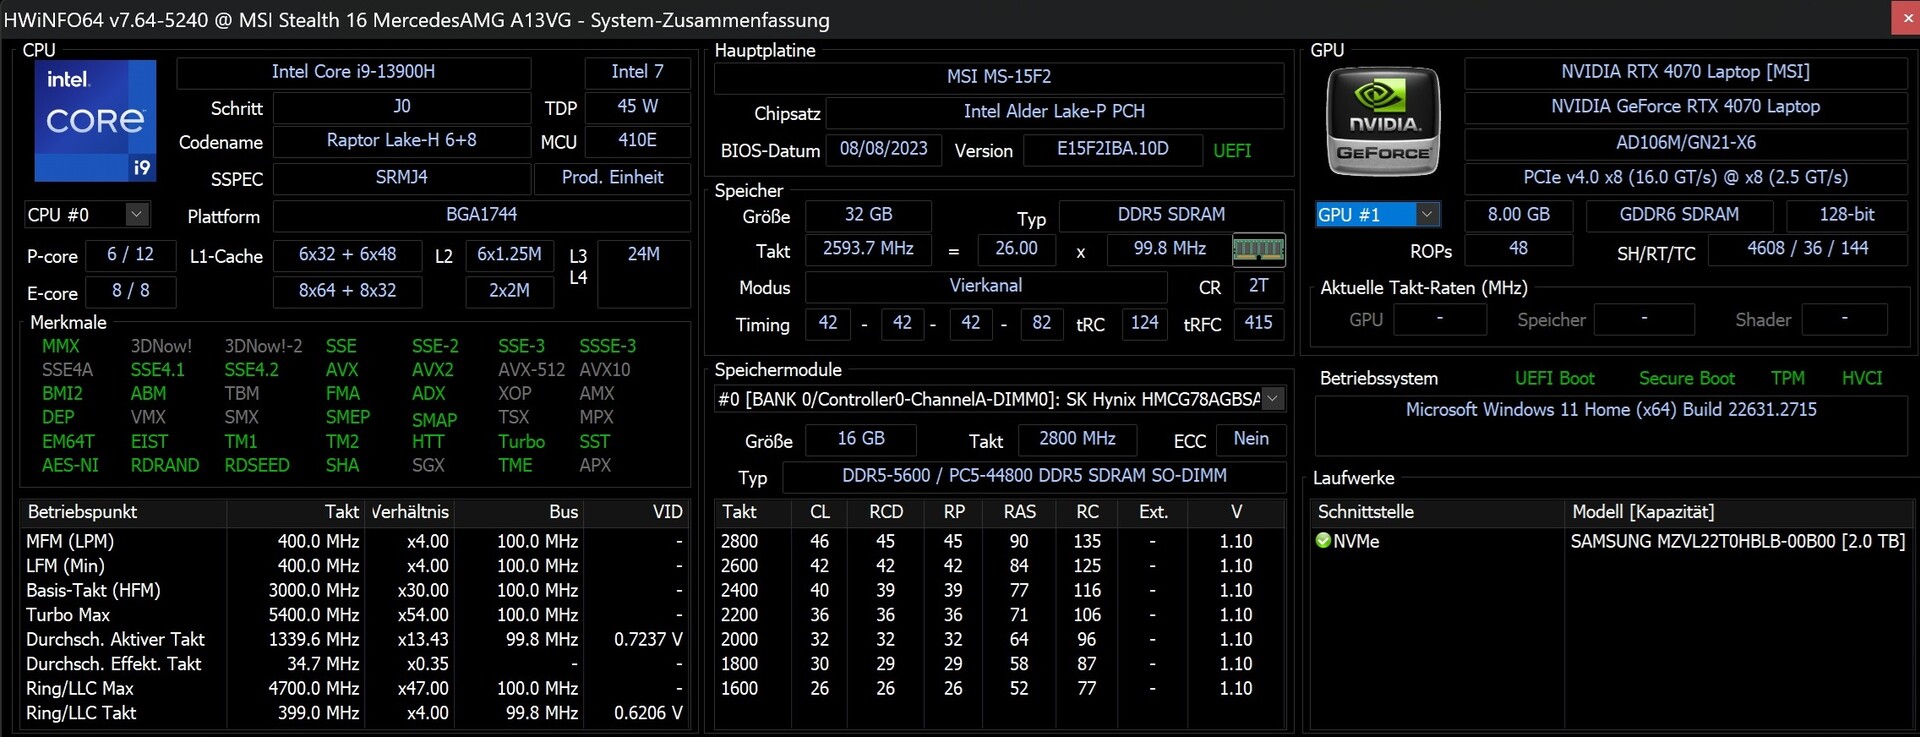
Med endast 8 GB VRAM för GeForce RTX 4070, som ansågs vara föråldrad i detta prissegment när den släpptes, hamnar 16-tummaren i det övre mellanskiktet, särskilt när det gäller GPU-prestanda. CPU-prestandan är i toppklass, Stealth 16 ligger precis på toppen, och den rikliga RAM- och SSD-konfigurationen bör erbjuda tillräckliga reserver för de flesta användare.
Villkor för testning
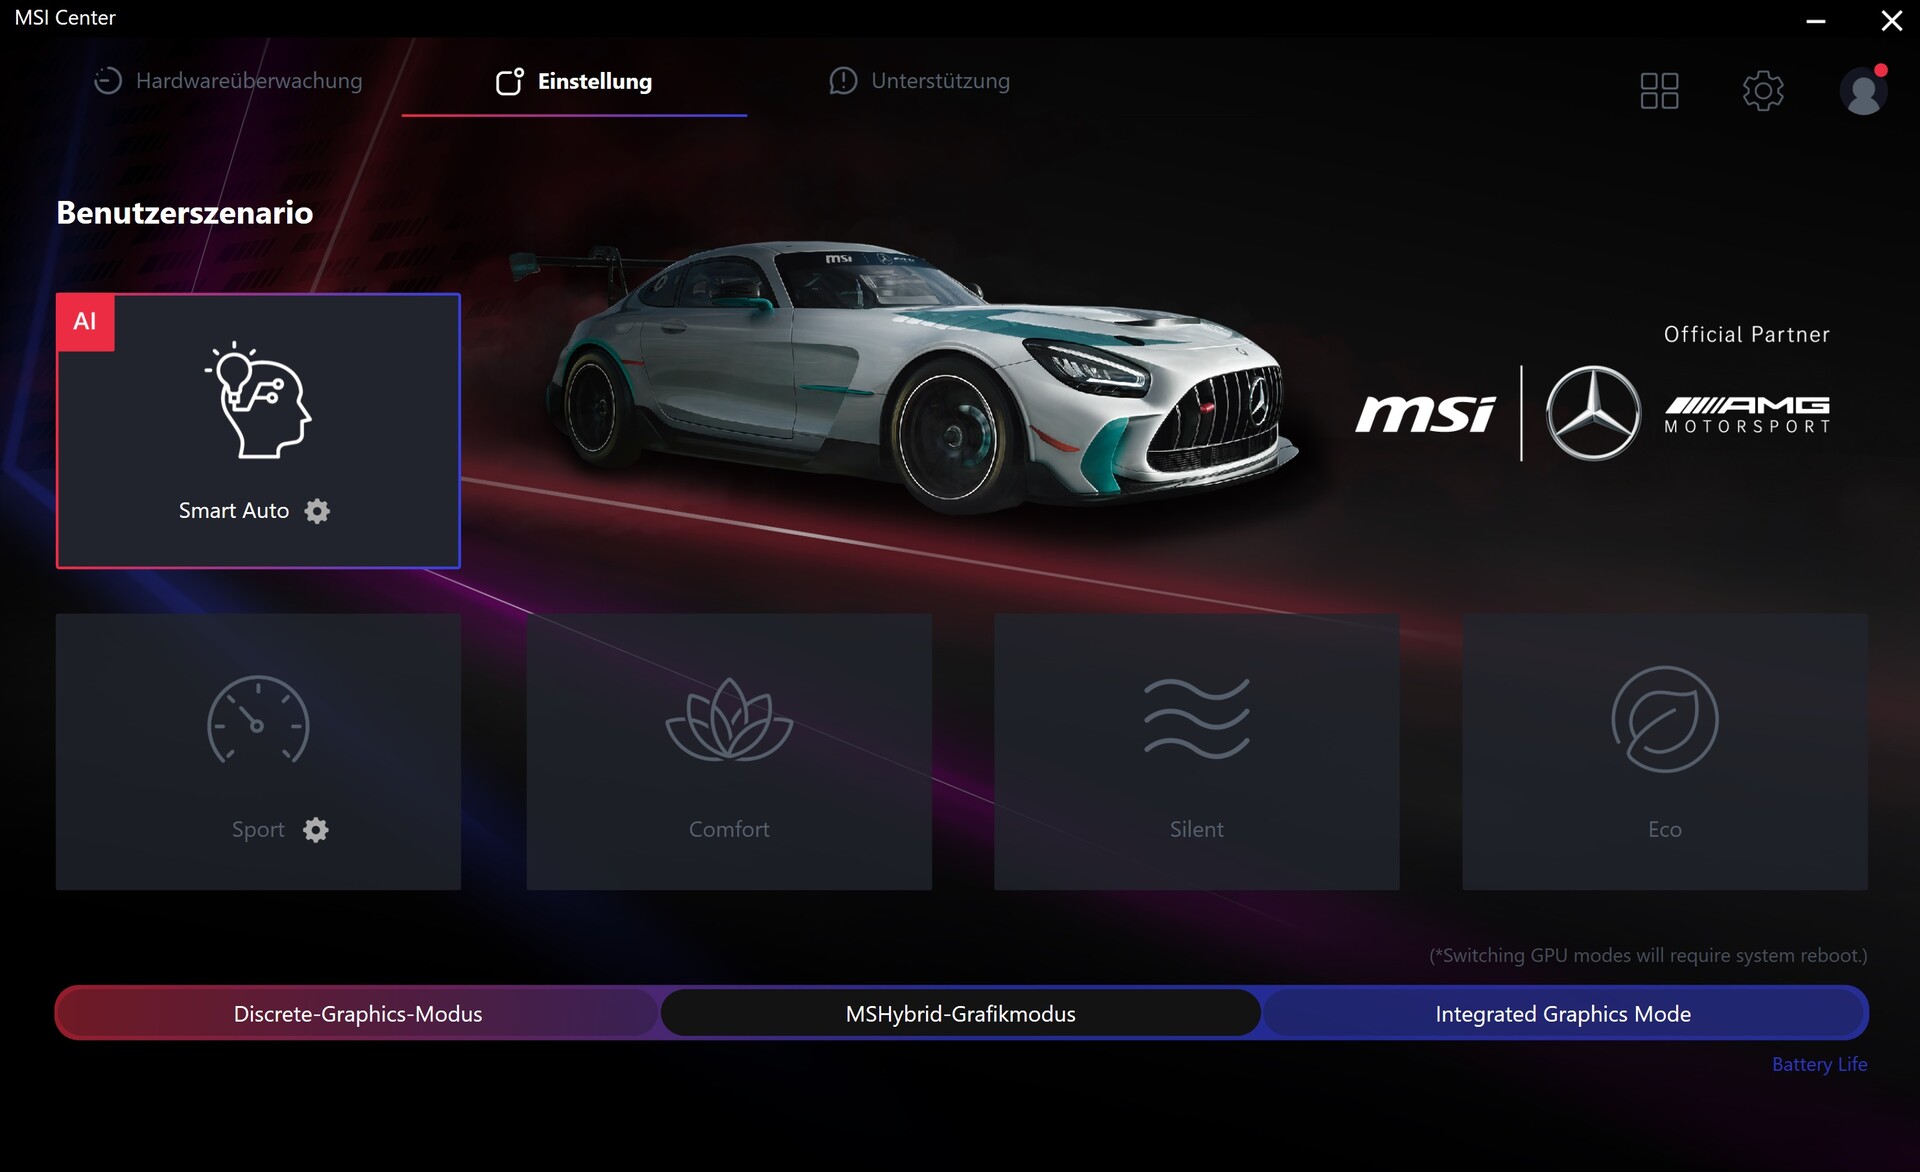
Det förinstallerade MSI Center erbjuder olika driftlägen, från Eco till Sport. Alla mätningar utfördes i Smart Auto-läge, där systemet automatiskt justerar inställningarna. Grafikväxling (MSHybrid) var aktiverat som standard.
| Sport | Komfort | Tyst | Eco | |
|---|---|---|---|---|
| Prestanda (Witcher 3, FHD/Ultra) | 120 fps | 110 fps | 90 fps | 90 fps |
| Buller (Witcher 3, FHD/Ultra) | 49 dB(A) | 45 dB(A) | 36 dB(A) | 34 dB(A) |
| Effektgräns 1 (HWInfo) | 100 w | 45 w | 25 w | 15 w |
| Effektgräns 2 (HWInfo) | 160 w | 45 w | 45 w | 15 w |
Processor
Uppgraderingen från i7-13700H till i9-13900H i våra CPU-tester visade marginella prestandaförbättringar. Benchmark-resultaten förblev liknande standardversionen. Under Cinebench-loopen fanns det två tillfälliga droppar, till skillnad från tävlingen. Core i9-13900H är ett kraftfullt men energikrävande high-end-chip med 6 prestandakärnor med Hyper-Threading och 8 effektivitetskärnor utan HT (totalt 20 trådar).
Cinebench R15 Multi Loop
* ... mindre är bättre
AIDA64: FP32 Ray-Trace | FPU Julia | CPU SHA3 | CPU Queen | FPU SinJulia | FPU Mandel | CPU AES | CPU ZLib | FP64 Ray-Trace | CPU PhotoWorxx
| Performance rating | |
| Genomsnitt av klass Gaming | |
| HP Omen Transcend 16 | |
| Lenovo Legion Pro 5 16ARX8 | |
| Schenker XMG CORE 16 (L23) | |
| MSI Stealth 16 Mercedes-AMG Motorsport A13VG | |
| Schenker XMG Pro 16 Studio (Mid 23) | |
| MSI Stealth 16 Studio A13VG | |
| Genomsnitt Intel Core i9-13900H | |
| AIDA64 / FP32 Ray-Trace | |
| Genomsnitt av klass Gaming (10227 - 85542, n=105, senaste 2 åren) | |
| Lenovo Legion Pro 5 16ARX8 | |
| Schenker XMG CORE 16 (L23) | |
| HP Omen Transcend 16 | |
| MSI Stealth 16 Mercedes-AMG Motorsport A13VG | |
| MSI Stealth 16 Studio A13VG | |
| Schenker XMG Pro 16 Studio (Mid 23) | |
| Genomsnitt Intel Core i9-13900H (6788 - 19557, n=25) | |
| AIDA64 / FPU Julia | |
| Genomsnitt av klass Gaming (51376 - 238426, n=105, senaste 2 åren) | |
| Lenovo Legion Pro 5 16ARX8 | |
| Schenker XMG CORE 16 (L23) | |
| HP Omen Transcend 16 | |
| MSI Stealth 16 Mercedes-AMG Motorsport A13VG | |
| Schenker XMG Pro 16 Studio (Mid 23) | |
| MSI Stealth 16 Studio A13VG | |
| Genomsnitt Intel Core i9-13900H (22551 - 95579, n=25) | |
| AIDA64 / CPU SHA3 | |
| Genomsnitt av klass Gaming (2180 - 10115, n=105, senaste 2 åren) | |
| HP Omen Transcend 16 | |
| Lenovo Legion Pro 5 16ARX8 | |
| Schenker XMG CORE 16 (L23) | |
| MSI Stealth 16 Mercedes-AMG Motorsport A13VG | |
| MSI Stealth 16 Studio A13VG | |
| Schenker XMG Pro 16 Studio (Mid 23) | |
| Genomsnitt Intel Core i9-13900H (2491 - 4270, n=25) | |
| AIDA64 / CPU Queen | |
| Lenovo Legion Pro 5 16ARX8 | |
| HP Omen Transcend 16 | |
| Genomsnitt av klass Gaming (49785 - 173351, n=90, senaste 2 åren) | |
| MSI Stealth 16 Mercedes-AMG Motorsport A13VG | |
| MSI Stealth 16 Studio A13VG | |
| Genomsnitt Intel Core i9-13900H (65121 - 120936, n=25) | |
| Schenker XMG CORE 16 (L23) | |
| Schenker XMG Pro 16 Studio (Mid 23) | |
| AIDA64 / FPU SinJulia | |
| Lenovo Legion Pro 5 16ARX8 | |
| Schenker XMG CORE 16 (L23) | |
| Genomsnitt av klass Gaming (4424 - 33636, n=105, senaste 2 åren) | |
| HP Omen Transcend 16 | |
| MSI Stealth 16 Mercedes-AMG Motorsport A13VG | |
| MSI Stealth 16 Studio A13VG | |
| Schenker XMG Pro 16 Studio (Mid 23) | |
| Genomsnitt Intel Core i9-13900H (6108 - 11631, n=25) | |
| AIDA64 / FPU Mandel | |
| Genomsnitt av klass Gaming (25115 - 128721, n=105, senaste 2 åren) | |
| Lenovo Legion Pro 5 16ARX8 | |
| Schenker XMG CORE 16 (L23) | |
| HP Omen Transcend 16 | |
| MSI Stealth 16 Mercedes-AMG Motorsport A13VG | |
| MSI Stealth 16 Studio A13VG | |
| Schenker XMG Pro 16 Studio (Mid 23) | |
| Genomsnitt Intel Core i9-13900H (11283 - 48474, n=25) | |
| AIDA64 / CPU AES | |
| Schenker XMG Pro 16 Studio (Mid 23) | |
| HP Omen Transcend 16 | |
| Genomsnitt av klass Gaming (39258 - 247074, n=105, senaste 2 åren) | |
| Schenker XMG CORE 16 (L23) | |
| Genomsnitt Intel Core i9-13900H (3691 - 149377, n=25) | |
| MSI Stealth 16 Mercedes-AMG Motorsport A13VG | |
| MSI Stealth 16 Studio A13VG | |
| Lenovo Legion Pro 5 16ARX8 | |
| AIDA64 / CPU ZLib | |
| HP Omen Transcend 16 | |
| Genomsnitt av klass Gaming (574 - 2531, n=105, senaste 2 åren) | |
| MSI Stealth 16 Mercedes-AMG Motorsport A13VG | |
| Lenovo Legion Pro 5 16ARX8 | |
| Schenker XMG CORE 16 (L23) | |
| Schenker XMG Pro 16 Studio (Mid 23) | |
| Genomsnitt Intel Core i9-13900H (789 - 1254, n=25) | |
| MSI Stealth 16 Studio A13VG | |
| AIDA64 / FP64 Ray-Trace | |
| Genomsnitt av klass Gaming (5509 - 45446, n=105, senaste 2 åren) | |
| Lenovo Legion Pro 5 16ARX8 | |
| Schenker XMG CORE 16 (L23) | |
| HP Omen Transcend 16 | |
| MSI Stealth 16 Mercedes-AMG Motorsport A13VG | |
| MSI Stealth 16 Studio A13VG | |
| Schenker XMG Pro 16 Studio (Mid 23) | |
| Genomsnitt Intel Core i9-13900H (3655 - 10716, n=25) | |
| AIDA64 / CPU PhotoWorxx | |
| HP Omen Transcend 16 | |
| Schenker XMG Pro 16 Studio (Mid 23) | |
| MSI Stealth 16 Mercedes-AMG Motorsport A13VG | |
| MSI Stealth 16 Studio A13VG | |
| Genomsnitt av klass Gaming (12271 - 89891, n=105, senaste 2 åren) | |
| Schenker XMG CORE 16 (L23) | |
| Genomsnitt Intel Core i9-13900H (10871 - 50488, n=25) | |
| Lenovo Legion Pro 5 16ARX8 | |
Systemets prestanda
Trots att Stealth 16 har mycket snabba komponenter hamnar systemprestandan på näst sista plats i jämförelsefältet, strax före den vanliga Studio-versionen. Skillnaderna är små, och i praktisk användning är det osannolikt att användarna kommer att märka några betydande skillnader.
CrossMark: Overall | Productivity | Creativity | Responsiveness
| PCMark 10 / Score | |
| Genomsnitt av klass Gaming (5828 - 12414, n=93, senaste 2 åren) | |
| Lenovo Legion Pro 5 16ARX8 | |
| Schenker XMG CORE 16 (L23) | |
| HP Omen Transcend 16 | |
| Schenker XMG Pro 16 Studio (Mid 23) | |
| Genomsnitt Intel Core i9-13900H, NVIDIA GeForce RTX 4070 Laptop GPU (5855 - 8538, n=8) | |
| MSI Stealth 16 Mercedes-AMG Motorsport A13VG | |
| MSI Stealth 16 Studio A13VG | |
| PCMark 10 / Essentials | |
| Schenker XMG Pro 16 Studio (Mid 23) | |
| HP Omen Transcend 16 | |
| Lenovo Legion Pro 5 16ARX8 | |
| Schenker XMG CORE 16 (L23) | |
| MSI Stealth 16 Mercedes-AMG Motorsport A13VG | |
| Genomsnitt Intel Core i9-13900H, NVIDIA GeForce RTX 4070 Laptop GPU (8835 - 11940, n=8) | |
| Genomsnitt av klass Gaming (8810 - 11935, n=97, senaste 2 åren) | |
| MSI Stealth 16 Studio A13VG | |
| PCMark 10 / Productivity | |
| Genomsnitt av klass Gaming (6845 - 25323, n=95, senaste 2 åren) | |
| Schenker XMG CORE 16 (L23) | |
| Schenker XMG Pro 16 Studio (Mid 23) | |
| Lenovo Legion Pro 5 16ARX8 | |
| Genomsnitt Intel Core i9-13900H, NVIDIA GeForce RTX 4070 Laptop GPU (7967 - 10991, n=8) | |
| HP Omen Transcend 16 | |
| MSI Stealth 16 Mercedes-AMG Motorsport A13VG | |
| MSI Stealth 16 Studio A13VG | |
| PCMark 10 / Digital Content Creation | |
| Genomsnitt av klass Gaming (7602 - 19954, n=95, senaste 2 åren) | |
| HP Omen Transcend 16 | |
| Lenovo Legion Pro 5 16ARX8 | |
| Schenker XMG CORE 16 (L23) | |
| Genomsnitt Intel Core i9-13900H, NVIDIA GeForce RTX 4070 Laptop GPU (7738 - 13575, n=8) | |
| Schenker XMG Pro 16 Studio (Mid 23) | |
| MSI Stealth 16 Studio A13VG | |
| MSI Stealth 16 Mercedes-AMG Motorsport A13VG | |
| CrossMark / Overall | |
| Lenovo Legion Pro 5 16ARX8 | |
| Genomsnitt av klass Gaming (1366 - 2409, n=94, senaste 2 åren) | |
| HP Omen Transcend 16 | |
| Schenker XMG Pro 16 Studio (Mid 23) | |
| Genomsnitt Intel Core i9-13900H, NVIDIA GeForce RTX 4070 Laptop GPU (1104 - 1974, n=7) | |
| MSI Stealth 16 Studio A13VG | |
| Schenker XMG CORE 16 (L23) | |
| CrossMark / Productivity | |
| Lenovo Legion Pro 5 16ARX8 | |
| Schenker XMG Pro 16 Studio (Mid 23) | |
| Genomsnitt av klass Gaming (1386 - 2254, n=94, senaste 2 åren) | |
| HP Omen Transcend 16 | |
| Genomsnitt Intel Core i9-13900H, NVIDIA GeForce RTX 4070 Laptop GPU (1058 - 1914, n=7) | |
| MSI Stealth 16 Studio A13VG | |
| Schenker XMG CORE 16 (L23) | |
| CrossMark / Creativity | |
| HP Omen Transcend 16 | |
| Genomsnitt av klass Gaming (1343 - 2786, n=94, senaste 2 åren) | |
| Lenovo Legion Pro 5 16ARX8 | |
| Schenker XMG Pro 16 Studio (Mid 23) | |
| Genomsnitt Intel Core i9-13900H, NVIDIA GeForce RTX 4070 Laptop GPU (1178 - 2254, n=7) | |
| MSI Stealth 16 Studio A13VG | |
| Schenker XMG CORE 16 (L23) | |
| CrossMark / Responsiveness | |
| Schenker XMG Pro 16 Studio (Mid 23) | |
| Lenovo Legion Pro 5 16ARX8 | |
| Genomsnitt av klass Gaming (1226 - 2334, n=94, senaste 2 åren) | |
| Genomsnitt Intel Core i9-13900H, NVIDIA GeForce RTX 4070 Laptop GPU (1037 - 1952, n=7) | |
| MSI Stealth 16 Studio A13VG | |
| HP Omen Transcend 16 | |
| Schenker XMG CORE 16 (L23) | |
| PCMark 10 Score | 7334 poäng | |
Hjälp | ||
| AIDA64 / Memory Copy | |
| HP Omen Transcend 16 | |
| Genomsnitt av klass Gaming (21750 - 129946, n=105, senaste 2 åren) | |
| Schenker XMG Pro 16 Studio (Mid 23) | |
| MSI Stealth 16 Studio A13VG | |
| MSI Stealth 16 Mercedes-AMG Motorsport A13VG | |
| Schenker XMG CORE 16 (L23) | |
| Genomsnitt Intel Core i9-13900H (37448 - 74486, n=25) | |
| Lenovo Legion Pro 5 16ARX8 | |
| AIDA64 / Memory Read | |
| HP Omen Transcend 16 | |
| Schenker XMG Pro 16 Studio (Mid 23) | |
| Genomsnitt av klass Gaming (22956 - 118858, n=105, senaste 2 åren) | |
| MSI Stealth 16 Studio A13VG | |
| MSI Stealth 16 Mercedes-AMG Motorsport A13VG | |
| Genomsnitt Intel Core i9-13900H (41599 - 75433, n=25) | |
| Schenker XMG CORE 16 (L23) | |
| Lenovo Legion Pro 5 16ARX8 | |
| AIDA64 / Memory Write | |
| Schenker XMG CORE 16 (L23) | |
| Genomsnitt av klass Gaming (22297 - 135096, n=105, senaste 2 åren) | |
| HP Omen Transcend 16 | |
| MSI Stealth 16 Mercedes-AMG Motorsport A13VG | |
| Schenker XMG Pro 16 Studio (Mid 23) | |
| MSI Stealth 16 Studio A13VG | |
| Genomsnitt Intel Core i9-13900H (36152 - 88505, n=25) | |
| Lenovo Legion Pro 5 16ARX8 | |
| AIDA64 / Memory Latency | |
| Genomsnitt av klass Gaming (75.3 - 259, n=105, senaste 2 åren) | |
| Genomsnitt Intel Core i9-13900H (75.8 - 102.3, n=25) | |
| MSI Stealth 16 Mercedes-AMG Motorsport A13VG | |
| Schenker XMG CORE 16 (L23) | |
| HP Omen Transcend 16 | |
| MSI Stealth 16 Studio A13VG | |
| Schenker XMG Pro 16 Studio (Mid 23) | |
| Lenovo Legion Pro 5 16ARX8 | |
* ... mindre är bättre
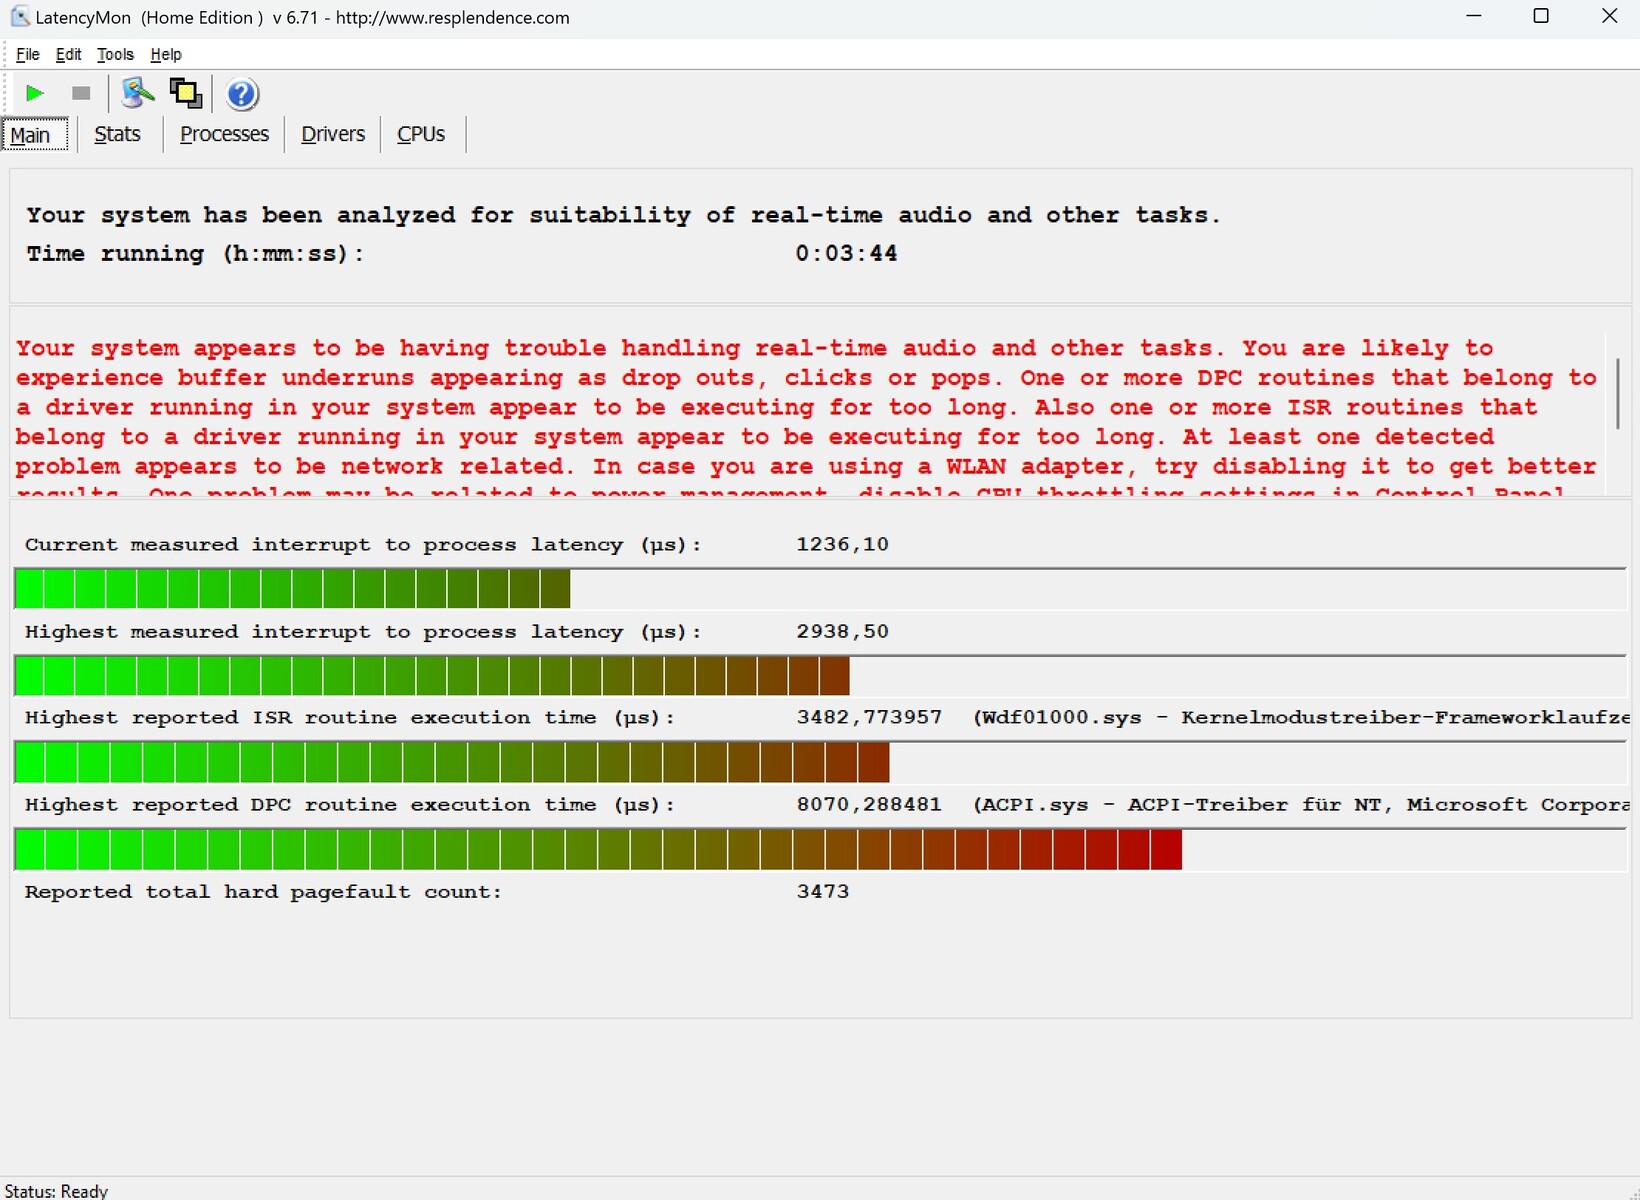
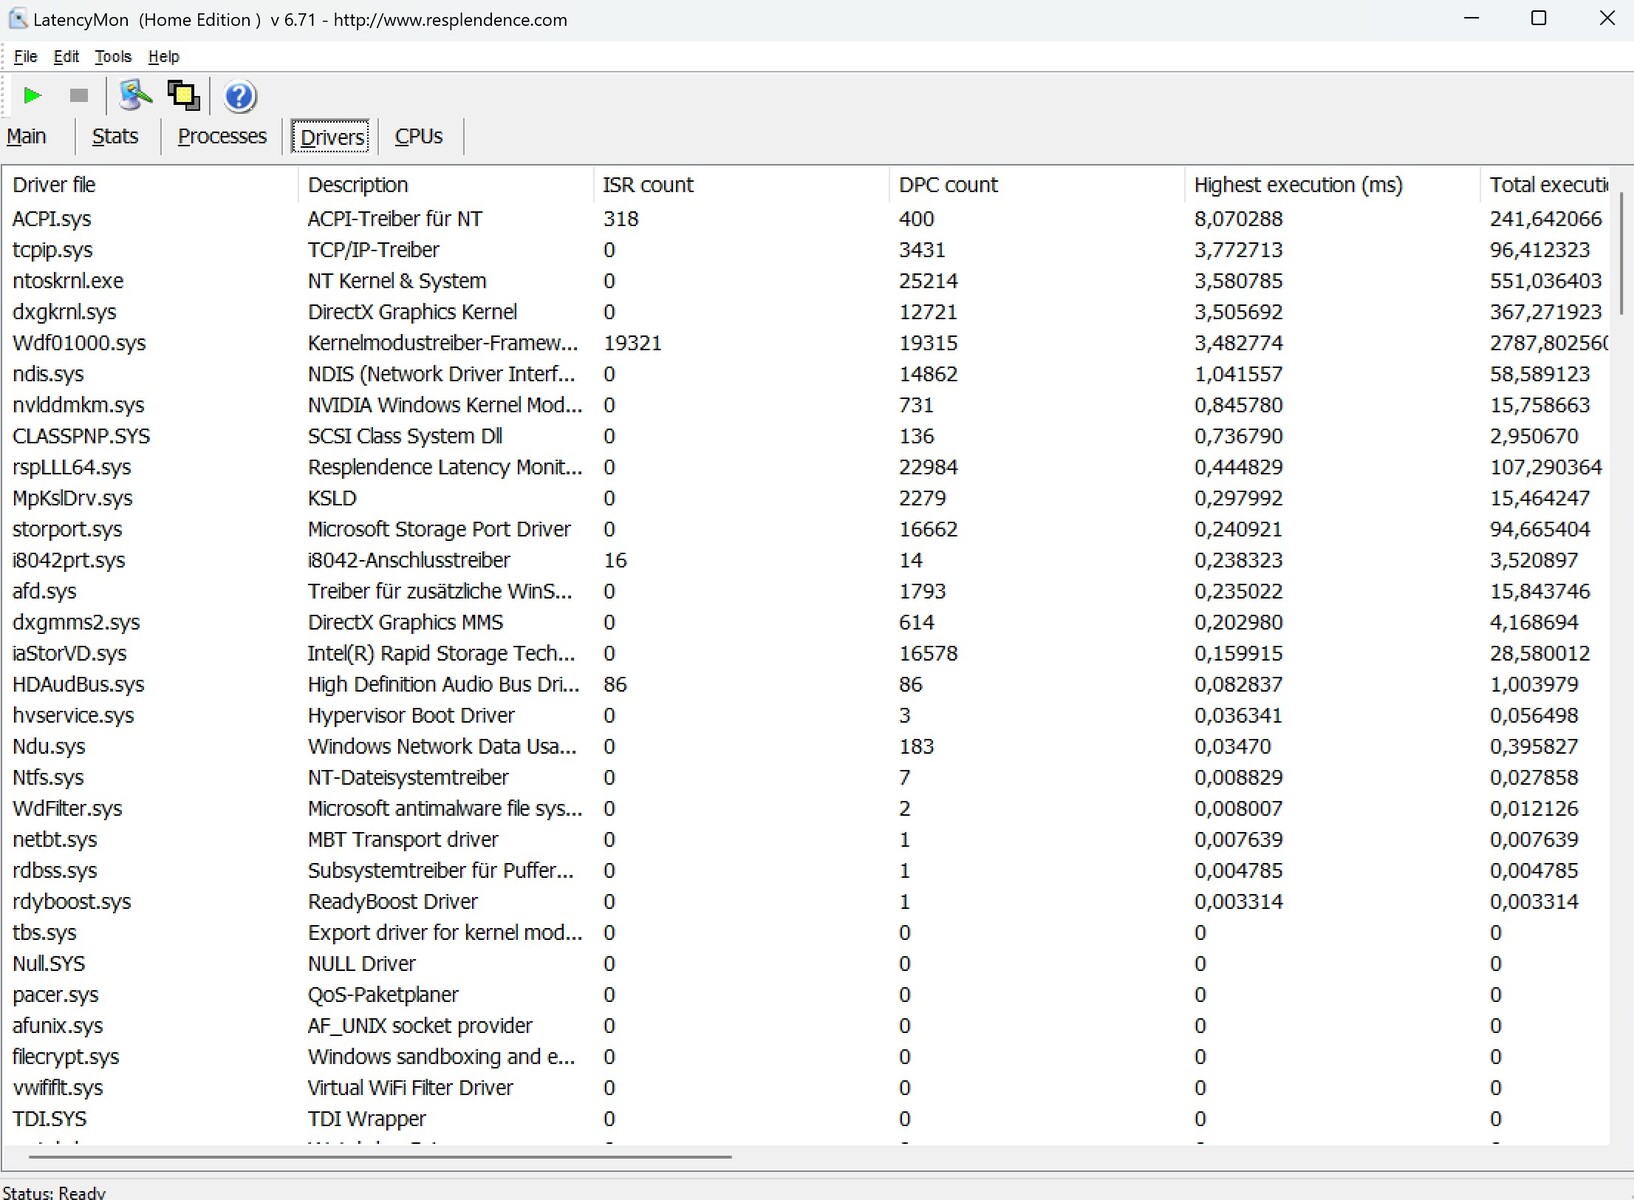
DPC-fördröjning
MSI skulle kunna förbättra latensen i Stealth 16. I levererat skick indikerar LatencyMon potentiella störningar i realtidsbearbetning av ljud och video. Detta fenomen drabbar dock många bärbara datorer.
| DPC Latencies / LatencyMon - interrupt to process latency (max), Web, Youtube, Prime95 | |
| MSI Stealth 16 Studio A13VG | |
| MSI Stealth 16 Mercedes-AMG Motorsport A13VG | |
| Schenker XMG Pro 16 Studio (Mid 23) | |
| HP Omen Transcend 16 | |
| Schenker XMG CORE 16 (L23) | |
| Lenovo Legion Pro 5 16ARX8 | |
* ... mindre är bättre
Lagringsenheter
Den 2 TB Samsung SSD (modell PM9A1) i testenheten presterade inledningsvis bra men upplevde kraftiga prestandafall, eller strypning, under långvarig belastning. Tyvärr har MSI ännu inte tagit itu med denna fråga, liknande standard Stealth 16. De flesta av tävlingarna presterar bättre i detta avseende, med undantag för Lenovo Legion Pro 5.

* ... mindre är bättre
Continuous power read: DiskSpd Read Loop, Queue Depth 8
Grafikkort
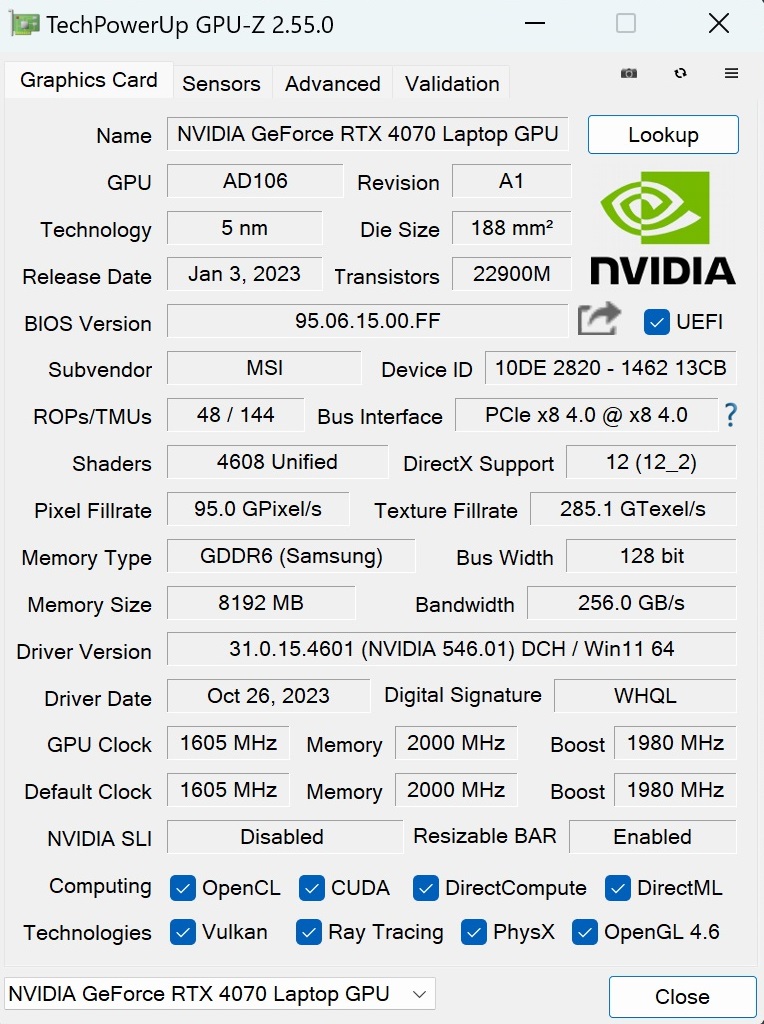
Trots GPU:ns TGP på 105 watt ligger prestandan för RTX 4070 i Stealth 16 i linje med genomsnittet för detta grafikkort.
| 3DMark Ice Storm Standard Score | 99001 poäng | |
| 3DMark Cloud Gate Standard Score | 52847 poäng | |
| 3DMark Fire Strike Score | 22419 poäng | |
| 3DMark Time Spy Score | 11694 poäng | |
Hjälp | ||
* ... mindre är bättre
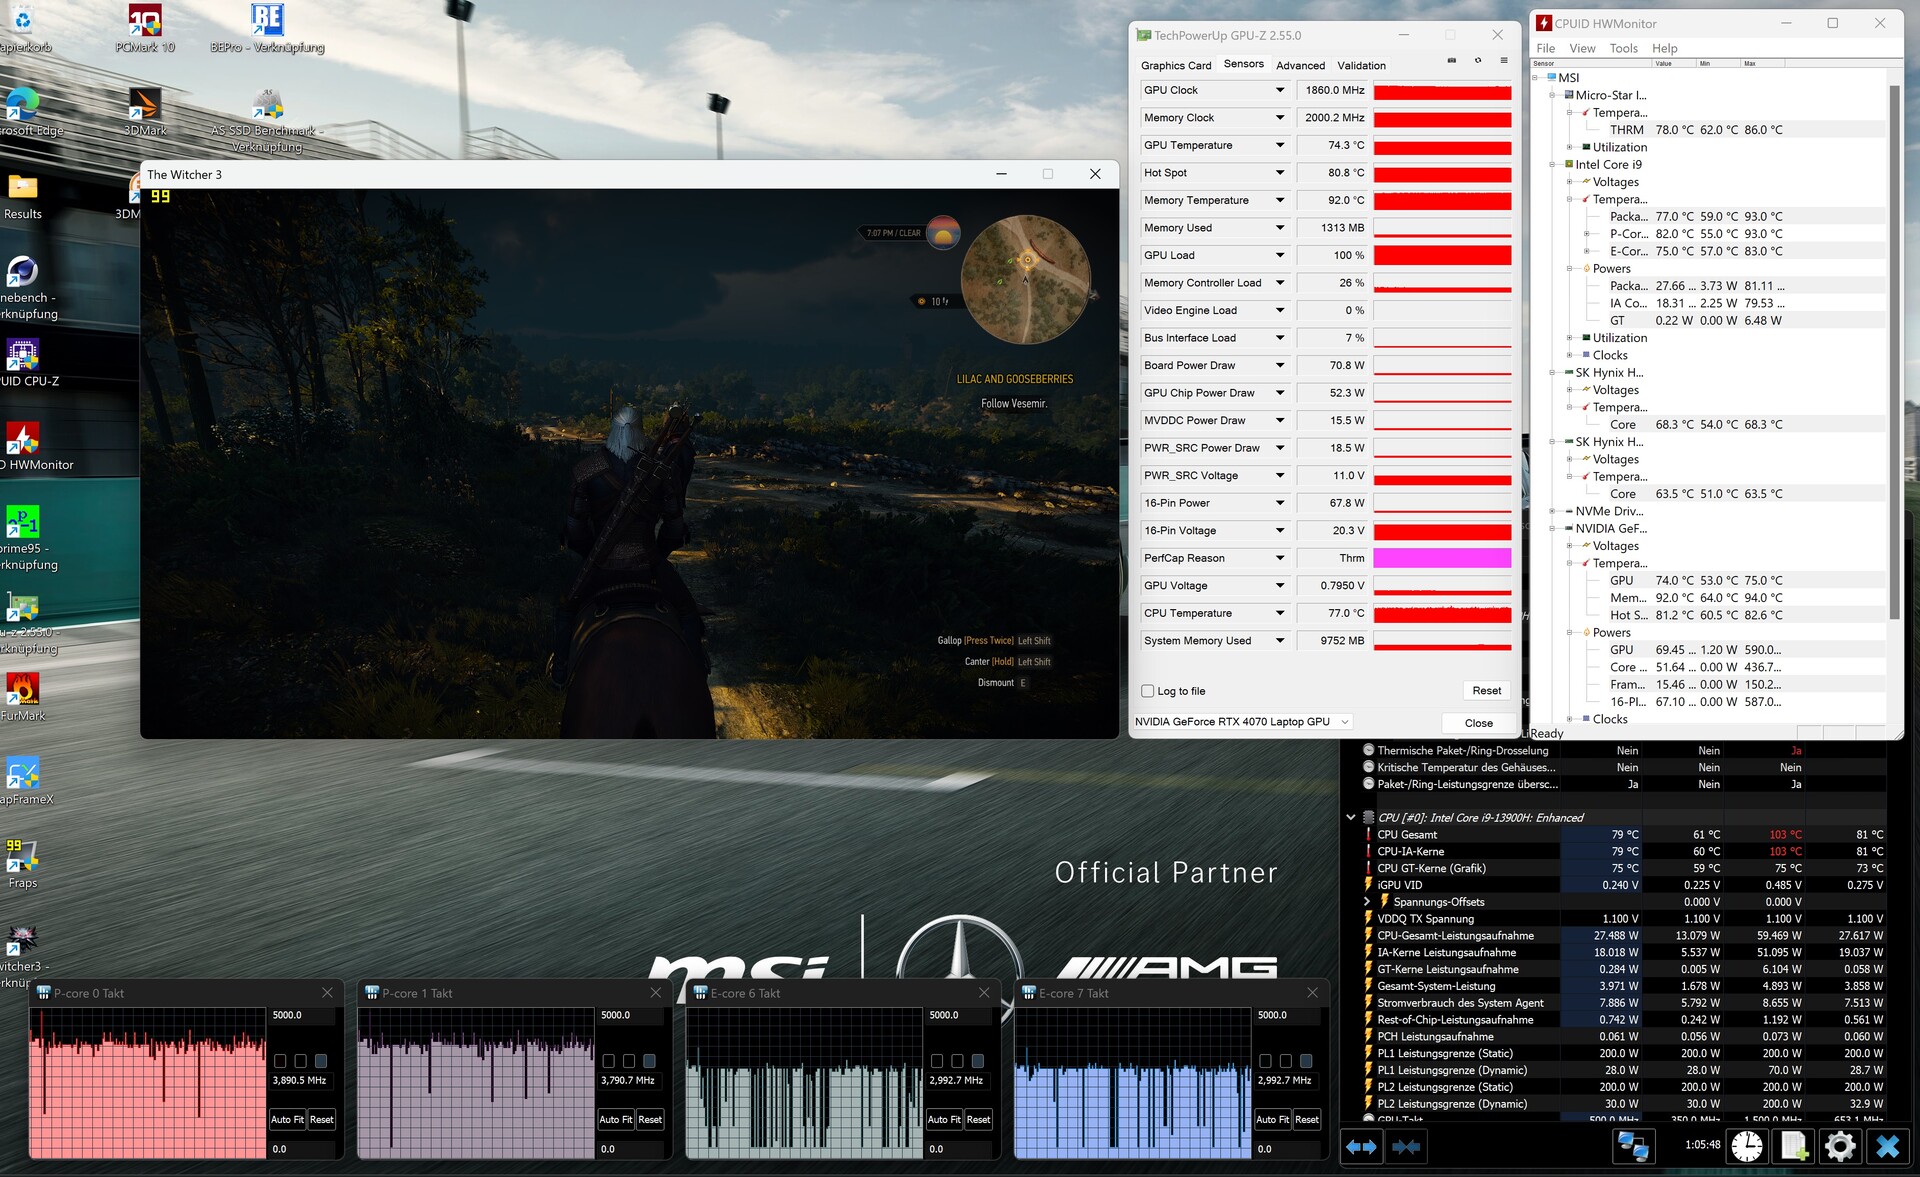
Spelprestanda
Eftersom OLED-skärmen inte stöder en klassisk UHD-upplösning (3 840 x 2 160 pixlar), använde vi maximalt 2 560 x 1 440 pixlar för spelbenchmarks. Att gå högre överbelastar ofta RTX 4070, särskilt vid högre inställningar, vilket framgår avGPU-sidan. Stealth 16 presterar dock beundransvärt i QHD och utnyttjar OLED-panelens 60 Hz-kapacitet fullt ut i de flesta titlar, med undantag för krävande och mindre optimerade titlar som Alan Wake 2.
| Counter-Strike 2 - 2560x1440 Very High Preset | |
| Genomsnitt av klass Gaming (15.7 - 224, n=5, senaste 2 åren) | |
| XMG Pro 15 E23 | |
| Genomsnitt NVIDIA GeForce RTX 4070 Laptop GPU (87.9 - 100.6, n=2) | |
| MSI Stealth 16 Mercedes-AMG Motorsport A13VG | |
| Alan Wake 2 - 2560x1440 High Preset | |
| Genomsnitt av klass Gaming (36.7 - 93.1, n=33, senaste 2 åren) | |
| Genomsnitt NVIDIA GeForce RTX 4070 Laptop GPU (40.2 - 44.5, n=7) | |
| MSI Stealth 16 Mercedes-AMG Motorsport A13VG | |
| XMG Pro 15 E23 | |
| EA Sports WRC - 2560x1440 Ultra Preset AA:Epic AF:16x | |
| XMG Pro 15 E23 | |
| Genomsnitt NVIDIA GeForce RTX 4070 Laptop GPU (59.6 - 68.8, n=3) | |
| MSI Stealth 16 Mercedes-AMG Motorsport A13VG | |
Under ett 60-minuters test av Witcher 3med inställningarna FHD/Ultra minskade inte bildfrekvensen, men hastigheten minskade med nästan 10 % under testets gång.
Witcher 3 FPS chart
| låg | med. | hög | ultra | QHD | |
|---|---|---|---|---|---|
| GTA V (2015) | 176 | 164.9 | 100.3 | 87.6 | |
| The Witcher 3 (2015) | 317 | 205 | 110 | 77.7 | |
| Dota 2 Reborn (2015) | 178.3 | 144.5 | 135.9 | 126.9 | |
| Final Fantasy XV Benchmark (2018) | 138 | 101.4 | 74.1 | ||
| X-Plane 11.11 (2018) | 144.7 | 118.1 | 98 | ||
| Strange Brigade (2018) | 276 | 220 | 190.6 | 126.3 | |
| Counter-Strike 2 (2023) | 160.2 | 151.5 | 121.5 | 87.9 | |
| Alan Wake 2 (2023) | 66.9 | 65.1 | 42.3 | ||
| EA Sports WRC (2023) | 90.6 | 85 | 77.1 | 59.6 |
Utsläpp
Buller från systemet
Medan ljudnivån vid tomgång liknar standard Stealth 16, är Motorsport Edition något högre under belastning. Jämfört med konkurrenterna ligger dock de uppmätta värdena inom rimliga gränser, där HP Omen Transcend 16 är mer märkbar i 3D-läge.
Ljudnivå
| Låg belastning |
| 25 / 26 / 27 dB(A) |
| Hög belastning |
| 39 / 51 dB(A) |
 | ||
30 dB tyst 40 dB(A) hörbar 50 dB(A) högt ljud |
||
min: | ||
| MSI Stealth 16 Mercedes-AMG Motorsport A13VG i9-13900H, GeForce RTX 4070 Laptop GPU | MSI Stealth 16 Studio A13VG i7-13700H, GeForce RTX 4070 Laptop GPU | Schenker XMG Pro 16 Studio (Mid 23) i9-13900H, GeForce RTX 4070 Laptop GPU | HP Omen Transcend 16 i9-13900HX, GeForce RTX 4070 Laptop GPU | Lenovo Legion Pro 5 16ARX8 R7 7745HX, GeForce RTX 4070 Laptop GPU | Schenker XMG CORE 16 (L23) R7 7840HS, GeForce RTX 4070 Laptop GPU | |
|---|---|---|---|---|---|---|
| Noise | 6% | -8% | -10% | 5% | -0% | |
| av / miljö * (dB) | 25 | 24 4% | 25 -0% | 22.9 8% | 23.2 7% | 23 8% |
| Idle Minimum * (dB) | 25 | 24 4% | 26 -4% | 29.1 -16% | 23.2 7% | 23 8% |
| Idle Average * (dB) | 26 | 24 8% | 29 -12% | 29.1 -12% | 23.2 11% | 28.48 -10% |
| Idle Maximum * (dB) | 27 | 24 11% | 34 -26% | 29.1 -8% | 26.2 3% | 28.48 -5% |
| Load Average * (dB) | 39 | 34.81 11% | 43 -10% | 45.7 -17% | 31.4 19% | 30 23% |
| Witcher 3 ultra * (dB) | 45 | 44.05 2% | 48 -7% | 54.3 -21% | 48.4 -8% | 54.12 -20% |
| Load Maximum * (dB) | 51 | 51.57 -1% | 48 6% | 54.3 -6% | 53.8 -5% | 54.12 -6% |
* ... mindre är bättre
Temperatur
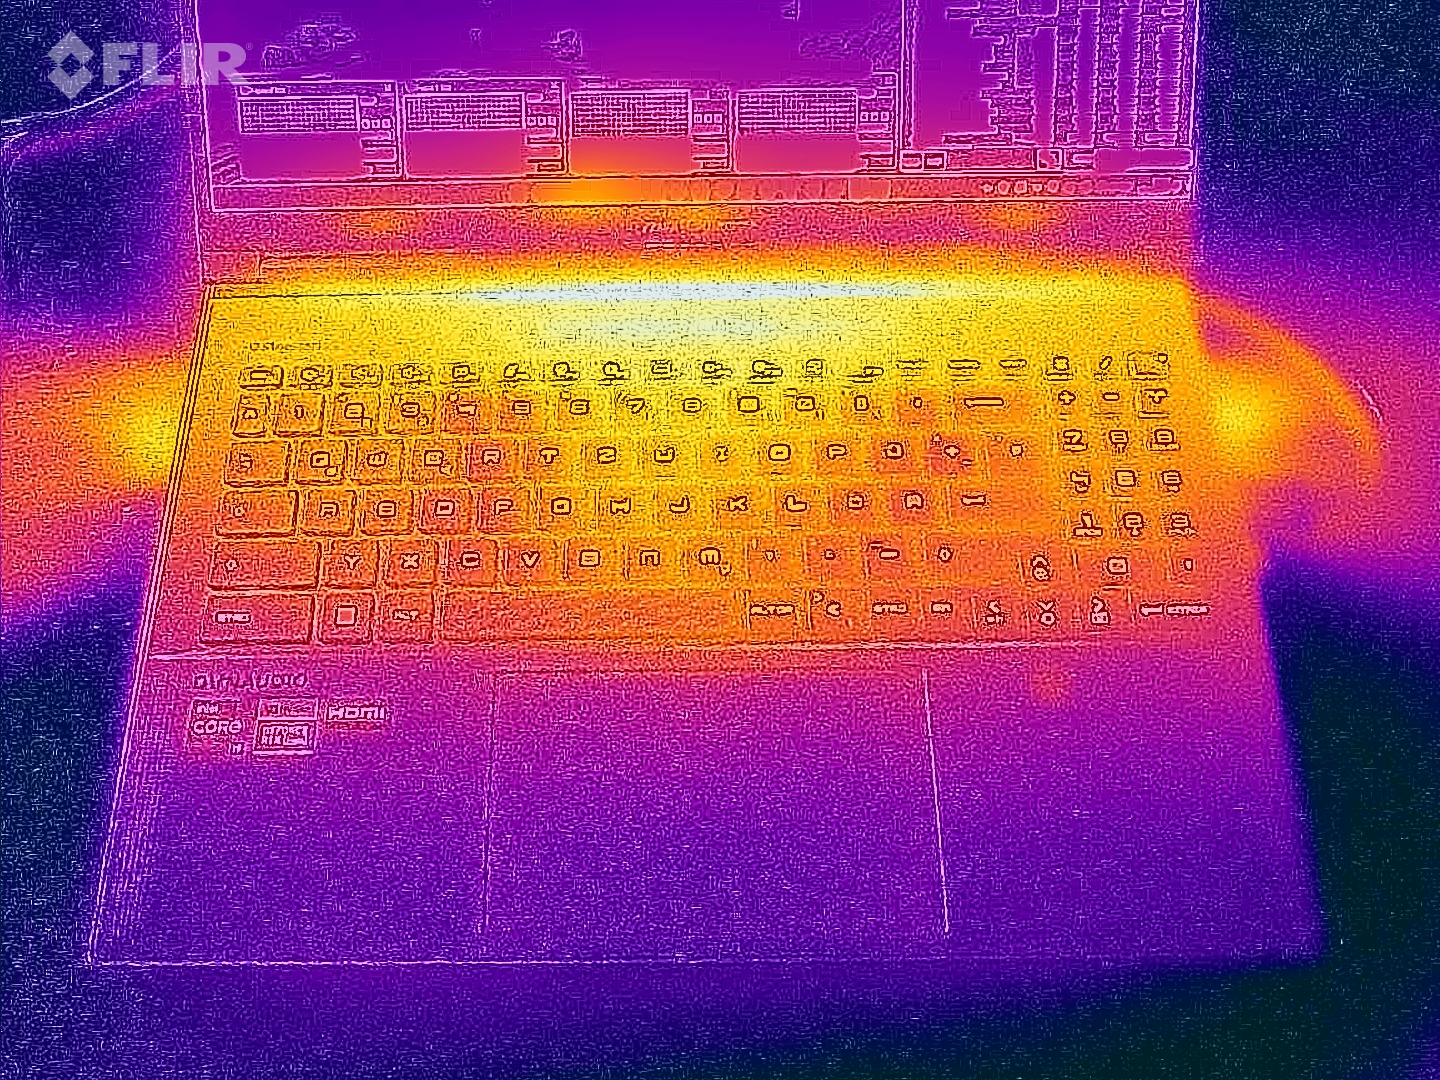
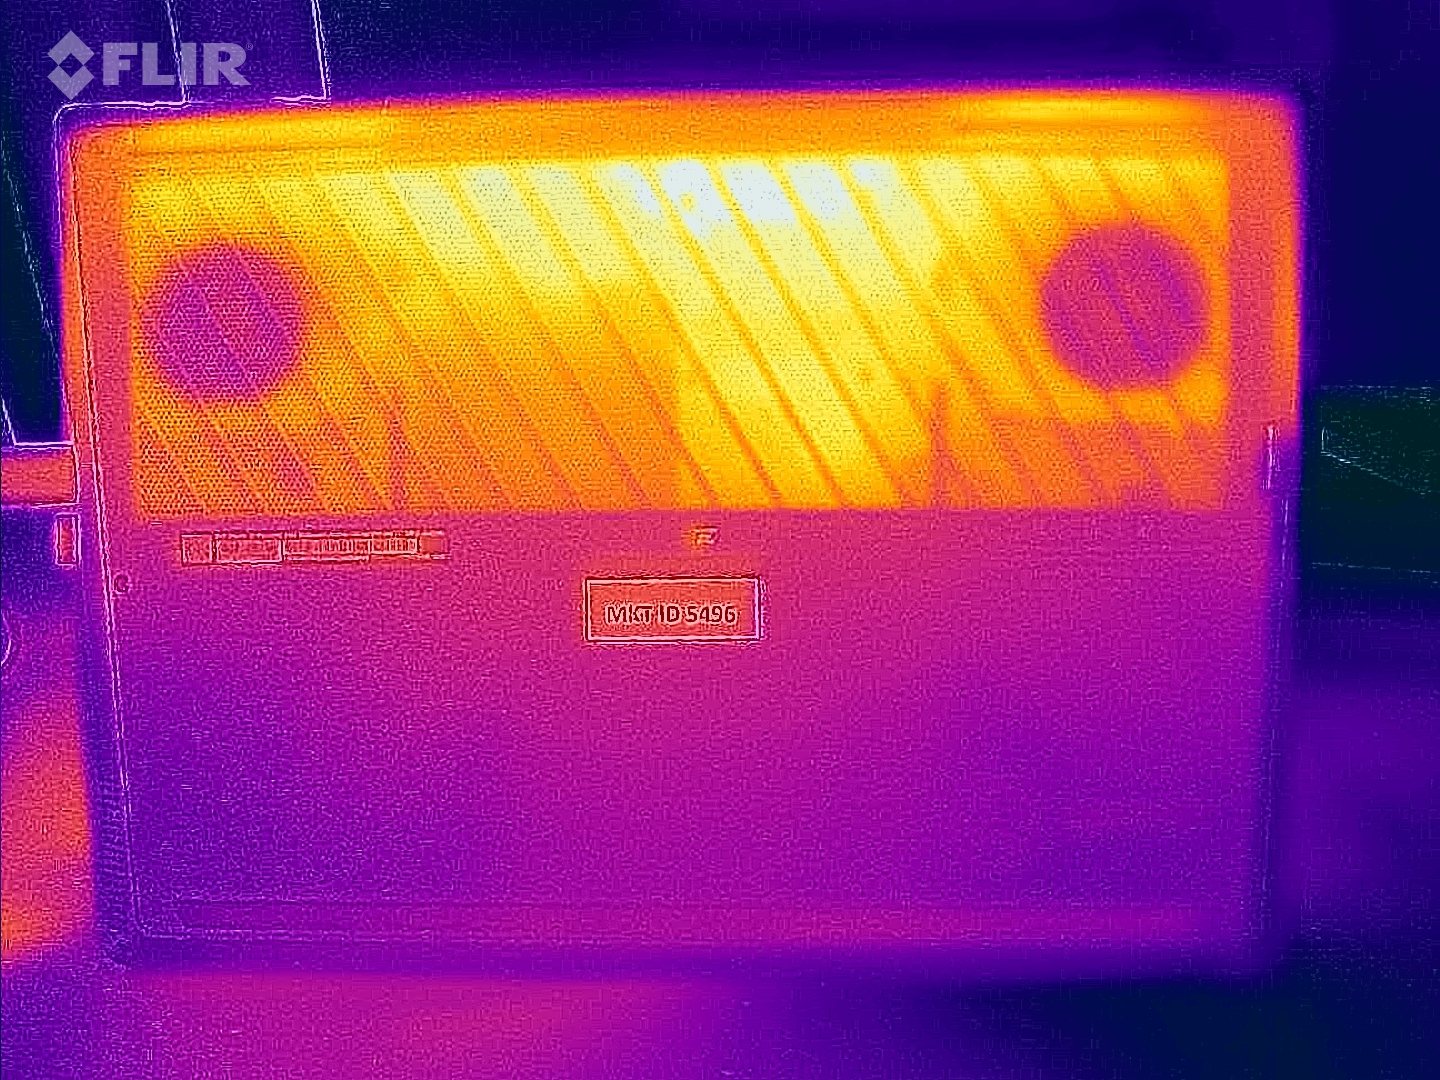
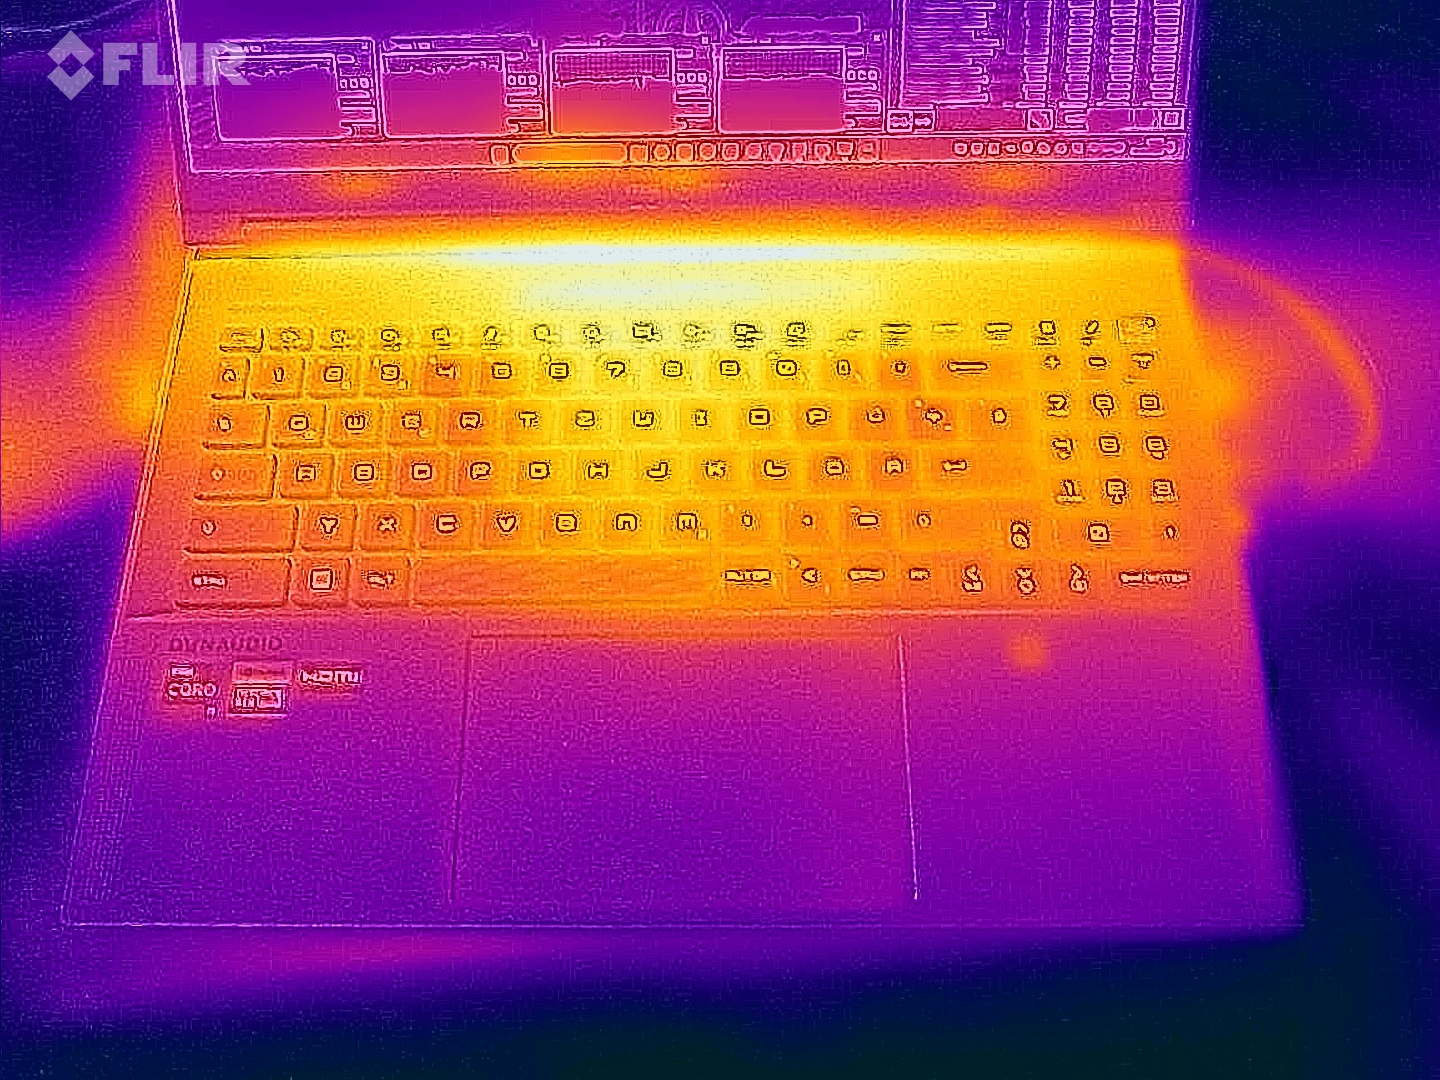
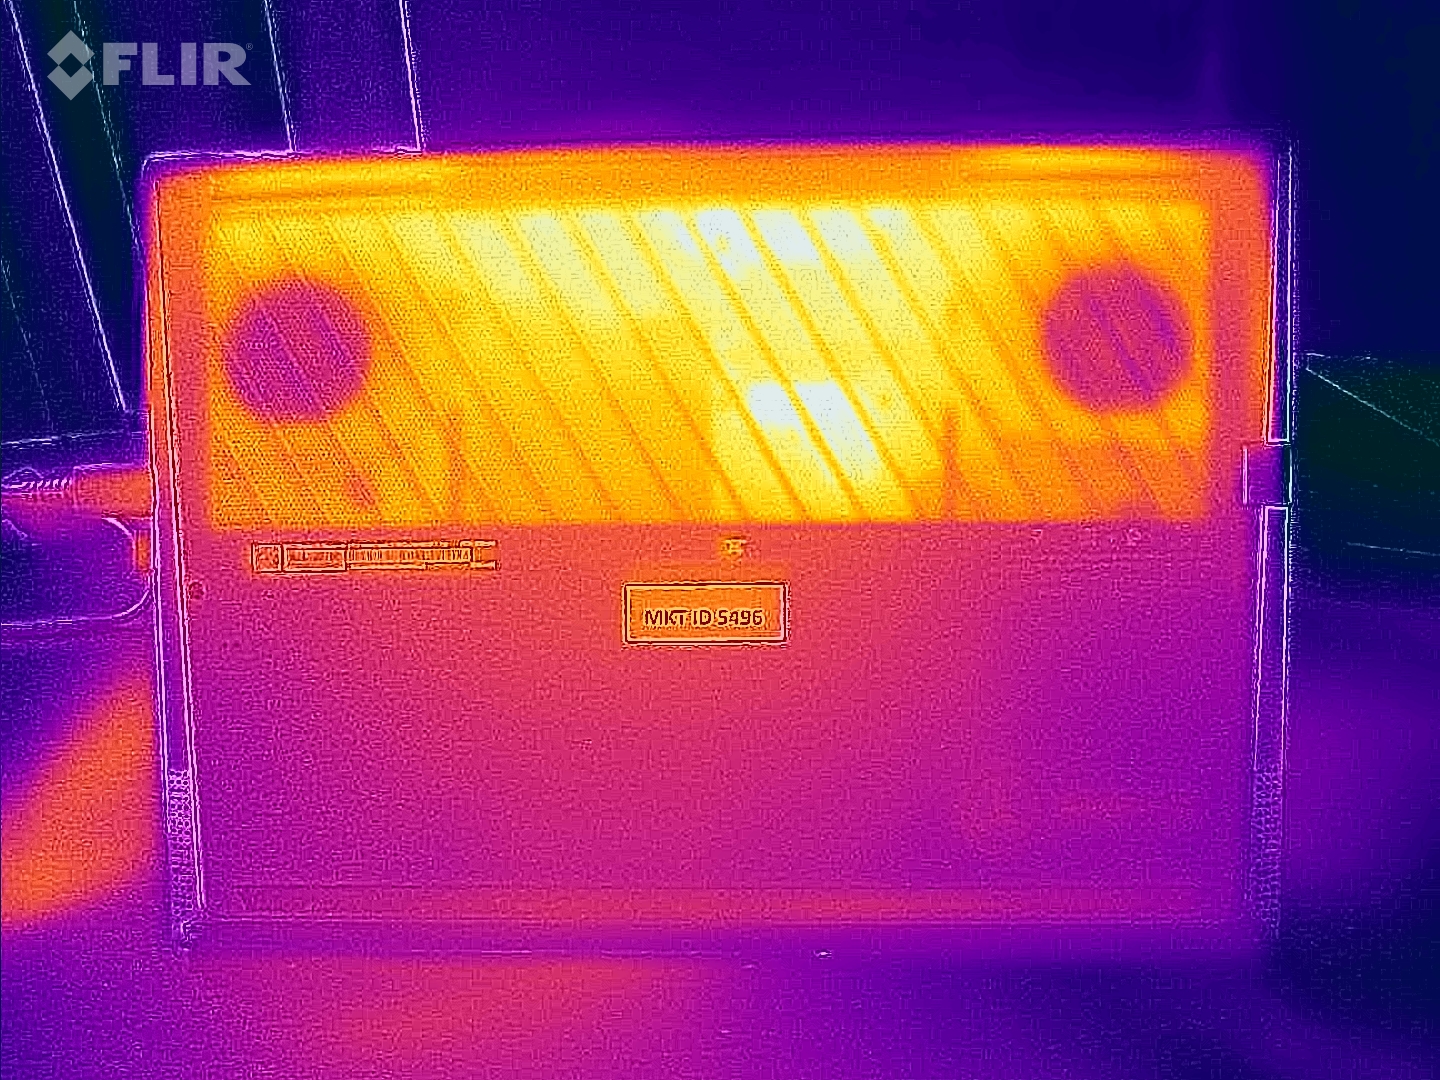
Temperaturerna ligger i mellanområdet, med maximalt 120,2 ° F på toppen och 125,6 ° F på botten. Även om dessa inte är låga, är de fortfarande rimligt acceptabla för den installerade hårdvaran, särskilt eftersom palmområdet förblir behagligt svalt.
(-) Den maximala temperaturen på ovansidan är 49 °C / 120 F, jämfört med genomsnittet av 40.4 °C / 105 F , allt från 21.2 till 68.8 °C för klassen Gaming.
(-) Botten värms upp till maximalt 52 °C / 126 F, jämfört med genomsnittet av 43.2 °C / 110 F
(+) Vid tomgångsbruk är medeltemperaturen för ovansidan 29.1 °C / 84 F, jämfört med enhetsgenomsnittet på 33.9 °C / ### class_avg_f### F.
(-) När du spelar The Witcher 3 är medeltemperaturen för ovansidan 40 °C / 104 F, jämfört med enhetsgenomsnittet på 33.9 °C / ## #class_avg_f### F.
(+) Handledsstöden och pekplattan når maximal hudtemperatur (32 °C / 89.6 F) och är därför inte varma.
(-) Medeltemperaturen för handledsstödsområdet på liknande enheter var 28.8 °C / 83.8 F (-3.2 °C / -5.8 F).
| MSI Stealth 16 Mercedes-AMG Motorsport A13VG i9-13900H, GeForce RTX 4070 Laptop GPU | MSI Stealth 16 Studio A13VG i7-13700H, GeForce RTX 4070 Laptop GPU | Schenker XMG Pro 16 Studio (Mid 23) i9-13900H, GeForce RTX 4070 Laptop GPU | HP Omen Transcend 16 i9-13900HX, GeForce RTX 4070 Laptop GPU | Lenovo Legion Pro 5 16ARX8 R7 7745HX, GeForce RTX 4070 Laptop GPU | Schenker XMG CORE 16 (L23) R7 7840HS, GeForce RTX 4070 Laptop GPU | |
|---|---|---|---|---|---|---|
| Heat | -17% | -11% | 6% | 14% | 6% | |
| Maximum Upper Side * (°C) | 49 | 60 -22% | 55 -12% | 47.4 3% | 41.8 15% | 46 6% |
| Maximum Bottom * (°C) | 52 | 61 -17% | 66 -27% | 54.4 -5% | 41.4 20% | 44 15% |
| Idle Upper Side * (°C) | 32 | 38.2 -19% | 33 -3% | 28.4 11% | 29 9% | 32 -0% |
| Idle Bottom * (°C) | 34 | 37.7 -11% | 35 -3% | 29.2 14% | 30.4 11% | 33 3% |
* ... mindre är bättre
Stresstest
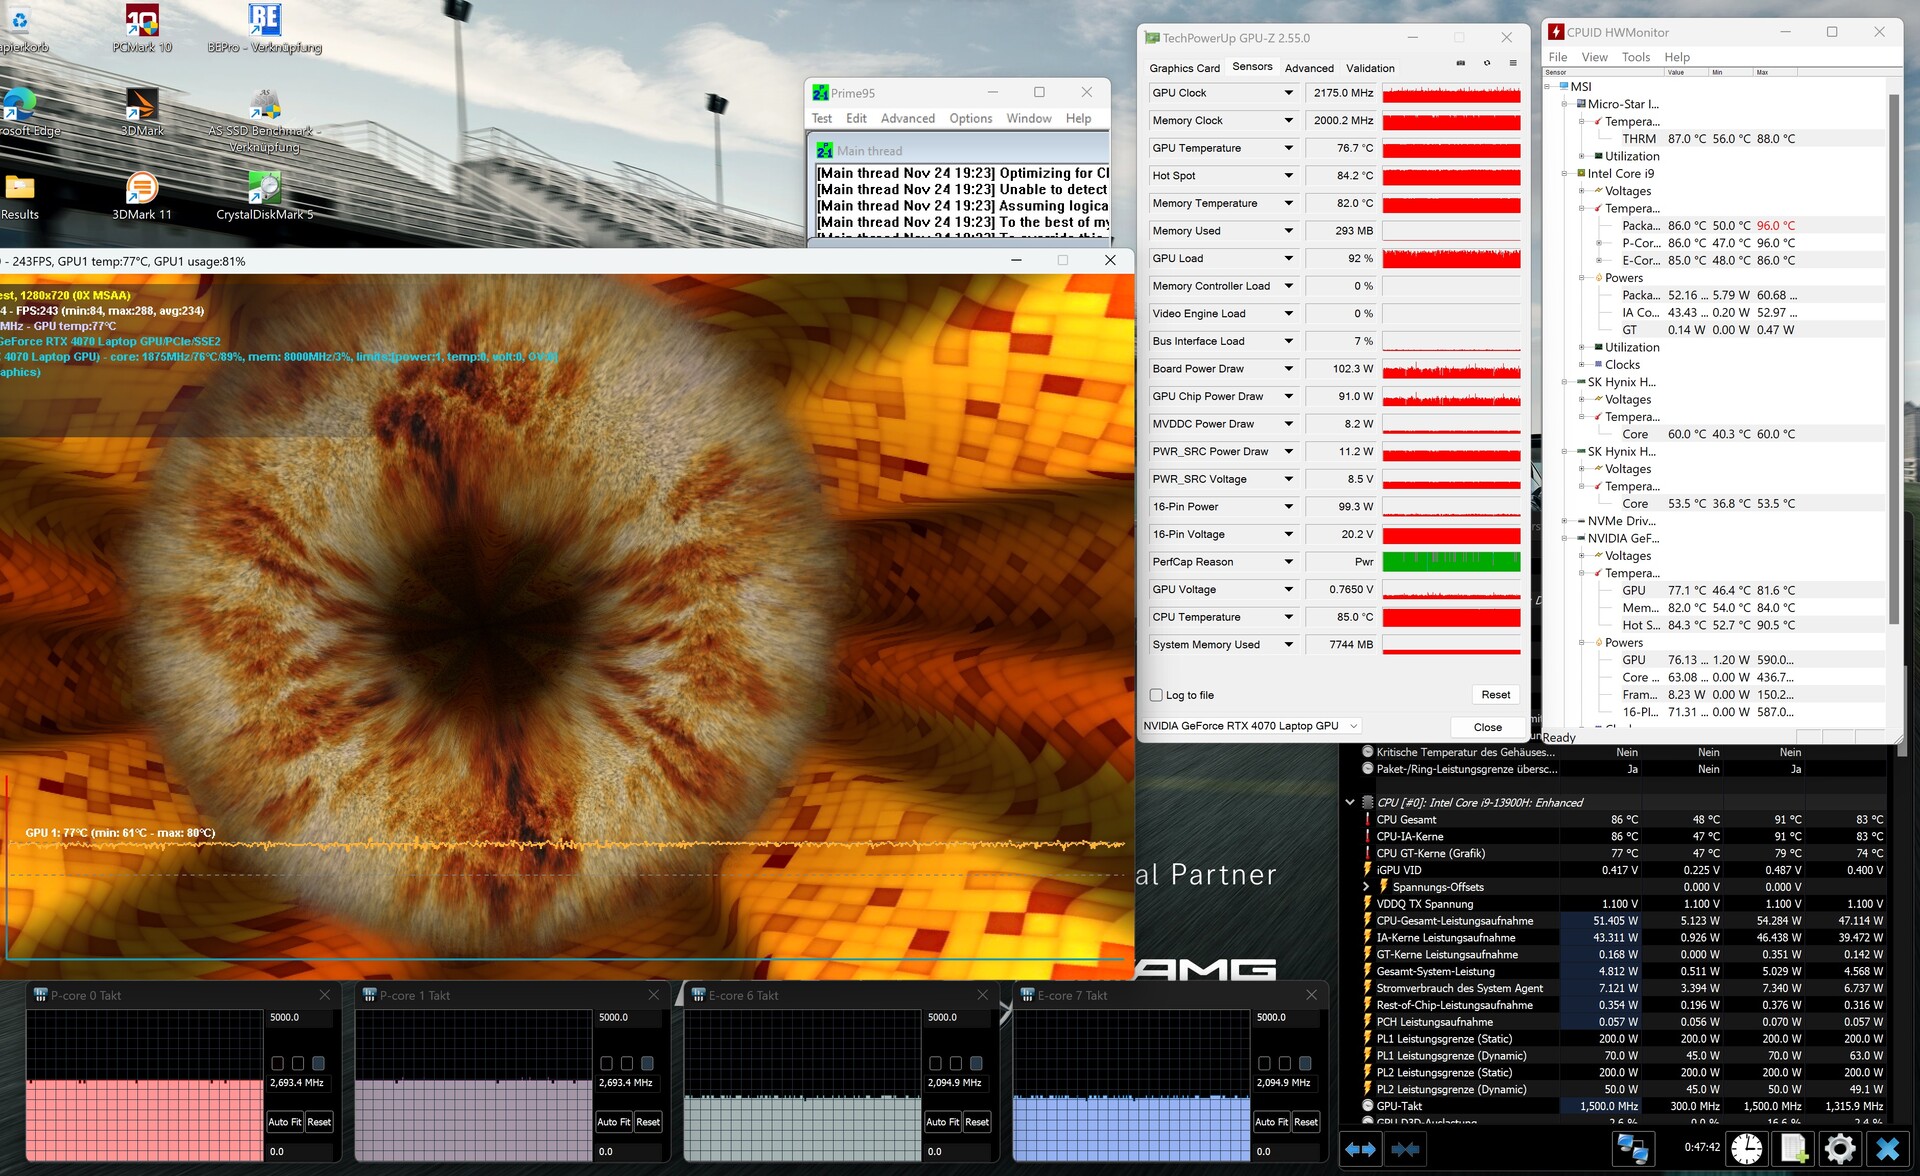
Under stresstestet med Furmark och Prime95 höll RTX 4070 cirka 183,2 °F (GPU-klocka ~2 175 MHz), och Core i9-13900H nådde cirka 186,8 °F (P-kärnor ~2,7 GHz, E-kärnor ~2,1 GHz), vilket båda är acceptabla.
Högtalare
MSI Stealth 16 Mercedes-AMG Motorsport A13VG ljudanalys
(+) | högtalare kan spela relativt högt (91 dB)
Bas 100 - 315 Hz
(-) | nästan ingen bas - i genomsnitt 18.1% lägre än medianen
(±) | linjäriteten för basen är genomsnittlig (7.3% delta till föregående frekvens)
Mellan 400 - 2000 Hz
(+) | balanserad mellan - endast 1.6% från medianen
(+) | mids är linjära (3.7% delta till föregående frekvens)
Högsta 2 - 16 kHz
(+) | balanserade toppar - endast 3.2% från medianen
(+) | toppar är linjära (2.6% delta till föregående frekvens)
Totalt 100 - 16 000 Hz
(+) | det totala ljudet är linjärt (11.8% skillnad mot median)
Jämfört med samma klass
» 11% av alla testade enheter i den här klassen var bättre, 4% liknande, 85% sämre
» Den bästa hade ett delta på 6%, genomsnittet var 18%, sämst var 132%
Jämfört med alla testade enheter
» 9% av alla testade enheter var bättre, 3% liknande, 89% sämre
» Den bästa hade ett delta på 4%, genomsnittet var 23%, sämst var 134%
HP Omen Transcend 16 ljudanalys
(+) | högtalare kan spela relativt högt (82.3 dB)
Bas 100 - 315 Hz
(-) | nästan ingen bas - i genomsnitt 20% lägre än medianen
(±) | linjäriteten för basen är genomsnittlig (14.3% delta till föregående frekvens)
Mellan 400 - 2000 Hz
(±) | högre mellan - i genomsnitt 5.2% högre än median
(+) | mids är linjära (3.7% delta till föregående frekvens)
Högsta 2 - 16 kHz
(+) | balanserade toppar - endast 2% från medianen
(+) | toppar är linjära (6.7% delta till föregående frekvens)
Totalt 100 - 16 000 Hz
(±) | linjäriteten för det totala ljudet är genomsnittlig (17% skillnad mot median)
Jämfört med samma klass
» 45% av alla testade enheter i den här klassen var bättre, 12% liknande, 43% sämre
» Den bästa hade ett delta på 6%, genomsnittet var 18%, sämst var 132%
Jämfört med alla testade enheter
» 31% av alla testade enheter var bättre, 8% liknande, 61% sämre
» Den bästa hade ett delta på 4%, genomsnittet var 23%, sämst var 134%
Energiförvaltning
Strömförbrukning
Tack vare grafikomkopplingen arbetar 16-tumsenheten effektivt i viloläge och förbrukar mellan 11 och 28 watt (genomsnitt 14 watt), vilket överensstämmer med de flesta konkurrenterna. Under belastning drar AMG-utgåvan från 83 watt (medelvärde i 3DMark 06) till 204 watt (maxvärde i stresstestet). Det medföljande 240-watts nätaggregatet, prytt med en motorsportlogotyp, är lämpligt dimensionerat för dessa krav.
| Av/Standby | |
| Låg belastning | |
| Hög belastning |
|
Förklaring:
min: | |
| MSI Stealth 16 Mercedes-AMG Motorsport A13VG i9-13900H, GeForce RTX 4070 Laptop GPU | MSI Stealth 16 Studio A13VG i7-13700H, GeForce RTX 4070 Laptop GPU | Schenker XMG Pro 16 Studio (Mid 23) i9-13900H, GeForce RTX 4070 Laptop GPU | HP Omen Transcend 16 i9-13900HX, GeForce RTX 4070 Laptop GPU | Lenovo Legion Pro 5 16ARX8 R7 7745HX, GeForce RTX 4070 Laptop GPU | Schenker XMG CORE 16 (L23) R7 7840HS, GeForce RTX 4070 Laptop GPU | Genomsnitt av klass Gaming | |
|---|---|---|---|---|---|---|---|
| Power Consumption | -2% | 2% | -63% | -16% | -1% | -20% | |
| Idle Minimum * (Watt) | 11 | 11 -0% | 8 27% | 19.2 -75% | 8.1 26% | 11 -0% | 13 ? -18% |
| Idle Average * (Watt) | 14 | 18 -29% | 12 14% | 22.7 -62% | 15.9 -14% | 15.2 -9% | 19 ? -36% |
| Idle Maximum * (Watt) | 28 | 19 32% | 23 18% | 55.4 -98% | 37.2 -33% | 16 43% | 24.6 ? 12% |
| Load Average * (Watt) | 83 | 91 -10% | 94 -13% | 128.4 -55% | 90.9 -10% | 64 23% | 110.7 ? -33% |
| Witcher 3 ultra * (Watt) | 140 | 130 7% | 181.5 -30% | 206 -47% | 189.6 -35% | 179 -28% | |
| Load Maximum * (Watt) | 204 | 228 -12% | 215 -5% | 292 -43% | 263.5 -29% | 280 -37% | 259 ? -27% |
* ... mindre är bättre
Power consumption Witcher 3 / stress test
Power consumption with external monitor
Batteritid
På grund av Core i9-13900H och OLED-panelen är körtiderna för Motorsport Edition något svagare jämfört med standardversionen. Att klara knappt 6,5 timmars internetsurfande med ljusstyrkan reducerad till 150 cd/m² är fortfarande mer än godkänt för en bärbar speldator. Batteriet, som är generöst tilltaget med 99 Wh, bidrar till dessa respektabla siffror.
| MSI Stealth 16 Mercedes-AMG Motorsport A13VG i9-13900H, GeForce RTX 4070 Laptop GPU, 99.99 Wh | MSI Stealth 16 Studio A13VG i7-13700H, GeForce RTX 4070 Laptop GPU, 99.9 Wh | Schenker XMG Pro 16 Studio (Mid 23) i9-13900H, GeForce RTX 4070 Laptop GPU, 73 Wh | HP Omen Transcend 16 i9-13900HX, GeForce RTX 4070 Laptop GPU, 97 Wh | Lenovo Legion Pro 5 16ARX8 R7 7745HX, GeForce RTX 4070 Laptop GPU, 80 Wh | Schenker XMG CORE 16 (L23) R7 7840HS, GeForce RTX 4070 Laptop GPU, 99 Wh | Genomsnitt av klass Gaming | |
|---|---|---|---|---|---|---|---|
| Batteridrifttid | 20% | 5% | -35% | -38% | 29% | 9% | |
| WiFi v1.3 (h) | 6.5 | 7.8 20% | 6.8 5% | 4.2 -35% | 4 -38% | 8.4 29% | 7.11 ? 9% |
| Reader / Idle (h) | 11 | 6.3 | 6.5 | 8.27 ? | |||
| H.264 (h) | 7.7 | 10.2 | 8.32 ? | ||||
| Load (h) | 2.4 | 1.2 | 1 | 2.4 | 1.502 ? |
För
Emot
Dom
Utöver de framgångsrika designelementen delar Mercedes-AMG Motorsport-utgåvan av Stealth 16 nästan samma styrkor och svagheter som standardversionen (se det fullständiga testet). Lyckligtvis överväger de positiva aspekterna de negativa.
På den positiva sidan har den bärbara datorn ett behagligt lätt och kompakt men ändå robust fodral, kraftfullt ljud och relativt bra inmatningsenheter. Avdragen kommer främst i form av ett B-betyg på grund av SSD: s strypning över tiden och den något begränsade USB-anslutningen (endast en typ A-port).
Att välja mellan OLED-panelen i Motorsport-versionen och IPS-skärmen beror på personliga preferenser.
OLED-panelen erbjuder enastående bildvärden (svartnivå, kontrast, färgrymd, betraktningsvinkel, responstid), men den har en reflekterande yta, en blygsam frekvens (60 Hz) och potentiellt flimmer.
Sammantaget får den ändå betyget "mycket bra". Alternativen inkluderar Intel-drivna bärbara datorer som HP Omen Transcend 16 och Schenker XMG Pro 16 som nämns i artikeln. För AMD-entusiaster är Lenovo Legion Pro 5 och Schenker XMG Core 16, som båda får betyget "mycket bra", värda att överväga.
Pris och tillgänglighet
MSI Stealth 16 Mercedes-AMG Motorsport A13VG kostar 2 899 USD och kan köpas direkt från MSI.
MSI Stealth 16 Mercedes-AMG Motorsport A13VG
- 11/28/2023 v7 (old)
Florian Glaser
Genomskinlighet
Valet av enheter som ska granskas görs av vår redaktion. Testprovet gavs till författaren som ett lån av tillverkaren eller återförsäljaren för denna recension. Långivaren hade inget inflytande på denna recension och inte heller fick tillverkaren en kopia av denna recension innan publiceringen. Det fanns ingen skyldighet att publicera denna recension. Som ett oberoende medieföretag är Notebookcheck inte föremål för auktoritet från tillverkare, återförsäljare eller förlag.
This is how Notebookcheck is testingEvery year, Notebookcheck independently reviews hundreds of laptops and smartphones using standardized procedures to ensure that all results are comparable. We have continuously developed our test methods for around 20 years and set industry standards in the process. In our test labs, high-quality measuring equipment is utilized by experienced technicians and editors. These tests involve a multi-stage validation process. Our complex rating system is based on hundreds of well-founded measurements and benchmarks, which maintains objectivity.
Price comparison

