Alienware m16 R2 laptop recension: Stora och riskabla förändringar

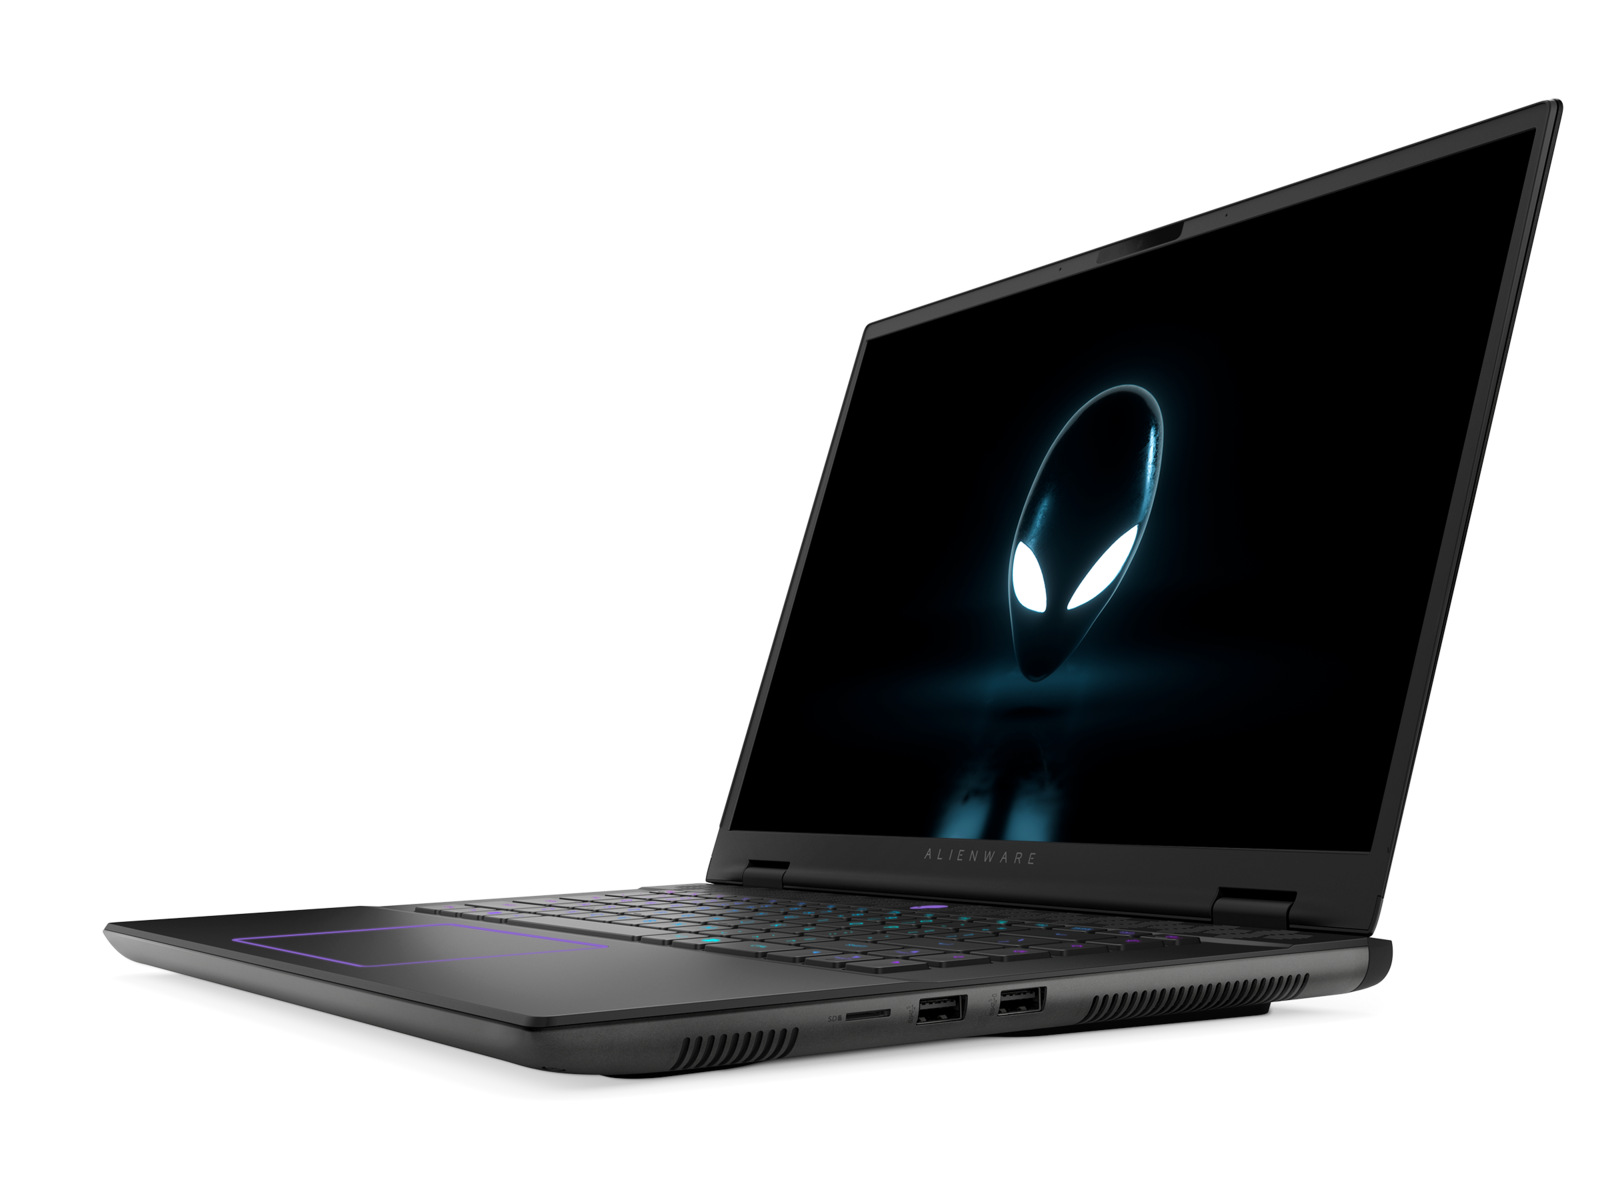
Alienware m16 R2 är en efterföljare till m16 R1men inte på det sätt som du kanske förväntar dig. Den nya modellen är en fullständig omdesign och omprövning av m16-serien i ett försök att locka både spelare och allmänna användare medan andra Alienware-produkter är inriktade på hardcore-spelare. Bara detta gör m16 R2 till en av de mest intressanta bärbara Alienware-datorerna på flera år eftersom den offrar några avancerade CPU- och GPU-alternativ som annars var tillgängliga på m16 R1 till förmån för en mindre design.
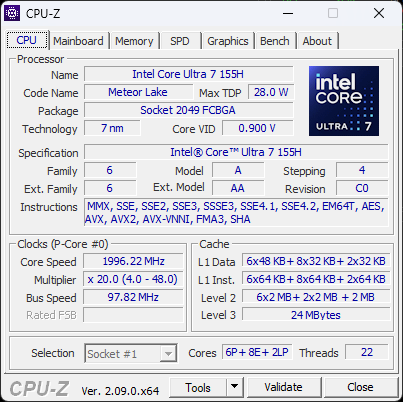
Vår granskningsenhet är en avancerad konfiguration med Meteor Lake-H Core Ultra 7 155H CPU, GeForce RTX 4070 GPU och 1600p 240 Hz IPS-skärm för cirka $1850 USD. SKU:er i lägre prisklasser kan konfigureras med RTX 4050 eller 4060 istället och SKU:er i högre prisklasser inkluderar Core Ultra 9, men alla konfigurationer är annars begränsade till samma 1600p240 IPS-skärm och endast upp till RTX 4070.
Alternativ till Alienware m16 R2 inkluderar andra högpresterande 16-tums bärbara datorer som Razer Blade 16, HP Omen Transcend 16, Asus ROG Zephyrus G16, eller Lenovo Legion Slim 7 16.
Fler recensioner av Alienware:
Potentiële concurrenten in vergelijking
Gradering | Datum | Modell | Vikt | Höjd | Storlek | Upplösning | Pris |
|---|---|---|---|---|---|---|---|
| 90.2 % v7 (old) | 03/2024 | Alienware m16 R2 Ultra 7 155H, GeForce RTX 4070 Laptop GPU | 2.5 kg | 23.5 mm | 16.00" | 2560x1600 | |
| 88.3 % v7 (old) | 09/2023 | Alienware m16 R1 Intel i7-13700HX, GeForce RTX 4060 Laptop GPU | 3 kg | 25.4 mm | 16.00" | 2560x1600 | |
| 88.4 % v7 (old) | 06/2023 | Alienware x16 R1 i9-13900HK, GeForce RTX 4080 Laptop GPU | 2.6 kg | 18.57 mm | 16.00" | 2560x1600 | |
| 88.4 % v7 (old) | 02/2024 | HP Omen Transcend 16-u1095ng i9-14900HX, GeForce RTX 4070 Laptop GPU | 2.3 kg | 20 mm | 16.00" | 2560x1600 | |
| 92.3 % v7 (old) | 02/2024 | Asus ROG Zephyrus G16 2024 GU605M Ultra 7 155H, GeForce RTX 4070 Laptop GPU | 1.8 kg | 16.4 mm | 16.00" | 2560x1600 | |
| 90.4 % v7 (old) | 11/2023 | Lenovo Legion Slim 7 16APH8 R7 7840HS, GeForce RTX 4060 Laptop GPU | 2.1 kg | 20 mm | 16.00" | 2560x1600 |
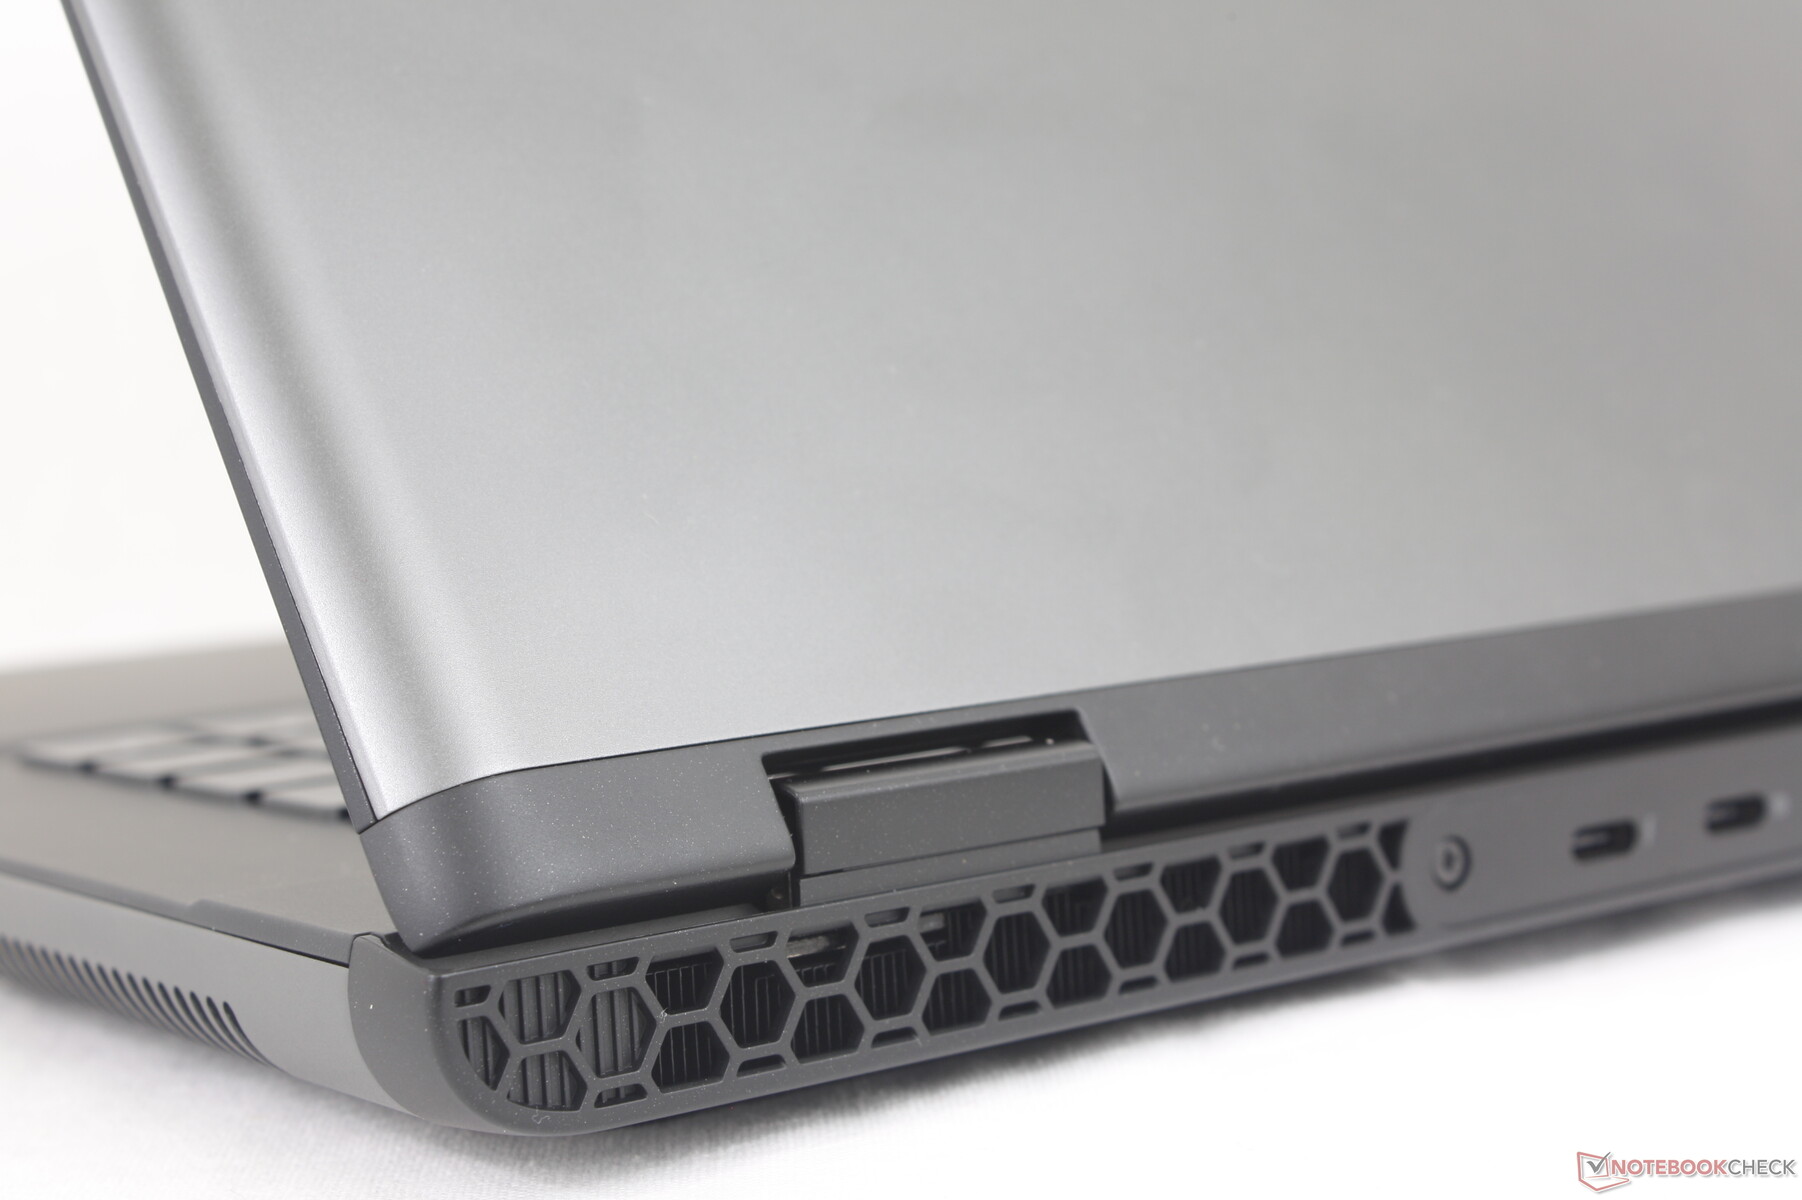
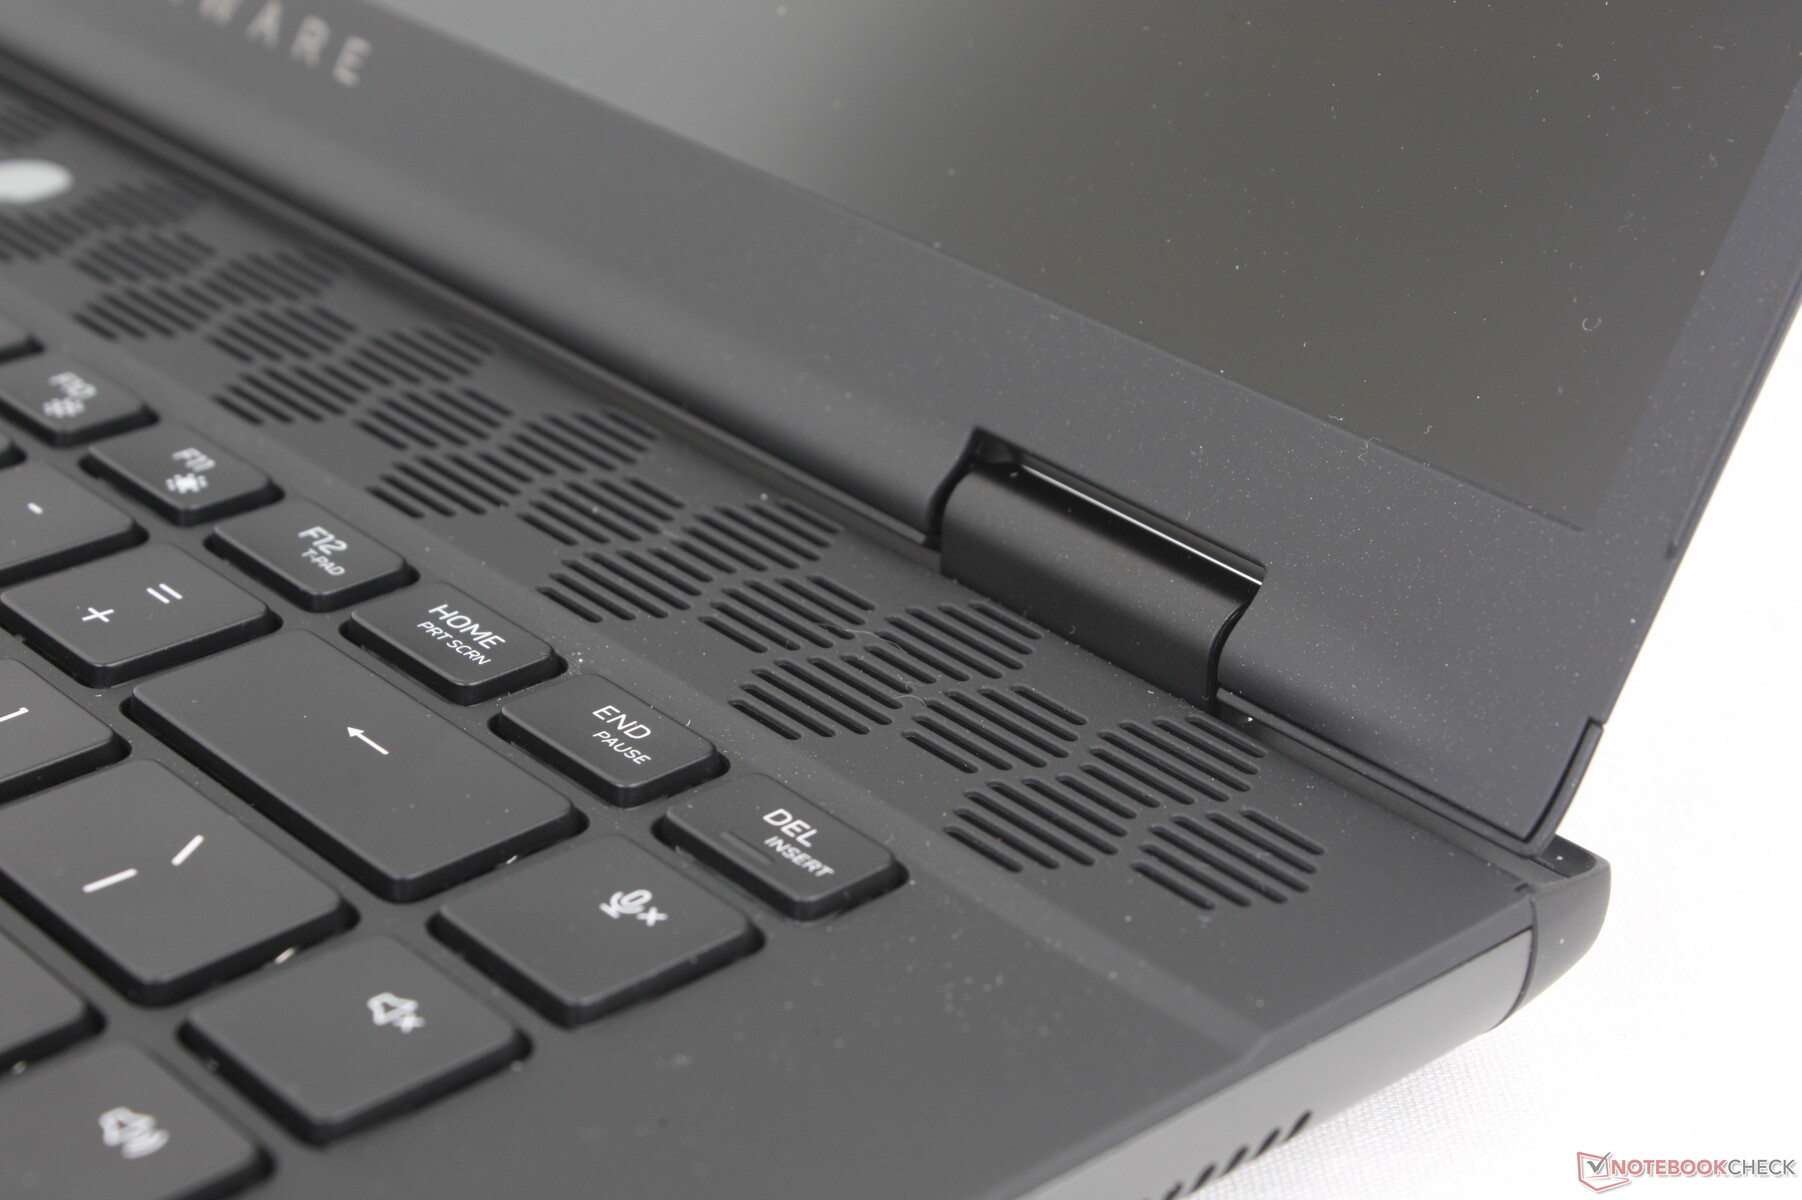
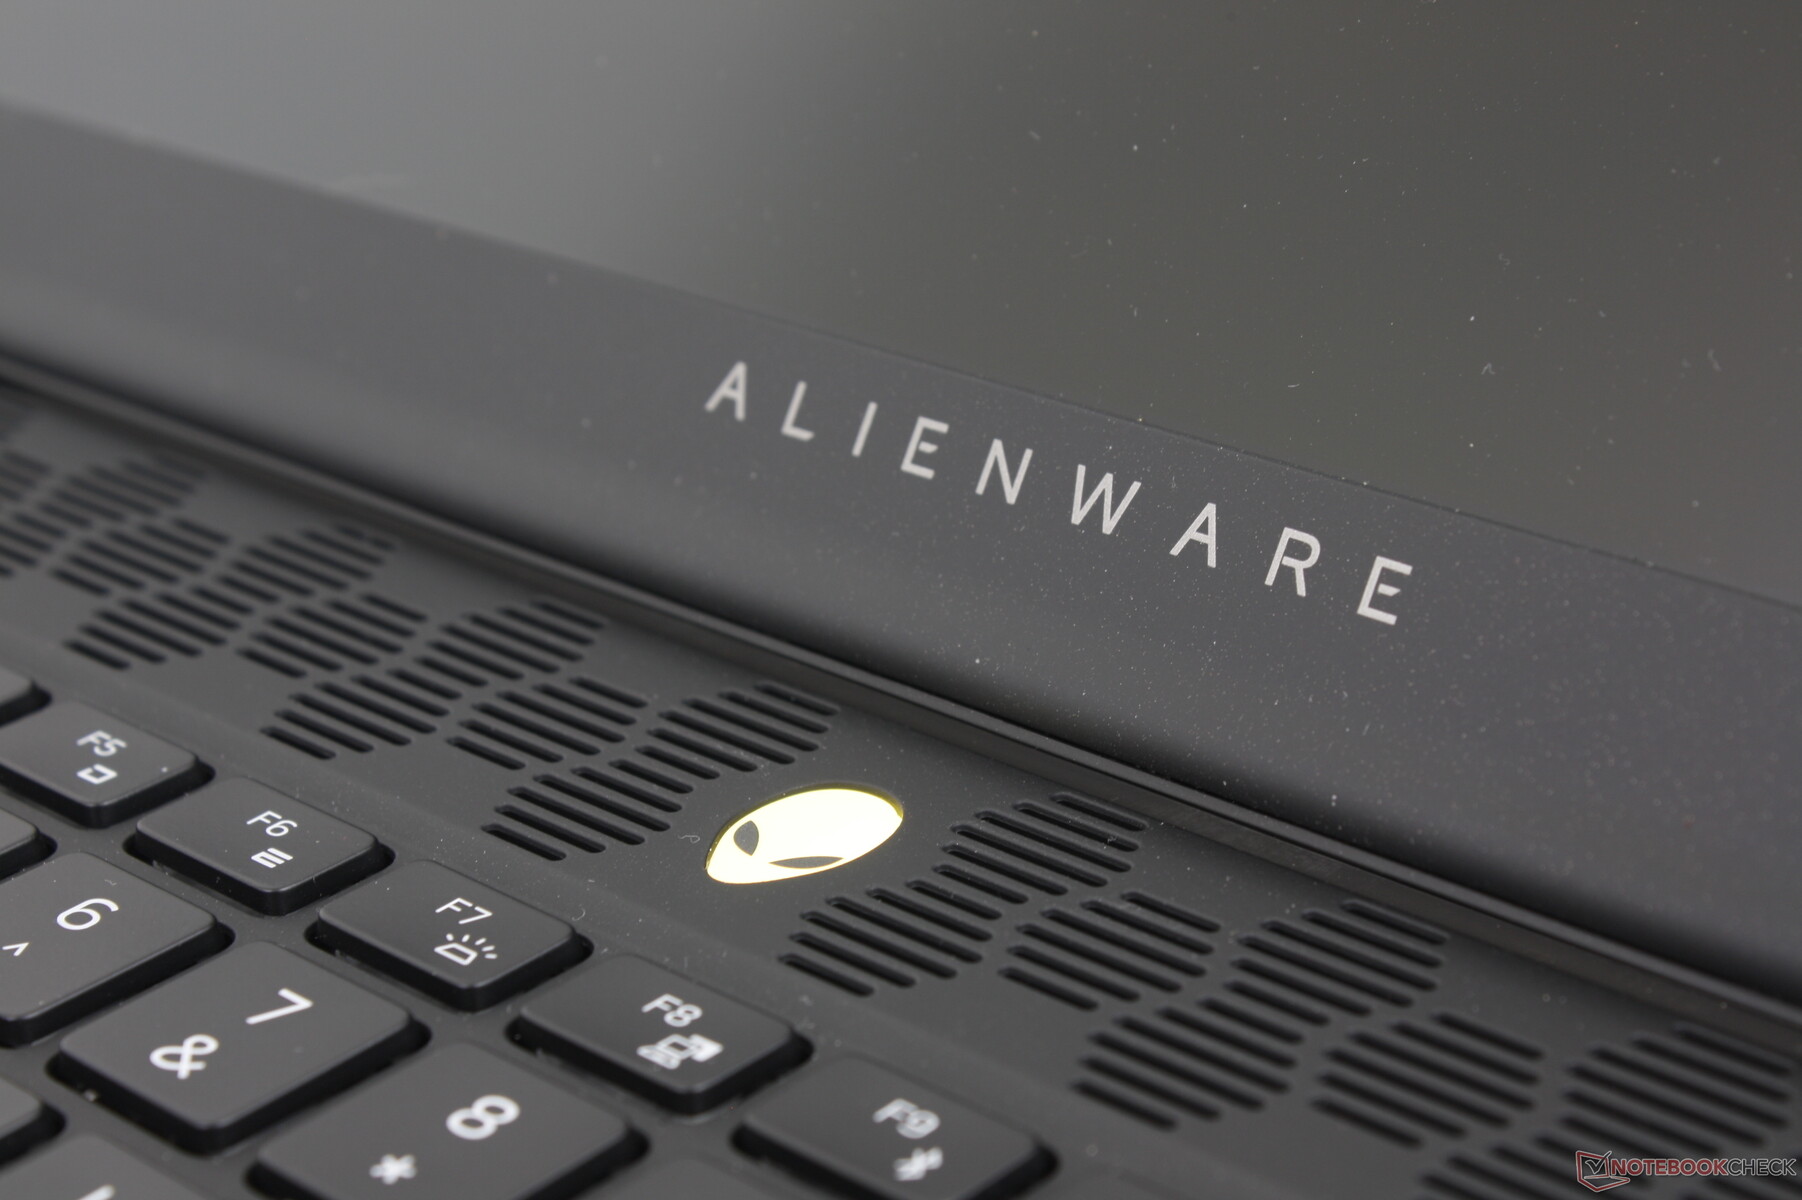
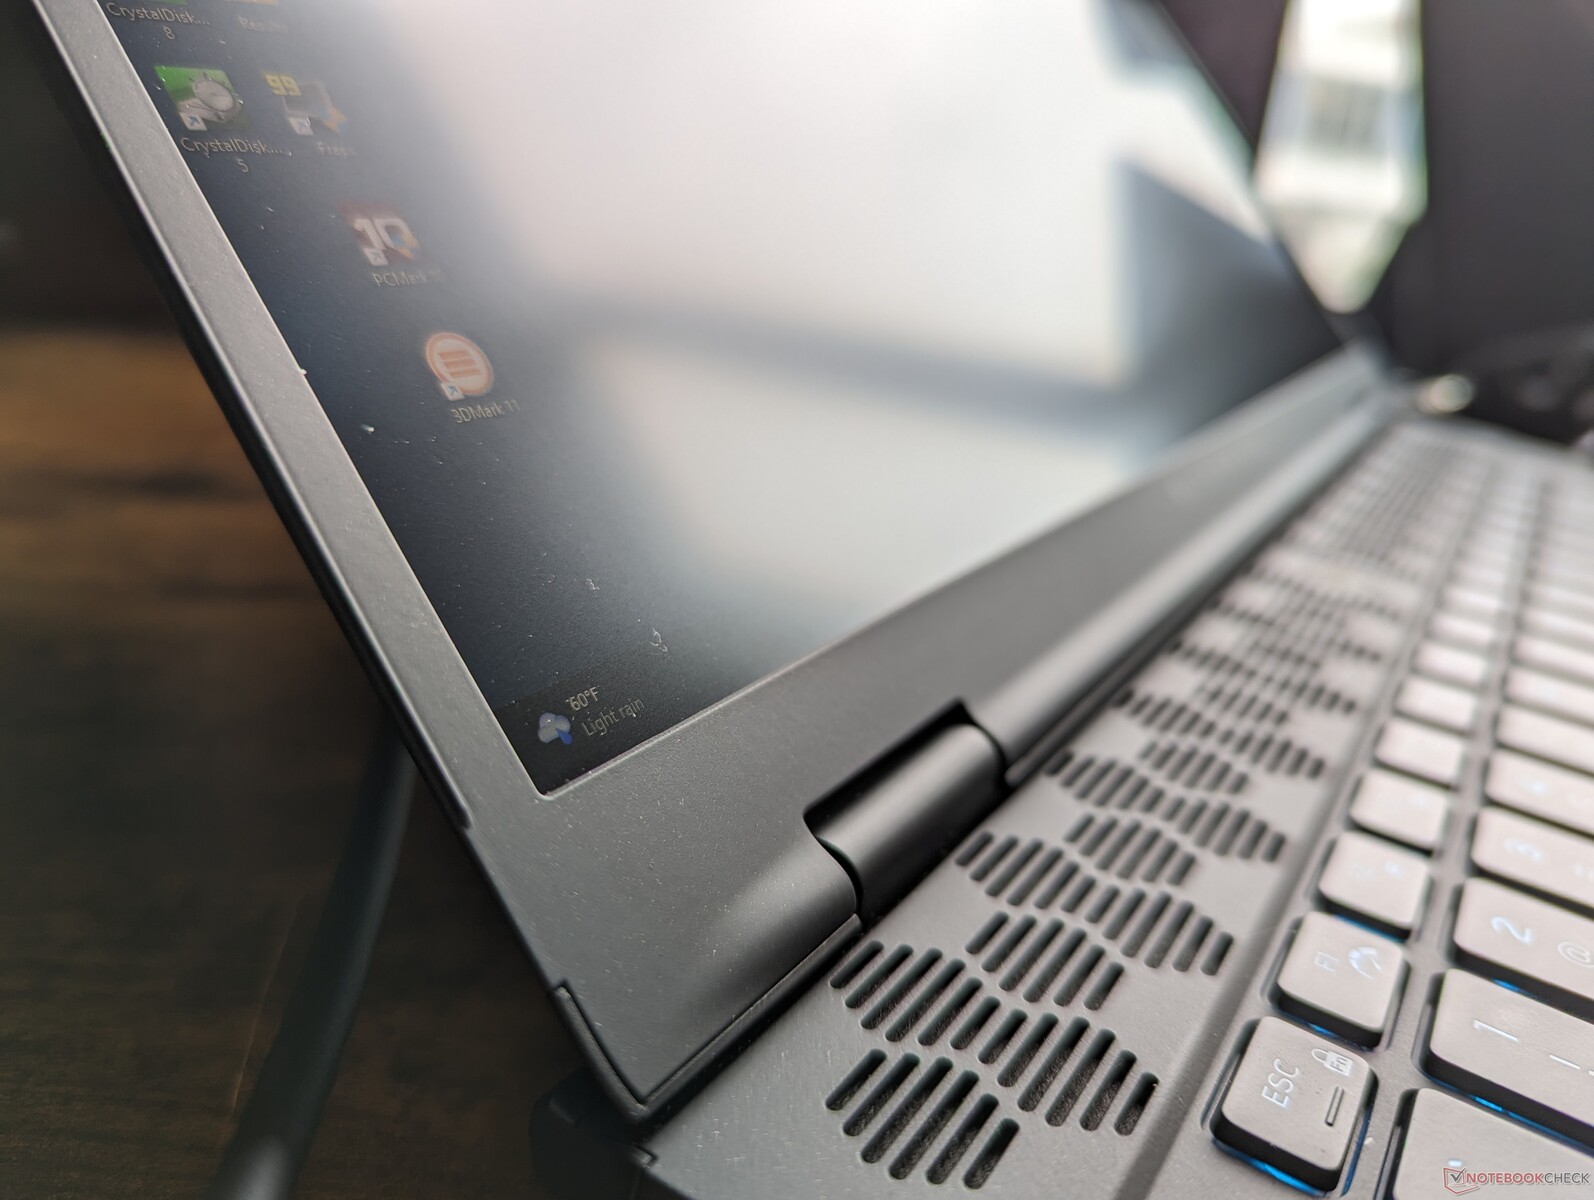
Case - Legend 3.0 omdefinierad
Alienware m16 R1 Alienware m16 R1 är inte ens ett år gammal och Dell introducerar redan en reviderad chassidesign med m16 R2. Den mest anmärkningsvärda förändringen innebär att det utskjutande termiska däcket längs baksidan tas bort för ett mycket mindre fotavtryck än tidigare. RGB LED-ringen på baksidan är nu borta och tangentbordet har flyttats uppåt för att göra plats för både större handledsstöd och en större klickplatta.
Chassimaterialen är i övrigt desamma som tidigare för liknande texturer och intryck. Styvheten har inte förändrats nämnvärt och därför känns enheten fortfarande ganska stark från topp till botten utan några större knakningar eller uppenbara svaga punkter.
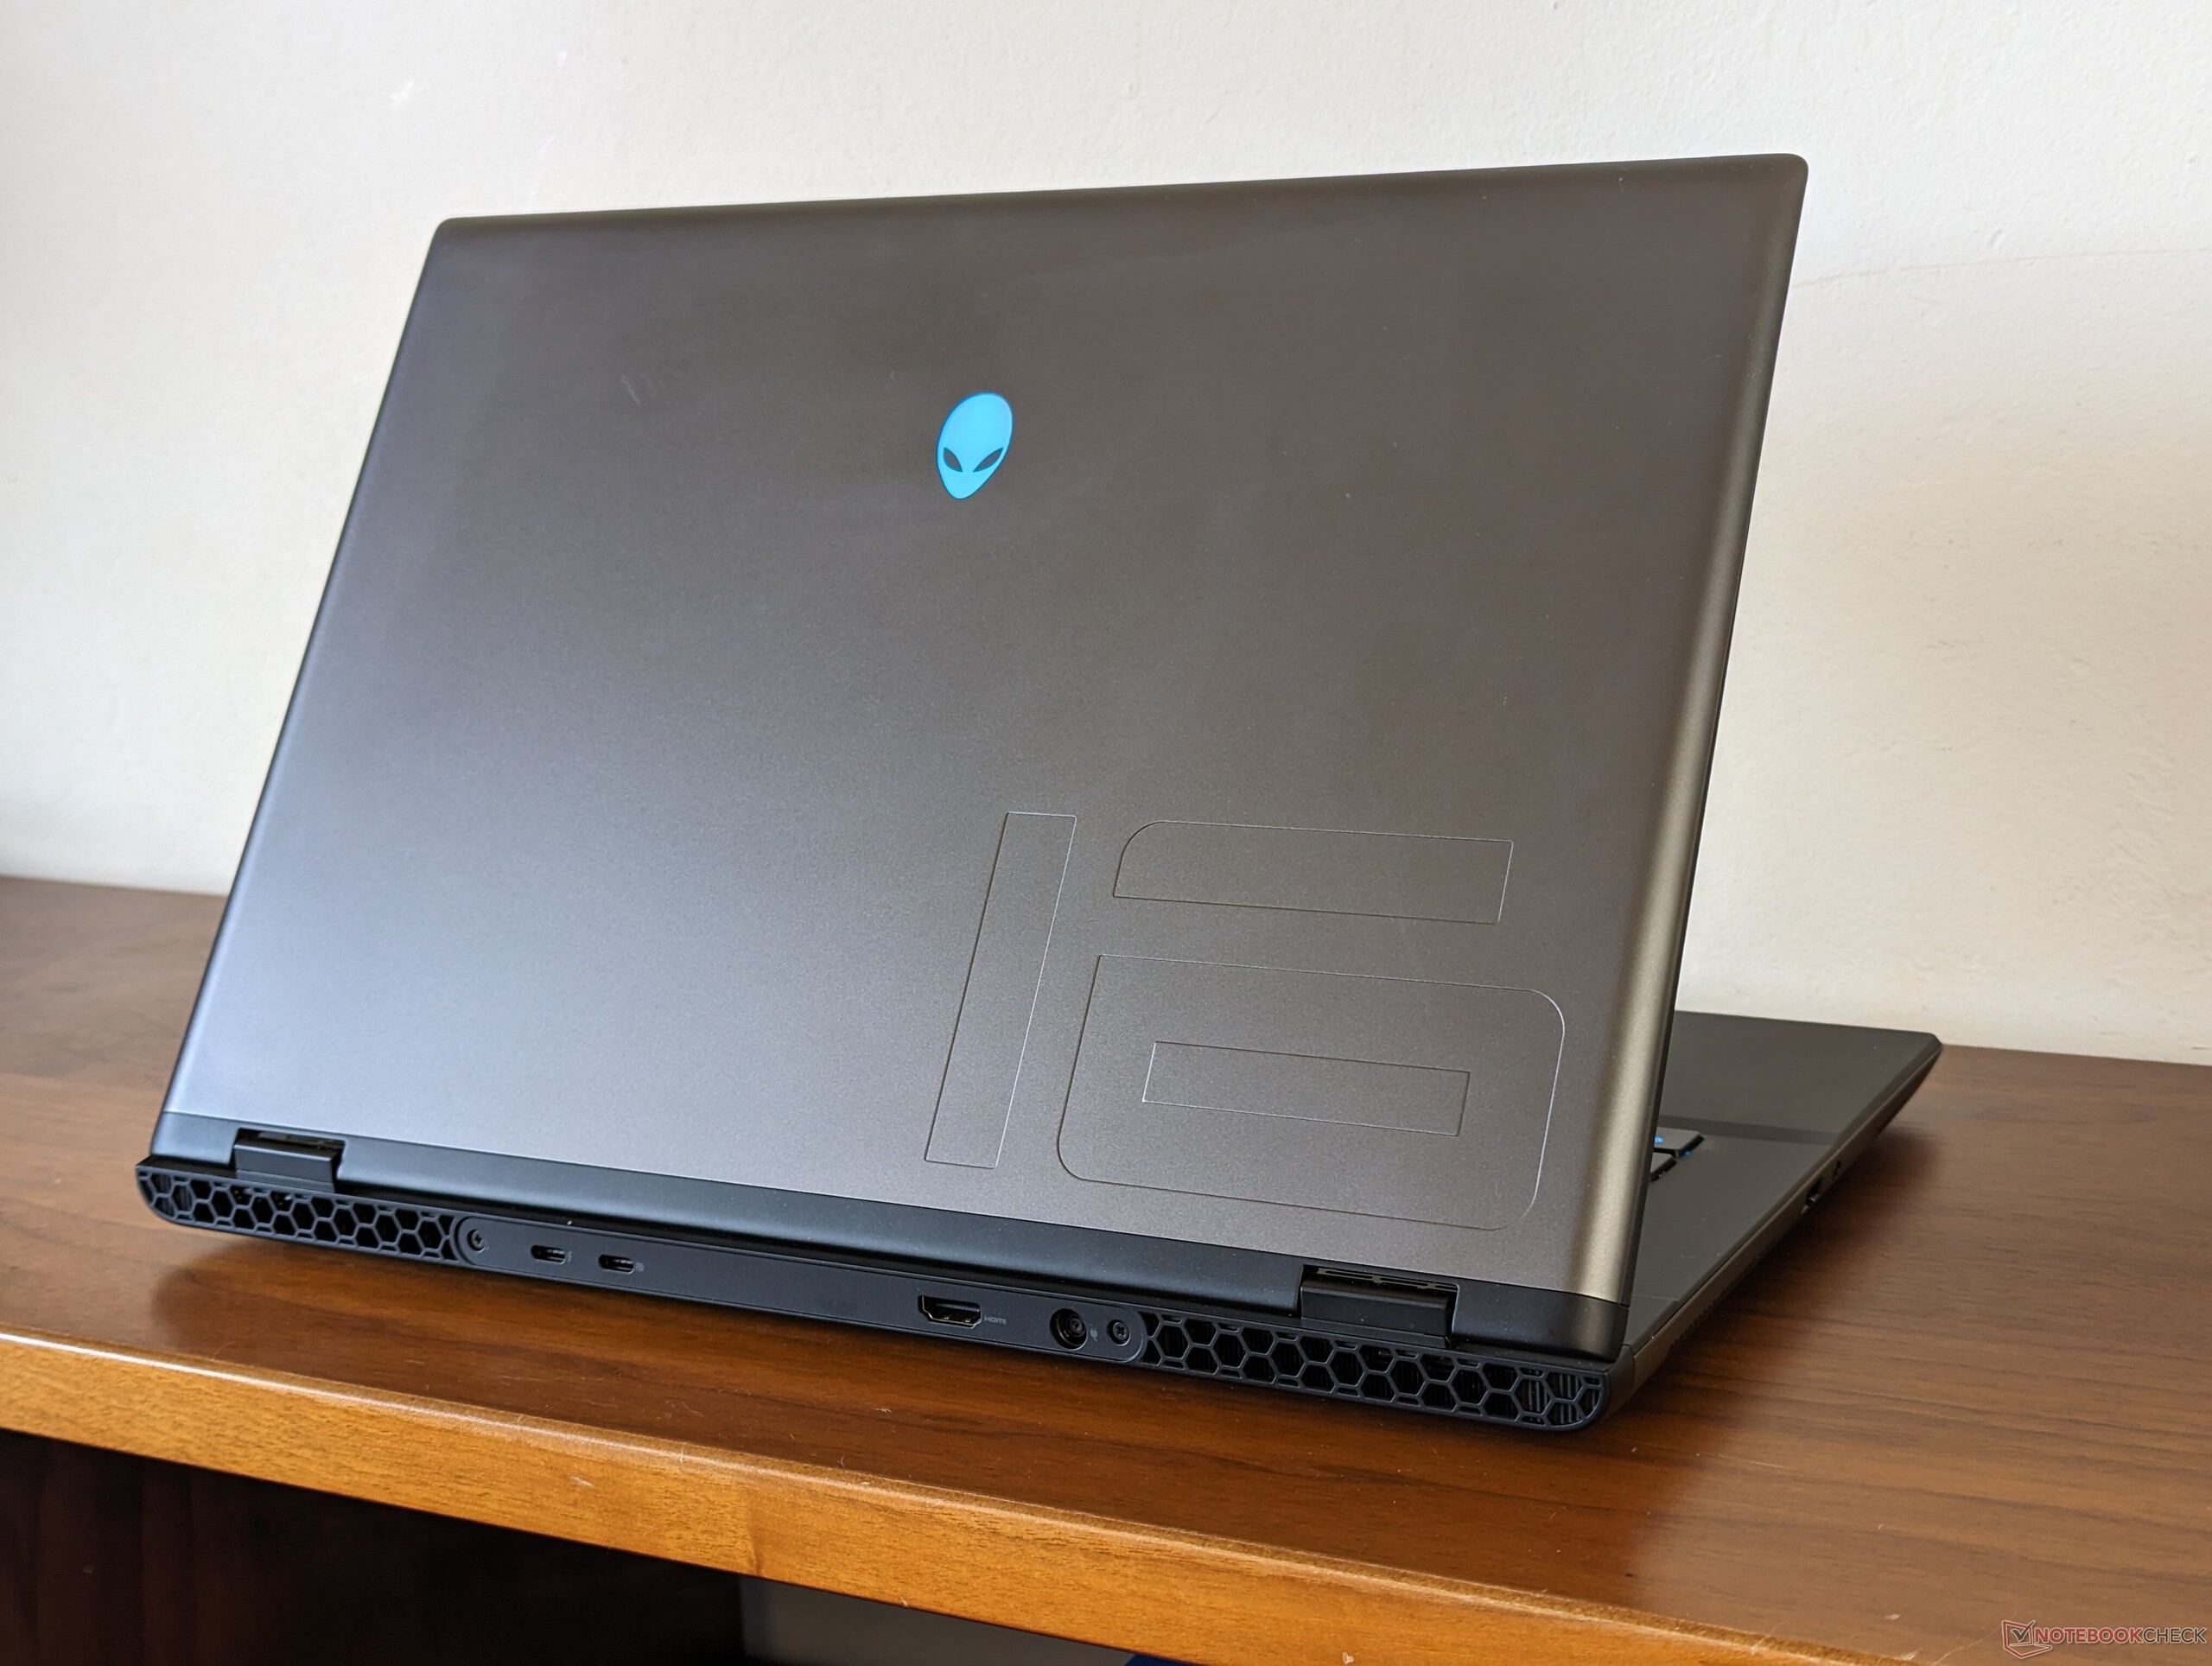
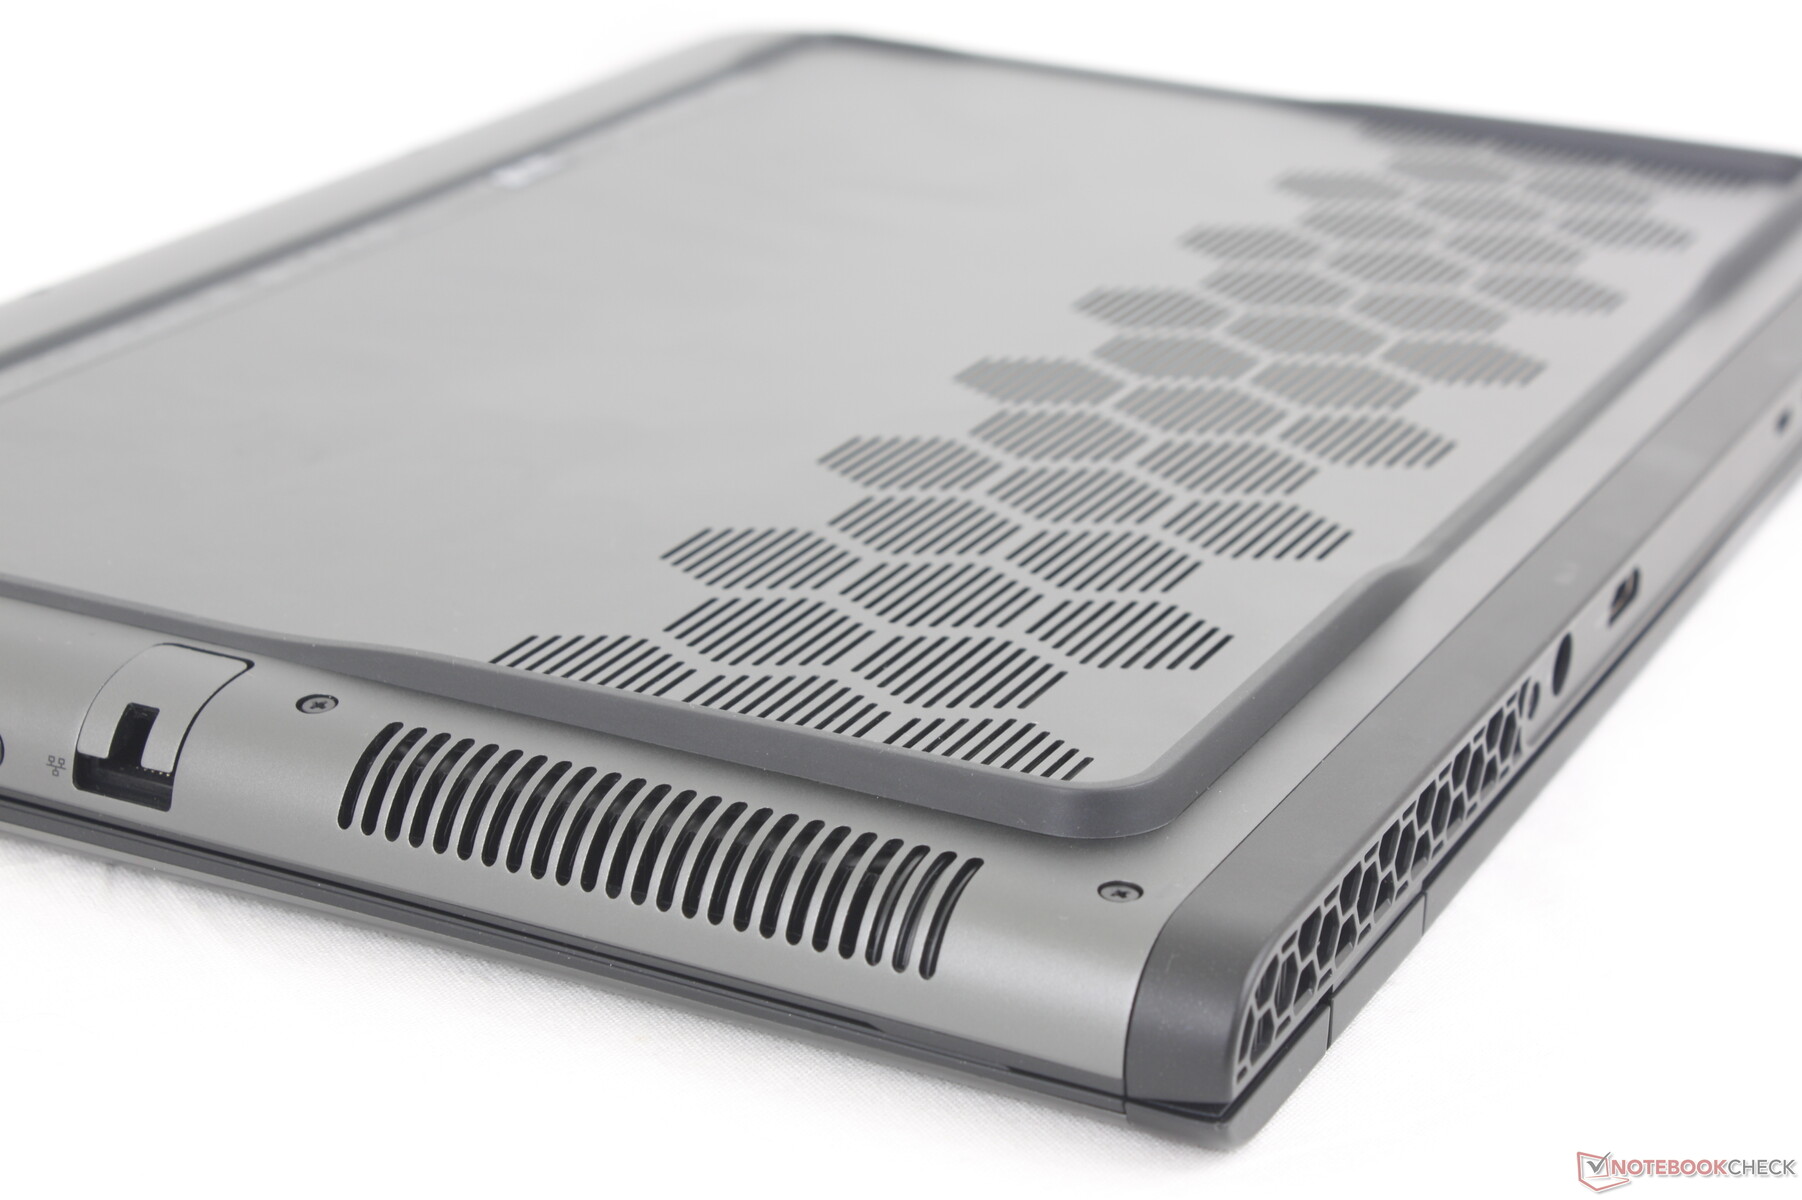
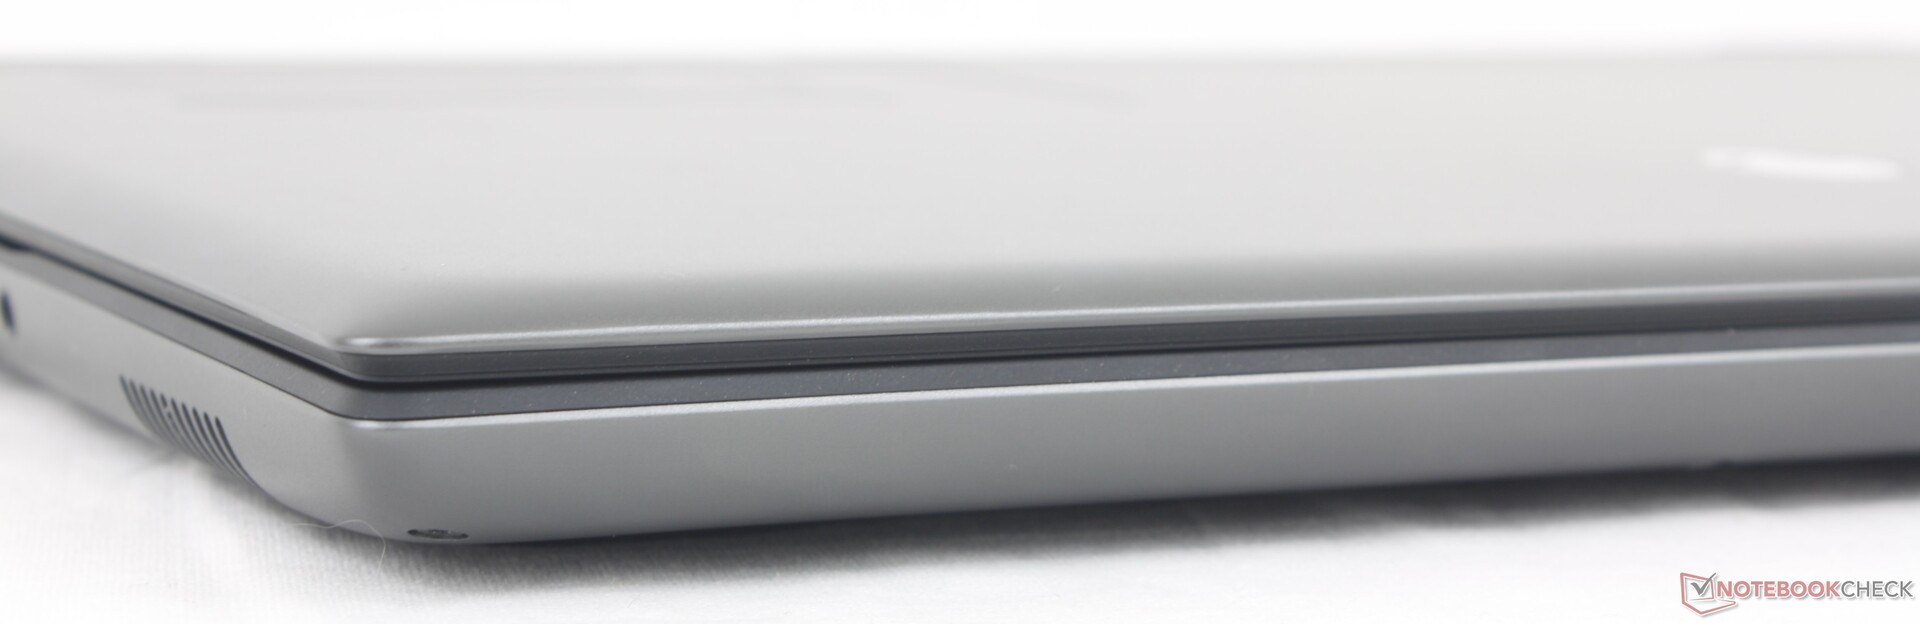
De betydande chassiförändringarna har resulterat i betydande minskningar av både vikt och mått. M16 R2 är cirka 17 procent lättare och 22 procent mindre än m16 R1, vilket ger bättre bärbarhet. Det mindre fotavtrycket gör också att systemet får plats i mindre ryggsäckar, eftersom de bredare dimensionerna hos den ursprungliga m16 R1 skulle kräva större väskor.
Minskningen av storleken är inte helt tillräcklig för att göra m16 R2 till den minsta i sin kategori eftersom både Razer Blade 16 och Asus Zephyrus G16 fortfarande är lättare och mindre.
Anslutningsmöjligheter - alla grunderna finns här
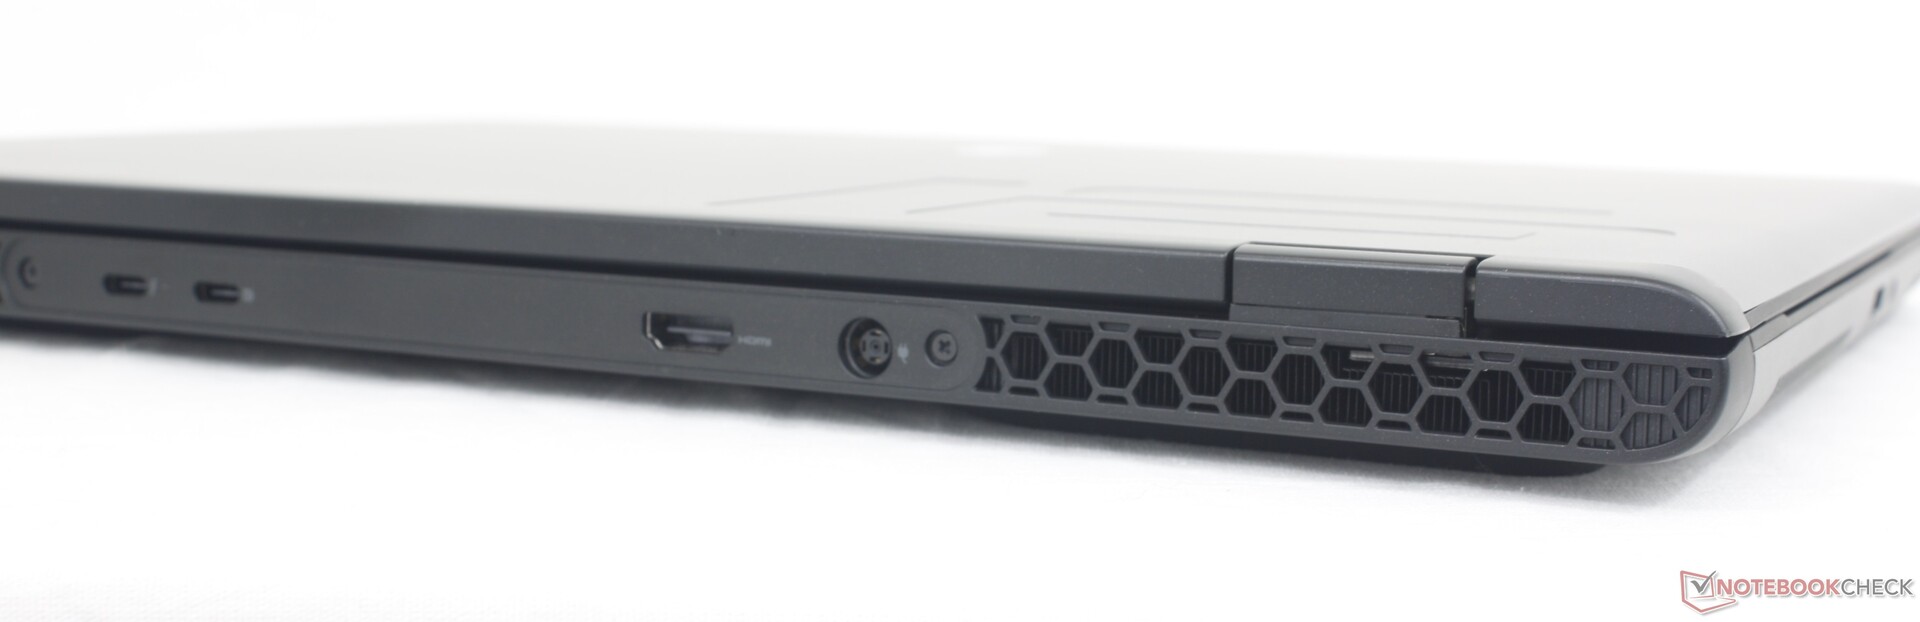
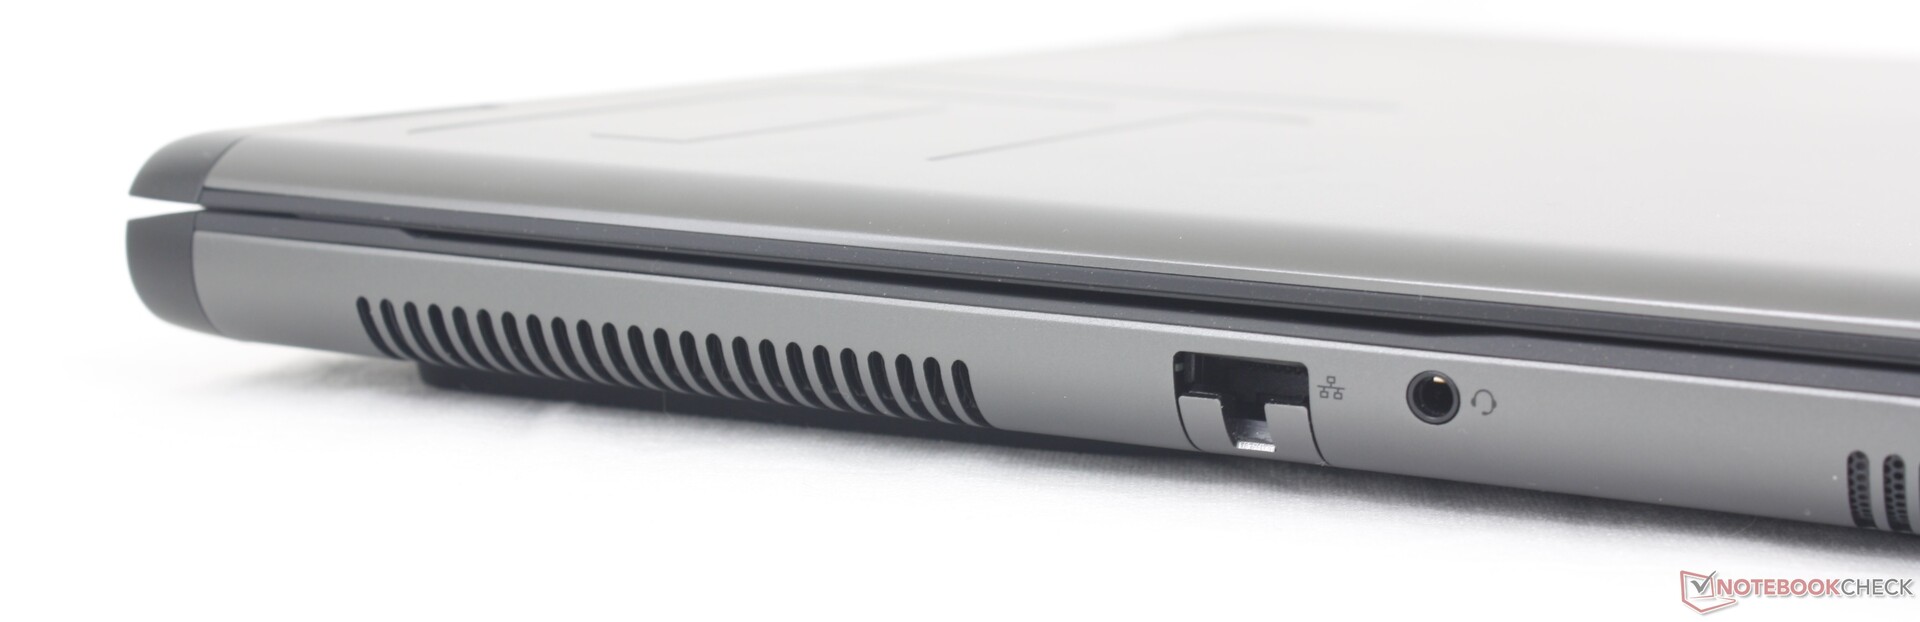
Alla portar från förra årets m16 R1 har återvänt utan mini-DisplayPort. Portplaceringen har ändrats med RJ-45 och ljuduttaget flyttade till vänsterkanten medan de flesta portarna på m16 R1 var olämpligt placerade längs baksidan.
Tänk på att endast en av de två USB-C-portarna har stöd för Power Delivery. Båda är i övrigt kompatibla med externa bildskärmar.
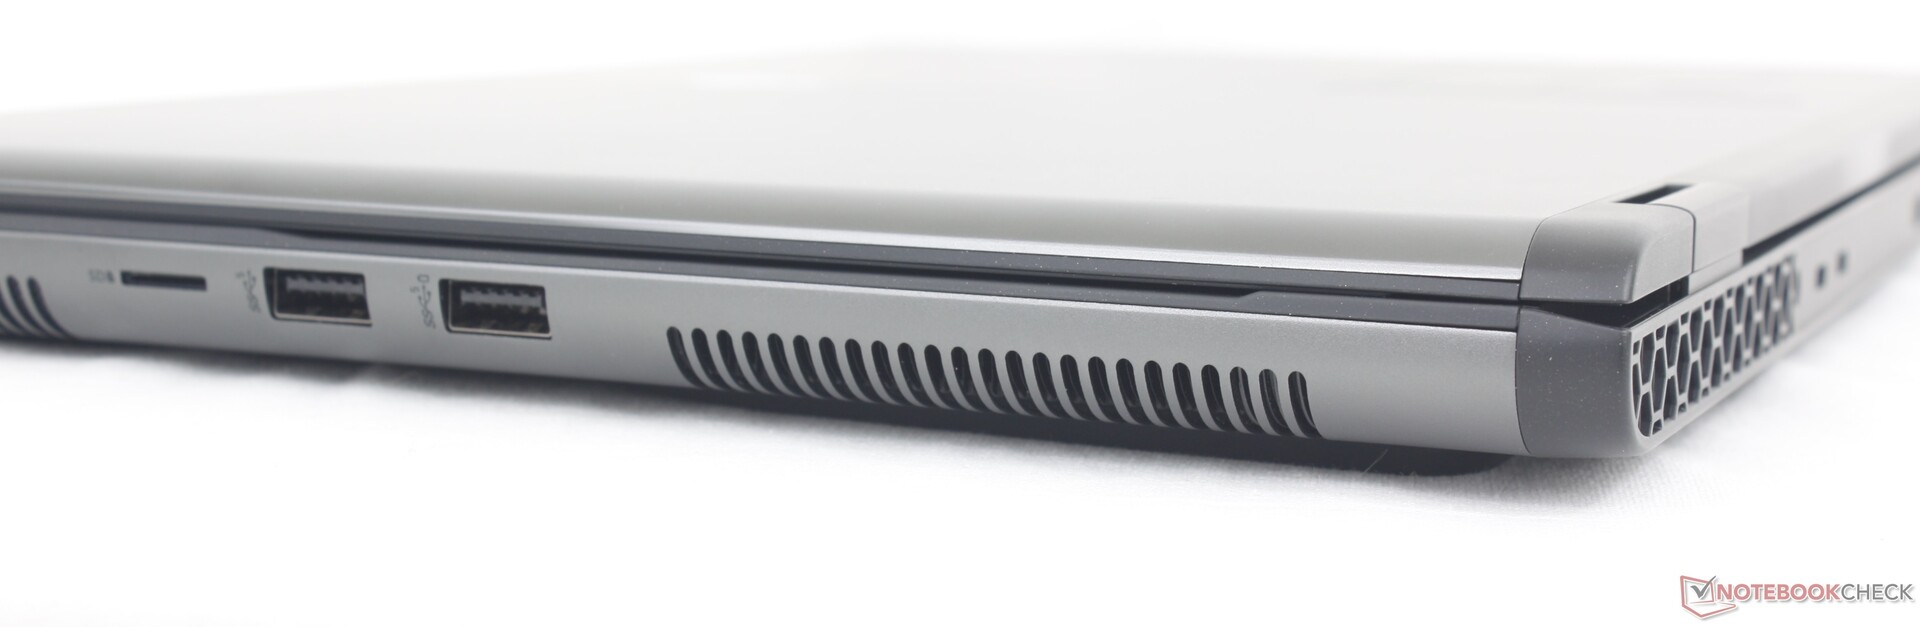
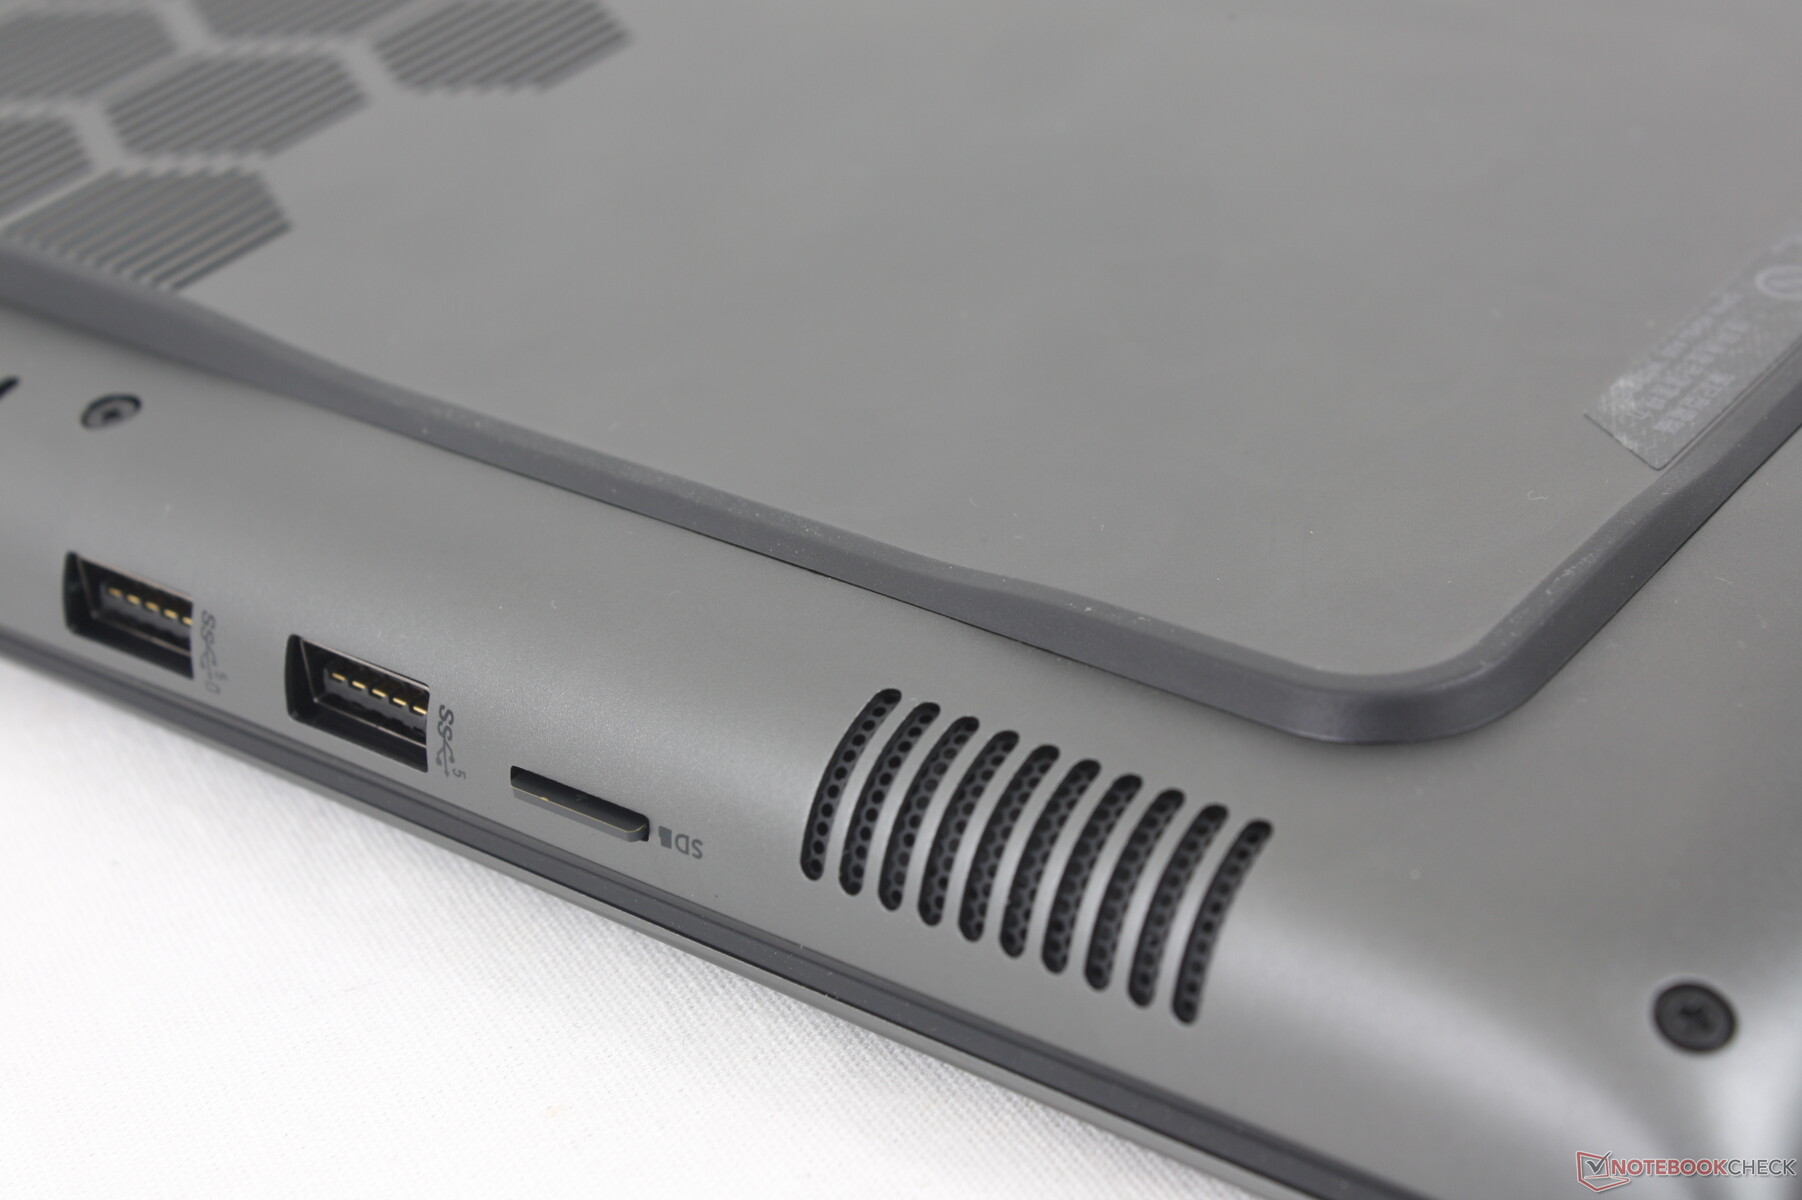
SD-kortläsare
Medan m16 R1 hade en SD-läsare i full storlek, har m16 R2 tyvärr gått tillbaka till en MicroSD-läsare istället, vilket kan irritera vissa innehållsskapare. Överföringshastigheterna är ändå ungefär desamma som de vi registrerade på m16 R1 trots bytet till MicroSD.
| SD Card Reader | |
| average JPG Copy Test (av. of 3 runs) | |
| Alienware m16 R1 Intel (AV PRO microSD 128 GB V60) | |
| Lenovo Legion Slim 7 16APH8 (AV PRO microSD 128 GB V60) | |
| Asus ROG Zephyrus G16 2024 GU605M | |
| Alienware m16 R2 (AV PRO microSD 128 GB V60) | |
| Alienware x16 R1 (AV PRO microSD 128 GB V60) | |
| maximum AS SSD Seq Read Test (1GB) | |
| Alienware x16 R1 (AV PRO microSD 128 GB V60) | |
| Alienware m16 R2 (AV PRO microSD 128 GB V60) | |
| Alienware m16 R1 Intel (AV PRO microSD 128 GB V60) | |
| Asus ROG Zephyrus G16 2024 GU605M | |
| Lenovo Legion Slim 7 16APH8 (AV PRO microSD 128 GB V60) | |
Kommunikation
Intel Killer AX1675 levereras som standard med Wi-Fi 6E-anslutning med möjlighet att uppgradera till BE202 för Wi-Fi 7-kompatibilitet. Vi upplevde inga problem när vi kopplade ihop den med vår Asus AXE11000 testrouter.
| Networking | |
| iperf3 transmit AXE11000 | |
| Asus ROG Zephyrus G16 2024 GU605M | |
| HP Omen Transcend 16-u1095ng | |
| Alienware m16 R1 Intel | |
| Alienware m16 R2 | |
| Alienware x16 R1 | |
| Lenovo Legion Slim 7 16APH8 | |
| iperf3 receive AXE11000 | |
| Lenovo Legion Slim 7 16APH8 | |
| HP Omen Transcend 16-u1095ng | |
| Alienware m16 R1 Intel | |
| Asus ROG Zephyrus G16 2024 GU605M | |
| Alienware x16 R1 | |
| Alienware m16 R2 | |
| iperf3 transmit AXE11000 6GHz | |
| Alienware m16 R2 | |
| Alienware x16 R1 | |
| iperf3 receive AXE11000 6GHz | |
| Alienware m16 R2 | |
| Alienware x16 R1 | |
Webbkamera
En 2 MP webbkamera med IR för stöd av Windows Hello ingår som standard. Det finns ingen integrerad sekretesslucka.


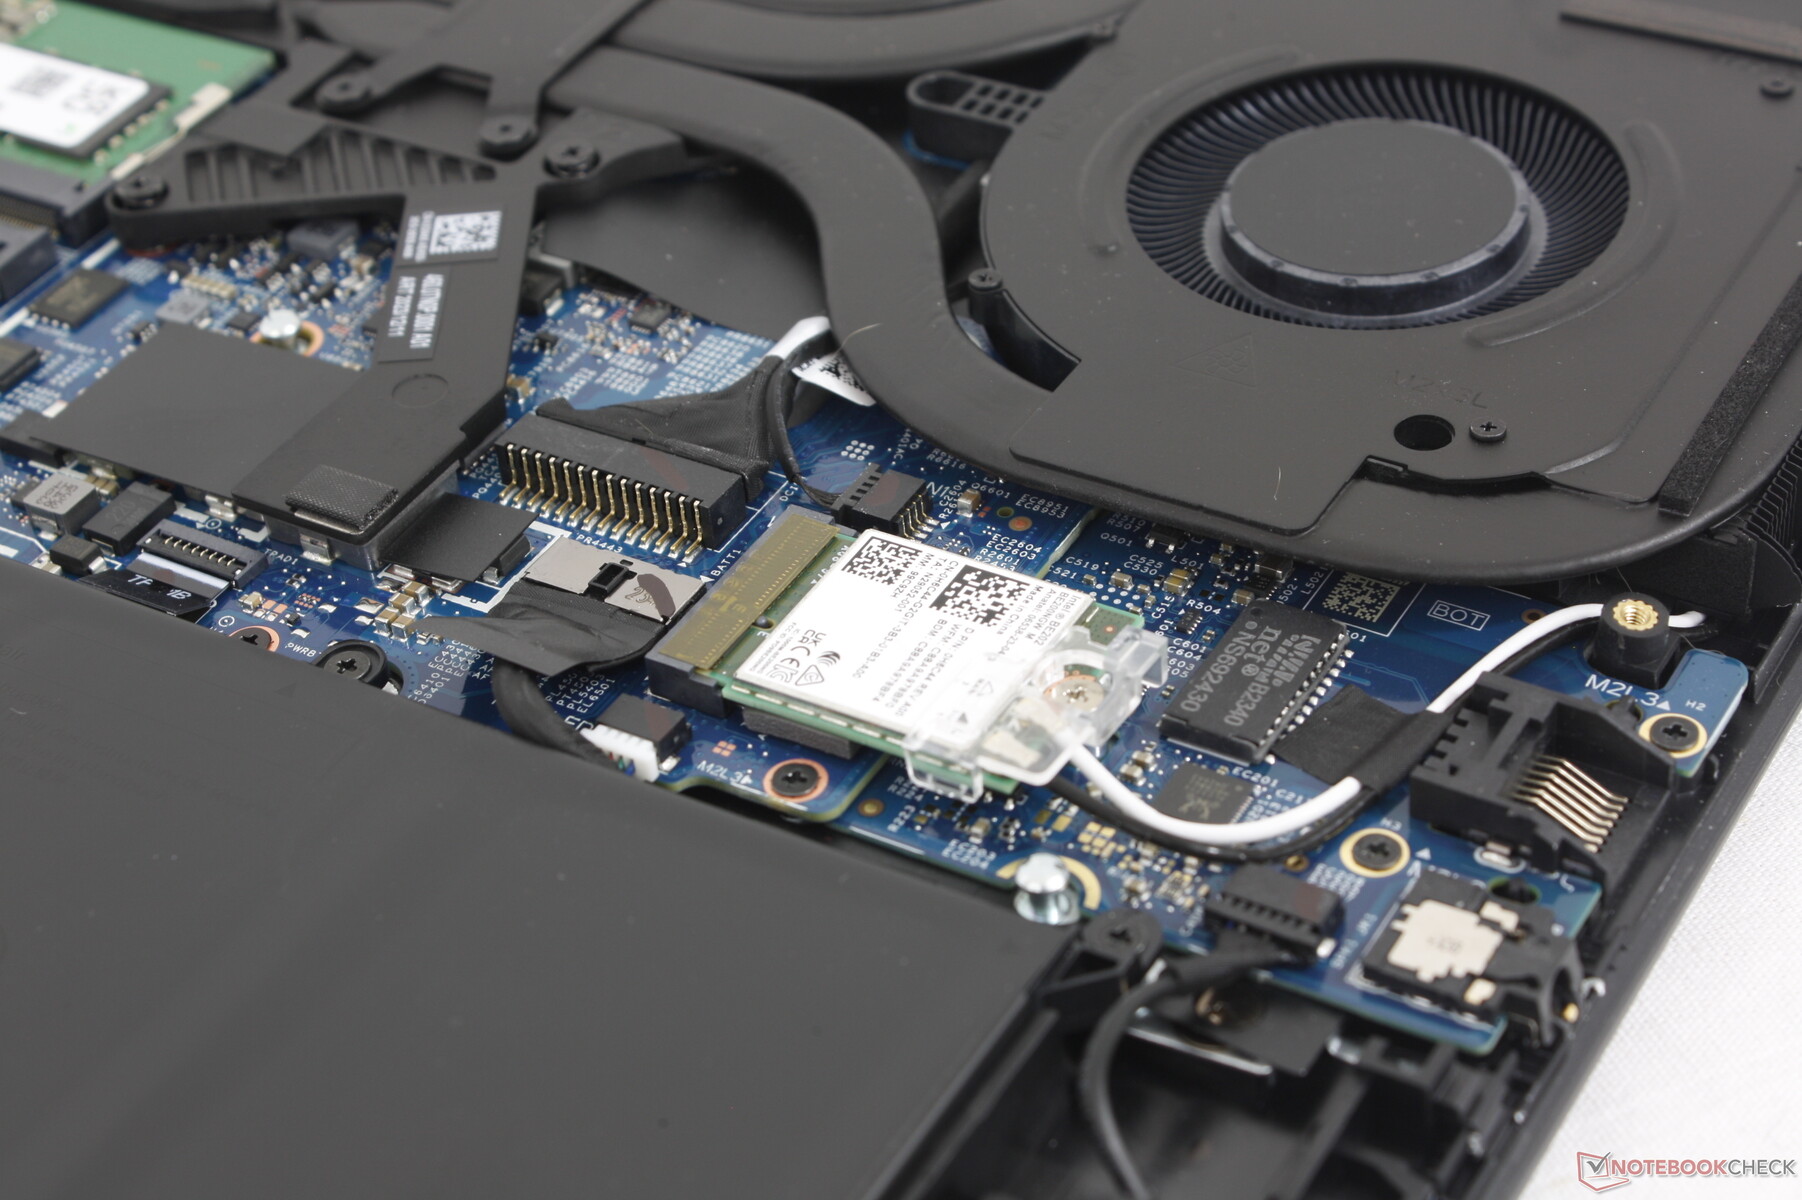
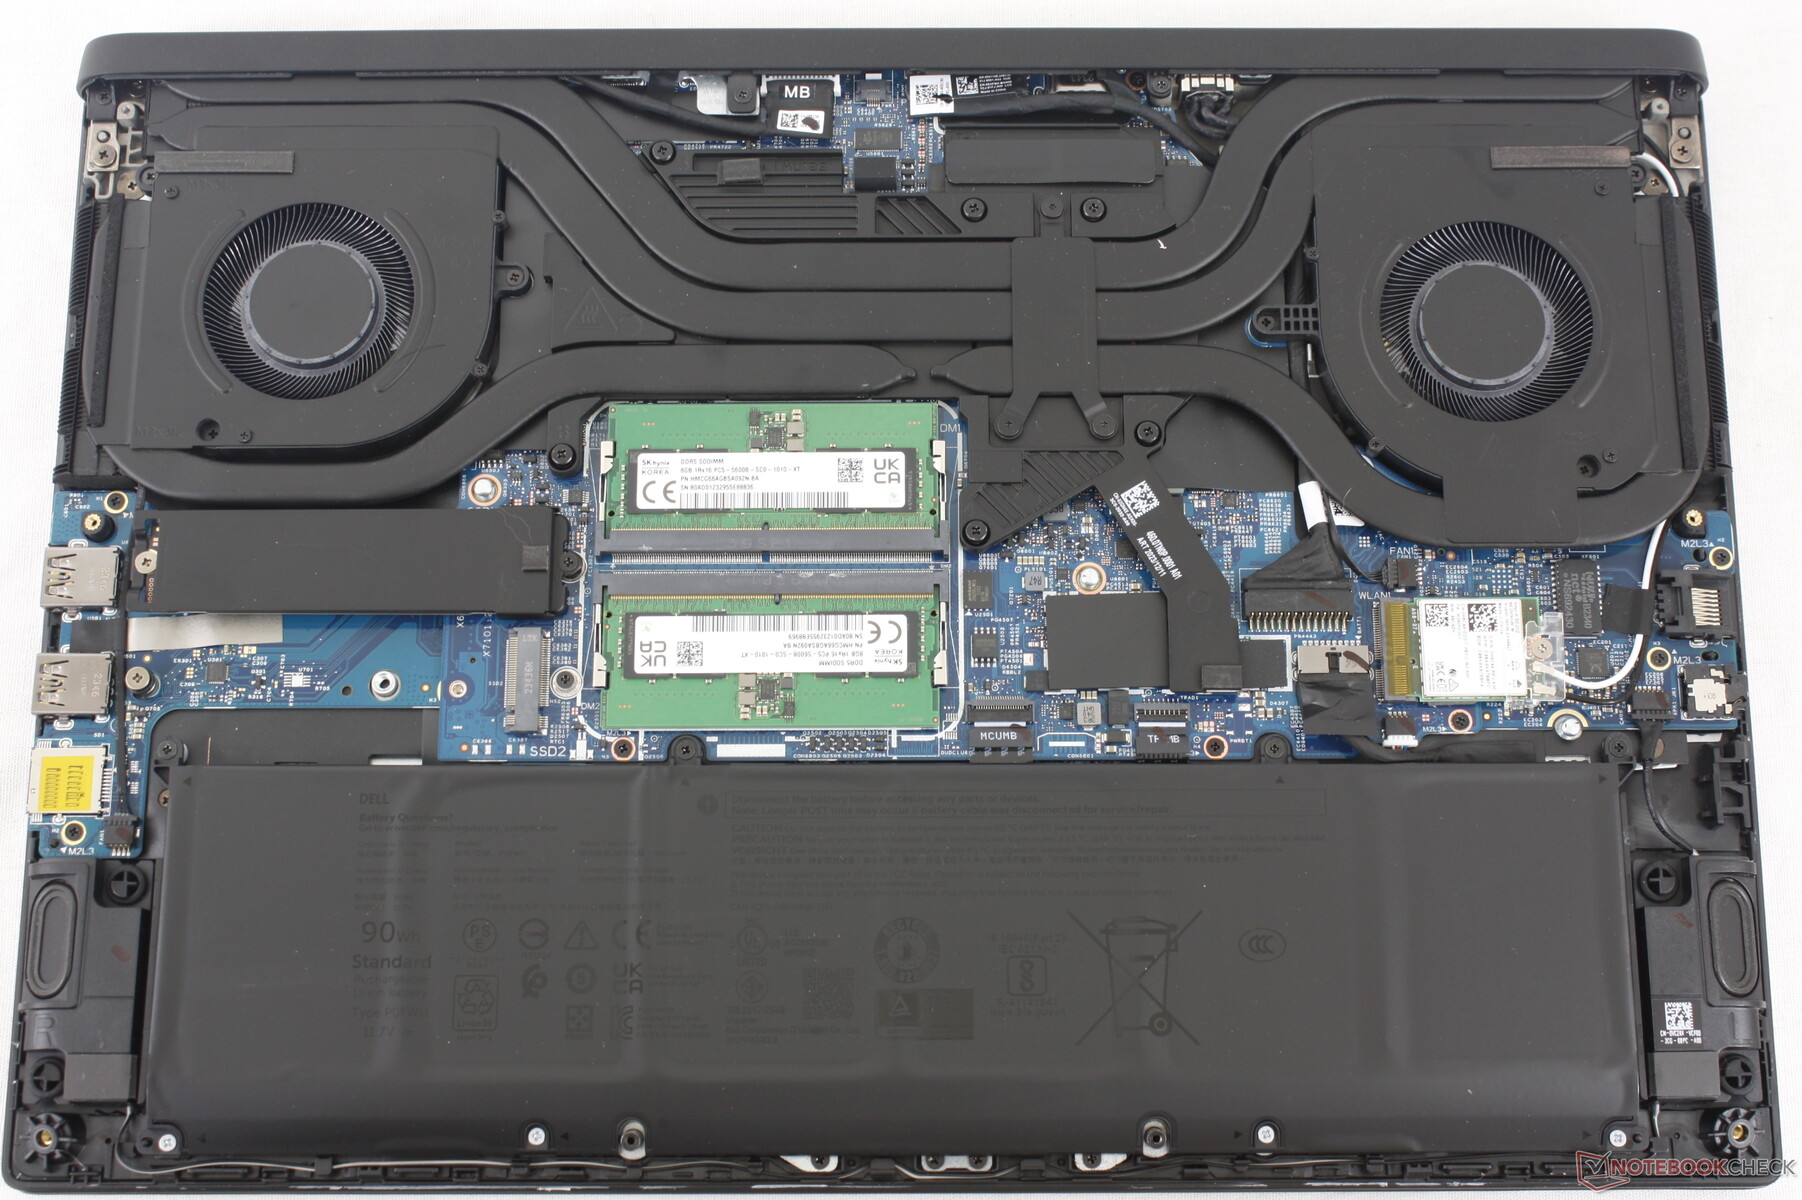
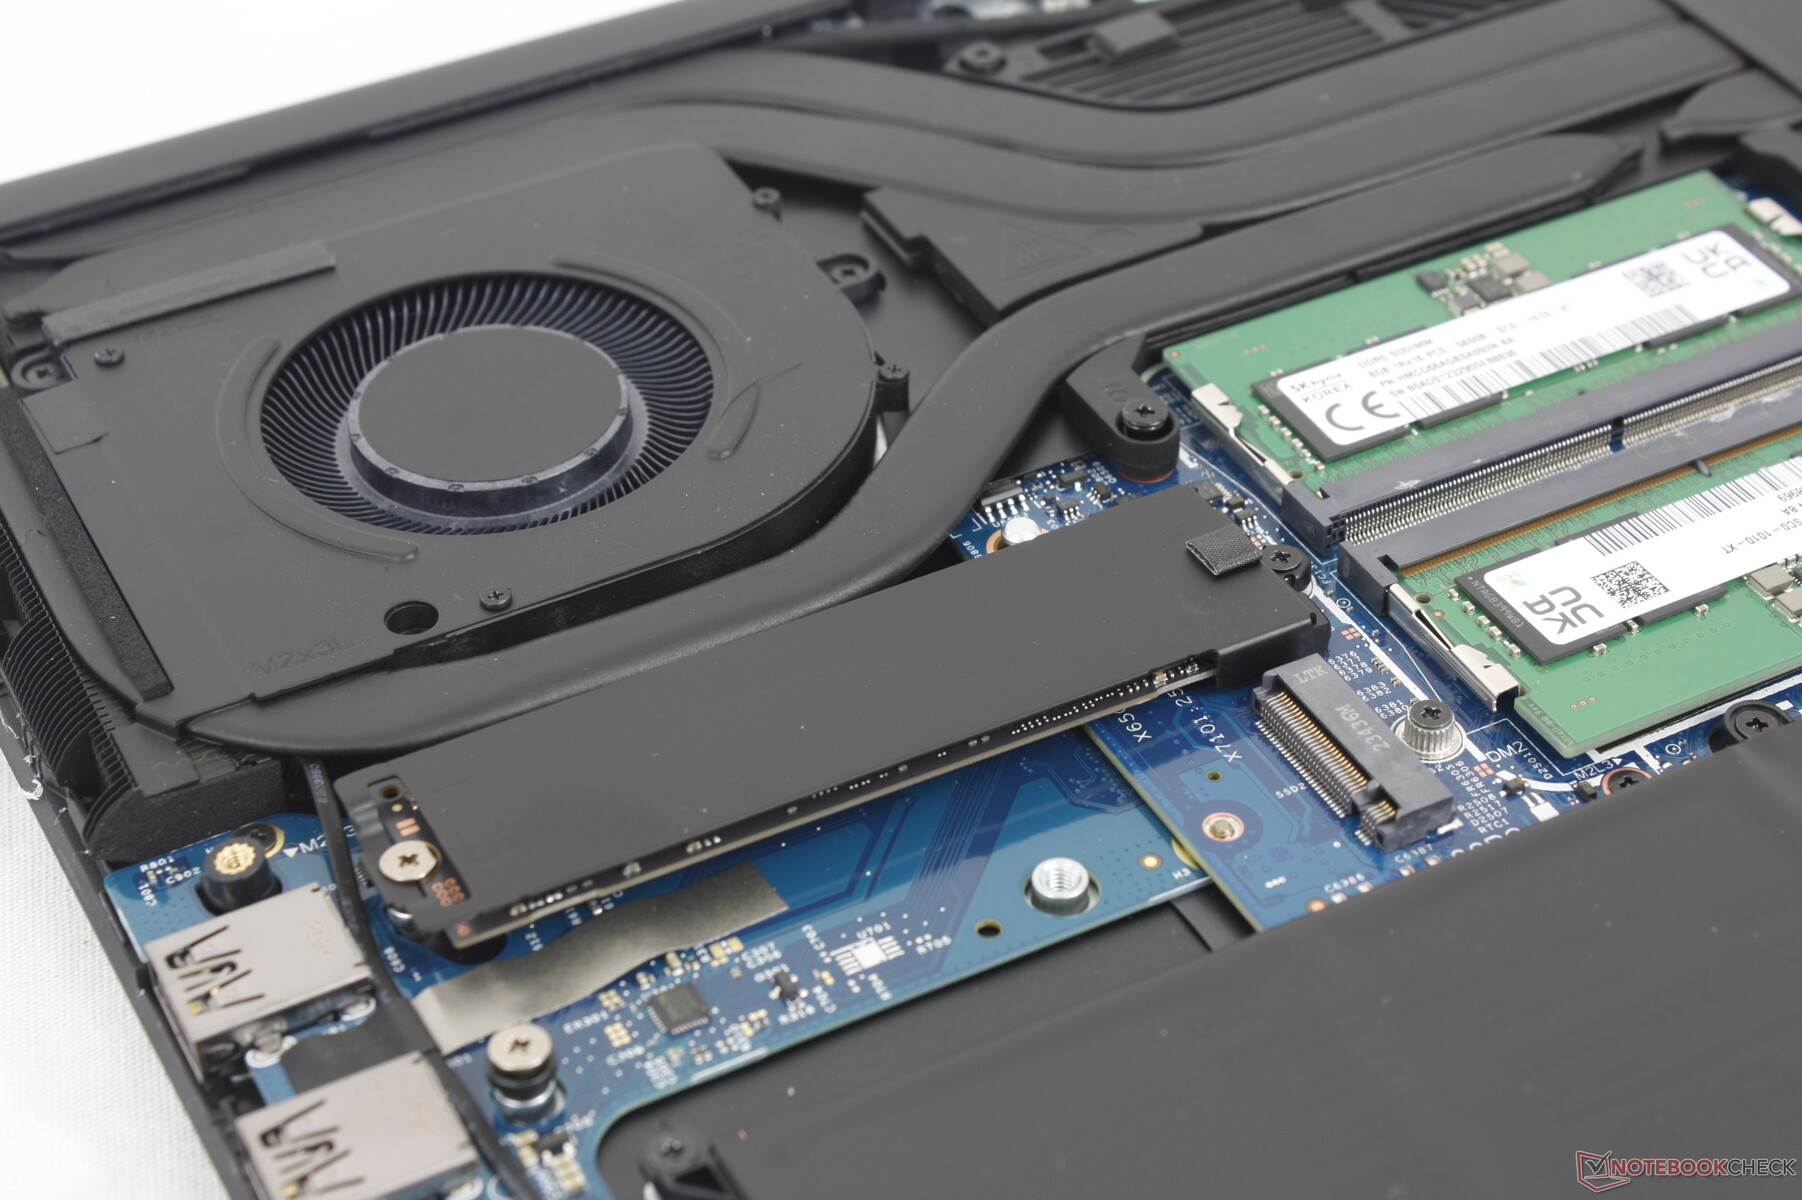
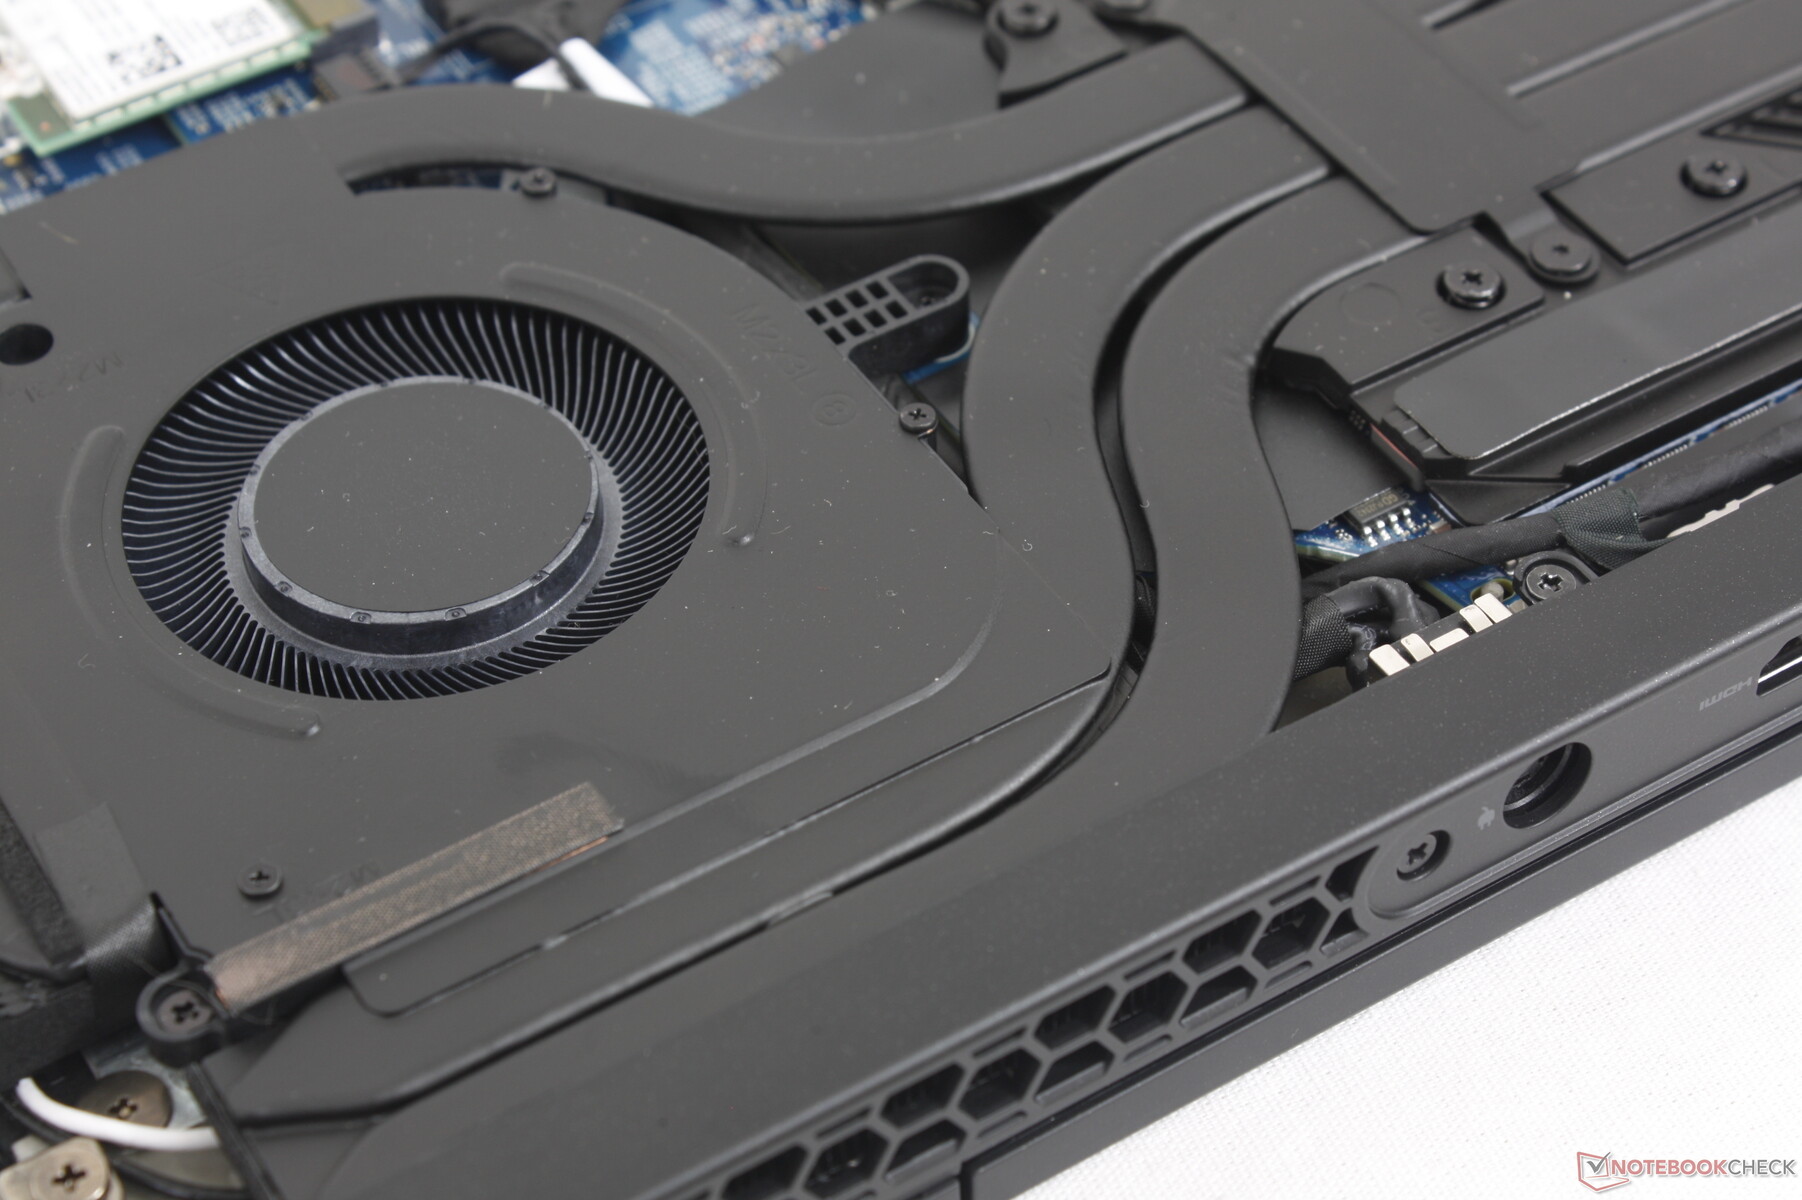
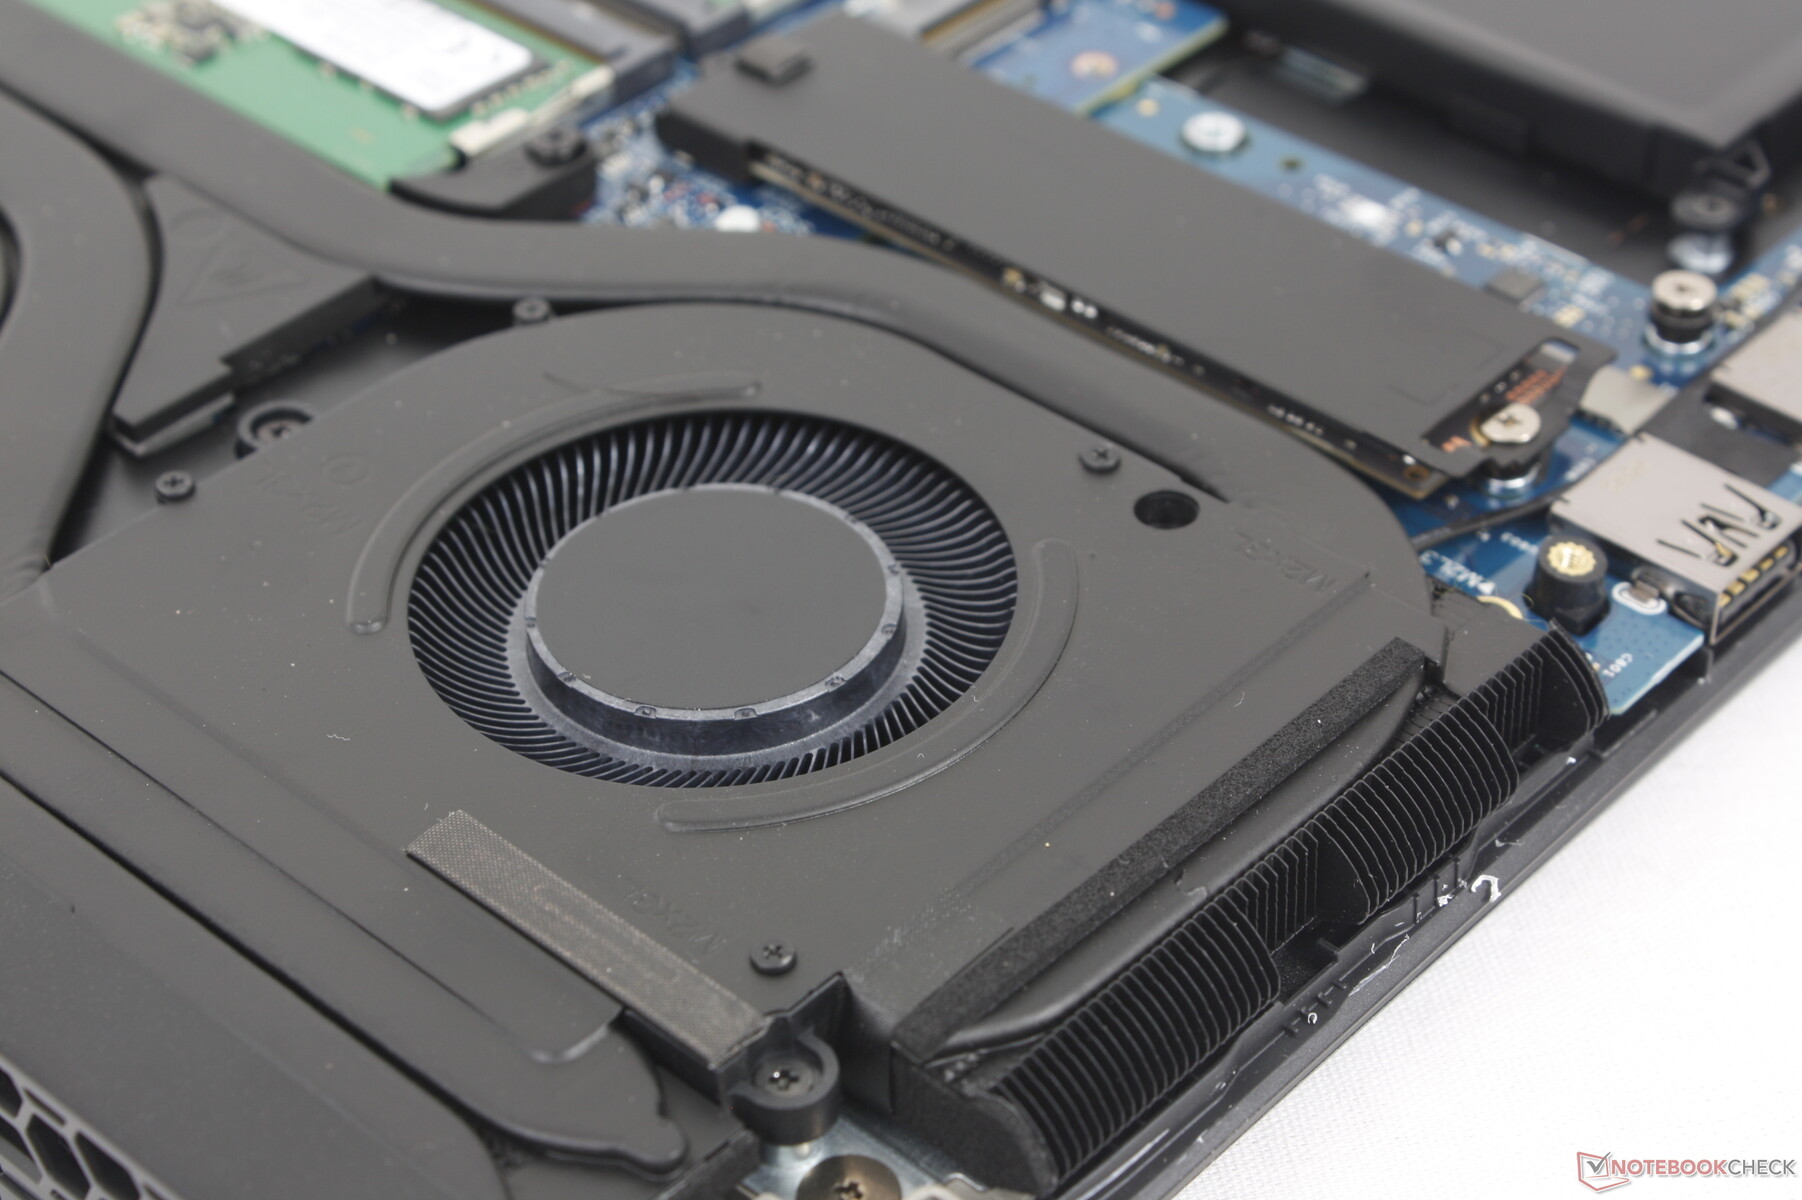
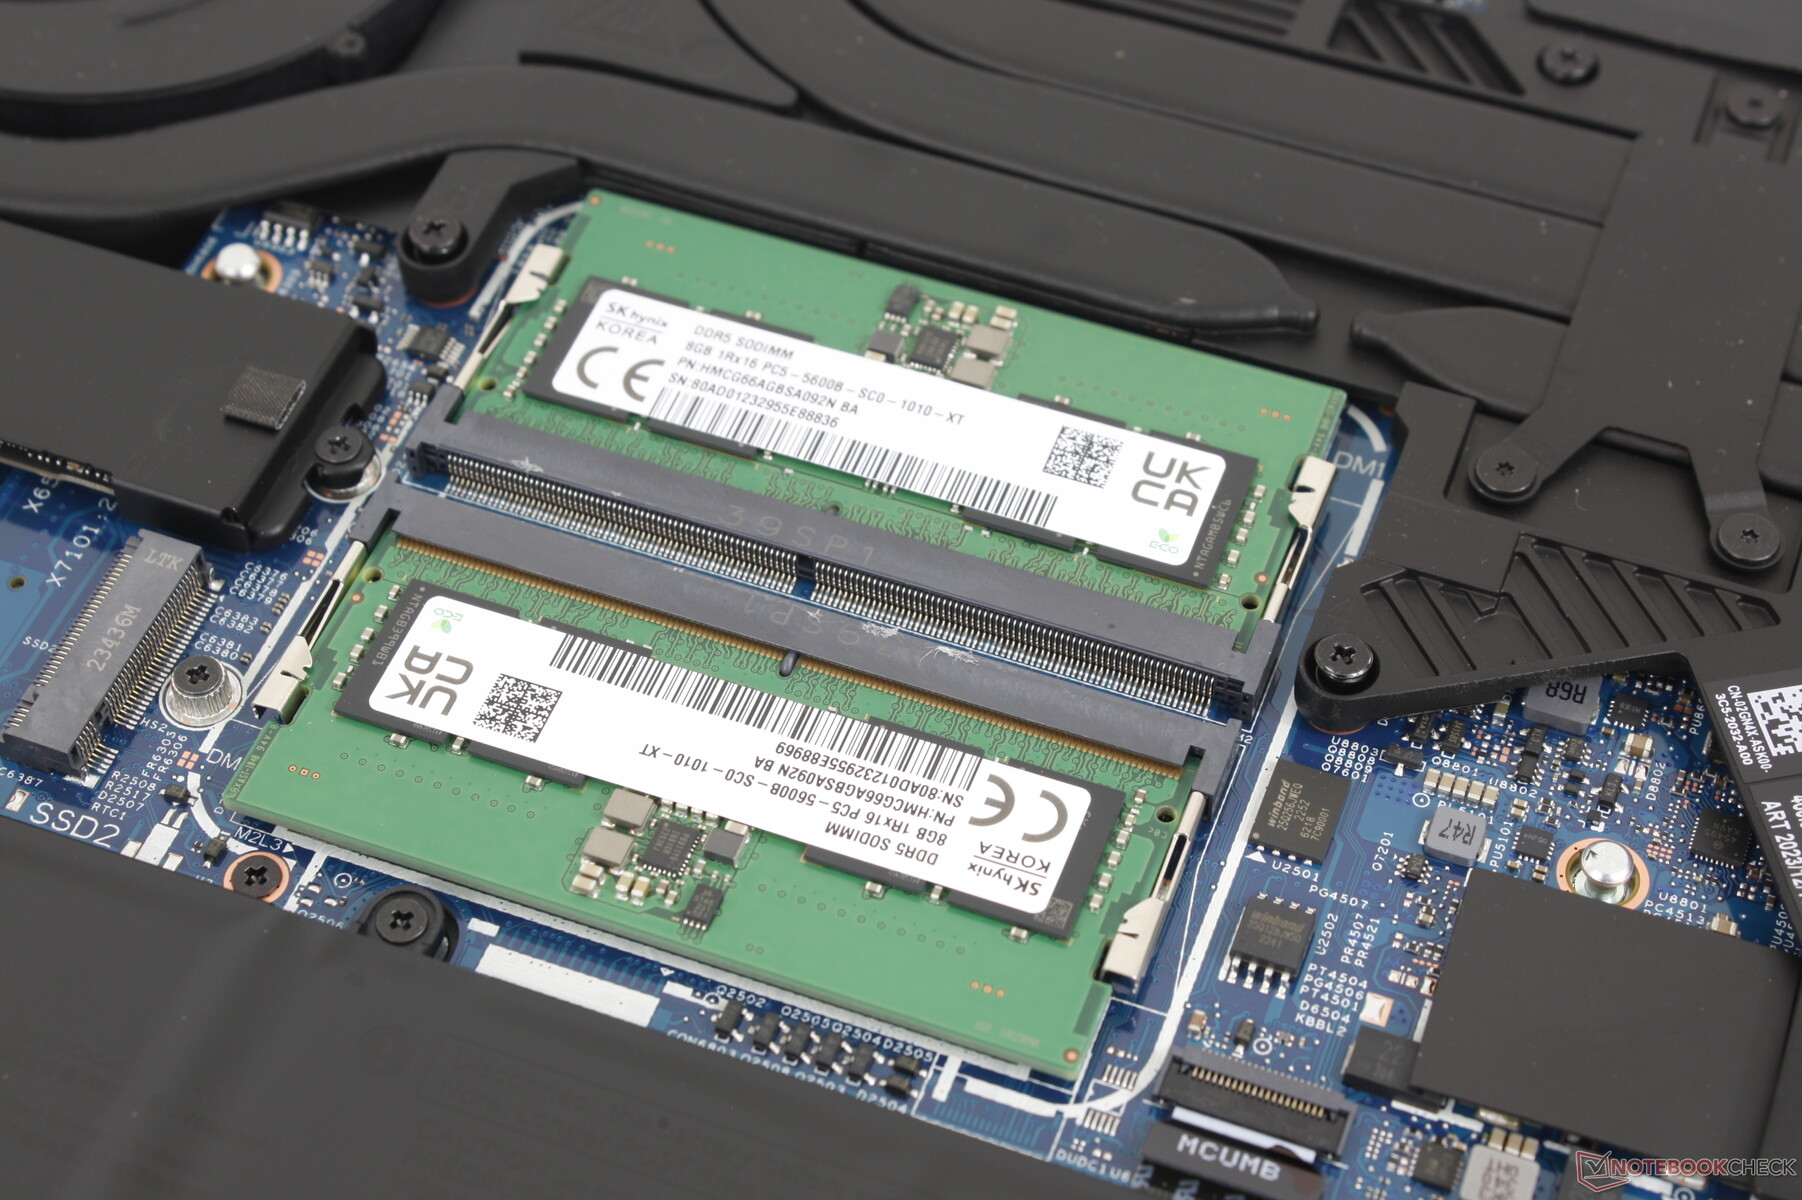
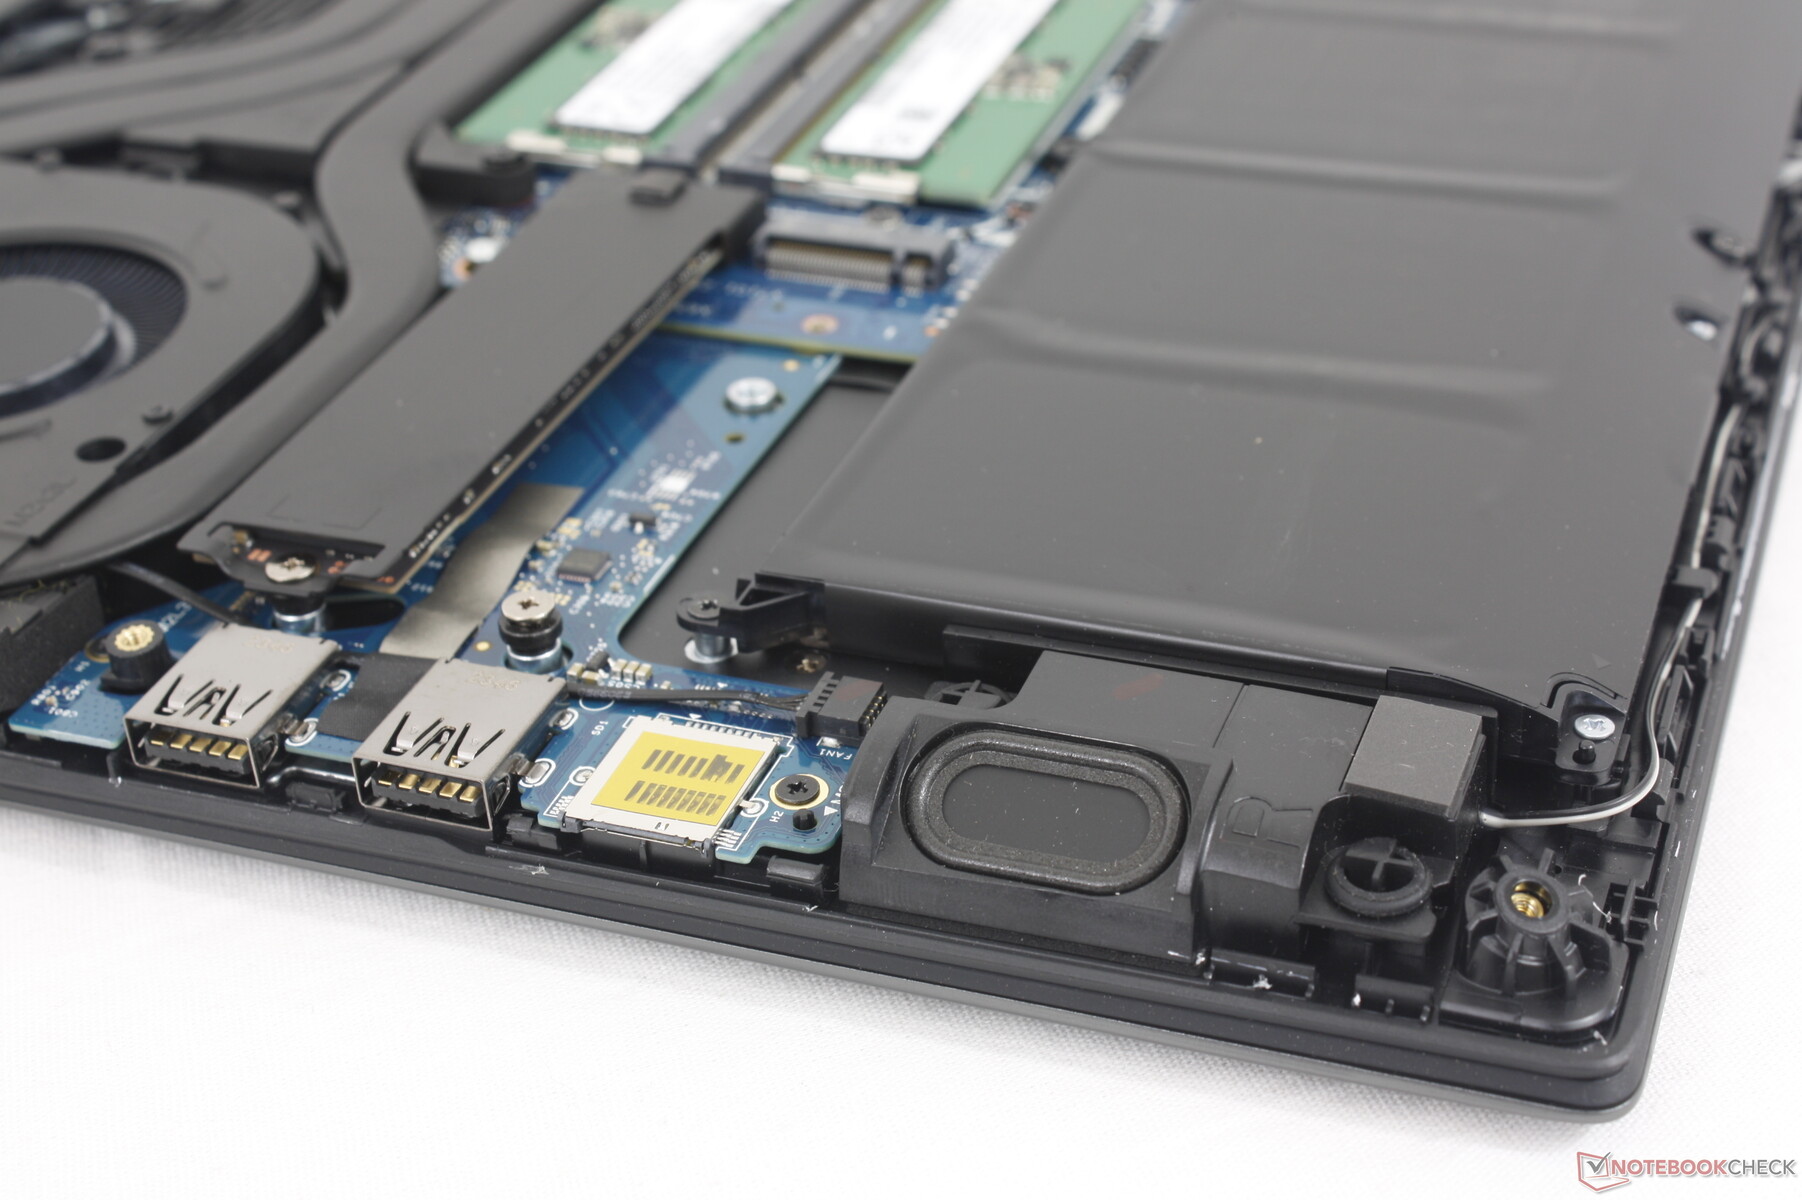
Underhåll
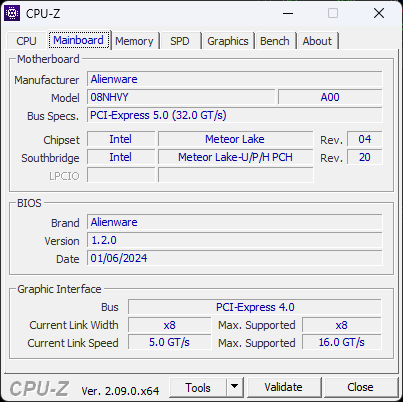
Bottenpanelen fästs med 8 stjärnskruvar för enkel service. RAM och WLAN är fortfarande löstagbara, men lagringskonfigurationen har ändrats; systemet stöder nu två M.2 2280 SSD-enheter istället för en M.2 2280 och två M.2 2230 SSD-enheter på förra årets design.
Tillbehör och garanti
Förpackningen innehåller några klistermärken med Alienware-logotypen tillsammans med den vanliga nätadaptern och pappersarbete. En ettårig begränsad tillverkargaranti ingår som standard vid köp i USA.
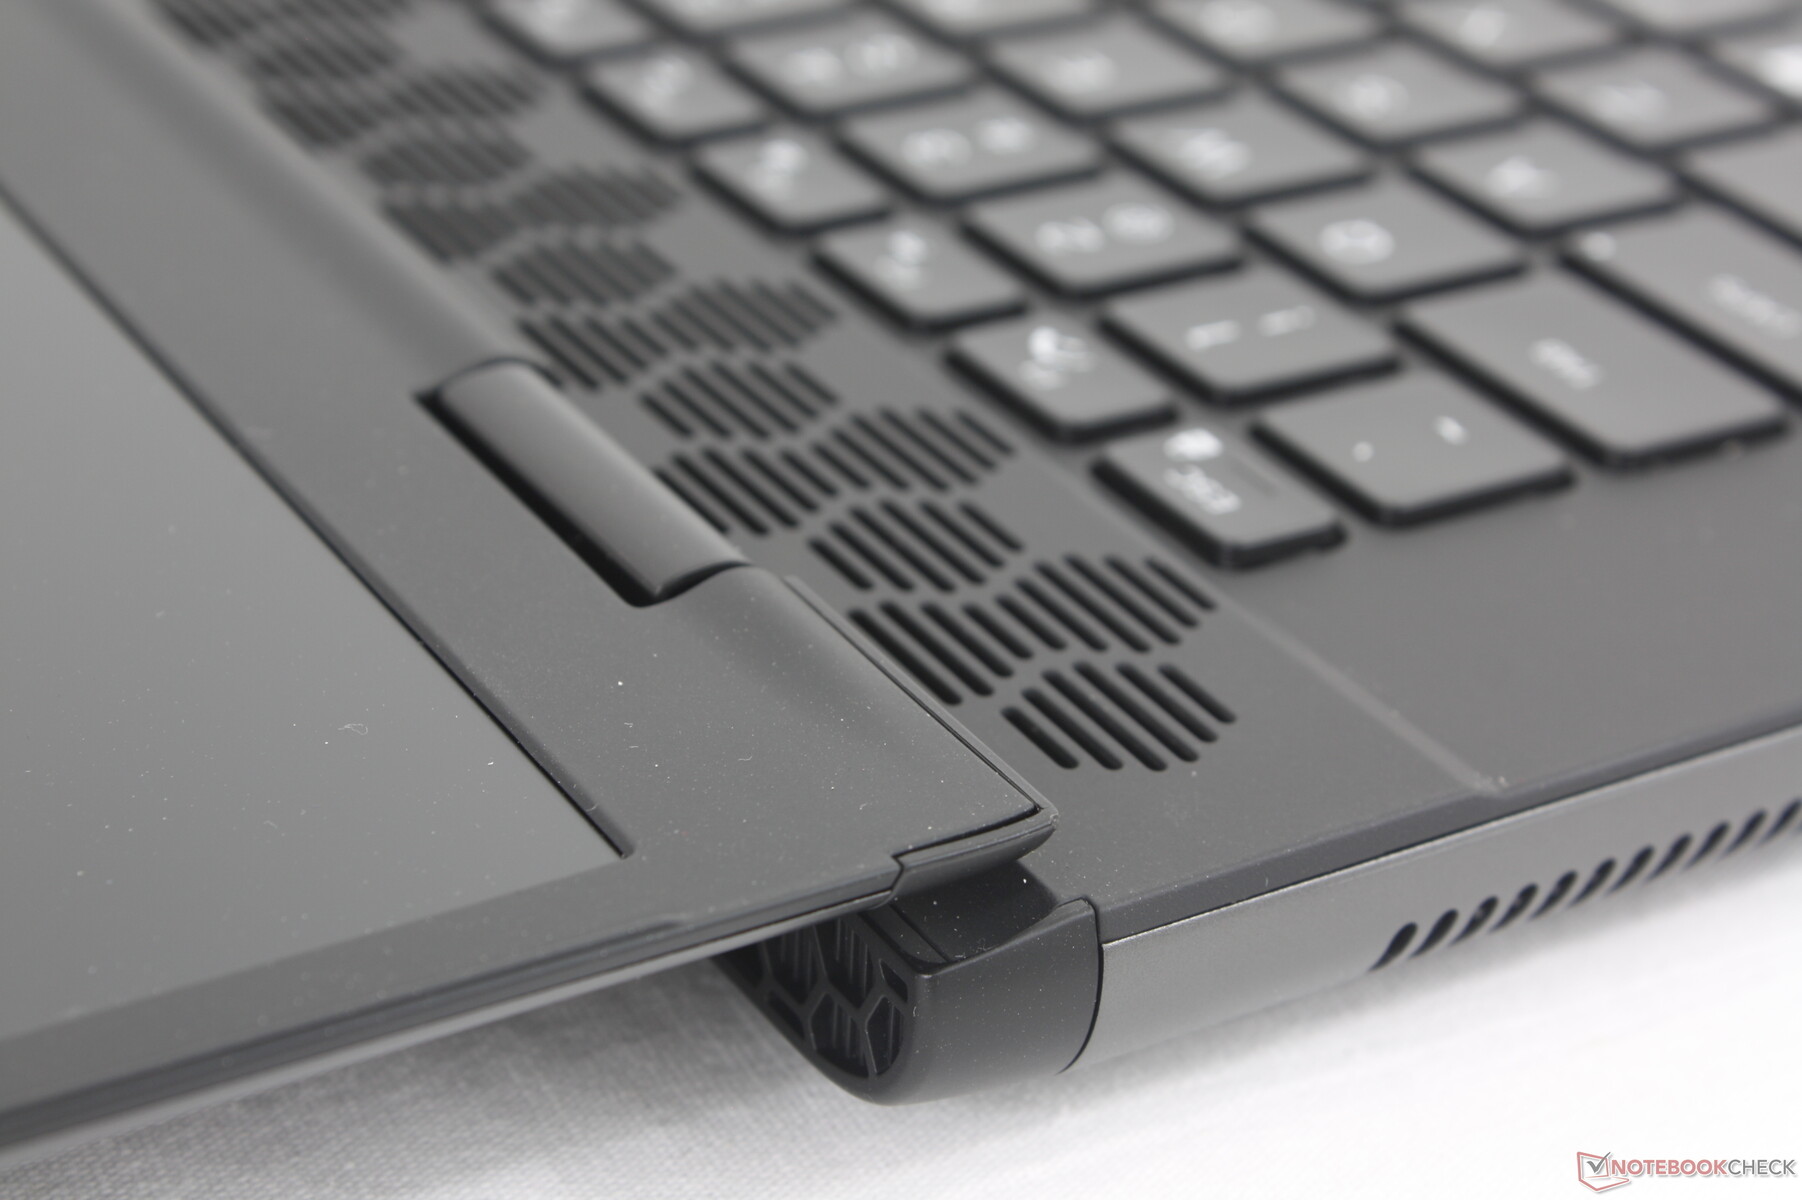
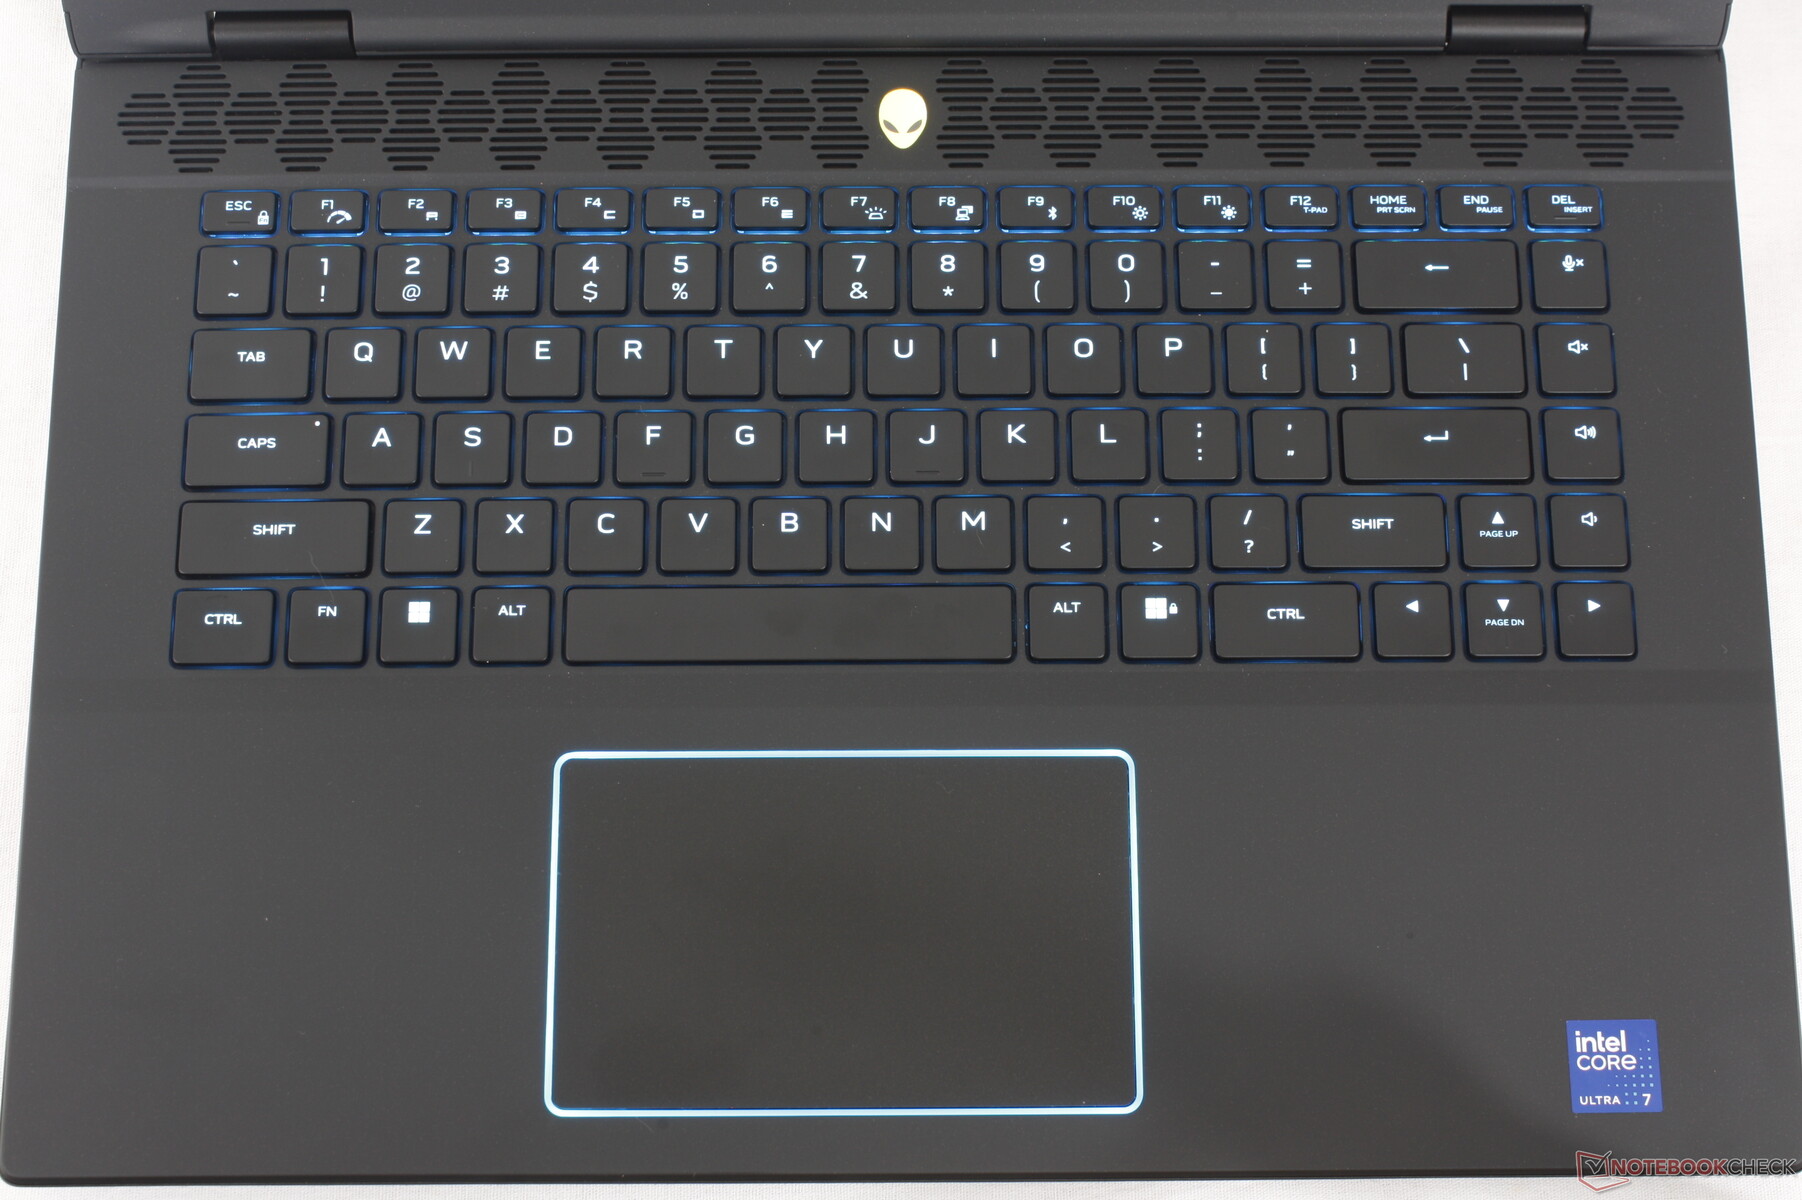
Inmatningsenheter - inget behov av mekaniska
Tangentbord
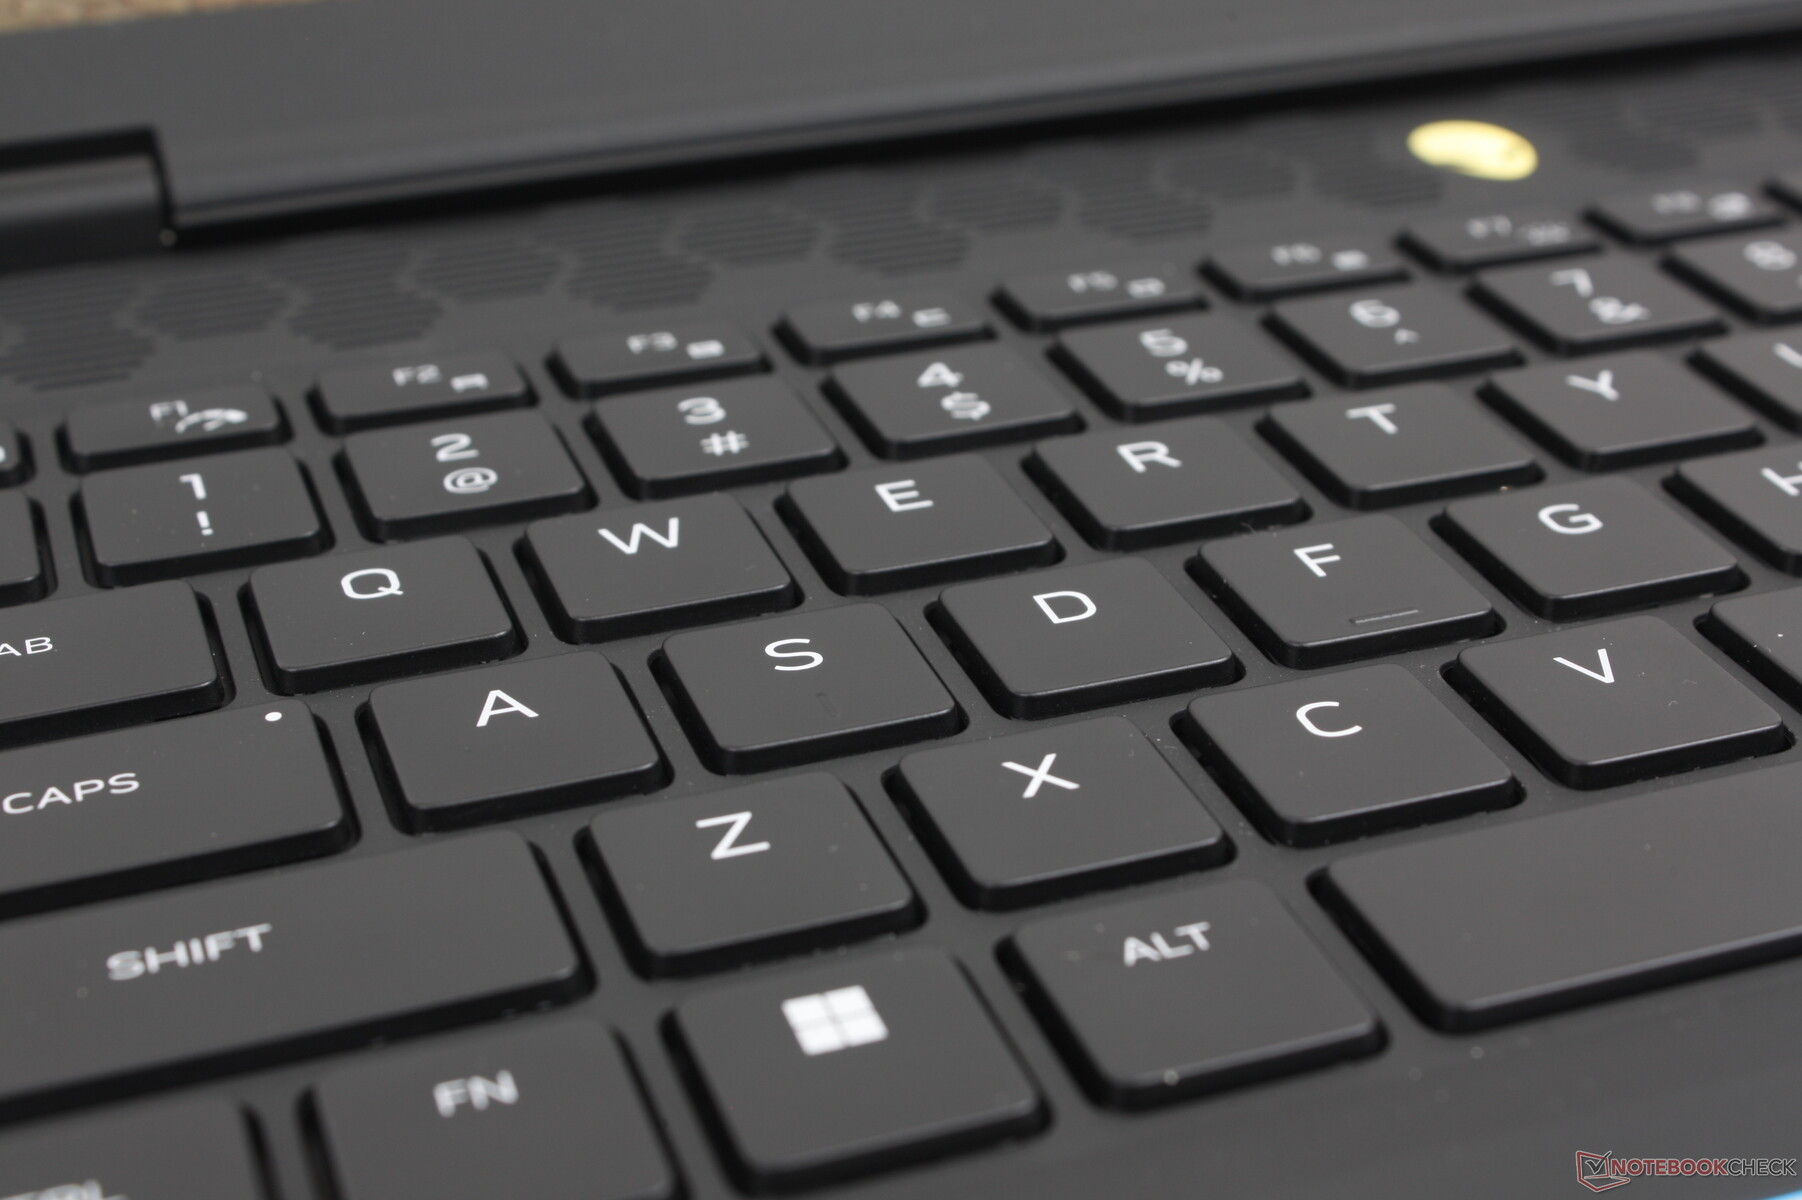
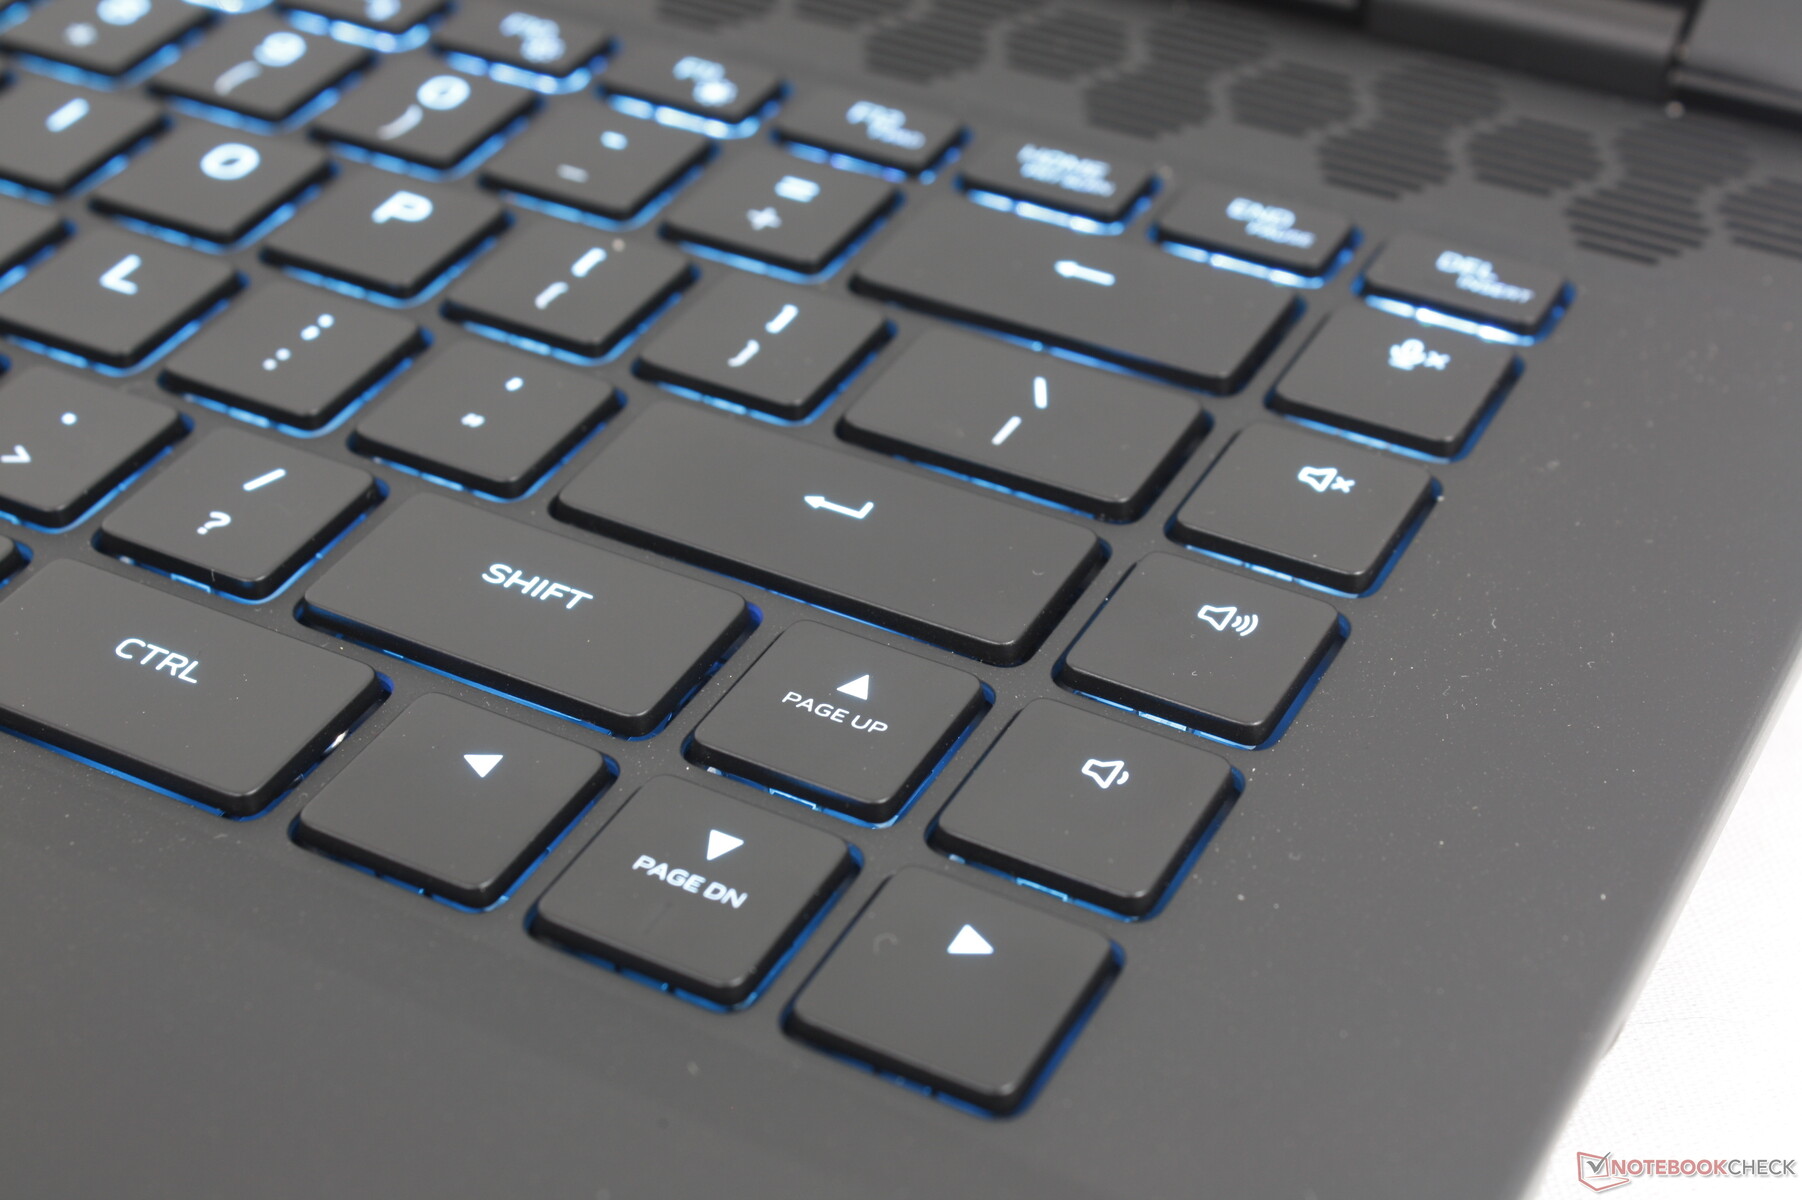
Systemet använder membranbaserade tangenter med 1,8 mm slaglängd och inget mer mekaniskt alternativ för att hålla vikten låg och för att tilltala en bredare publik utöver spelare. De är ändå bekväma och klickar mer än förväntat jämfört med tangentborden på de flesta andra bärbara speldatorer, inklusive MSI Raider GE68 eller HP Omen Transcend 16. Speciellt Space- och Enter-tangenterna är mycket högre och skarpare än de vanliga QWERTY-tangenterna när de trycks ned.
Nytt för tangentbordet i år är en praktisk "Stealth mode"-funktion kopplad till F2-tangenten som växlar systemet till tyst läge utan att först behöva starta Alienware Command Center. I övrigt är tangentbordslayouten densamma som på den ursprungliga m16 R1.
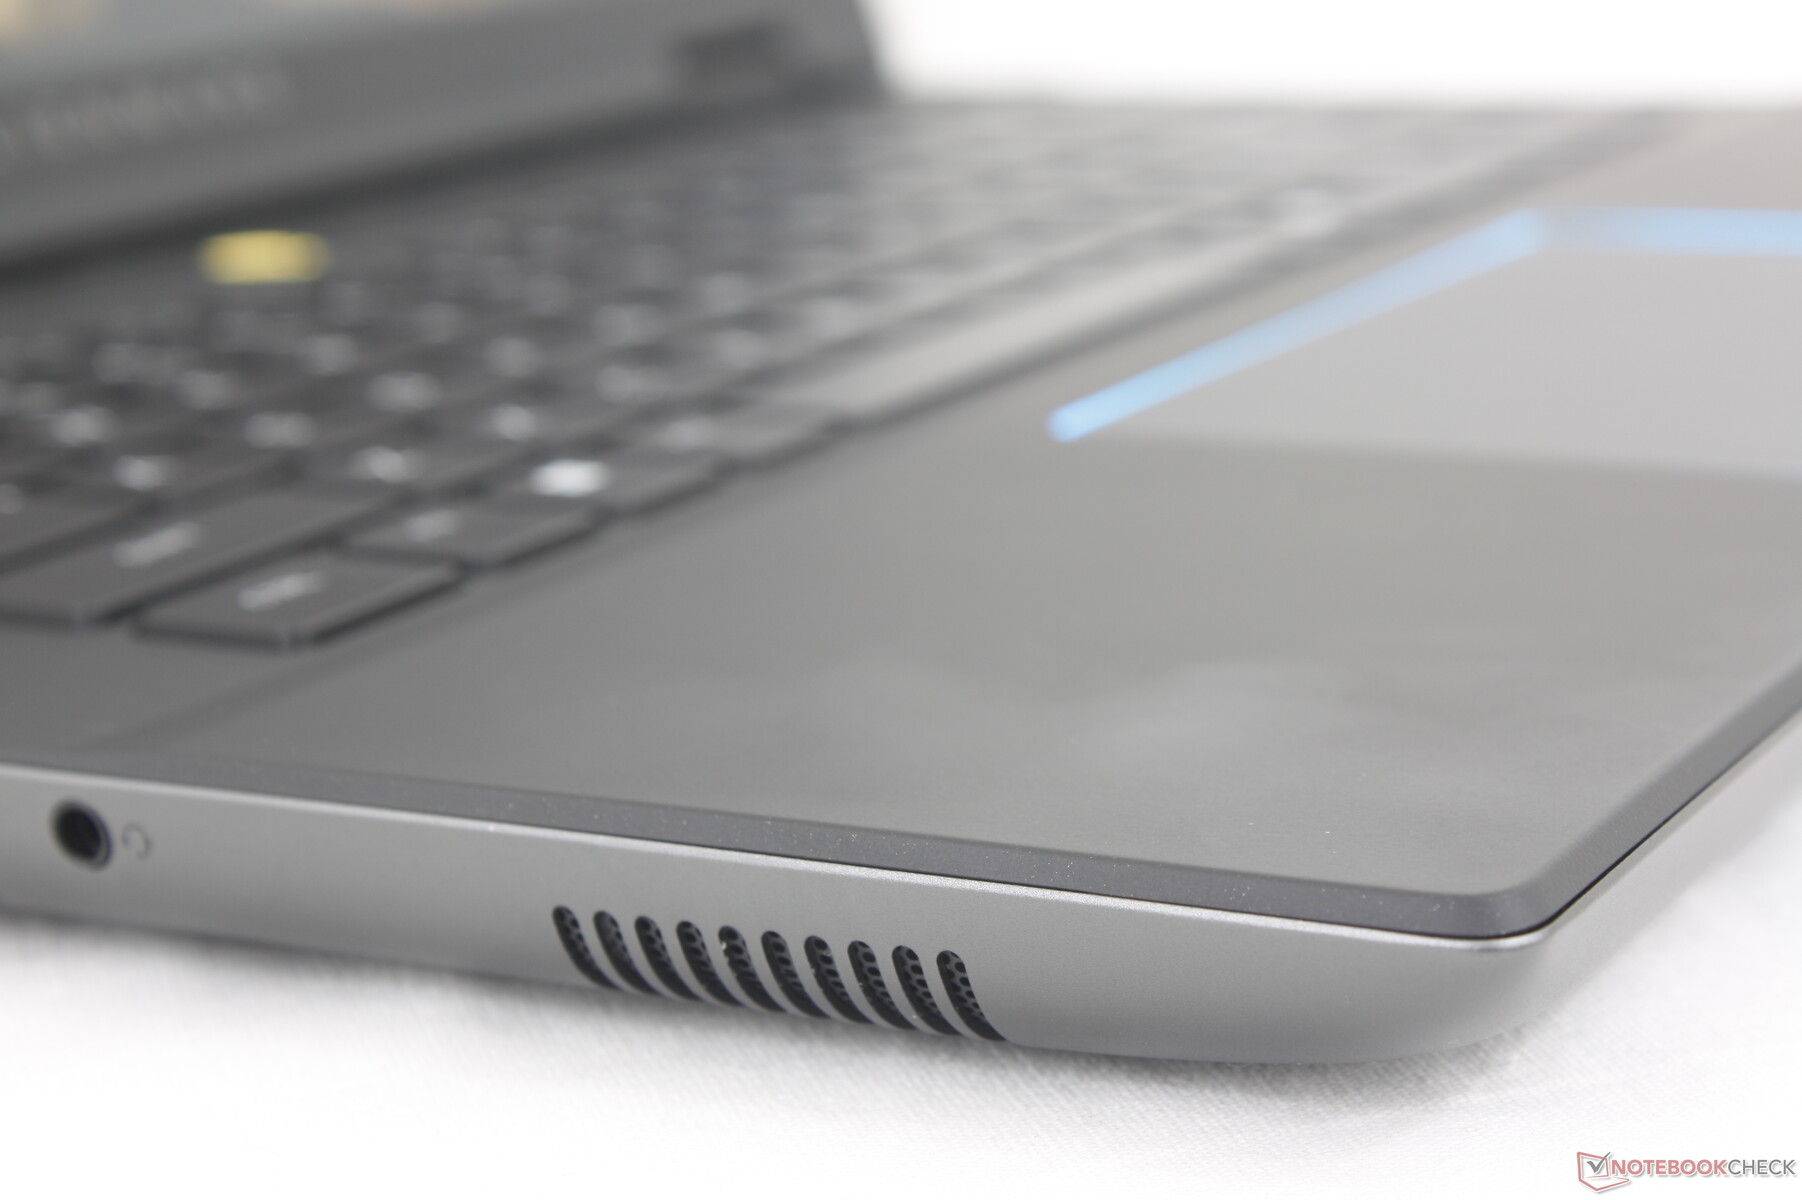
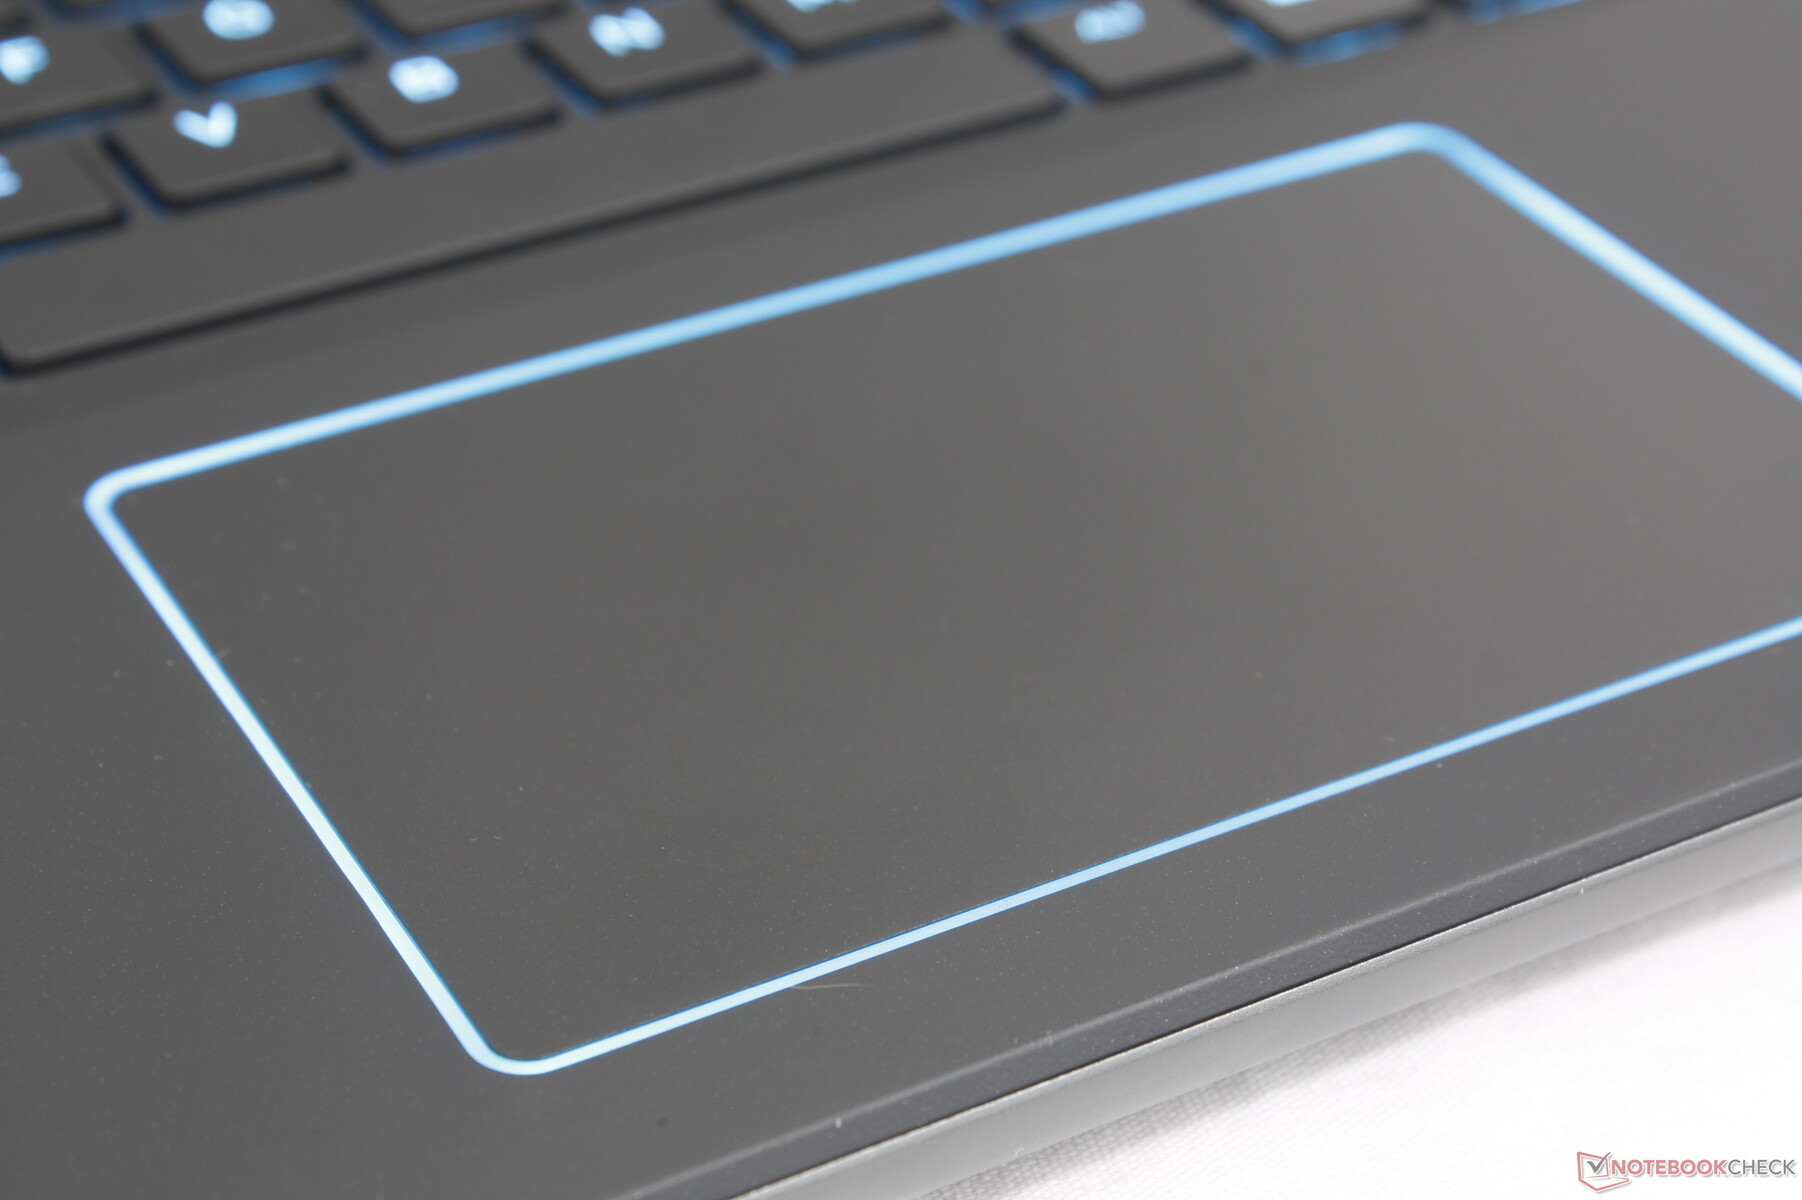
Pekplatta
Klickplattan är något större än på förra årets modell (11,5 x 7 cm jämfört med 11,3 x 6,6 cm) och den innehåller ny RGB-belysning runt omkretsen. Återkopplingen när du klickar är dock fortfarande svampig och mycket ytlig, vilket ger en otillfredsställande känsla. Det fungerar tillräckligt pålitligt för grundläggande pekning och klickning, men en mus rekommenderas fortfarande för mer detaljerade åtgärder som att dra och släppa.
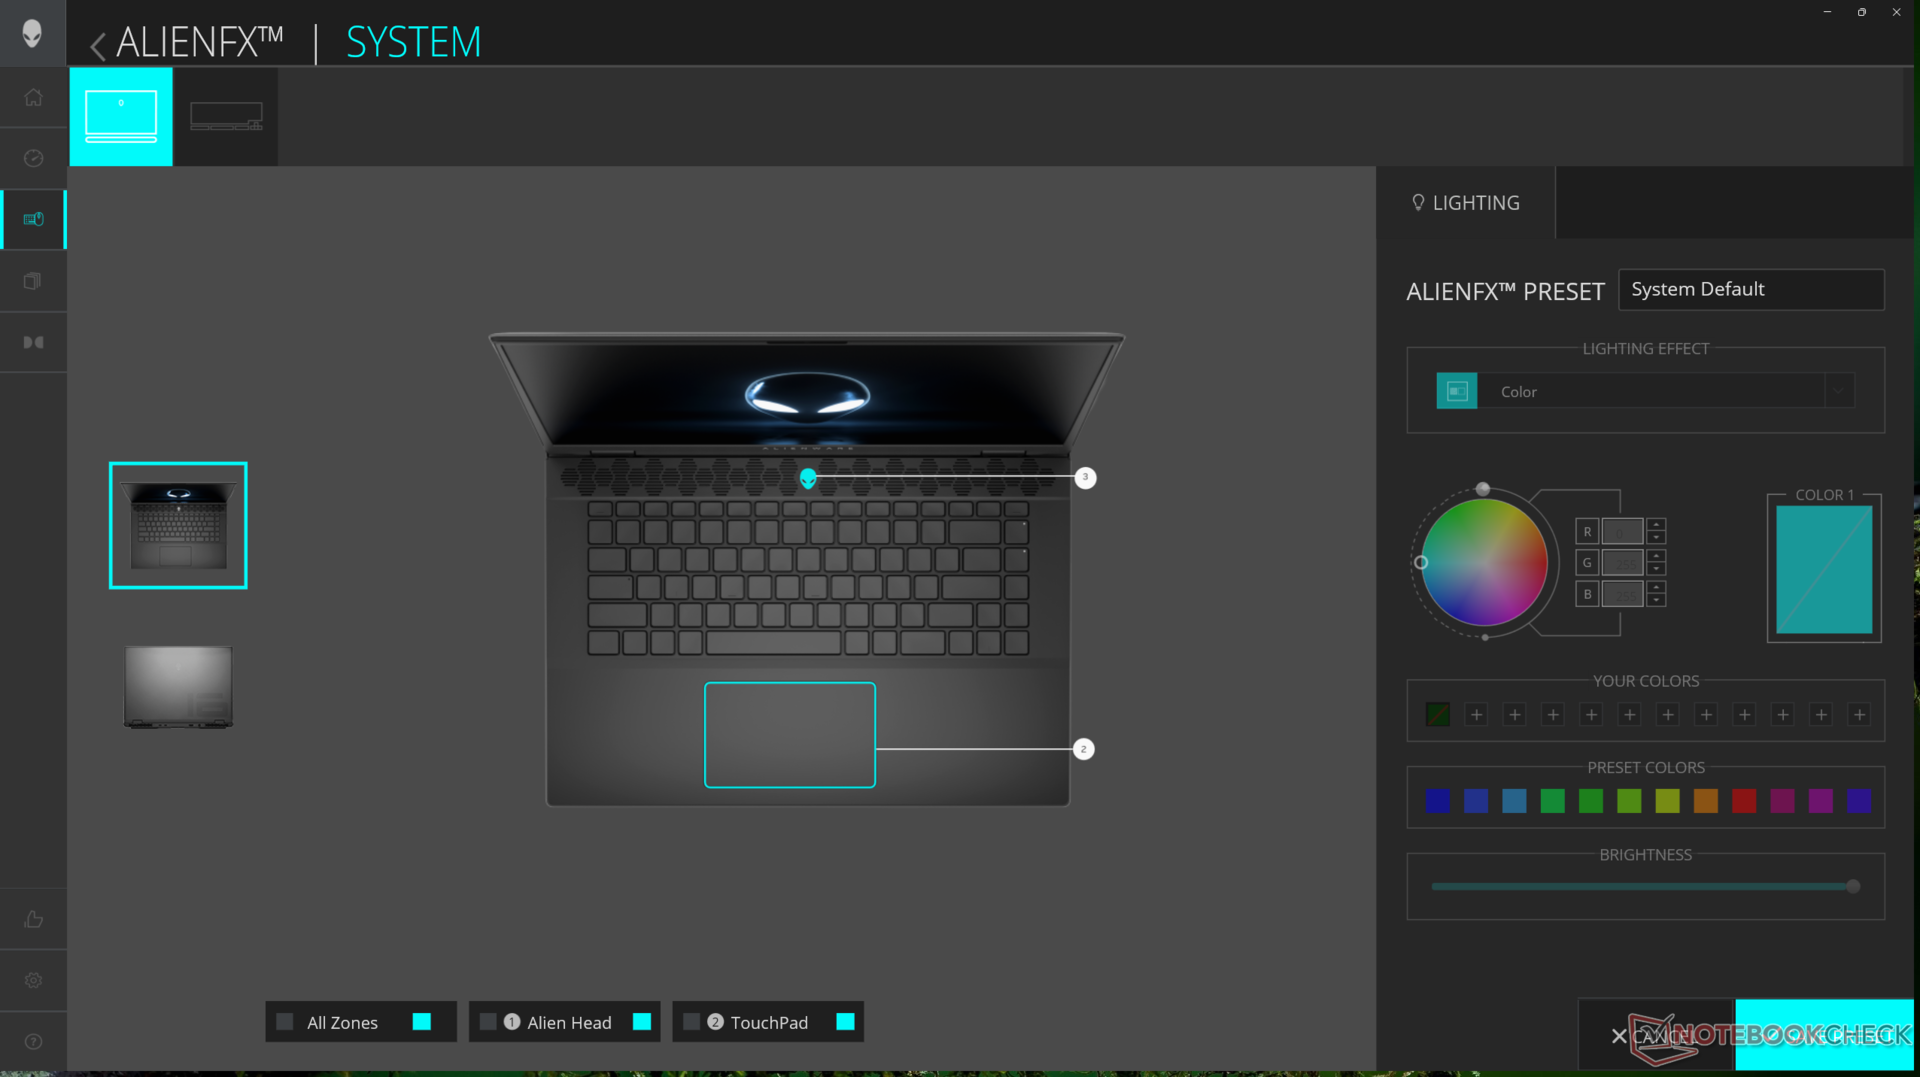
Irriterande kan RGB-belysningen endast aktiveras eller inaktiveras via Alienware Command Center eftersom det inte finns någon snabbtangent för att växla den. Justering av ljusstyrkan på RGB-tangenterna påverkar inte belysningen runt klickplattan.
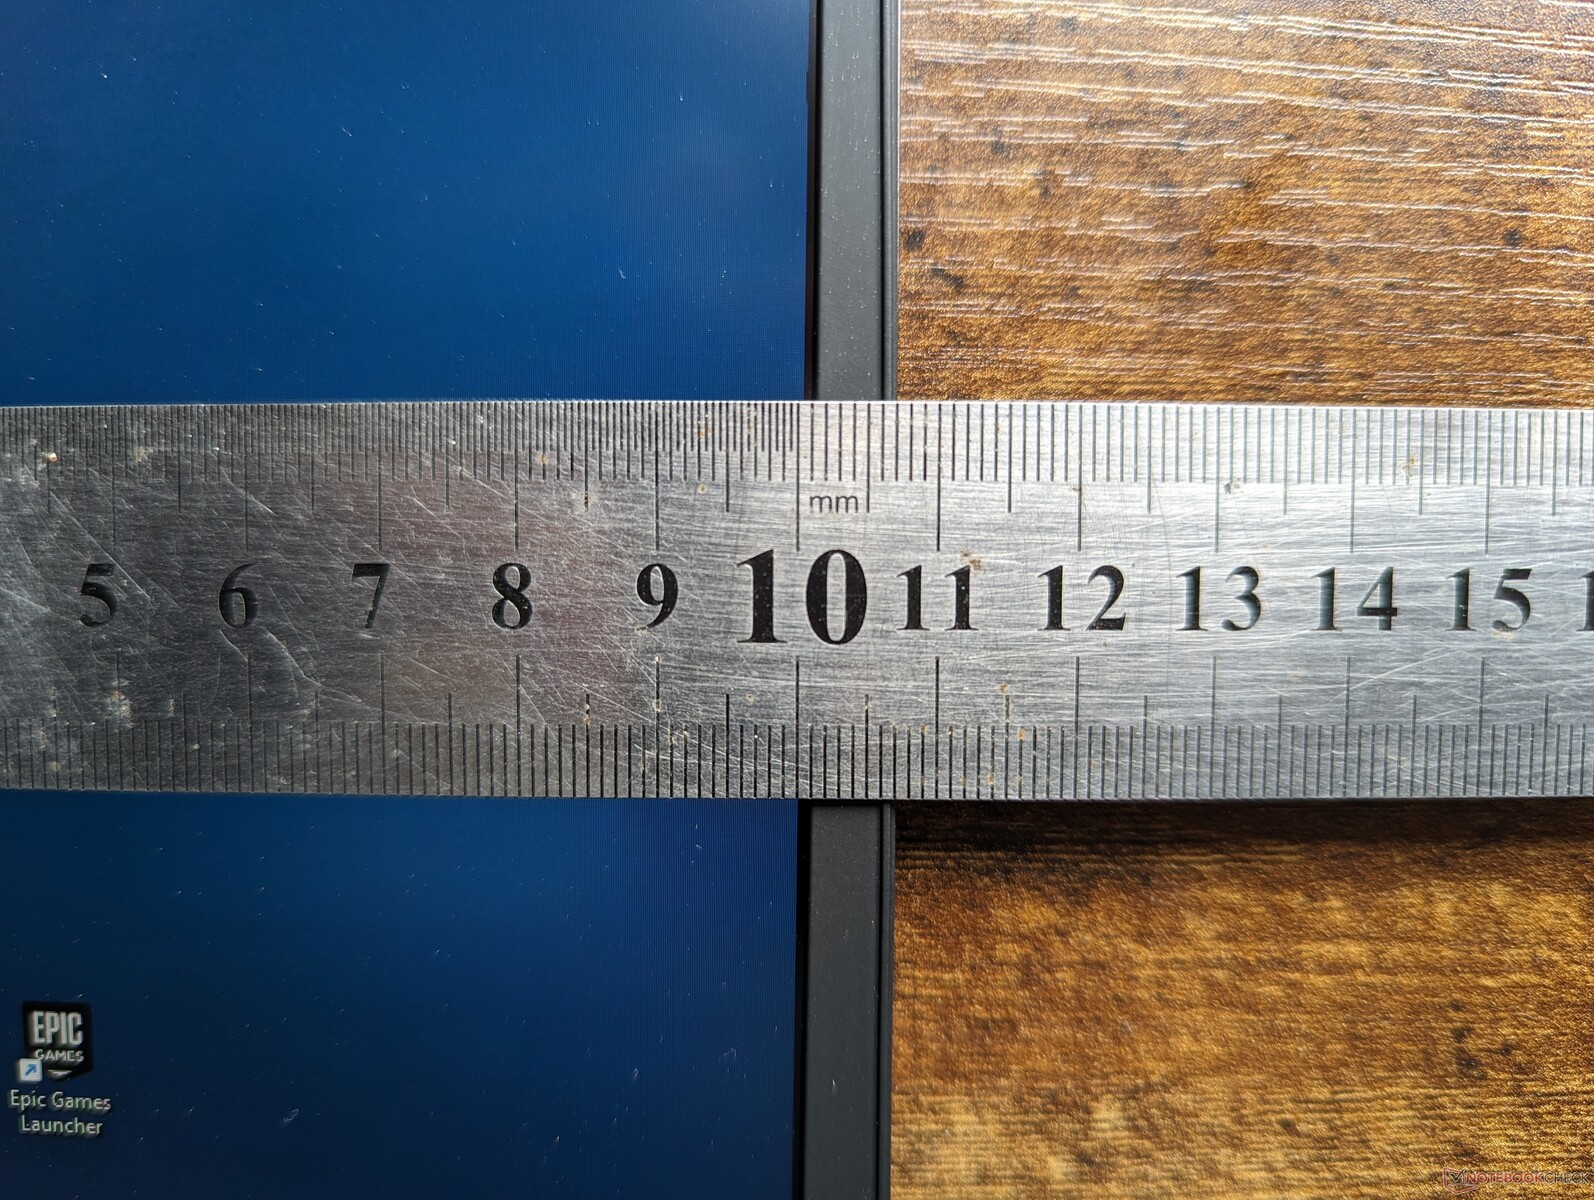
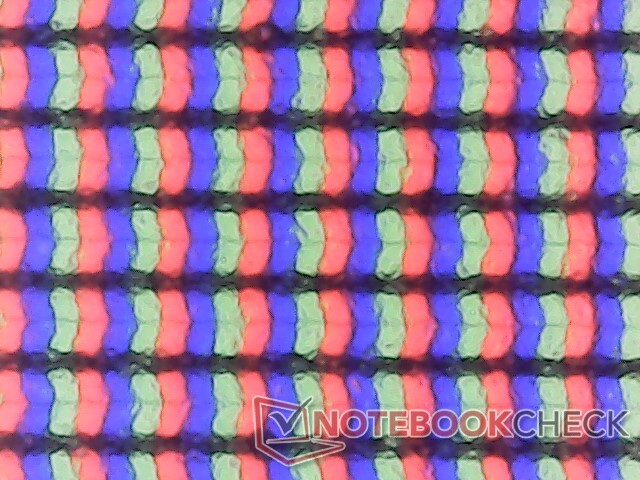
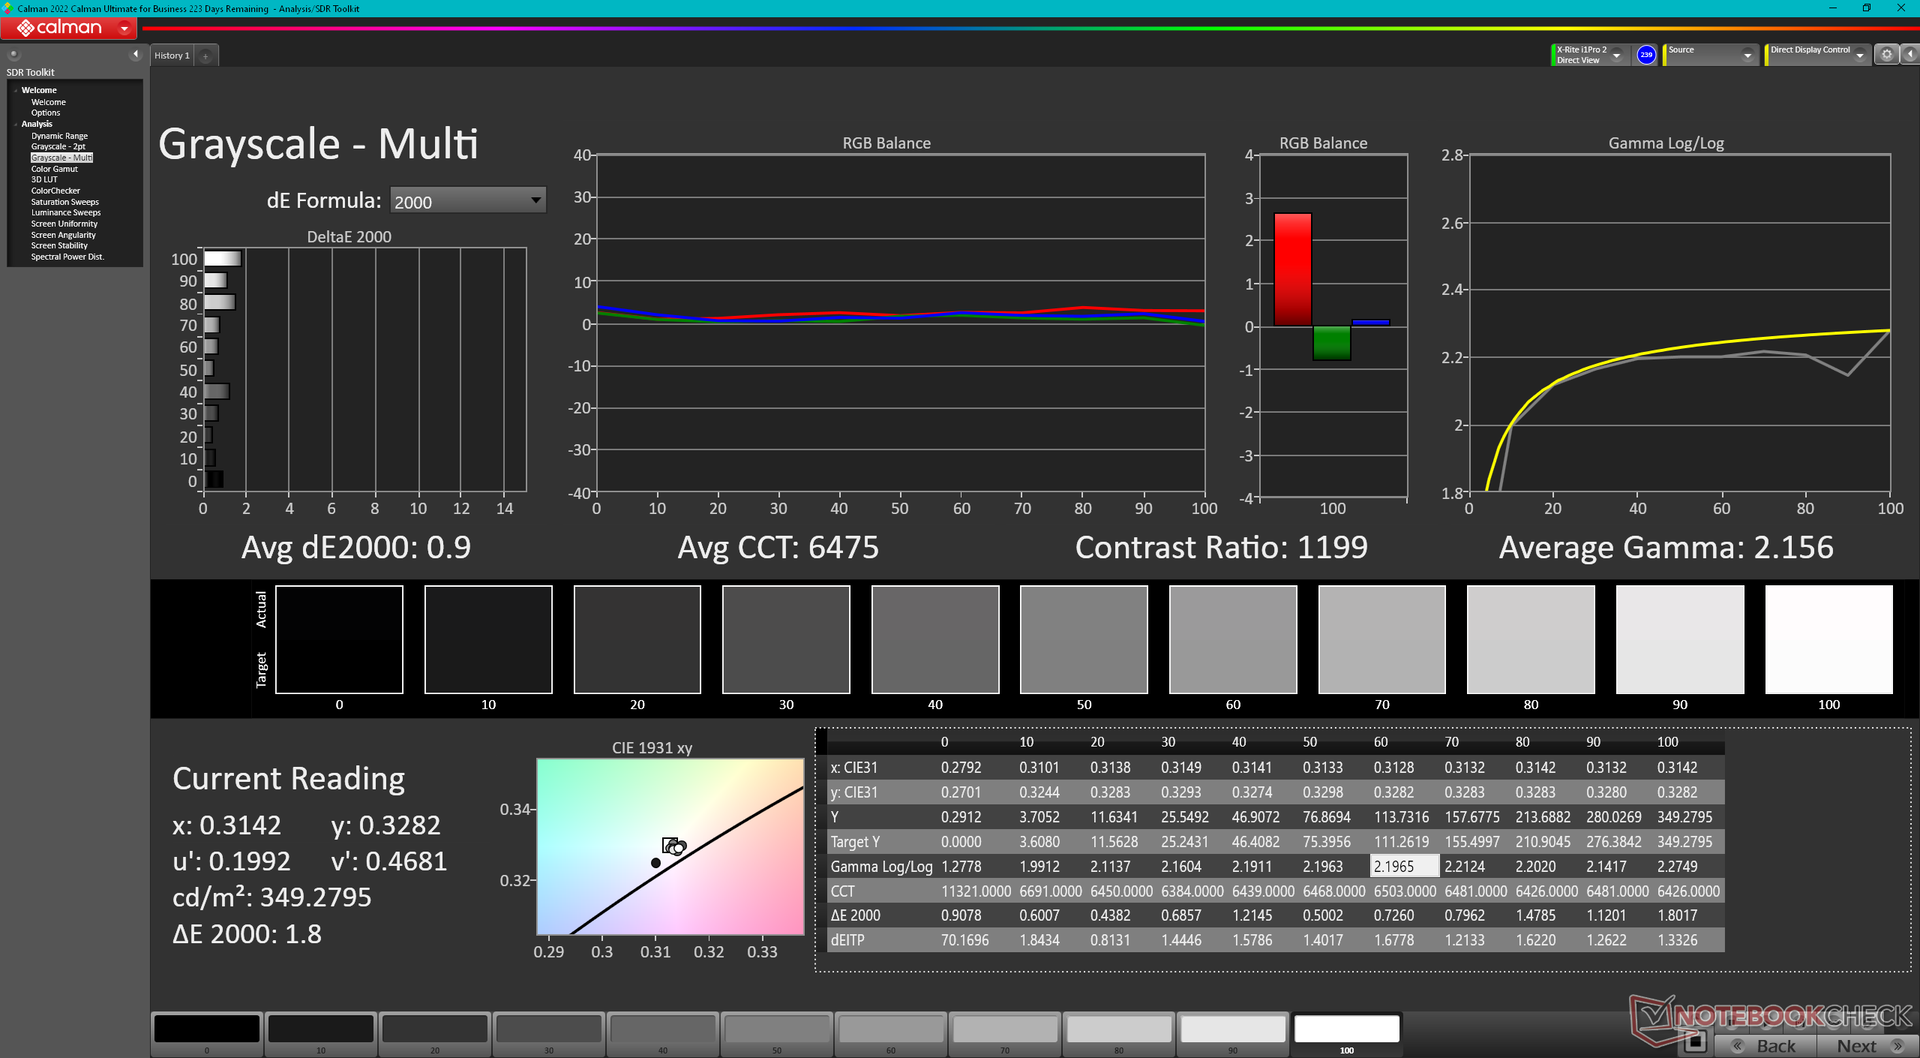
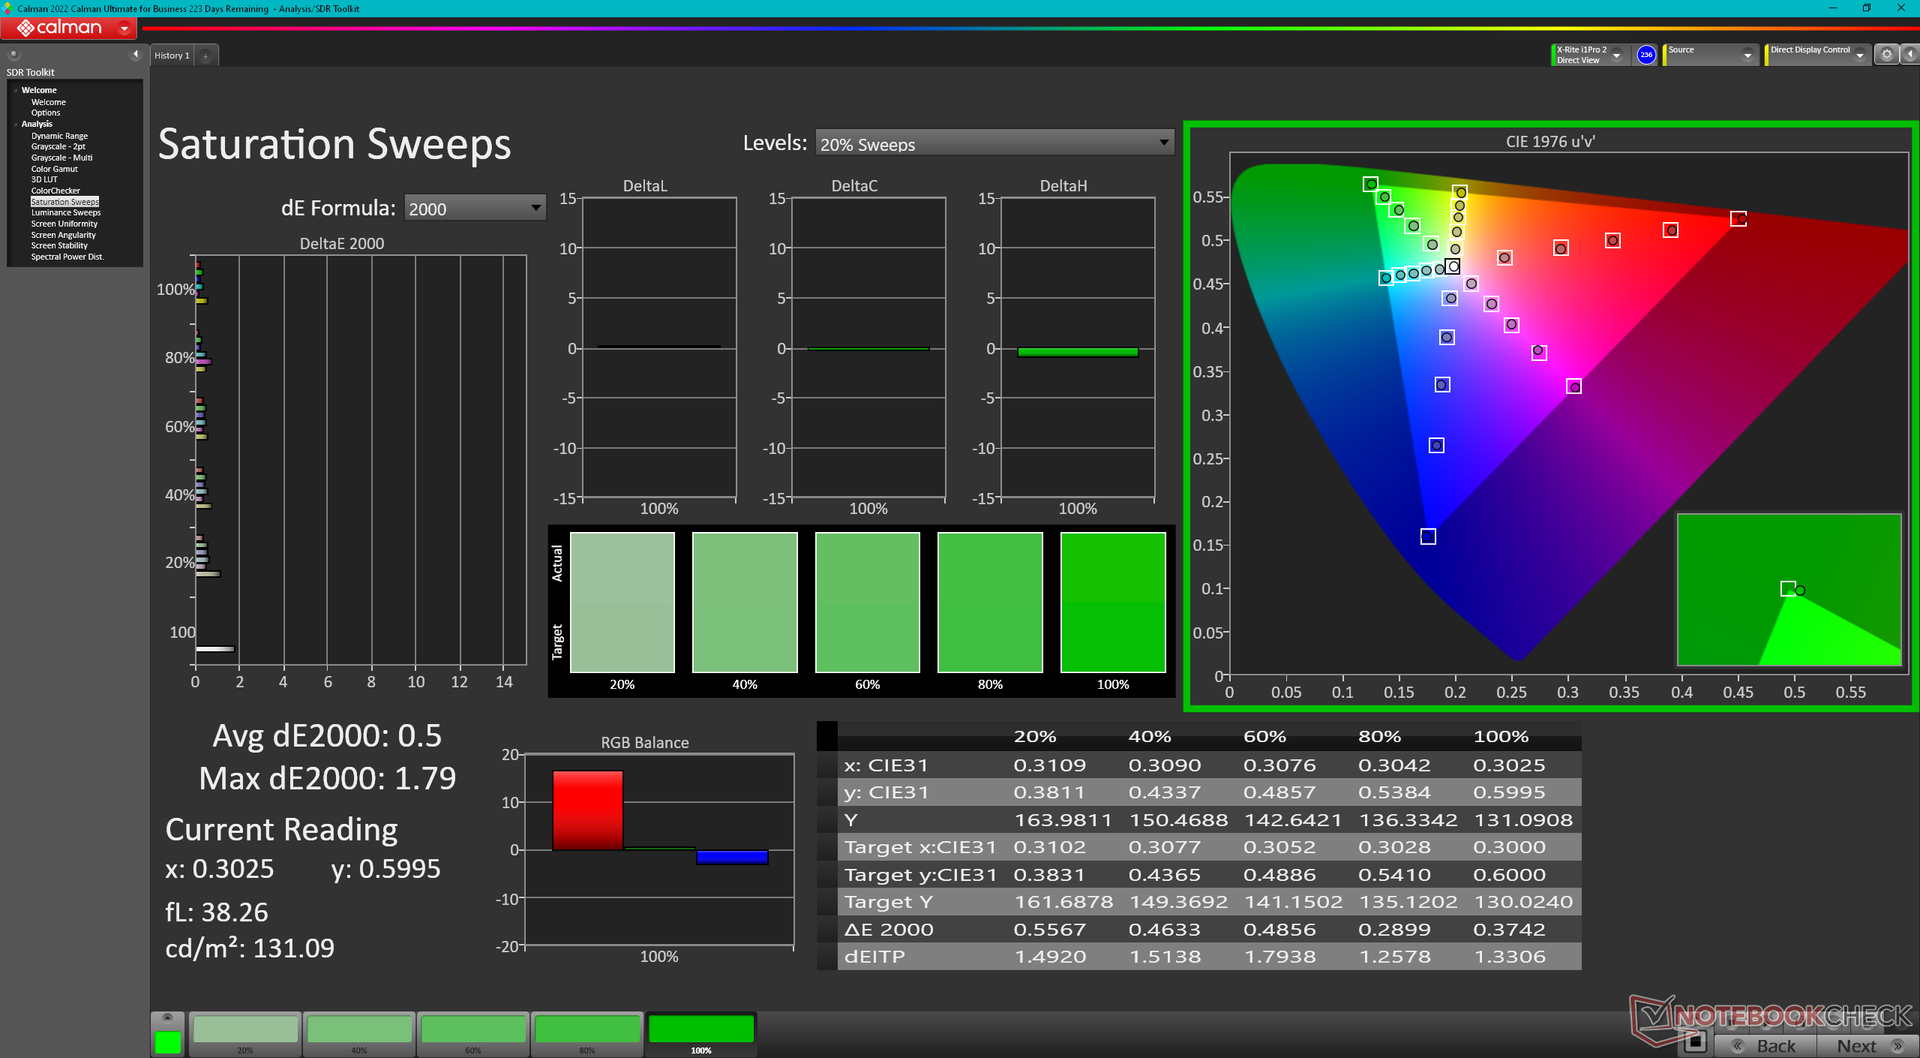
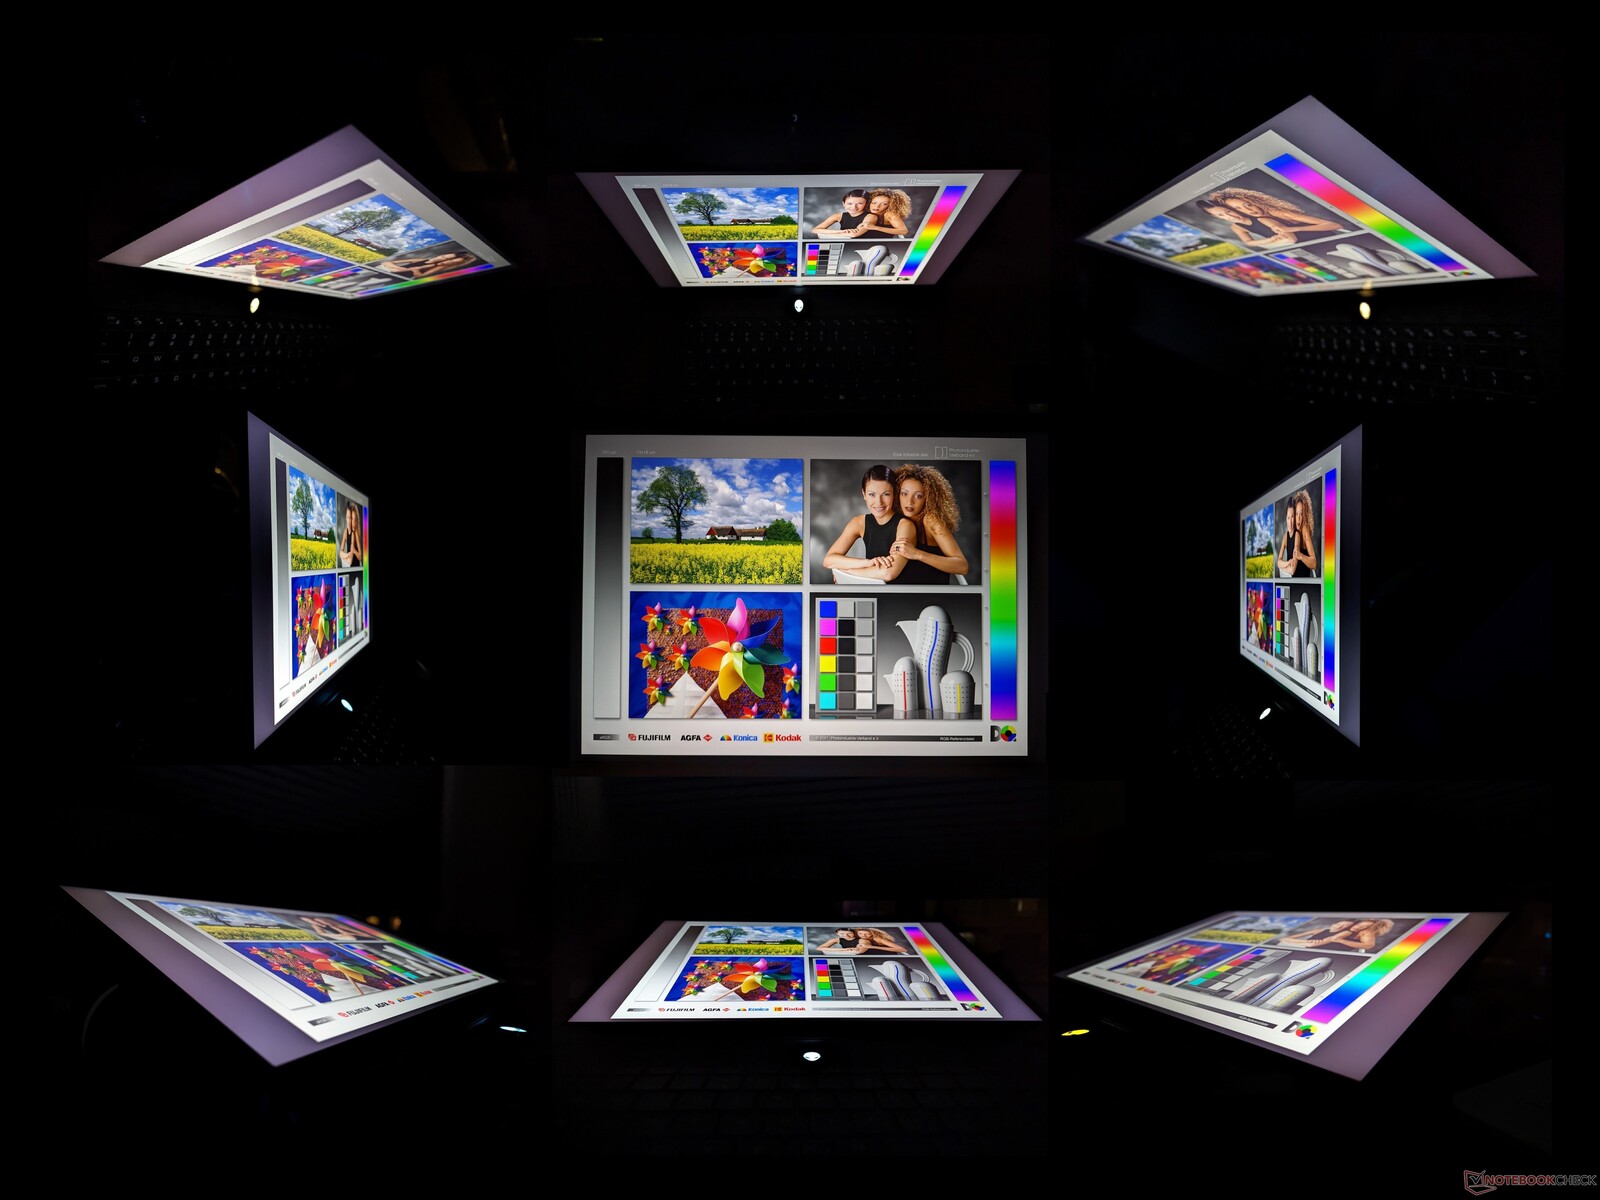
Display - 240 Hz och full sRGB nu standard
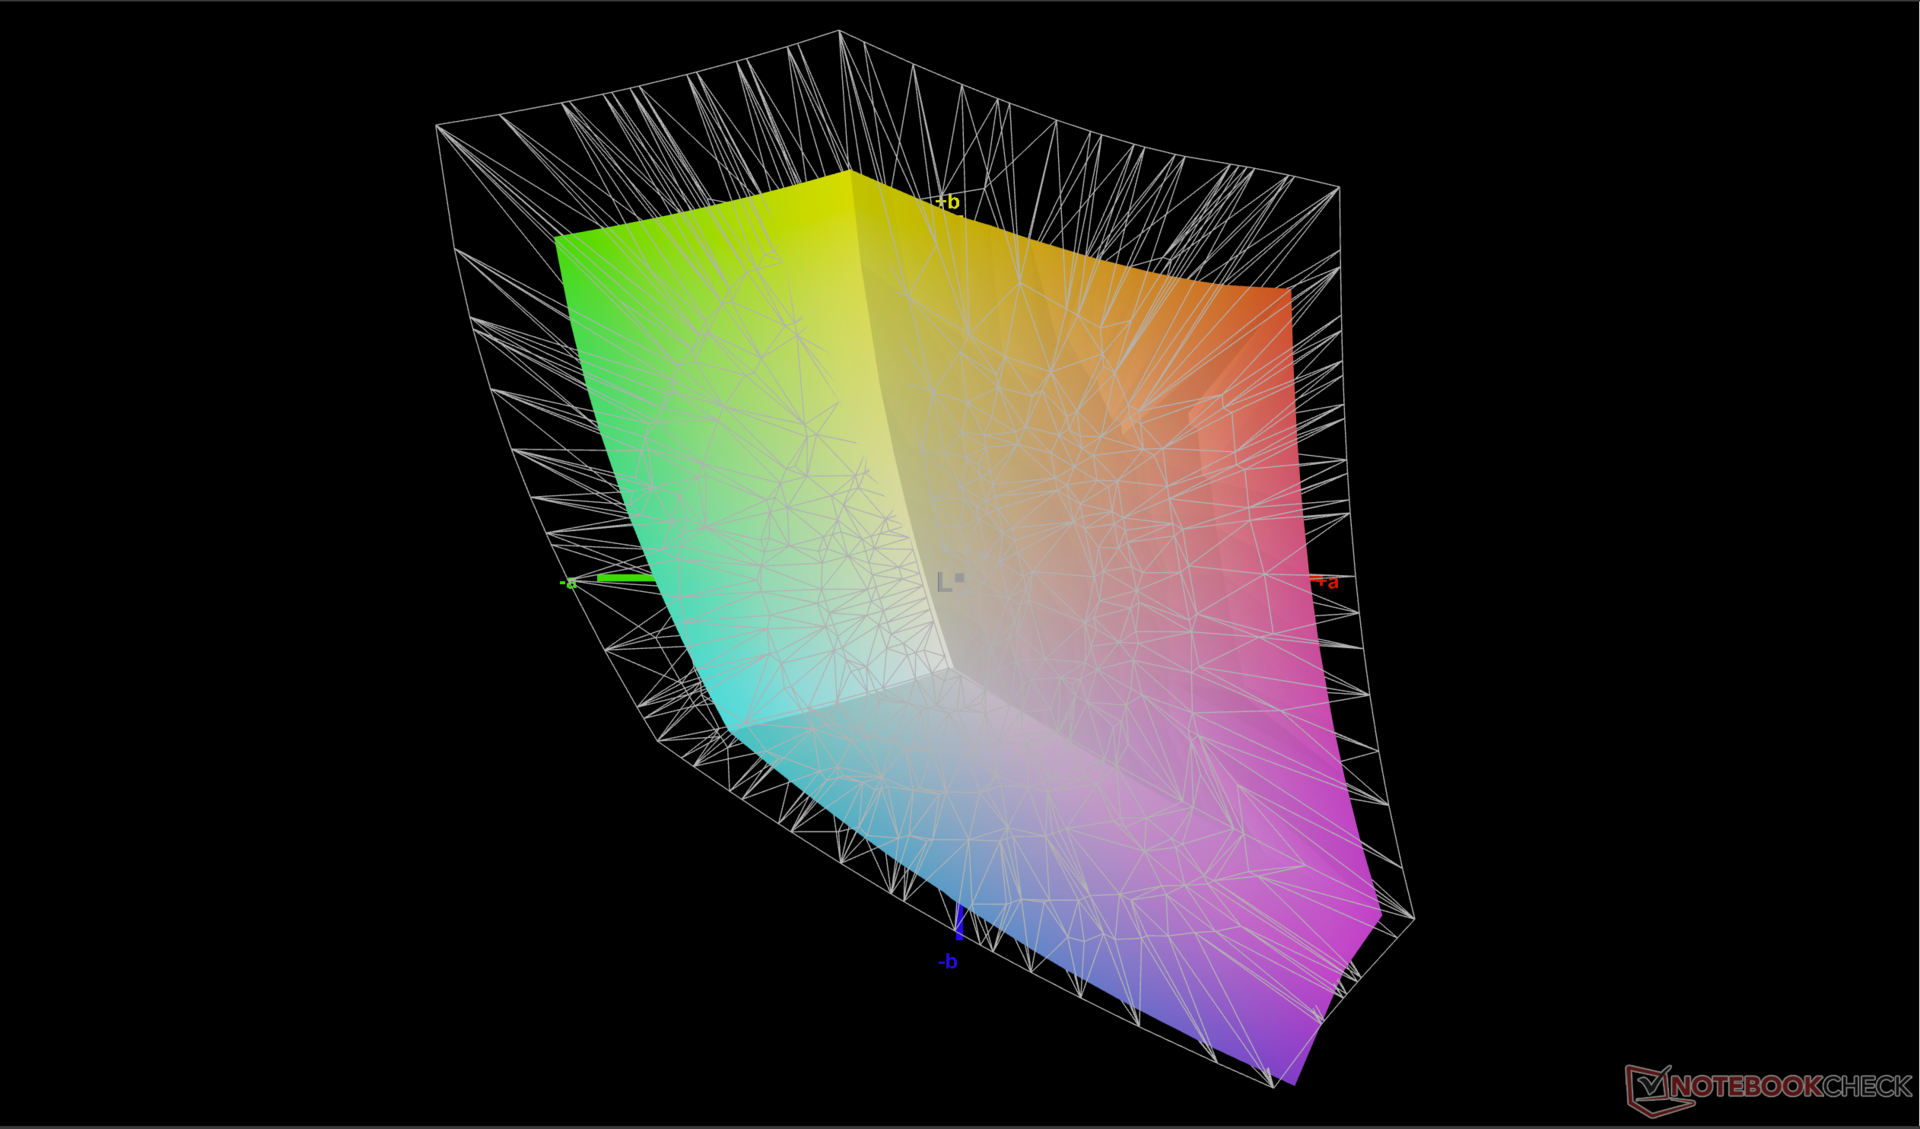
Modellen använder en BOE NE16NYH-panel i motsats till BOE NE16NYB på förra årets m16 R1. Den nyare panelen har en snabbare inbyggd uppdateringsfrekvens (240 Hz jämfört med 165 Hz) medan alla andra egenskaper är i stort sett desamma, inklusive snabba svartvita svarstider, kontrastförhållande ~1000:1, full sRGB-täckning och maximal ljusstyrka på 300 till 350 nit. Skärmen lämpar sig för både spel och amatörredigering.
Även om den nya panelen är smidig saknar den fortfarande DCI-P3-färger och Windows variabla uppdateringsfrekvens. Det förstnämnda skulle ha tilltalat mer professionella grafikredigerare medan det sistnämnda skulle ha förbättrat batteritiden. Fullständiga DCI-P3 färger är tillgängliga på x16 R1, HP Omen Transcend 16 och Asus ROG Zephyrus G16. HDR stöds inte heller eftersom skärmen inte är tillräckligt ljusstark för att uppfylla kraven för HDR400+.
| |||||||||||||||||||||||||
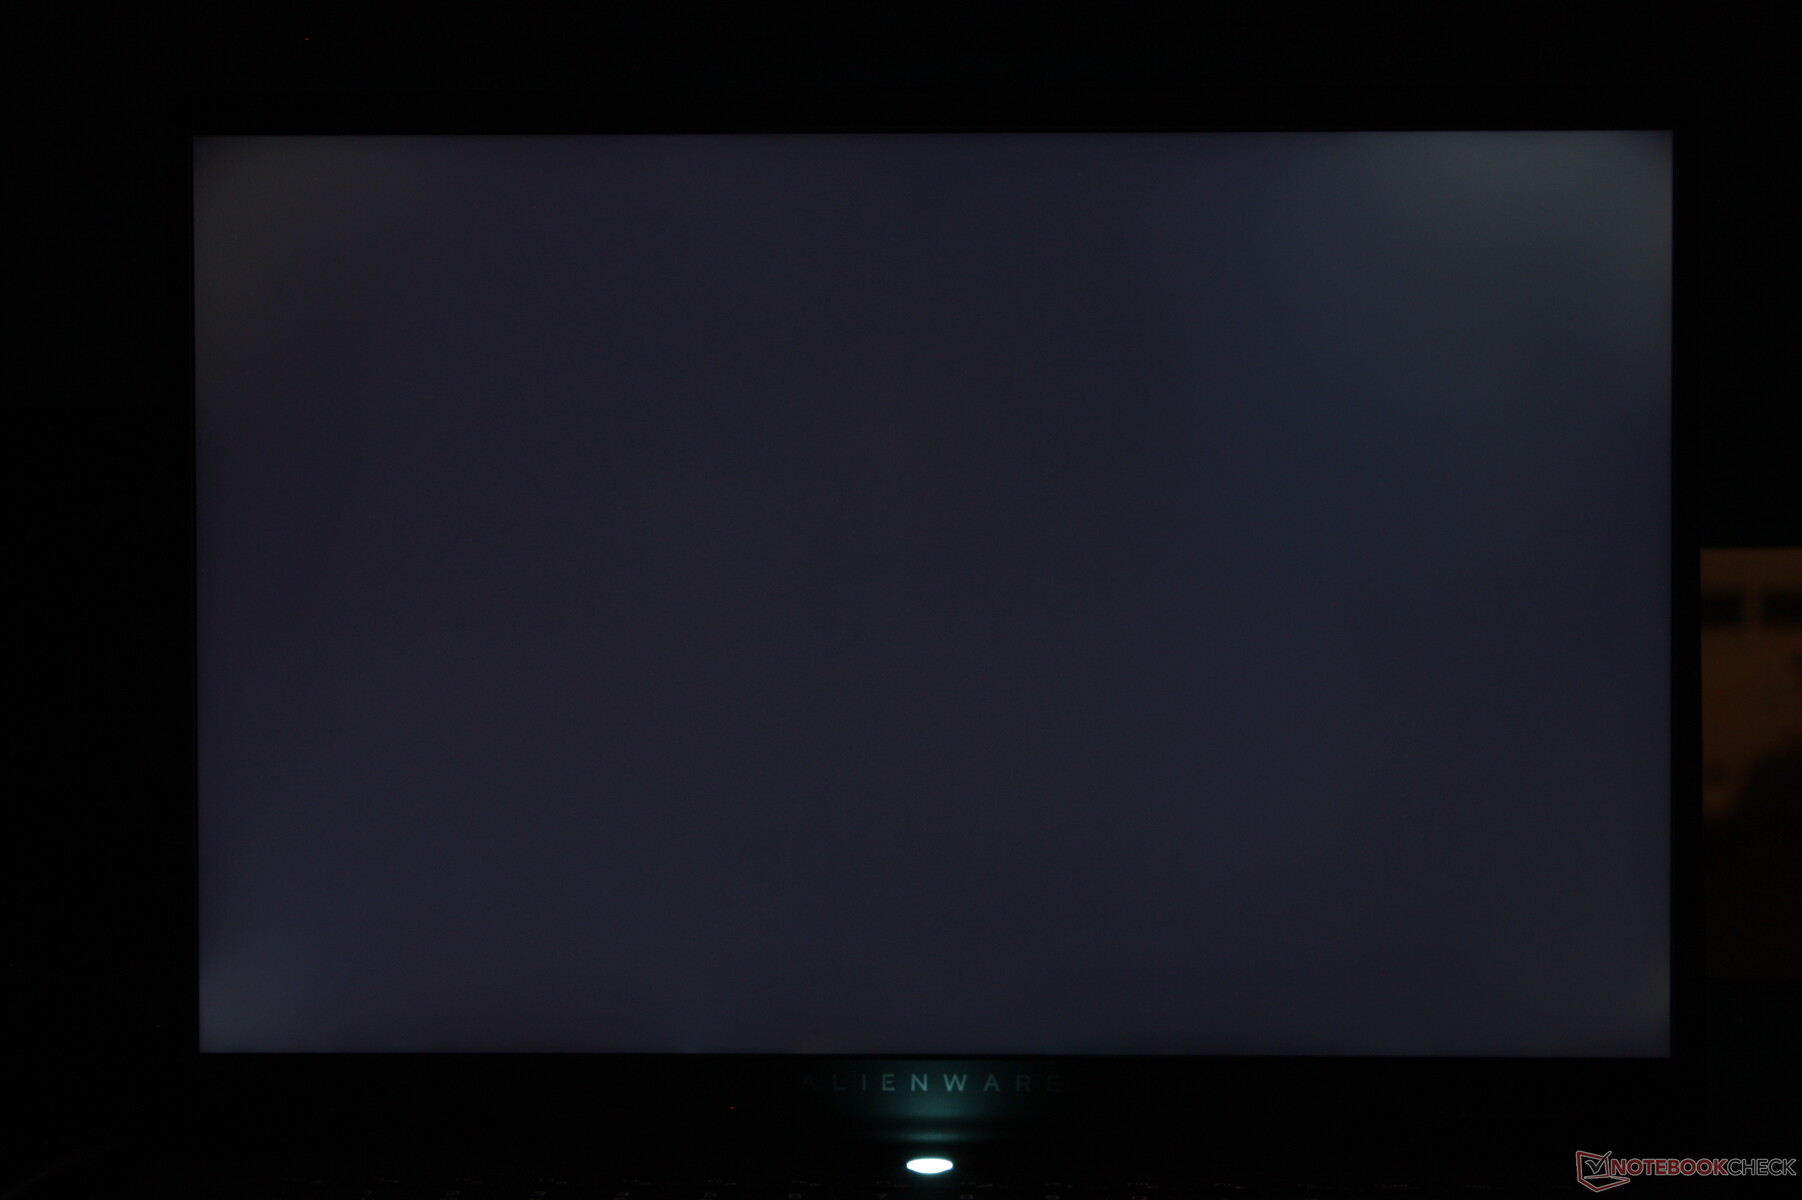
Distribution av ljusstyrkan: 87 %
Mitt på batteriet: 345.8 cd/m²
Kontrast: 1153:1 (Svärta: 0.3 cd/m²)
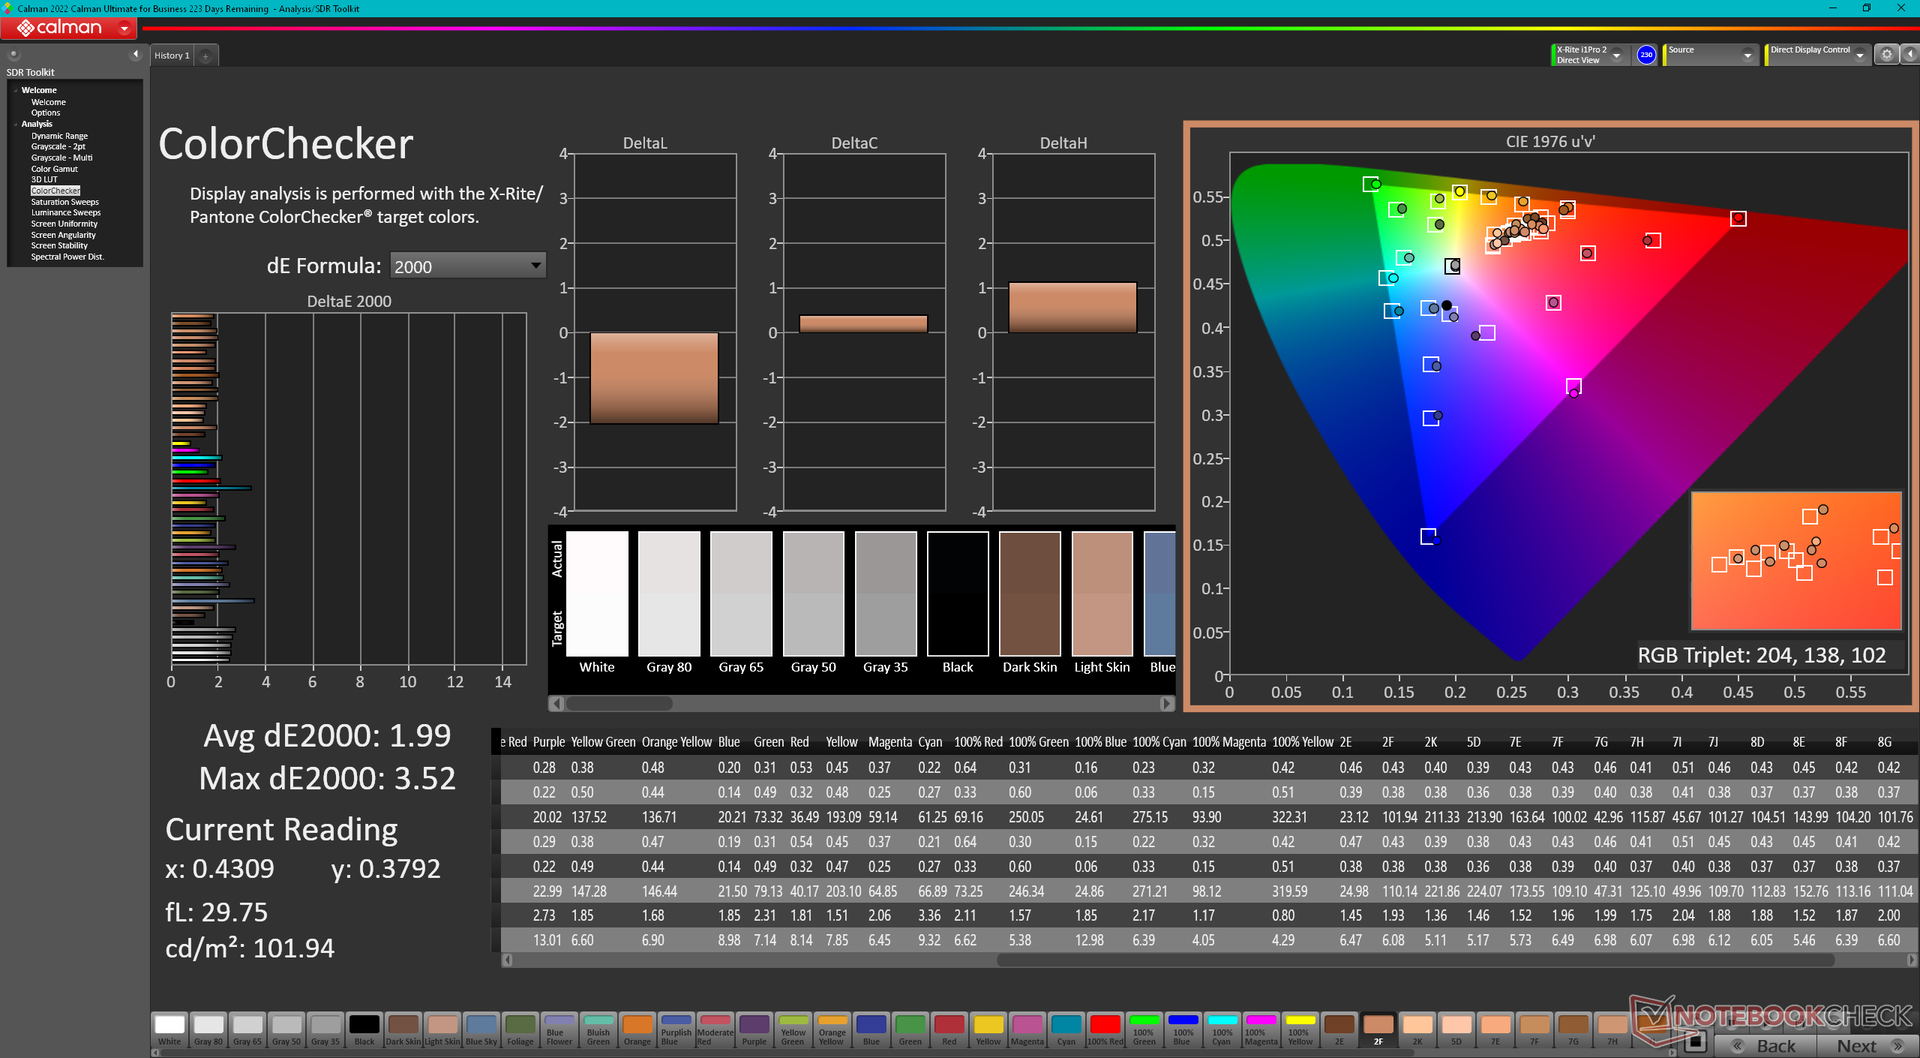
ΔE ColorChecker Calman: 1.99 | ∀{0.5-29.43 Ø4.71}
calibrated: 0.62
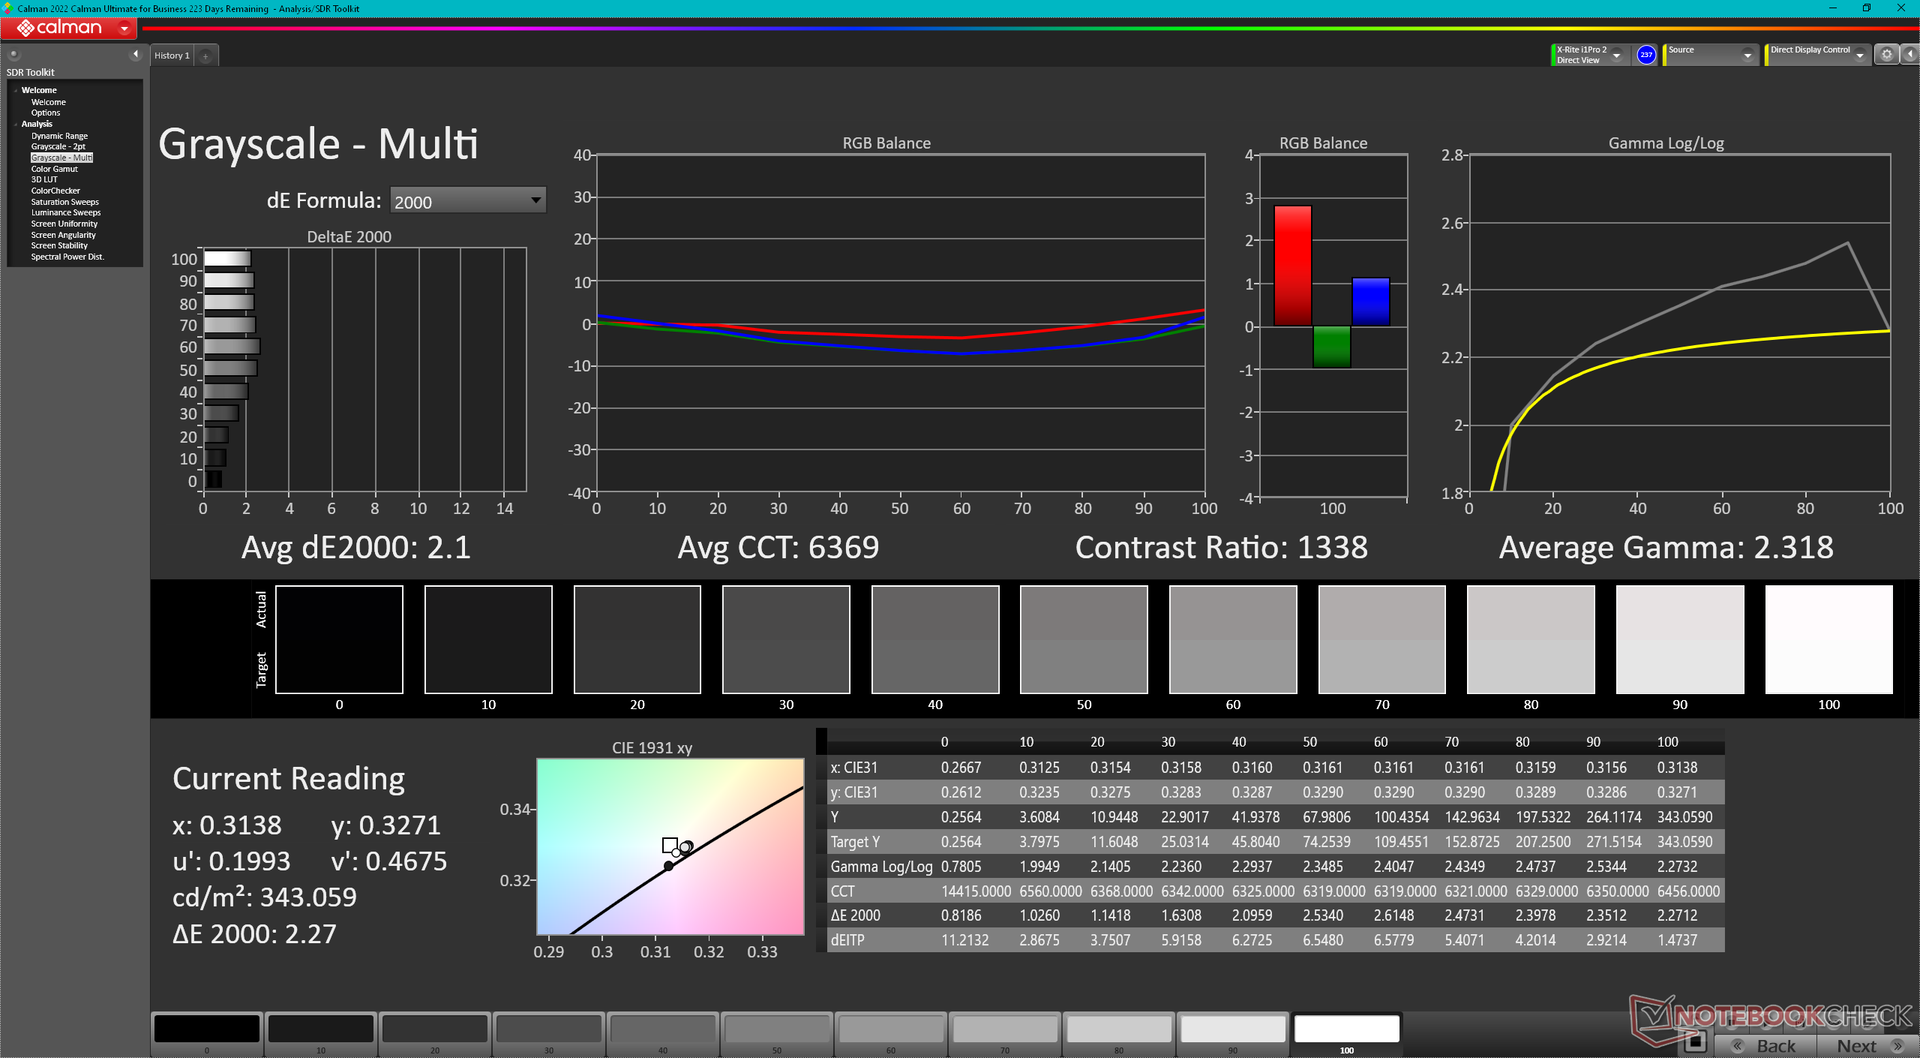
ΔE Greyscale Calman: 2.1 | ∀{0.09-98 Ø4.96}
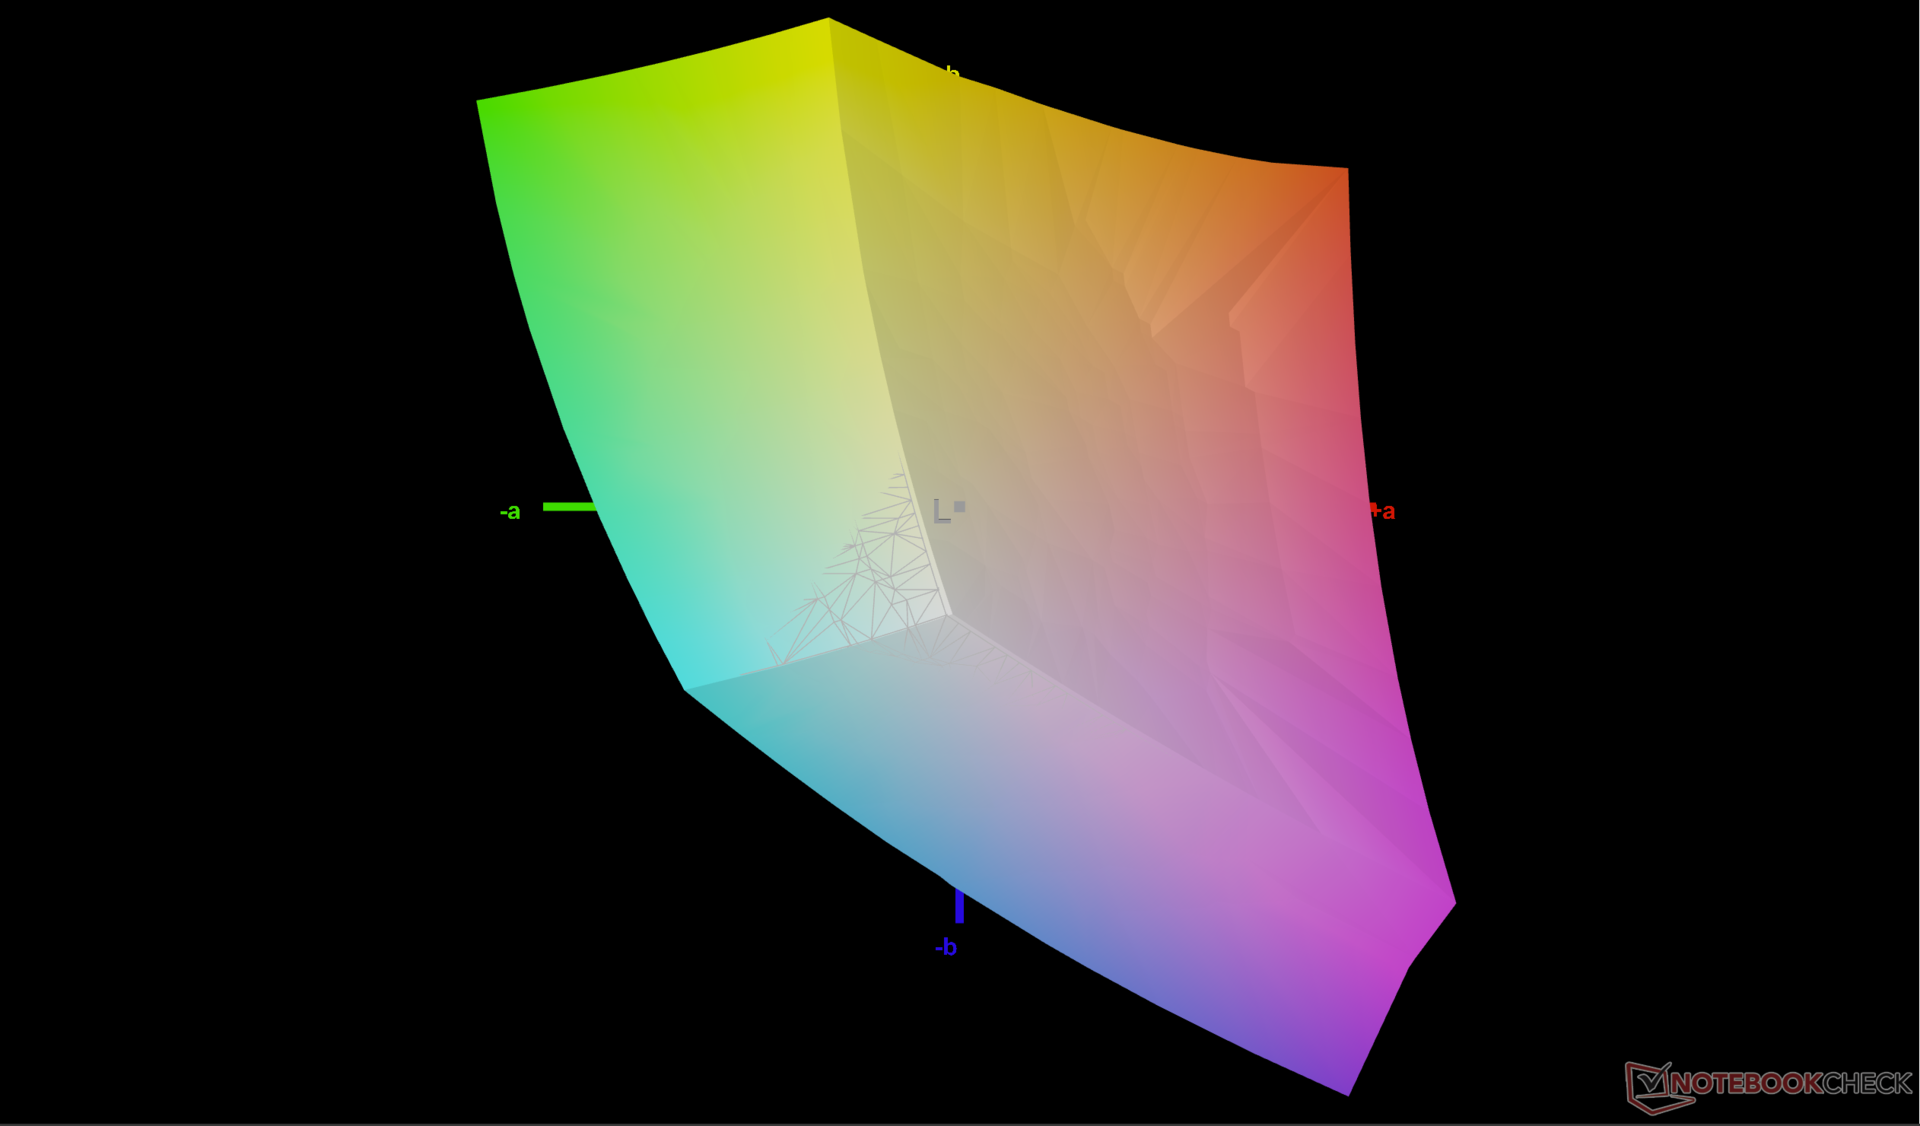
71.4% AdobeRGB 1998 (Argyll 3D)
100% sRGB (Argyll 3D)
71% Display P3 (Argyll 3D)
Gamma: 2.32
CCT: 6369 K
| Alienware m16 R2 BOE NE16NYH, IPS, 2560x1600, 16" | Alienware m16 R1 Intel BOE NE16NYB, IPS, 2560x1600, 16" | Alienware x16 R1 BOE NE16NZ4, IPS, 2560x1600, 16" | HP Omen Transcend 16-u1095ng ATNA60DL02-0 (SDC41A4), OLED, 2560x1600, 16" | Asus ROG Zephyrus G16 2024 GU605M ATNA60DL01-0, OLED, 2560x1600, 16" | Lenovo Legion Slim 7 16APH8 BOE NE160QDM-NZ3, IPS, 2560x1600, 16" | |
|---|---|---|---|---|---|---|
| Display | -3% | 21% | 26% | 26% | 0% | |
| Display P3 Coverage (%) | 71 | 67.7 -5% | 99.2 40% | 99.8 41% | 99.9 41% | 70.3 -1% |
| sRGB Coverage (%) | 100 | 97.2 -3% | 100 0% | 100 0% | 100 0% | 99.6 0% |
| AdobeRGB 1998 Coverage (%) | 71.4 | 70 -2% | 88.6 24% | 97 36% | 96.9 36% | 72.4 1% |
| Response Times | 23% | -4% | 97% | 97% | -45% | |
| Response Time Grey 50% / Grey 80% * (ms) | 5.7 ? | 4 ? 30% | 5.1 ? 11% | 0.2 ? 96% | 0.22 ? 96% | 12.6 ? -121% |
| Response Time Black / White * (ms) | 8.7 ? | 7.3 ? 16% | 10.3 ? -18% | 0.2 ? 98% | 0.25 ? 97% | 5.9 ? 32% |
| PWM Frequency (Hz) | 120 ? | 960 ? | ||||
| Screen | -20% | -13% | 129% | 14% | 5% | |
| Brightness middle (cd/m²) | 345.8 | 306 -12% | 302.2 -13% | 390 13% | 416 20% | 545 58% |
| Brightness (cd/m²) | 337 | 302 -10% | 285 -15% | 392 16% | 418 24% | 502 49% |
| Brightness Distribution (%) | 87 | 89 2% | 89 2% | 98 13% | 96 10% | 82 -6% |
| Black Level * (cd/m²) | 0.3 | 0.3 -0% | 0.26 13% | 0.02 93% | 0.48 -60% | |
| Contrast (:1) | 1153 | 1020 -12% | 1162 1% | 19500 1591% | 1135 -2% | |
| Colorchecker dE 2000 * | 1.99 | 2.57 -29% | 1.63 18% | 1.94 3% | 1.6 20% | 1.36 32% |
| Colorchecker dE 2000 max. * | 3.52 | 4.26 -21% | 4.13 -17% | 4.26 -21% | 2.1 40% | 3.11 12% |
| Colorchecker dE 2000 calibrated * | 0.62 | 0.85 -37% | 1.17 -89% | 4.21 -579% | 1.04 -68% | |
| Greyscale dE 2000 * | 2.1 | 3.3 -57% | 2.5 -19% | 1.5 29% | 2.7 -29% | 1.4 33% |
| Gamma | 2.32 95% | 1.997 110% | 2.23 99% | 2.221 99% | 2.16 102% | 2.253 98% |
| CCT | 6369 102% | 6895 94% | 6590 99% | 6395 102% | 6331 103% | 6631 98% |
| Totalt genomsnitt (program/inställningar) | 0% /
-10% | 1% /
-4% | 84% /
102% | 46% /
32% | -13% /
-3% |
* ... mindre är bättre
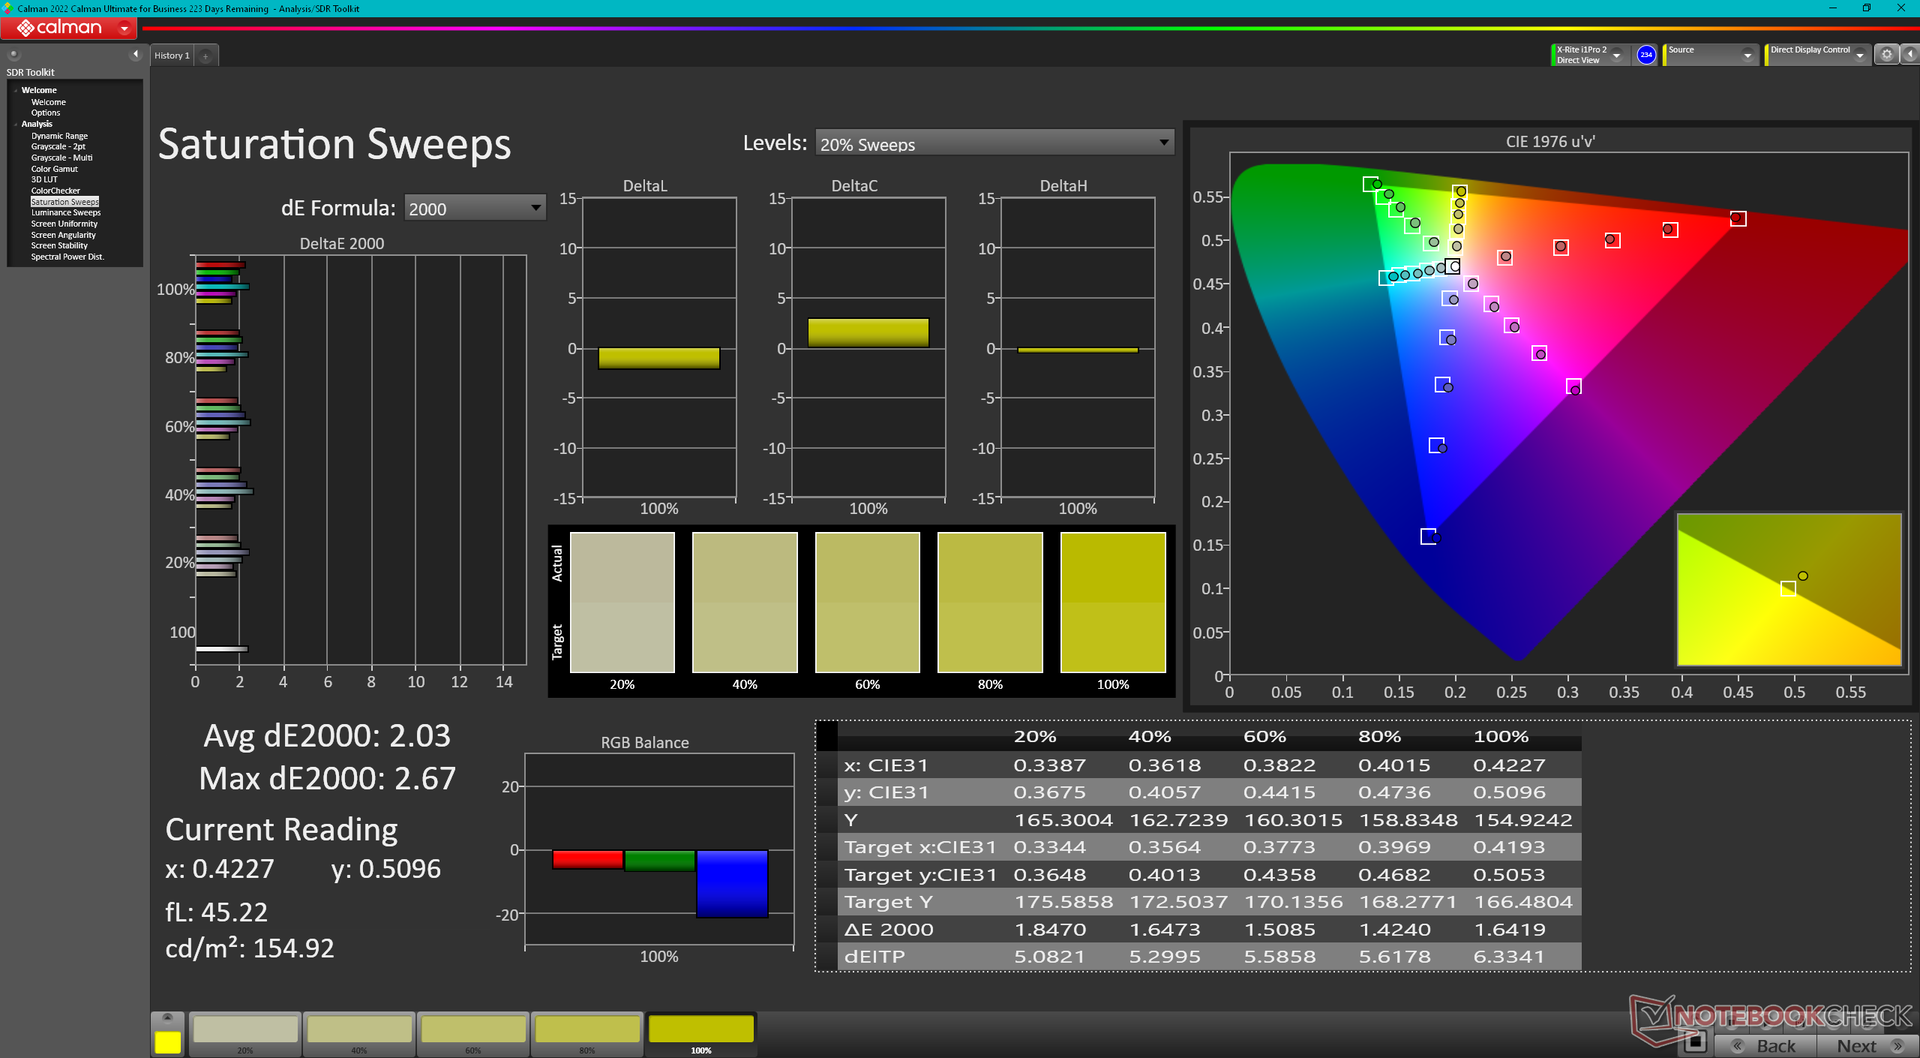
Skärmen är väl kalibrerad direkt från förpackningen med genomsnittliga deltaE-värden för gråskala och färg på bara 2,1 respektive 1,99. Resultaten skulle förbättras ännu mer till <1 vardera när de kalibreras ytterligare med vår X-Rite-kolorimeter, men detta bör inte vara nödvändigt för de flesta användare. Vår kalibrerade ICM-profil finns tillgänglig för gratis nedladdning ovan.

Visa svarstider
| ↔ Svarstid svart till vitt | ||
|---|---|---|
| 8.7 ms ... stiga ↗ och falla ↘ kombinerat | ↗ 4.6 ms stiga | 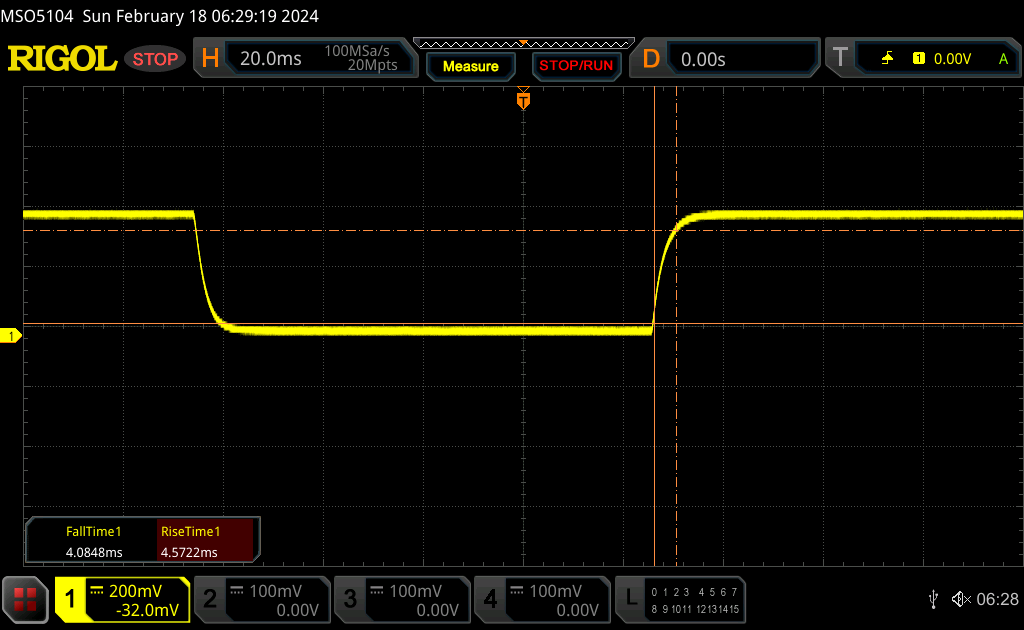 |
| ↘ 4.1 ms hösten | ||
| Skärmen visar snabba svarsfrekvenser i våra tester och bör passa för spel. I jämförelse sträcker sig alla testade enheter från 0.1 (minst) till 240 (maximalt) ms. » 24 % av alla enheter är bättre. Det betyder att den uppmätta svarstiden är bättre än genomsnittet av alla testade enheter (19.8 ms). | ||
| ↔ Svarstid 50 % grått till 80 % grått | ||
| 5.7 ms ... stiga ↗ och falla ↘ kombinerat | ↗ 2.6 ms stiga | 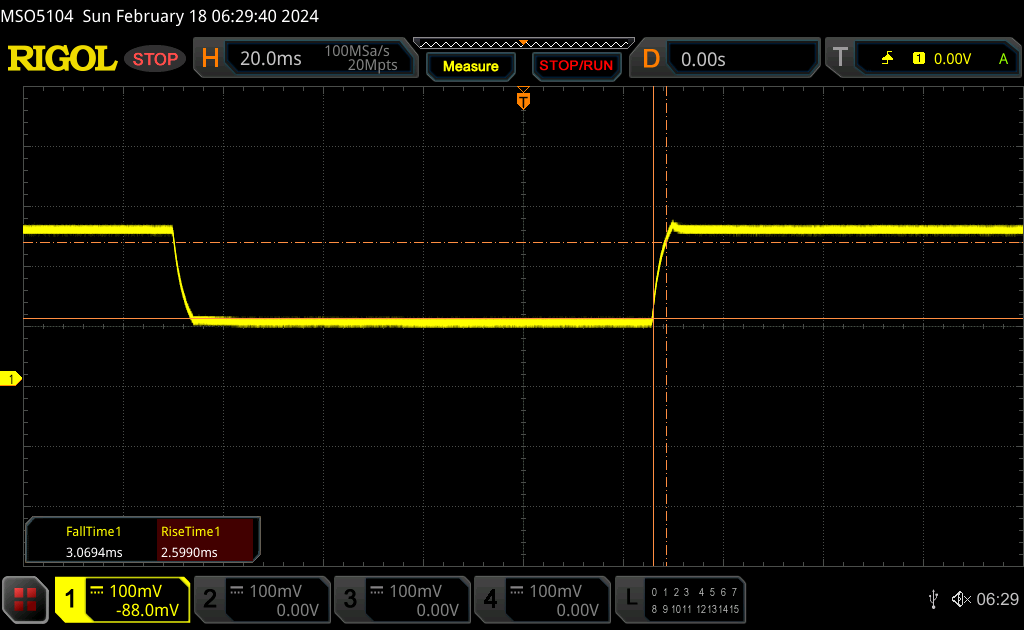 |
| ↘ 3.1 ms hösten | ||
| Skärmen visar väldigt snabba svarsfrekvenser i våra tester och borde vara mycket väl lämpad för fartfyllt spel. I jämförelse sträcker sig alla testade enheter från 0.165 (minst) till 636 (maximalt) ms. » 18 % av alla enheter är bättre. Det betyder att den uppmätta svarstiden är bättre än genomsnittet av alla testade enheter (31 ms). | ||
Skärmflimmer / PWM (Puls-Width Modulation)
| Skärmflimmer / PWM upptäcktes inte |  | ||
Som jämförelse: 52 % av alla testade enheter använder inte PWM för att dämpa skärmen. Om PWM upptäcktes mättes ett medelvärde av 7757 (minst: 5 - maximum: 343500) Hz. | |||
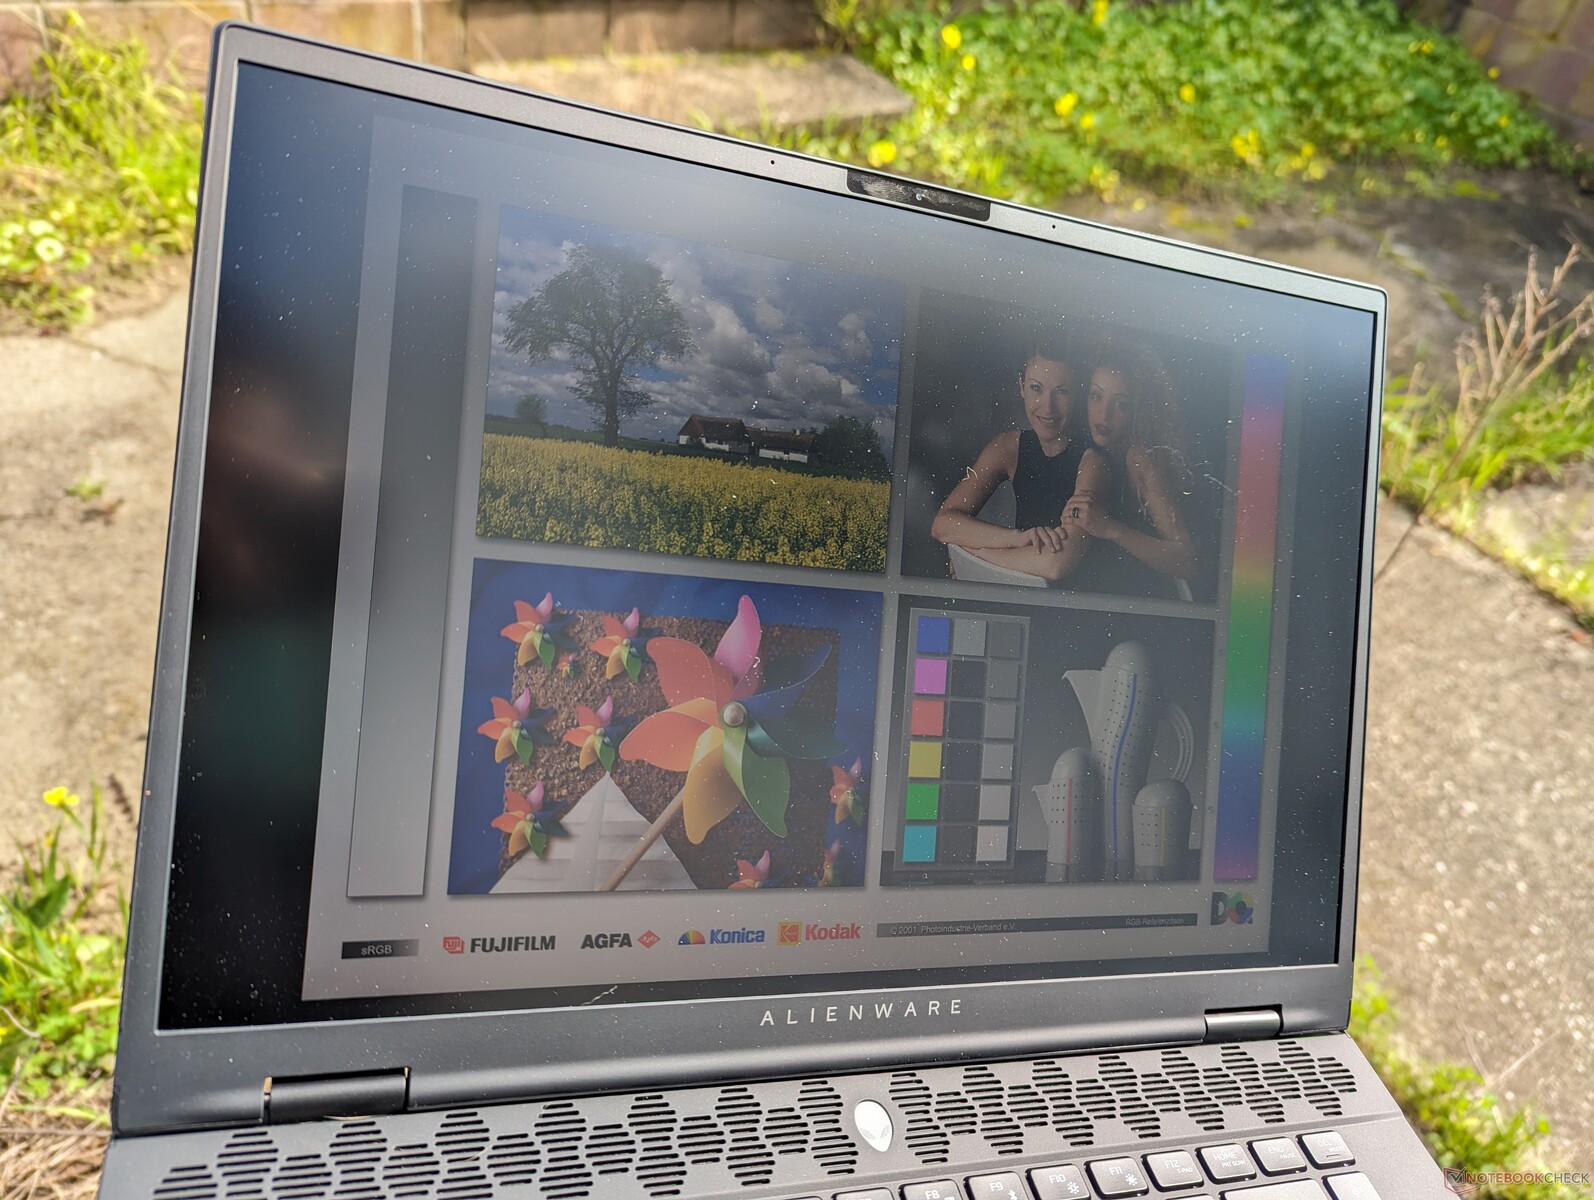
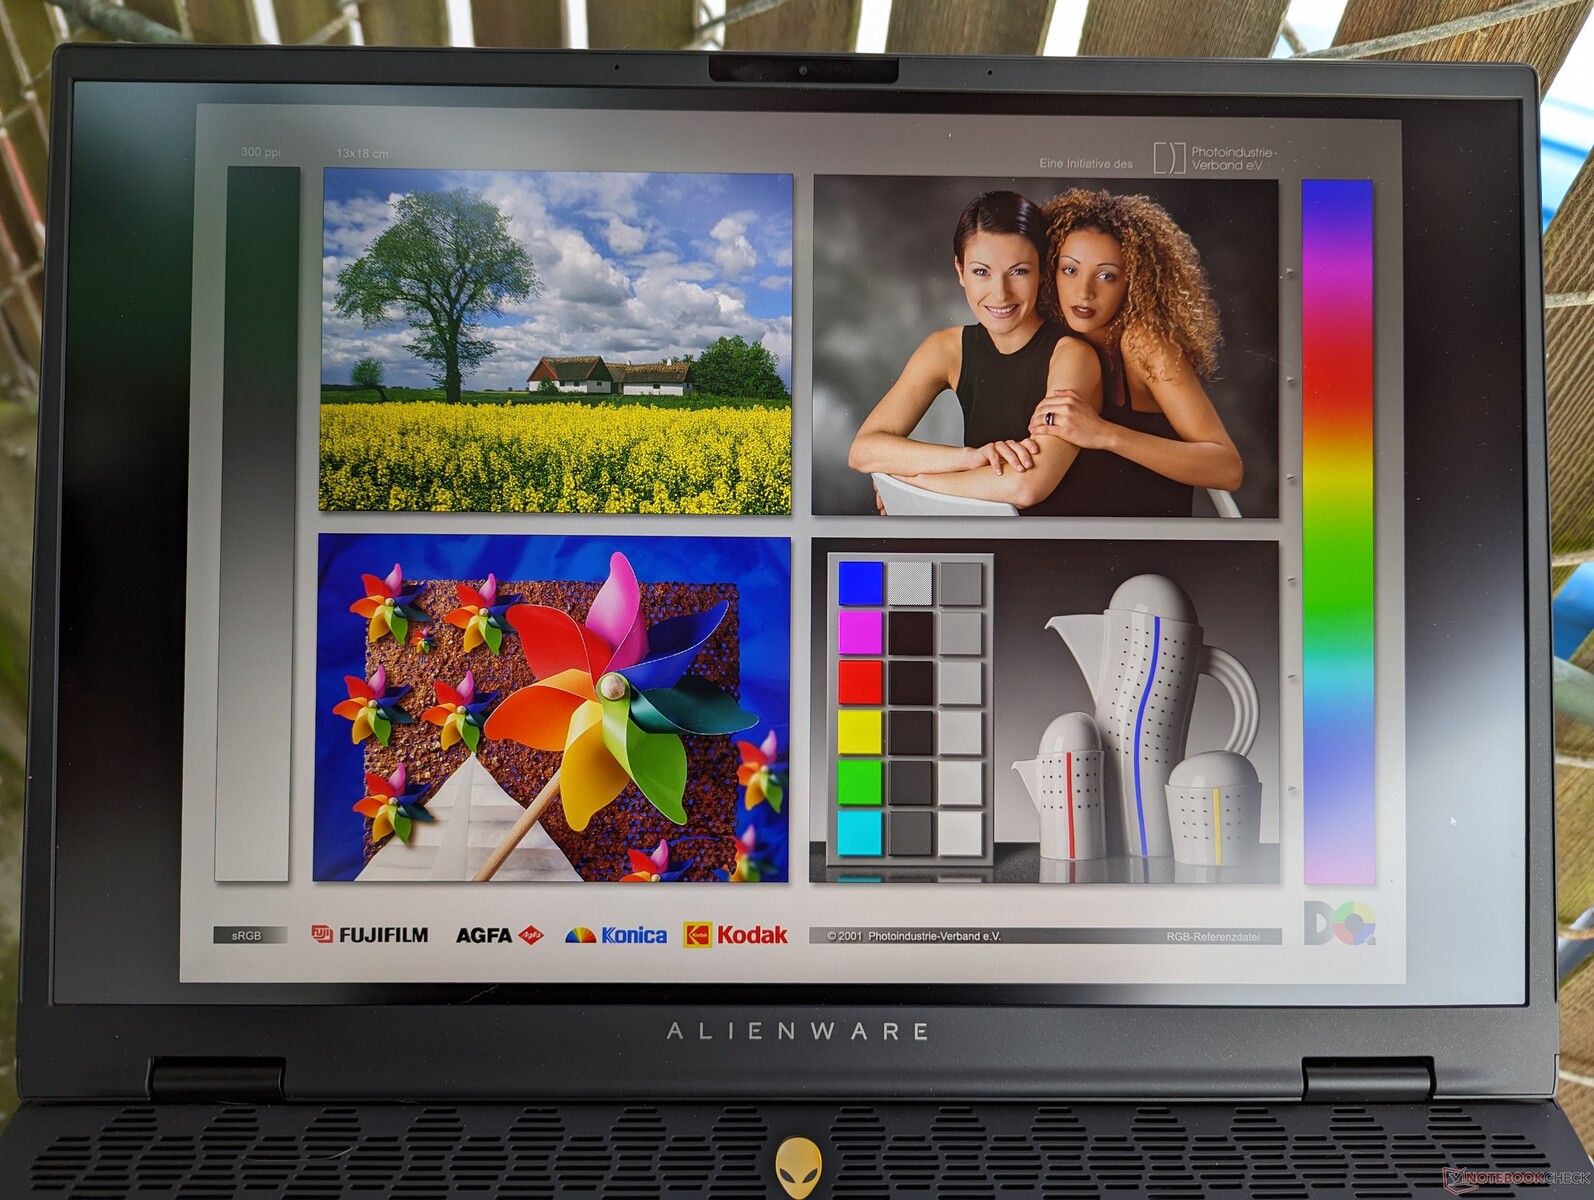
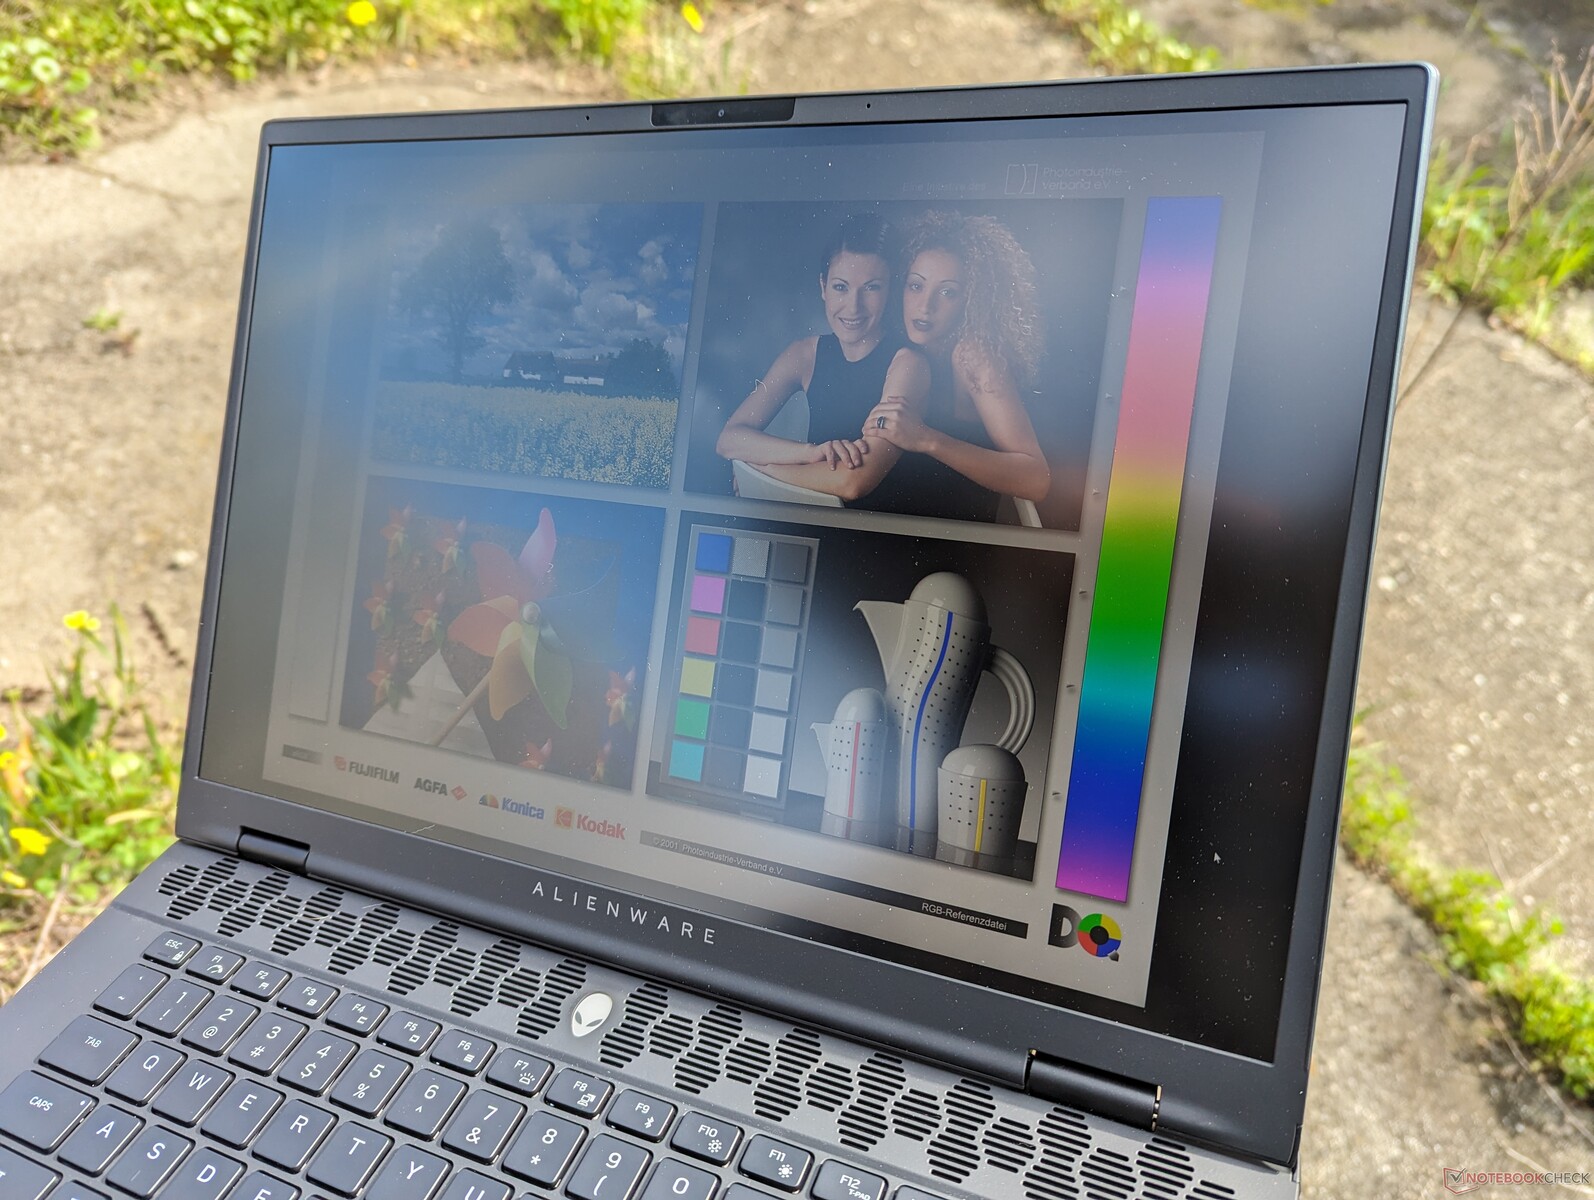
Sikten utomhus är ungefär densamma som tidigare och därför rekommenderas att man håller sig i skuggan när det är möjligt för att minska bländningen och bevara färgerna. Den lägre vikten och mindre storleken gör dock systemet lättare att hantera.
Prestanda - Från Raptor Lake-HX till Meteor Lake-H
Villkor för testning
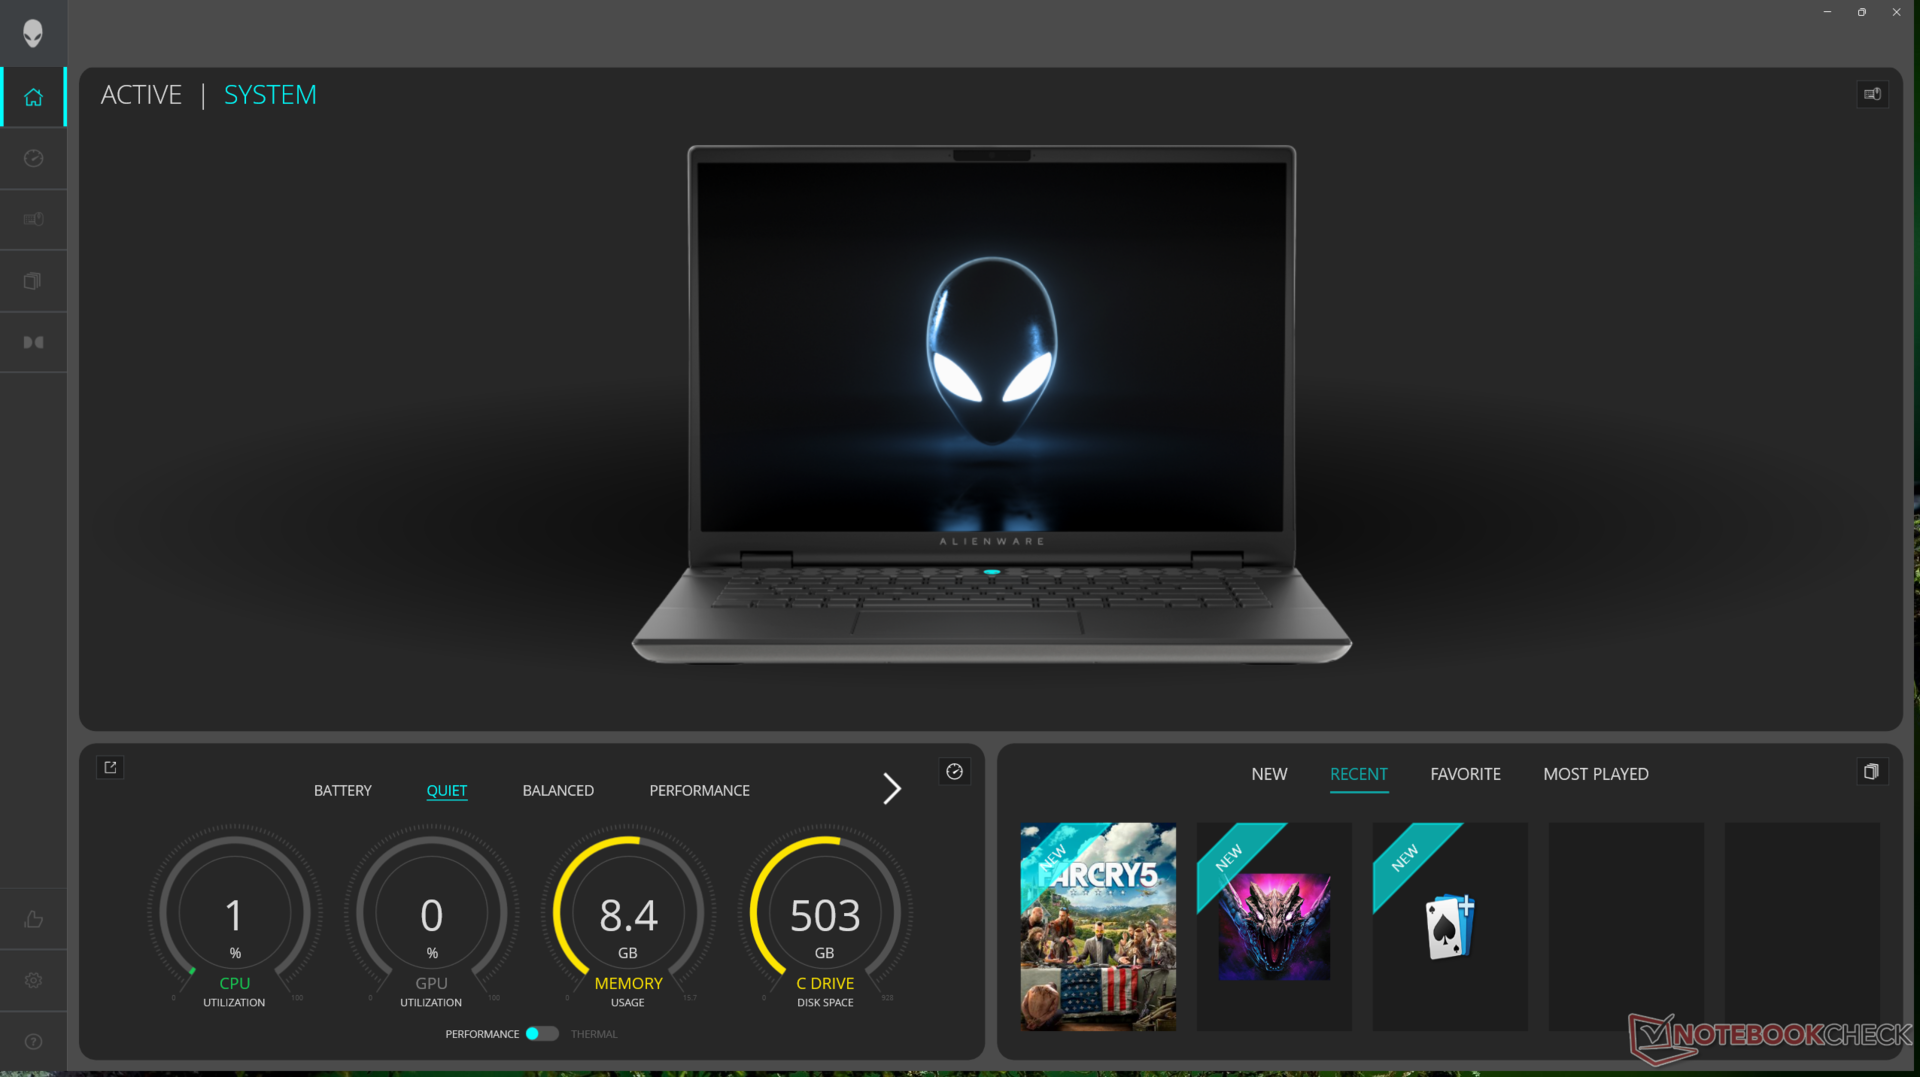
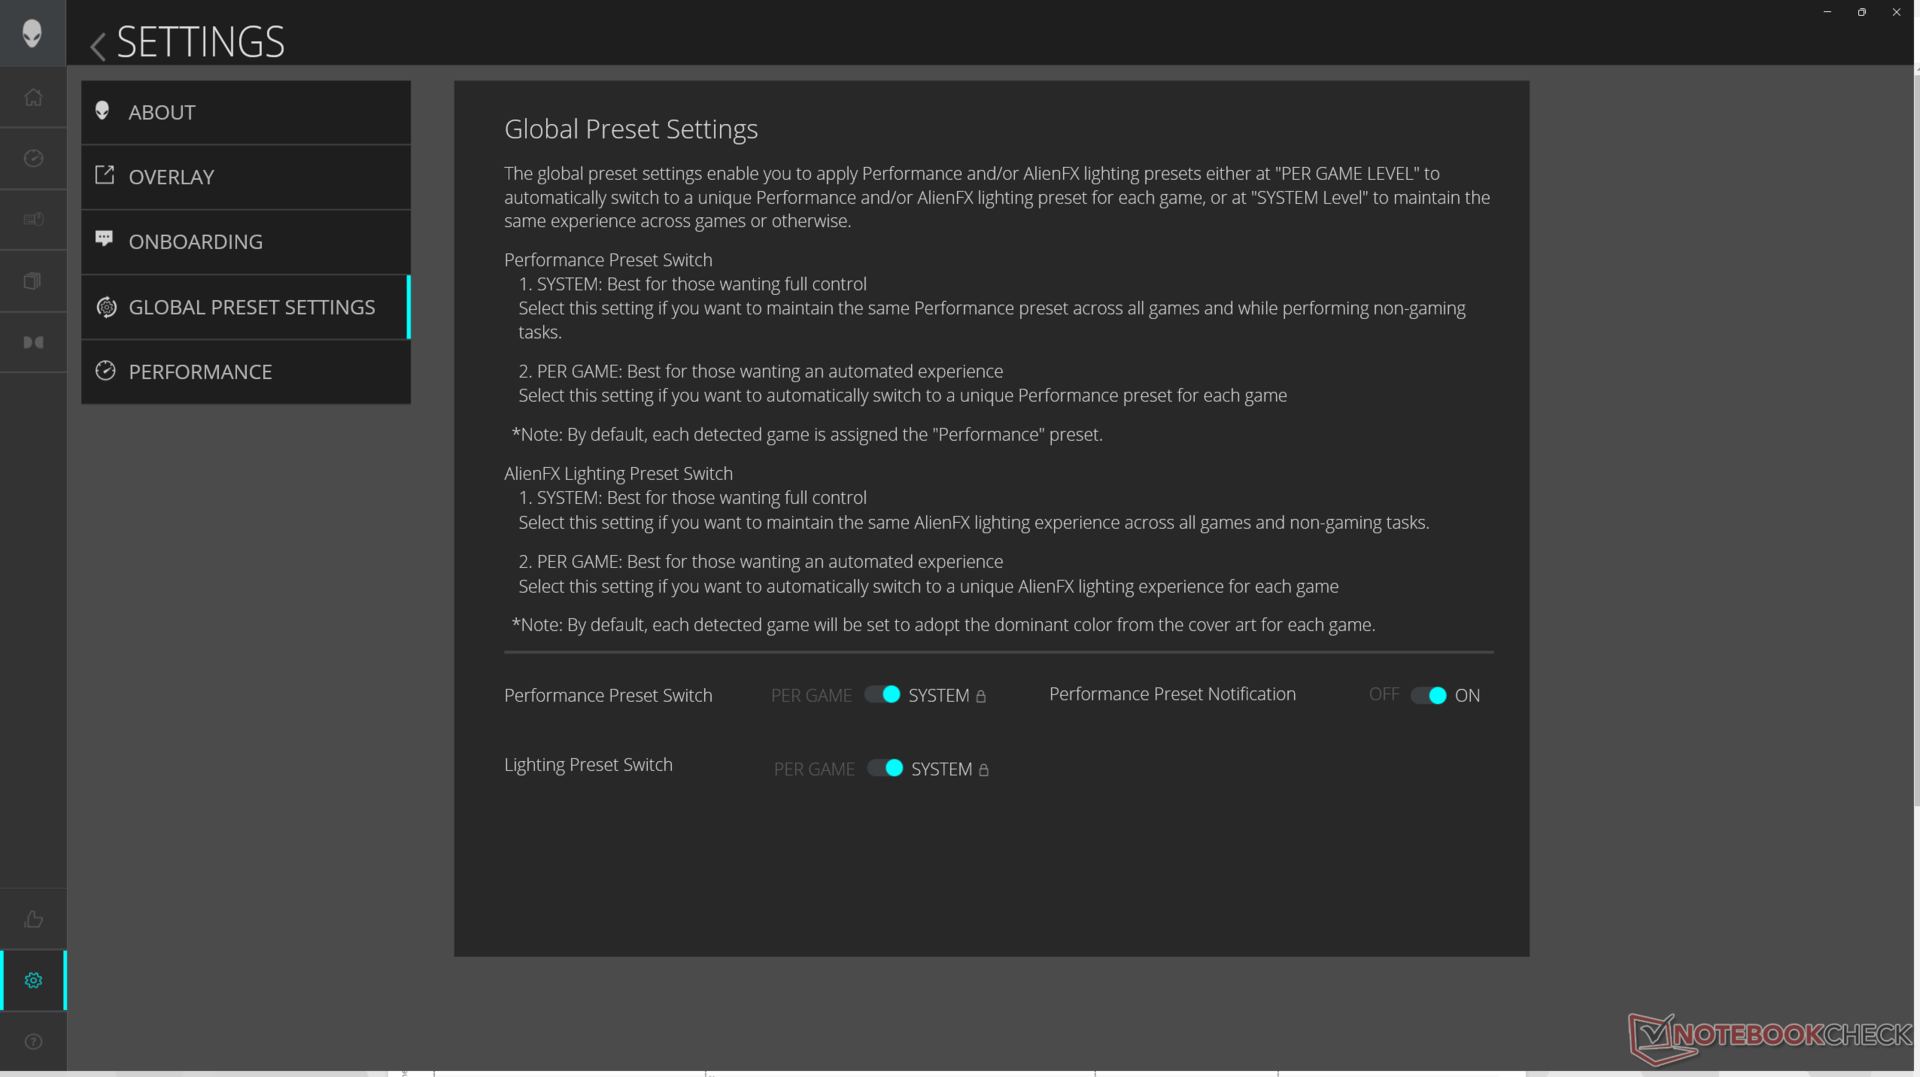
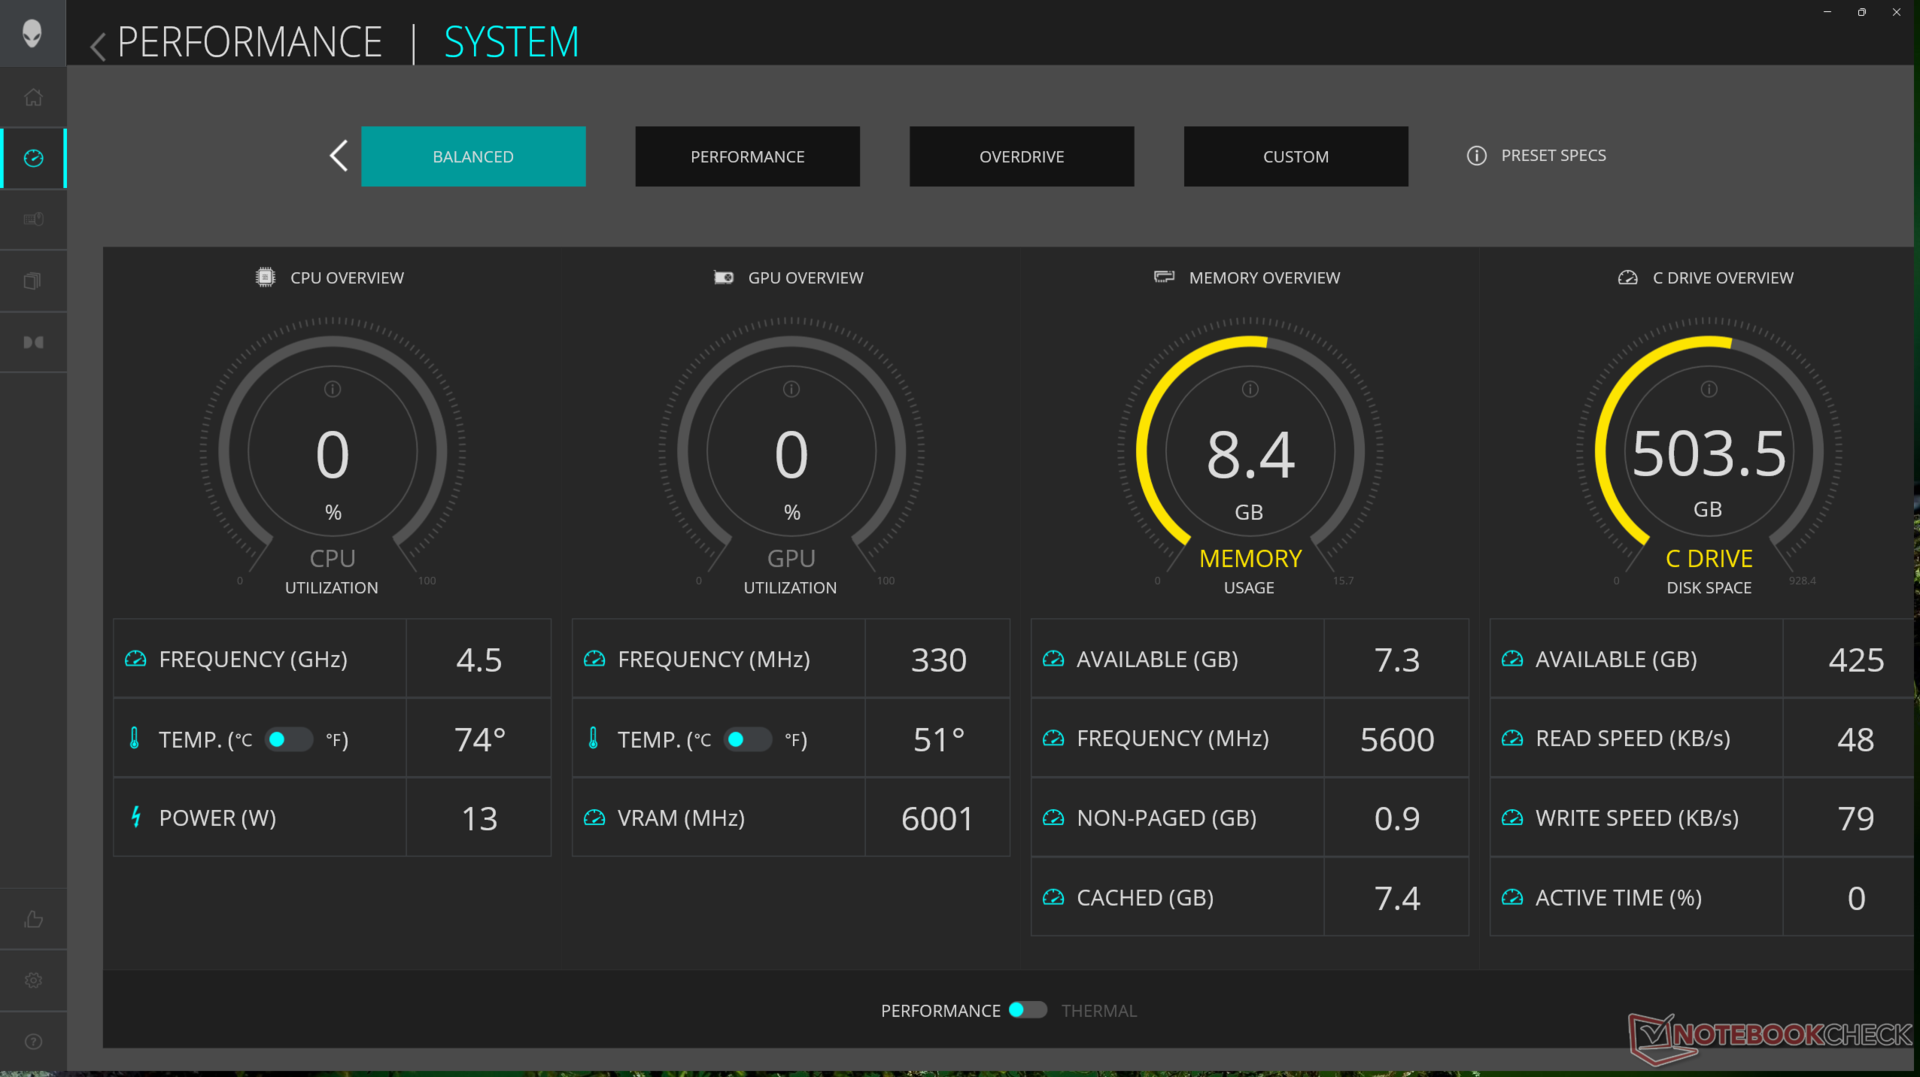
Vi ställde in Alienware Command Center (ACC) till Overdrive-läge och Nvidia Control Panel till dGPU-läge innan vi körde riktmärkena nedan. ACC har uppdaterats för att fungera mycket smidigare och utan många av de problem som vi upplevde på m16 R1. Till exempel startar den nu nästan omedelbart vid uppstart medan fläktprofillägena och AlienFX RGB-belysningen inte längre ändras automatiskt utan att användaren först meddelas.
Trots detta upplevde vi fortfarande en bugg där systemet ibland inte gick in i viloläge korrekt när locket stängdes, även efter dubbelkontroll av Windows Power-inställningarna. Detta ledde till en mycket varm bärbar dator och ett helt urladdat batteri bara några timmar senare.
Både Advanced Optimus och G-Sync stöds, vilket innebär att användare kan växla mellan iGPU- och dGPU-lägen utan en mjuk omstart. Observera att systemet måste vara inställt på dGPU-läge för att G-Sync ska fungera.
Processor
Vår Core Ultra 7 155H är cirka 10 till 15 procent långsammare än Core i7-13700HX på förra årets m16 R1 i både enkel- och flertrådade operationer. Den är i princip i nivå med den senaste Ryzen 9 8945HS. Precis som på andra Meteor Lake-processorer integrerar Core Ultra 7 155H en NPU för att accelerera AI-uppgifter som Microsoft Co-Pilot. De flesta AI-applikationer är för närvarande molnbaserade och har inga alternativ för att köras lokalt, vilket innebär att den nya CPU:ns integrerade AI-funktioner är mycket begränsade för närvarande.
Trots prestandaförlusten mot Core i7-13700HX kan m16 R2 köra Core Ultra 7 155H betydligt snabbare än andra bärbara datorer med samma processor. Till exempel Core Ultra 7 155H i den senaste MSI Prestige 16 nästan 20 procent långsammare.
Dell säger att man planerar att erbjuda en Ultra 9 185H SKU inom en snar framtid, vilket bör hjälpa till att minska prestandaklyftan mot Core i7-13700HX. De mer krävande Core i7-14700HX eller Core i9-14900HX erbjuds inte på grund av termiska begränsningar; Dell prioriterade att maximera GPU TGP snarare än CPU TDP.
Cinebench R15 Multi Loop
Cinebench R23: Multi Core | Single Core
Cinebench R20: CPU (Multi Core) | CPU (Single Core)
Cinebench R15: CPU Multi 64Bit | CPU Single 64Bit
Blender: v2.79 BMW27 CPU
7-Zip 18.03: 7z b 4 | 7z b 4 -mmt1
Geekbench 6.7: Multi-Core | Single-Core
Geekbench 5.5: Multi-Core | Single-Core
HWBOT x265 Benchmark v2.2: 4k Preset
LibreOffice : 20 Documents To PDF
R Benchmark 2.5: Overall mean
| CPU Performance rating | |
| Lenovo Legion 9 16IRX8 | |
| Lenovo Legion Pro 7 16IRX8H -2! | |
| Alienware m16 R1 AMD | |
| HP Omen Transcend 16-u1095ng | |
| Alienware m16 R1 Intel | |
| Alienware x16 R1 -3! | |
| Lenovo Legion Slim 7i 16 Gen 8 -3! | |
| Razer Blade 14 RZ09-0508 | |
| Framework Laptop 16 | |
| Alienware m16 R2 -1! | |
| Asus ROG Zephyrus G16 2024 GU605M | |
| Lenovo Legion Slim 7 16APH8 | |
| Genomsnitt Intel Core Ultra 7 155H | |
| Lenovo Legion S7 16ARHA7 -2! | |
| Asus ROG Zephyrus M16 GU603H -4! | |
| Geekbench 6.7 / Multi-Core | |
| Lenovo Legion 9 16IRX8 | |
| HP Omen Transcend 16-u1095ng | |
| Alienware m16 R1 Intel | |
| Razer Blade 14 RZ09-0508 | |
| Asus ROG Zephyrus G16 2024 GU605M | |
| Framework Laptop 16 | |
| Lenovo Legion Slim 7 16APH8 | |
| Alienware m16 R2 | |
| Alienware m16 R1 AMD | |
| Genomsnitt Intel Core Ultra 7 155H (7732 - 13656, n=55) | |
| Geekbench 6.7 / Single-Core | |
| Lenovo Legion 9 16IRX8 | |
| HP Omen Transcend 16-u1095ng | |
| Alienware m16 R1 AMD | |
| Razer Blade 14 RZ09-0508 | |
| Alienware m16 R1 Intel | |
| Framework Laptop 16 | |
| Lenovo Legion Slim 7 16APH8 | |
| Asus ROG Zephyrus G16 2024 GU605M | |
| Alienware m16 R2 | |
| Genomsnitt Intel Core Ultra 7 155H (1901 - 2473, n=52) | |
Cinebench R23: Multi Core | Single Core
Cinebench R20: CPU (Multi Core) | CPU (Single Core)
Cinebench R15: CPU Multi 64Bit | CPU Single 64Bit
Blender: v2.79 BMW27 CPU
7-Zip 18.03: 7z b 4 | 7z b 4 -mmt1
Geekbench 6.7: Multi-Core | Single-Core
Geekbench 5.5: Multi-Core | Single-Core
HWBOT x265 Benchmark v2.2: 4k Preset
LibreOffice : 20 Documents To PDF
R Benchmark 2.5: Overall mean
* ... mindre är bättre
AIDA64: FP32 Ray-Trace | FPU Julia | CPU SHA3 | CPU Queen | FPU SinJulia | FPU Mandel | CPU AES | CPU ZLib | FP64 Ray-Trace | CPU PhotoWorxx
| Performance rating | |
| Lenovo Legion Slim 7 16APH8 | |
| Alienware m16 R1 Intel | |
| Alienware x16 R1 | |
| HP Omen Transcend 16-u1095ng | |
| Alienware m16 R2 | |
| Asus ROG Zephyrus G16 2024 GU605M | |
| Genomsnitt Intel Core Ultra 7 155H | |
| AIDA64 / FP32 Ray-Trace | |
| Lenovo Legion Slim 7 16APH8 | |
| Alienware m16 R1 Intel | |
| Alienware m16 R2 | |
| Alienware x16 R1 | |
| HP Omen Transcend 16-u1095ng | |
| Asus ROG Zephyrus G16 2024 GU605M | |
| Genomsnitt Intel Core Ultra 7 155H (6670 - 18470, n=50) | |
| AIDA64 / FPU Julia | |
| Lenovo Legion Slim 7 16APH8 | |
| Alienware m16 R1 Intel | |
| Alienware m16 R2 | |
| Alienware x16 R1 | |
| HP Omen Transcend 16-u1095ng | |
| Asus ROG Zephyrus G16 2024 GU605M | |
| Genomsnitt Intel Core Ultra 7 155H (40905 - 93181, n=50) | |
| AIDA64 / CPU SHA3 | |
| Alienware m16 R1 Intel | |
| Lenovo Legion Slim 7 16APH8 | |
| HP Omen Transcend 16-u1095ng | |
| Alienware m16 R2 | |
| Alienware x16 R1 | |
| Asus ROG Zephyrus G16 2024 GU605M | |
| Genomsnitt Intel Core Ultra 7 155H (1940 - 4436, n=50) | |
| AIDA64 / CPU Queen | |
| HP Omen Transcend 16-u1095ng | |
| Alienware x16 R1 | |
| Lenovo Legion Slim 7 16APH8 | |
| Alienware m16 R1 Intel | |
| Asus ROG Zephyrus G16 2024 GU605M | |
| Alienware m16 R2 | |
| Genomsnitt Intel Core Ultra 7 155H (64698 - 94181, n=50) | |
| AIDA64 / FPU SinJulia | |
| Lenovo Legion Slim 7 16APH8 | |
| Alienware m16 R1 Intel | |
| HP Omen Transcend 16-u1095ng | |
| Alienware x16 R1 | |
| Asus ROG Zephyrus G16 2024 GU605M | |
| Alienware m16 R2 | |
| Genomsnitt Intel Core Ultra 7 155H (5639 - 10647, n=50) | |
| AIDA64 / FPU Mandel | |
| Lenovo Legion Slim 7 16APH8 | |
| Alienware m16 R1 Intel | |
| Alienware m16 R2 | |
| Alienware x16 R1 | |
| HP Omen Transcend 16-u1095ng | |
| Asus ROG Zephyrus G16 2024 GU605M | |
| Genomsnitt Intel Core Ultra 7 155H (18236 - 47685, n=50) | |
| AIDA64 / CPU AES | |
| Alienware m16 R1 Intel | |
| HP Omen Transcend 16-u1095ng | |
| Alienware m16 R2 | |
| Alienware x16 R1 | |
| Asus ROG Zephyrus G16 2024 GU605M | |
| Genomsnitt Intel Core Ultra 7 155H (45713 - 152179, n=50) | |
| Lenovo Legion Slim 7 16APH8 | |
| AIDA64 / CPU ZLib | |
| Alienware m16 R1 Intel | |
| HP Omen Transcend 16-u1095ng | |
| Alienware x16 R1 | |
| Alienware m16 R2 | |
| Asus ROG Zephyrus G16 2024 GU605M | |
| Lenovo Legion Slim 7 16APH8 | |
| Genomsnitt Intel Core Ultra 7 155H (557 - 1250, n=50) | |
| AIDA64 / FP64 Ray-Trace | |
| Lenovo Legion Slim 7 16APH8 | |
| Alienware m16 R1 Intel | |
| Alienware x16 R1 | |
| Alienware m16 R2 | |
| HP Omen Transcend 16-u1095ng | |
| Asus ROG Zephyrus G16 2024 GU605M | |
| Genomsnitt Intel Core Ultra 7 155H (3569 - 9802, n=50) | |
| AIDA64 / CPU PhotoWorxx | |
| Alienware x16 R1 | |
| HP Omen Transcend 16-u1095ng | |
| Asus ROG Zephyrus G16 2024 GU605M | |
| Genomsnitt Intel Core Ultra 7 155H (32719 - 54223, n=50) | |
| Lenovo Legion Slim 7 16APH8 | |
| Alienware m16 R2 | |
| Alienware m16 R1 Intel | |
Stresstest
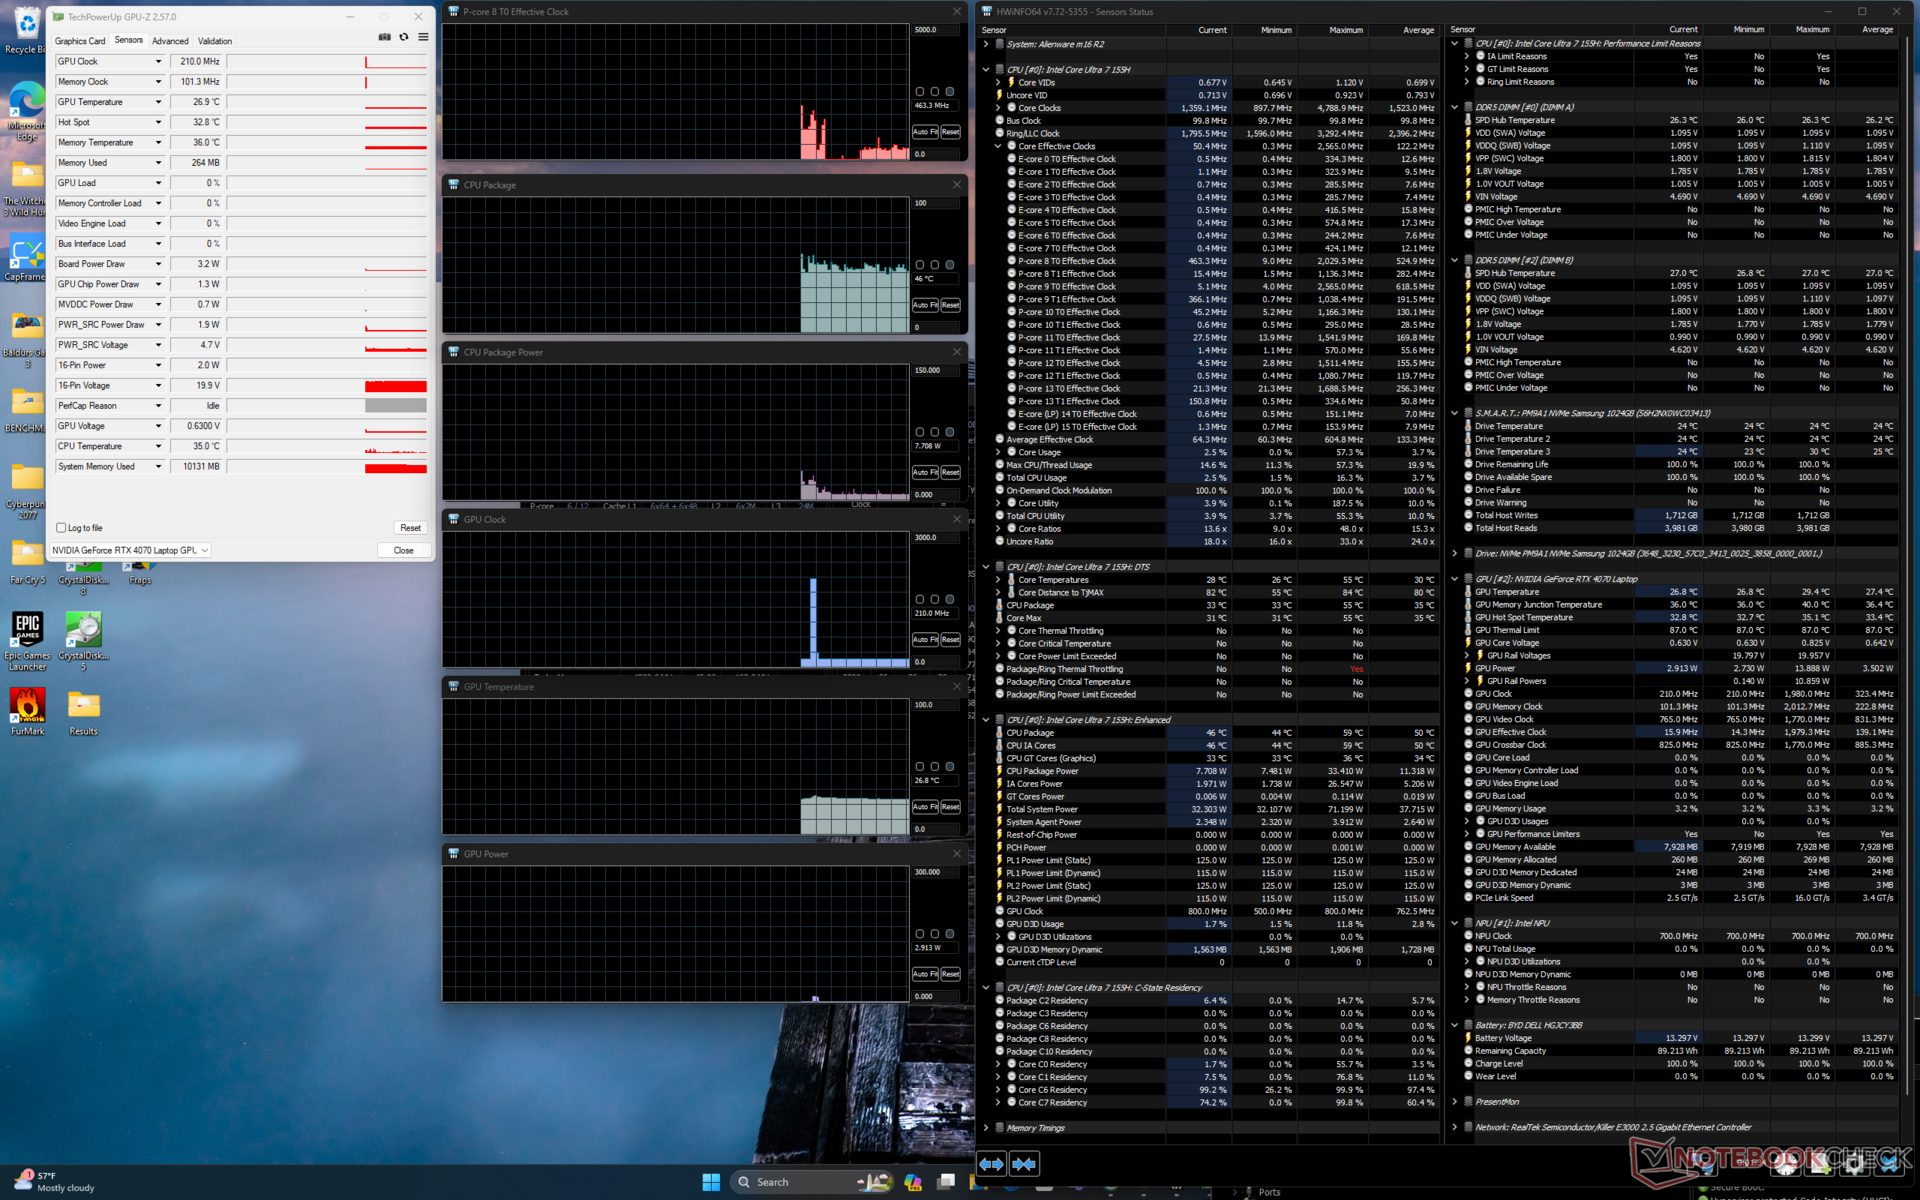
När Prime95 kördes i Overdrive-läget ökade CPU:n till 4,6 GHz och 115 W under flera sekunder innan den sjönk stadigt och slutligen stabiliserades på 3,4 GHz och 102 W. Kärntemperaturen var dock extremt hög på 100 C vilket tyder på att CPU:n redan pressar kylningslösningen till dess yttersta gräns.
Intressant nog finns det nästan inga förändringar i GPU-klockfrekvenser eller kortets strömförbrukning när man kör Witcher 3 i lägena Balanserad, Prestanda eller Overdrive, vilket korrelerar med våra resultat nedan i avsnittet om GPU-prestanda. Istället tenderar GPU-temperaturen att minska i Performance- eller Overdrive-läget på grund av de högre fläkttaken i dessa lägen. Med andra ord skulle klockfrekvenser och TGP i realtid förbli konstanta medan fläktljudet skulle förändras. Det kan finnas några små förändringar i CPU-prestanda mellan lägena, men de flesta spel är ändå inte CPU-bundna.
Det är värt att notera att medan GPU:n är klassad till 140 W TGP enligt Nvidia Control Panel, tenderar den att stabilisera sig på 106 W när man spelar. Vi kunde nå ett tillfälligt maximum på 121 W.
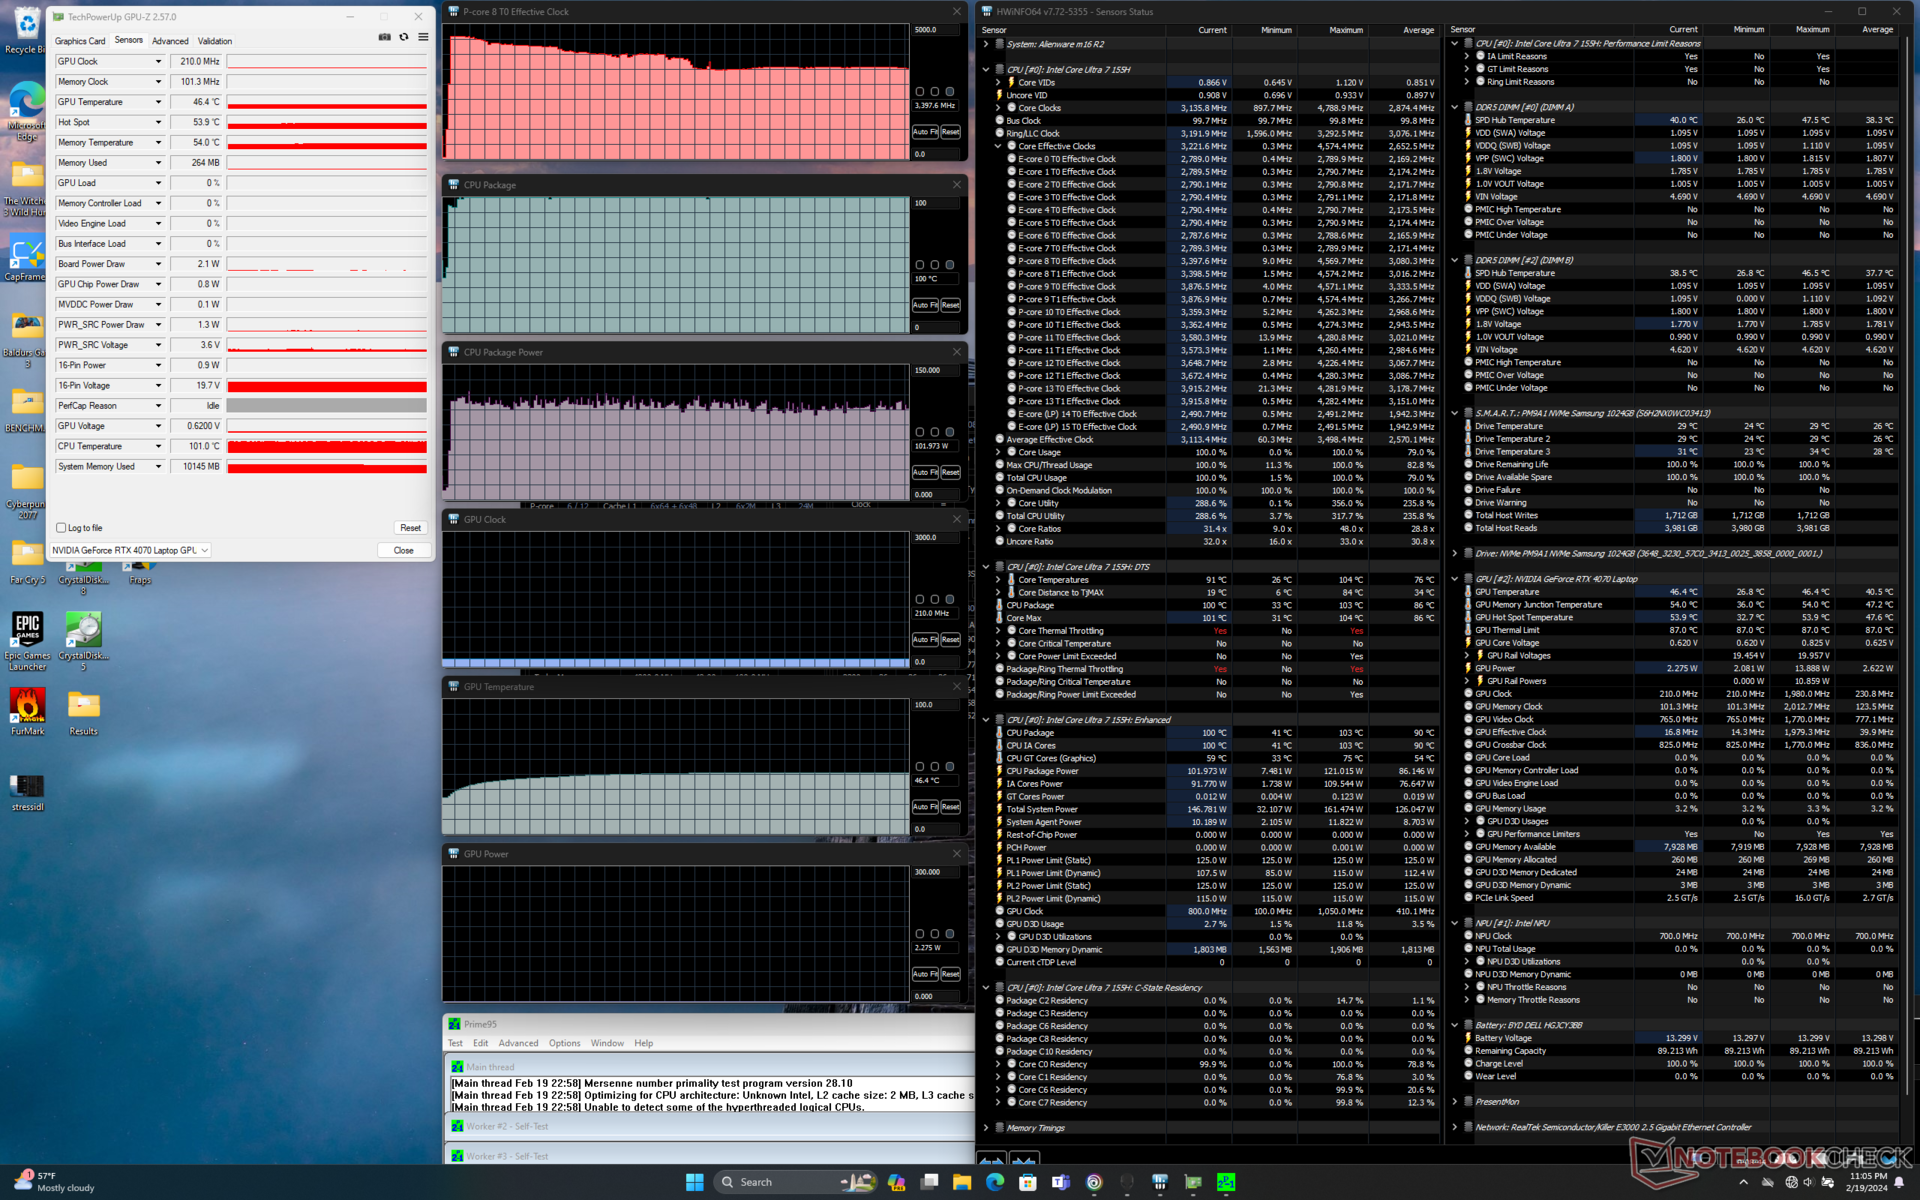
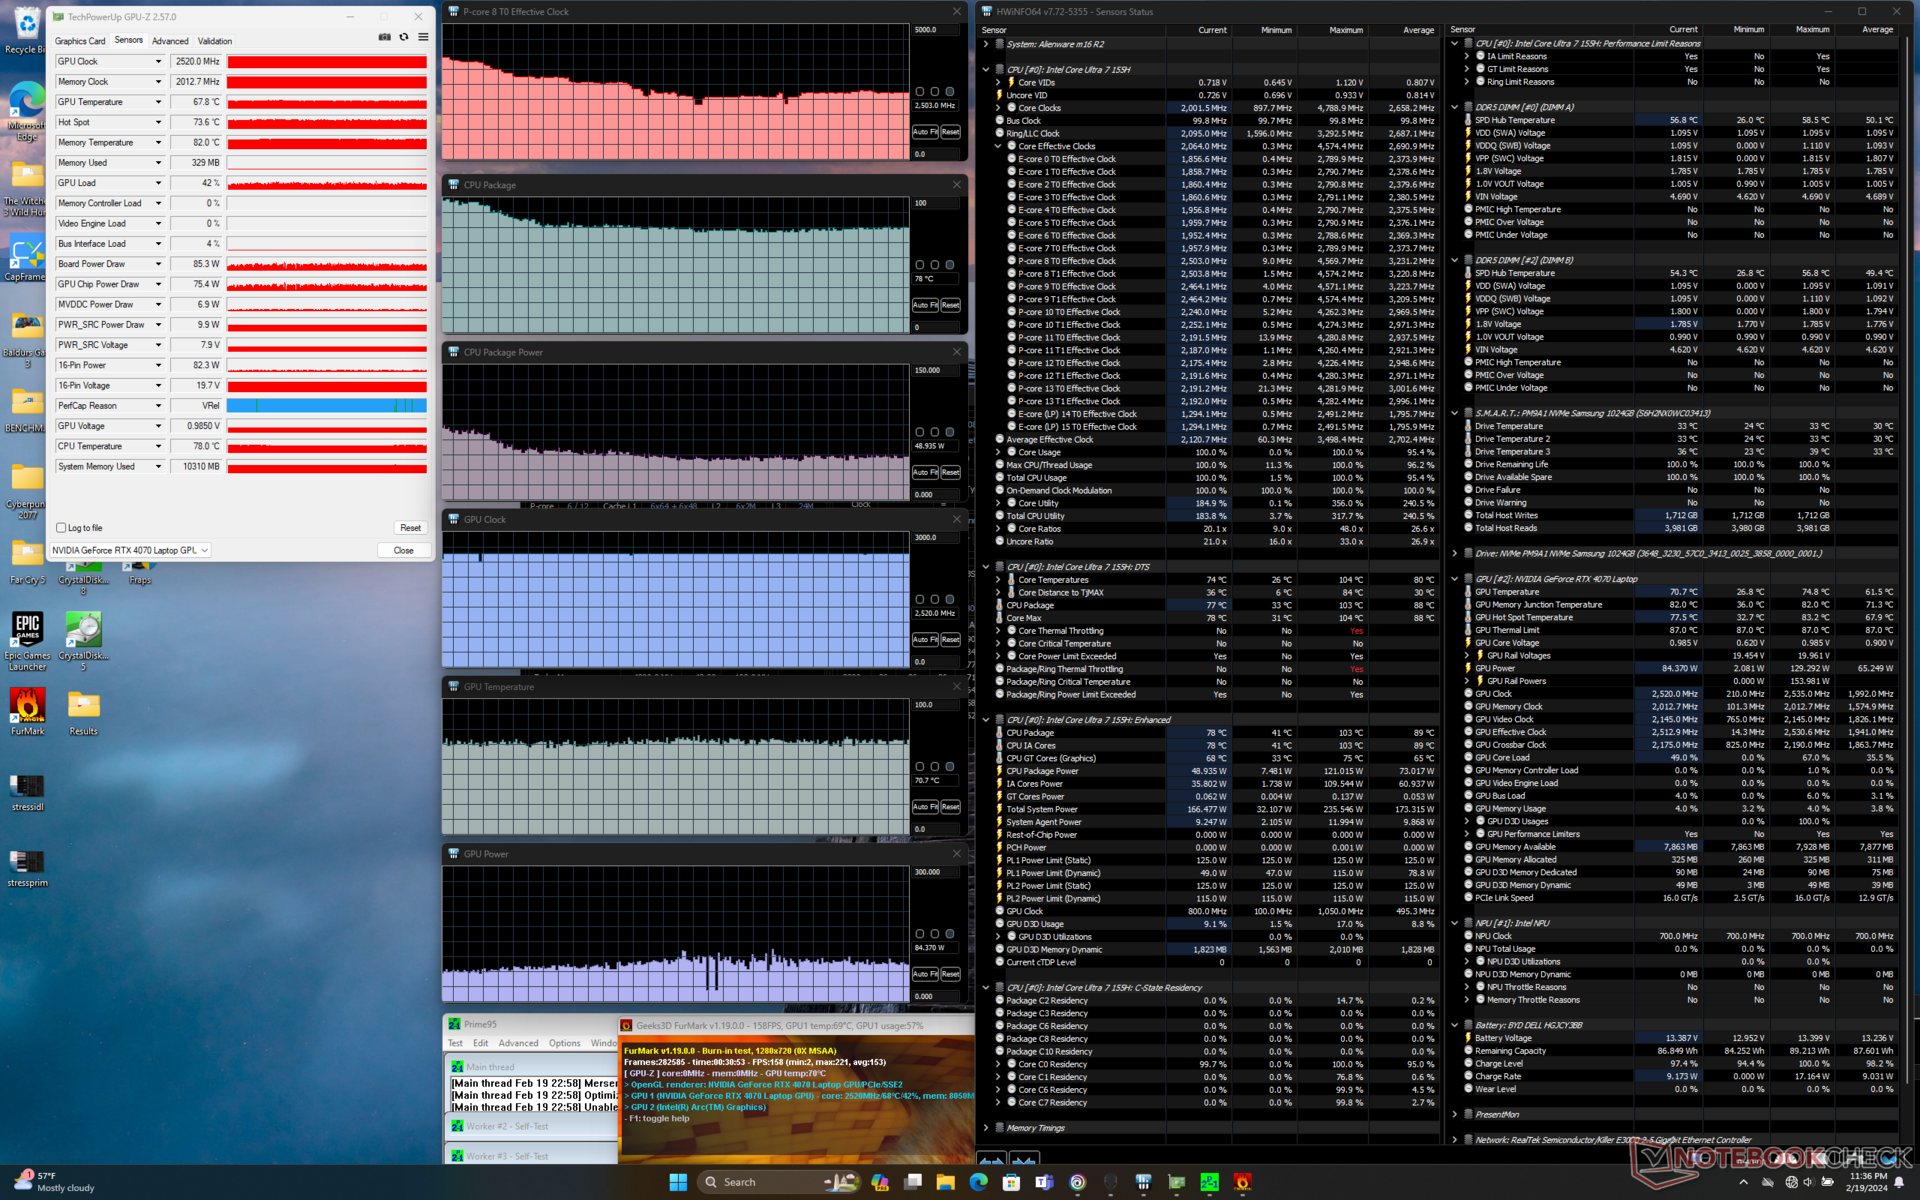
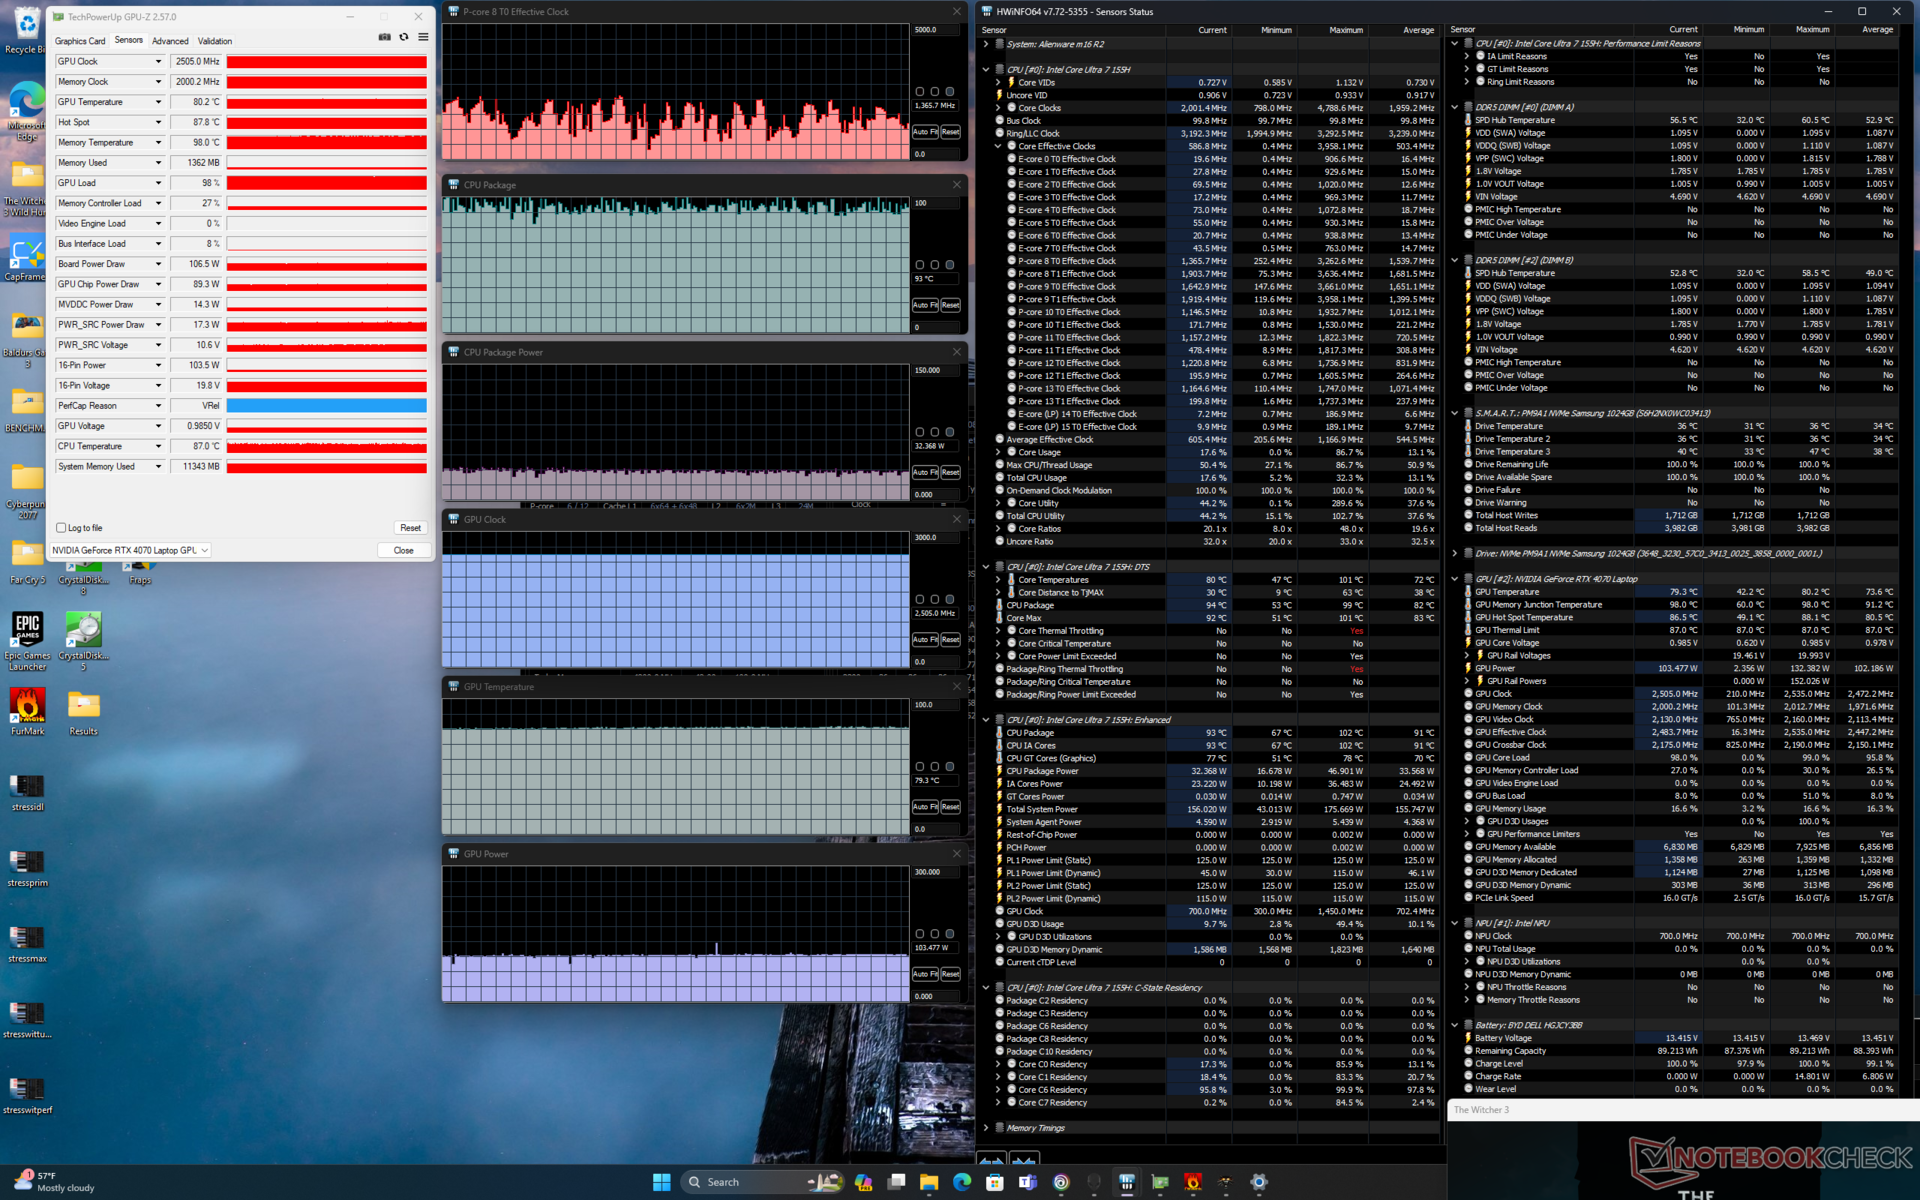

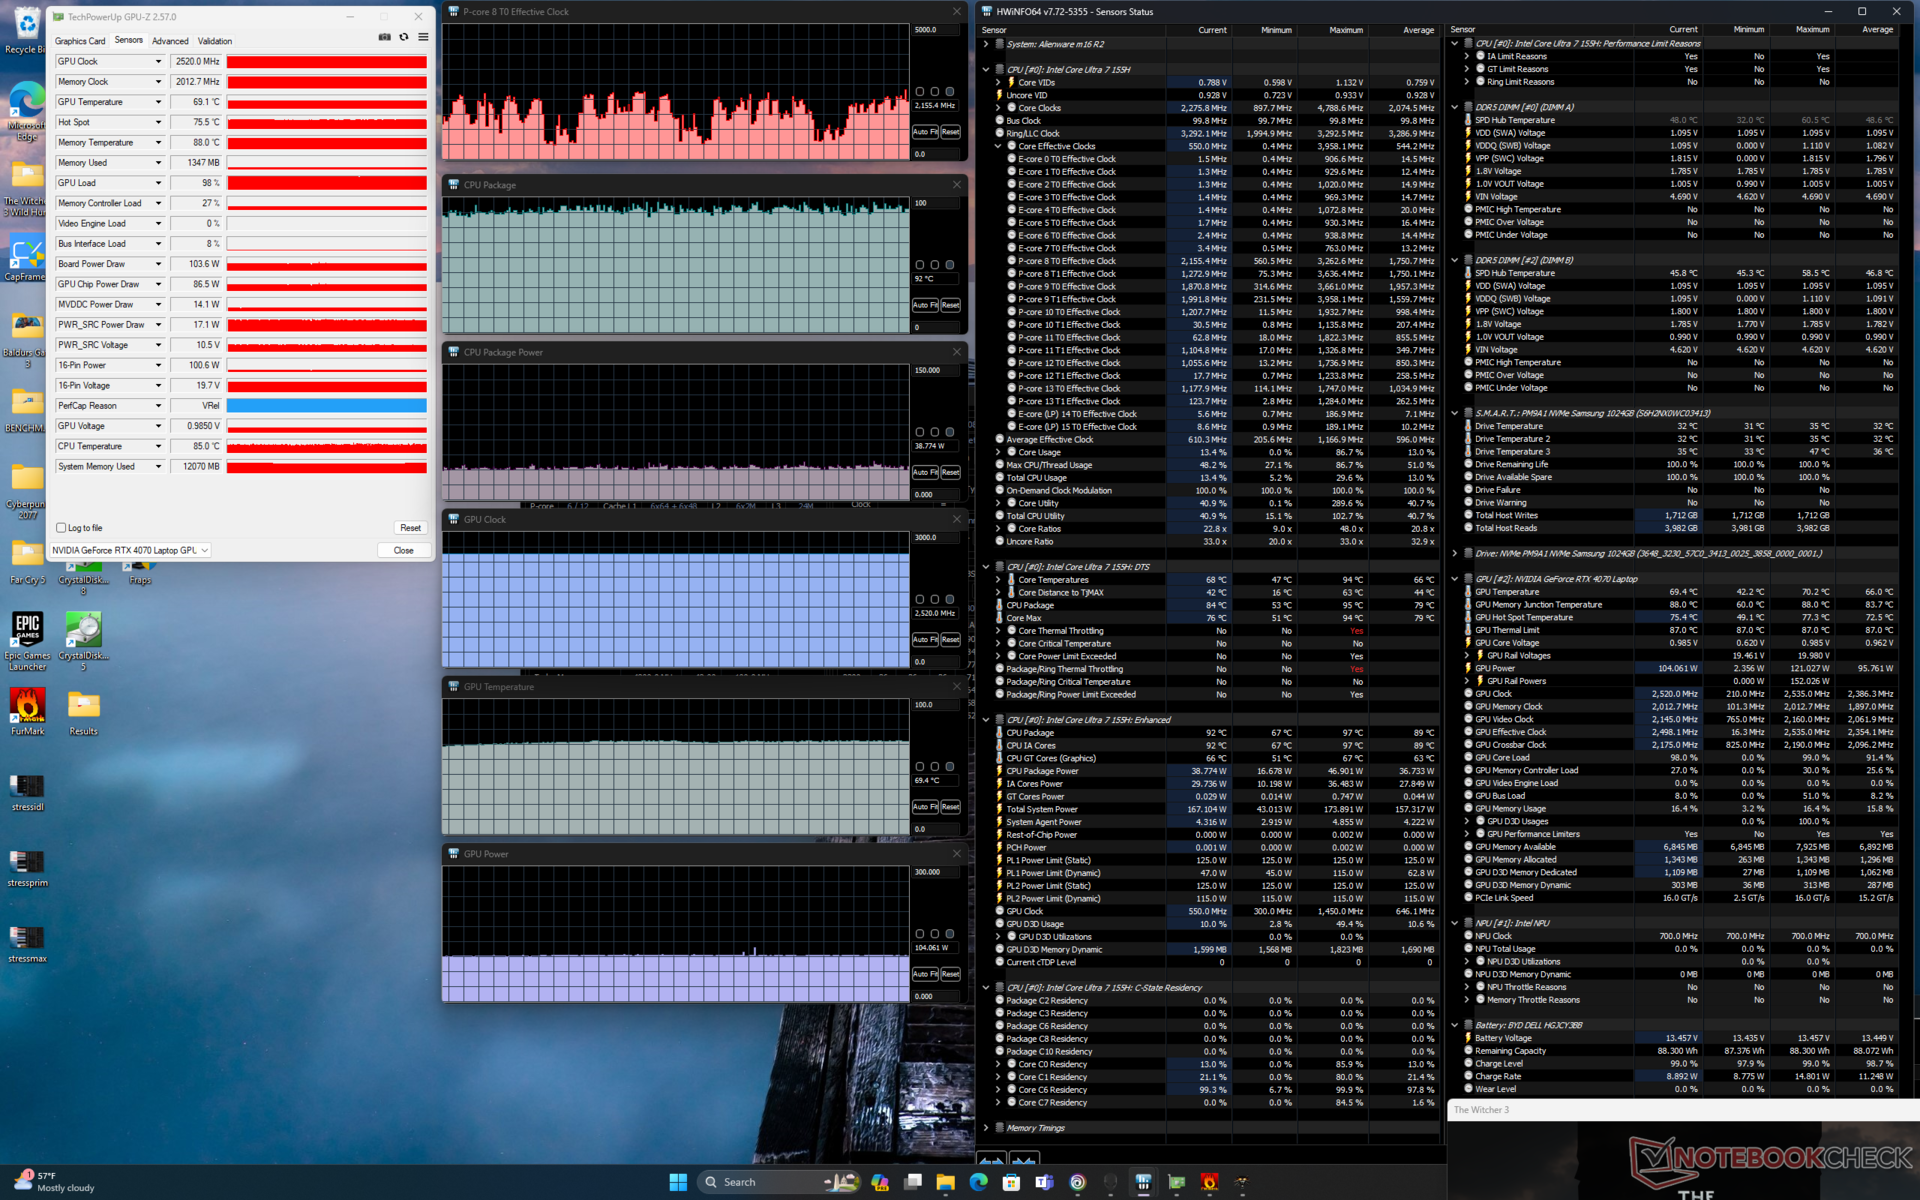
| CPU-klocka (GHz) | GPU-klocka (MHz) | Genomsnittlig CPU-temperatur (°C) | Genomsnittlig GPU-temperatur (°C) | |
| System i viloläge | -- | -- | 46 | 27 |
| Prime95 Stress | 3.4 | -- | 100 | 47 |
| Prime95 + FurMark Stress | 2.5 | 2520 | 78 | 71 |
| Witcher 3 Stress (balanserat läge) | ~1,8 | 2502 | 93 | 80 |
| Witcher 3 Stress(Performance mode) | ~1,8 | 2520 | 91 | 77 |
| Witcher 3 Stress (lägeOverdrive) | ~2.0 | 2520 | 92 | 69 |
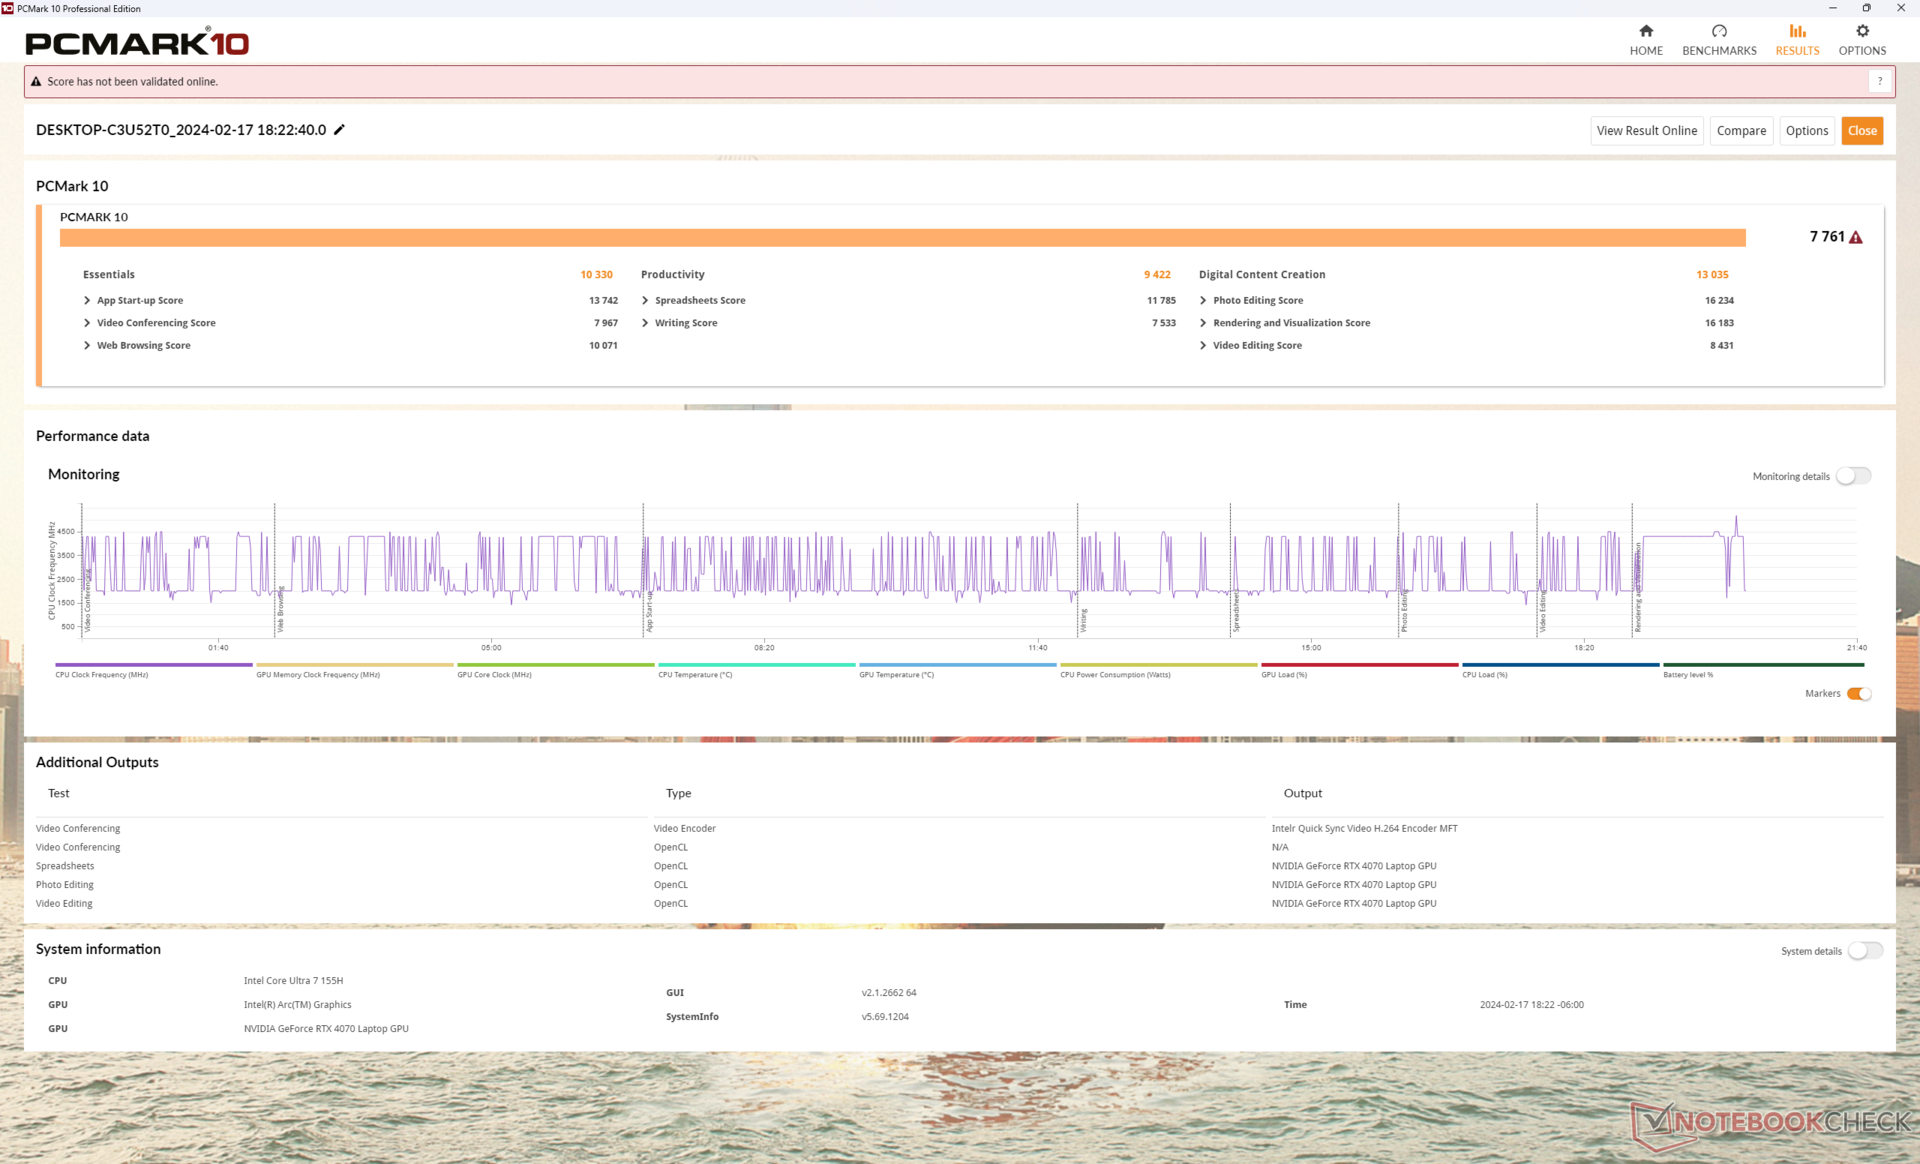
Systemets prestanda
PCMark 10-resultaten är jämförbara med m16 R1, med undantag för vår lägre poäng för deltestet Digital Content Creation eftersom m16 R2 är utrustad med den långsammare RTX 4070. Systemprestandan är i övrigt mycket likartad och visar inga betydande förbättringar i de flesta dagliga belastningar trots den nyare generationen CPU.
CrossMark: Overall | Productivity | Creativity | Responsiveness
WebXPRT 3: Overall
WebXPRT 4: Overall
Mozilla Kraken 1.1: Total
| PCMark 10 / Score | |
| Alienware x16 R1 | |
| HP Omen Transcend 16-u1095ng | |
| Alienware m16 R2 | |
| Lenovo Legion Slim 7 16APH8 | |
| Genomsnitt Intel Core Ultra 7 155H, NVIDIA GeForce RTX 4070 Laptop GPU (7084 - 7761, n=4) | |
| Alienware m16 R1 Intel | |
| Asus ROG Zephyrus G16 2024 GU605M | |
| PCMark 10 / Essentials | |
| Alienware x16 R1 | |
| Alienware m16 R1 Intel | |
| HP Omen Transcend 16-u1095ng | |
| Lenovo Legion Slim 7 16APH8 | |
| Alienware m16 R2 | |
| Genomsnitt Intel Core Ultra 7 155H, NVIDIA GeForce RTX 4070 Laptop GPU (10038 - 10393, n=4) | |
| Asus ROG Zephyrus G16 2024 GU605M | |
| PCMark 10 / Productivity | |
| HP Omen Transcend 16-u1095ng | |
| Alienware x16 R1 | |
| Lenovo Legion Slim 7 16APH8 | |
| Alienware m16 R1 Intel | |
| Alienware m16 R2 | |
| Genomsnitt Intel Core Ultra 7 155H, NVIDIA GeForce RTX 4070 Laptop GPU (9192 - 9518, n=4) | |
| Asus ROG Zephyrus G16 2024 GU605M | |
| PCMark 10 / Digital Content Creation | |
| Alienware x16 R1 | |
| Alienware m16 R2 | |
| HP Omen Transcend 16-u1095ng | |
| Genomsnitt Intel Core Ultra 7 155H, NVIDIA GeForce RTX 4070 Laptop GPU (10100 - 13035, n=4) | |
| Lenovo Legion Slim 7 16APH8 | |
| Asus ROG Zephyrus G16 2024 GU605M | |
| Alienware m16 R1 Intel | |
| CrossMark / Overall | |
| Alienware m16 R1 Intel | |
| Alienware x16 R1 | |
| Alienware m16 R2 | |
| Genomsnitt Intel Core Ultra 7 155H, NVIDIA GeForce RTX 4070 Laptop GPU (1687 - 1848, n=4) | |
| Asus ROG Zephyrus G16 2024 GU605M | |
| CrossMark / Productivity | |
| Alienware m16 R1 Intel | |
| Alienware x16 R1 | |
| Alienware m16 R2 | |
| Genomsnitt Intel Core Ultra 7 155H, NVIDIA GeForce RTX 4070 Laptop GPU (1589 - 1750, n=4) | |
| Asus ROG Zephyrus G16 2024 GU605M | |
| CrossMark / Creativity | |
| Alienware m16 R1 Intel | |
| Alienware x16 R1 | |
| Asus ROG Zephyrus G16 2024 GU605M | |
| Genomsnitt Intel Core Ultra 7 155H, NVIDIA GeForce RTX 4070 Laptop GPU (1860 - 2014, n=4) | |
| Alienware m16 R2 | |
| CrossMark / Responsiveness | |
| Alienware x16 R1 | |
| Alienware m16 R1 Intel | |
| Alienware m16 R2 | |
| Genomsnitt Intel Core Ultra 7 155H, NVIDIA GeForce RTX 4070 Laptop GPU (1424 - 1683, n=4) | |
| Asus ROG Zephyrus G16 2024 GU605M | |
| WebXPRT 3 / Overall | |
| HP Omen Transcend 16-u1095ng | |
| Alienware m16 R1 Intel | |
| Alienware x16 R1 | |
| Alienware m16 R2 | |
| Asus ROG Zephyrus G16 2024 GU605M | |
| Genomsnitt Intel Core Ultra 7 155H, NVIDIA GeForce RTX 4070 Laptop GPU (264 - 294, n=4) | |
| WebXPRT 4 / Overall | |
| Alienware m16 R1 Intel | |
| Alienware x16 R1 | |
| Alienware m16 R2 | |
| Asus ROG Zephyrus G16 2024 GU605M | |
| Genomsnitt Intel Core Ultra 7 155H, NVIDIA GeForce RTX 4070 Laptop GPU (247 - 257, n=4) | |
| Mozilla Kraken 1.1 / Total | |
| Genomsnitt Intel Core Ultra 7 155H, NVIDIA GeForce RTX 4070 Laptop GPU (546 - 568, n=3) | |
| Asus ROG Zephyrus G16 2024 GU605M | |
| Alienware m16 R2 | |
| Alienware m16 R1 Intel | |
| Alienware x16 R1 | |
| HP Omen Transcend 16-u1095ng | |
* ... mindre är bättre
| PCMark 10 Score | 7761 poäng | |
Hjälp | ||
| AIDA64 / Memory Copy | |
| Asus ROG Zephyrus G16 2024 GU605M | |
| Genomsnitt Intel Core Ultra 7 155H (62397 - 96791, n=50) | |
| HP Omen Transcend 16-u1095ng | |
| Alienware x16 R1 | |
| Lenovo Legion Slim 7 16APH8 | |
| Alienware m16 R2 | |
| Alienware m16 R1 Intel | |
| AIDA64 / Memory Read | |
| Asus ROG Zephyrus G16 2024 GU605M | |
| HP Omen Transcend 16-u1095ng | |
| Genomsnitt Intel Core Ultra 7 155H (60544 - 90647, n=50) | |
| Alienware m16 R2 | |
| Alienware x16 R1 | |
| Alienware m16 R1 Intel | |
| Lenovo Legion Slim 7 16APH8 | |
| AIDA64 / Memory Write | |
| Lenovo Legion Slim 7 16APH8 | |
| Alienware x16 R1 | |
| HP Omen Transcend 16-u1095ng | |
| Asus ROG Zephyrus G16 2024 GU605M | |
| Genomsnitt Intel Core Ultra 7 155H (58692 - 93451, n=50) | |
| Alienware m16 R2 | |
| Alienware m16 R1 Intel | |
| AIDA64 / Memory Latency | |
| Genomsnitt Intel Core Ultra 7 155H (116.2 - 233, n=50) | |
| Asus ROG Zephyrus G16 2024 GU605M | |
| Alienware m16 R2 | |
| Alienware x16 R1 | |
| Lenovo Legion Slim 7 16APH8 | |
| Alienware m16 R1 Intel | |
| HP Omen Transcend 16-u1095ng | |
* ... mindre är bättre
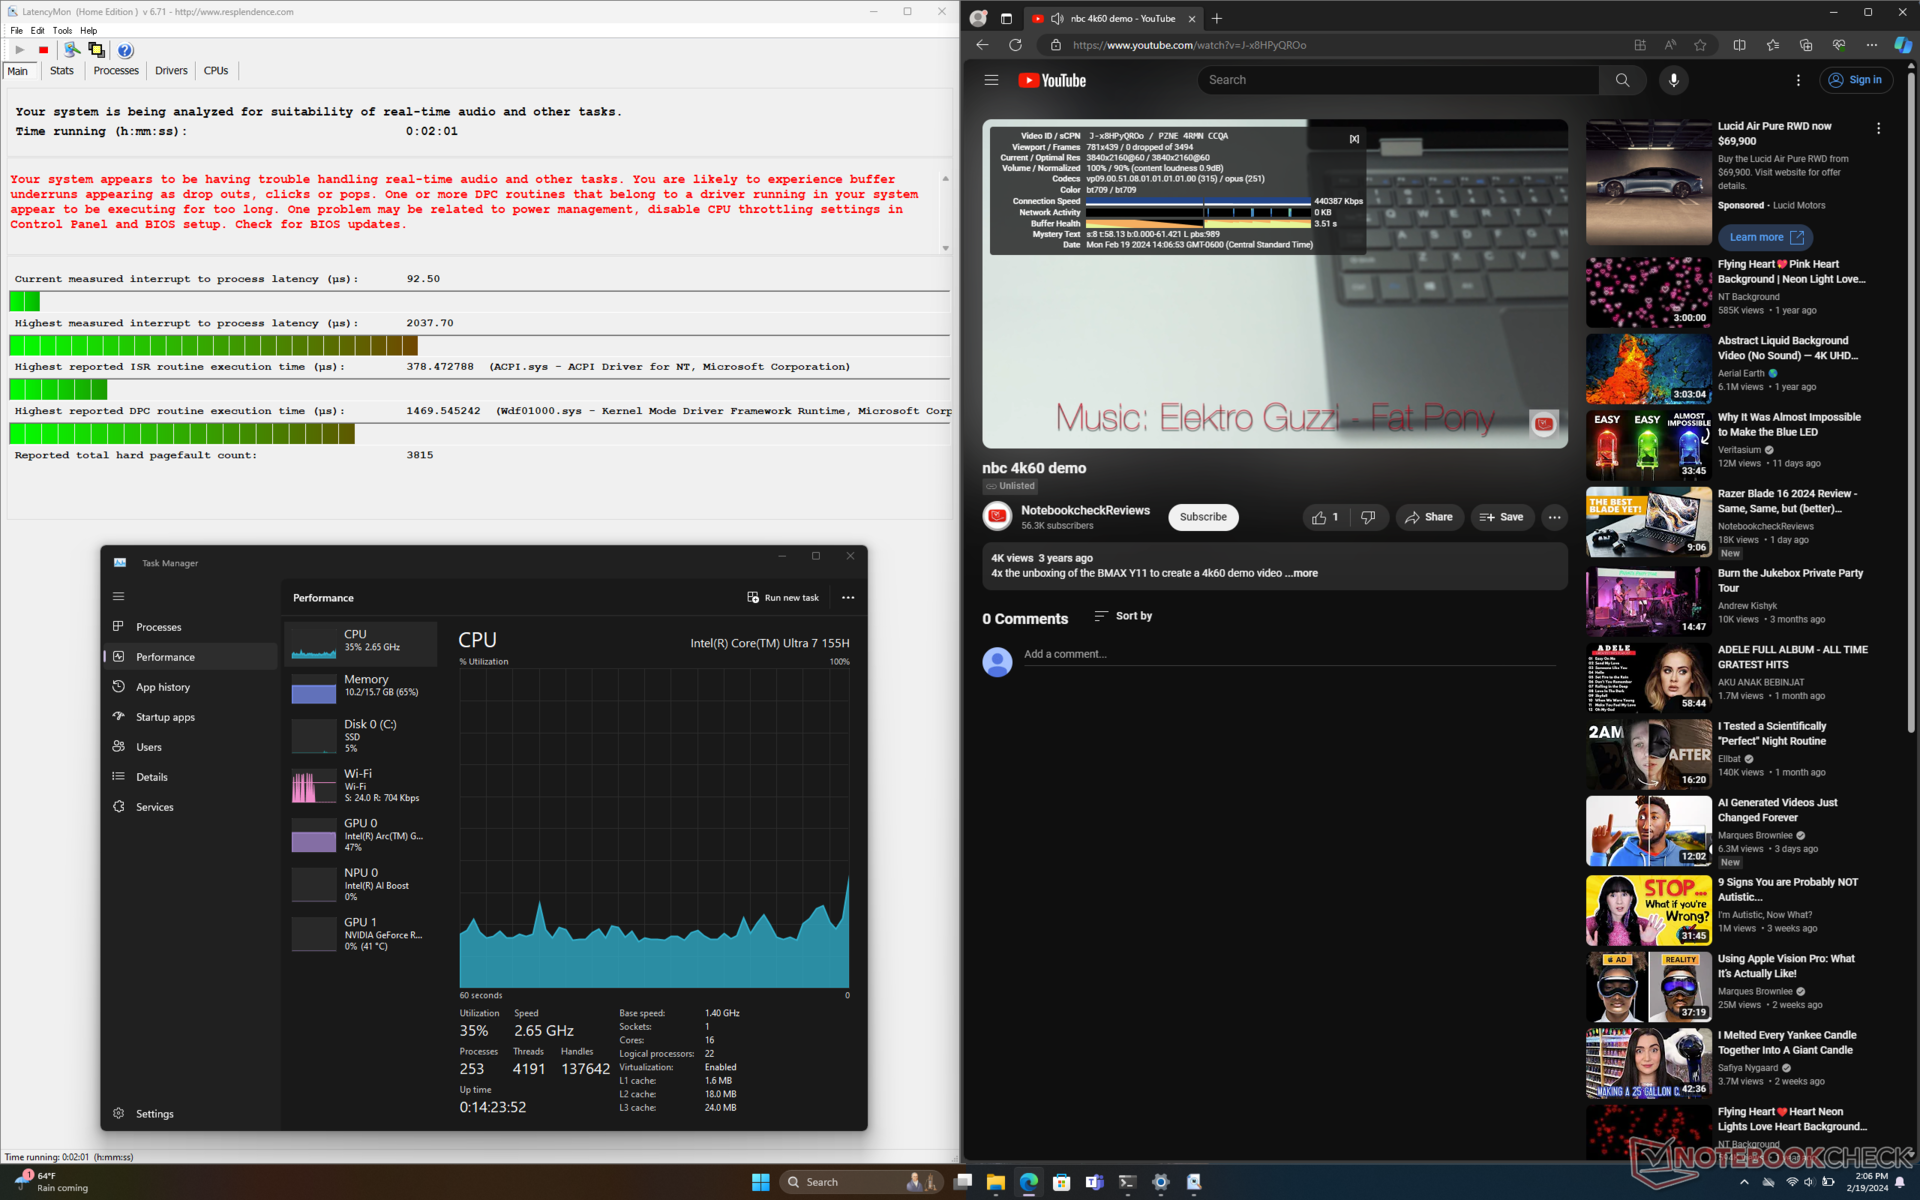
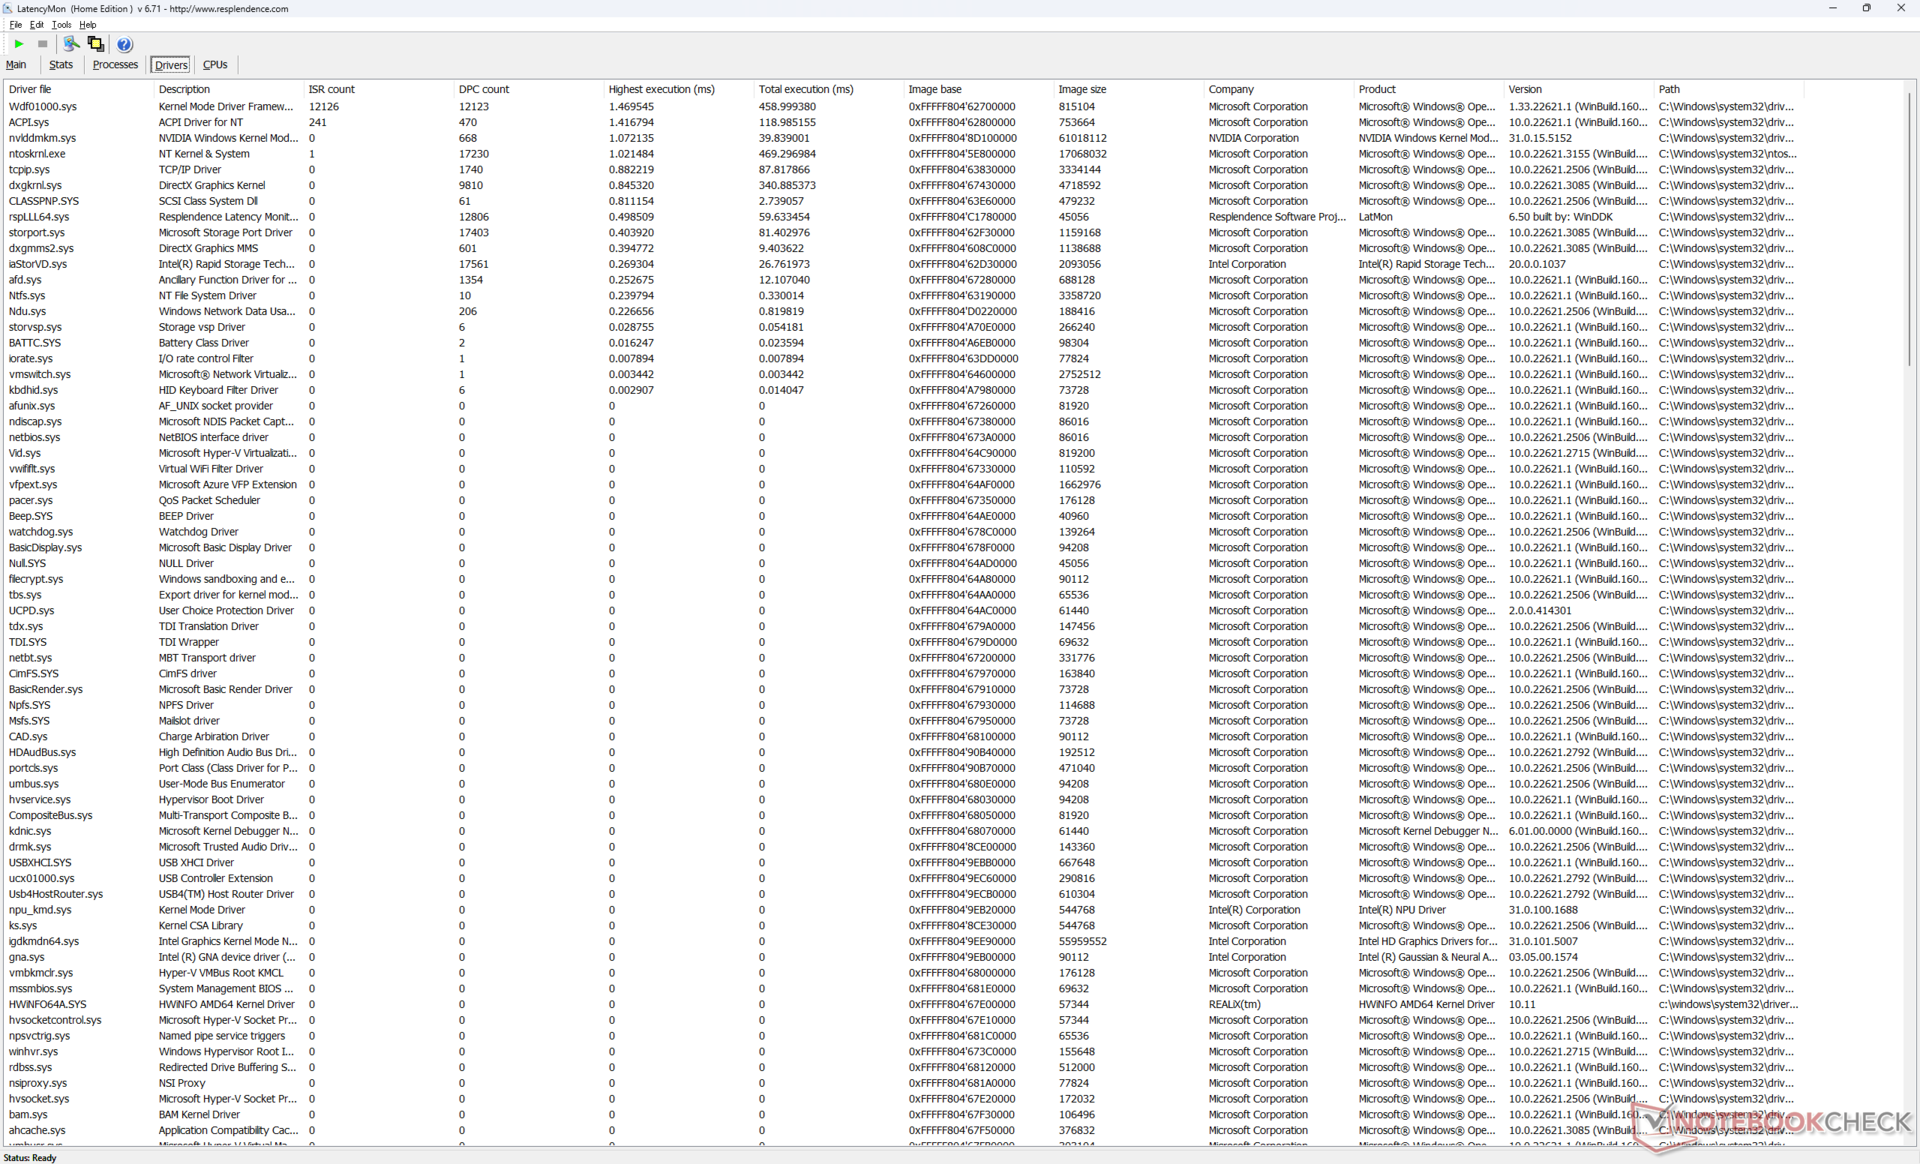
DPC-fördröjning
LatencyMon avslöjar DPC-problem när du öppnar flera flikar på vår hemsida. 4K-videouppspelning vid 60 FPS är annars perfekt utan några tappade bildrutor.
| DPC Latencies / LatencyMon - interrupt to process latency (max), Web, Youtube, Prime95 | |
| Alienware m16 R1 Intel | |
| Asus ROG Zephyrus G16 2024 GU605M | |
| Alienware m16 R2 | |
| HP Omen Transcend 16-u1095ng | |
| Alienware x16 R1 | |
| Lenovo Legion Slim 7 16APH8 | |
* ... mindre är bättre
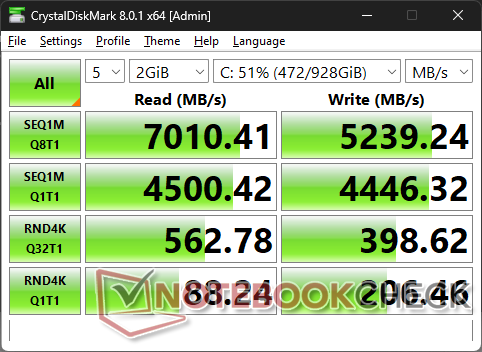
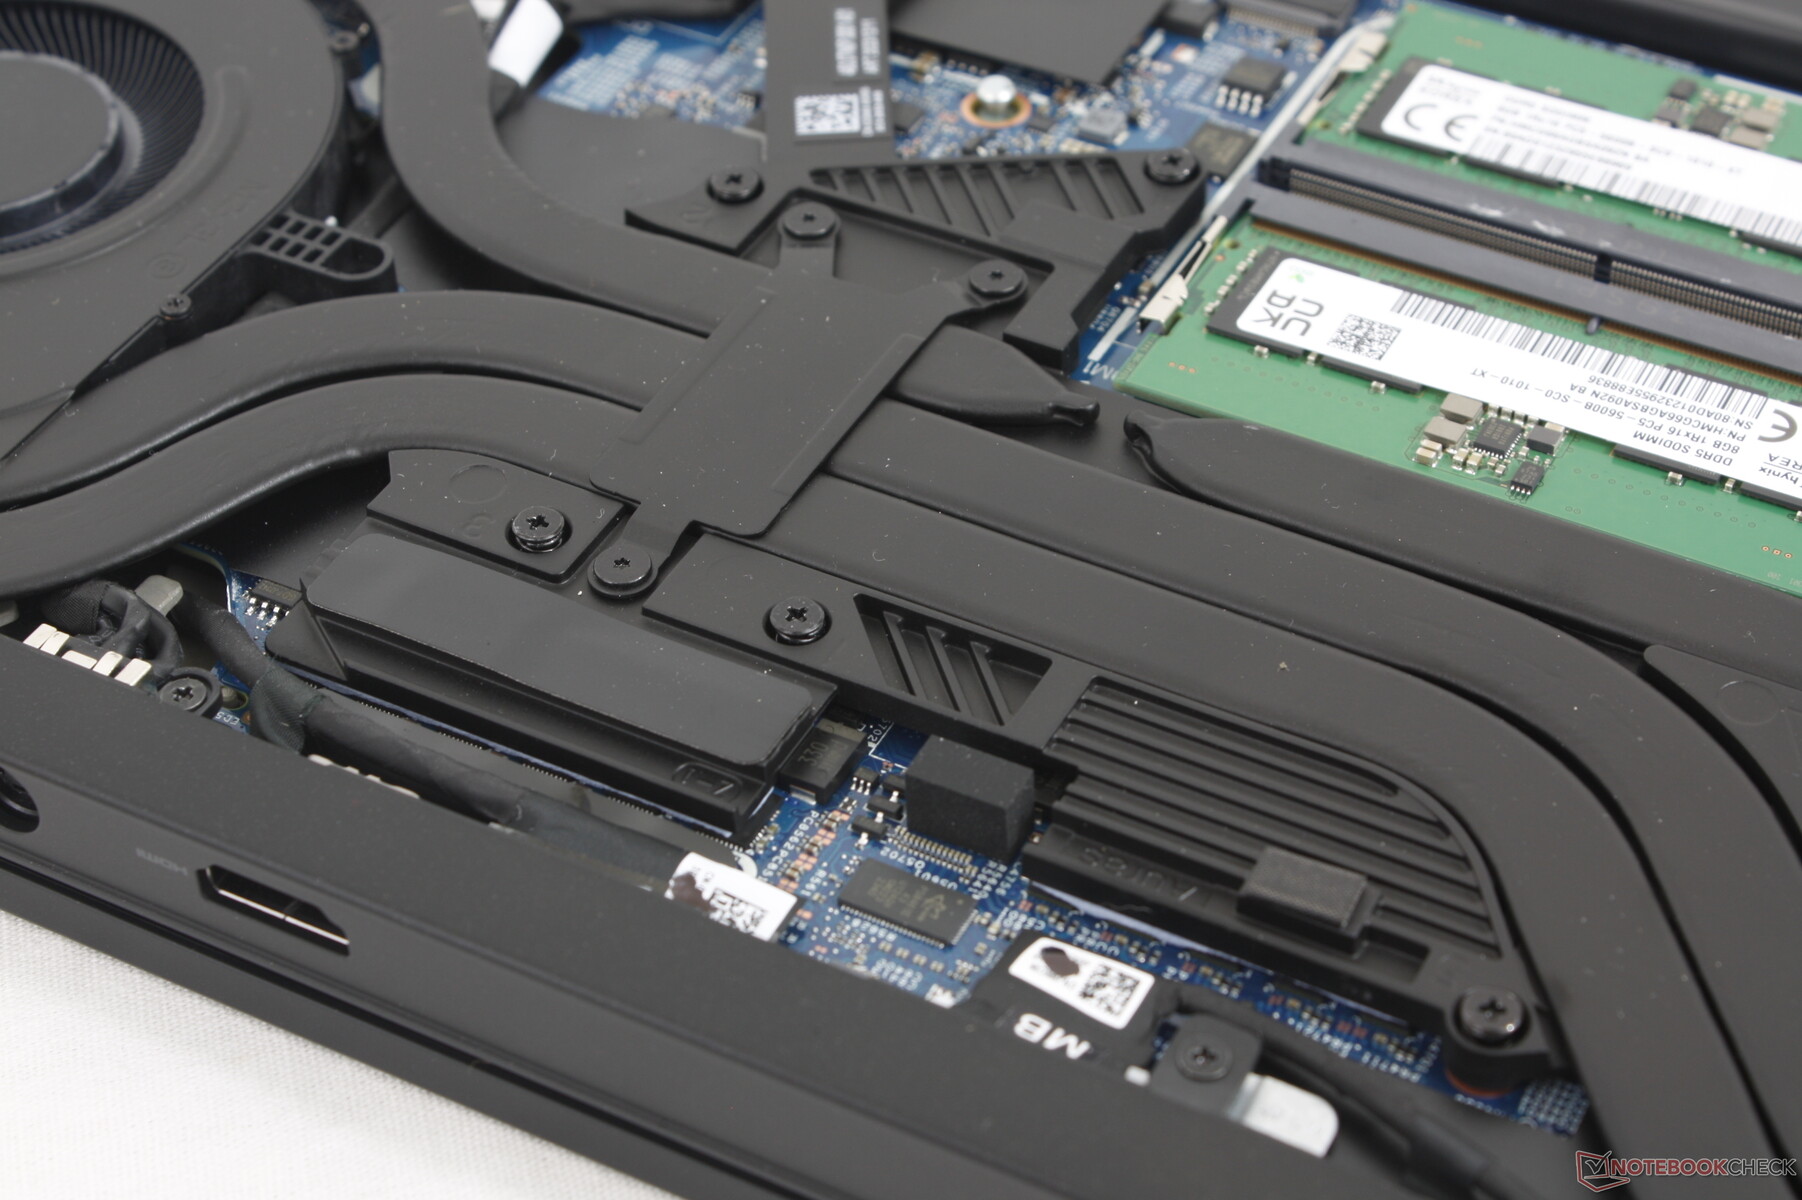
Lagringsenheter
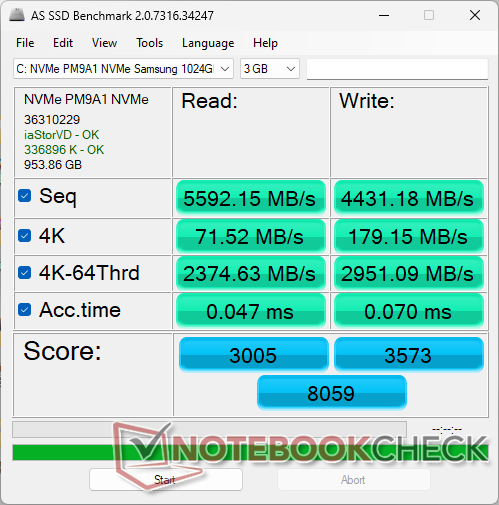
Vår enhet levereras med Samsung PM9A1 PCIe4 x4 NVMe SSD istället för Kioxia på förra årets m16 R1. Enheten har inga problem att bibehålla sin maximala överföringshastighet på 7000 MB/s under längre perioder. En värmespridare ingår för var och en av de två M.2 2280-platserna.

| Drive Performance rating - Percent | |
| Alienware x16 R1 | |
| Alienware m16 R2 | |
| Alienware m16 R1 Intel | |
| Lenovo Legion Slim 7 16APH8 | |
| HP Omen Transcend 16-u1095ng | |
| Asus ROG Zephyrus G16 2024 GU605M | |
* ... mindre är bättre
Disk Throttling: DiskSpd Read Loop, Queue Depth 8
GPU-prestanda
Grafikprestanda från vår 140 W GeForce RTX 4070 är cirka 10 procent snabbare än den genomsnittliga bärbara datorn i vår databas som är utrustad med samma GPU. Även om en nedgradering från m16 R1 med så mycket som 30 till 45 procent på grund av bristen på RTX 4080 eller 4090 alternativ, är det åtminstone bra att se att RTX 4070 här presterar bättre än förväntat. Användare som vill ha RTX 4080 eller 4090 måste överväga den äldre m16 R1 eller den dyrare Alienware x16-serien istället.
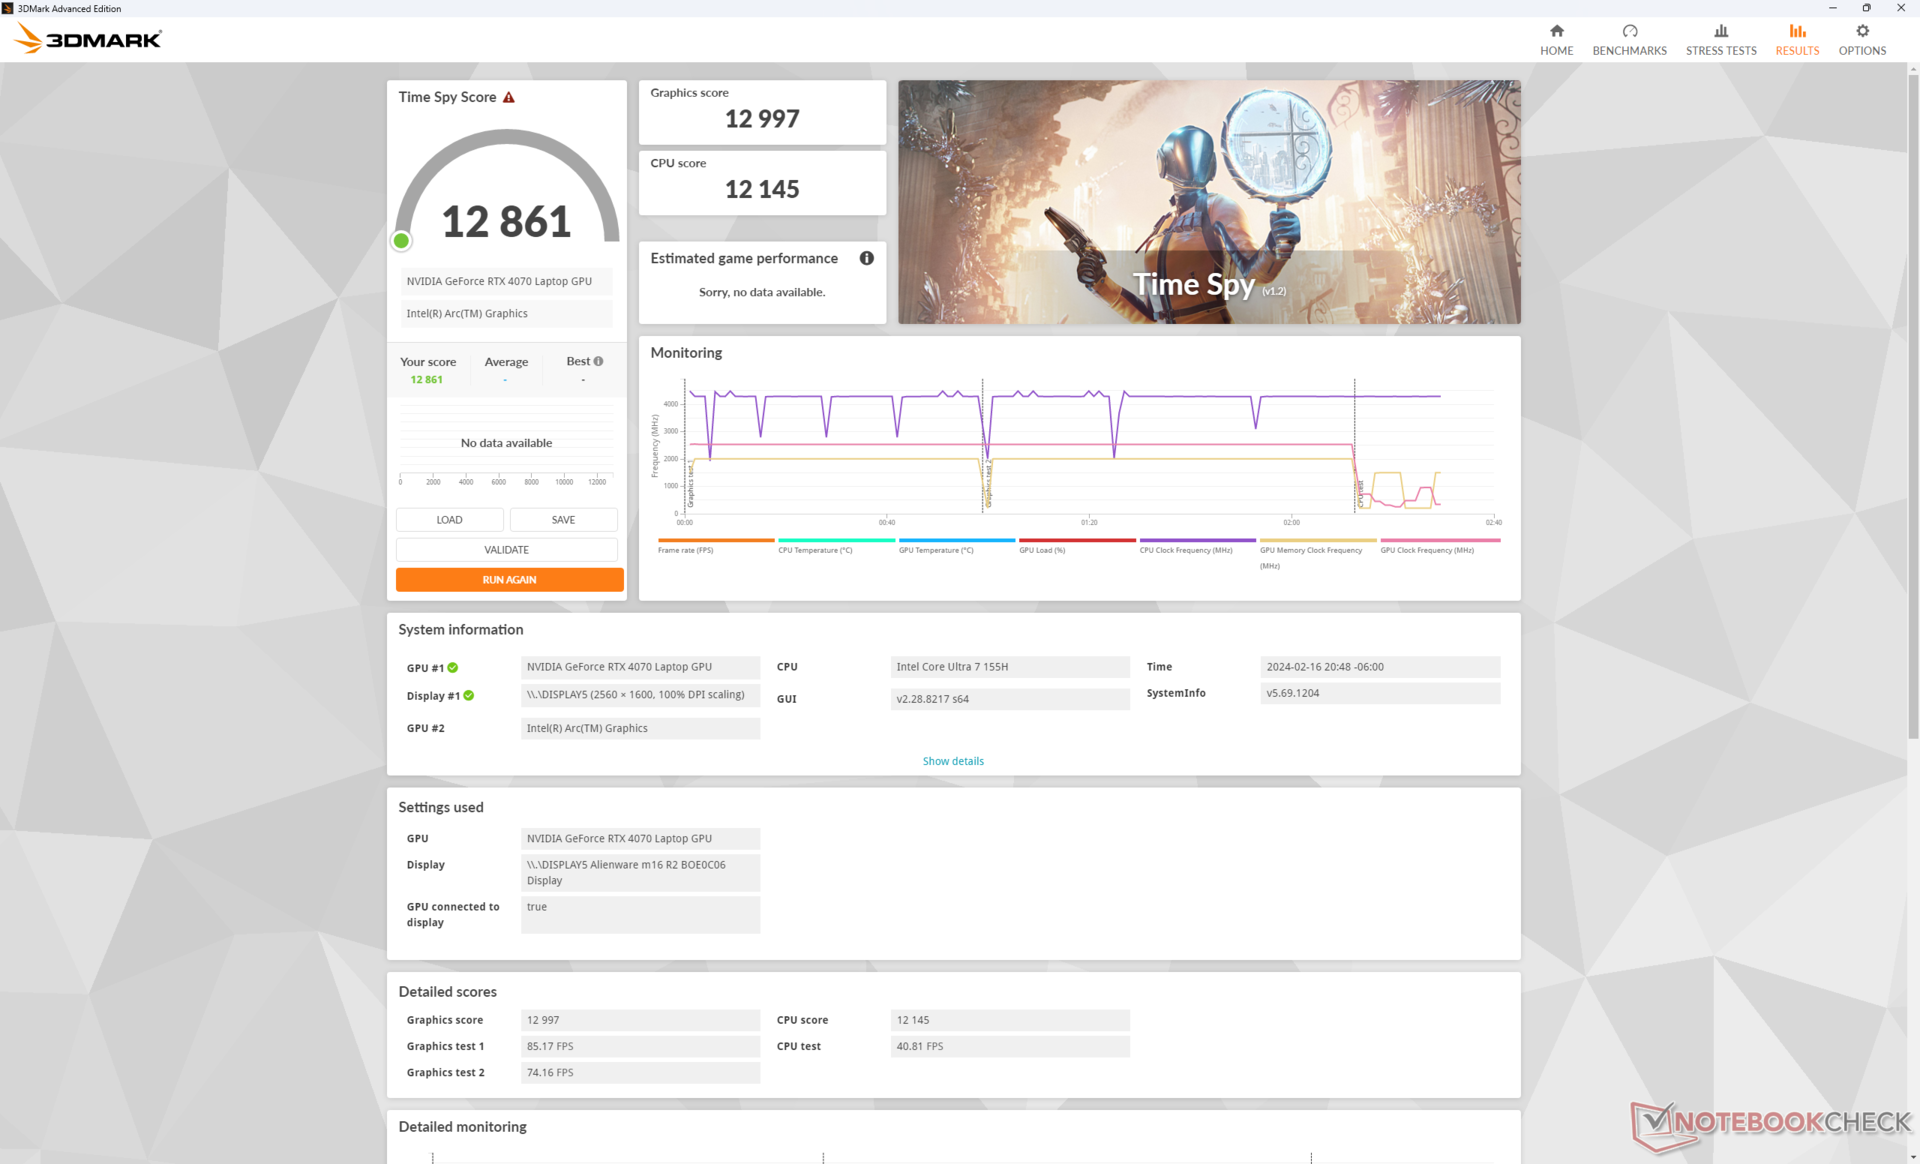
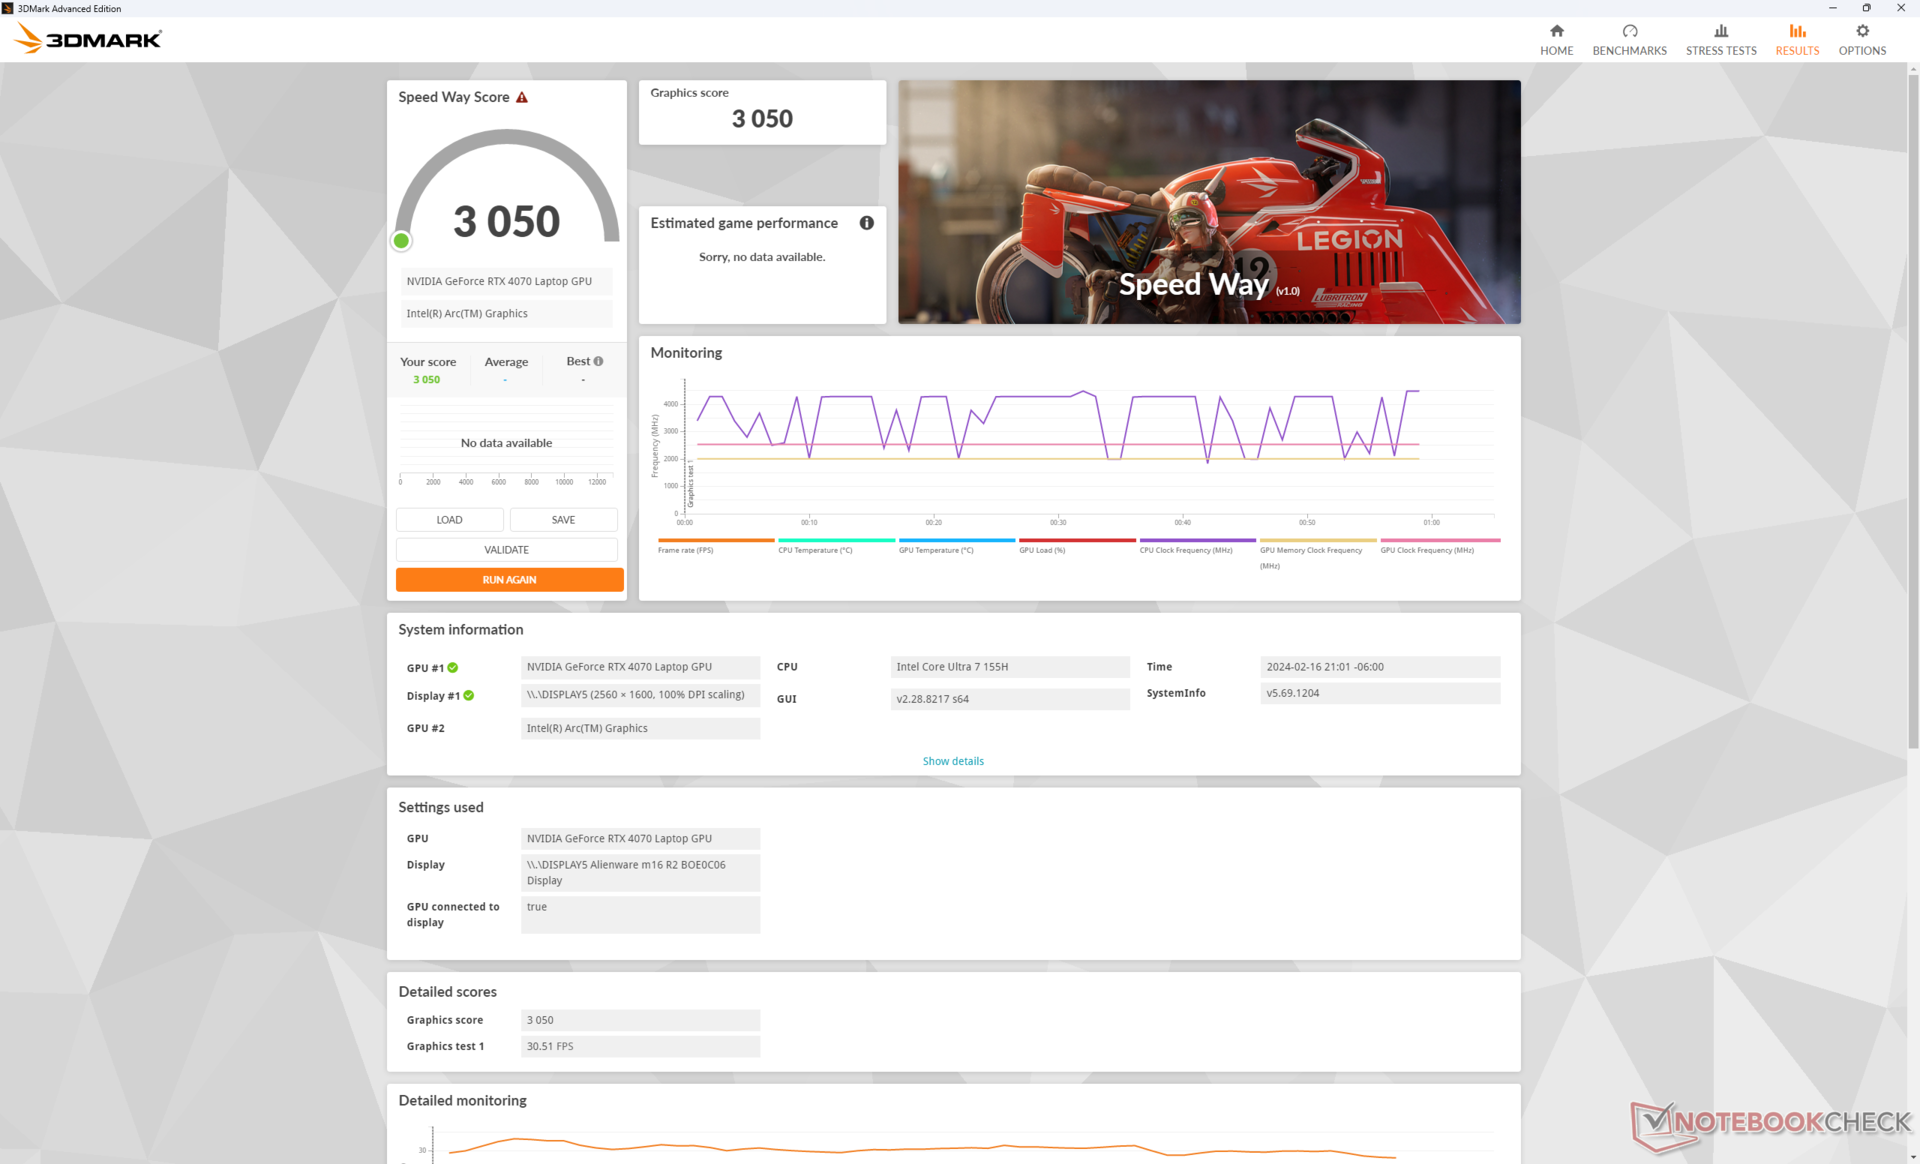
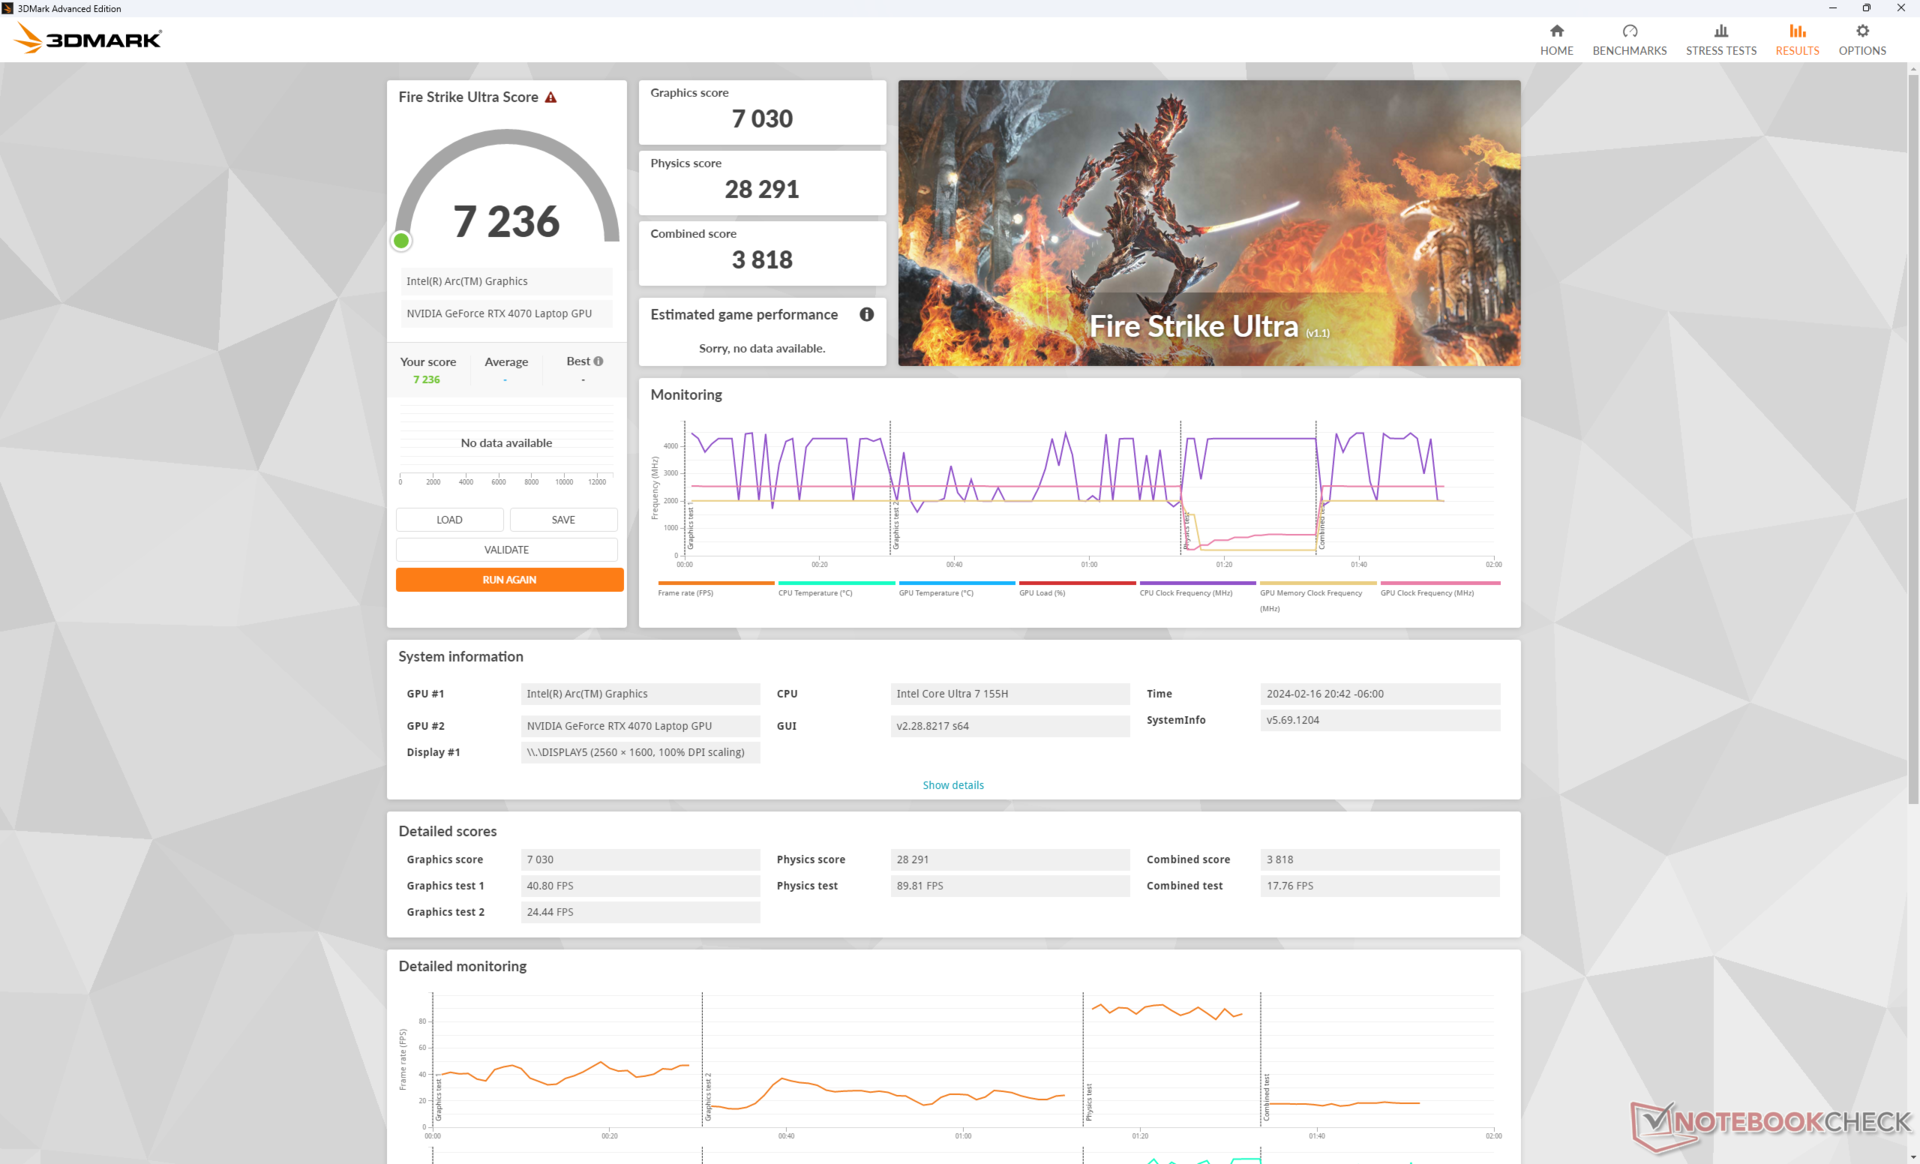
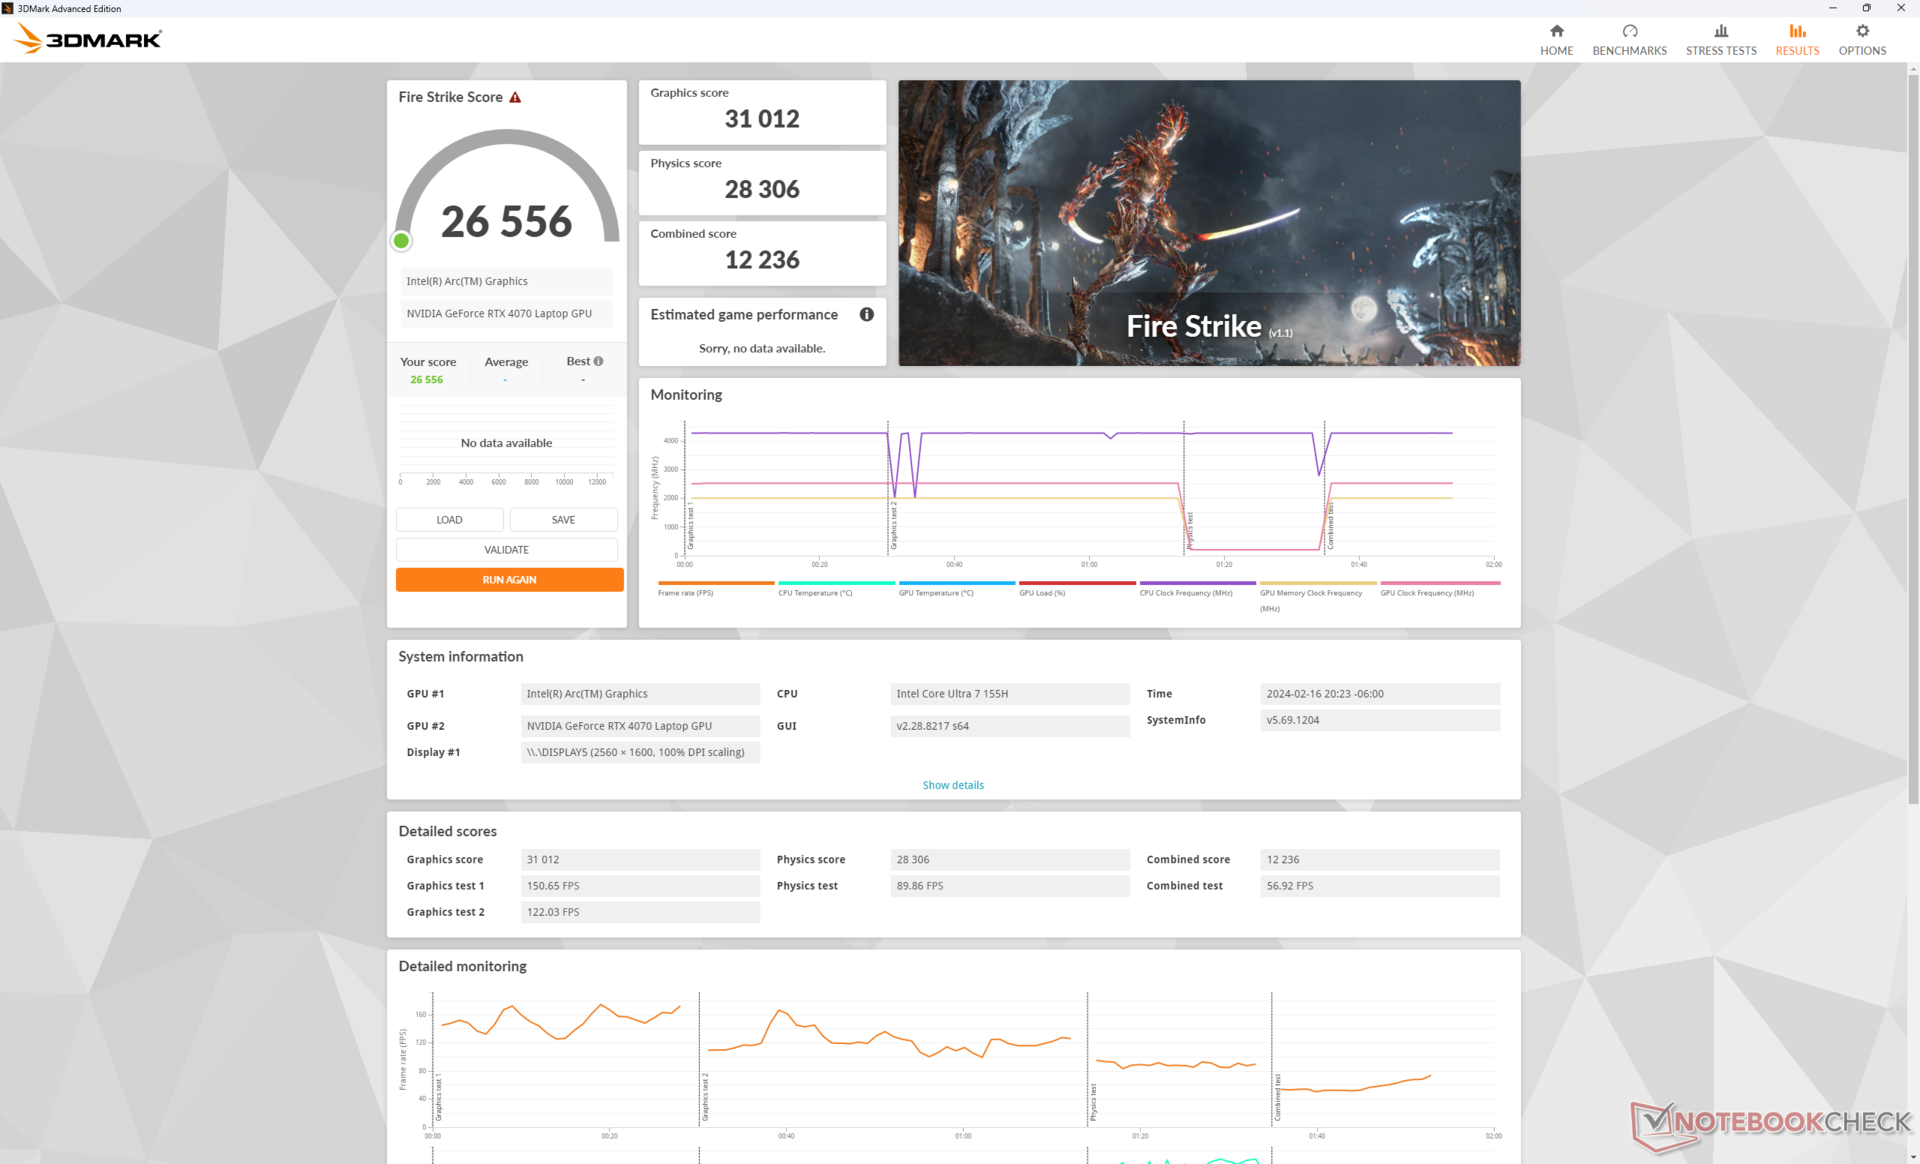
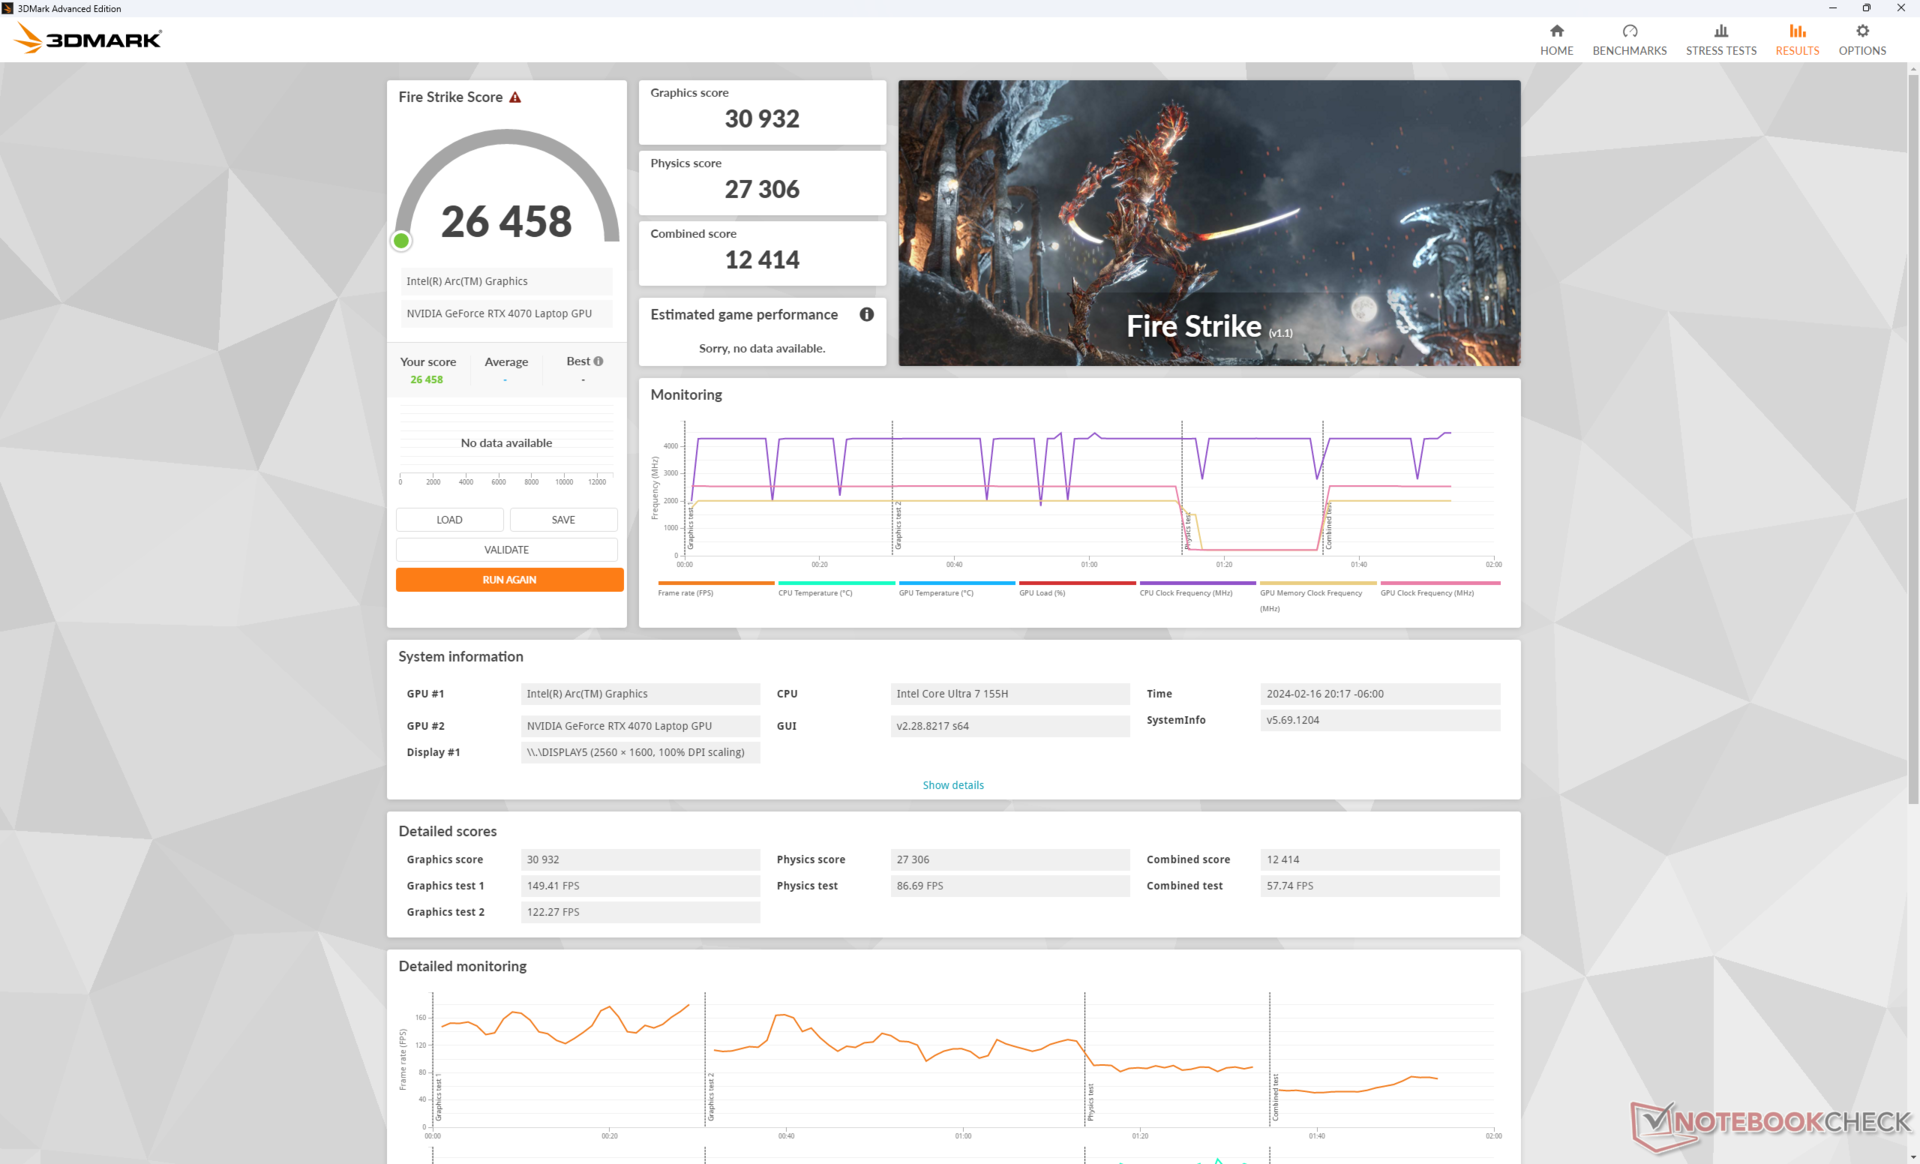
Intressant nog är prestandaskillnaderna mellan lägena Overdrive, Performance och Balanced i bästa fall små. Detta är förvånande eftersom en övergång till balanserat läge vanligtvis skulle innebära en prestandaförlust på 10 till 30 procent på de flesta andra bärbara speldatorer, men Fire Strike poäng skulle förbli nästan konstanta på vår Alienware m16 R2. Dell har definitivt ändrat fläktarnas ljudprofiler och därmed prestandan under utvecklingen av den här modellen.
| Strömförsörjning Profil | Poäng för grafik | Poäng för fysik | Kombinerat resultat |
| Överdrivet läge | 30932 | 27306 | 12414 |
| Prestanda-läge | 31012 (-0%) | 28306 (-0%) | 12236 (-0%) |
| Balanserat läge | 30603 (-0%) | 28281 (-0%) | 12448 (-0%) |
| Batteridrift | 24398 (-21%) | 24684 (-10%) | 10088 (-19%) |
Nedgradering till RTX 4060 förväntas påverka prestandan med 10 till 15 procent.
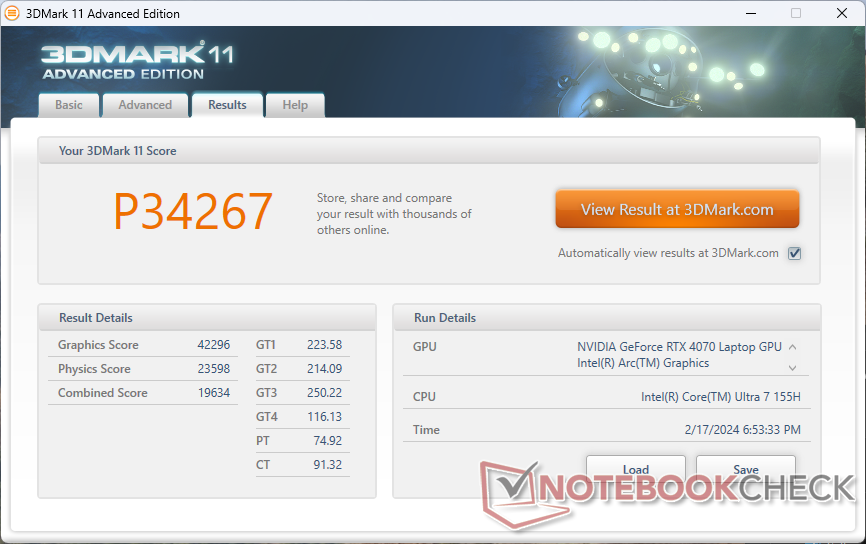
| 3DMark 11 Performance | 34267 poäng | |
| 3DMark Fire Strike Score | 26458 poäng | |
| 3DMark Time Spy Score | 12861 poäng | |
Hjälp | ||
* ... mindre är bättre
| F1 22 | |
| 1920x1080 Ultra High Preset AA:T AF:16x | |
| Lenovo Legion 9 16IRX8 | |
| Alienware m16 R1 AMD | |
| Alienware m16 R2 | |
| Genomsnitt NVIDIA GeForce RTX 4070 Laptop GPU (39.2 - 88.7, n=32) | |
| Lenovo Legion 5 16IRX G9 | |
| HP Victus 16-r0076TX | |
| Framework Laptop 16 | |
| 2560x1440 Ultra High Preset AA:T AF:16x | |
| Lenovo Legion 9 16IRX8 | |
| Alienware m16 R1 AMD | |
| Alienware m16 R2 | |
| Genomsnitt NVIDIA GeForce RTX 4070 Laptop GPU (10.6 - 58.8, n=30) | |
| Lenovo Legion 5 16IRX G9 | |
| Framework Laptop 16 | |
| 3840x2160 Ultra High Preset AA:T AF:16x | |
| Alienware m16 R1 AMD | |
| Alienware m16 R2 | |
| Genomsnitt NVIDIA GeForce RTX 4070 Laptop GPU (4.7 - 27.6, n=15) | |
| Framework Laptop 16 | |
| The Witcher 3 | |
| 1920x1080 Ultra Graphics & Postprocessing (HBAO+) | |
| Lenovo Legion 9 16IRX8 | |
| Alienware m16 R1 AMD | |
| Alienware m16 R2 | |
| Lenovo Legion 7 16IAX7-82TD004SGE | |
| HP Omen Transcend 16-u1095ng | |
| Genomsnitt NVIDIA GeForce RTX 4070 Laptop GPU (69.8 - 133.7, n=57) | |
| Asus ROG Zephyrus M16 GU603Z | |
| Lenovo Legion 5 16IRX G9 | |
| HP Victus 16-r0076TX | |
| Lenovo Legion S7 16ARHA7 | |
| Asus ROG Zephyrus M16 GU603H | |
| Dell G16 7620 | |
| Framework Laptop 16 | |
| 3840x2160 High Graphics & Postprocessing (Nvidia HairWorks Off) | |
| Alienware m16 R1 AMD | |
| Alienware m16 R2 | |
| Genomsnitt NVIDIA GeForce RTX 4070 Laptop GPU (26.5 - 83.5, n=16) | |
| Framework Laptop 16 | |
| Tiny Tina's Wonderlands | |
| 1920x1080 Badass Preset (DX12) | |
| Lenovo Legion 9 16IRX8 | |
| Alienware m16 R1 AMD | |
| Alienware m16 R2 | |
| Genomsnitt NVIDIA GeForce RTX 4070 Laptop GPU (58.6 - 115.9, n=18) | |
| Framework Laptop 16 | |
| 2560x1440 Badass Preset (DX12) | |
| Lenovo Legion 9 16IRX8 | |
| Alienware m16 R1 AMD | |
| Alienware m16 R2 | |
| Genomsnitt NVIDIA GeForce RTX 4070 Laptop GPU (49.8 - 79.5, n=17) | |
| Framework Laptop 16 | |
| 3840x2160 Badass Preset (DX12) | |
| Alienware m16 R1 AMD | |
| Genomsnitt NVIDIA GeForce RTX 4070 Laptop GPU (28.3 - 39.7, n=13) | |
| Alienware m16 R2 | |
| Framework Laptop 16 | |
| Baldur's Gate 3 | |
| 1920x1080 Ultra Preset AA:T | |
| Alienware m16 R2 | |
| Genomsnitt NVIDIA GeForce RTX 4070 Laptop GPU (66.7 - 128.5, n=30) | |
| Framework Laptop 16 | |
| 2560x1440 Ultra Preset AA:T | |
| Alienware m16 R2 | |
| Genomsnitt NVIDIA GeForce RTX 4070 Laptop GPU (54.4 - 89.6, n=25) | |
| Framework Laptop 16 | |
| 3840x2160 Ultra Preset AA:T | |
| Alienware m16 R2 | |
| Genomsnitt NVIDIA GeForce RTX 4070 Laptop GPU (33.4 - 45.2, n=12) | |
| Framework Laptop 16 | |
| Cyberpunk 2077 | |
| 1920x1080 Ultra Preset (FSR off) | |
| Lenovo Legion 9 16IRX8 | |
| Alienware m16 R2 | |
| Lenovo Legion 5 16IRX G9 | |
| Genomsnitt NVIDIA GeForce RTX 4070 Laptop GPU (30.7 - 90.7, n=40) | |
| Framework Laptop 16 | |
| 2560x1440 Ultra Preset (FSR off) | |
| Lenovo Legion 9 16IRX8 | |
| Alienware m16 R2 | |
| Lenovo Legion 5 16IRX G9 | |
| Genomsnitt NVIDIA GeForce RTX 4070 Laptop GPU (24.8 - 57.1, n=37) | |
| Framework Laptop 16 | |
| 3840x2160 Ultra Preset (FSR off) | |
| Genomsnitt NVIDIA GeForce RTX 4070 Laptop GPU (20.2 - 24, n=13) | |
| Alienware m16 R2 | |
| Framework Laptop 16 | |
Witcher 3 FPS Chart
| låg | med. | hög | ultra | QHD | 4K | |
|---|---|---|---|---|---|---|
| The Witcher 3 (2015) | 399.6 | 344.6 | 240.5 | 121.3 | 72 | |
| Dota 2 Reborn (2015) | 166.8 | 149 | 149.5 | 139.7 | 130.6 | |
| Final Fantasy XV Benchmark (2018) | 184.6 | 165.1 | 119.3 | 85.2 | 48.5 | |
| X-Plane 11.11 (2018) | 132.3 | 116 | 90.8 | 78.2 | ||
| Far Cry 5 (2018) | 146 | 134 | 123 | 115 | 61 | |
| Strange Brigade (2018) | 427 | 308 | 255 | 219 | 141.7 | 73.8 |
| Tiny Tina's Wonderlands (2022) | 244 | 202.8 | 138.3 | 107.6 | 74.6 | 34.8 |
| F1 22 (2022) | 235 | 225 | 217 | 83.6 | 52.9 | 26.6 |
| Baldur's Gate 3 (2023) | 168.7 | 148.9 | 129.3 | 128.5 | 88.3 | 44.3 |
| Cyberpunk 2077 (2023) | 125.7 | 114.1 | 95.6 | 83.1 | 52.7 | 21 |
Utsläpp
Buller från systemet
Fläktljudet har förbättrats avsevärt jämfört med m16 R1. När vi till exempel kör 3DMark 06 i balanserat läge är m16 R2 tystare under längre tid med 32 dB(A), medan m16 R1 är onödigt högljudd med 52 dB(A) under hela den första benchmarkscenen. Detta gör m16 R2 mer jämförbar med konkurrenter som Lenovo Legion Slim 7 under liknande förhållanden.
Fläktljudet vid spel är nära kopplat till den valda strömprofilen. Till exempel skulle fläktljudet ligga på 52 dB(A), 54 dB(A) och 62 dB(A) när man kör Witcher 3 i balanserat läge, prestandaläge respektive overdrive-läge. Eftersom prestandaskillnaderna mellan dessa tre lägen är mycket små, som nämnts ovan, rekommenderar vi att du spelar i Performance-läget och undviker Overdrive-läget i de flesta scenarier. Maxvärdet på 62 dB(A) är mycket högre än vad vi registrerade på den kraftfullare Alienware x16 R1, men det här läget är främst avsett för överklockning av slutanvändare; Performance-läget är tillräckligt för standardinställningar.
Ljudnivå
| Låg belastning |
| 25.3 / 25.3 / 25.3 dB(A) |
| Hög belastning |
| 31.7 / 62 dB(A) |
 | ||
30 dB tyst 40 dB(A) hörbar 50 dB(A) högt ljud |
||
min: | ||
| Alienware m16 R2 GeForce RTX 4070 Laptop GPU, Ultra 7 155H, Samsung PM9A1 MZVL21T0HCLR | Alienware m16 R1 Intel GeForce RTX 4060 Laptop GPU, i7-13700HX, Kioxia KXG70ZNV512G | Alienware x16 R1 GeForce RTX 4080 Laptop GPU, i9-13900HK, SK hynix PC801 HFS001TEJ9X101N | HP Omen Transcend 16-u1095ng GeForce RTX 4070 Laptop GPU, i9-14900HX, Kioxia XG8 KXG80ZNV1T02 | Asus ROG Zephyrus G16 2024 GU605M GeForce RTX 4070 Laptop GPU, Ultra 7 155H, WD PC SN560 SDDPNQE-1T00 | Lenovo Legion Slim 7 16APH8 GeForce RTX 4060 Laptop GPU, R7 7840HS, WDC PC SN810 1TB | |
|---|---|---|---|---|---|---|
| Noise | -8% | 1% | -8% | 2% | 0% | |
| av / miljö * (dB) | 24.7 | 25 -1% | 22.7 8% | 24 3% | 23.9 3% | 24 3% |
| Idle Minimum * (dB) | 25.3 | 25 1% | 23.1 9% | 29 -15% | 23.9 6% | 25 1% |
| Idle Average * (dB) | 25.3 | 26 -3% | 25.8 -2% | 30 -19% | 27.8 -10% | 28 -11% |
| Idle Maximum * (dB) | 25.3 | 27 -7% | 25.8 -2% | 31 -23% | 30.1 -19% | 31 -23% |
| Load Average * (dB) | 31.7 | 52 -64% | 39.3 -24% | 45 -42% | 34.2 -8% | 33 -4% |
| Witcher 3 ultra * (dB) | 53.8 | 51 5% | 49.9 7% | 44 18% | 46.4 14% | 47 13% |
| Load Maximum * (dB) | 62 | 53 15% | 54.8 12% | 47 24% | 46.4 25% | 49 21% |
* ... mindre är bättre
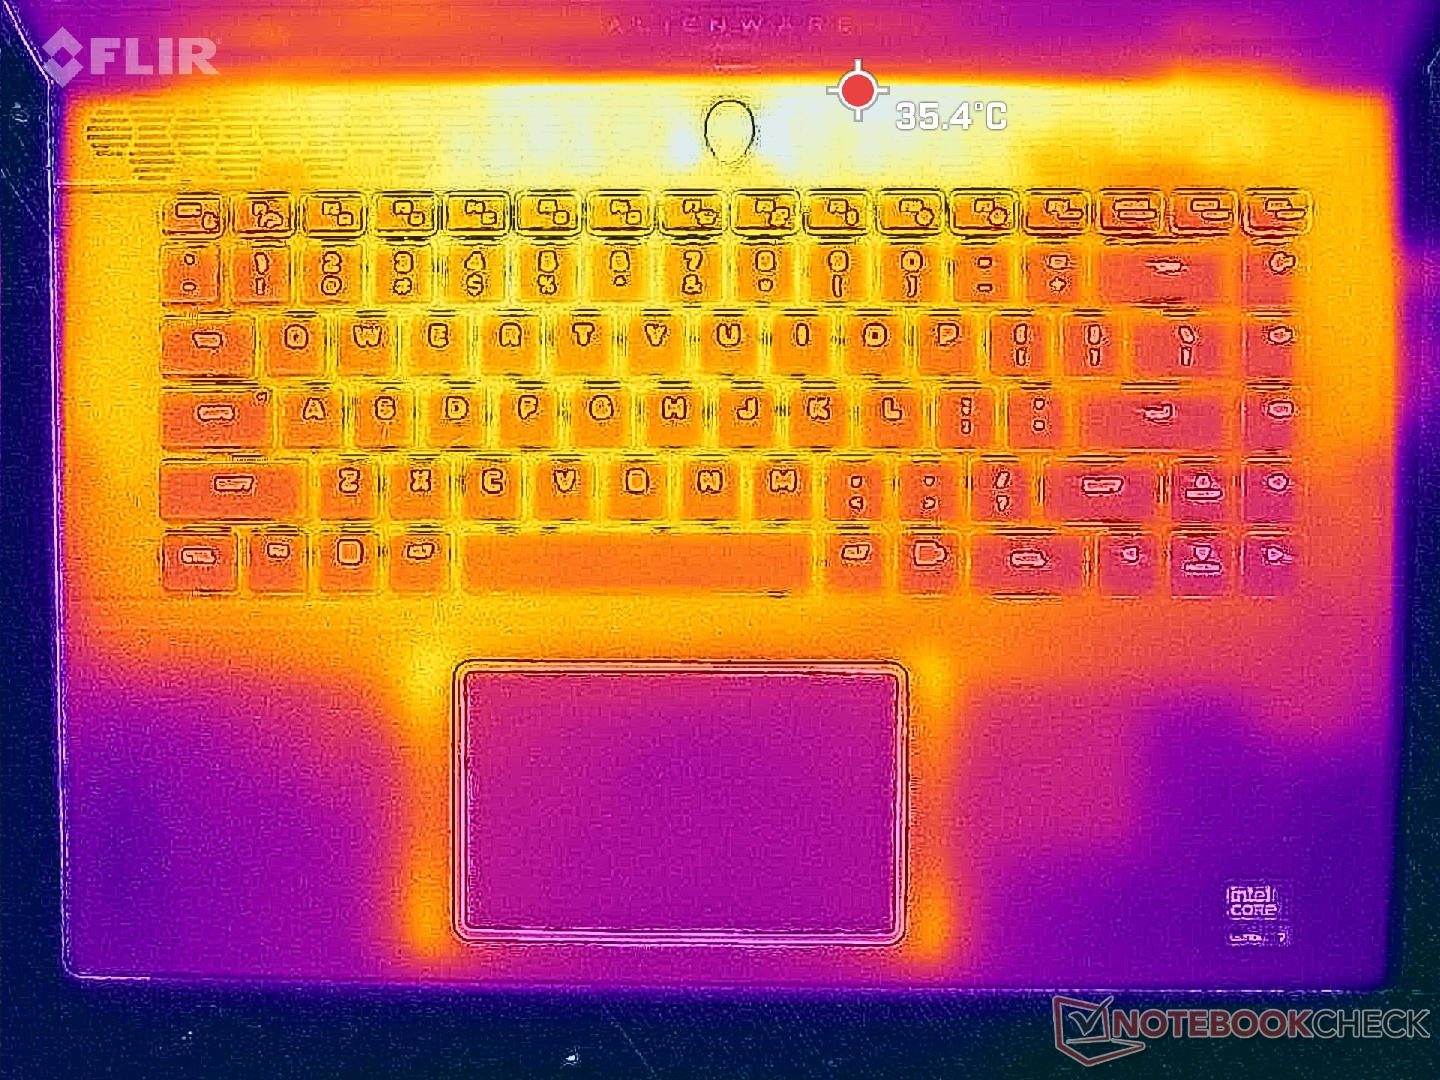
Temperatur
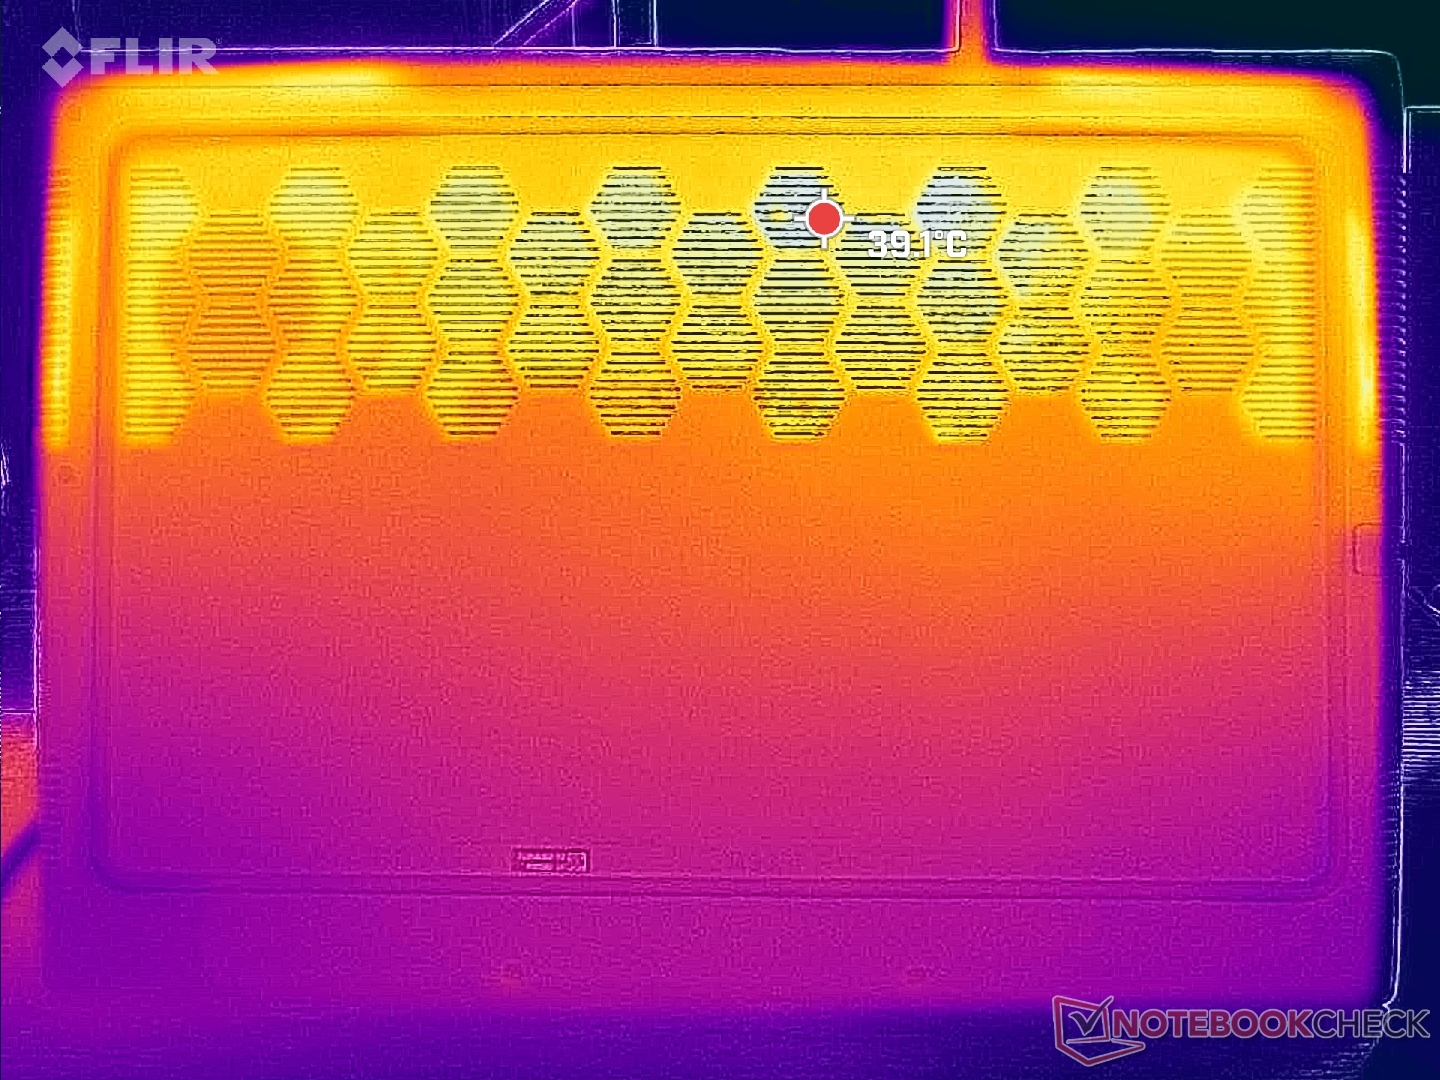
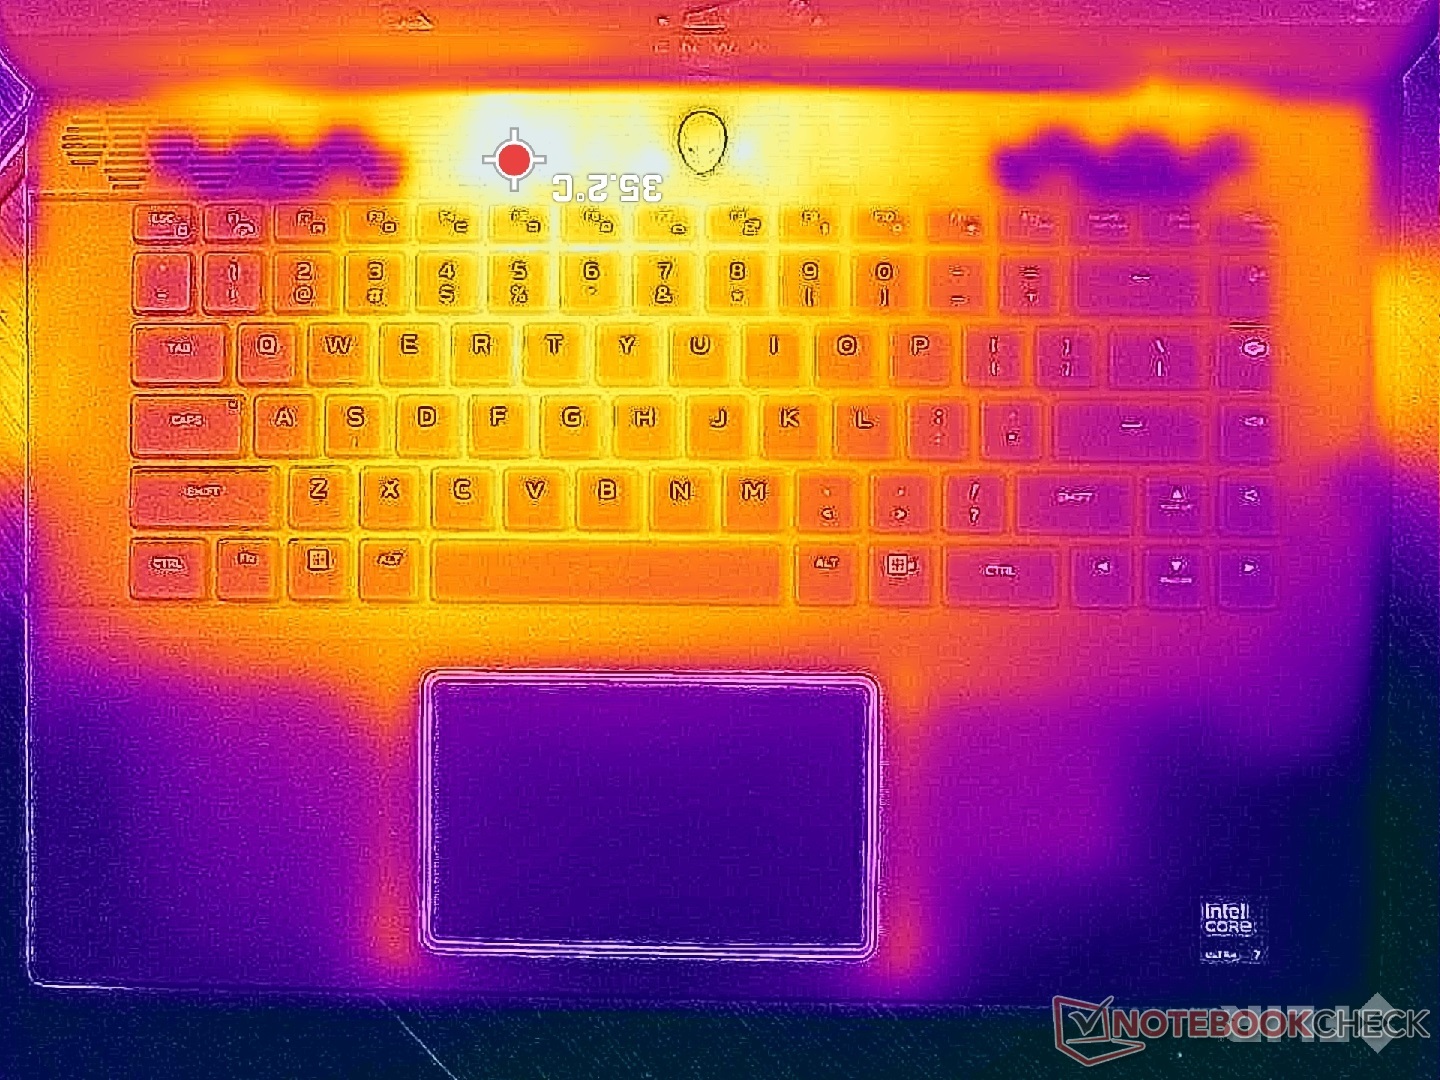
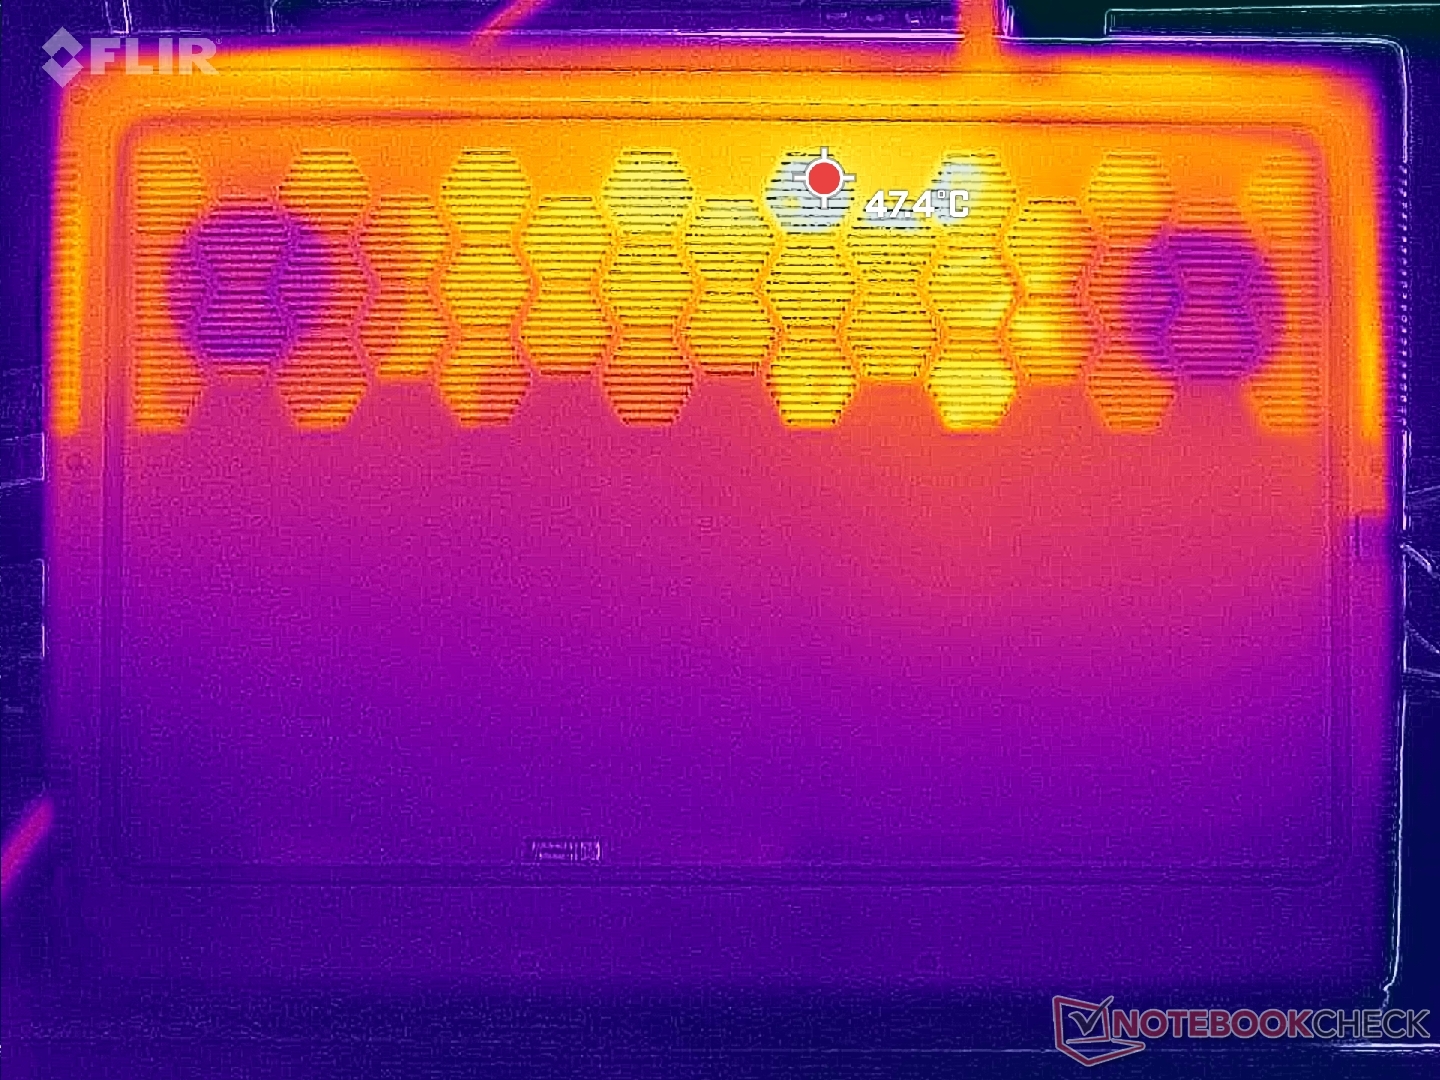
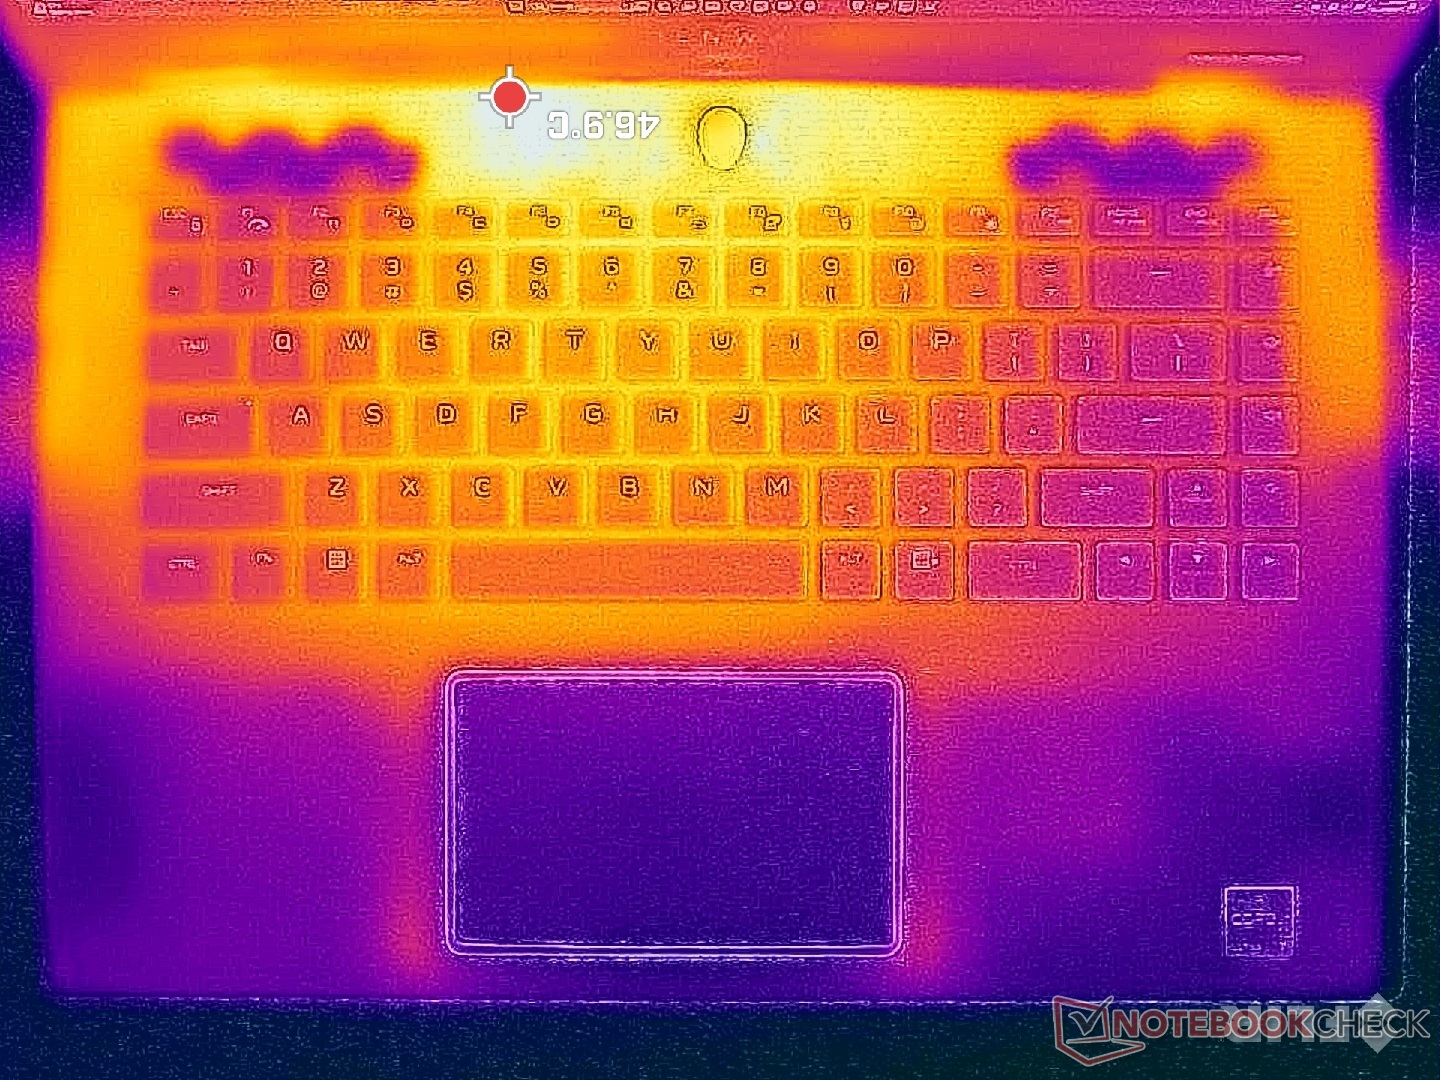
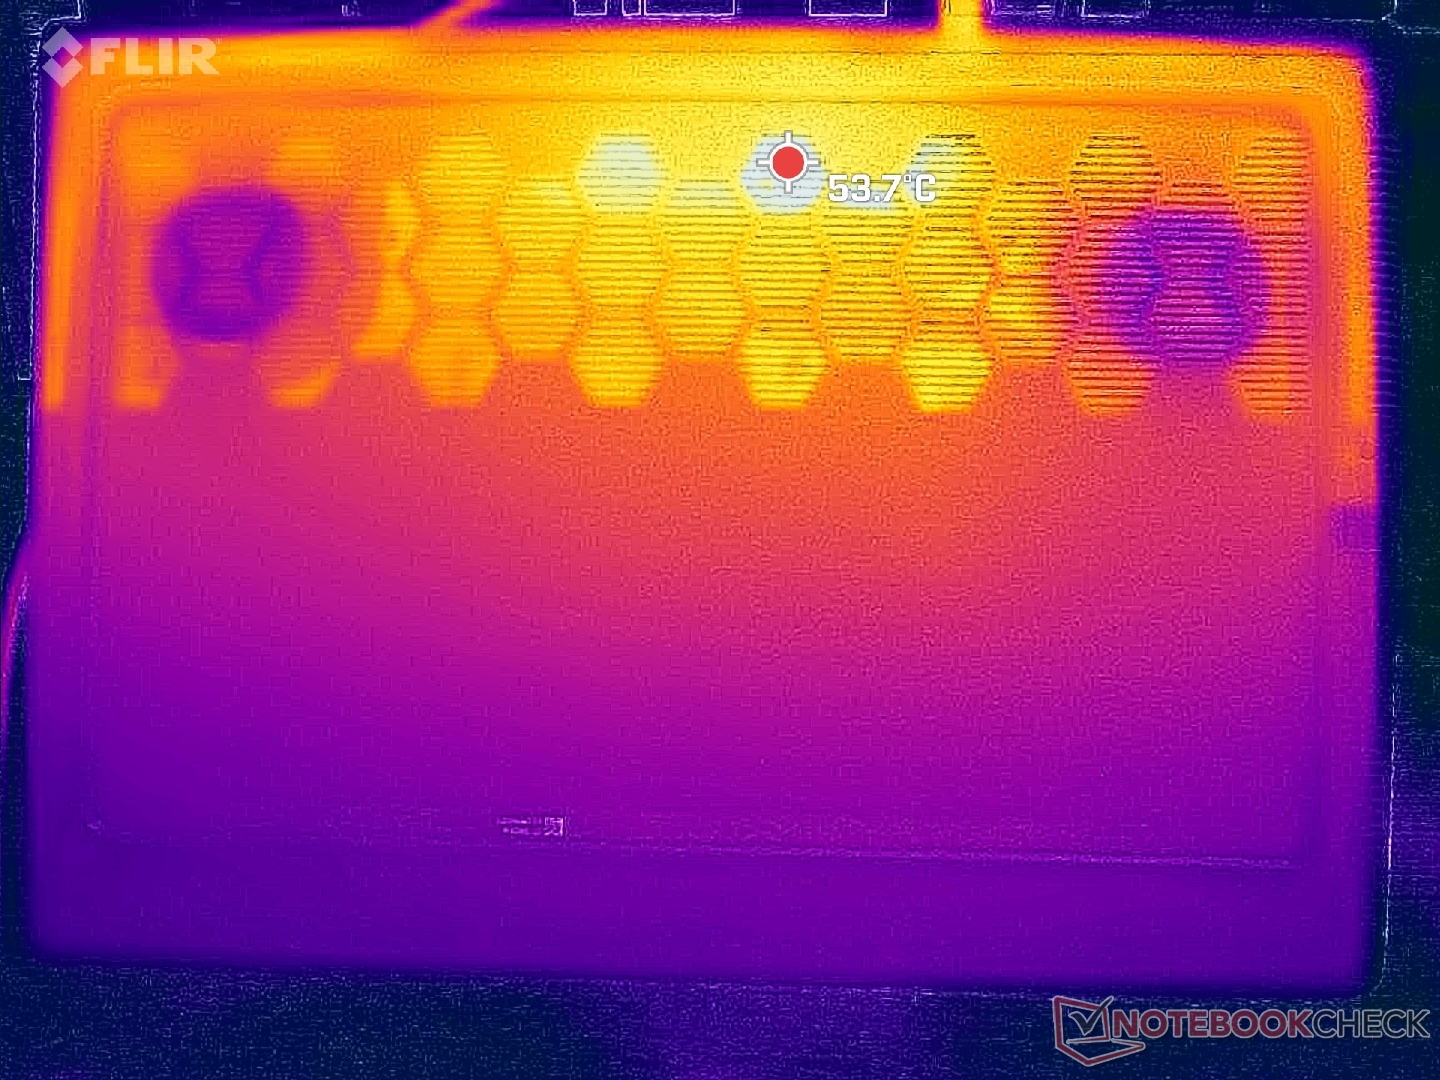
När man kör krävande belastningar som spel är hettan koncentrerad till baksidan av chassit där händerna sannolikt inte kommer i kontakt med datorn. Handledsstöden och tangentbordet skulle förbli rimligt svala i mitten av 20 C respektive 30 C-intervallet, medan baksidan kan närma sig 50 C. Genomsnittliga yttemperaturer är varmare än vad vi registrerade på Blade 16 men fortfarande svalare än på HP Omen Transcend 16 där vissa områden kan nå över 60 C.
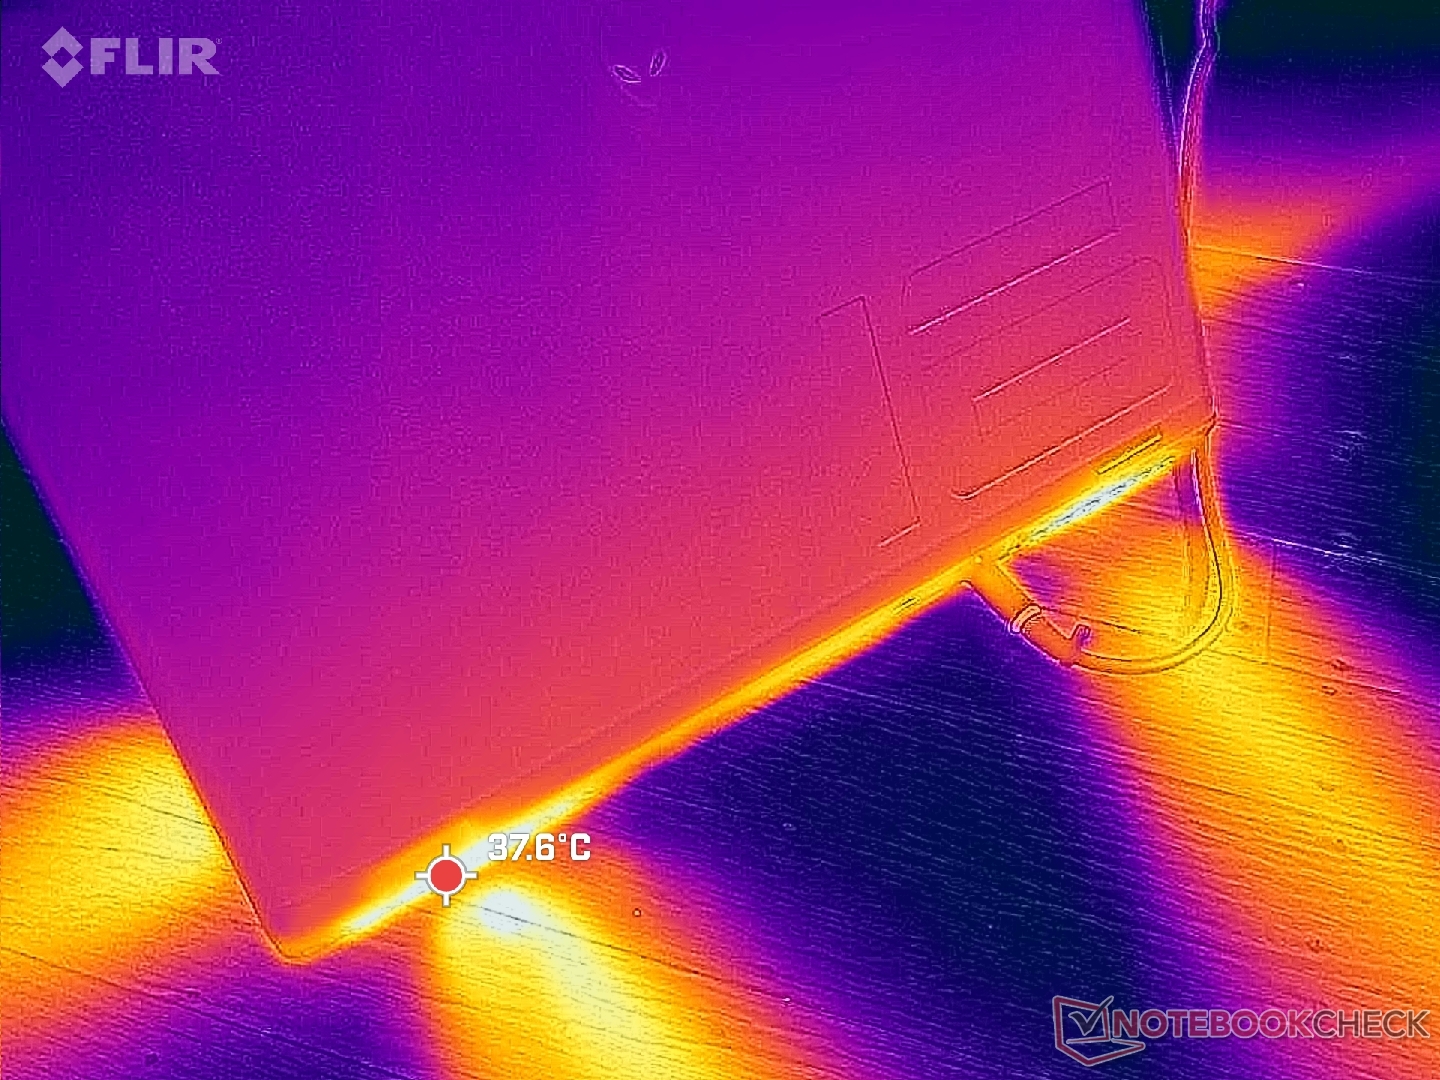
(±) Den maximala temperaturen på ovansidan är 44.8 °C / 113 F, jämfört med genomsnittet av 40.4 °C / 105 F , allt från 21.2 till 68.8 °C för klassen Gaming.
(-) Botten värms upp till maximalt 48 °C / 118 F, jämfört med genomsnittet av 43.2 °C / 110 F
(+) Vid tomgångsbruk är medeltemperaturen för ovansidan 30.9 °C / 88 F, jämfört med enhetsgenomsnittet på 33.9 °C / ### class_avg_f### F.
(+) När du spelar The Witcher 3 är medeltemperaturen för ovansidan 28.7 °C / 84 F, jämfört med enhetsgenomsnittet på 33.9 °C / ## #class_avg_f### F.
(+) Handledsstöden och pekplattan är kallare än hudtemperaturen med maximalt 27.2 °C / 81 F och är därför svala att ta på.
(±) Medeltemperaturen för handledsstödsområdet på liknande enheter var 28.8 °C / 83.8 F (+1.6 °C / 2.8 F).
| Alienware m16 R2 Intel Core Ultra 7 155H, NVIDIA GeForce RTX 4070 Laptop GPU | Alienware m16 R1 Intel Intel Core i7-13700HX, NVIDIA GeForce RTX 4060 Laptop GPU | Alienware x16 R1 Intel Core i9-13900HK, NVIDIA GeForce RTX 4080 Laptop GPU | HP Omen Transcend 16-u1095ng Intel Core i9-14900HX, NVIDIA GeForce RTX 4070 Laptop GPU | Asus ROG Zephyrus G16 2024 GU605M Intel Core Ultra 7 155H, NVIDIA GeForce RTX 4070 Laptop GPU | Lenovo Legion Slim 7 16APH8 AMD Ryzen 7 7840HS, NVIDIA GeForce RTX 4060 Laptop GPU | |
|---|---|---|---|---|---|---|
| Heat | -3% | 3% | 3% | 10% | 8% | |
| Maximum Upper Side * (°C) | 44.8 | 49 -9% | 47.2 -5% | 49 -9% | 50.3 -12% | 46 -3% |
| Maximum Bottom * (°C) | 48 | 48 -0% | 47.8 -0% | 63 -31% | 48 -0% | 46 4% |
| Idle Upper Side * (°C) | 37.2 | 40 -8% | 36.8 1% | 30 19% | 28.8 23% | 33 11% |
| Idle Bottom * (°C) | 42 | 39 7% | 35.8 15% | 29 31% | 29.8 29% | 34 19% |
* ... mindre är bättre
Högtalare
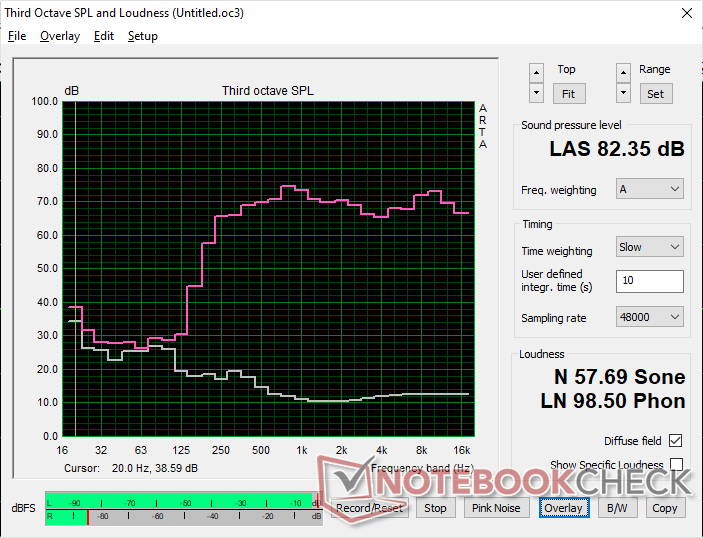
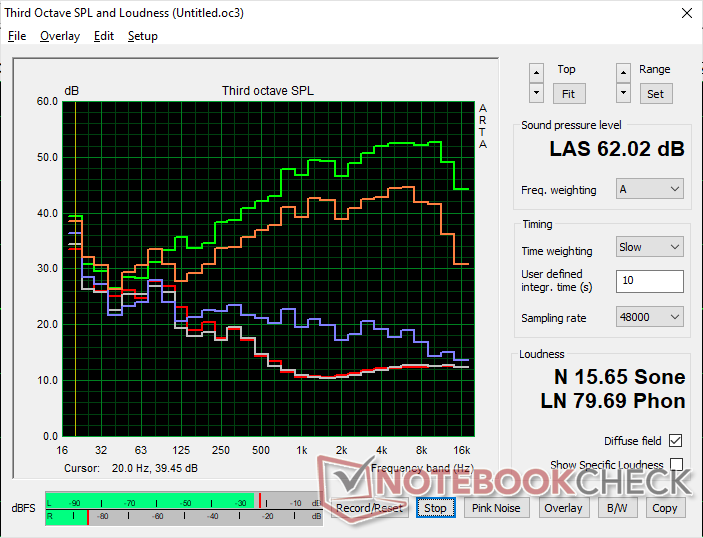
Alienware m16 R2 ljudanalys
(+) | högtalare kan spela relativt högt (82.4 dB)
Bas 100 - 315 Hz
(-) | nästan ingen bas - i genomsnitt 20.1% lägre än medianen
(±) | linjäriteten för basen är genomsnittlig (11.1% delta till föregående frekvens)
Mellan 400 - 2000 Hz
(+) | balanserad mellan - endast 2.2% från medianen
(+) | mids är linjära (3.1% delta till föregående frekvens)
Högsta 2 - 16 kHz
(+) | balanserade toppar - endast 2.2% från medianen
(+) | toppar är linjära (3.5% delta till föregående frekvens)
Totalt 100 - 16 000 Hz
(+) | det totala ljudet är linjärt (12.9% skillnad mot median)
Jämfört med samma klass
» 17% av alla testade enheter i den här klassen var bättre, 4% liknande, 79% sämre
» Den bästa hade ett delta på 6%, genomsnittet var 18%, sämst var 132%
Jämfört med alla testade enheter
» 12% av alla testade enheter var bättre, 3% liknande, 85% sämre
» Den bästa hade ett delta på 4%, genomsnittet var 23%, sämst var 134%
Apple MacBook Pro 16 2021 M1 Pro ljudanalys
(+) | högtalare kan spela relativt högt (84.7 dB)
Bas 100 - 315 Hz
(+) | bra bas - bara 3.8% från medianen
(+) | basen är linjär (5.2% delta till föregående frekvens)
Mellan 400 - 2000 Hz
(+) | balanserad mellan - endast 1.3% från medianen
(+) | mids är linjära (2.1% delta till föregående frekvens)
Högsta 2 - 16 kHz
(+) | balanserade toppar - endast 1.9% från medianen
(+) | toppar är linjära (2.7% delta till föregående frekvens)
Totalt 100 - 16 000 Hz
(+) | det totala ljudet är linjärt (4.6% skillnad mot median)
Jämfört med samma klass
» 0% av alla testade enheter i den här klassen var bättre, 0% liknande, 100% sämre
» Den bästa hade ett delta på 5%, genomsnittet var 17%, sämst var 45%
Jämfört med alla testade enheter
» 0% av alla testade enheter var bättre, 0% liknande, 100% sämre
» Den bästa hade ett delta på 4%, genomsnittet var 23%, sämst var 134%
Energihantering - smalare och mindre strömkrävande
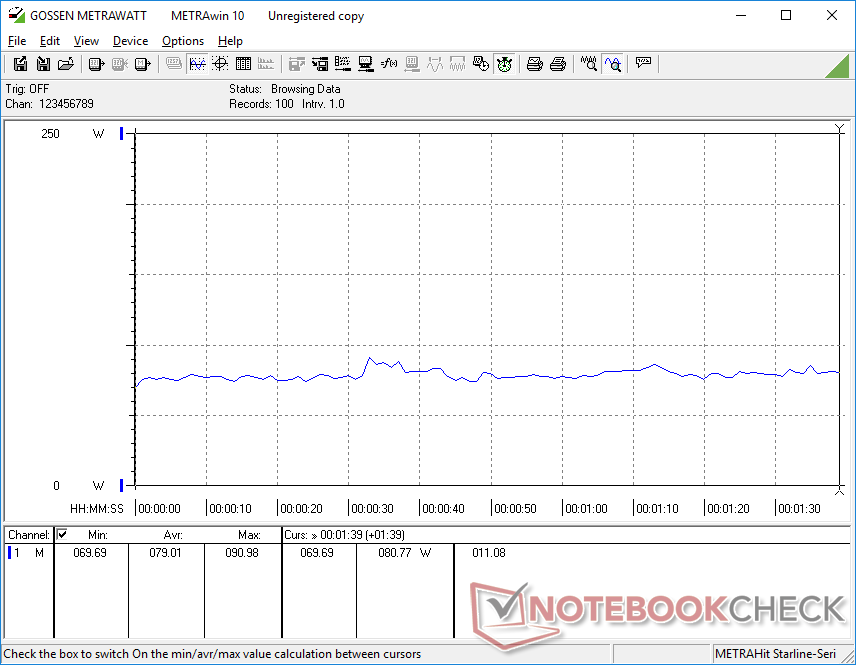
Strömförbrukning
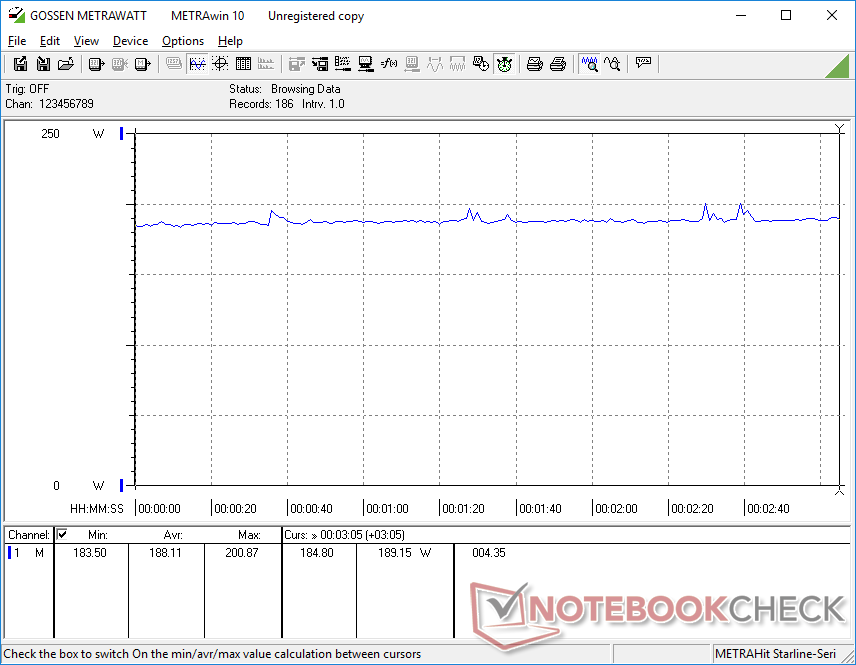
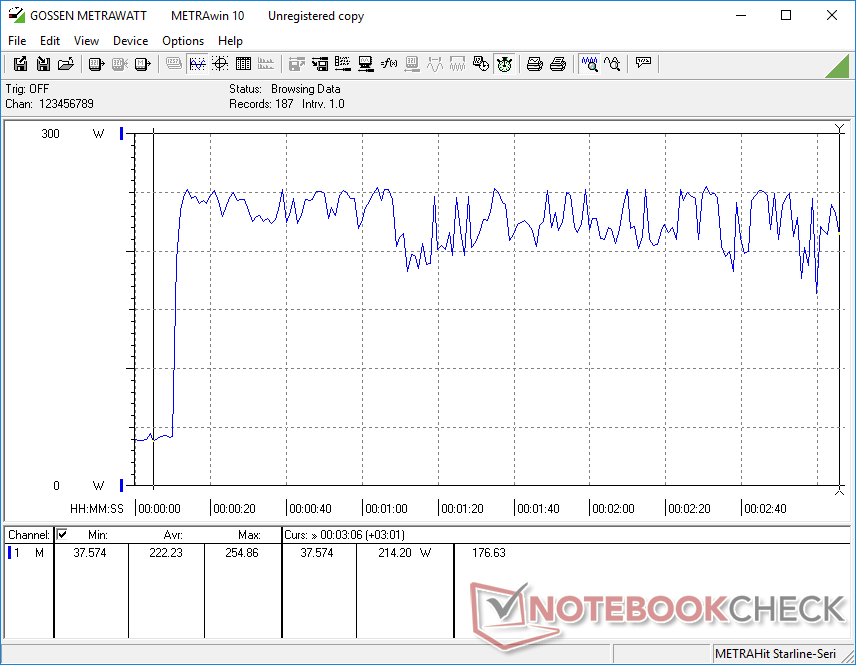
Tomgångskörning på skrivbordet kan vara så låg som 8 W när den är inställd på lägsta ljusstyrka i Tyst läge och iGPU-läge eller upp till 40 W när den är inställd på högsta ljusstyrka i Overdrive-läge och dGPU-läge. Du bör ha läget Balanserat och iGPU-läget när de extra hästkrafterna inte behövs för att förlänga batteritiden, vilket framgår av nästa avsnitt.
När du spelar eller kör CPU-tunga belastningar blir den totala förbrukningen ungefär densamma som den vi registrerade på RTX 4060-drivna m16 R1 för något högre prestanda per watt.
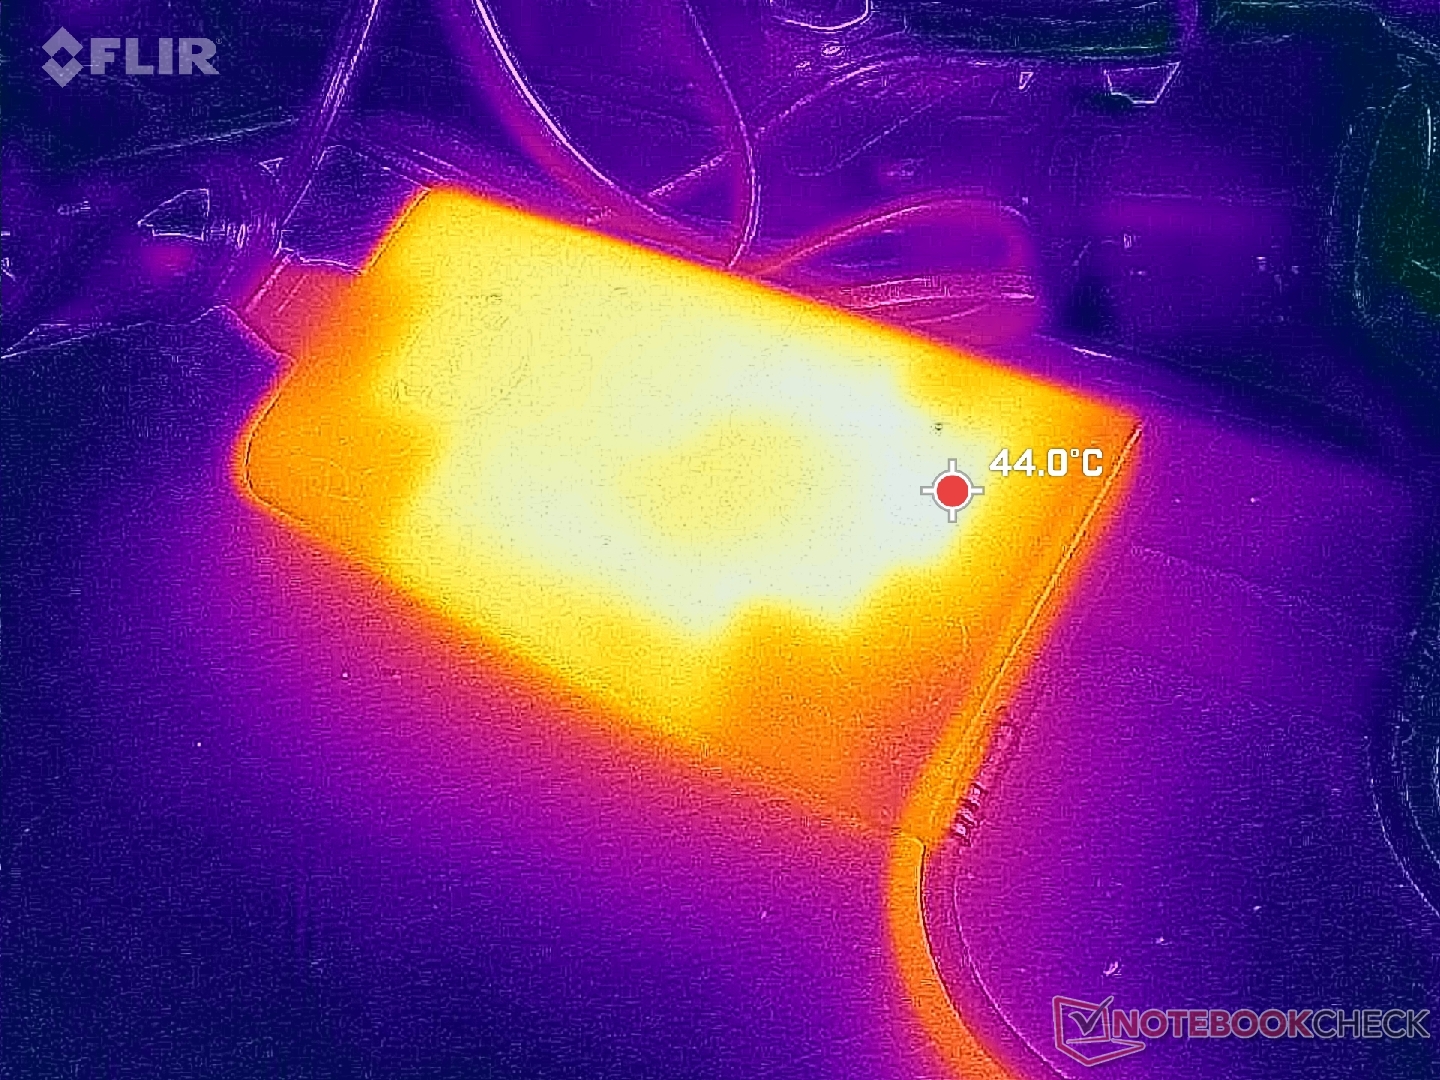
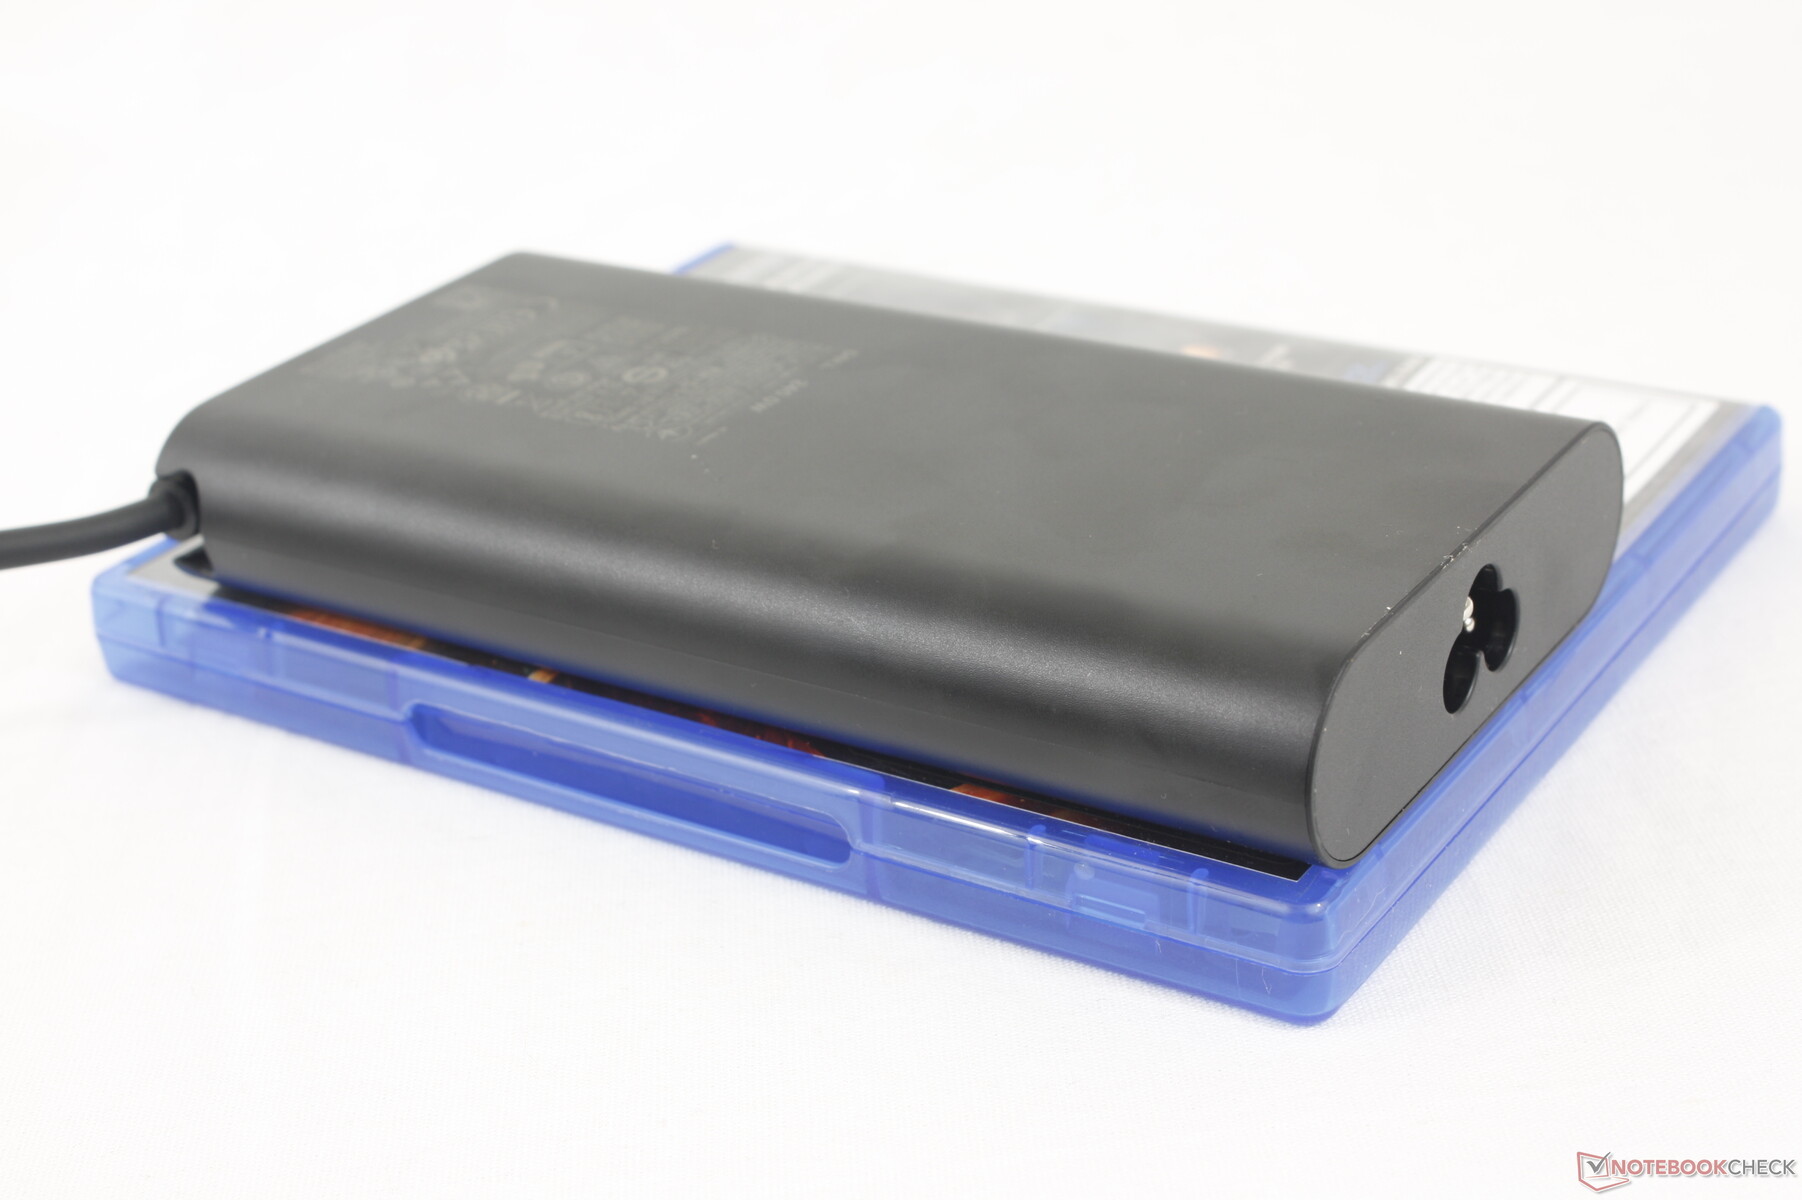
M16 R2 kan konfigureras att levereras med en liten (~15,2 x 7,7 x 2,3 cm) 240 W GaN AC-adapter medan m16 R1 levereras med en större (~20 x 10 x 4,5 cm) 330 W för att passa RTX 4080- och 4090-konfigurationerna. Vissa SKU:er som vår kan levereras med en 280 W AC-adapter istället.

| Av/Standby | |
| Låg belastning | |
| Hög belastning |
|
Förklaring:
min: | |
| Alienware m16 R2 Ultra 7 155H, GeForce RTX 4070 Laptop GPU, Samsung PM9A1 MZVL21T0HCLR, IPS, 2560x1600, 16" | Alienware m16 R1 Intel i7-13700HX, GeForce RTX 4060 Laptop GPU, Kioxia KXG70ZNV512G, IPS, 2560x1600, 16" | Alienware x16 R1 i9-13900HK, GeForce RTX 4080 Laptop GPU, SK hynix PC801 HFS001TEJ9X101N, IPS, 2560x1600, 16" | HP Omen Transcend 16-u1095ng i9-14900HX, GeForce RTX 4070 Laptop GPU, Kioxia XG8 KXG80ZNV1T02, OLED, 2560x1600, 16" | Asus ROG Zephyrus G16 2024 GU605M Ultra 7 155H, GeForce RTX 4070 Laptop GPU, WD PC SN560 SDDPNQE-1T00, OLED, 2560x1600, 16" | Lenovo Legion Slim 7 16APH8 R7 7840HS, GeForce RTX 4060 Laptop GPU, WDC PC SN810 1TB, IPS, 2560x1600, 16" | |
|---|---|---|---|---|---|---|
| Power Consumption | -10% | -77% | -13% | 24% | -67% | |
| Idle Minimum * (Watt) | 8.1 | 10 -23% | 25.2 -211% | 10 -23% | 8.3 -2% | 33 -307% |
| Idle Average * (Watt) | 13 | 14 -8% | 29.9 -130% | 18 -38% | 12.5 4% | 35 -169% |
| Idle Maximum * (Watt) | 40.3 | 21 48% | 49.8 -24% | 32 21% | 12.8 68% | 45 -12% |
| Load Average * (Watt) | 79 | 119 -51% | 105.4 -33% | 128 -62% | 71.3 10% | 59 25% |
| Witcher 3 ultra * (Watt) | 188.1 | 186.7 1% | 263 -40% | 148.4 21% | 127.5 32% | 131 30% |
| Load Maximum * (Watt) | 254.9 | 323 -27% | 313.8 -23% | 242 5% | 169.1 34% | 177 31% |
* ... mindre är bättre
Power Consumption Witcher 3 / Stresstest
Power Consumption external Monitor
Batteritid
Batterikapaciteten är faktiskt något större i år på 90 Wh trots den mindre chassidesignen. Det verkar också som att Dell har åtgärdat de problem med batteritiden som vi upplevde på många äldre bärbara Alienware-datorer; webbsurfning i balanserat och Optimus-läge varar i hela 8 timmar jämfört med nästan hälften så länge på Alienware m16 R1. Systemet kan till och med överleva de senaste Asus ROG Zephyrus G16 GU605M med nästan en timme.
Laddning från tom till full kapacitet tar cirka 90 minuter. Alternativt tar det knappt 40 minuter att ladda till 85 procent. Modellen kan också laddas via generiska USB-C-adaptrar, om än mycket långsammare.
| Alienware m16 R2 Ultra 7 155H, GeForce RTX 4070 Laptop GPU, 90 Wh | Alienware m16 R1 Intel i7-13700HX, GeForce RTX 4060 Laptop GPU, 86 Wh | Alienware x16 R1 i9-13900HK, GeForce RTX 4080 Laptop GPU, 90 Wh | HP Omen Transcend 16-u1095ng i9-14900HX, GeForce RTX 4070 Laptop GPU, 97 Wh | Asus ROG Zephyrus G16 2024 GU605M Ultra 7 155H, GeForce RTX 4070 Laptop GPU, 90 Wh | Lenovo Legion Slim 7 16APH8 R7 7840HS, GeForce RTX 4060 Laptop GPU, 99.9 Wh | |
|---|---|---|---|---|---|---|
| Batteridrifttid | -30% | -47% | -40% | 5% | -12% | |
| Reader / Idle (h) | 12.6 | 6.4 -49% | 7.3 -42% | |||
| WiFi v1.3 (h) | 8.1 | 4.8 -41% | 2.5 -69% | 4.9 -40% | 7.3 -10% | 7.1 -12% |
| Load (h) | 1 | 1 0% | 0.7 -30% | 1.2 20% | ||
| H.264 (h) | 5.6 | 11.2 |
För
Emot
Verdict - En ny balans mellan spel och hybridarbete
Alienware m16 R2 skapades med ett tydligt mål i åtanke: att vara mindre än Alienware m16 R1 även om det innebär att kompromissa med prestandan. Modellen är definitivt mycket mer portabel än tidigare, men användarna går miste om GeForce RTX 4080/4090-grafik, Core HX-processorer och mekaniska tangenter i processen. Dell hoppas att den smalare m16 R2 kan locka en större publik av hybridarbetare, studenter och vanliga spelare som kanske har hoppat över de mer "hardcore" och mindre resevänliga m16 R1 eller x16 R1 genom att ta bort dessa funktioner till förmån för en mindre design x16 R1.
Slutresultatet är ett system som balanserar alla fronter extremt bra, från prestanda till batteritid och bärbarhet, medan m16 R1 fokuserade nästan helt på prestanda på bekostnad av vikt och körtider. Även fläktarnas ljudnivåer och beteende har förbättrats för att vara mer lämpliga i klassrums- eller kontorsmiljöer där extra hästkrafter inte behövs. Det här är definitivt den mest välavrundade bärbara Alienware-dator vi har testat tack vare alla hårdvaru- och programvaruändringar.
Om du är nöjd med GeForce RTX 4060- eller 4070-grafik, är Alienware m16 R2 lätt det bästa jack-of-all-trades-alternativet du kan välja i serien. Om du behöver mer kraft och vill bevara bärbarheten är den dyrare Blade 16 fortfarande rätt väg att gå.
Även om m16 R2 är imponerande och ofta överraskande, möter den fortfarande hård konkurrens i 16-tumskategorin. Razer Razer Blade 16är till exempel fortfarande lättare, mindre och snabbare än m16 R2 och har djupare DCI-P3-färger. Den Asus ROG Zephyrus G16 är på samma sätt lättare och har fler skärmalternativ, men GPU-prestandan är något sämre. I detta scenario har Dell prissatt Alienware m16 R2 så att den är billigare än både Razer- och Asus-systemen.
Pris och tillgänglighet
Dell levererar nu Alienware m16 R2 från $1650 för RTX 4060 eller upp till $1850+ för RTX 4070-konfigurationen. Instegskonfigurationen RTX 4050 är också tillgänglig för $1500.
Alienware m16 R2
- 02/24/2024 v7 (old)
Allen Ngo
Genomskinlighet
Valet av enheter som ska granskas görs av vår redaktion. Testprovet gavs till författaren som ett lån av tillverkaren eller återförsäljaren för denna recension. Långivaren hade inget inflytande på denna recension och inte heller fick tillverkaren en kopia av denna recension innan publiceringen. Det fanns ingen skyldighet att publicera denna recension. Som ett oberoende medieföretag är Notebookcheck inte föremål för auktoritet från tillverkare, återförsäljare eller förlag.
This is how Notebookcheck is testingEvery year, Notebookcheck independently reviews hundreds of laptops and smartphones using standardized procedures to ensure that all results are comparable. We have continuously developed our test methods for around 20 years and set industry standards in the process. In our test labs, high-quality measuring equipment is utilized by experienced technicians and editors. These tests involve a multi-stage validation process. Our complex rating system is based on hundreds of well-founded measurements and benchmarks, which maintains objectivity.
Price comparison

