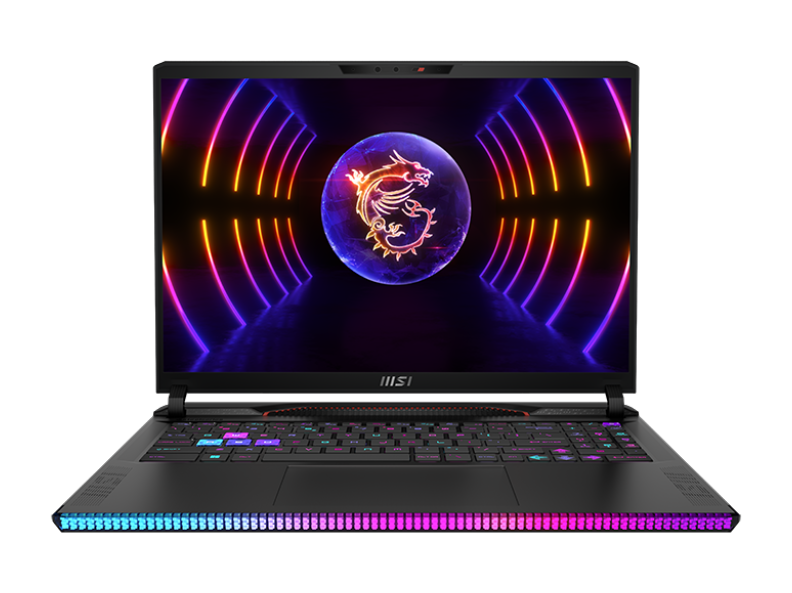
MSI Raider GE68 HX 13VF recension av bärbar dator: En komplett designförändring

GE68HX efterträder direkt förra årets GE67HX med både uppfräschade interndelar och en ny chassidesign. Förutom de förväntade 13:e generationens Raptor Lake-HX-processorer och Nvidia Ada Lovelace GPU:er som ersätter de äldre 12:e generationens Alder Lake-HX och Ampere-alternativ, erbjuder den nyare modellen också en större 16:10 16-tums skärmstorlek upp från det minskande 16:9 15,6-tums bildförhållandet.
Vår enhet är baskonfigurationen med Core i7-13950HX, 140 W GeForce RTX 4060 och 1080p 144 Hz IPS-skärm som säljs för ca $1700 USD eller $1300 om den är på rea. De mer avancerade SKU:erna inkluderar Core i9-13980HX, RTX 4090 och 1440p 240 Hz-skärm för över $3500.
Konkurrenter till GE68HX inkluderar andra avancerade 16-tums bärbara speldatorer som HP Omen 16,Alienware m16 R1, Lenovo Legion Slim 7i 16 Gen 8eller Asus ROG Zephyrus M16.
Fler MSI recensioner:
Potentiella konkurrenter i jämförelse
Gradering | Datum | Modell | Vikt | Höjd | Storlek | Upplösning | Pris |
|---|---|---|---|---|---|---|---|
| 86.9 % v7 (old) | 10/2023 | MSI Raider GE68HX 13VF i9-13950HX, GeForce RTX 4060 Laptop GPU | 2.7 kg | 27.9 mm | 16.00" | 1900x1200 | |
| 87.7 % v7 (old) | 07/2022 | MSI GE67 HX 12UGS i7-12800HX, GeForce RTX 3070 Ti Laptop GPU | 2.5 kg | 23.4 mm | 15.60" | 1920x1080 | |
| 86.6 % v7 (old) | 09/2023 | HP Omen 16-xf0376ng R7 7840HS, GeForce RTX 4070 Laptop GPU | 2.4 kg | 23.5 mm | 16.10" | 1920x1080 | |
| 89.2 % v7 (old) | 08/2023 | Alienware m16 R1 AMD R9 7845HX, GeForce RTX 4080 Laptop GPU | 3.1 kg | 25.4 mm | 16.00" | 2560x1600 | |
| 90 % v7 (old) | 07/2023 | Lenovo Legion Slim 7i 16 Gen 8 i9-13900H, GeForce RTX 4070 Laptop GPU | 2.1 kg | 19.9 mm | 16.00" | 2560x1600 | |
| 89.4 % v7 (old) | 03/2023 | Asus ROG Zephyrus M16 GU604VY-NM042X i9-13900H, GeForce RTX 4090 Laptop GPU | 2.3 kg | 22.9 mm | 16.00" | 2560x1600 |
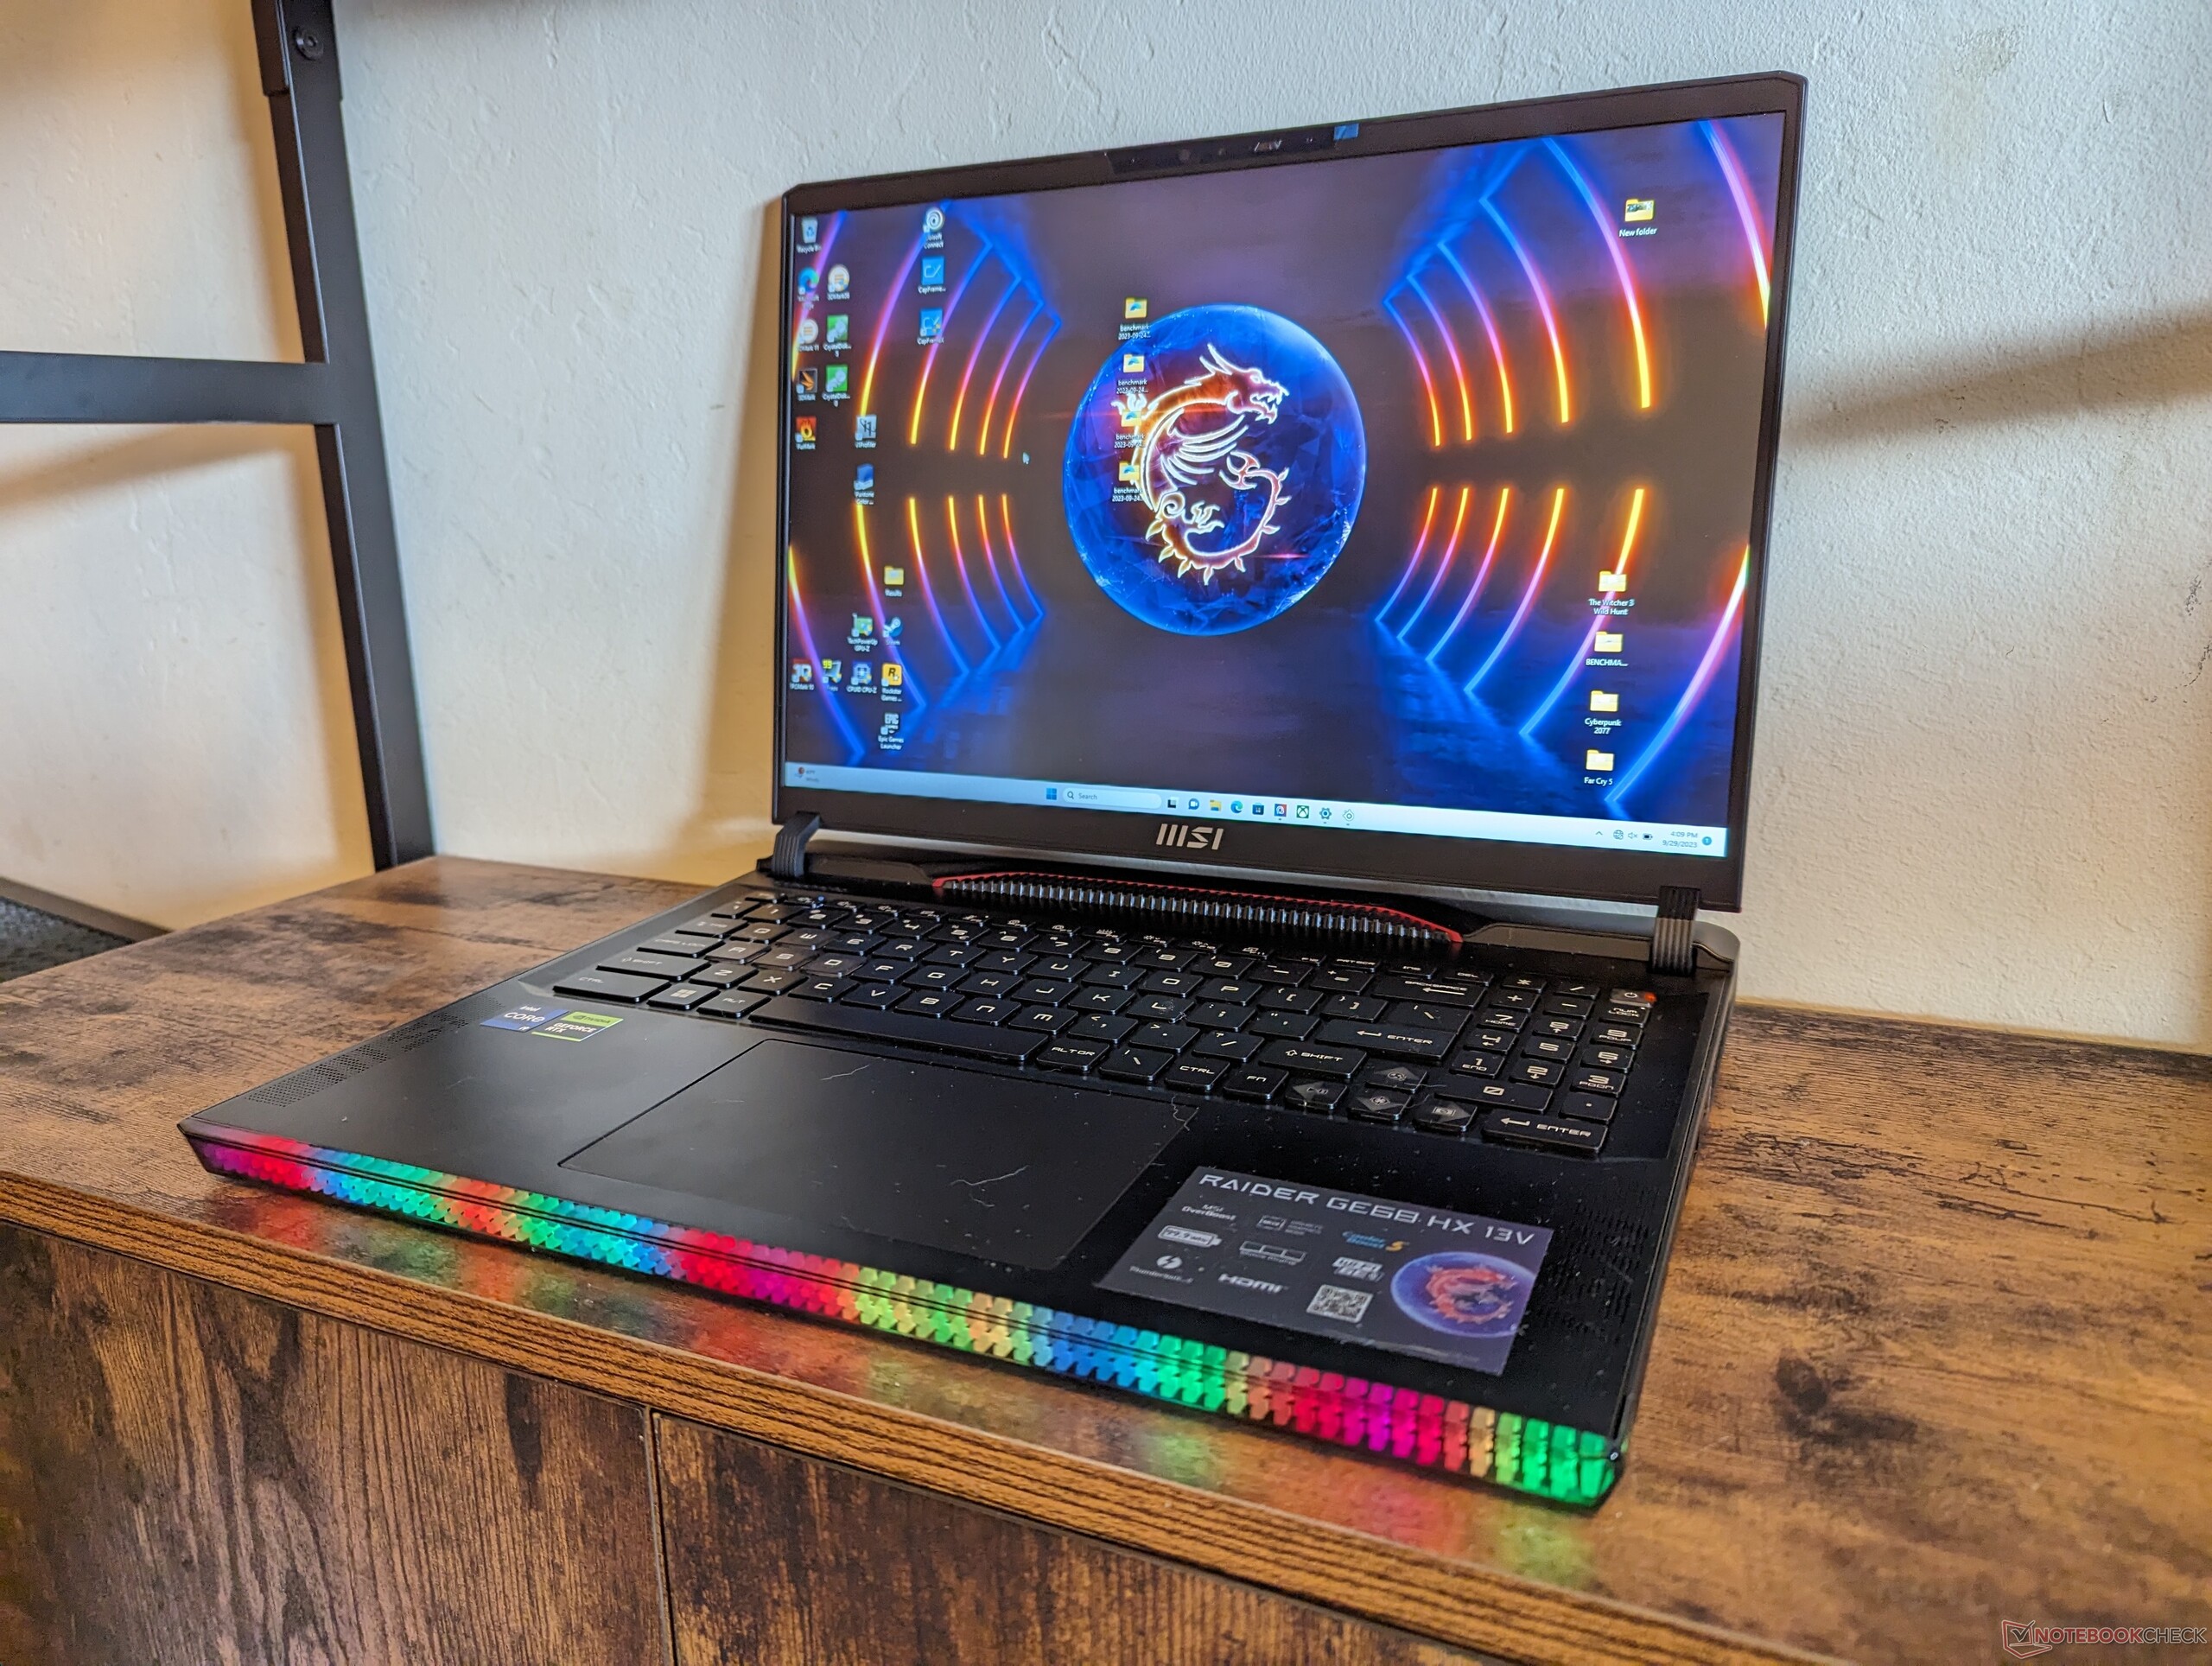
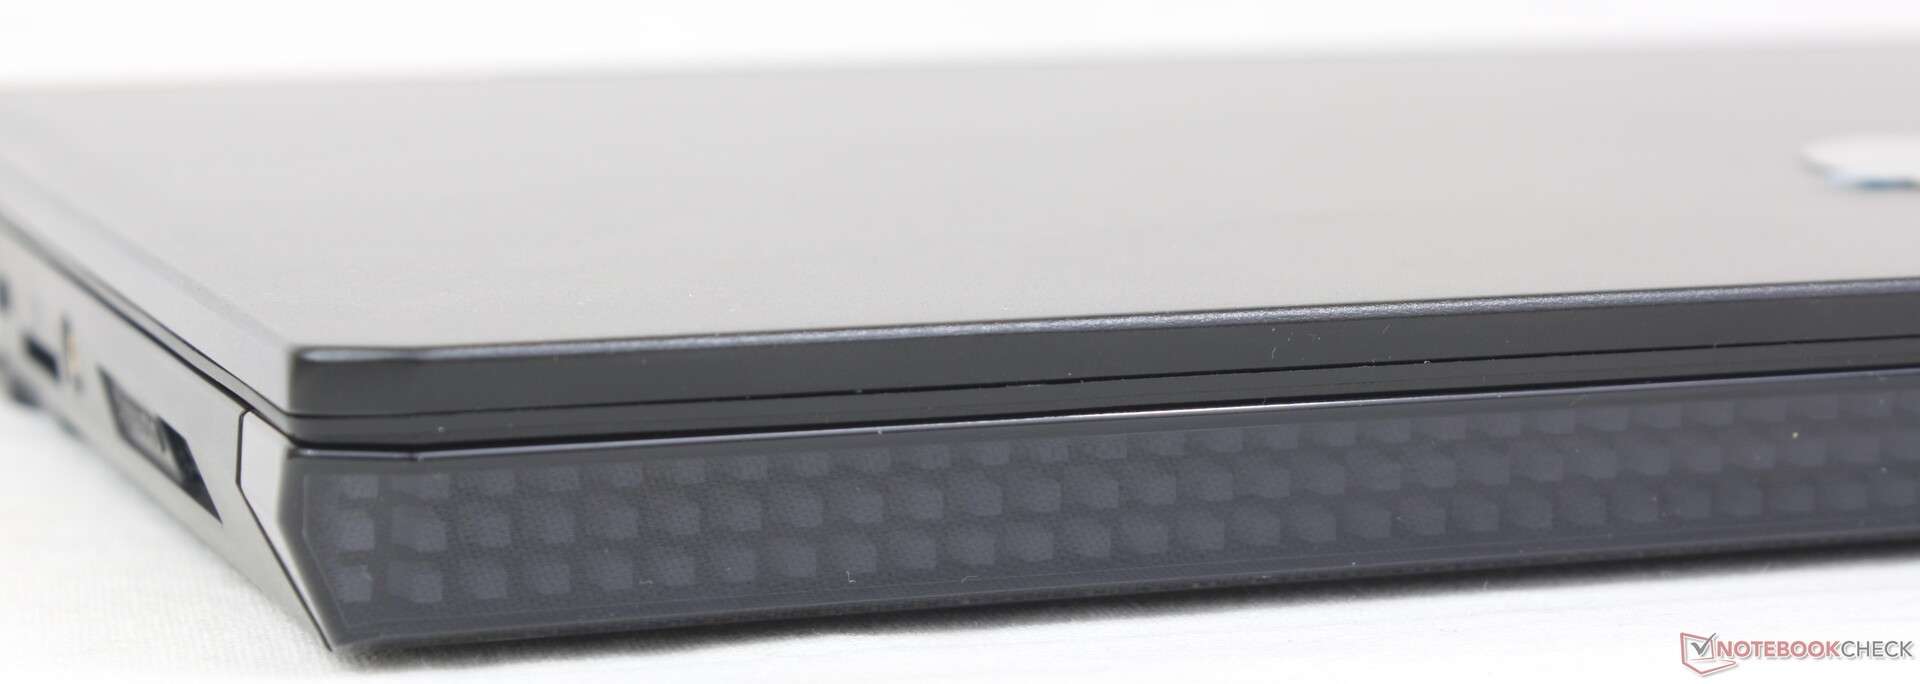
Case - Större än någonsin tidigare
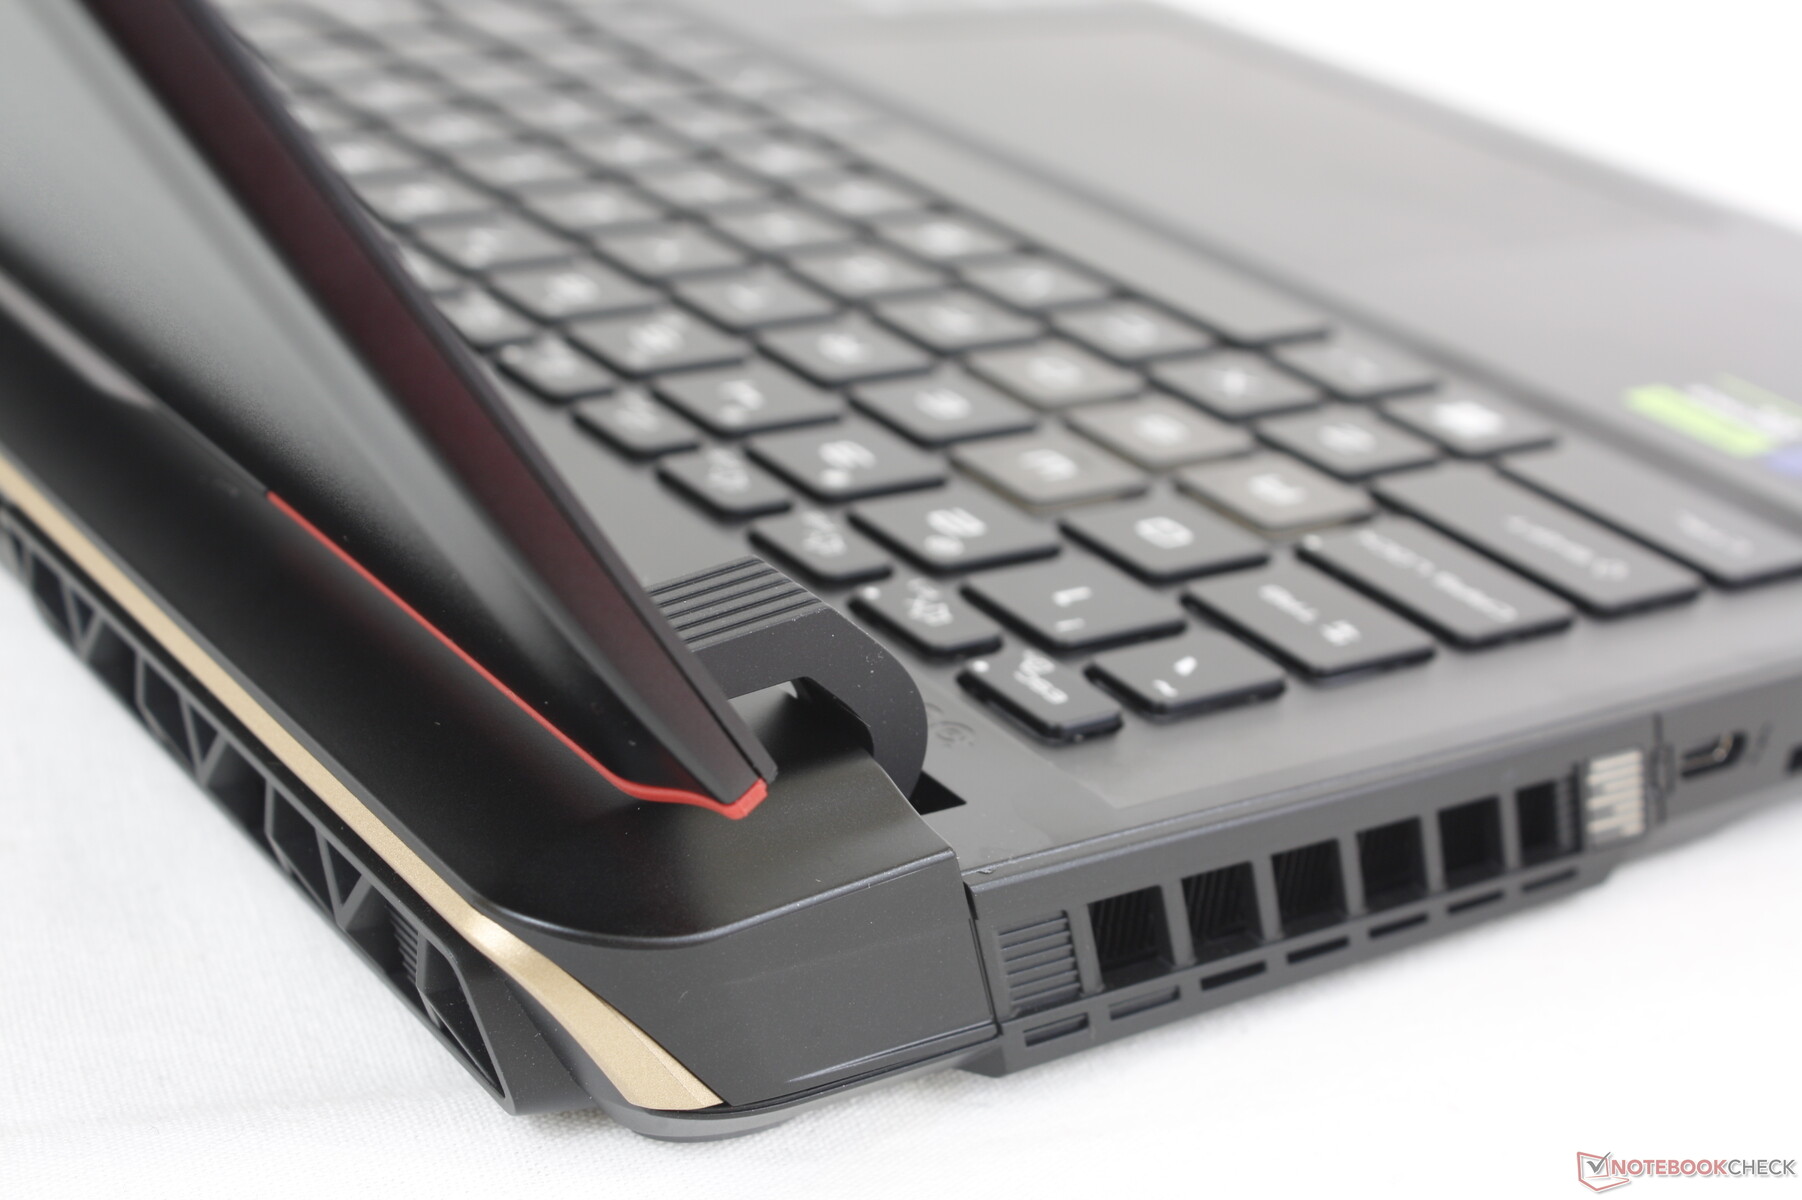
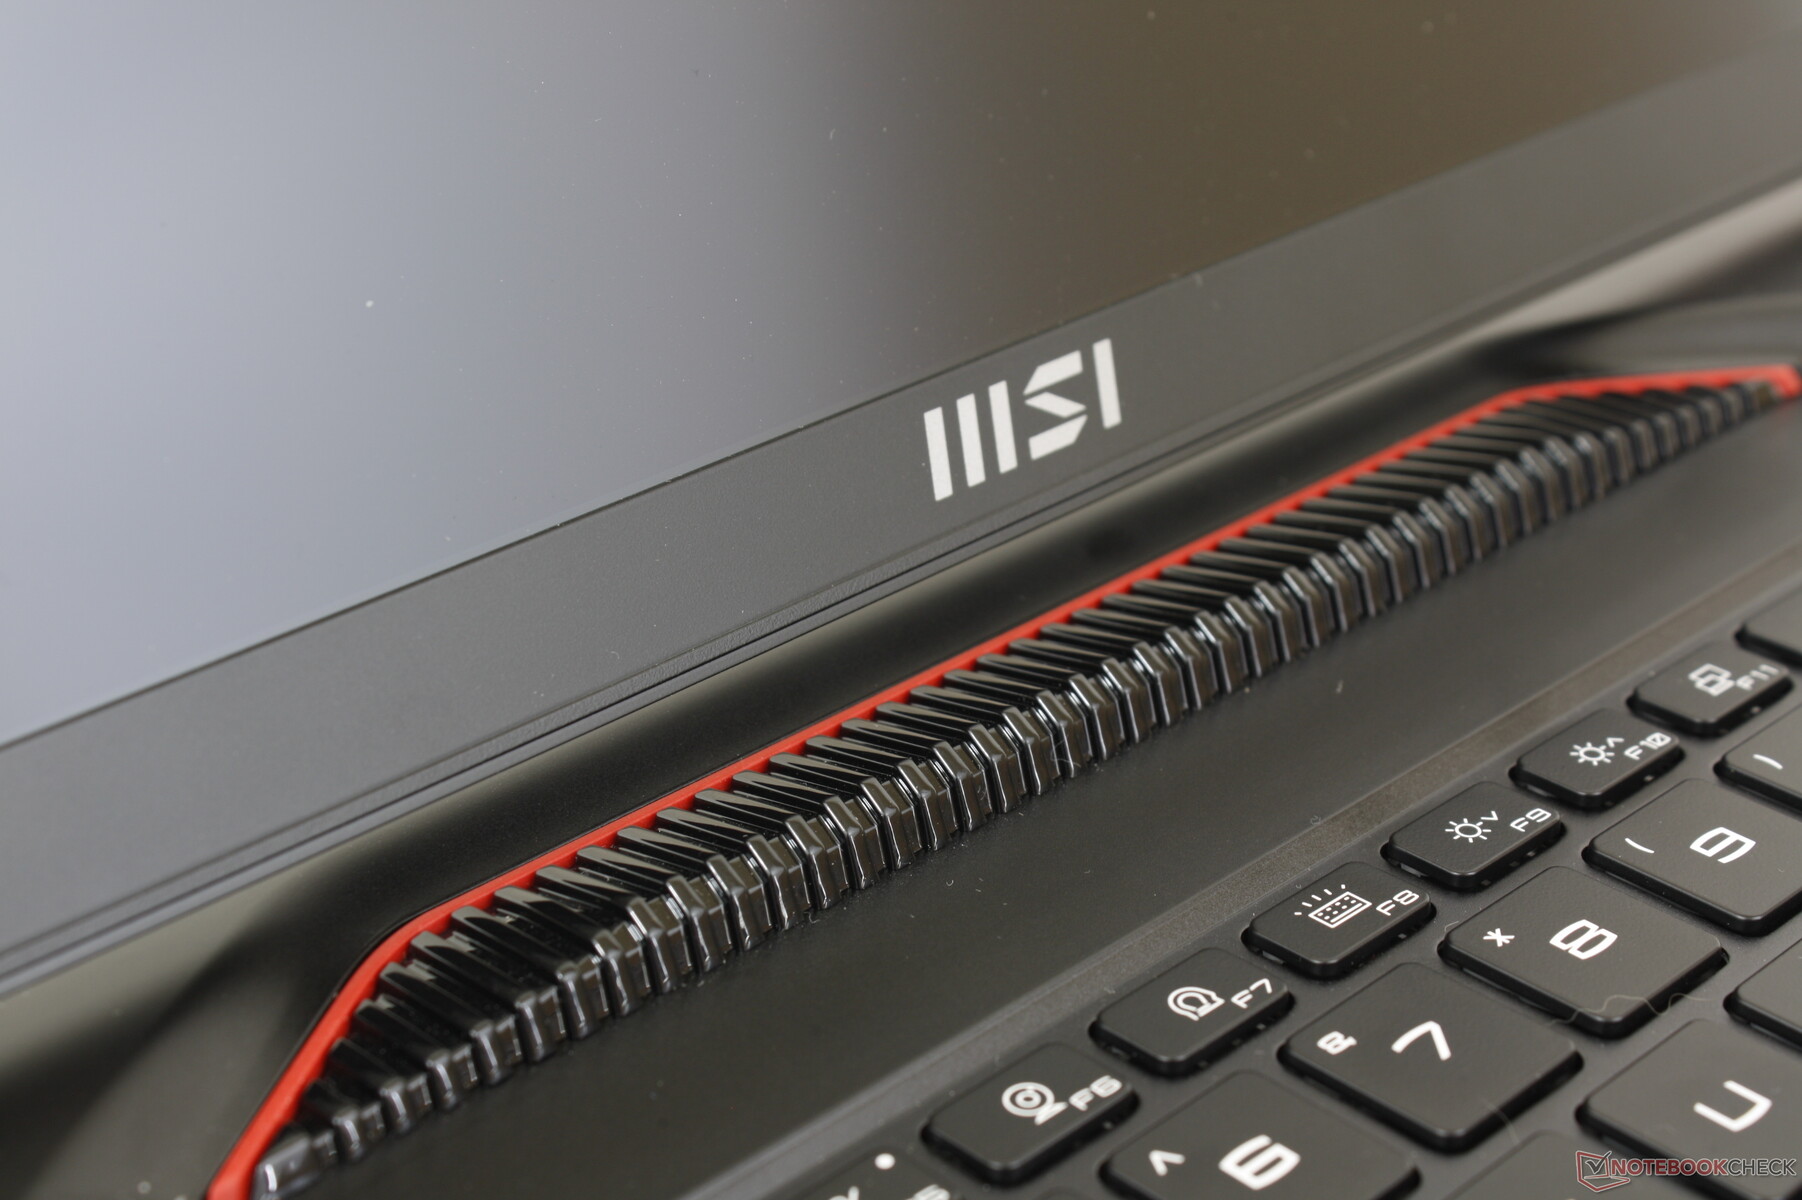
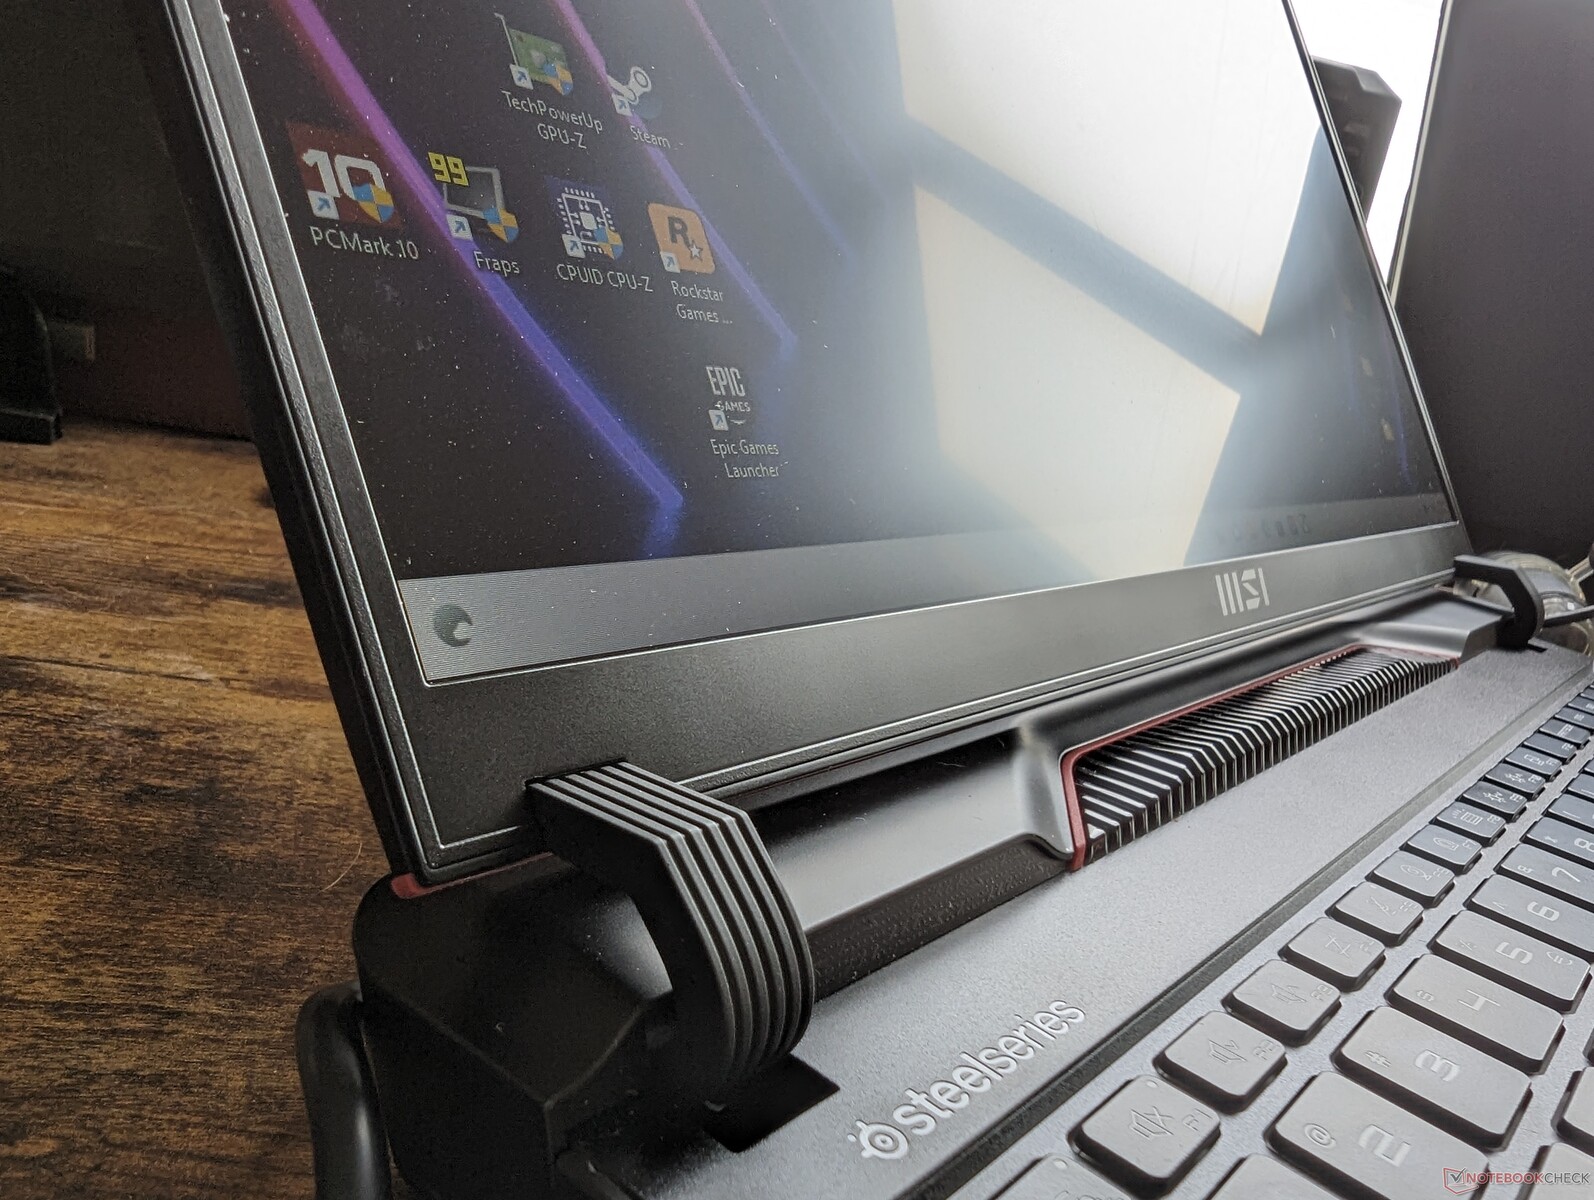
Chassit kan bäst beskrivas som en mindre version av 17-tums Raider GE78HX. LED-pixelbarren framtill ersätter den kontinuerliga belysningen på förra årets modell medan baksidan nu är mer stiliserad med guld, rött och glansiga trimmer. Ett av MSI:s mål för i år var att skapa mer visuellt intressanta bärbara datorer istället för den allt vanligare kolsvarta och minimalistiska estetiken. Tillverkaren har lyckats i detta avseende eftersom GE68HX-designen verkligen är omisskännlig och skiljer sig mycket från andra bärbara speldatorer från konkurrenterna.
Chassiets styvhet är utmärkt trots alla kurvor och delar som utgör det icke-unibody skelettet. Att trycka på tangentbordets mittpunkt eller försöka vrida hörnen skulle resultera i väldigt lite böjning och inget hörbart knakande. Vi uppskattar särskilt de större och kraftigare gångjärnen jämfört med förra årets GE67HX för en bättre känsla av livslängd.
Den nya modellen är både större och tyngre än den utgående GE67HX med märkbara marginaler, vilket framgår av vår storlekstabell nedan. Faktum är att GE68HX är en av de större och tyngre 16-tums gaming-laptops som finns tillgängliga.
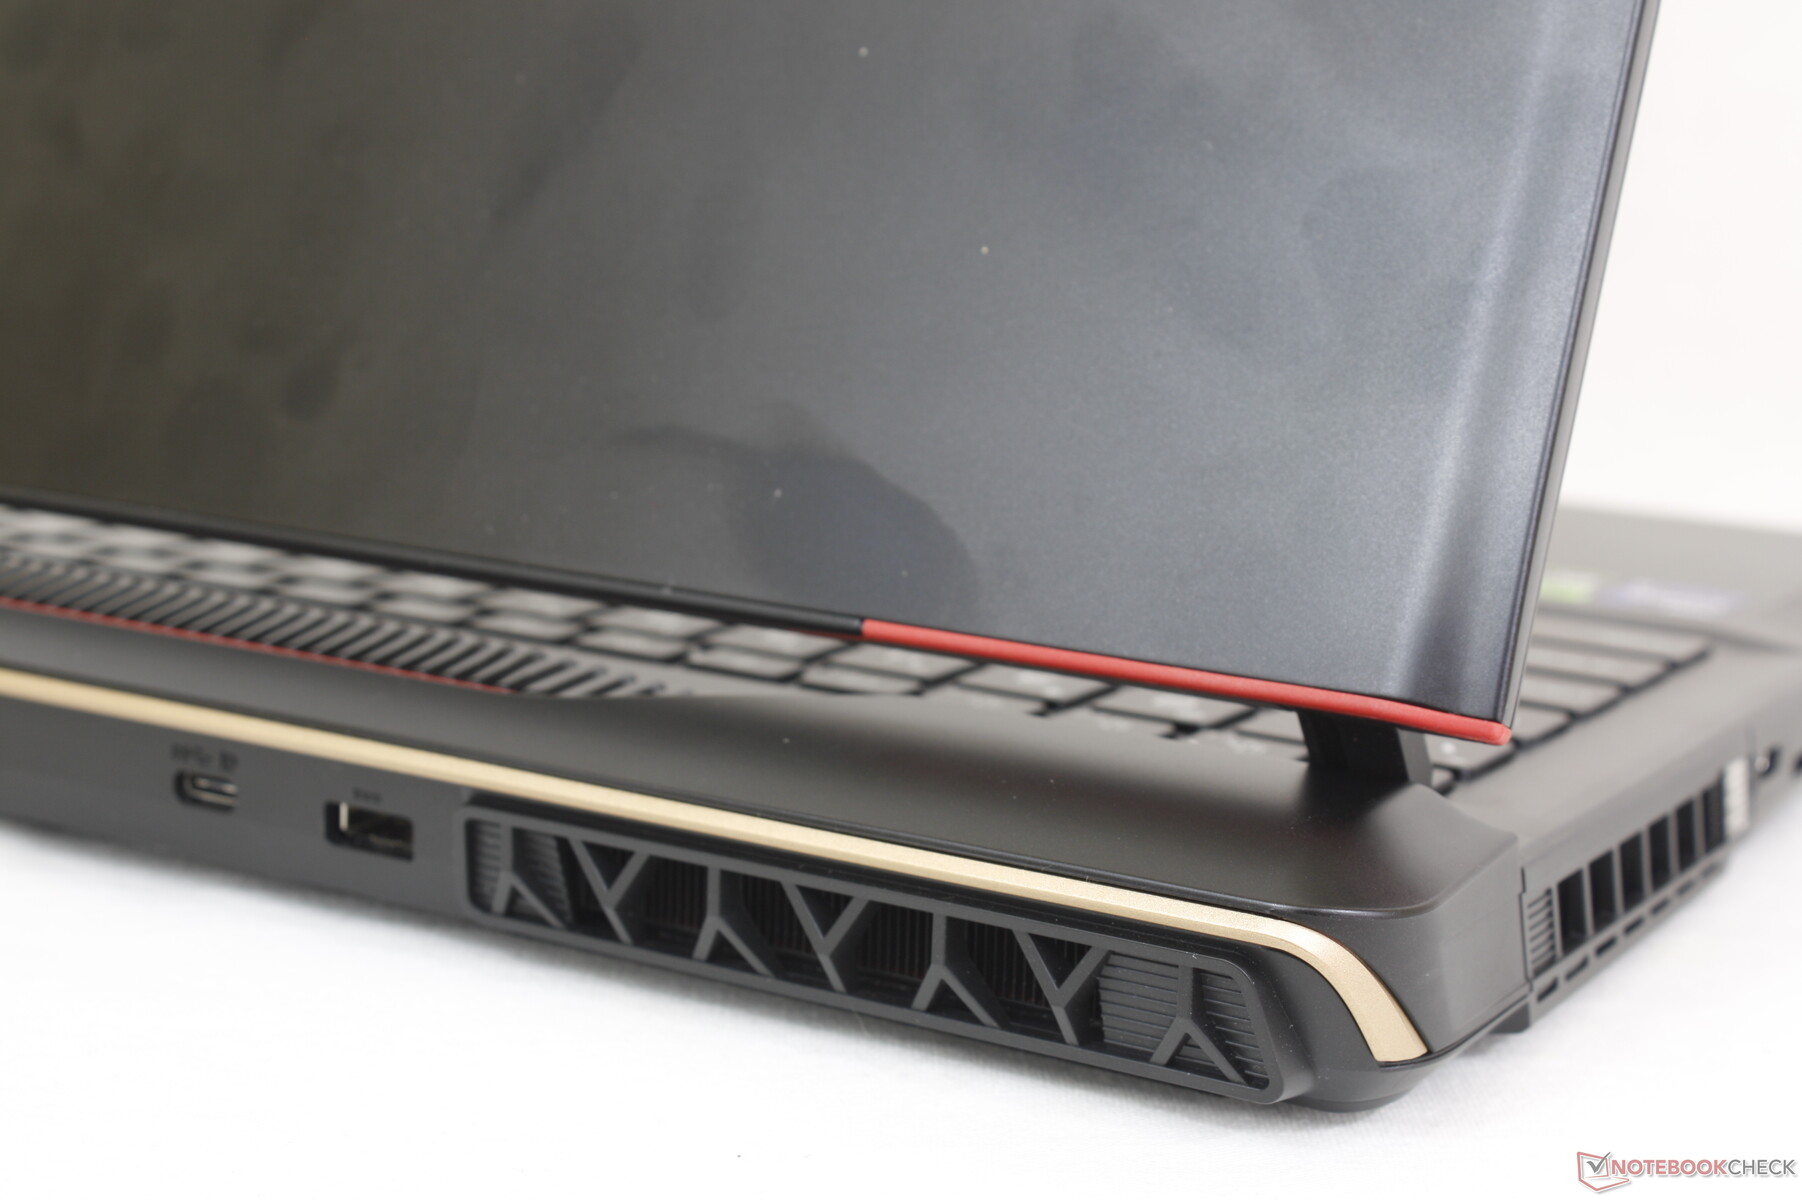
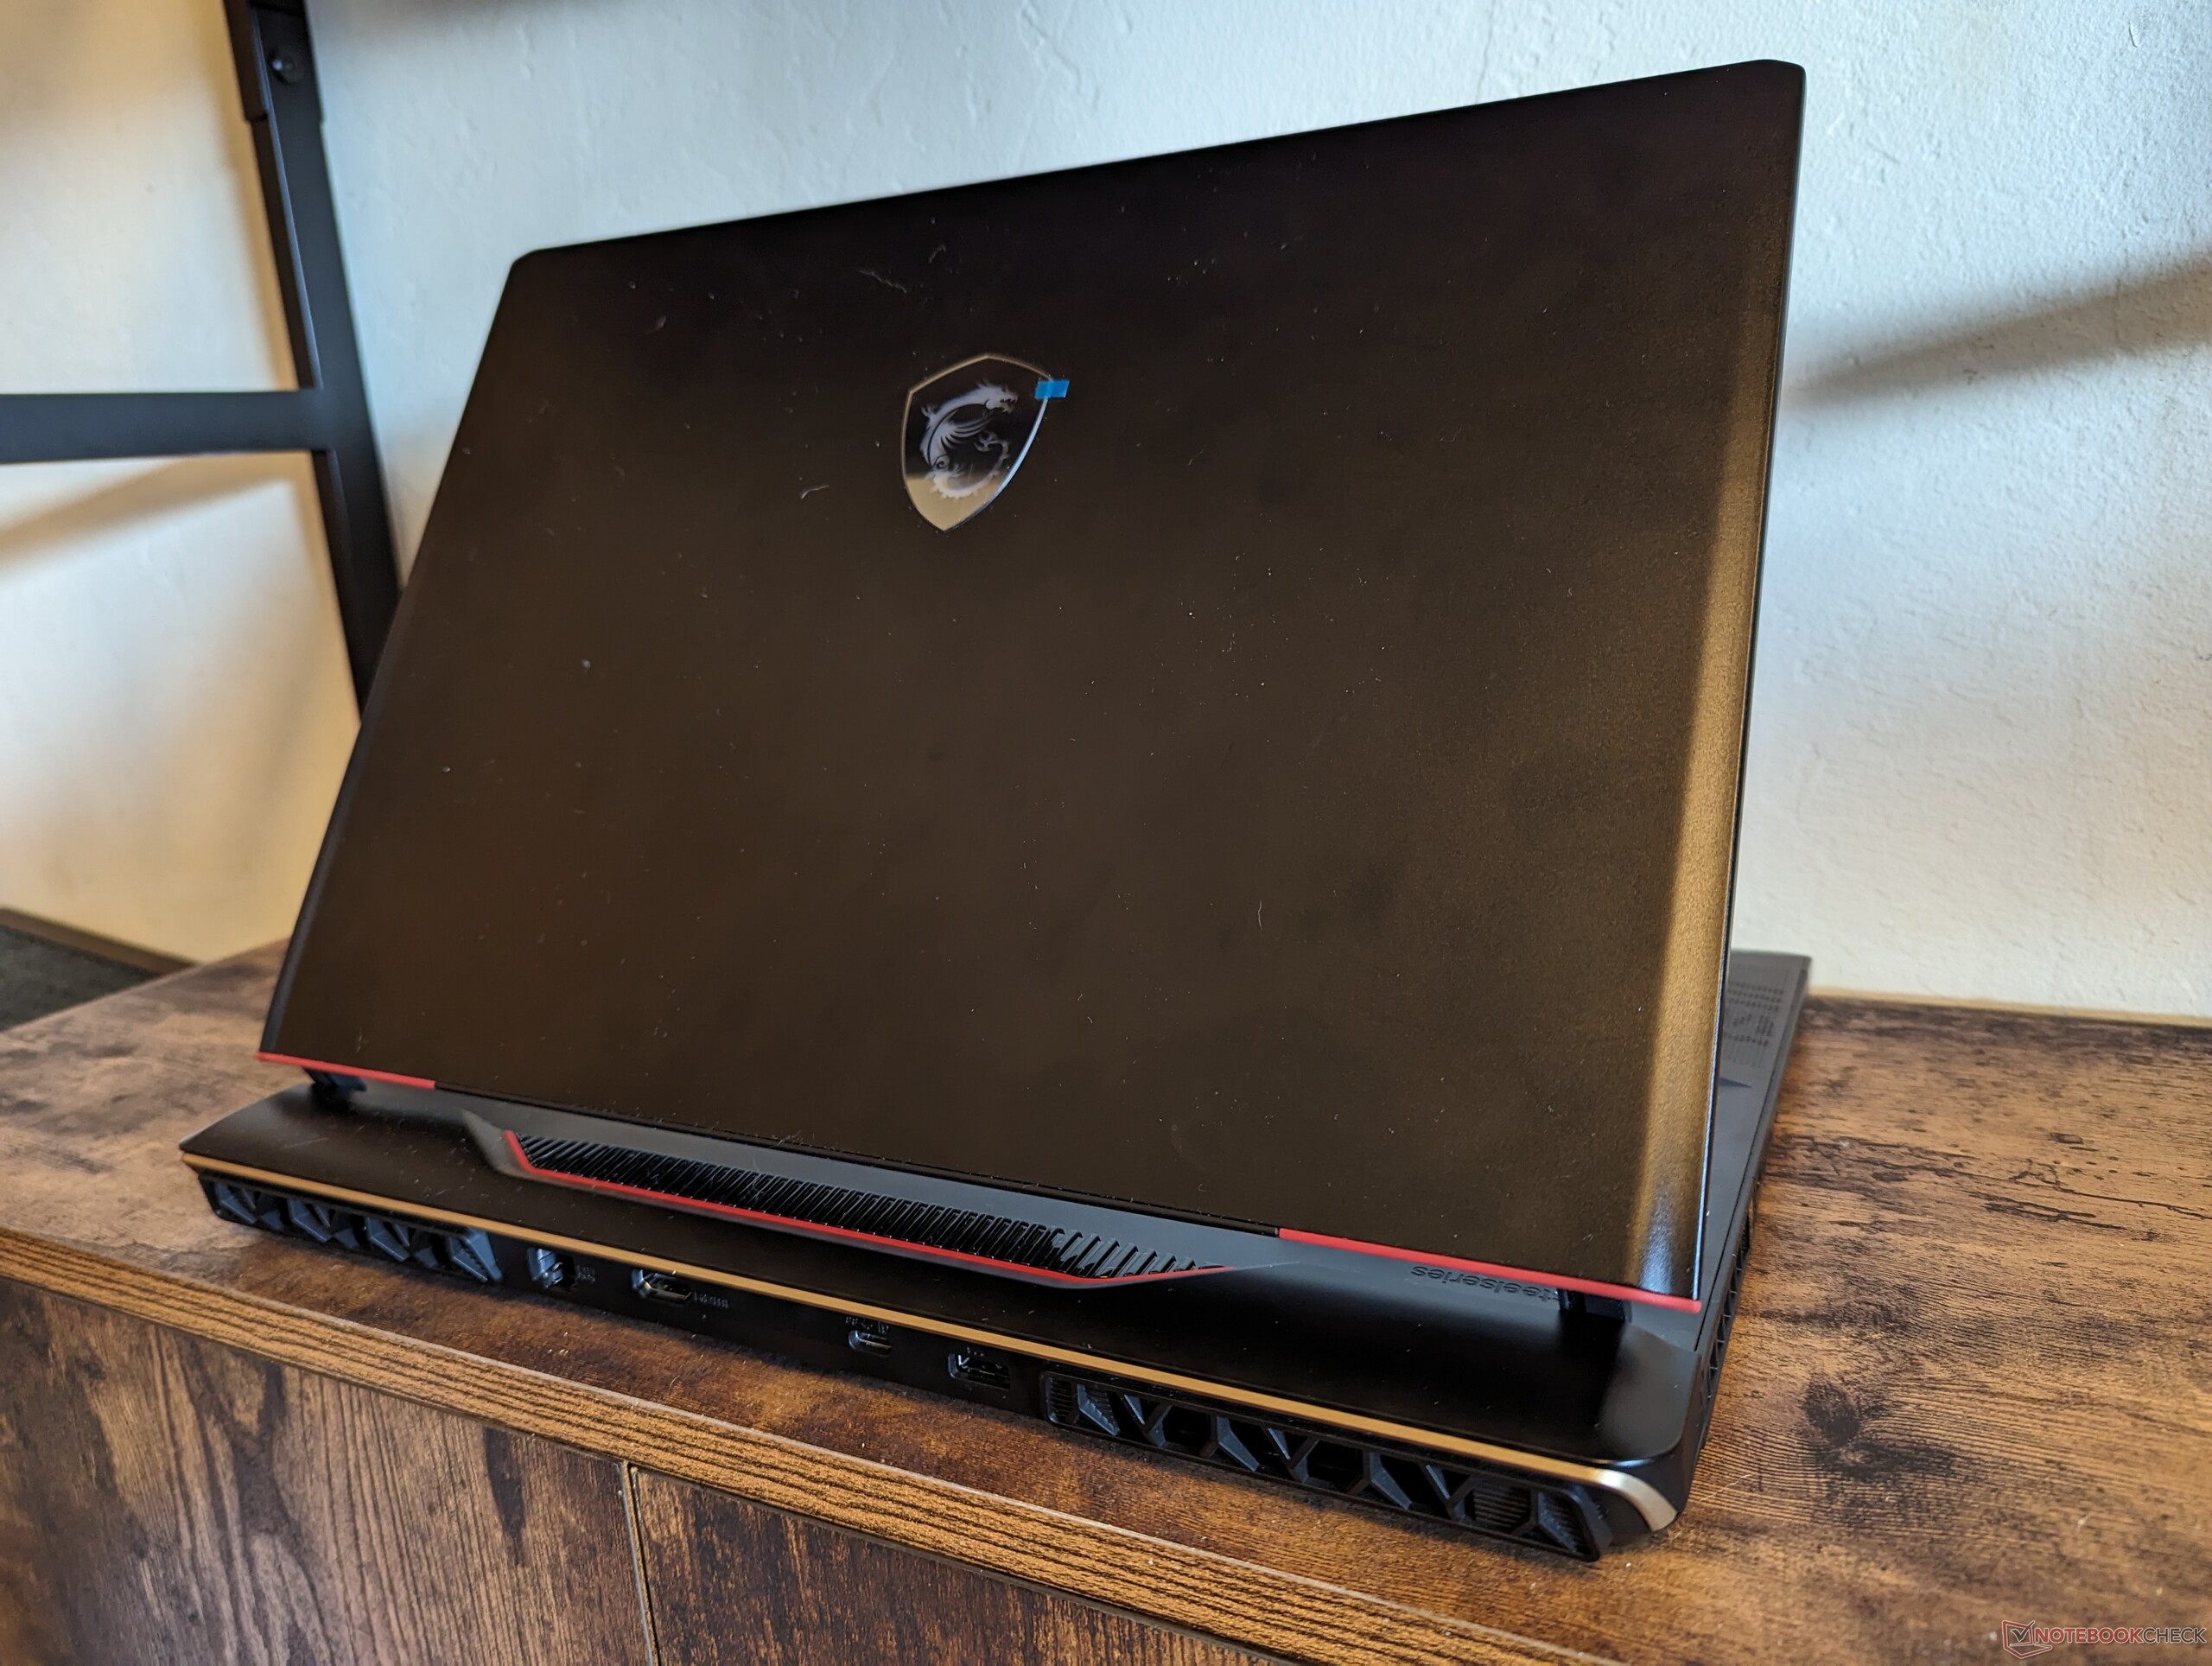
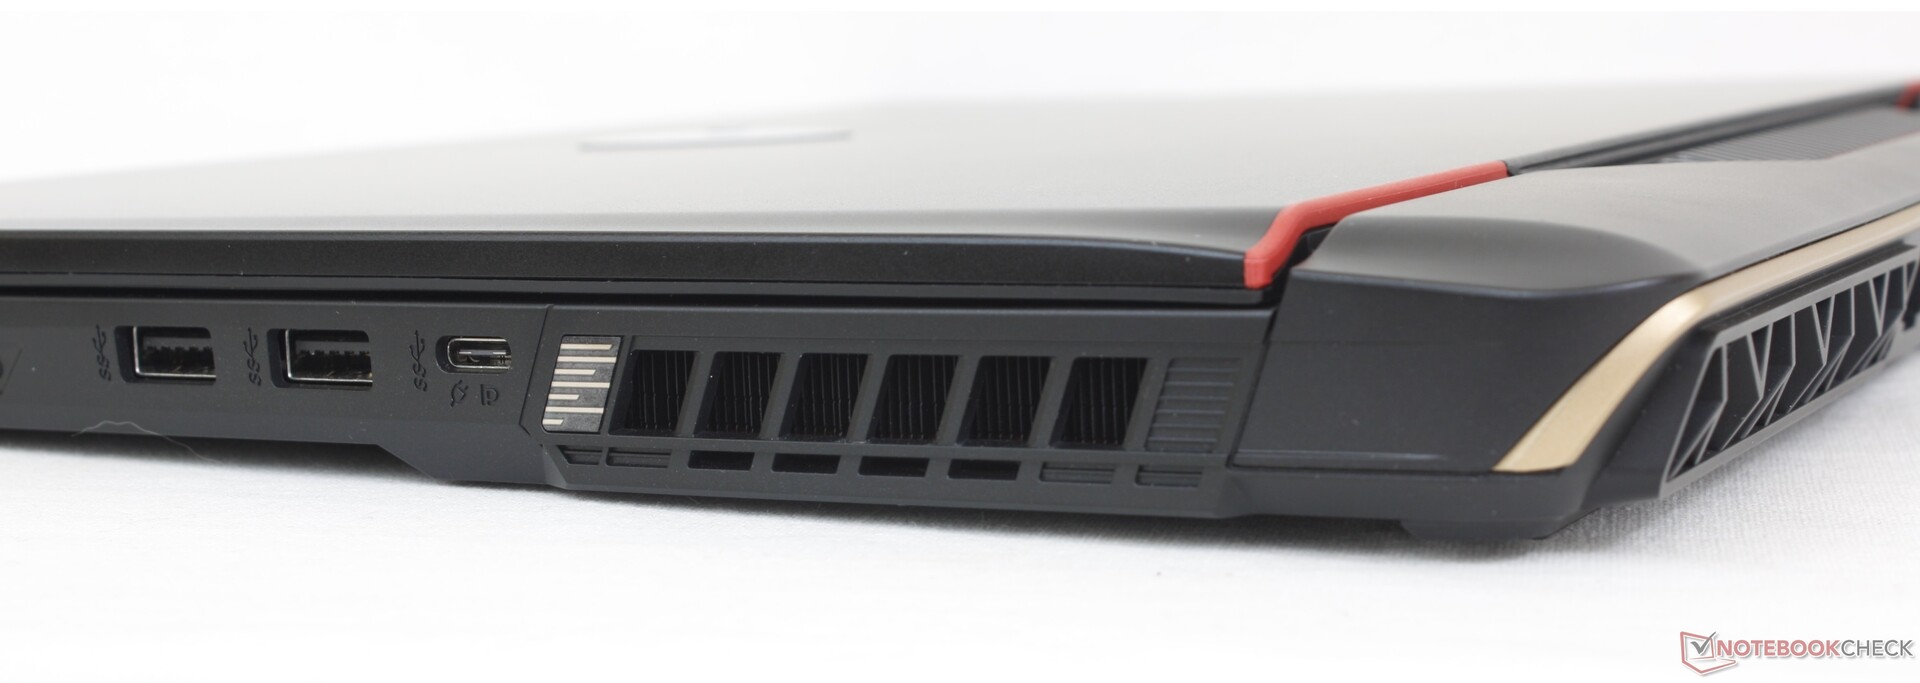
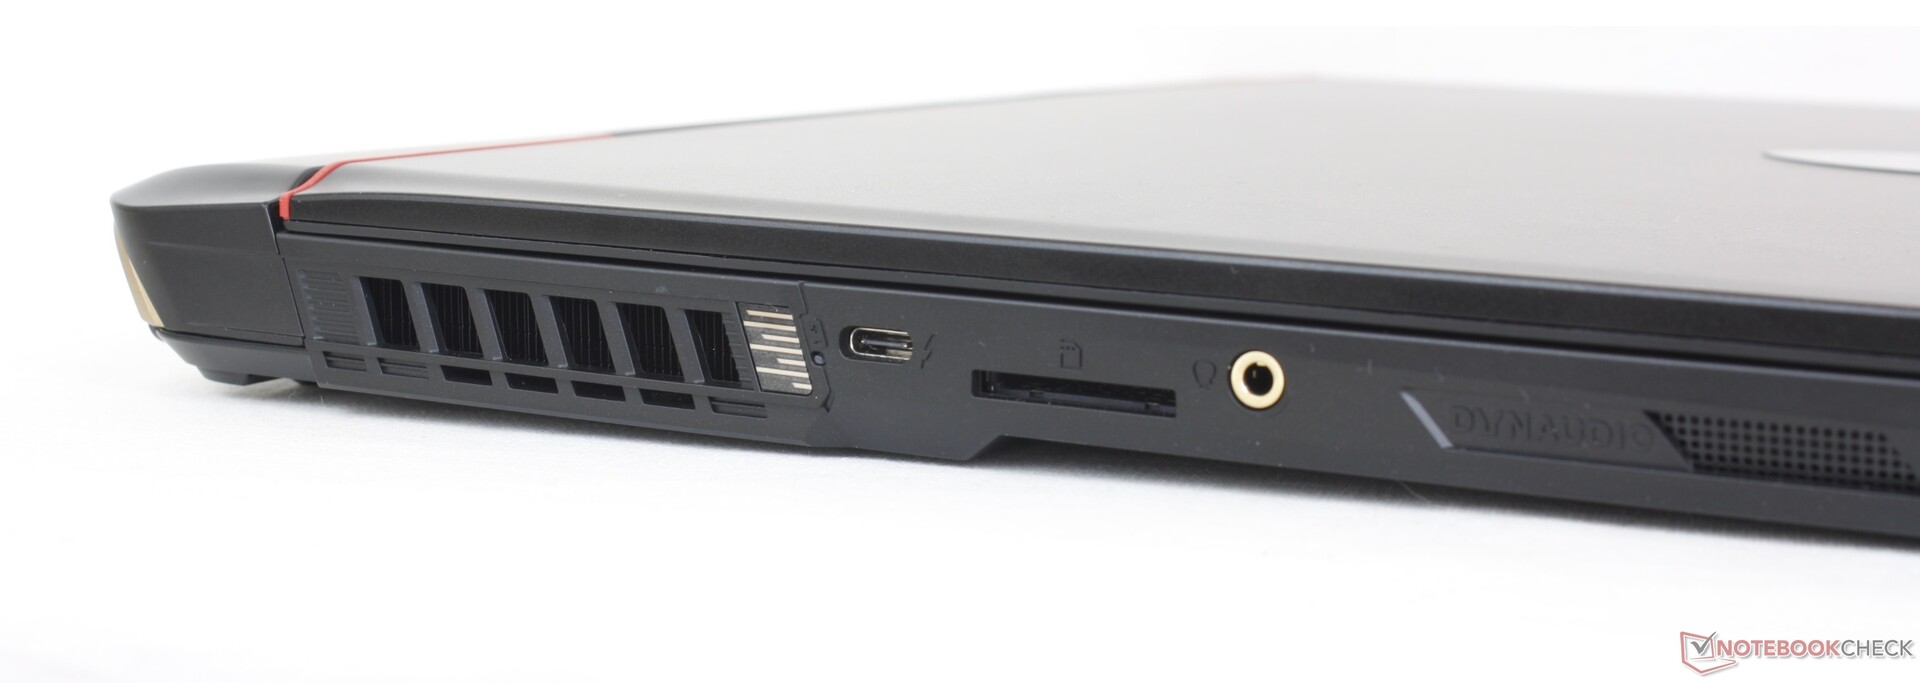
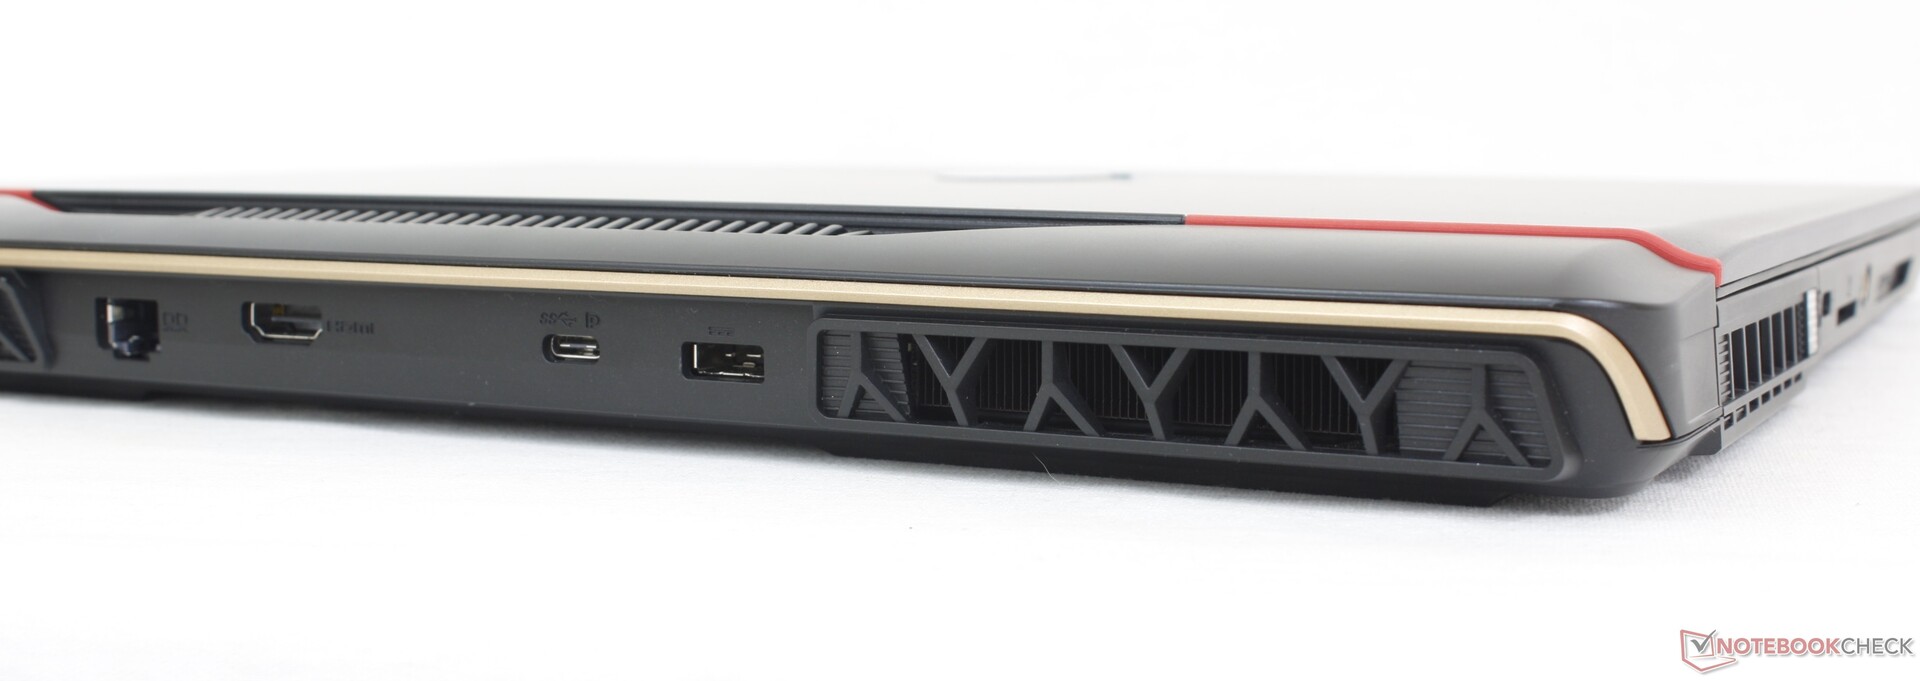
Anslutningsmöjligheter
Portalternativen har ändrats något från förra årets GE67HX. Medan GE67HX skulle ha 3x USB-A-portar och 2x USB-C-portar, levereras GE68HX med 2x USB-A-portar och 3x USB-C-portar. Alla tre USB-C-portarna stöder Displayport, men endast den längs den vänstra kanten är kompatibel med Thunderbolt 4.
Konstigt nog har MSI valt att skippa Kensington-låset på årets design. Det finns ingen mini-DisplayPort heller till skillnad från påAlienware m16 R1.
SD-kortläsare
Den integrerade SD-kortläsaren är lite långsam för vad som är tänkt att vara en spelmodell i övre mellanklassen. Att överföra 1 GB bilder från vårt UHS-II-testkort till skrivbordet skulle ta lite över 12 sekunder medan samma test på Alienware m16 R1 skulle vara över 2x snabbare.
| SD Card Reader | |
| average JPG Copy Test (av. of 3 runs) | |
| Alienware m16 R1 AMD (Toshiba Exceria Pro SDXC 64 GB UHS-II) | |
| Asus ROG Zephyrus M16 GU604VY-NM042X | |
| Lenovo Legion Slim 7i 16 Gen 8 (Toshiba Exceria Pro SDXC 64 GB UHS-II) | |
| MSI GE67 HX 12UGS (Toshiba Exceria Pro SDXC 64 GB UHS-II) | |
| MSI Raider GE68HX 13VF (Toshiba Exceria Pro SDXC 64 GB UHS-II) | |
| maximum AS SSD Seq Read Test (1GB) | |
| Alienware m16 R1 AMD (Toshiba Exceria Pro SDXC 64 GB UHS-II) | |
| Asus ROG Zephyrus M16 GU604VY-NM042X | |
| Lenovo Legion Slim 7i 16 Gen 8 (Toshiba Exceria Pro SDXC 64 GB UHS-II) | |
| MSI Raider GE68HX 13VF (Toshiba Exceria Pro SDXC 64 GB UHS-II) | |
| MSI GE67 HX 12UGS (Toshiba Exceria Pro SDXC 64 GB UHS-II) | |
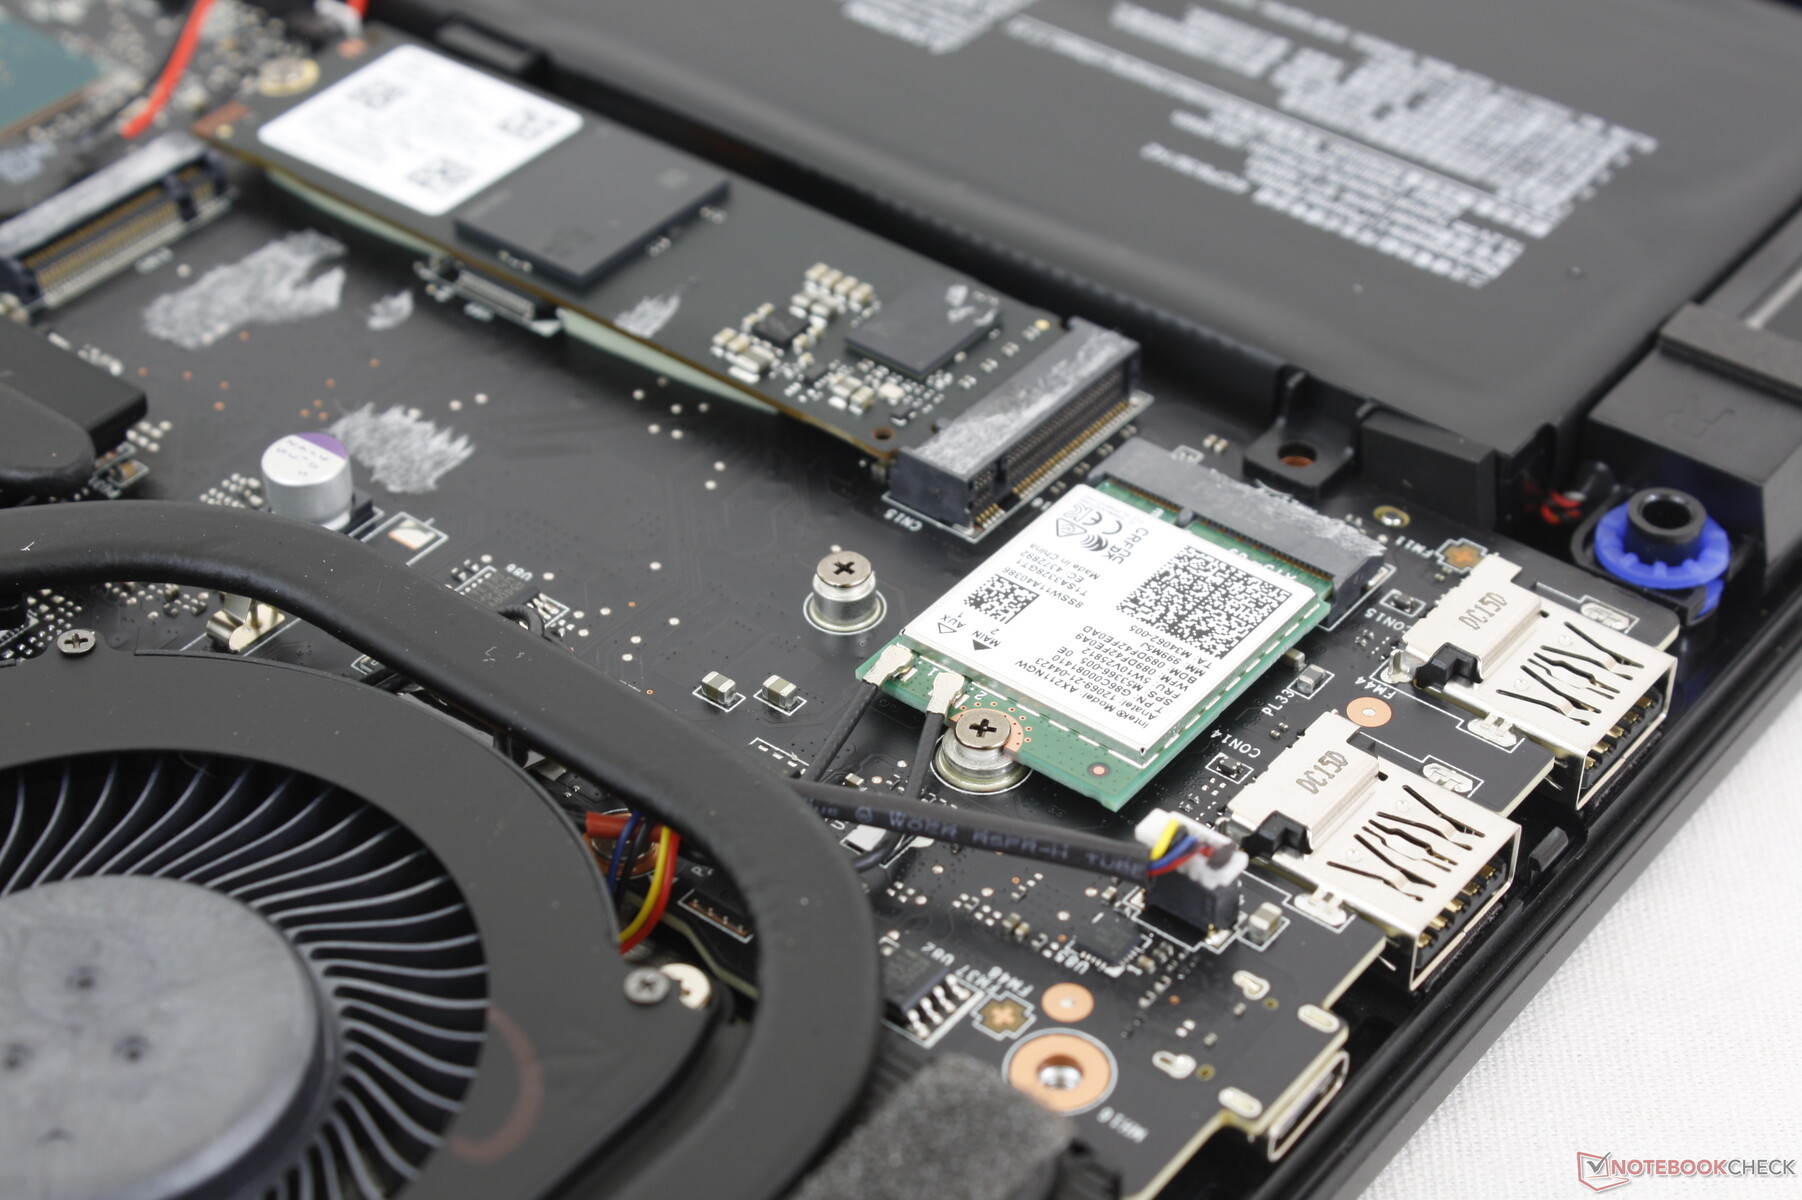
Kommunikation
En Intel AX211 är standard för stöd för Wi-Fi 6E och Bluetooth 5.3. Vi upplevde inga anslutningsproblem när vi parade ihop den med vårt AXE11000 6 GHz testnätverk.
| Networking | |
| iperf3 transmit AXE11000 | |
| Alienware m16 R1 AMD | |
| MSI Raider GE68HX 13VF | |
| HP Omen 16-xf0376ng | |
| Lenovo Legion Slim 7i 16 Gen 8 | |
| iperf3 receive AXE11000 | |
| HP Omen 16-xf0376ng | |
| Alienware m16 R1 AMD | |
| Lenovo Legion Slim 7i 16 Gen 8 | |
| MSI Raider GE68HX 13VF | |
| iperf3 transmit AXE11000 6GHz | |
| Alienware m16 R1 AMD | |
| Asus ROG Zephyrus M16 GU604VY-NM042X | |
| Lenovo Legion Slim 7i 16 Gen 8 | |
| MSI Raider GE68HX 13VF | |
| MSI GE67 HX 12UGS | |
| iperf3 receive AXE11000 6GHz | |
| Asus ROG Zephyrus M16 GU604VY-NM042X | |
| Alienware m16 R1 AMD | |
| Lenovo Legion Slim 7i 16 Gen 8 | |
| MSI Raider GE68HX 13VF | |
| MSI GE67 HX 12UGS | |
Webbkamera
Medan 2 MP-kvaliteten inte har förändrats finns det fortfarande ett par skillnader kring webbkameran. Slutaren, till exempel, är nu ett fysiskt reglage bredvid linsen istället för en elektronisk strömbrytare på tangentbordet. Och för det andra är en IR-sensor nu inbyggd för Hello-stöd.


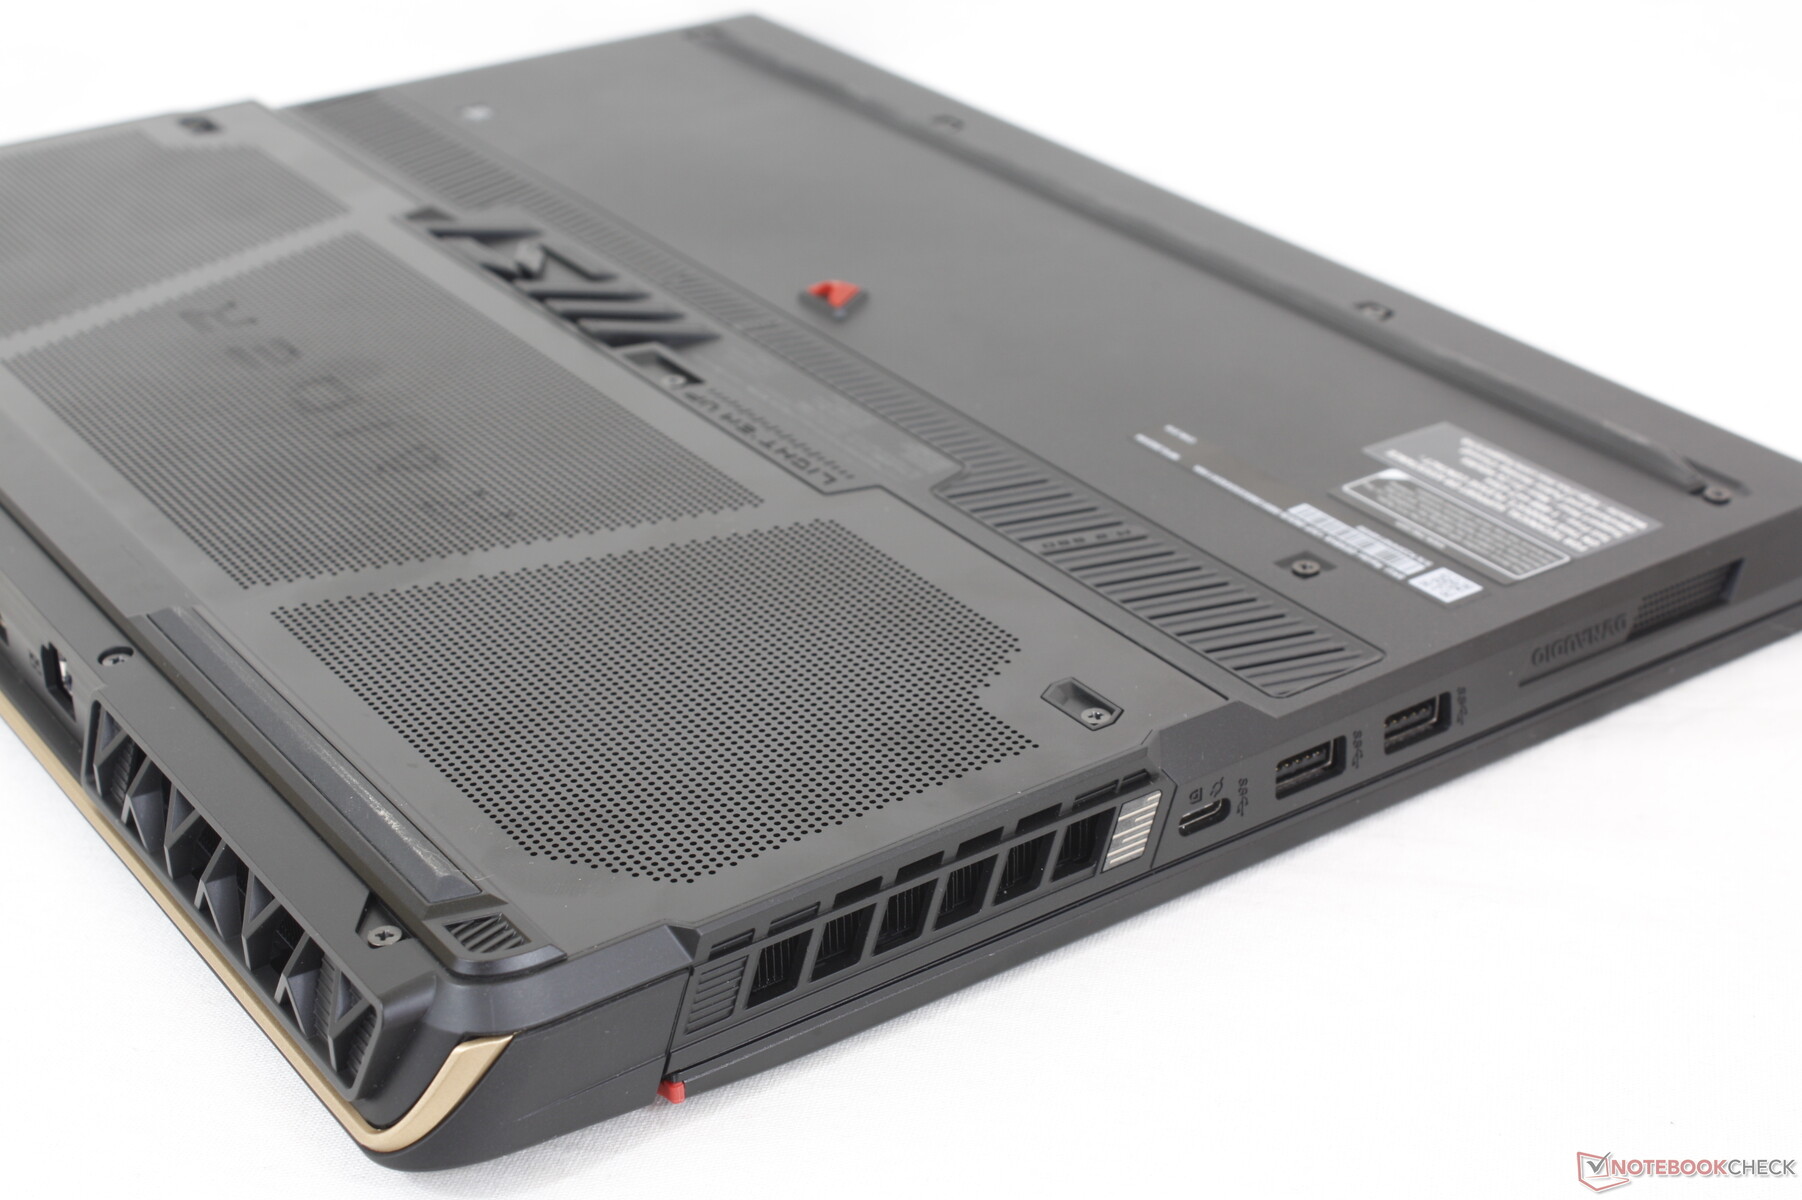
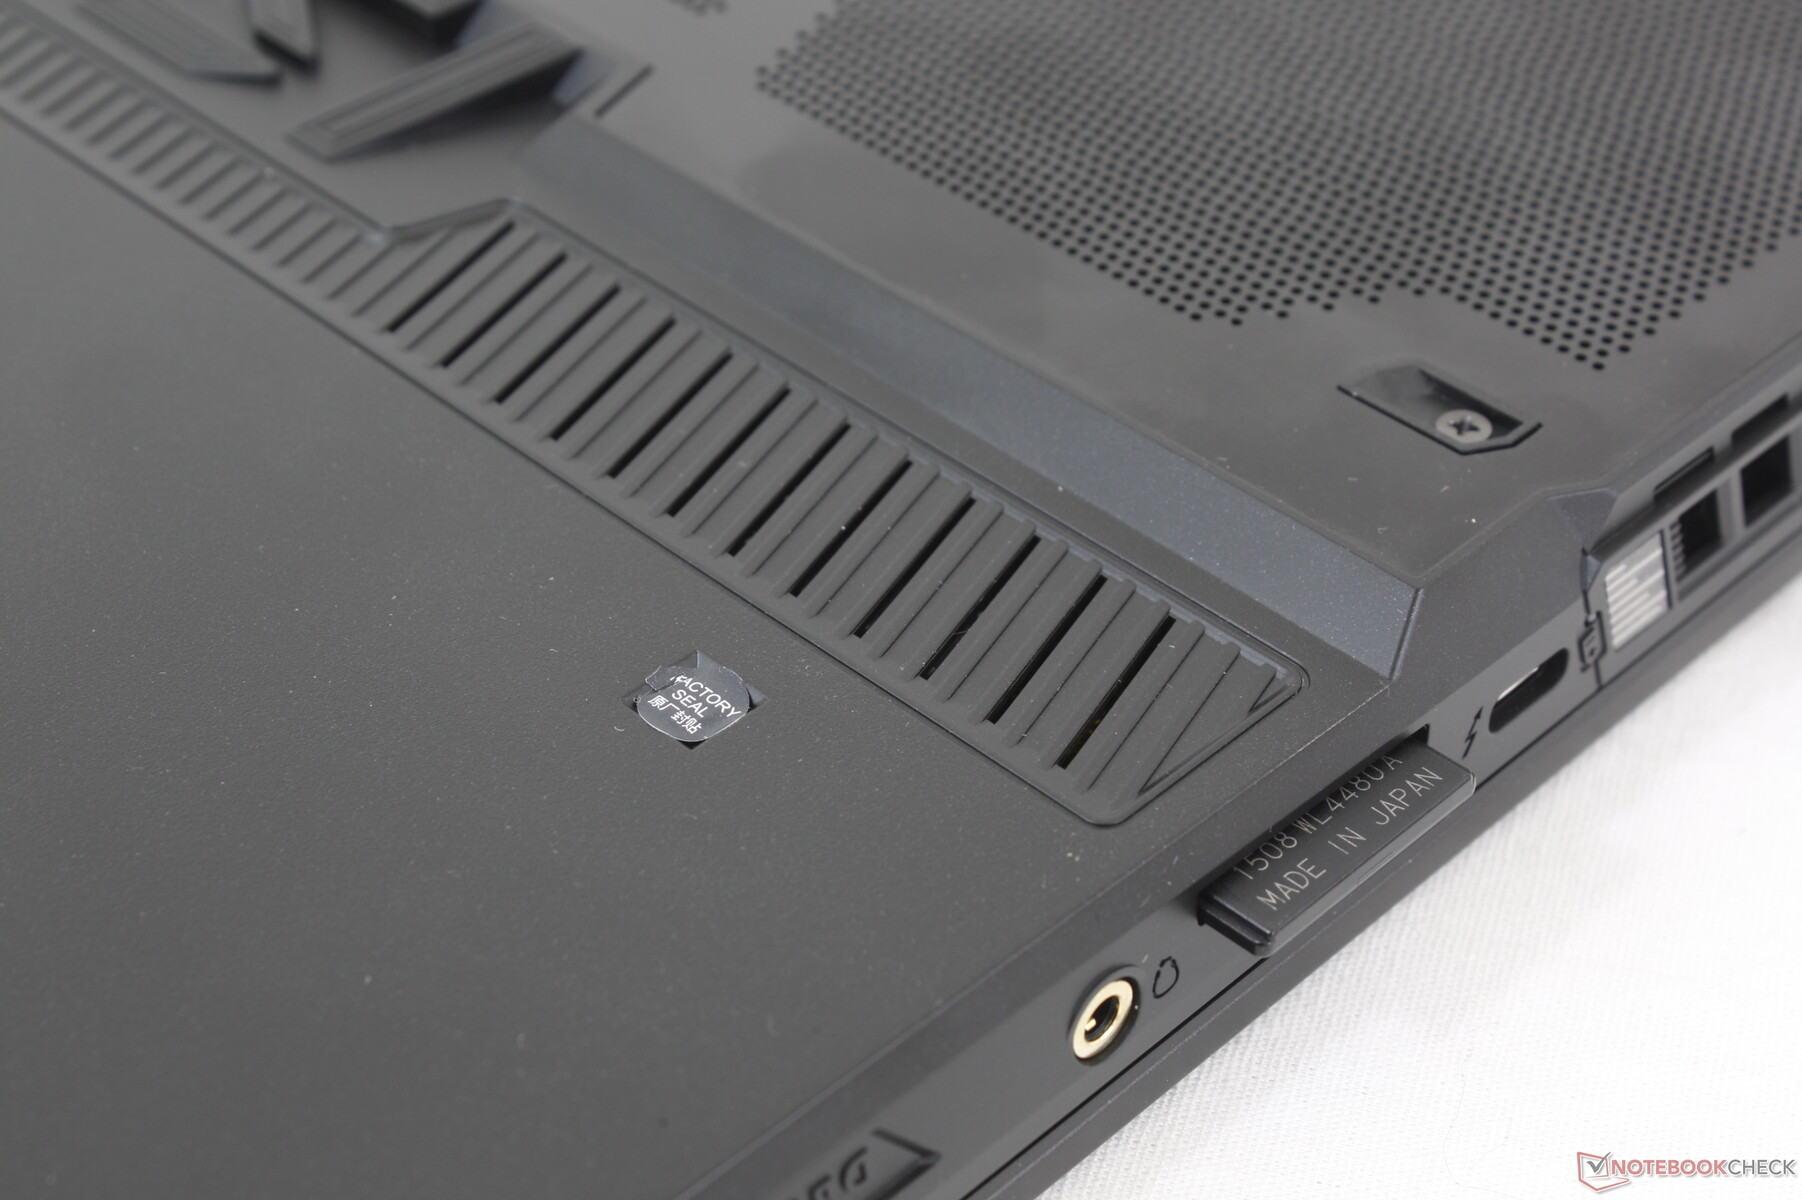
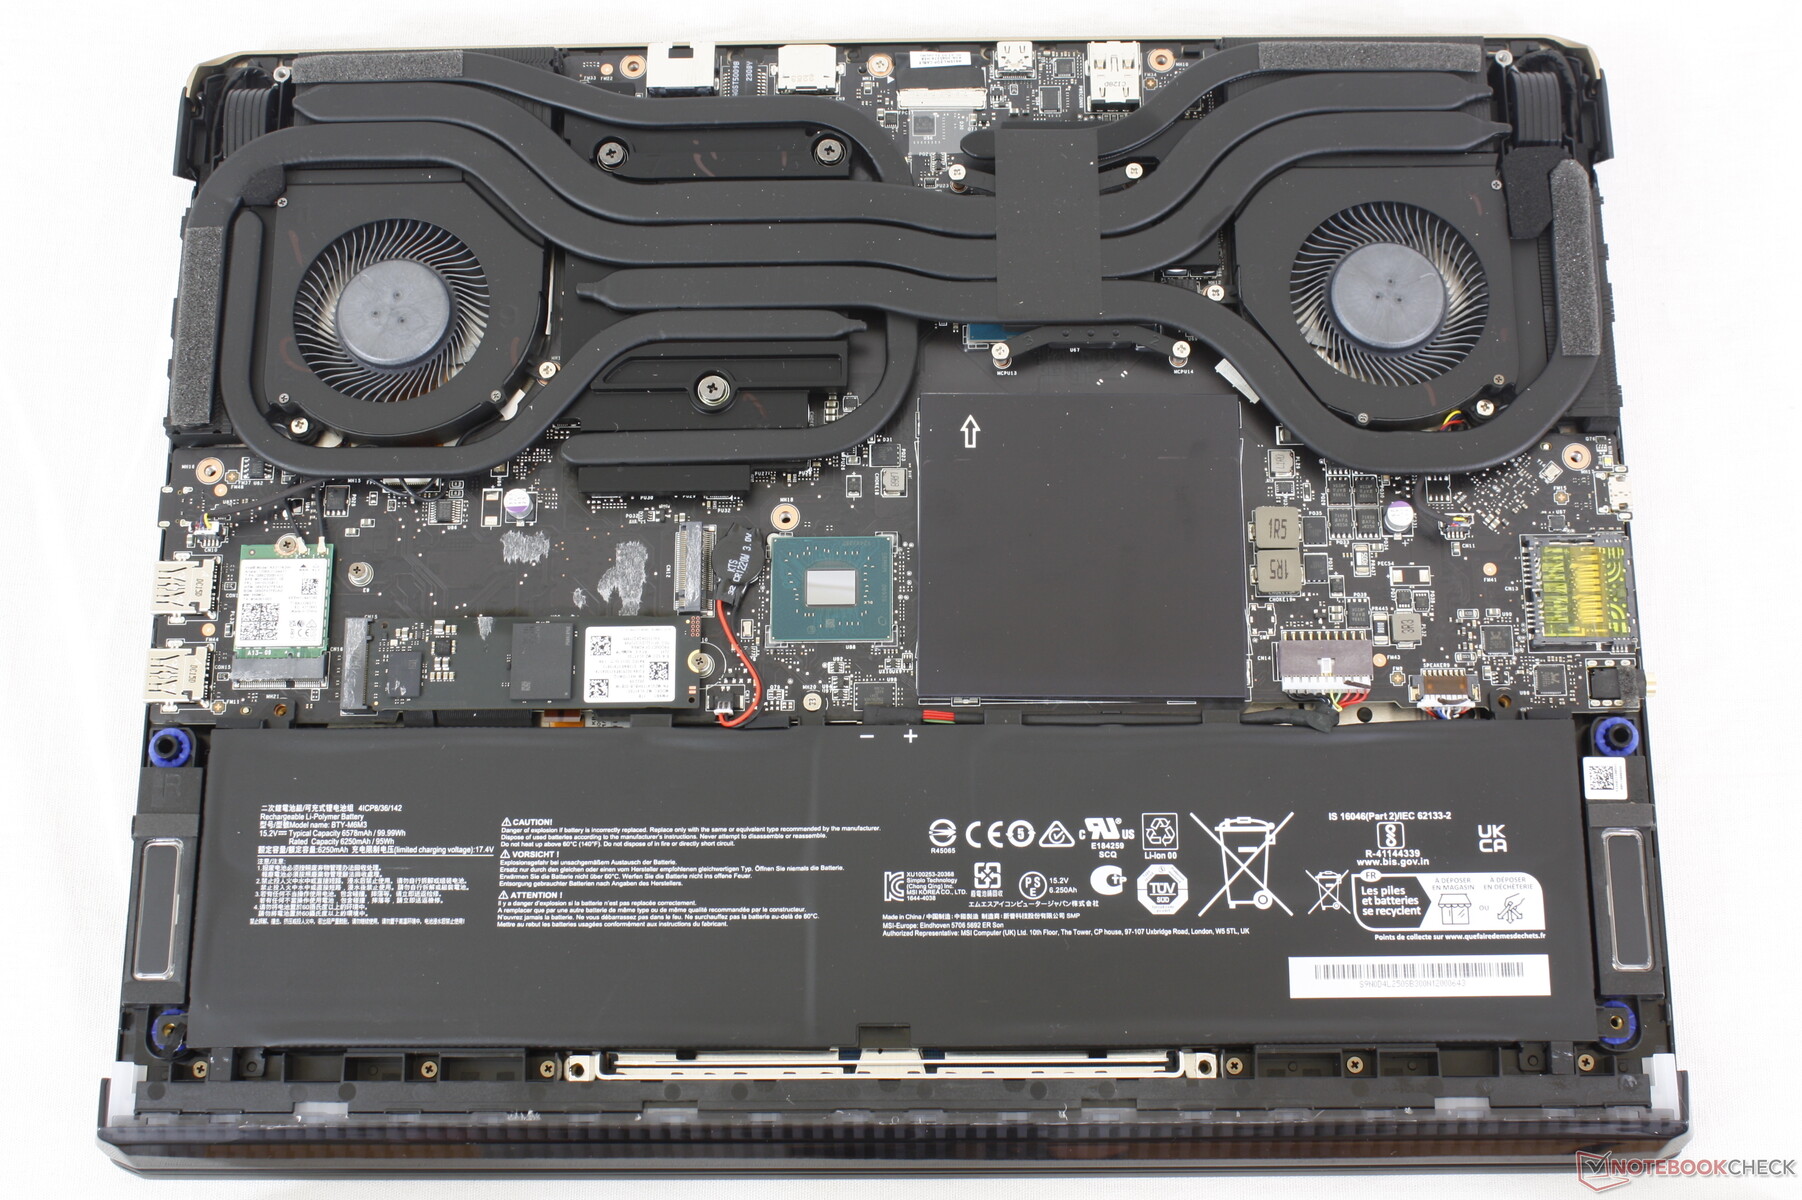
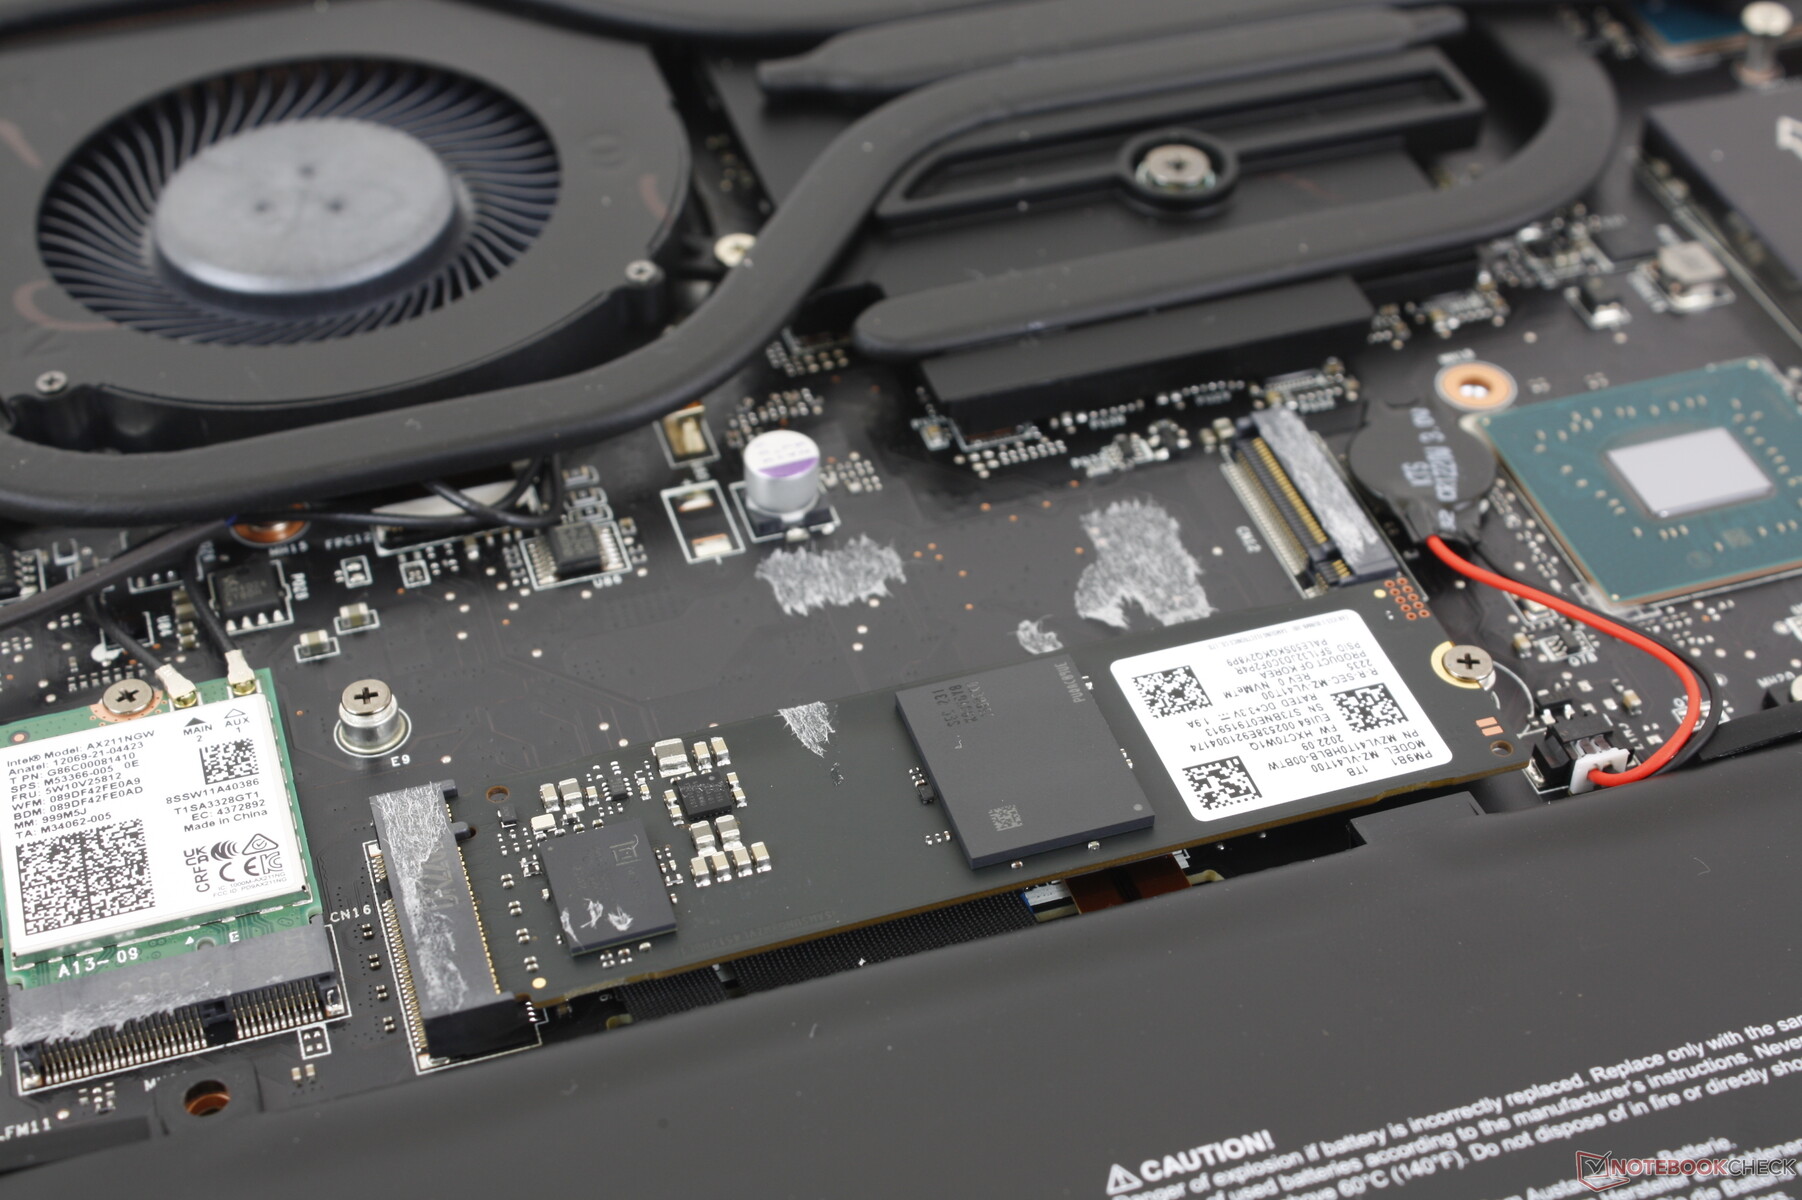
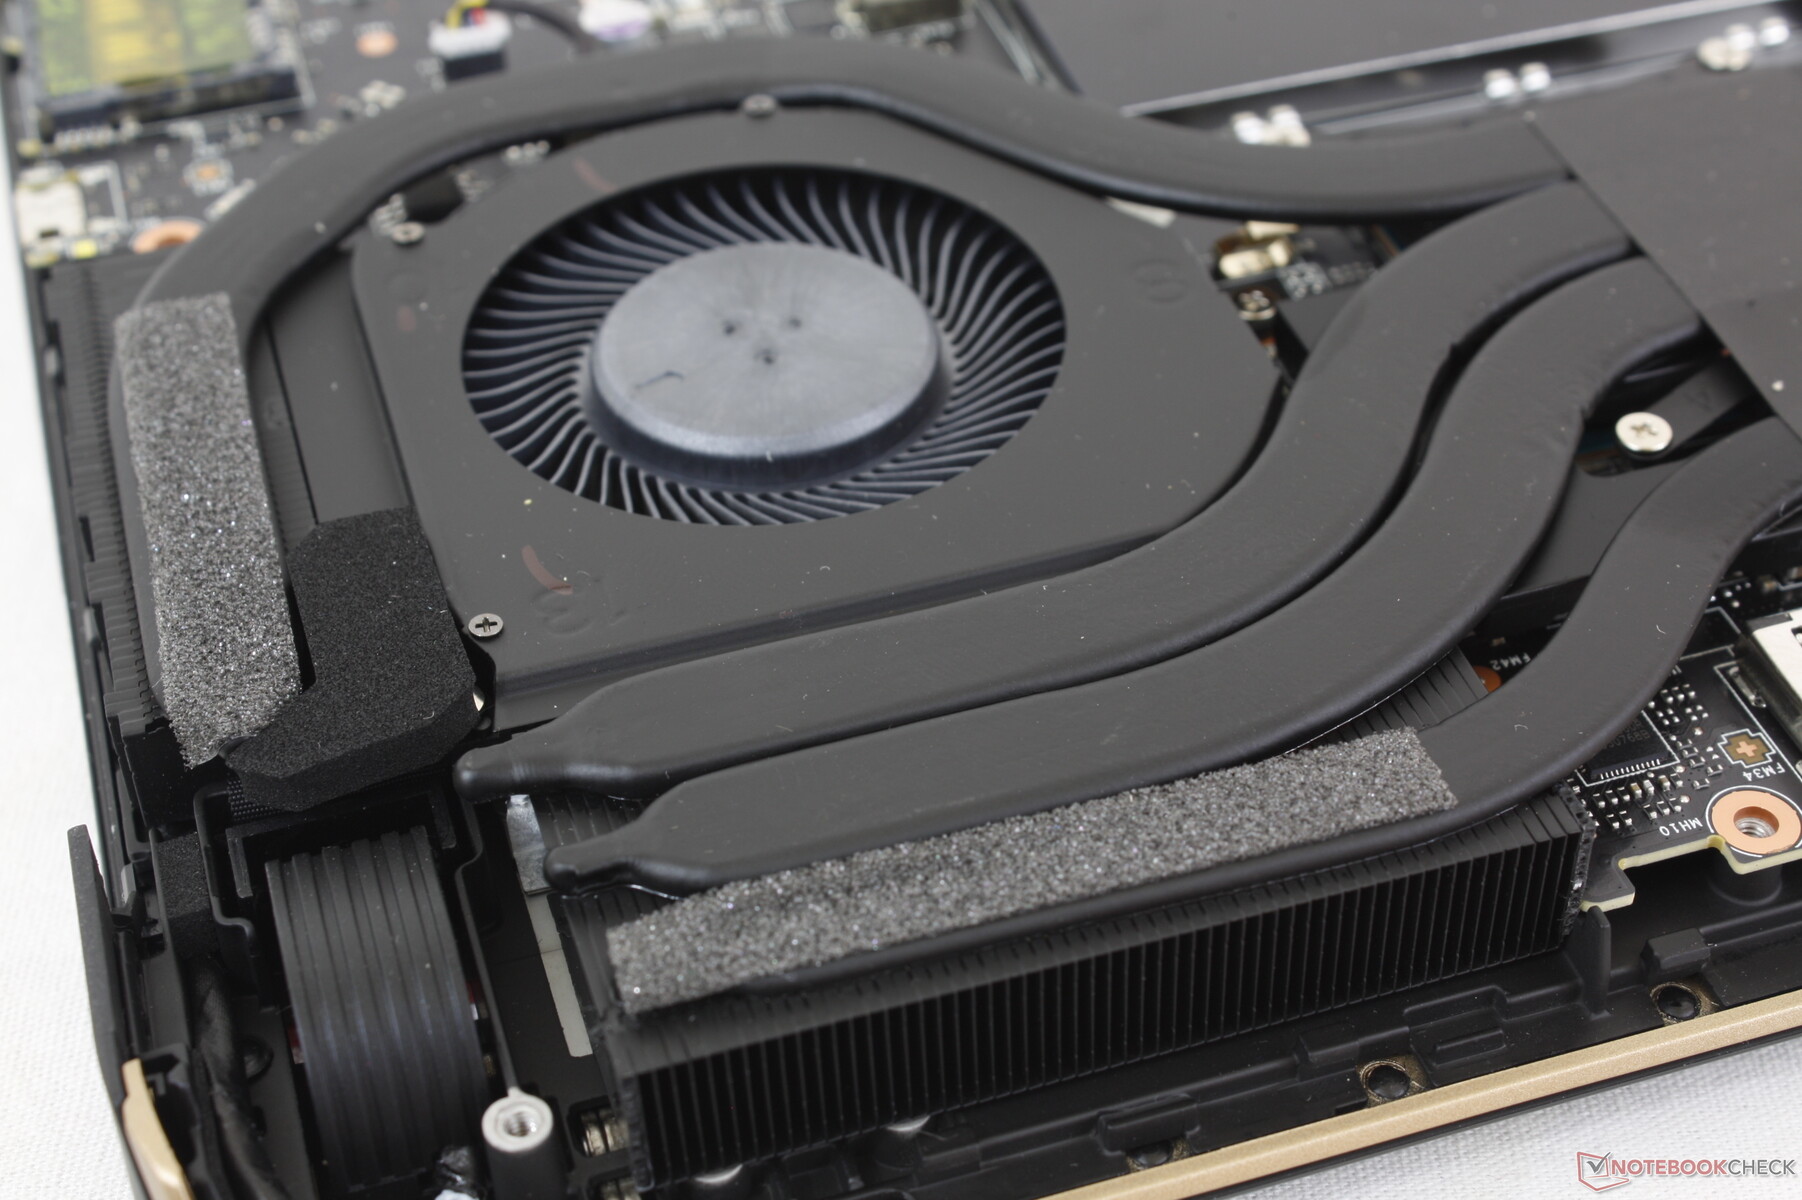
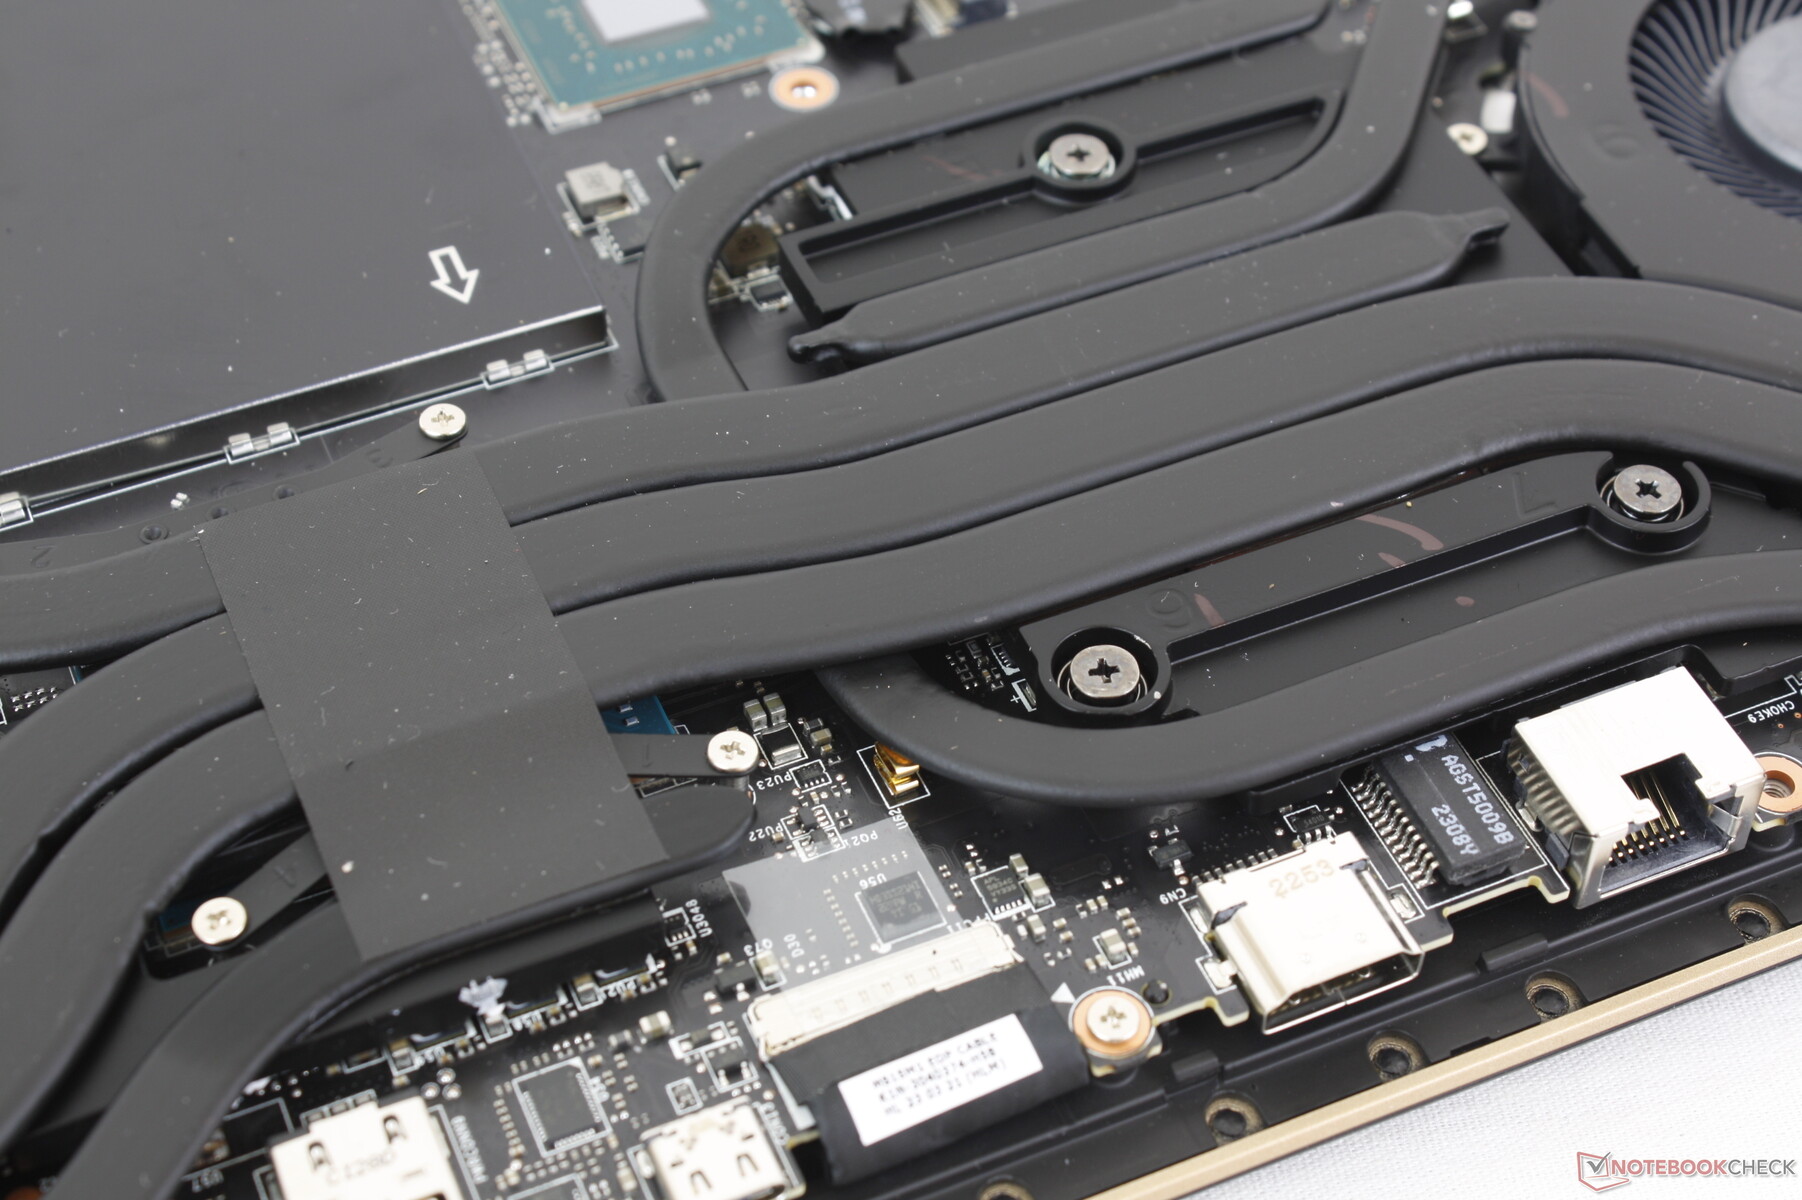
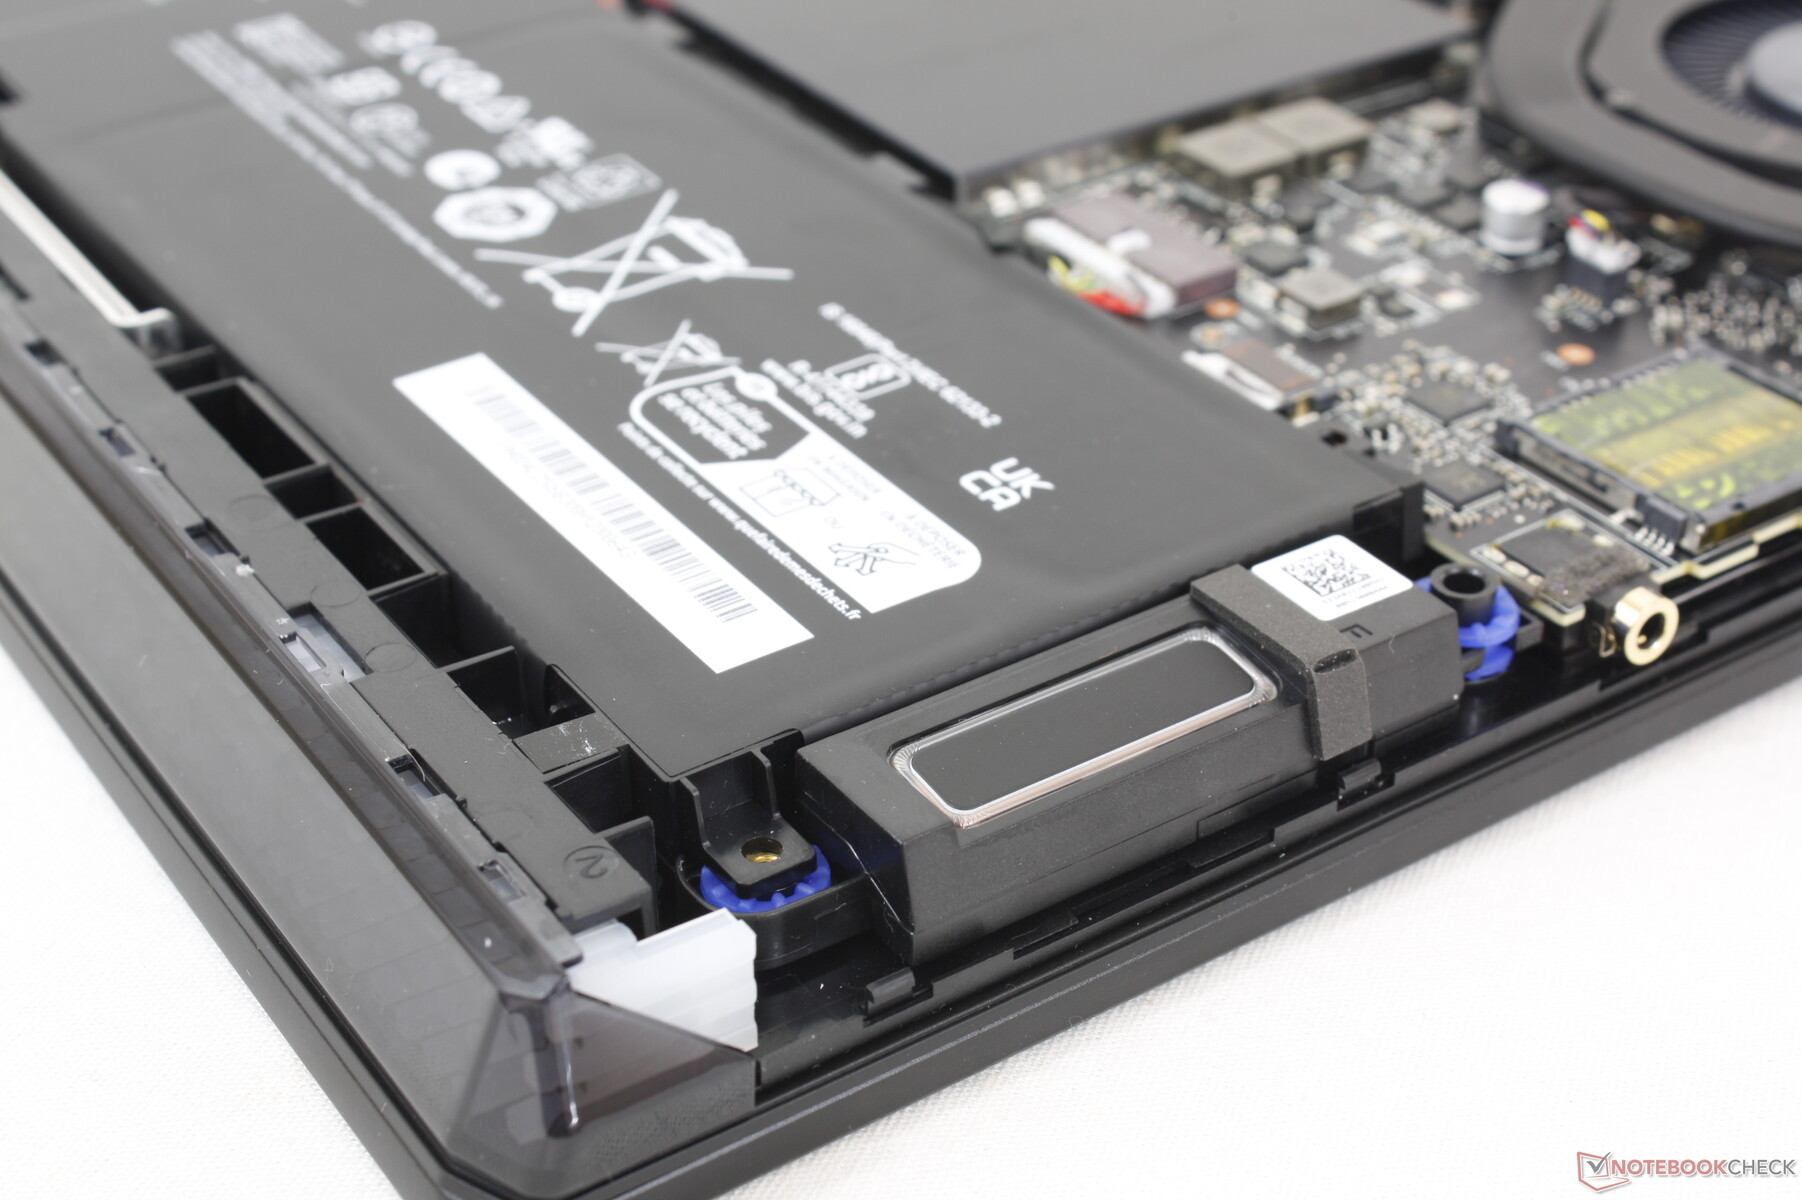
Underhåll
Tyvärr blir MSI-laptops allt svårare att serva nuförtiden. Bottenpanelen är säkrad med 13 Phillips-skruvar, varav en är bakom en klistermärke mot manipulering för att avskräcka slutanvändare från att utföra service. Det största problemet är att plastkrokarna längs panelens kanter är vinklade och tätt fästa vid basen, särskilt längs baksidan. Dessa krokar är svåra att lossa och ännu svårare att återmontera.
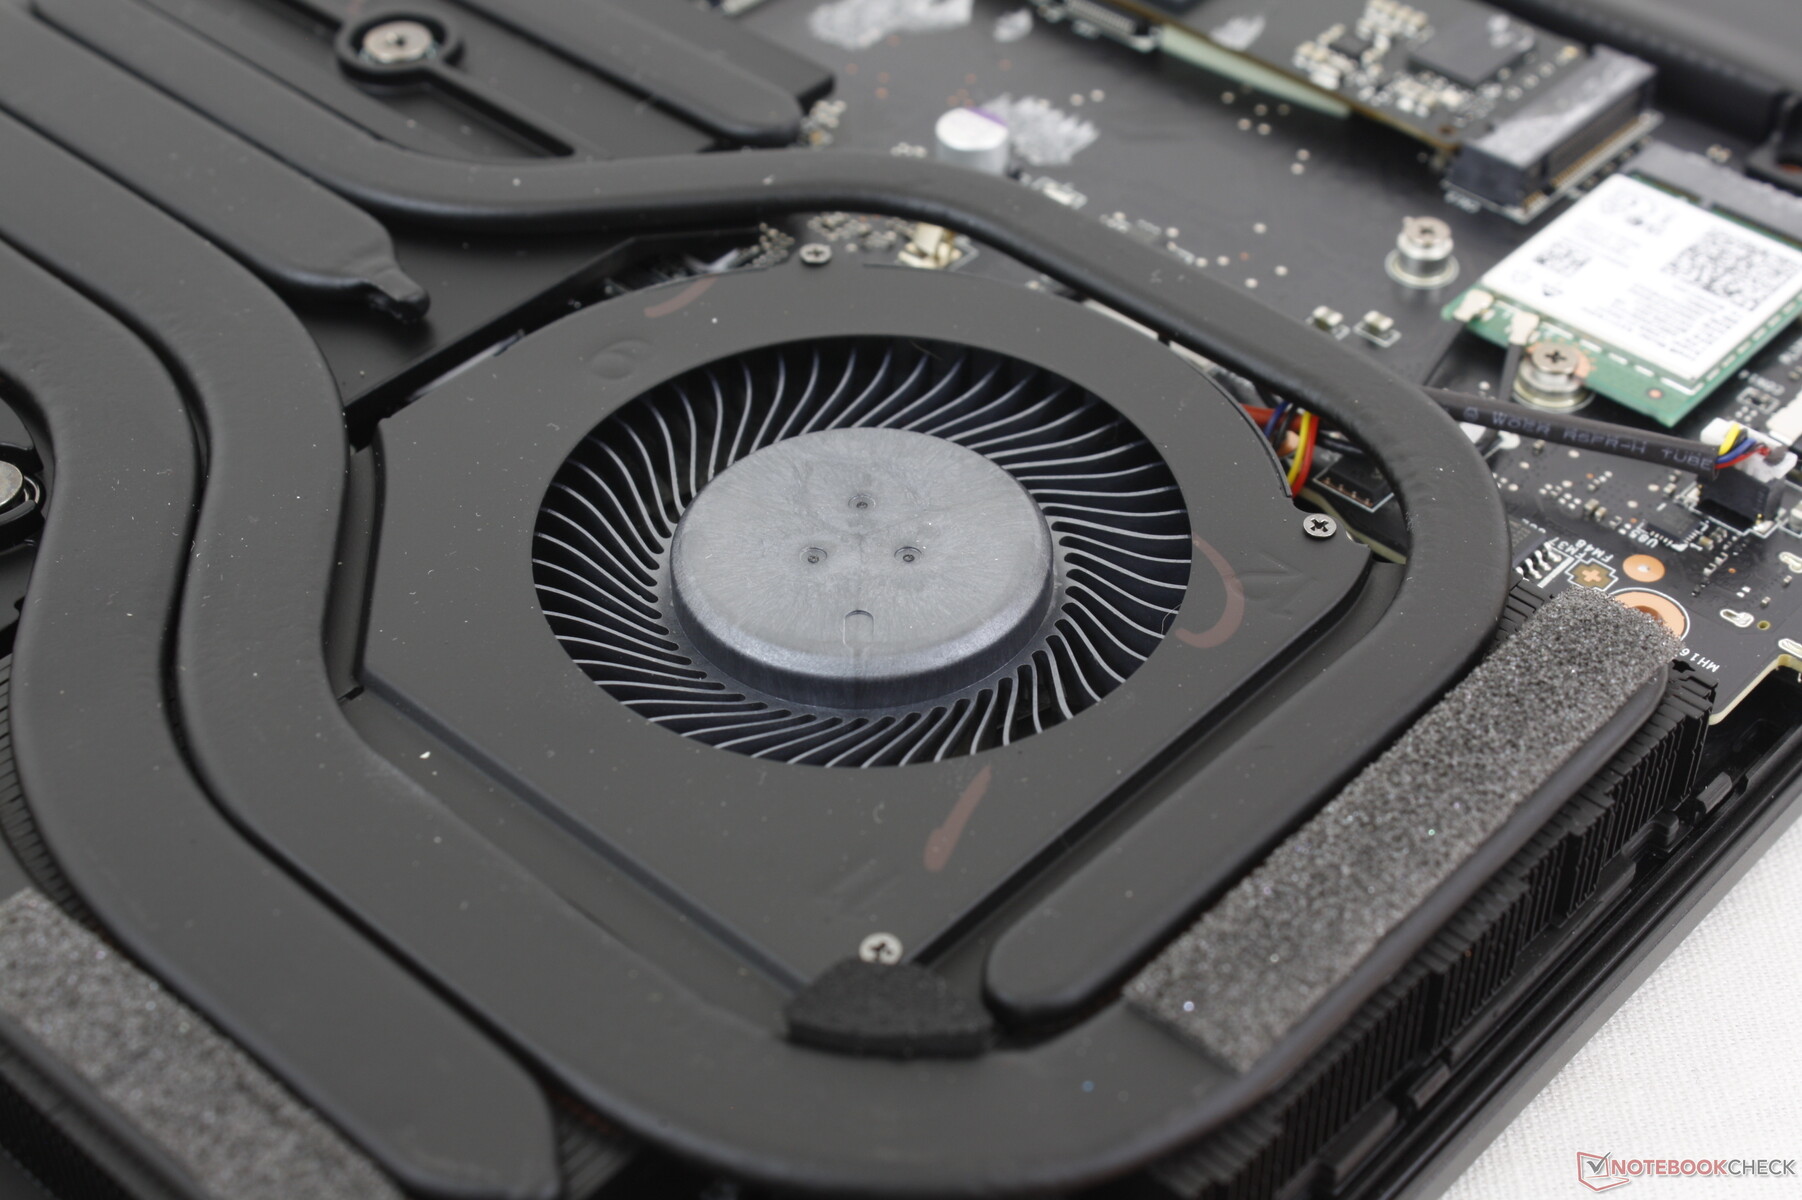
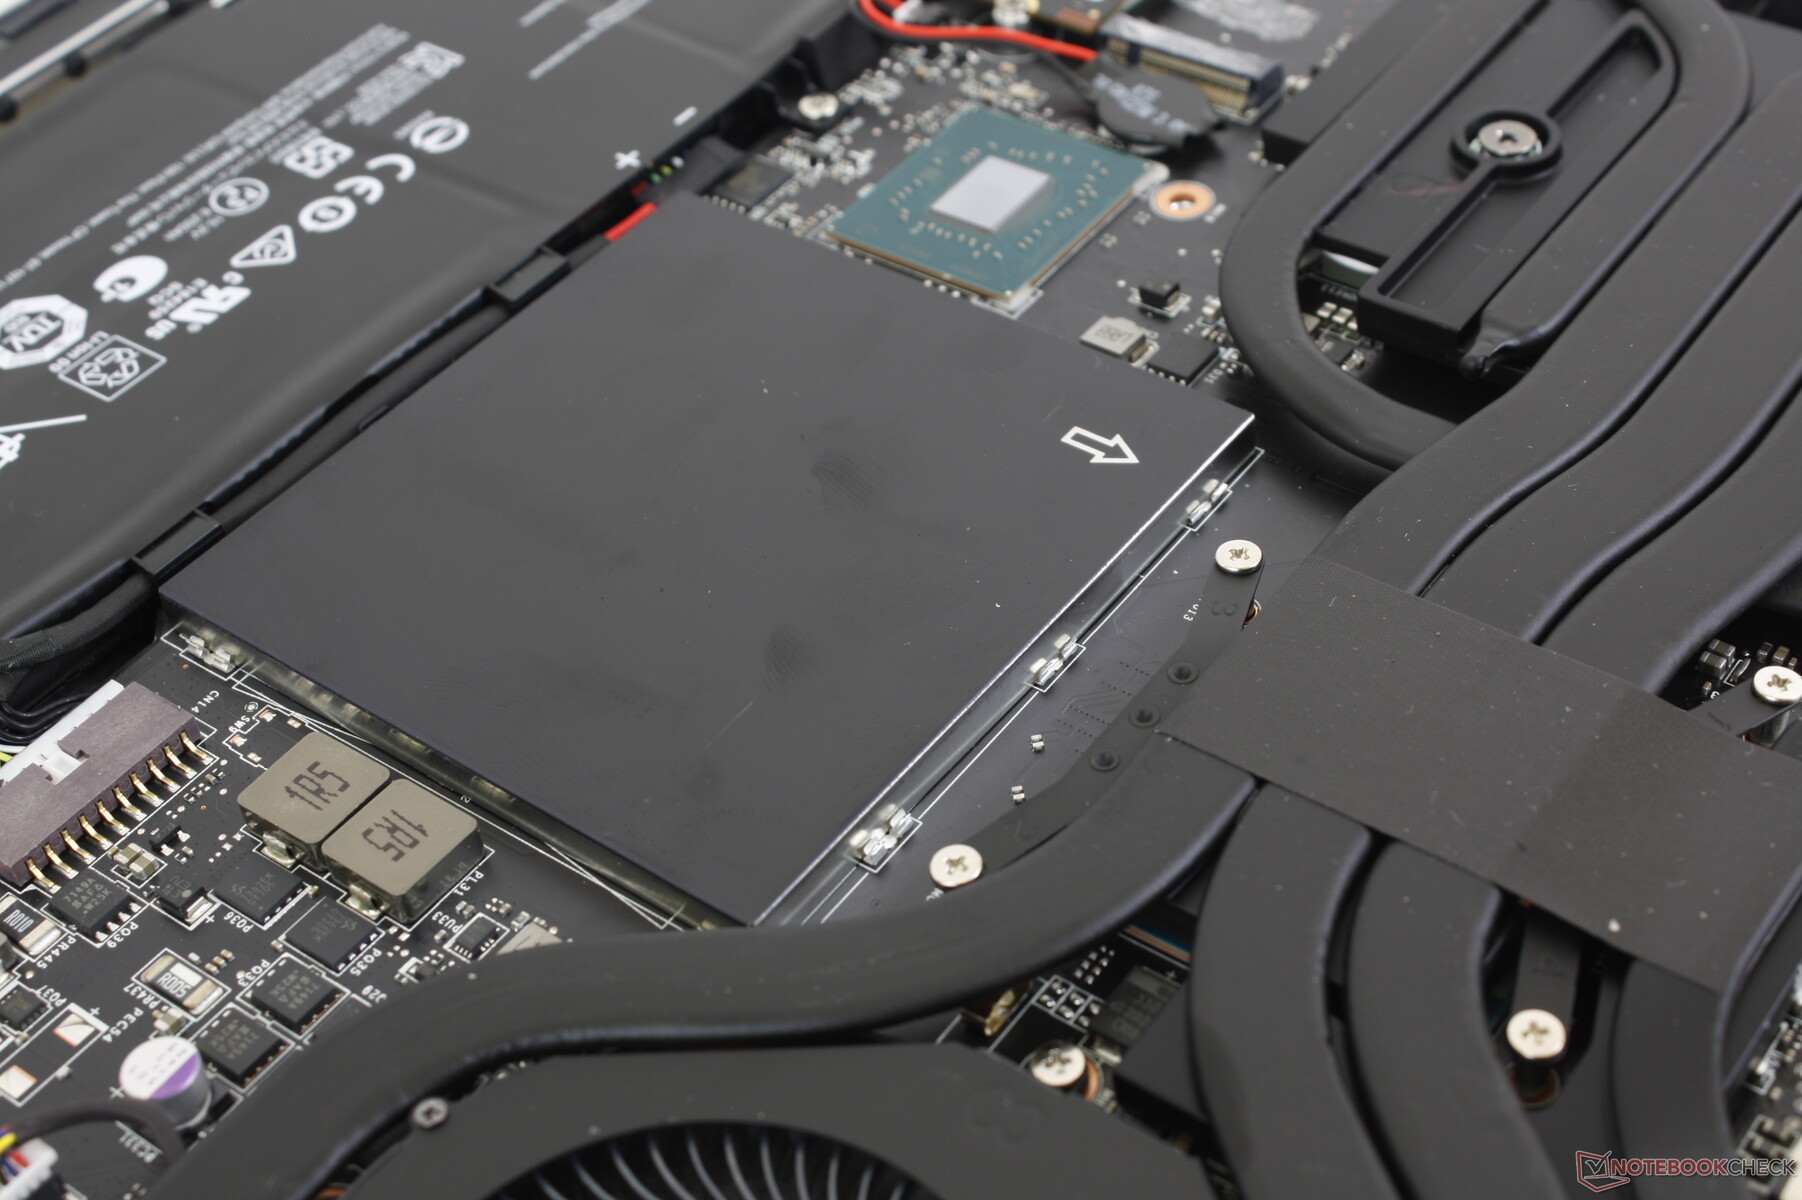
Användare har direkt tillgång till två M.2 2280-lagringsfack, två DDR5 SODIMM-kortplatser, WLAN-modulen och batteriet en gång inuti.
Tillbehör och garanti
I detaljhandelsförpackningen ingår en rengöringsduk, nätadapter och pappersarbete. En ettårig begränsad tillverkargaranti gäller vid köp i USA.
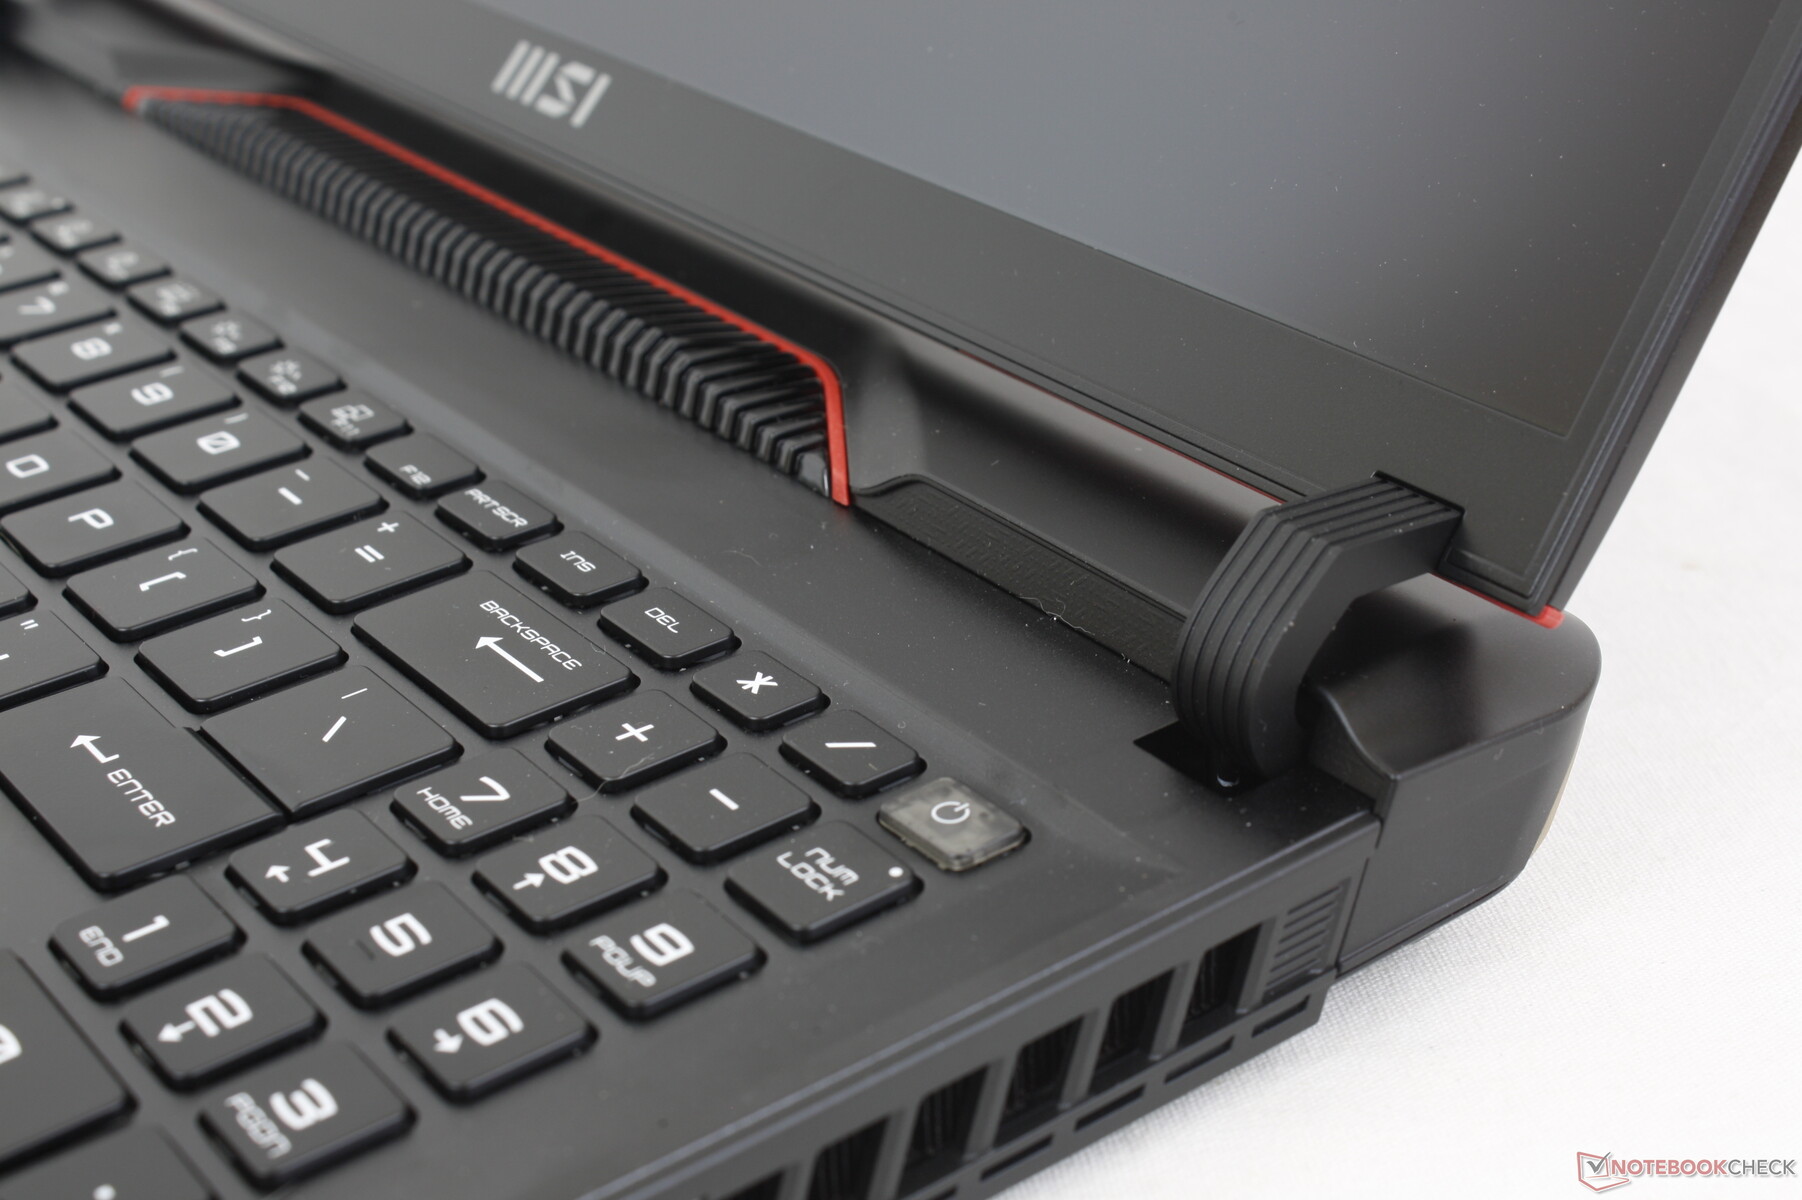
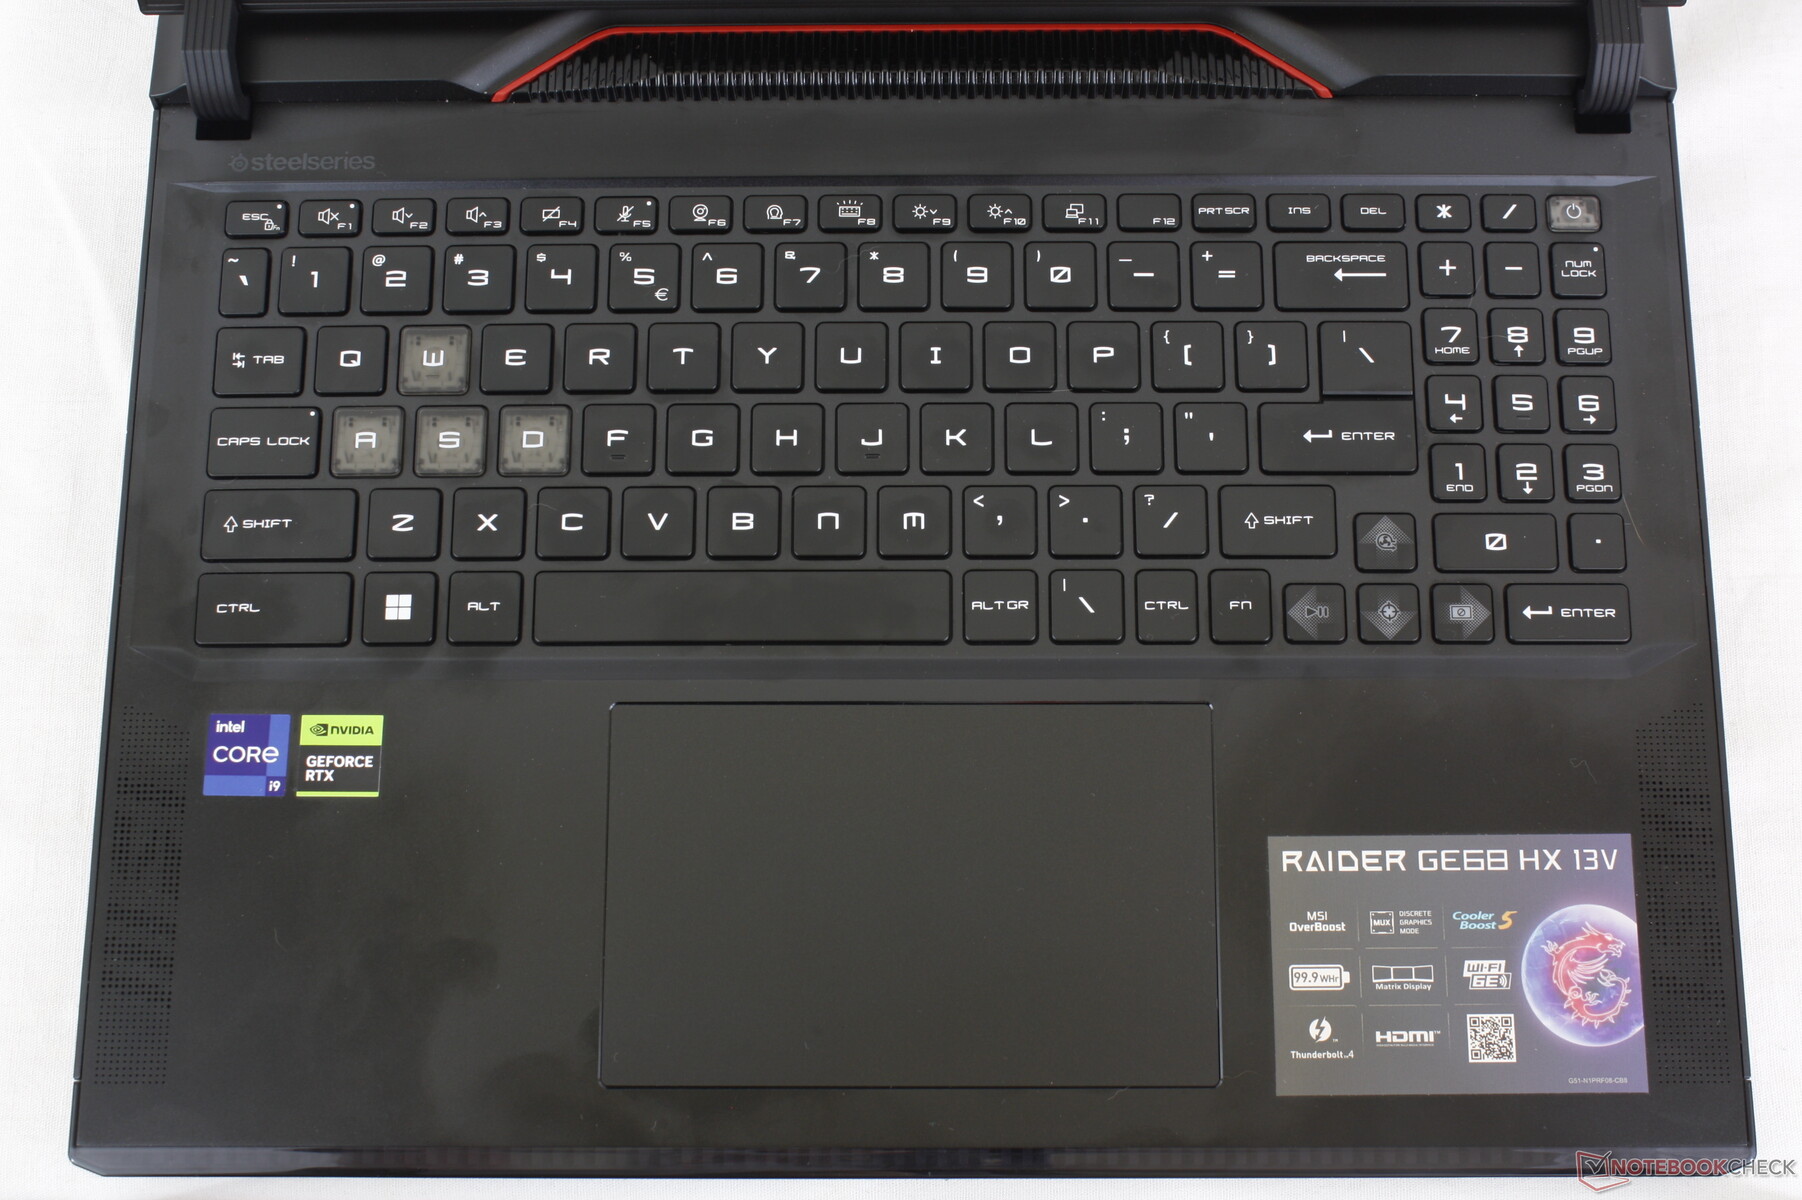
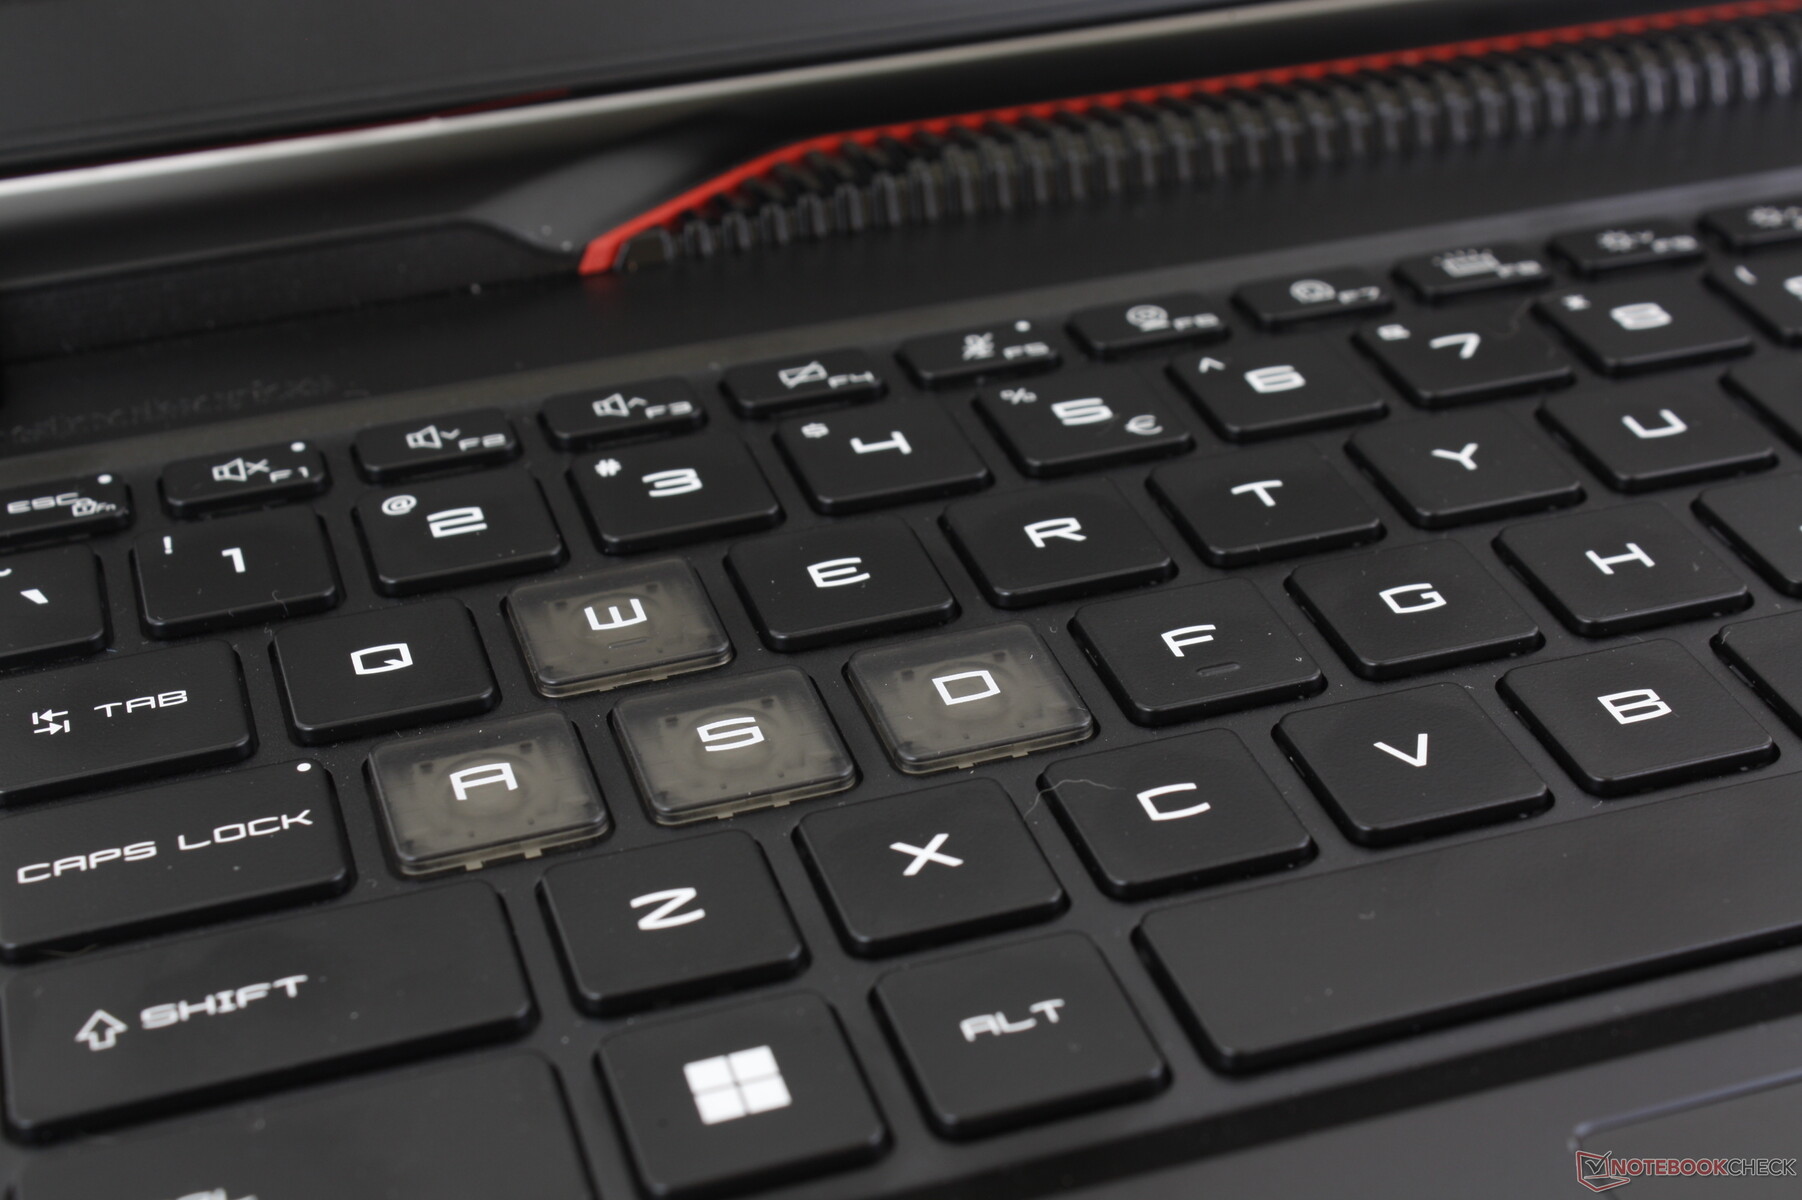
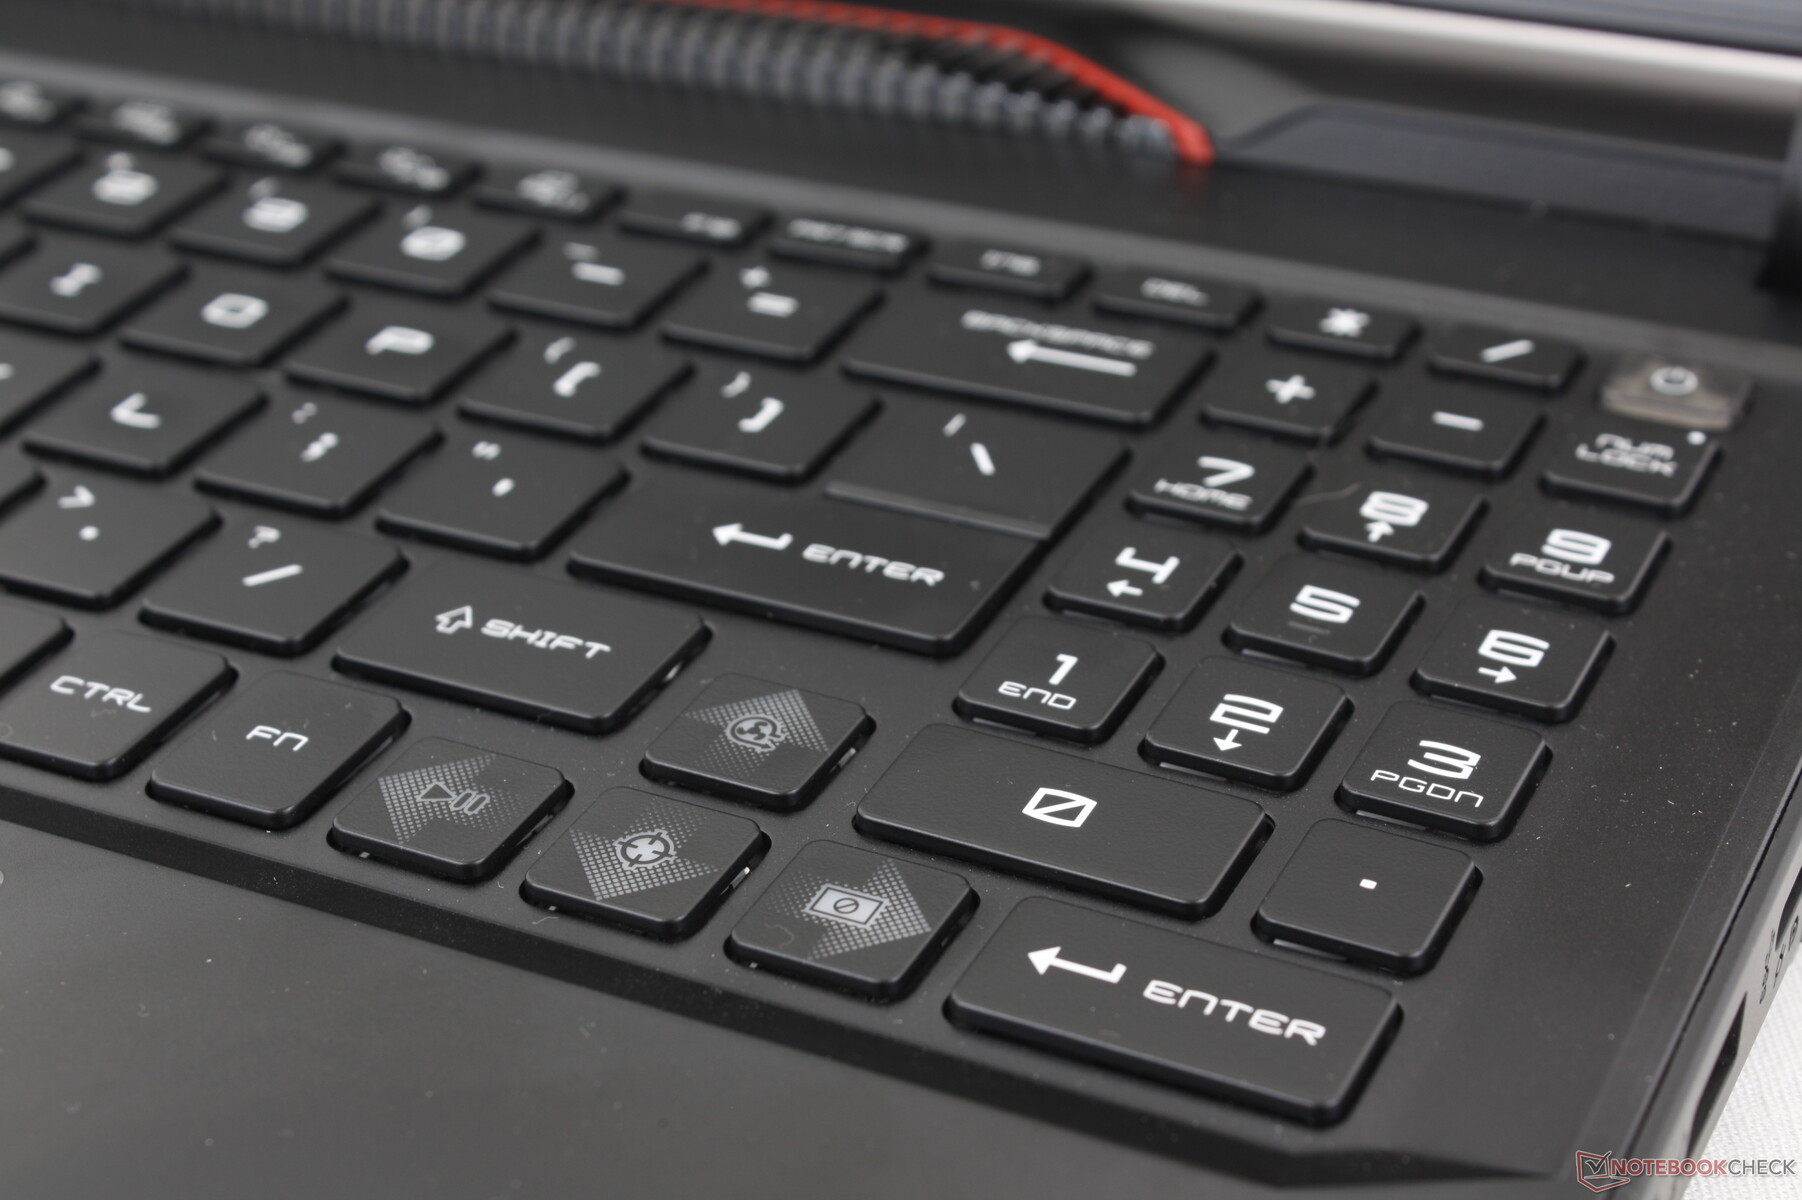
Inmatningsenheter - Större Clickpad och ny Numpad
Tangentbord
MSI har gjort om tangentbordslayouten jämfört med GE67HX. Det finns nu en integrerad numpad medan Ctrl- och Fn-tangenterna inte längre är klämda ihop på ett besvärligt sätt. Tyvärr har piltangenterna minskats i storlek för att göra plats för den nya numpaden.
I övrigt är tangentfeedbacken utmärkt med fast och jämn feedback mellan de viktigaste QWERTY-tangenterna. Speciellt Space- och Enter-tangenterna är märkbart högre för en mer tillfredsställande känsla.
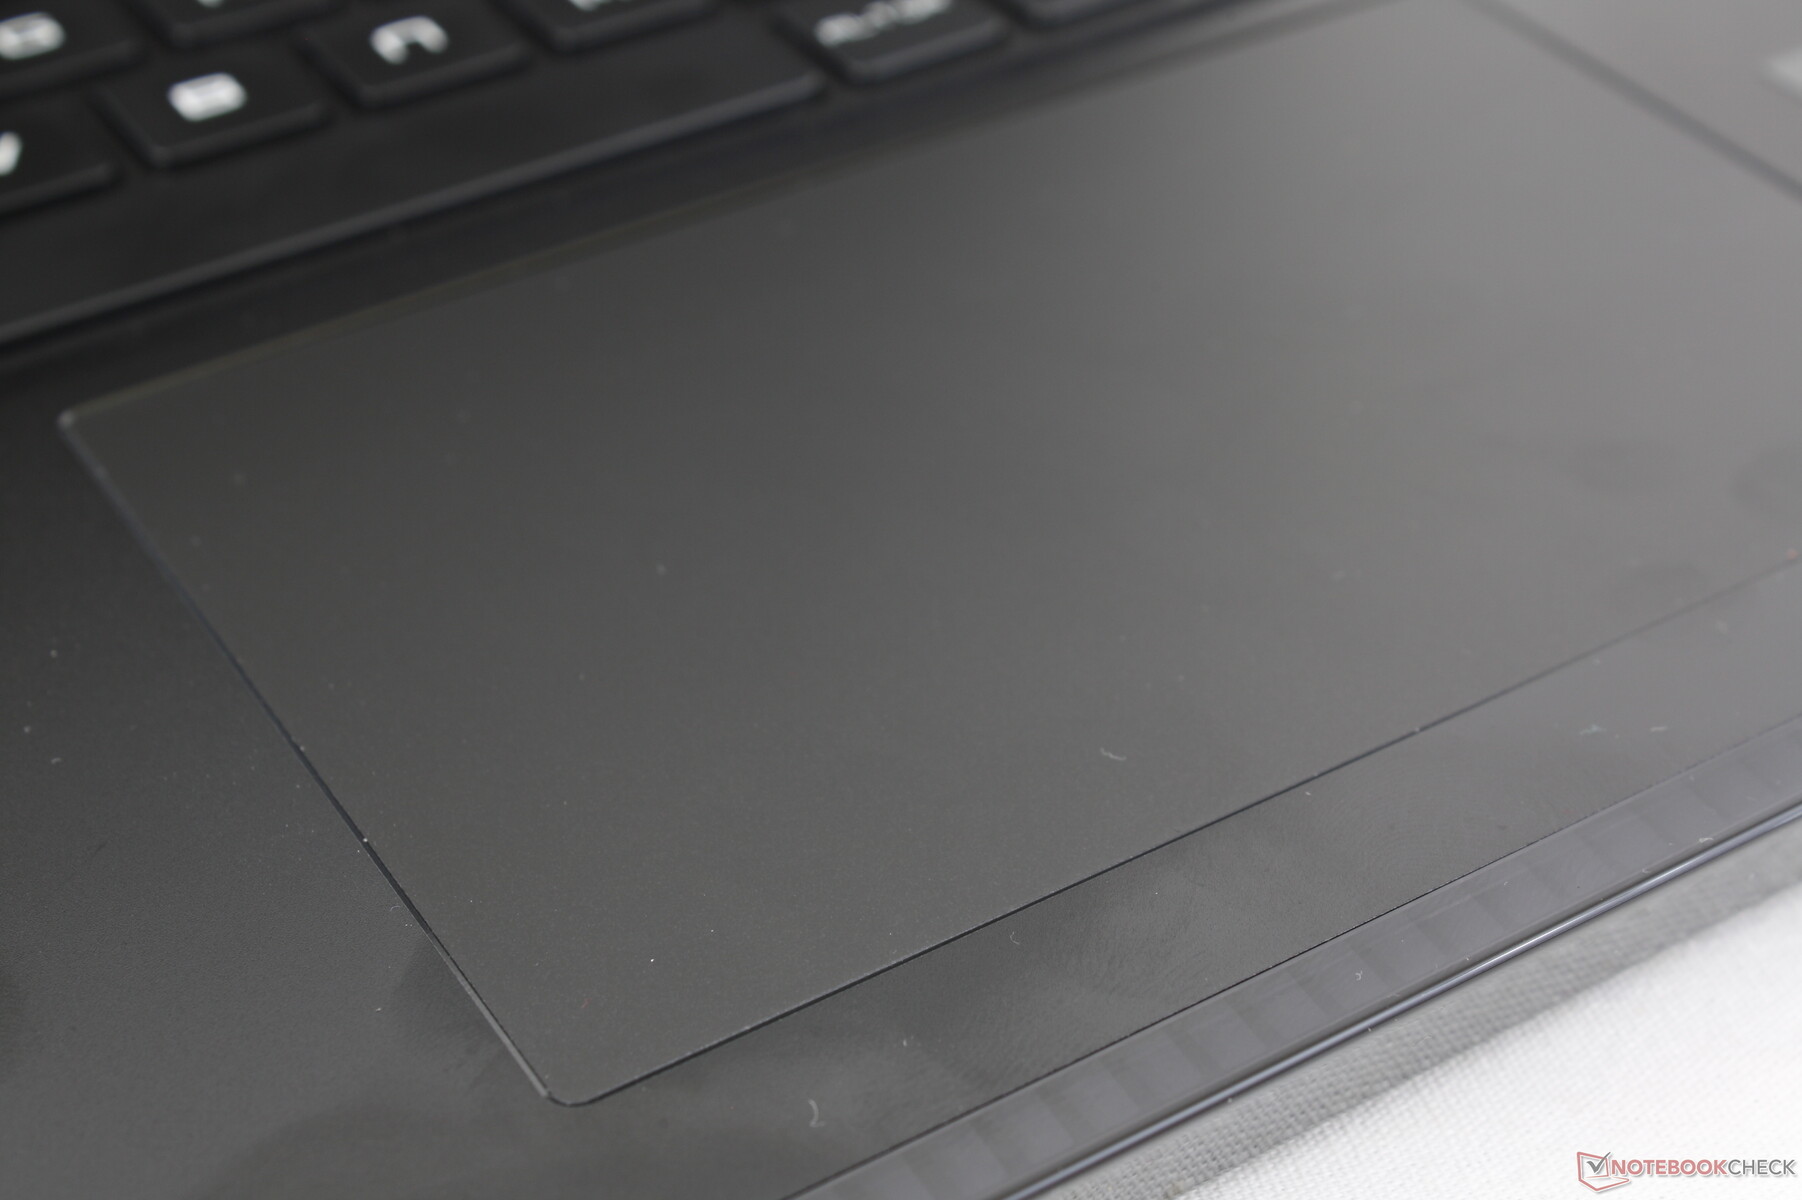
Pekplatta
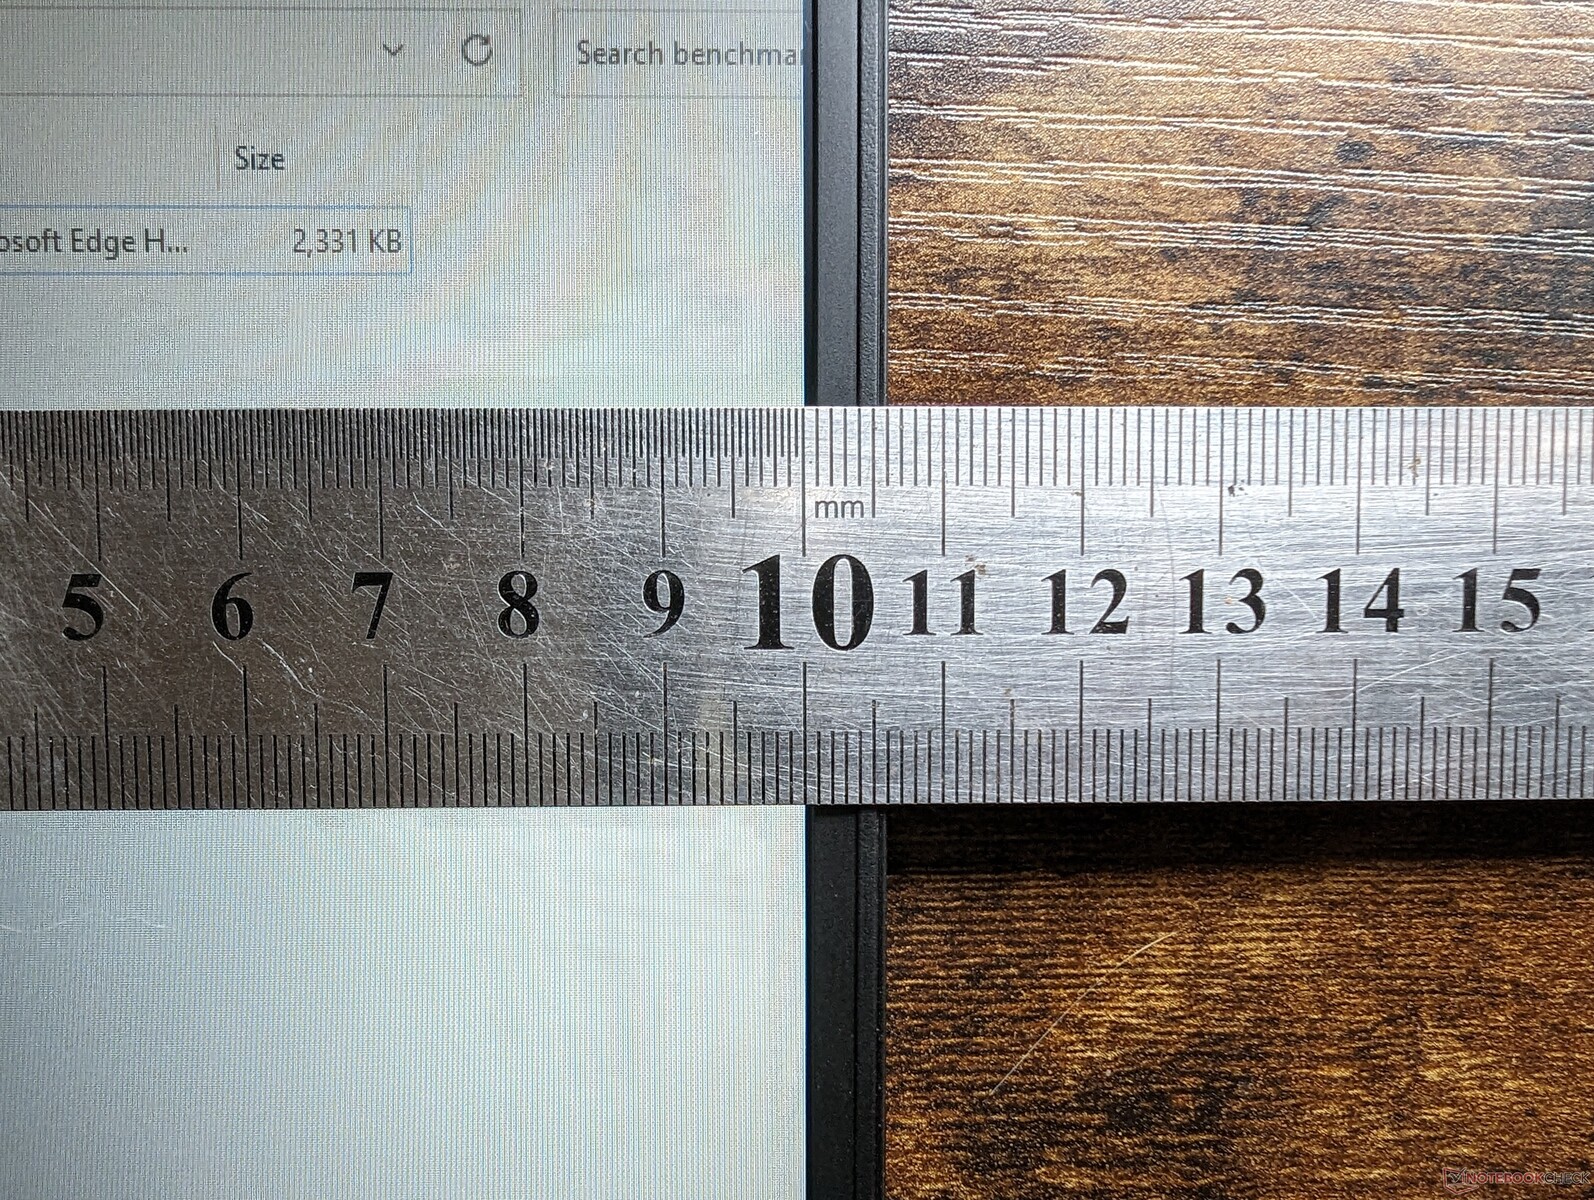
Klickplattans storlek har ökat betydligt från bara 10,5 x 6,5 cm på GE67HX till 13 x 8,3 cm på GE68HX. Glidningen är mycket mjuk och responsiv och det finns nästan inget klibbande även när man rör sig i långsammare hastigheter. Klickandet är också tillfredsställande, men återkopplingen är inte helt enhetlig eftersom det känns mer klickande när man trycker i mitten medan de nedre hörnen känns mer svampiga.
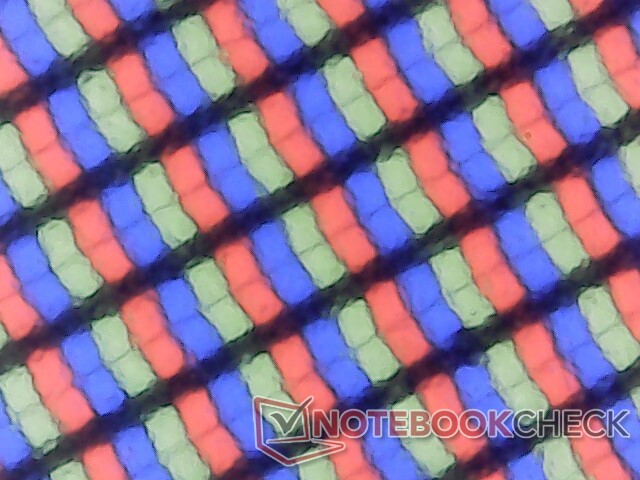
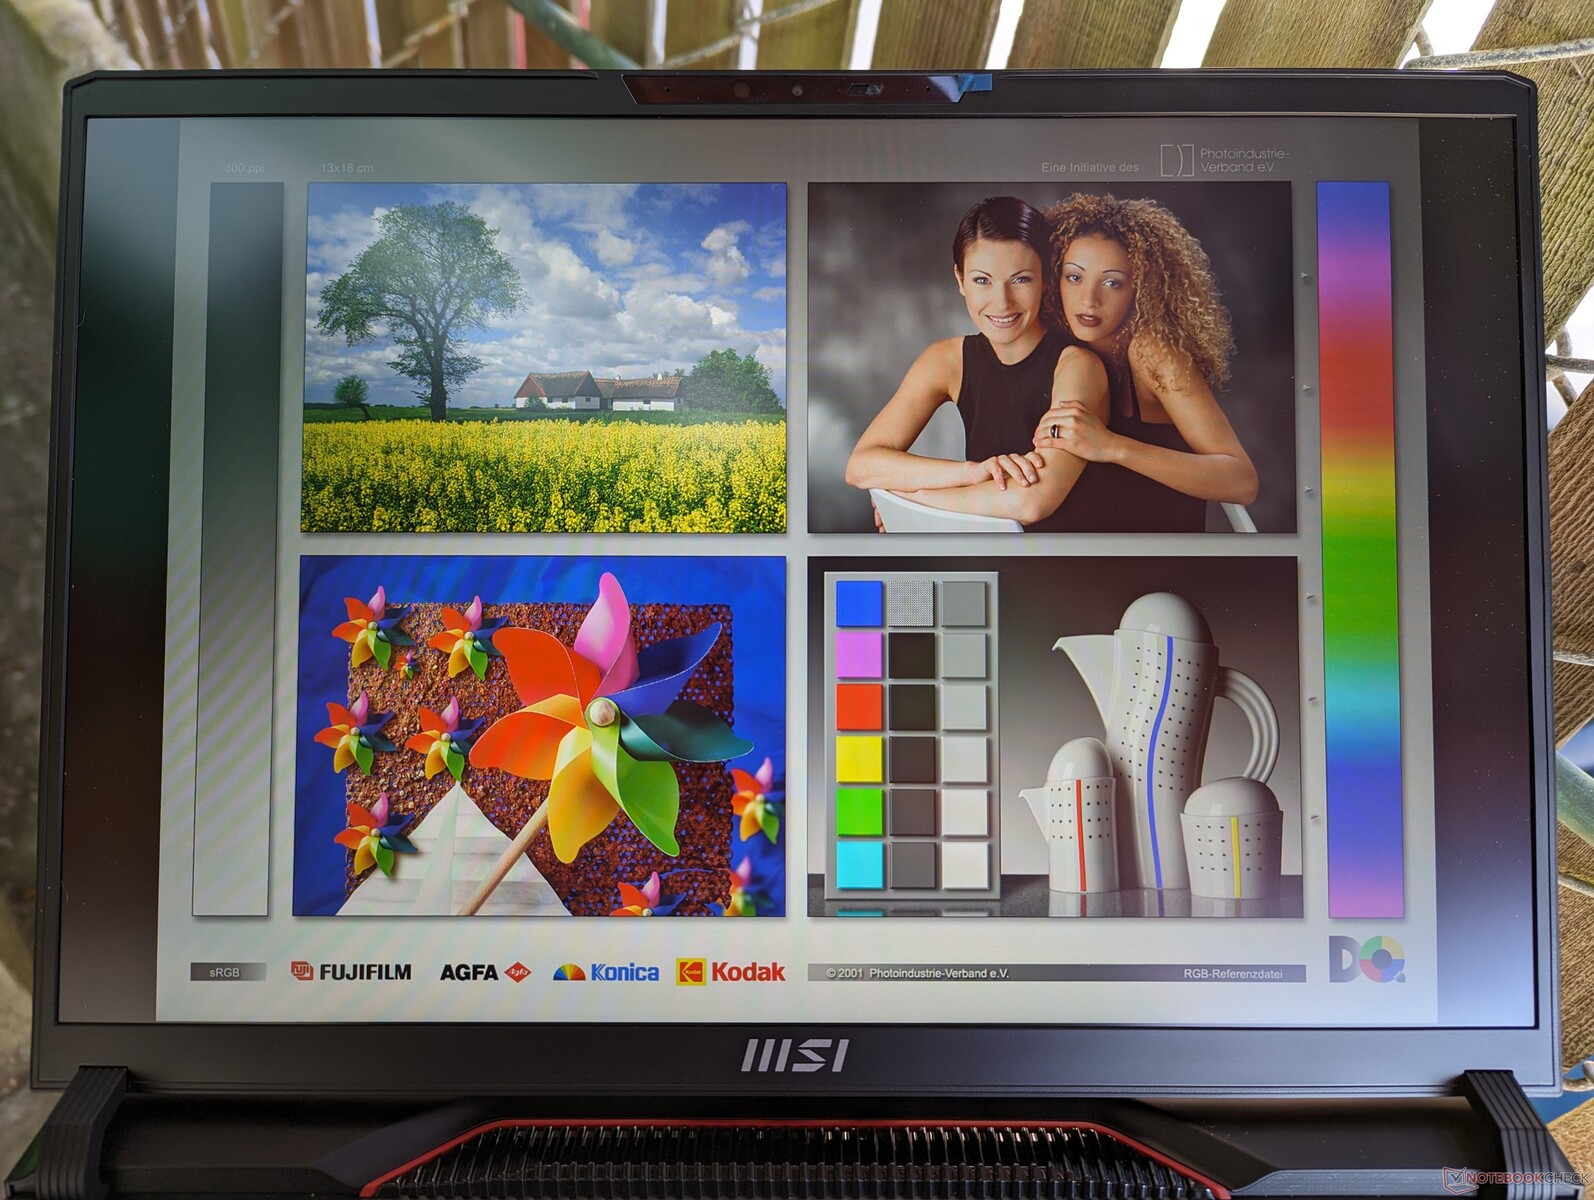
Display - Dåliga färger
Raider GE68HX levereras med två olika panelalternativ. Vår specifika granskningsenhet levereras med det fetmarkerade alternativet nedan:
- 2560 x 1600, 240 Hz, 100% DCI-P3, 3 ms, IPS
- 1920 x 1200, 144 Hz, 60% sRGB, 11 ms, IPS
Det billigare 144 Hz-alternativet rekommenderas inte på grund av dess smalare färgtäckning och långsammare svarstider för mer märkbar spökbild. De grundare färgerna är svåra att förbise även om du inte gör mycket grafikredigering. Den här panelen passar bättre för billigare bärbara speldatorer som MSI Pulse 17 där smala färgområden är vanliga.
G-Sync saknas i alla nuvarande konfigurationer av GE68HX.
| |||||||||||||||||||||||||
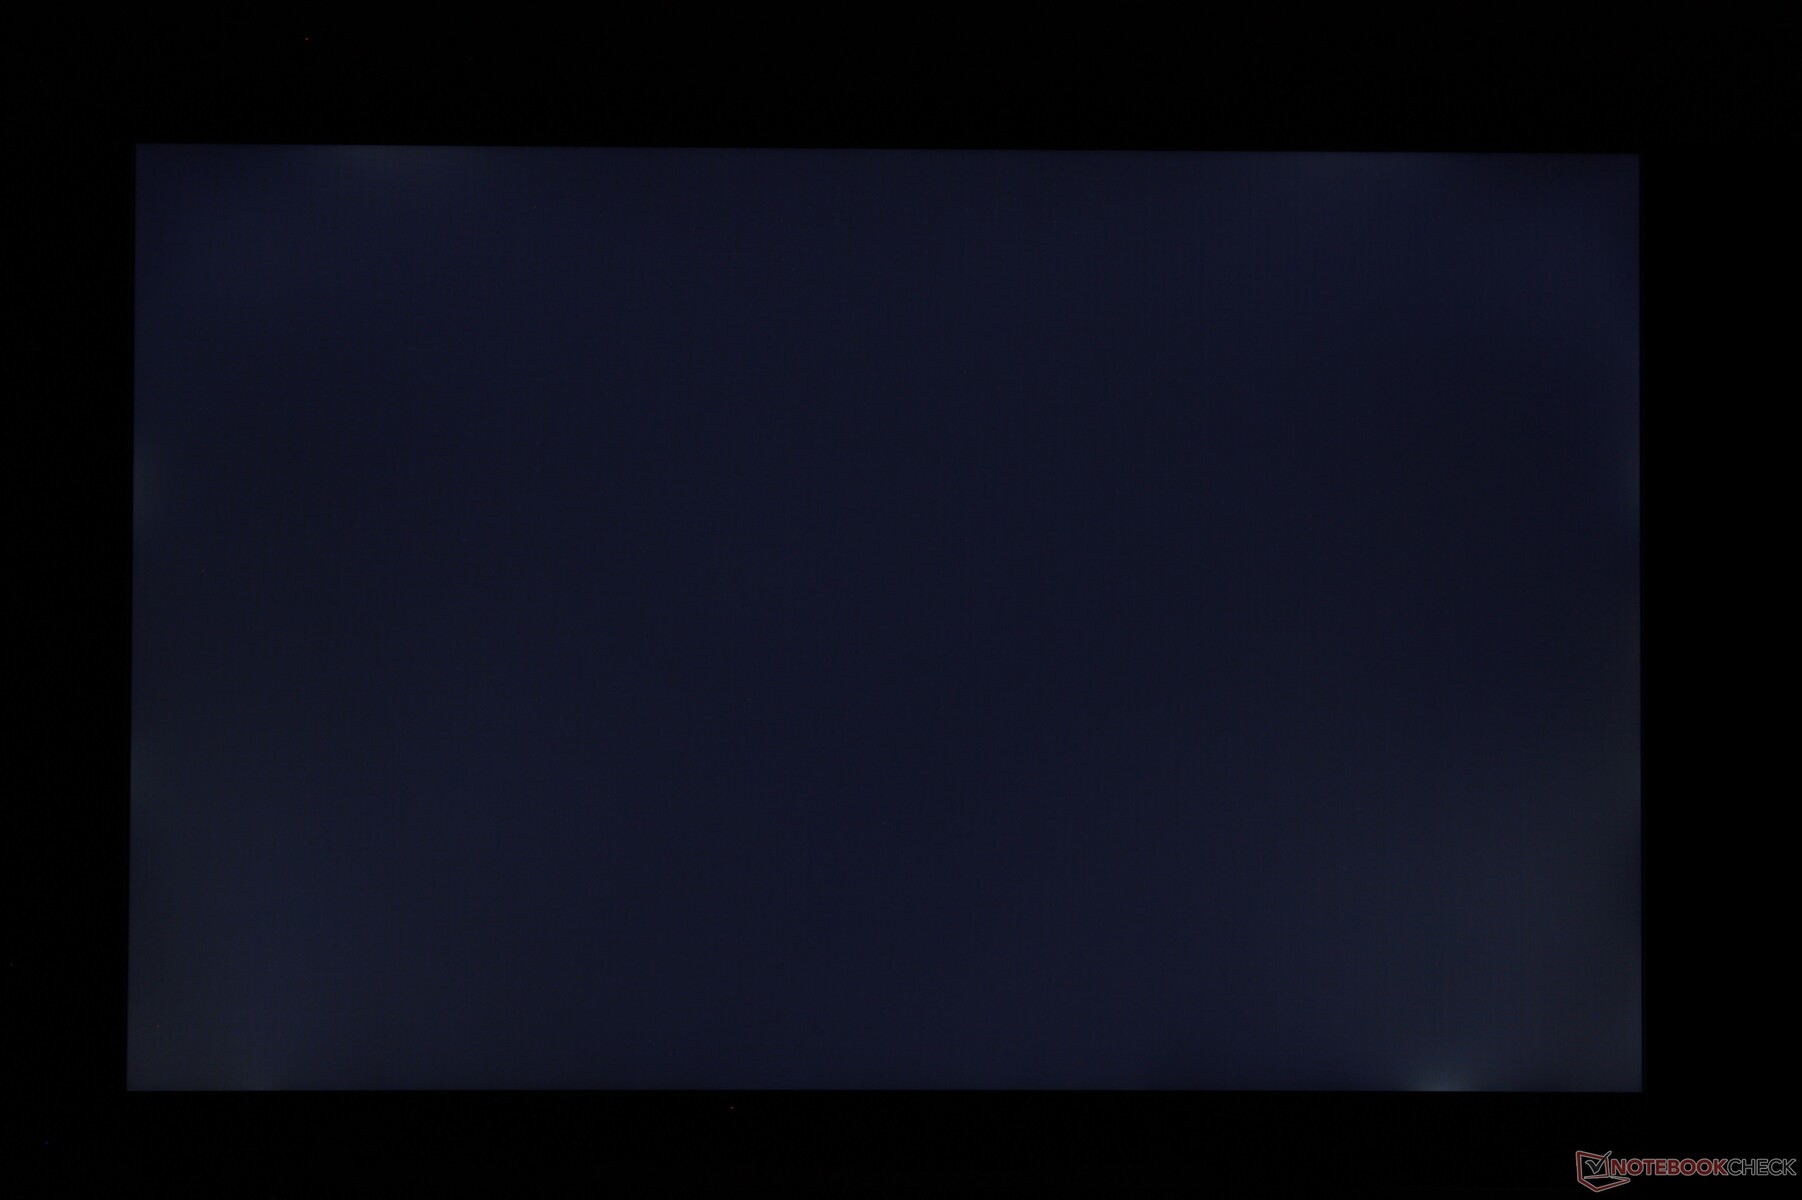
Distribution av ljusstyrkan: 93 %
Mitt på batteriet: 300.9 cd/m²
Kontrast: 971:1 (Svärta: 0.31 cd/m²)
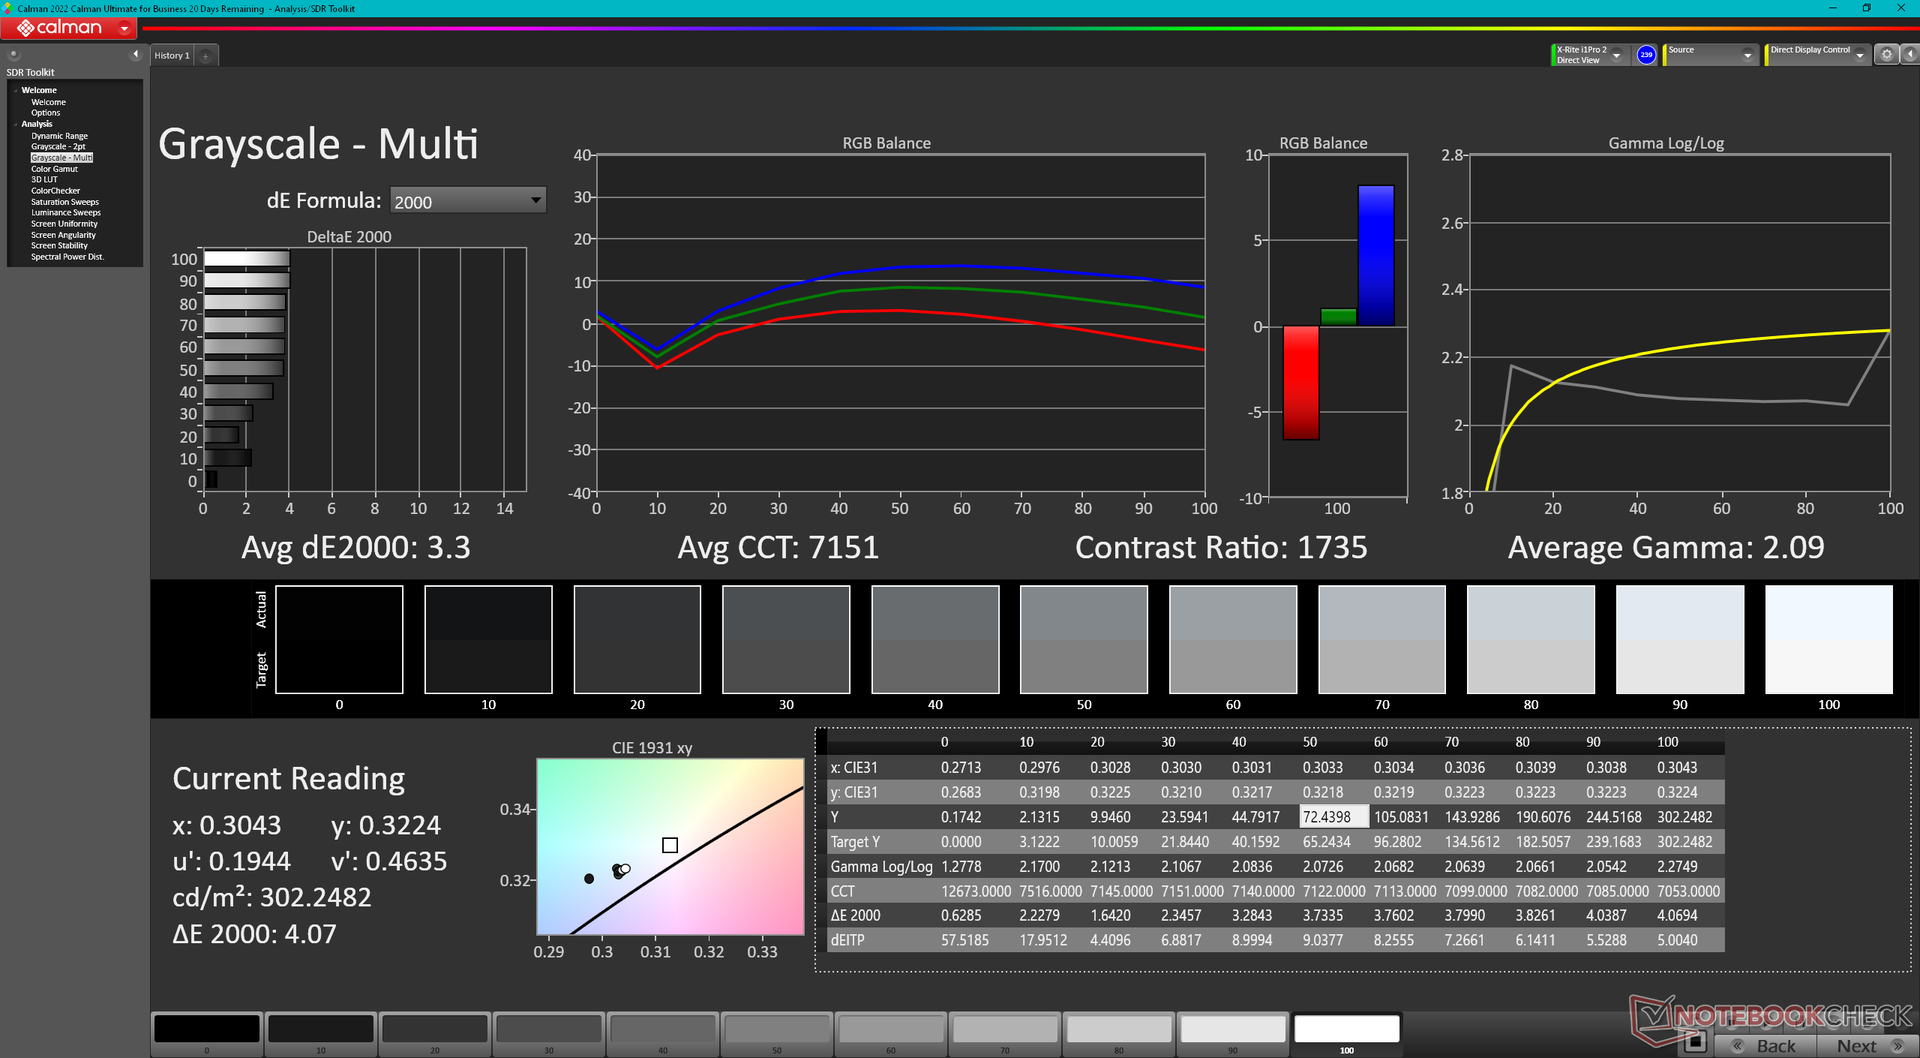
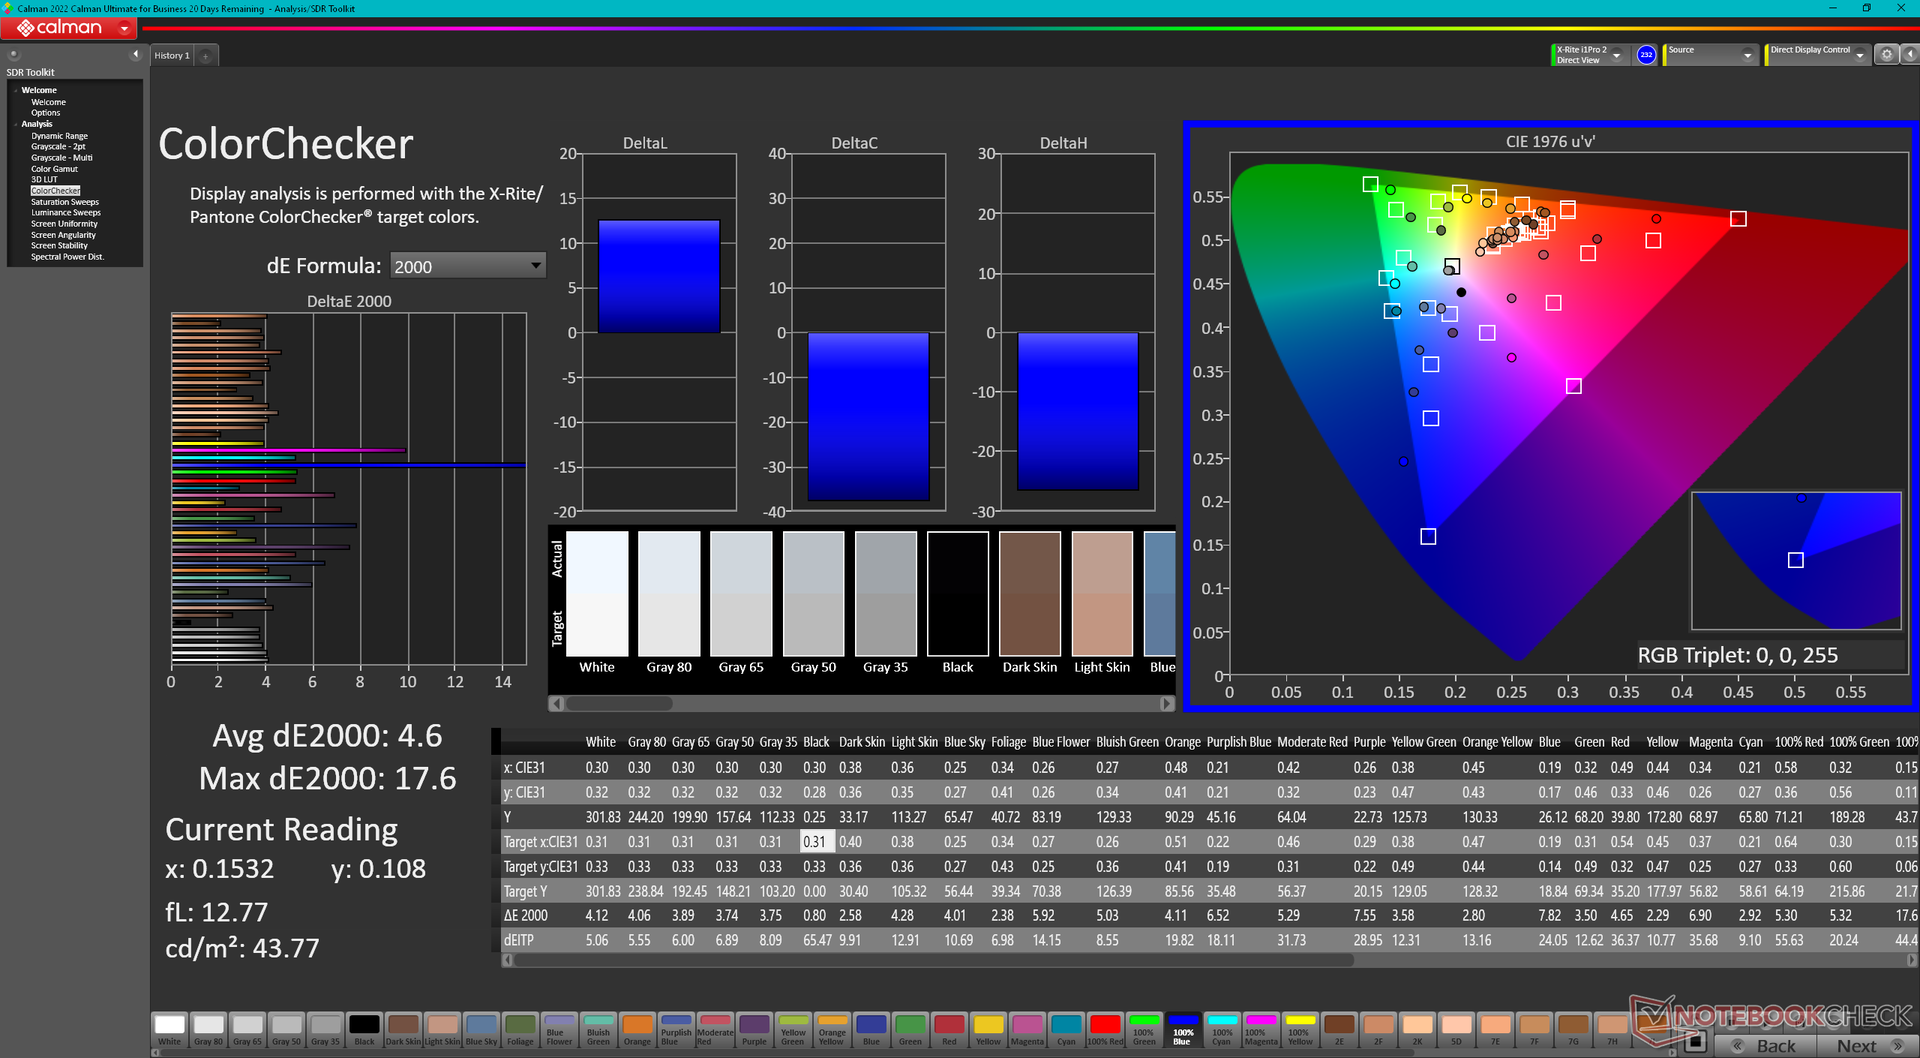
ΔE ColorChecker Calman: 4.6 | ∀{0.5-29.43 Ø4.71}
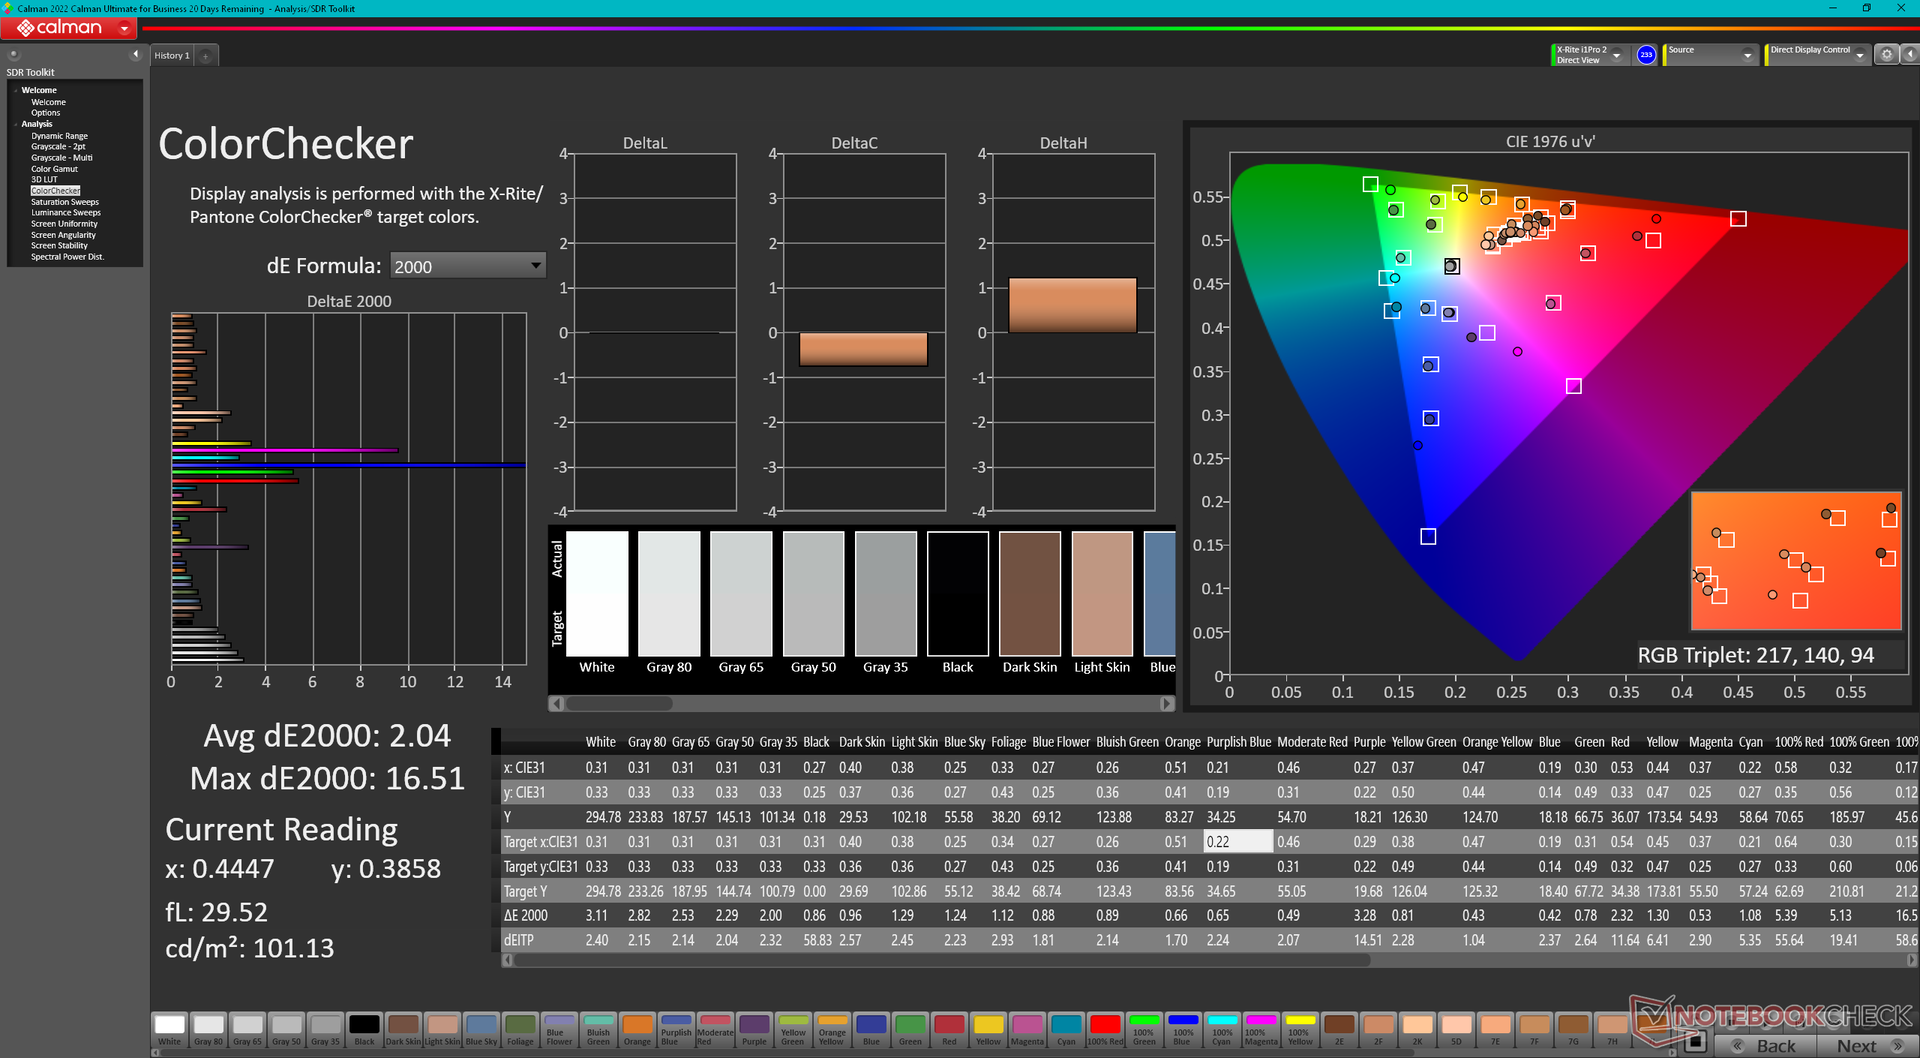
calibrated: 2.04
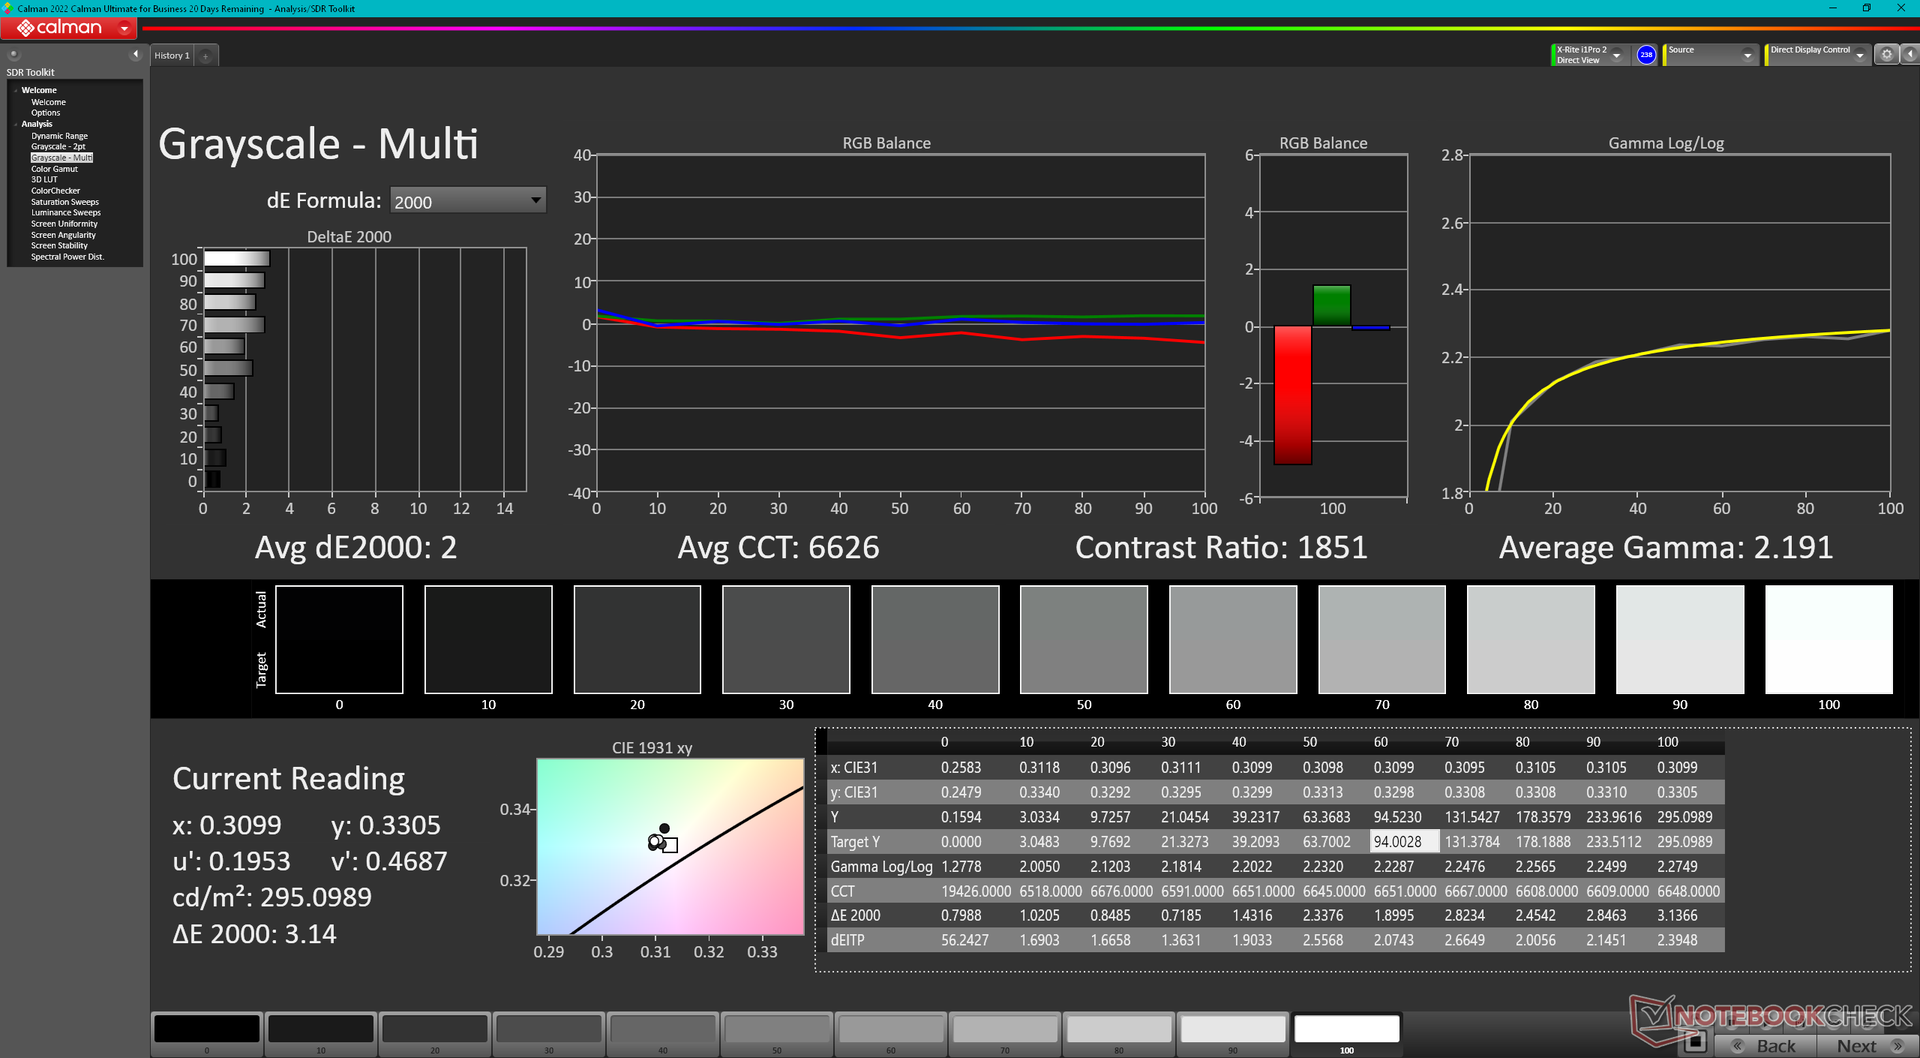
ΔE Greyscale Calman: 3.3 | ∀{0.09-98 Ø4.96}
43% AdobeRGB 1998 (Argyll 3D)
62.2% sRGB (Argyll 3D)
41.6% Display P3 (Argyll 3D)
Gamma: 2.09
CCT: 7151 K
| MSI Raider GE68HX 13VF Chi Mei N160JME-GTK, IPS, 1900x1200, 16" | MSI GE67 HX 12UGS Samsung ATNA562P02-0, OLED, 1920x1080, 15.6" | HP Omen 16-xf0376ng BOE0B81, IPS, 1920x1080, 16.1" | Alienware m16 R1 AMD BOE NE16NZ4, IPS, 2560x1600, 16" | Lenovo Legion Slim 7i 16 Gen 8 CSOT T3 MNG007DA2-3, IPS, 2560x1600, 16" | Asus ROG Zephyrus M16 GU604VY-NM042X BOE0B74 (NE160QDM-NM4, IPS, 2560x1600, 16" | |
|---|---|---|---|---|---|---|
| Display | 64% | 67% | 102% | 66% | 103% | |
| Display P3 Coverage (%) | 41.6 | 71.7 72% | 72.1 73% | 98.6 137% | 70.4 69% | 99.33 139% |
| sRGB Coverage (%) | 62.2 | 89.7 44% | 99.6 60% | 99.9 61% | 99.4 60% | 99.9 61% |
| AdobeRGB 1998 Coverage (%) | 43 | 75.2 75% | 72.3 68% | 88.9 107% | 72.5 69% | 90.01 109% |
| Response Times | 99% | 50% | 67% | 47% | -108% | |
| Response Time Grey 50% / Grey 80% * (ms) | 17.3 ? | 0.25 ? 99% | 12.3 ? 29% | 5.1 ? 71% | 12 ? 31% | 50.8 ? -194% |
| Response Time Black / White * (ms) | 24.2 ? | 0.4 ? 98% | 7.2 ? 70% | 9 ? 63% | 8.9 ? 63% | 29.6 ? -22% |
| PWM Frequency (Hz) | 480.4 ? | 12000 | ||||
| Screen | 17% | 10% | 10% | 34% | 297% | |
| Brightness middle (cd/m²) | 300.9 | 356.1 18% | 350 16% | 329 9% | 474.6 58% | 634 111% |
| Brightness (cd/m²) | 302 | 358 19% | 338 12% | 317 5% | 445 47% | 627 108% |
| Brightness Distribution (%) | 93 | 99 6% | 91 -2% | 89 -4% | 86 -8% | 92 -1% |
| Black Level * (cd/m²) | 0.31 | 0.35 -13% | 0.32 -3% | 0.39 -26% | 0.03 90% | |
| Contrast (:1) | 971 | 1000 3% | 1028 6% | 1217 25% | 21133 2076% | |
| Colorchecker dE 2000 * | 4.6 | 4.83 -5% | 3.29 28% | 3.71 19% | 2.12 54% | 0.89 81% |
| Colorchecker dE 2000 max. * | 17.6 | 7.94 55% | 8.47 52% | 7.23 59% | 4.73 73% | 1.79 90% |
| Colorchecker dE 2000 calibrated * | 2.04 | 2.23 -9% | 2.82 -38% | 0.57 72% | 0.91 55% | |
| Greyscale dE 2000 * | 3.3 | 3.1 6% | 3.2 3% | 2.2 33% | 2.8 15% | 1.13 66% |
| Gamma | 2.09 105% | 2.2 100% | 2.131 103% | 2.3 96% | 2.22 99% | 2.47 89% |
| CCT | 7151 91% | 5938 109% | 6317 103% | 6270 104% | 6542 99% | 6497 100% |
| Totalt genomsnitt (program/inställningar) | 60% /
44% | 42% /
28% | 60% /
38% | 49% /
43% | 97% /
198% |
* ... mindre är bättre
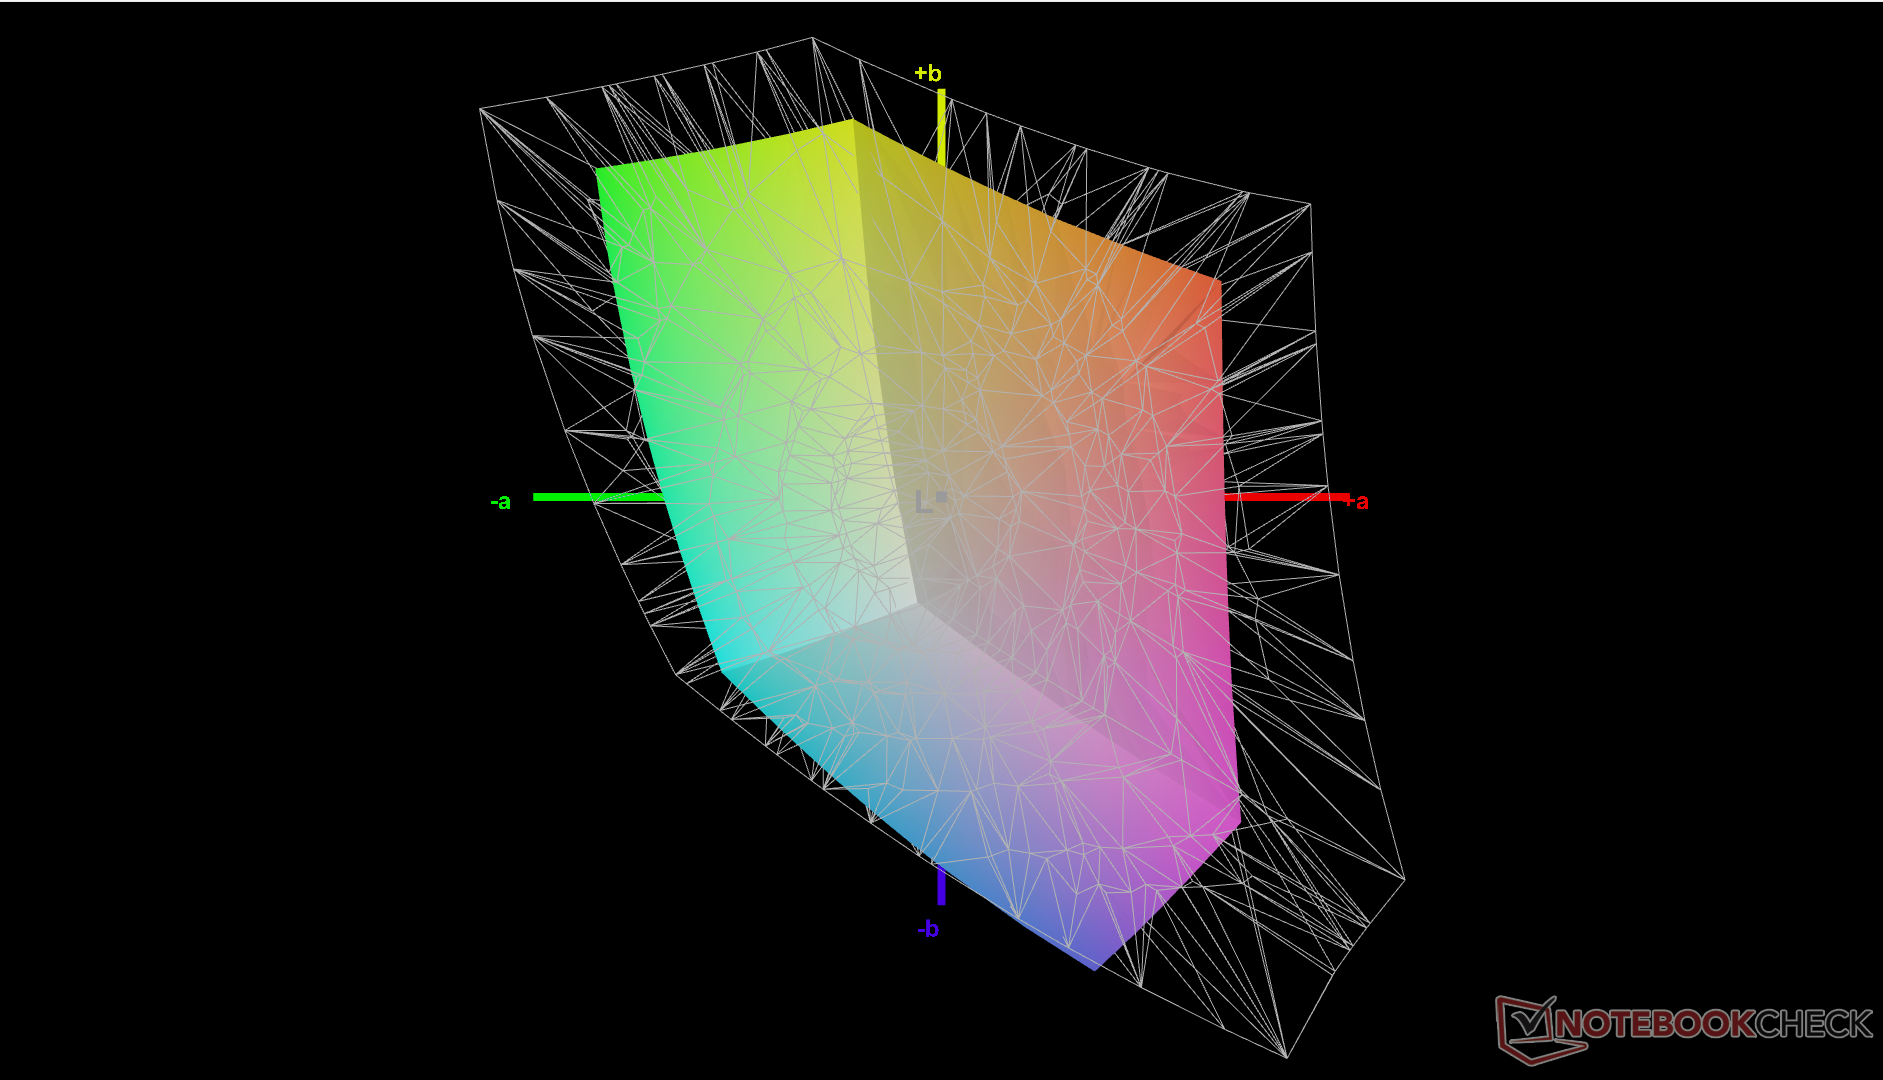
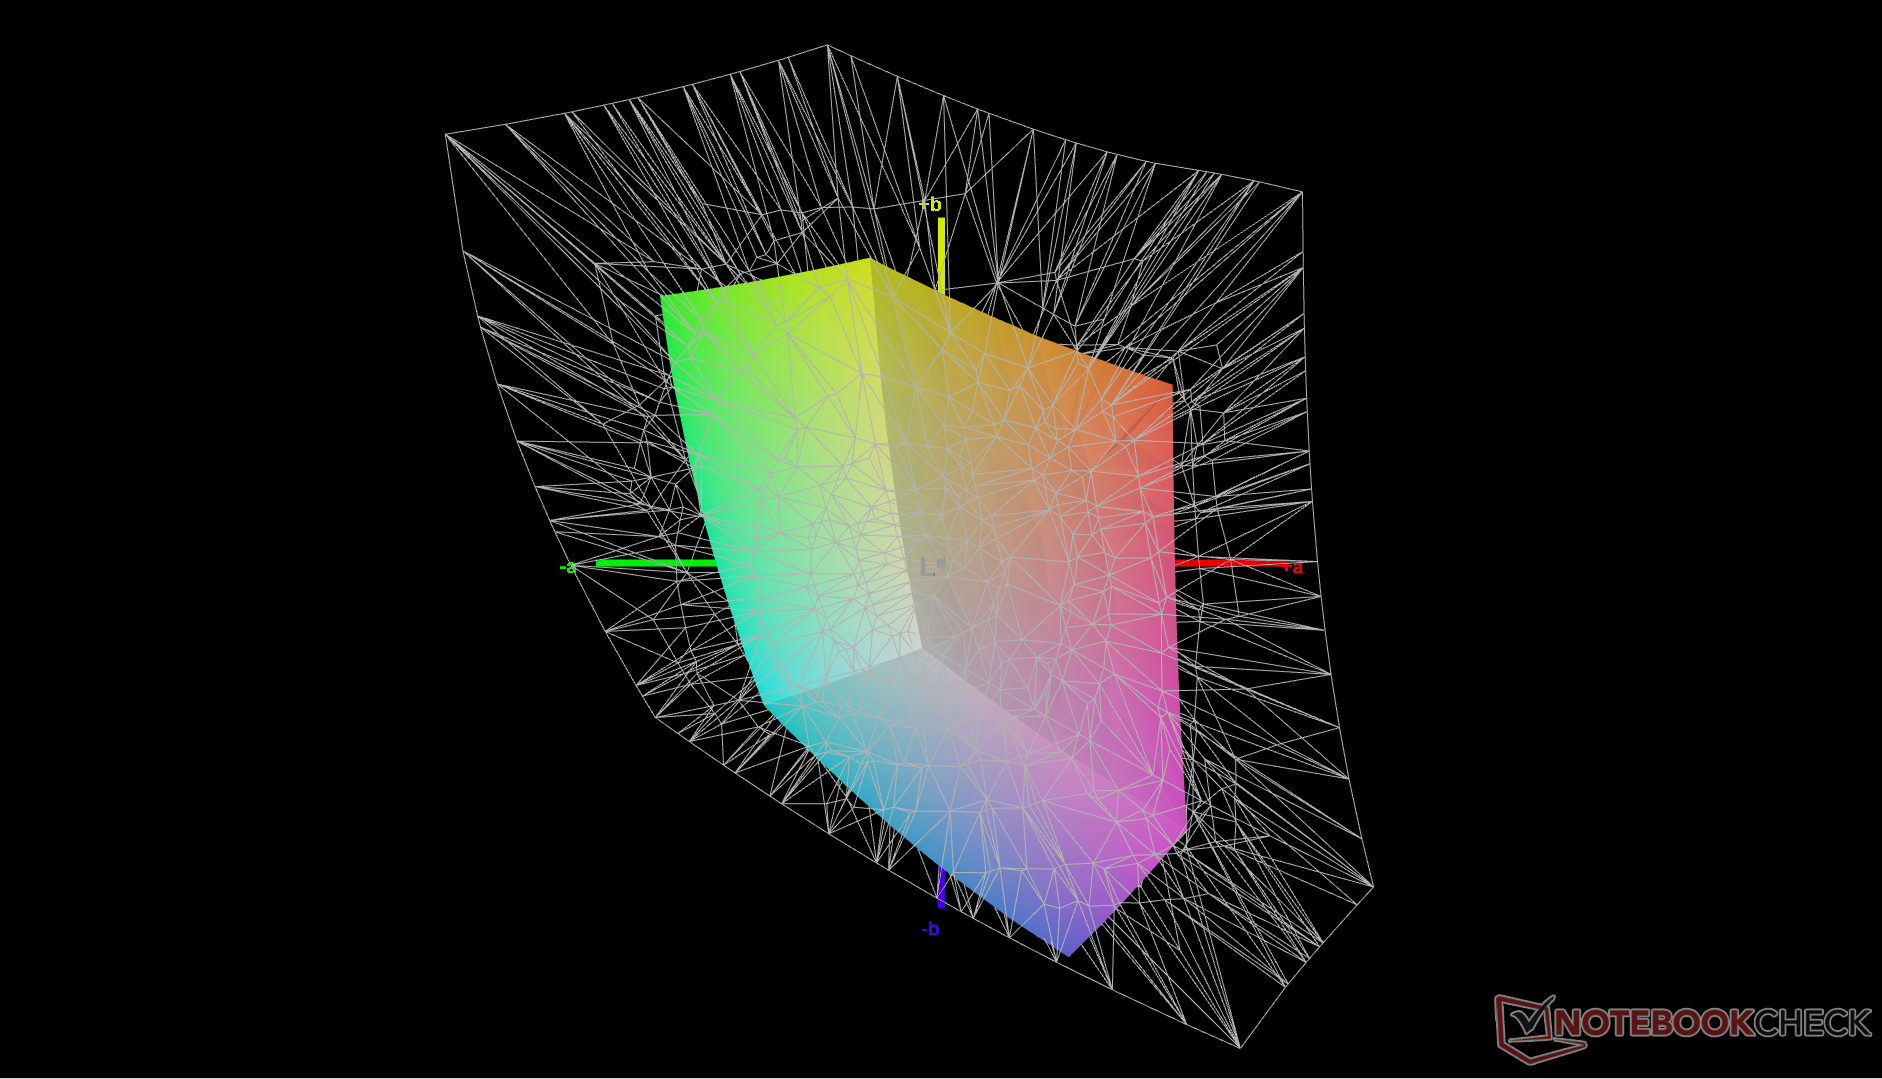
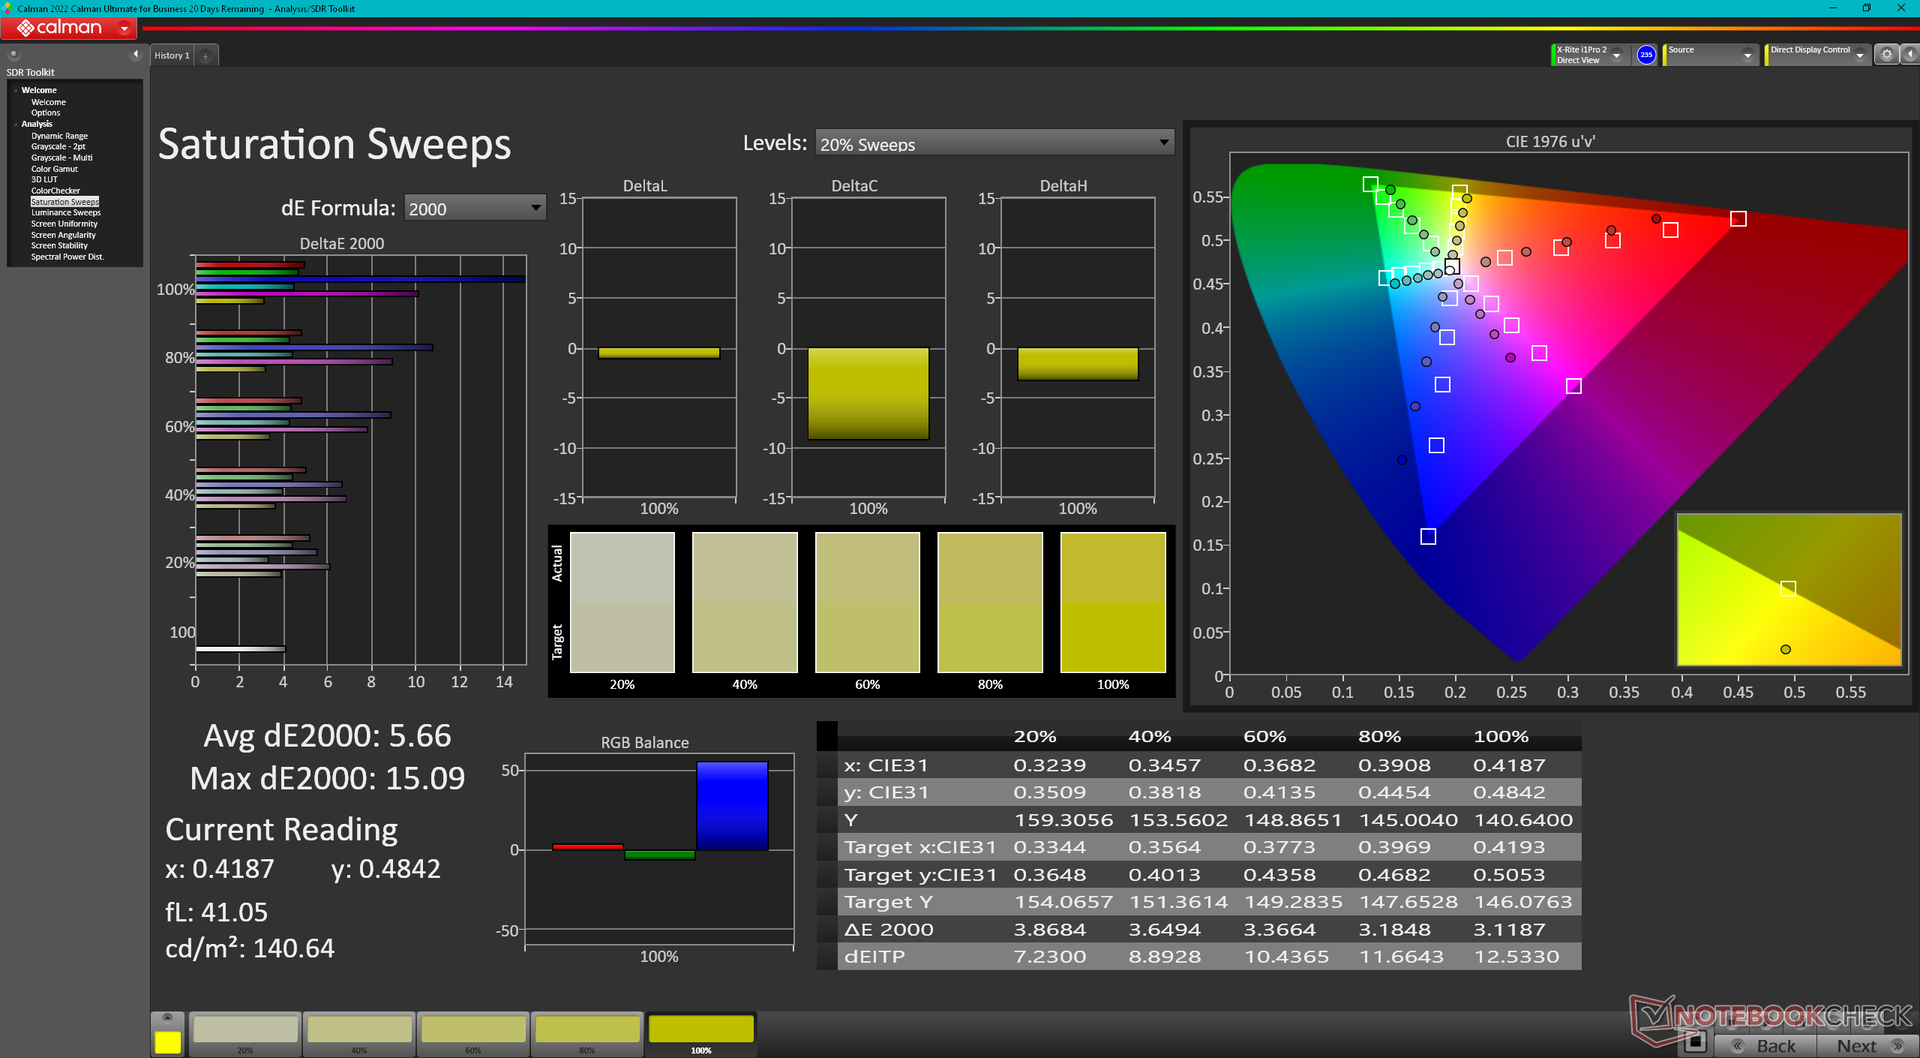
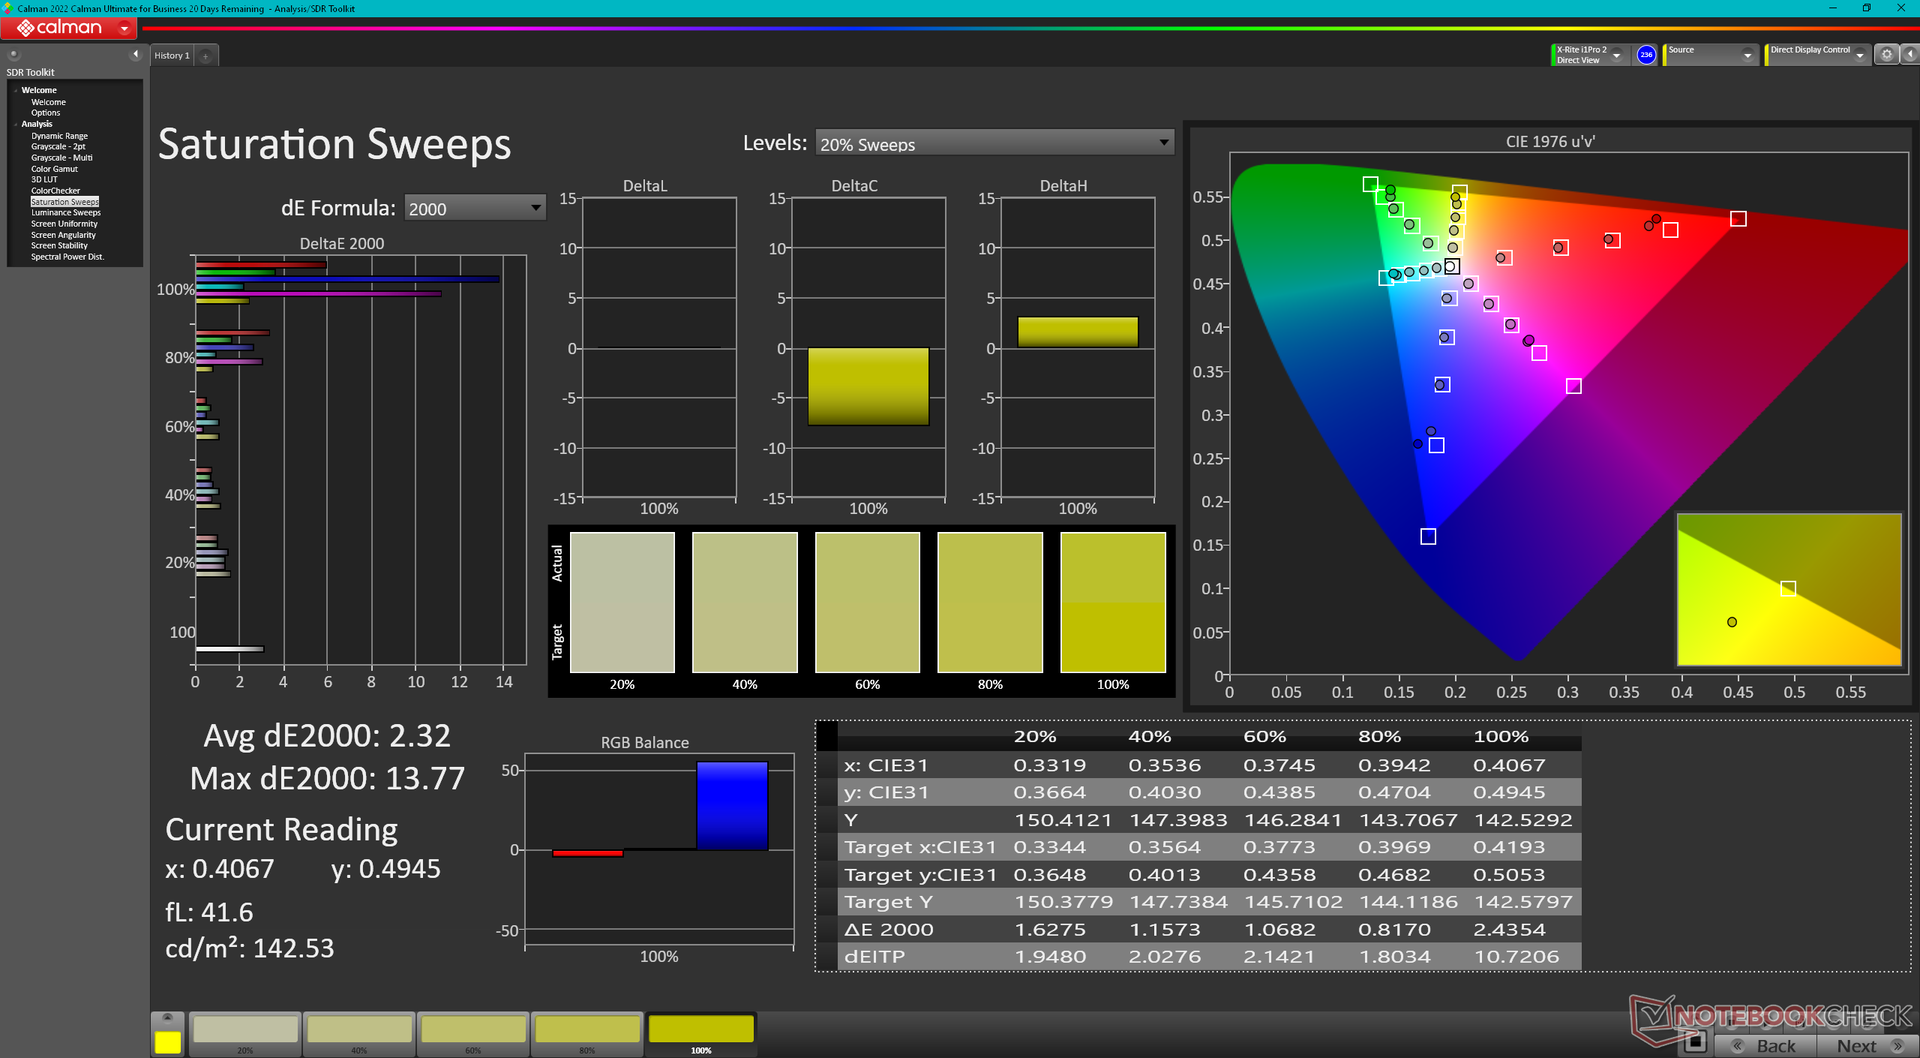
Skärmen levereras inte förkalibrerad, men den genomsnittliga färgnoggrannheten är inte dålig med tanke på omständigheterna. Om vi kalibrerar panelen själva med en X-Rite-kolorimeter förbättras de genomsnittliga DeltaE-värdena för gråskala och färg från 3,3 och 4,6 till bara 2 respektive 2,04. Färgerna skulle fortfarande bli alltmer felaktiga vid högre mättnadsnivåer oavsett hur mycket du kalibrerar den på grund av panelens begränsade färgrymd. Blå är kanske den värsta förövaren eftersom den istället visas som något violett. Vår ICM-profil finns tillgänglig ovan för gratis nedladdning.
Visa svarstider
| ↔ Svarstid svart till vitt | ||
|---|---|---|
| 24.2 ms ... stiga ↗ och falla ↘ kombinerat | ↗ 10.6 ms stiga | 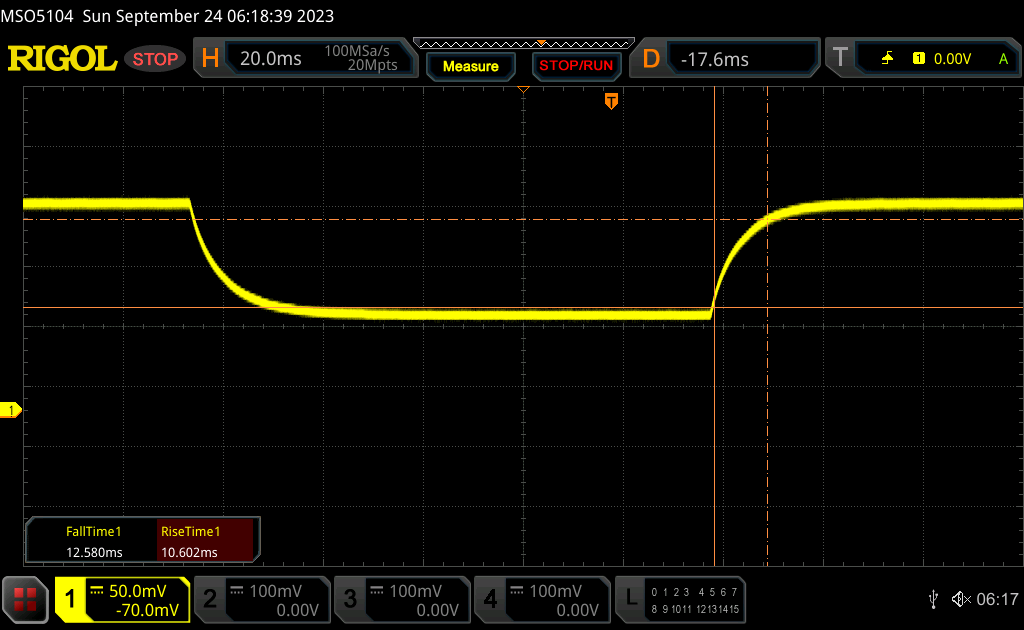 |
| ↘ 12.6 ms hösten | ||
| Skärmen visar bra svarsfrekvens i våra tester, men kan vara för långsam för konkurrenskraftiga spelare. I jämförelse sträcker sig alla testade enheter från 0.1 (minst) till 240 (maximalt) ms. » 57 % av alla enheter är bättre. Detta innebär att den uppmätta svarstiden är sämre än genomsnittet av alla testade enheter (19.8 ms). | ||
| ↔ Svarstid 50 % grått till 80 % grått | ||
| 17.3 ms ... stiga ↗ och falla ↘ kombinerat | ↗ 9.4 ms stiga | 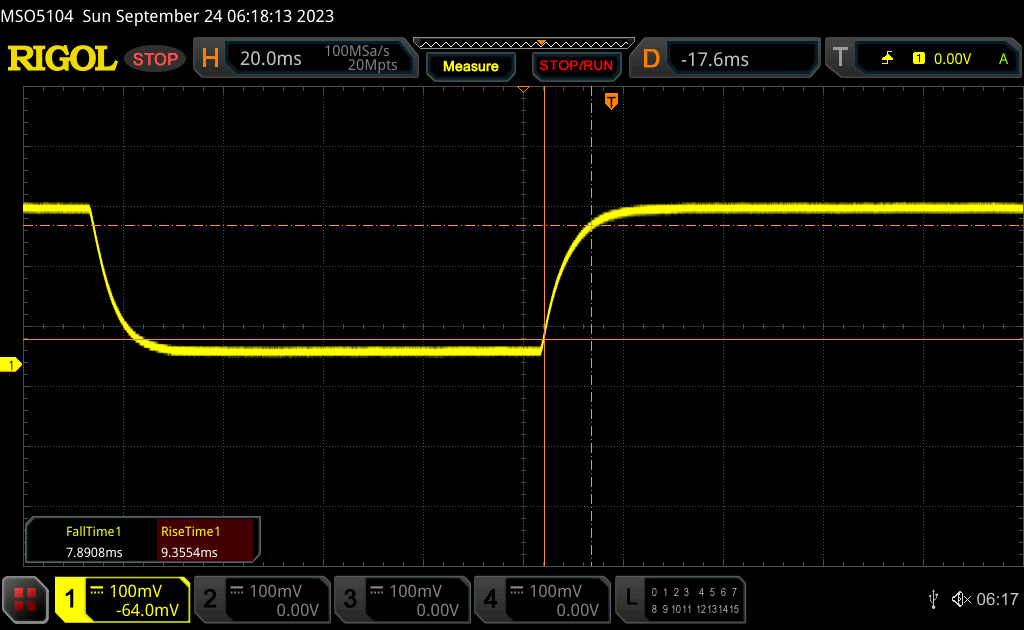 |
| ↘ 7.9 ms hösten | ||
| Skärmen visar bra svarsfrekvens i våra tester, men kan vara för långsam för konkurrenskraftiga spelare. I jämförelse sträcker sig alla testade enheter från 0.165 (minst) till 636 (maximalt) ms. » 32 % av alla enheter är bättre. Det betyder att den uppmätta svarstiden är bättre än genomsnittet av alla testade enheter (31 ms). | ||
Skärmflimmer / PWM (Puls-Width Modulation)
| Skärmflimmer / PWM upptäcktes inte | 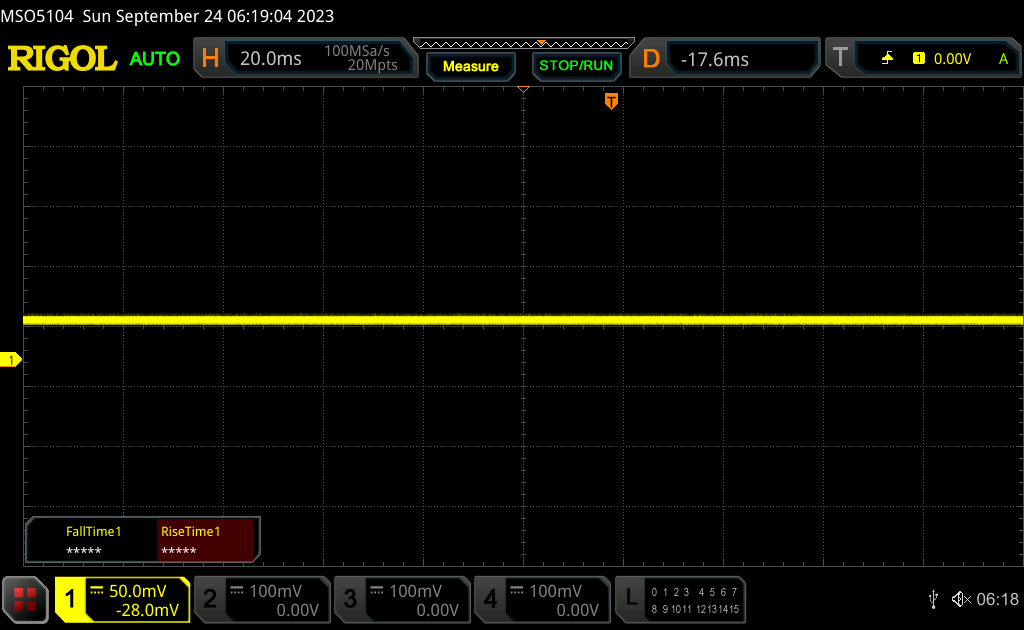 | ||
Som jämförelse: 52 % av alla testade enheter använder inte PWM för att dämpa skärmen. Om PWM upptäcktes mättes ett medelvärde av 7754 (minst: 5 - maximum: 343500) Hz. | |||
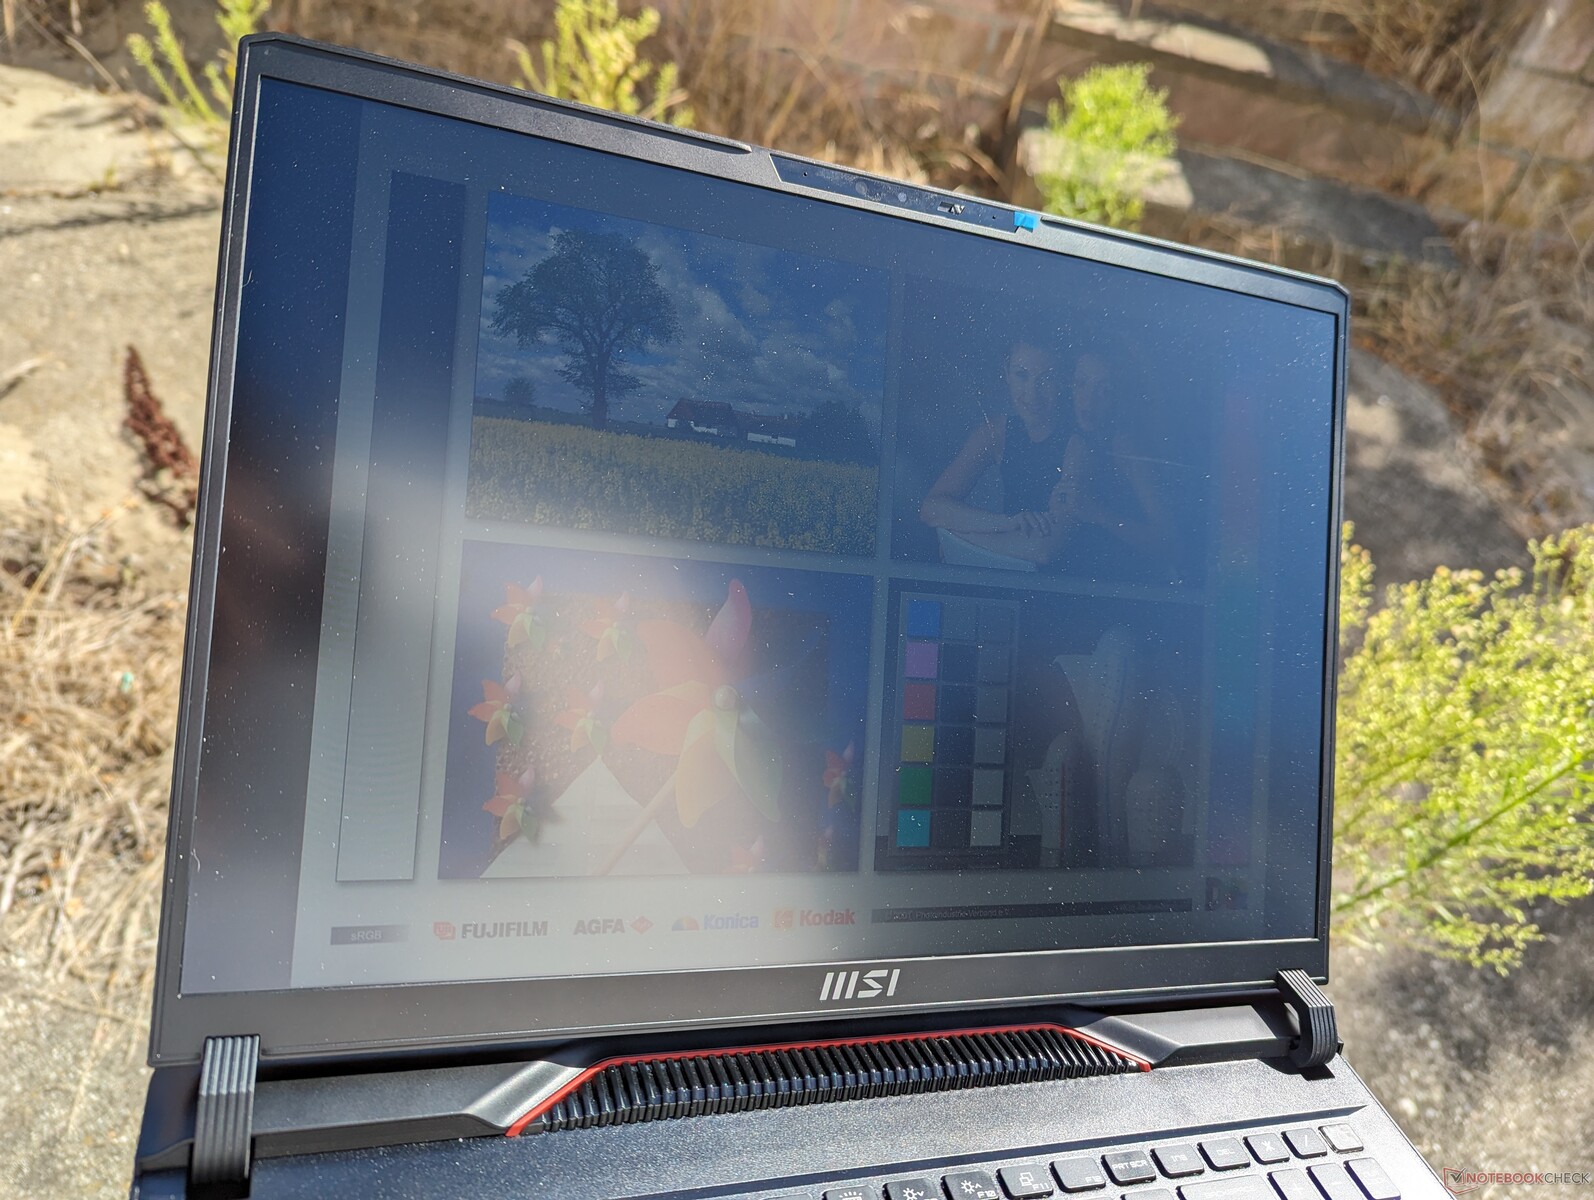
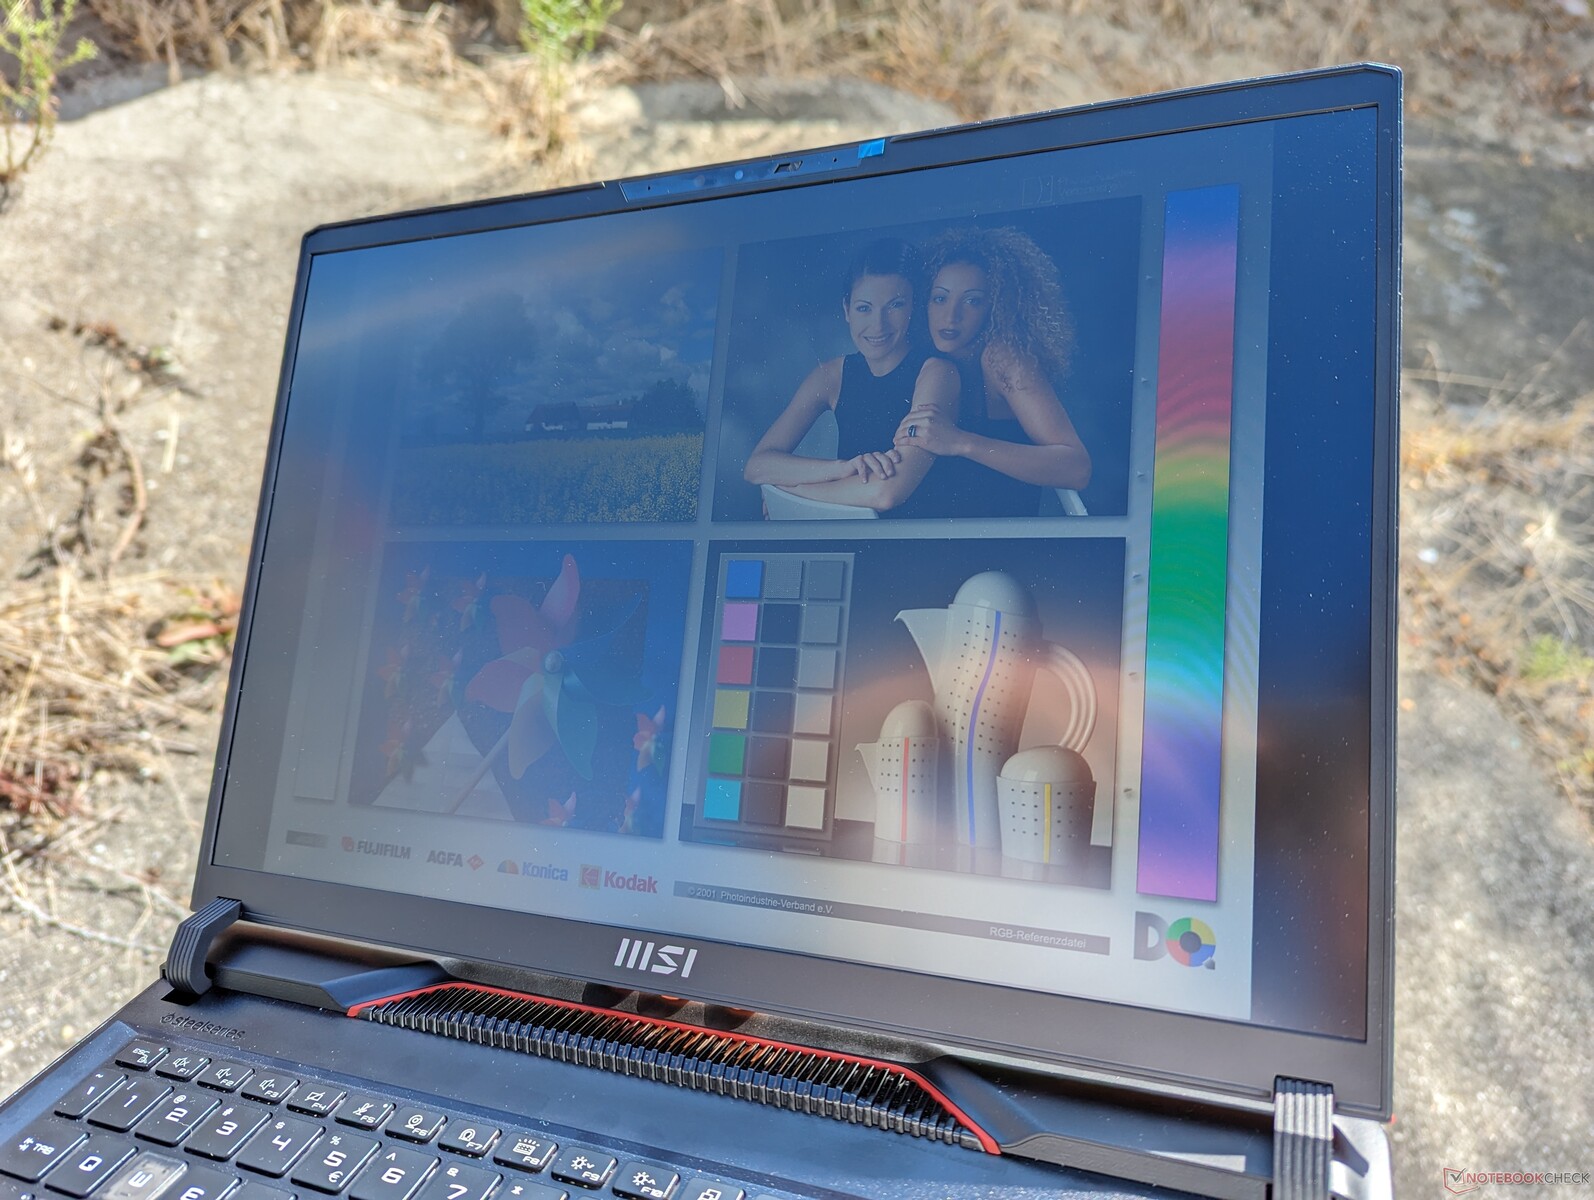
Den maximala ljusstyrkan på 300 nit är typisk för de flesta bärbara speldatorer. Direkt solljus bör undvikas, annars blir färgerna urvattnade. För bättre synlighet utomhus kanske användare istället vill överväga Zephyrus M16 och dess 2x ljusstarkare skärm.
Resultat - Imponerande ökning jämfört med föregående år
Villkor för testning
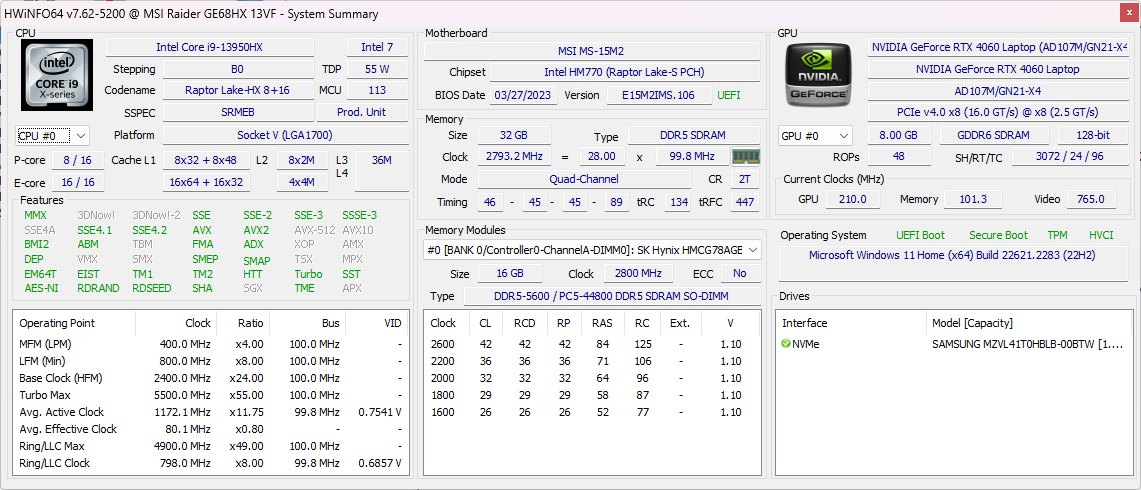
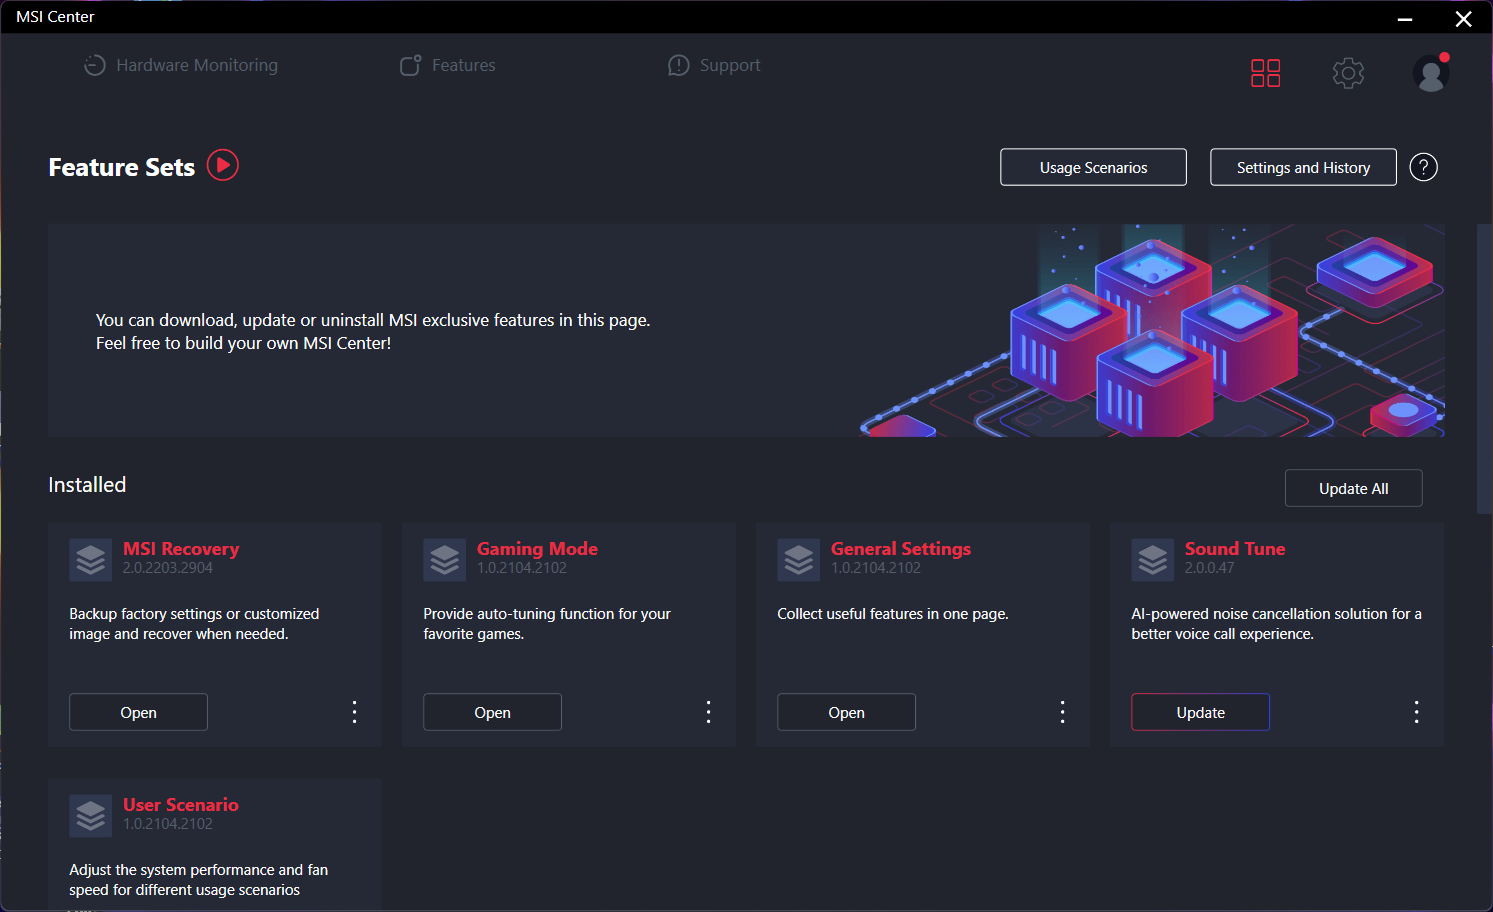
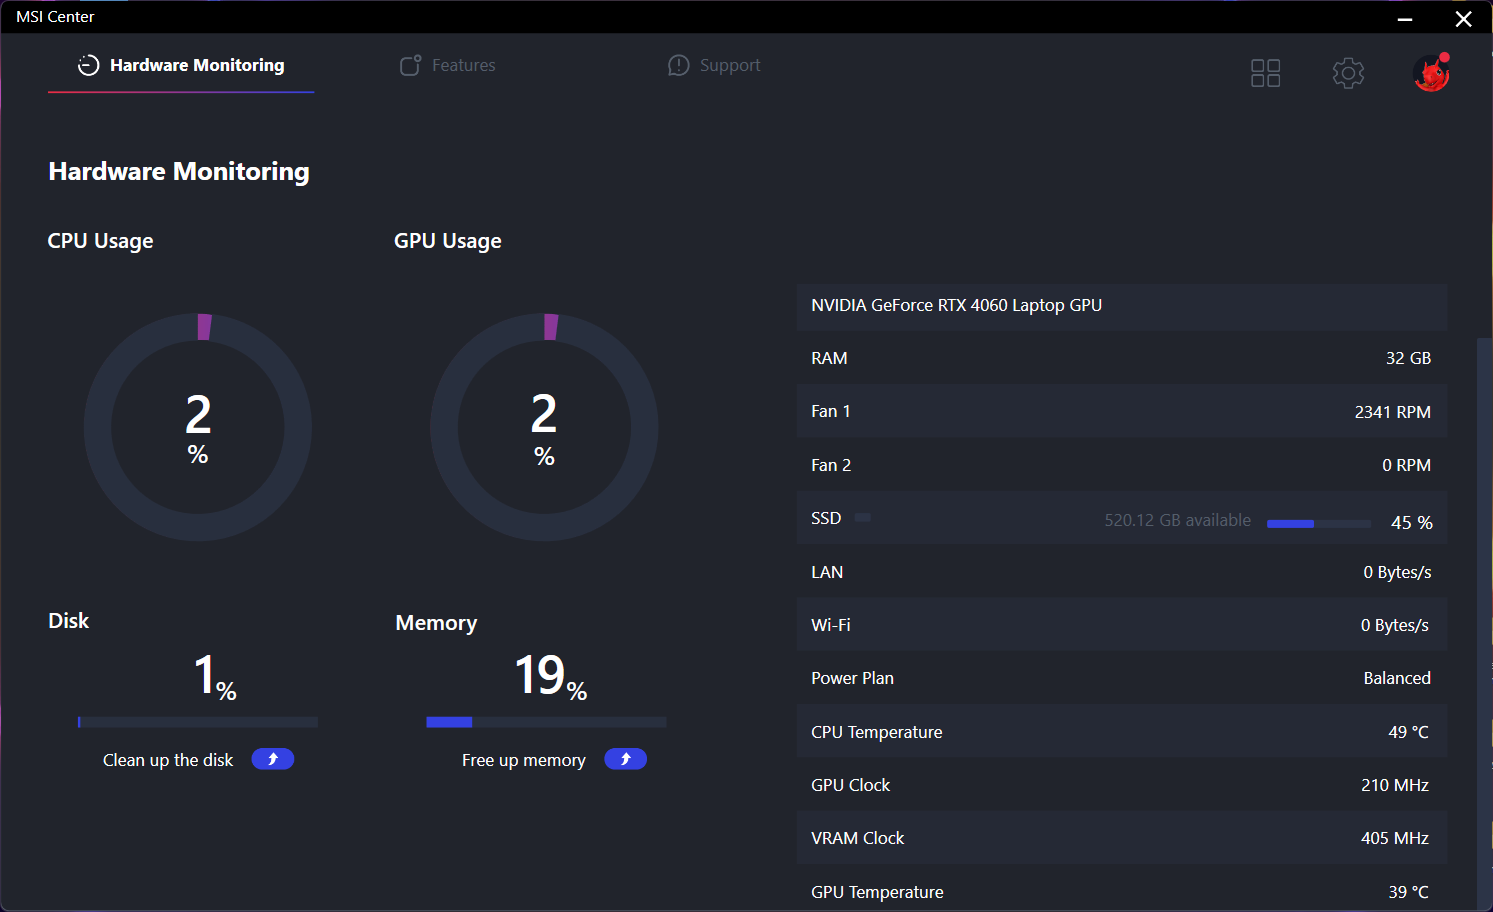
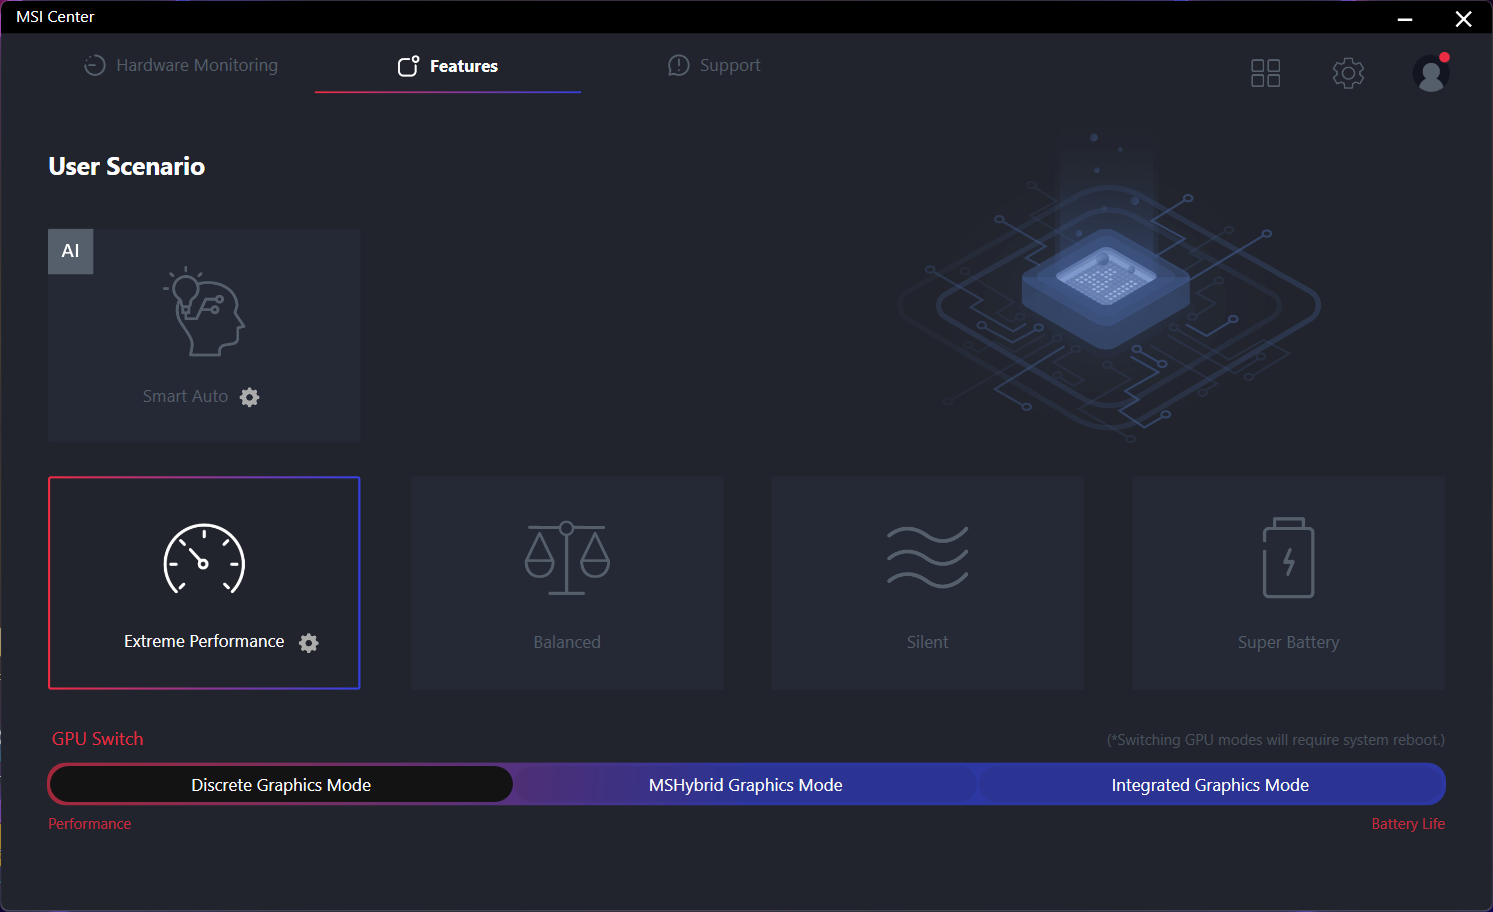
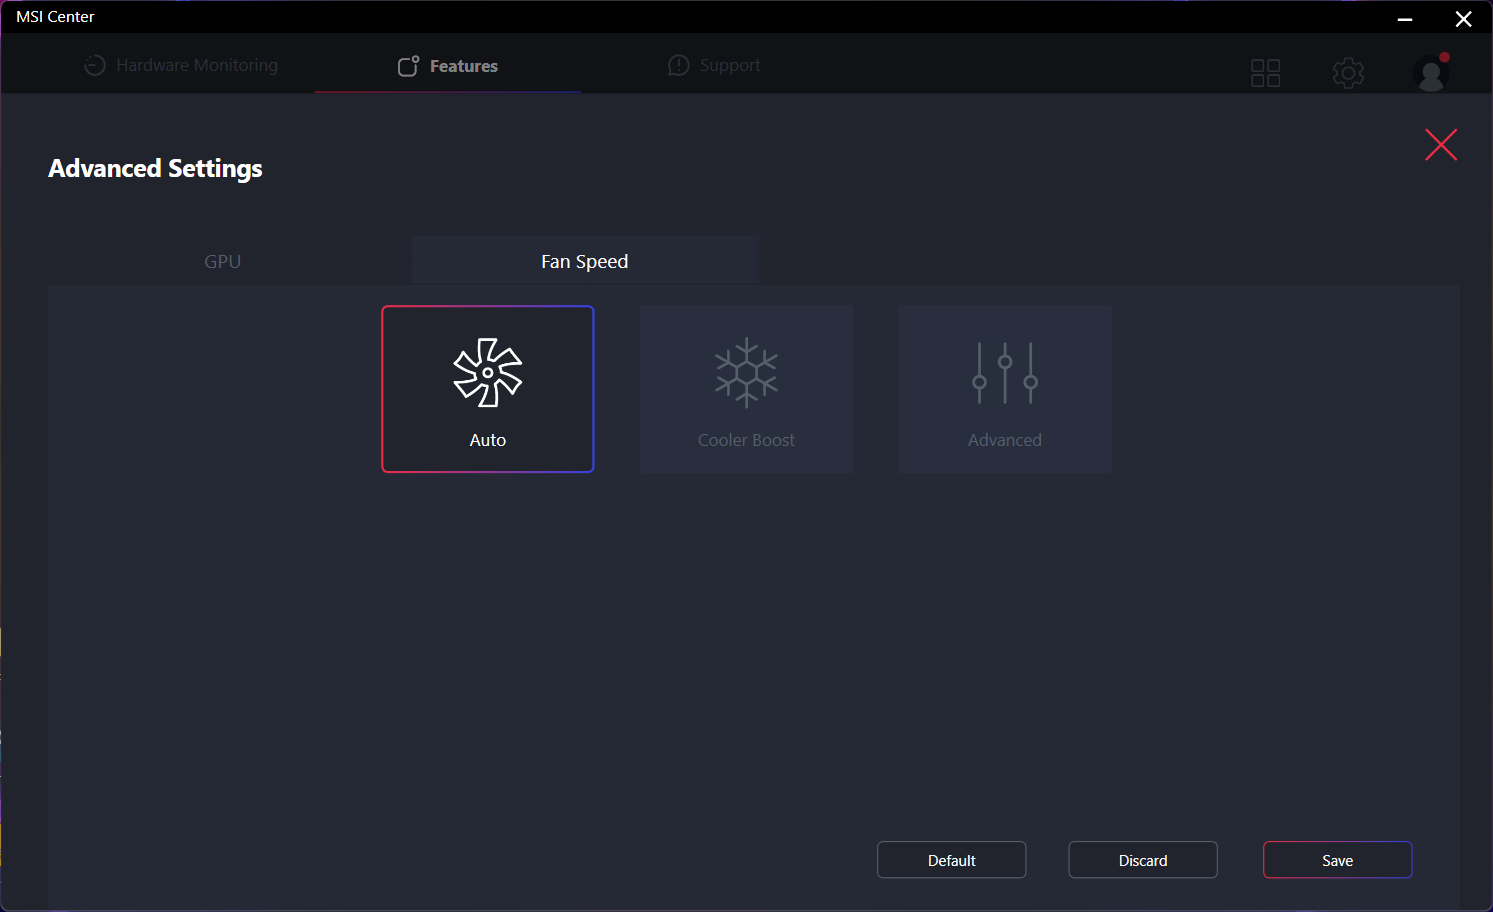
Vi ställde in Windows på Performance-läge och MSI Center på både Extreme Performance-läge och dGPU-läge innan vi körde riktmärkena nedan. MSI Center är kontrollhubben för systemuppdateringar, vitala data, energiprofiler, GPU-lägen och mycket mer. RGB-inställningarna hanteras dock av en separat app som heter SteelSeries GG.
Cooler Boost är en undermenyinställning i läget Extreme Performance. Om du aktiverar den körs de interna fläktarna på maximalt varvtal oavsett belastningen på skärmen.
RTX 4060-konfigurationen stöder MUX men inte Advanced Optimus, vilket innebär att en omstart krävs när man växlar mellan dGPU-, MSHybrid- och iGPU-lägen.
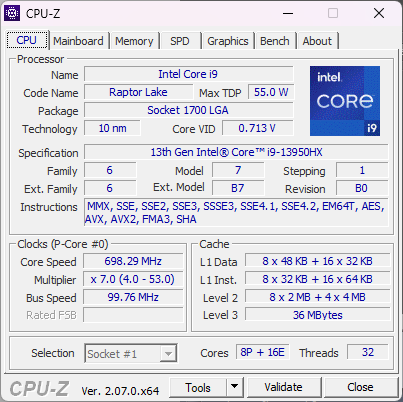
Processor
CPU-prestanda och klockfrekvensstabilitet är utmärkta med resultat som är 5 till 10 procent snabbare än genomsnittetCore i9-13950HX i vår databas eller nästan 2x snabbare än Core i7-13700H som finns i de flesta andra bärbara speldatorer. Detta är en av de snabbaste mobila processorerna på marknaden just nu och den konkurrerar med Zen 4 Ryzen 9 7945HX om de tre översta platserna.
Uppgradering till den dyrare Core i9-13980HX alternativet förväntas bara öka prestandan med cirka 5 procent baserat på vår tid med Alienware m18 R1. Fördelarna är så marginella att vi rekommenderar att du håller dig till Core i9-13950HX för att spara några hundra dollar.
Cinebench R15 Multi Loop
Cinebench R23: Multi Core | Single Core
Cinebench R20: CPU (Multi Core) | CPU (Single Core)
Cinebench R15: CPU Multi 64Bit | CPU Single 64Bit
Blender: v2.79 BMW27 CPU
7-Zip 18.03: 7z b 4 | 7z b 4 -mmt1
Geekbench 5.5: Multi-Core | Single-Core
HWBOT x265 Benchmark v2.2: 4k Preset
LibreOffice : 20 Documents To PDF
R Benchmark 2.5: Overall mean
* ... mindre är bättre
AIDA64: FP32 Ray-Trace | FPU Julia | CPU SHA3 | CPU Queen | FPU SinJulia | FPU Mandel | CPU AES | CPU ZLib | FP64 Ray-Trace | CPU PhotoWorxx
| Performance rating | |
| Alienware m16 R1 AMD | |
| MSI Raider GE68HX 13VF | |
| Genomsnitt Intel Core i9-13950HX | |
| HP Omen 16-xf0376ng | |
| Asus ROG Zephyrus M16 GU604VY-NM042X | |
| Lenovo Legion Slim 7i 16 Gen 8 | |
| MSI GE67 HX 12UGS | |
| AIDA64 / FP32 Ray-Trace | |
| Alienware m16 R1 AMD | |
| MSI Raider GE68HX 13VF | |
| HP Omen 16-xf0376ng | |
| Genomsnitt Intel Core i9-13950HX (17993 - 28957, n=9) | |
| Asus ROG Zephyrus M16 GU604VY-NM042X | |
| Lenovo Legion Slim 7i 16 Gen 8 | |
| MSI GE67 HX 12UGS | |
| AIDA64 / FPU Julia | |
| Alienware m16 R1 AMD | |
| MSI Raider GE68HX 13VF | |
| Genomsnitt Intel Core i9-13950HX (89362 - 144303, n=9) | |
| HP Omen 16-xf0376ng | |
| Asus ROG Zephyrus M16 GU604VY-NM042X | |
| Lenovo Legion Slim 7i 16 Gen 8 | |
| MSI GE67 HX 12UGS | |
| AIDA64 / CPU SHA3 | |
| Alienware m16 R1 AMD | |
| MSI Raider GE68HX 13VF | |
| Genomsnitt Intel Core i9-13950HX (4518 - 7093, n=9) | |
| HP Omen 16-xf0376ng | |
| Asus ROG Zephyrus M16 GU604VY-NM042X | |
| MSI GE67 HX 12UGS | |
| Lenovo Legion Slim 7i 16 Gen 8 | |
| AIDA64 / CPU Queen | |
| Alienware m16 R1 AMD | |
| MSI Raider GE68HX 13VF | |
| Genomsnitt Intel Core i9-13950HX (131931 - 140103, n=8) | |
| Lenovo Legion Slim 7i 16 Gen 8 | |
| Asus ROG Zephyrus M16 GU604VY-NM042X | |
| HP Omen 16-xf0376ng | |
| MSI GE67 HX 12UGS | |
| AIDA64 / FPU SinJulia | |
| Alienware m16 R1 AMD | |
| MSI Raider GE68HX 13VF | |
| HP Omen 16-xf0376ng | |
| Genomsnitt Intel Core i9-13950HX (12318 - 17057, n=9) | |
| MSI GE67 HX 12UGS | |
| Asus ROG Zephyrus M16 GU604VY-NM042X | |
| Lenovo Legion Slim 7i 16 Gen 8 | |
| AIDA64 / FPU Mandel | |
| Alienware m16 R1 AMD | |
| MSI Raider GE68HX 13VF | |
| HP Omen 16-xf0376ng | |
| Genomsnitt Intel Core i9-13950HX (44372 - 71038, n=9) | |
| Asus ROG Zephyrus M16 GU604VY-NM042X | |
| Lenovo Legion Slim 7i 16 Gen 8 | |
| MSI GE67 HX 12UGS | |
| AIDA64 / CPU AES | |
| Genomsnitt Intel Core i9-13950HX (99981 - 204491, n=9) | |
| MSI Raider GE68HX 13VF | |
| MSI GE67 HX 12UGS | |
| Alienware m16 R1 AMD | |
| Asus ROG Zephyrus M16 GU604VY-NM042X | |
| Lenovo Legion Slim 7i 16 Gen 8 | |
| HP Omen 16-xf0376ng | |
| AIDA64 / CPU ZLib | |
| MSI Raider GE68HX 13VF | |
| Alienware m16 R1 AMD | |
| Genomsnitt Intel Core i9-13950HX (1263 - 2069, n=9) | |
| MSI GE67 HX 12UGS | |
| Lenovo Legion Slim 7i 16 Gen 8 | |
| Asus ROG Zephyrus M16 GU604VY-NM042X | |
| HP Omen 16-xf0376ng | |
| AIDA64 / FP64 Ray-Trace | |
| Alienware m16 R1 AMD | |
| MSI Raider GE68HX 13VF | |
| HP Omen 16-xf0376ng | |
| Genomsnitt Intel Core i9-13950HX (9649 - 15573, n=9) | |
| Asus ROG Zephyrus M16 GU604VY-NM042X | |
| Lenovo Legion Slim 7i 16 Gen 8 | |
| MSI GE67 HX 12UGS | |
| AIDA64 / CPU PhotoWorxx | |
| MSI Raider GE68HX 13VF | |
| Asus ROG Zephyrus M16 GU604VY-NM042X | |
| Genomsnitt Intel Core i9-13950HX (40233 - 50864, n=9) | |
| HP Omen 16-xf0376ng | |
| MSI GE67 HX 12UGS | |
| Alienware m16 R1 AMD | |
| Lenovo Legion Slim 7i 16 Gen 8 | |
Systemets prestanda
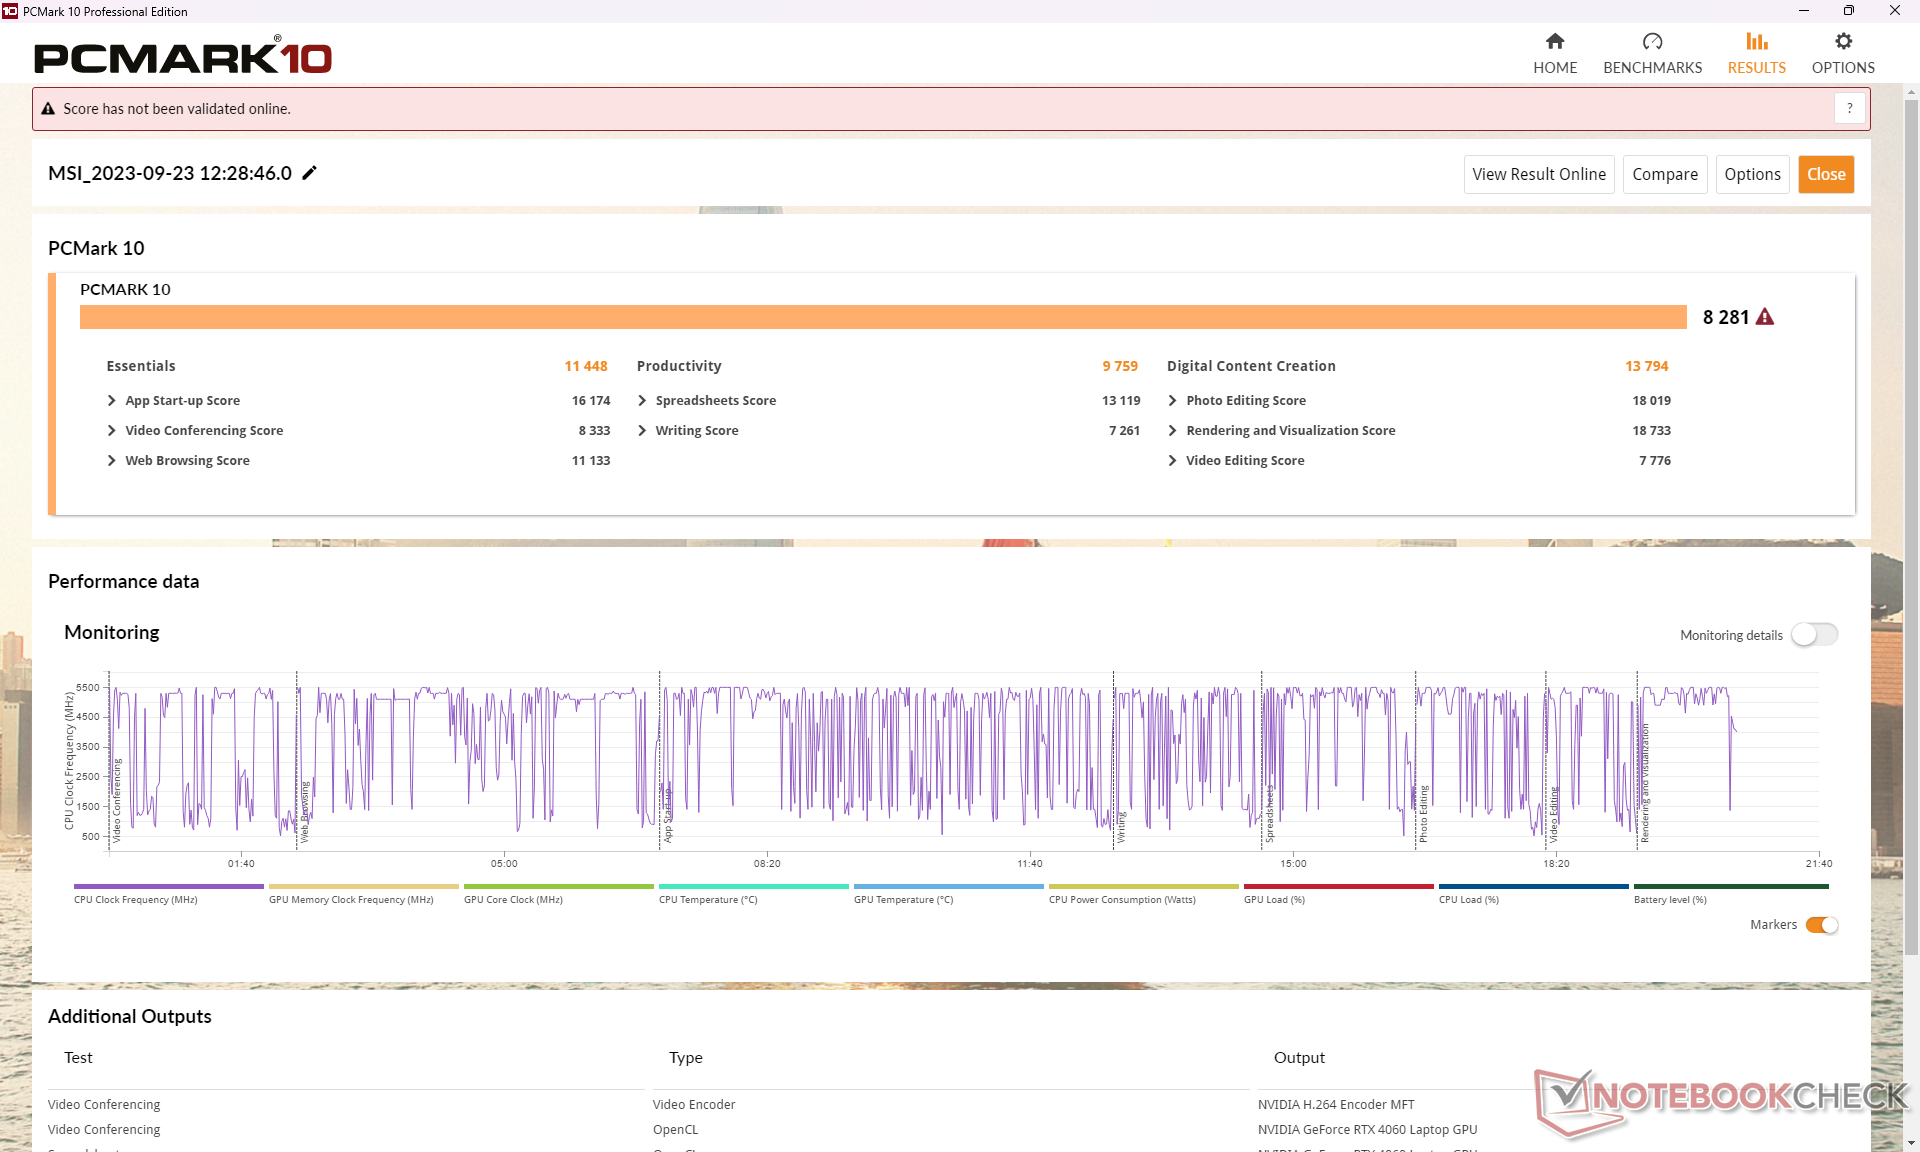
PCMark-riktmärken är jämförbara med andra 16-tums bärbara datorer för spel som Alienware m16 R1 eller Lenovo Legion Slim 7i 16 med bara några få procentenheter. Vi upplevde inga problem med att väcka från viloläge eller andra anmärkningsvärda problem med vår testenhet under testningen.
CrossMark: Overall | Productivity | Creativity | Responsiveness
| PCMark 10 / Score | |
| Alienware m16 R1 AMD | |
| Lenovo Legion Slim 7i 16 Gen 8 | |
| MSI Raider GE68HX 13VF | |
| Genomsnitt Intel Core i9-13950HX, NVIDIA GeForce RTX 4060 Laptop GPU (n=1) | |
| Asus ROG Zephyrus M16 GU604VY-NM042X | |
| HP Omen 16-xf0376ng | |
| MSI GE67 HX 12UGS | |
| PCMark 10 / Essentials | |
| Asus ROG Zephyrus M16 GU604VY-NM042X | |
| Alienware m16 R1 AMD | |
| MSI Raider GE68HX 13VF | |
| Genomsnitt Intel Core i9-13950HX, NVIDIA GeForce RTX 4060 Laptop GPU (n=1) | |
| Lenovo Legion Slim 7i 16 Gen 8 | |
| HP Omen 16-xf0376ng | |
| MSI GE67 HX 12UGS | |
| PCMark 10 / Productivity | |
| Asus ROG Zephyrus M16 GU604VY-NM042X | |
| Lenovo Legion Slim 7i 16 Gen 8 | |
| Alienware m16 R1 AMD | |
| HP Omen 16-xf0376ng | |
| MSI GE67 HX 12UGS | |
| MSI Raider GE68HX 13VF | |
| Genomsnitt Intel Core i9-13950HX, NVIDIA GeForce RTX 4060 Laptop GPU (n=1) | |
| PCMark 10 / Digital Content Creation | |
| Alienware m16 R1 AMD | |
| MSI Raider GE68HX 13VF | |
| Genomsnitt Intel Core i9-13950HX, NVIDIA GeForce RTX 4060 Laptop GPU (n=1) | |
| Lenovo Legion Slim 7i 16 Gen 8 | |
| HP Omen 16-xf0376ng | |
| MSI GE67 HX 12UGS | |
| Asus ROG Zephyrus M16 GU604VY-NM042X | |
| CrossMark / Overall | |
| Alienware m16 R1 AMD | |
| Lenovo Legion Slim 7i 16 Gen 8 | |
| MSI GE67 HX 12UGS | |
| Asus ROG Zephyrus M16 GU604VY-NM042X | |
| MSI Raider GE68HX 13VF | |
| Genomsnitt Intel Core i9-13950HX, NVIDIA GeForce RTX 4060 Laptop GPU (n=1) | |
| CrossMark / Productivity | |
| Lenovo Legion Slim 7i 16 Gen 8 | |
| Alienware m16 R1 AMD | |
| MSI GE67 HX 12UGS | |
| Asus ROG Zephyrus M16 GU604VY-NM042X | |
| MSI Raider GE68HX 13VF | |
| Genomsnitt Intel Core i9-13950HX, NVIDIA GeForce RTX 4060 Laptop GPU (n=1) | |
| CrossMark / Creativity | |
| MSI Raider GE68HX 13VF | |
| Genomsnitt Intel Core i9-13950HX, NVIDIA GeForce RTX 4060 Laptop GPU (n=1) | |
| Asus ROG Zephyrus M16 GU604VY-NM042X | |
| Alienware m16 R1 AMD | |
| MSI GE67 HX 12UGS | |
| Lenovo Legion Slim 7i 16 Gen 8 | |
| CrossMark / Responsiveness | |
| MSI GE67 HX 12UGS | |
| Lenovo Legion Slim 7i 16 Gen 8 | |
| Alienware m16 R1 AMD | |
| Asus ROG Zephyrus M16 GU604VY-NM042X | |
| MSI Raider GE68HX 13VF | |
| Genomsnitt Intel Core i9-13950HX, NVIDIA GeForce RTX 4060 Laptop GPU (n=1) | |
| PCMark 10 Score | 8281 poäng | |
Hjälp | ||
| AIDA64 / Memory Copy | |
| MSI Raider GE68HX 13VF | |
| Genomsnitt Intel Core i9-13950HX (61938 - 78813, n=9) | |
| Asus ROG Zephyrus M16 GU604VY-NM042X | |
| HP Omen 16-xf0376ng | |
| MSI GE67 HX 12UGS | |
| Alienware m16 R1 AMD | |
| Lenovo Legion Slim 7i 16 Gen 8 | |
| AIDA64 / Memory Read | |
| MSI Raider GE68HX 13VF | |
| Genomsnitt Intel Core i9-13950HX (62368 - 86831, n=9) | |
| Asus ROG Zephyrus M16 GU604VY-NM042X | |
| HP Omen 16-xf0376ng | |
| MSI GE67 HX 12UGS | |
| Alienware m16 R1 AMD | |
| Lenovo Legion Slim 7i 16 Gen 8 | |
| AIDA64 / Memory Write | |
| HP Omen 16-xf0376ng | |
| MSI Raider GE68HX 13VF | |
| Genomsnitt Intel Core i9-13950HX (59501 - 80441, n=9) | |
| Asus ROG Zephyrus M16 GU604VY-NM042X | |
| MSI GE67 HX 12UGS | |
| Alienware m16 R1 AMD | |
| Lenovo Legion Slim 7i 16 Gen 8 | |
| AIDA64 / Memory Latency | |
| MSI GE67 HX 12UGS | |
| Alienware m16 R1 AMD | |
| HP Omen 16-xf0376ng | |
| Genomsnitt Intel Core i9-13950HX (84.4 - 99.5, n=9) | |
| Asus ROG Zephyrus M16 GU604VY-NM042X | |
| MSI Raider GE68HX 13VF | |
| Lenovo Legion Slim 7i 16 Gen 8 | |
* ... mindre är bättre
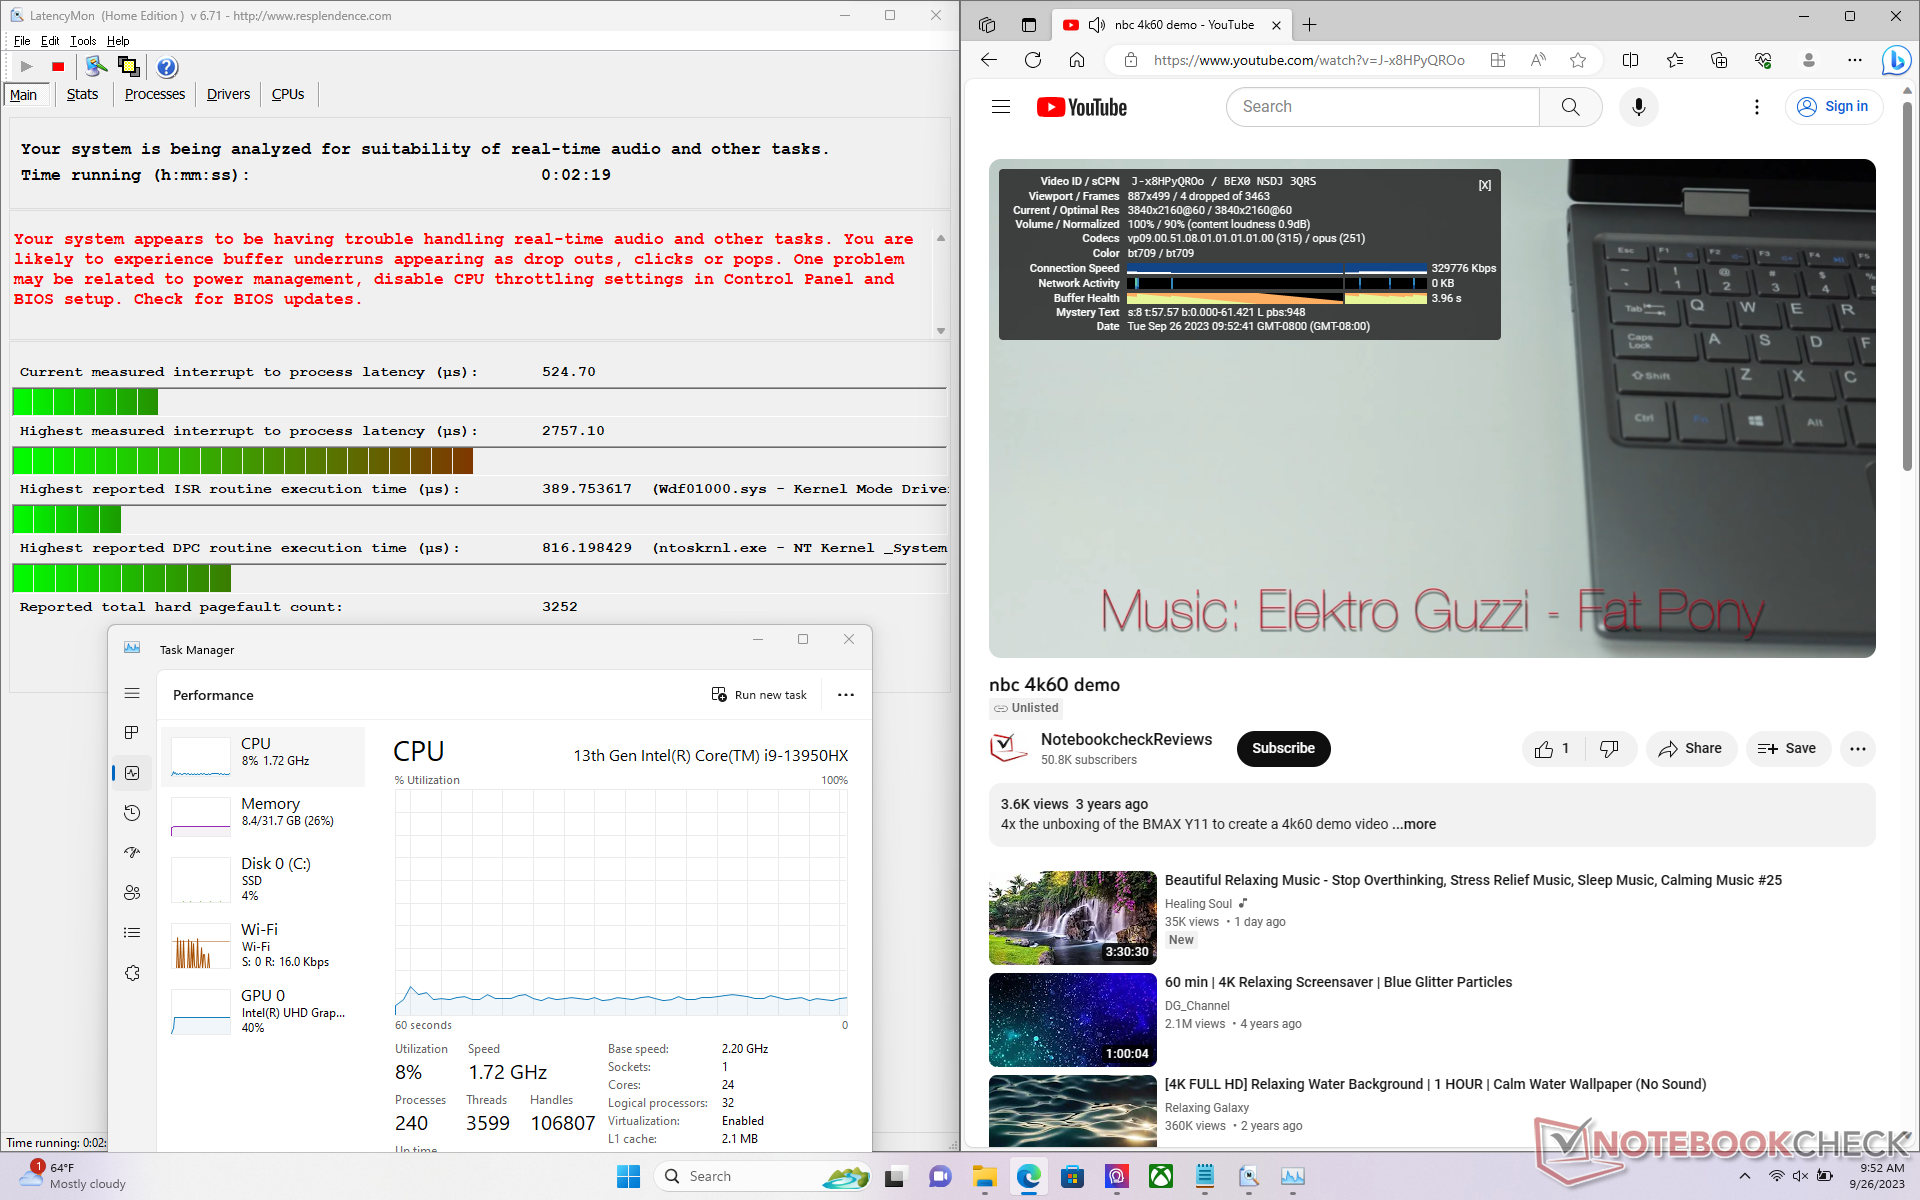
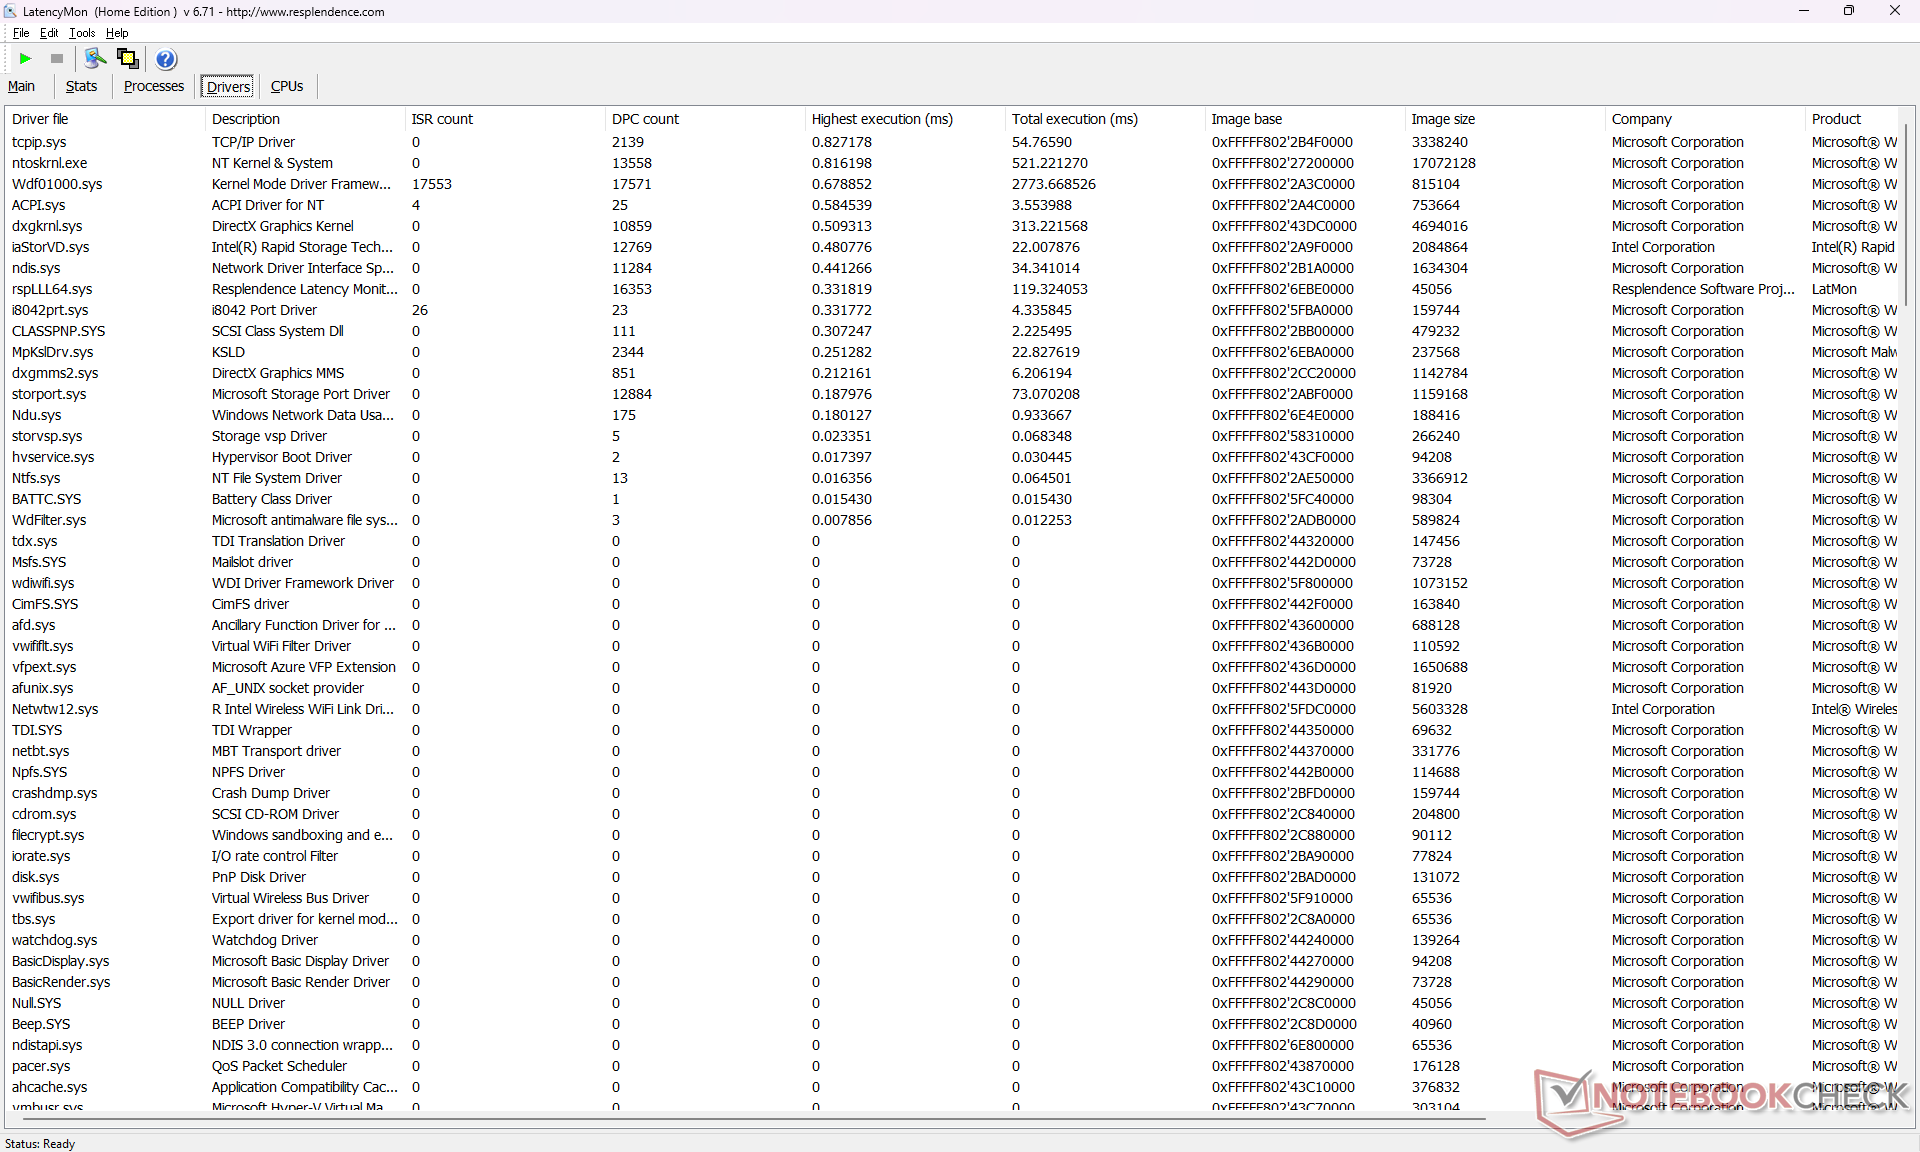
DPC-fördröjning
LatencyMon avslöjar DPC-problem när flera webbläsarflikar öppnas på vår hemsida. 4K-videouppspelning vid 60 FPS är ofullständig med 4 tappade bildrutor som registrerats under ett 60-sekundersfönster.
| DPC Latencies / LatencyMon - interrupt to process latency (max), Web, Youtube, Prime95 | |
| Lenovo Legion Slim 7i 16 Gen 8 | |
| Asus ROG Zephyrus M16 GU604VY-NM042X | |
| MSI Raider GE68HX 13VF | |
| HP Omen 16-xf0376ng | |
| Alienware m16 R1 AMD | |
| MSI GE67 HX 12UGS | |
* ... mindre är bättre
Lagringsenheter
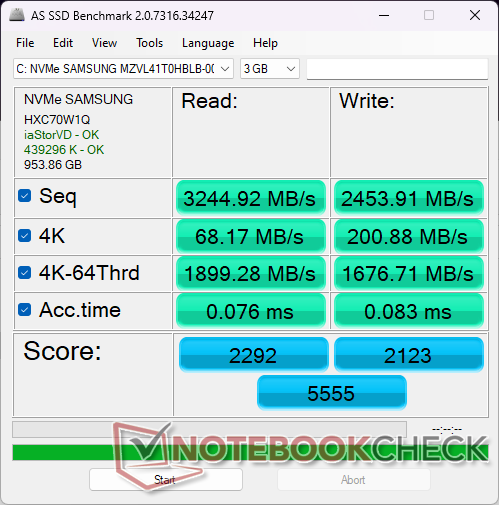
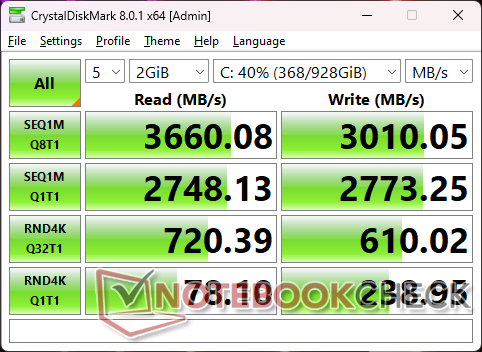
Vår enhet levereras med den billigare 1 TB Samsung PM9B1 istället för den dyrare Samsung PM9A1, sannolikt för att spara på kostnaderna. PM9B1 är nästan hälften så snabb med maximala sekventiella läshastigheter på cirka 3600 MB/s jämfört med ~7000 MB/s på PM9A1. SSD-prestandan är ändå stabil utan någon strypning.

| Drive Performance rating - Percent | |
| MSI GE67 HX 12UGS | |
| Lenovo Legion Slim 7i 16 Gen 8 | |
| Alienware m16 R1 AMD | |
| Asus ROG Zephyrus M16 GU604VY-NM042X | |
| HP Omen 16-xf0376ng | |
| MSI Raider GE68HX 13VF -11! | |
* ... mindre är bättre
Disk Throttling: DiskSpd Read Loop, Queue Depth 8
GPU-prestanda
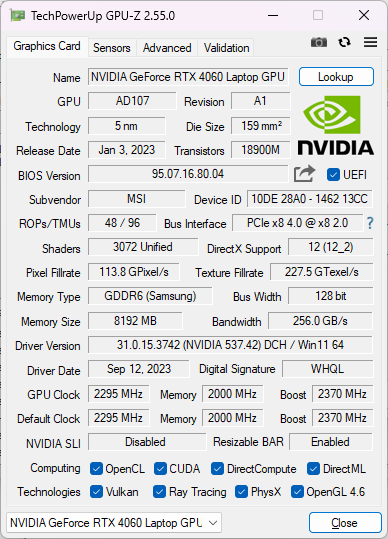
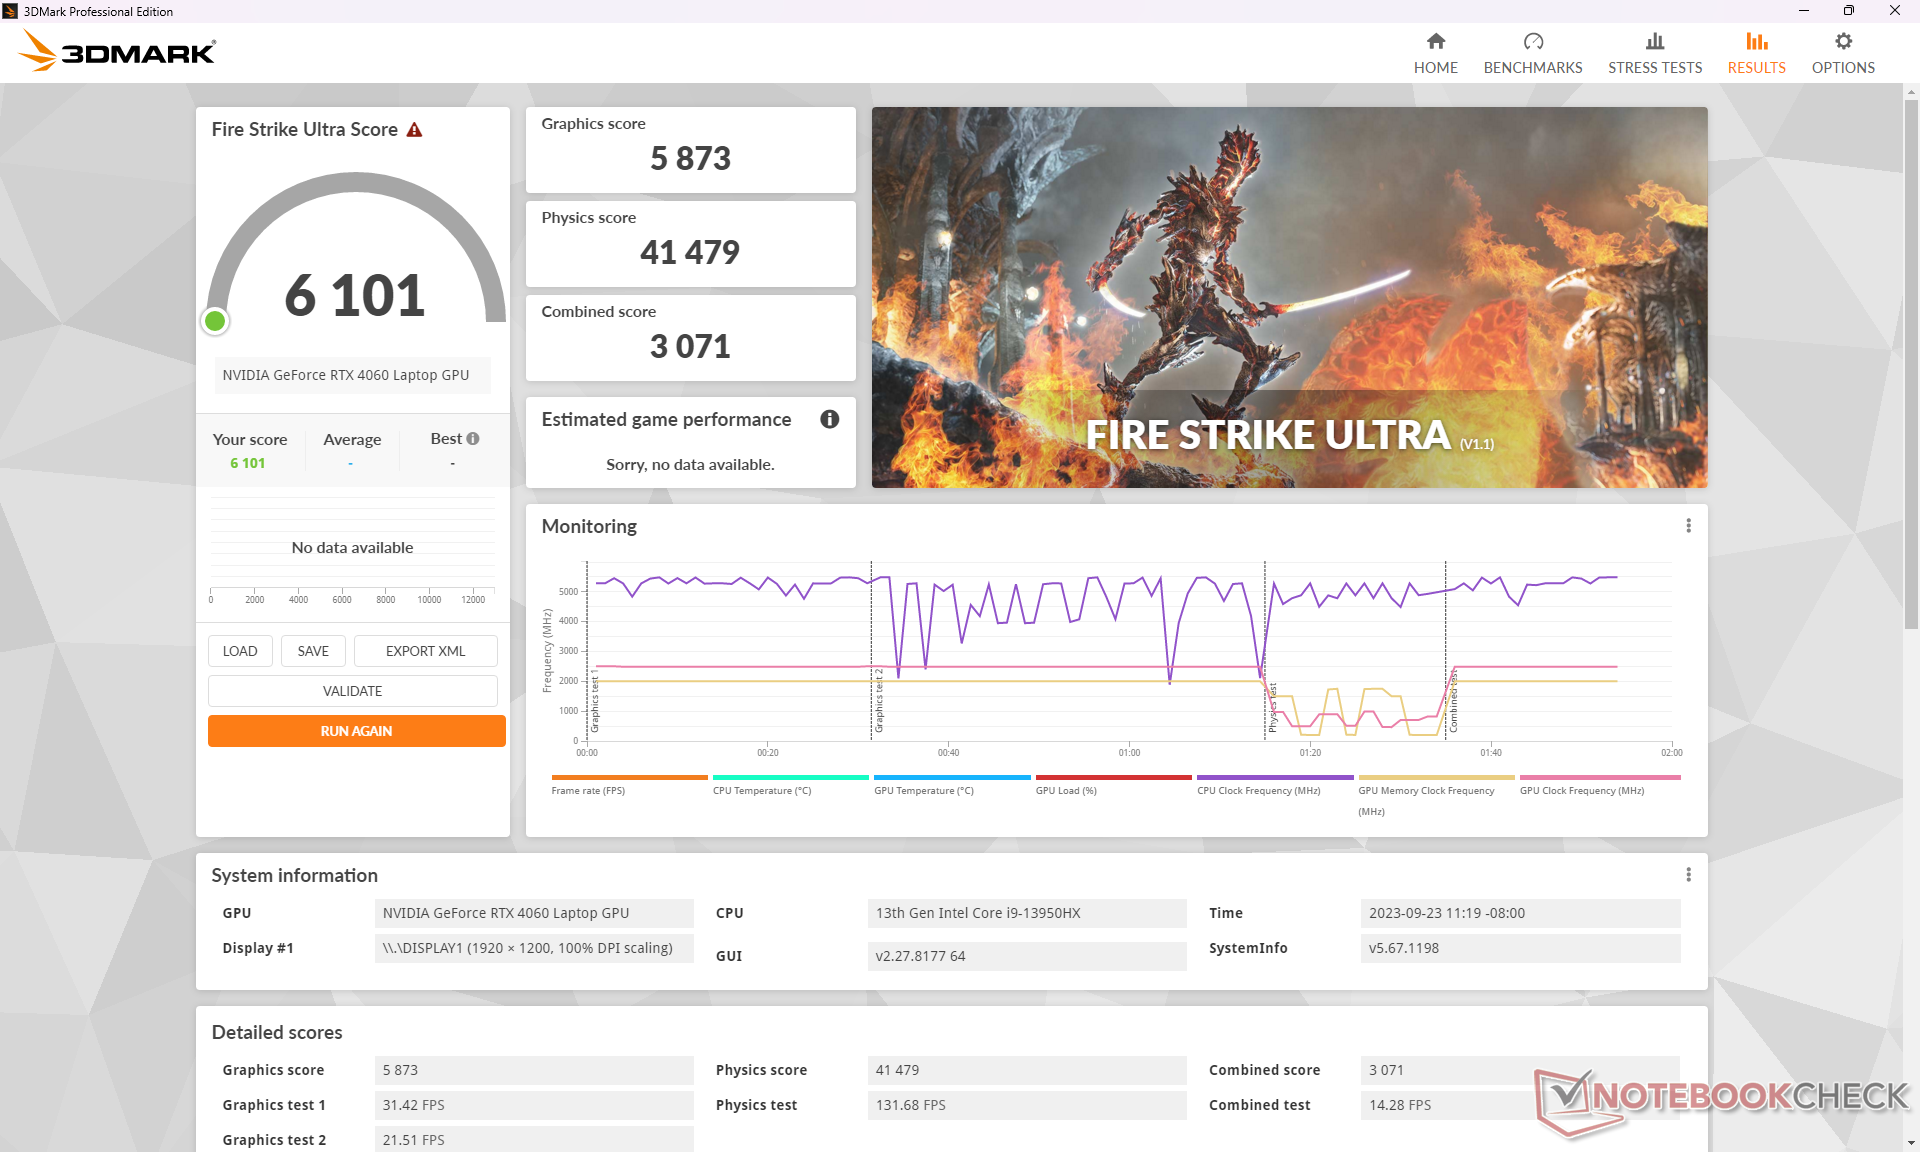
Vår RTX 4060 presterar bra med resultat som bara ligger något över den genomsnittliga bärbara speldatorn i vår databas som är utrustad med samma GPU. Uppgradering till RTX 4070, 4080 eller 4090 förväntas öka prestandan med 10 till 20 procent, 60 till 80 procent respektive 80 till 100 procent jämfört med RTX 4060. Prestandagapet är störst mellan RTX 4070 och 4080.
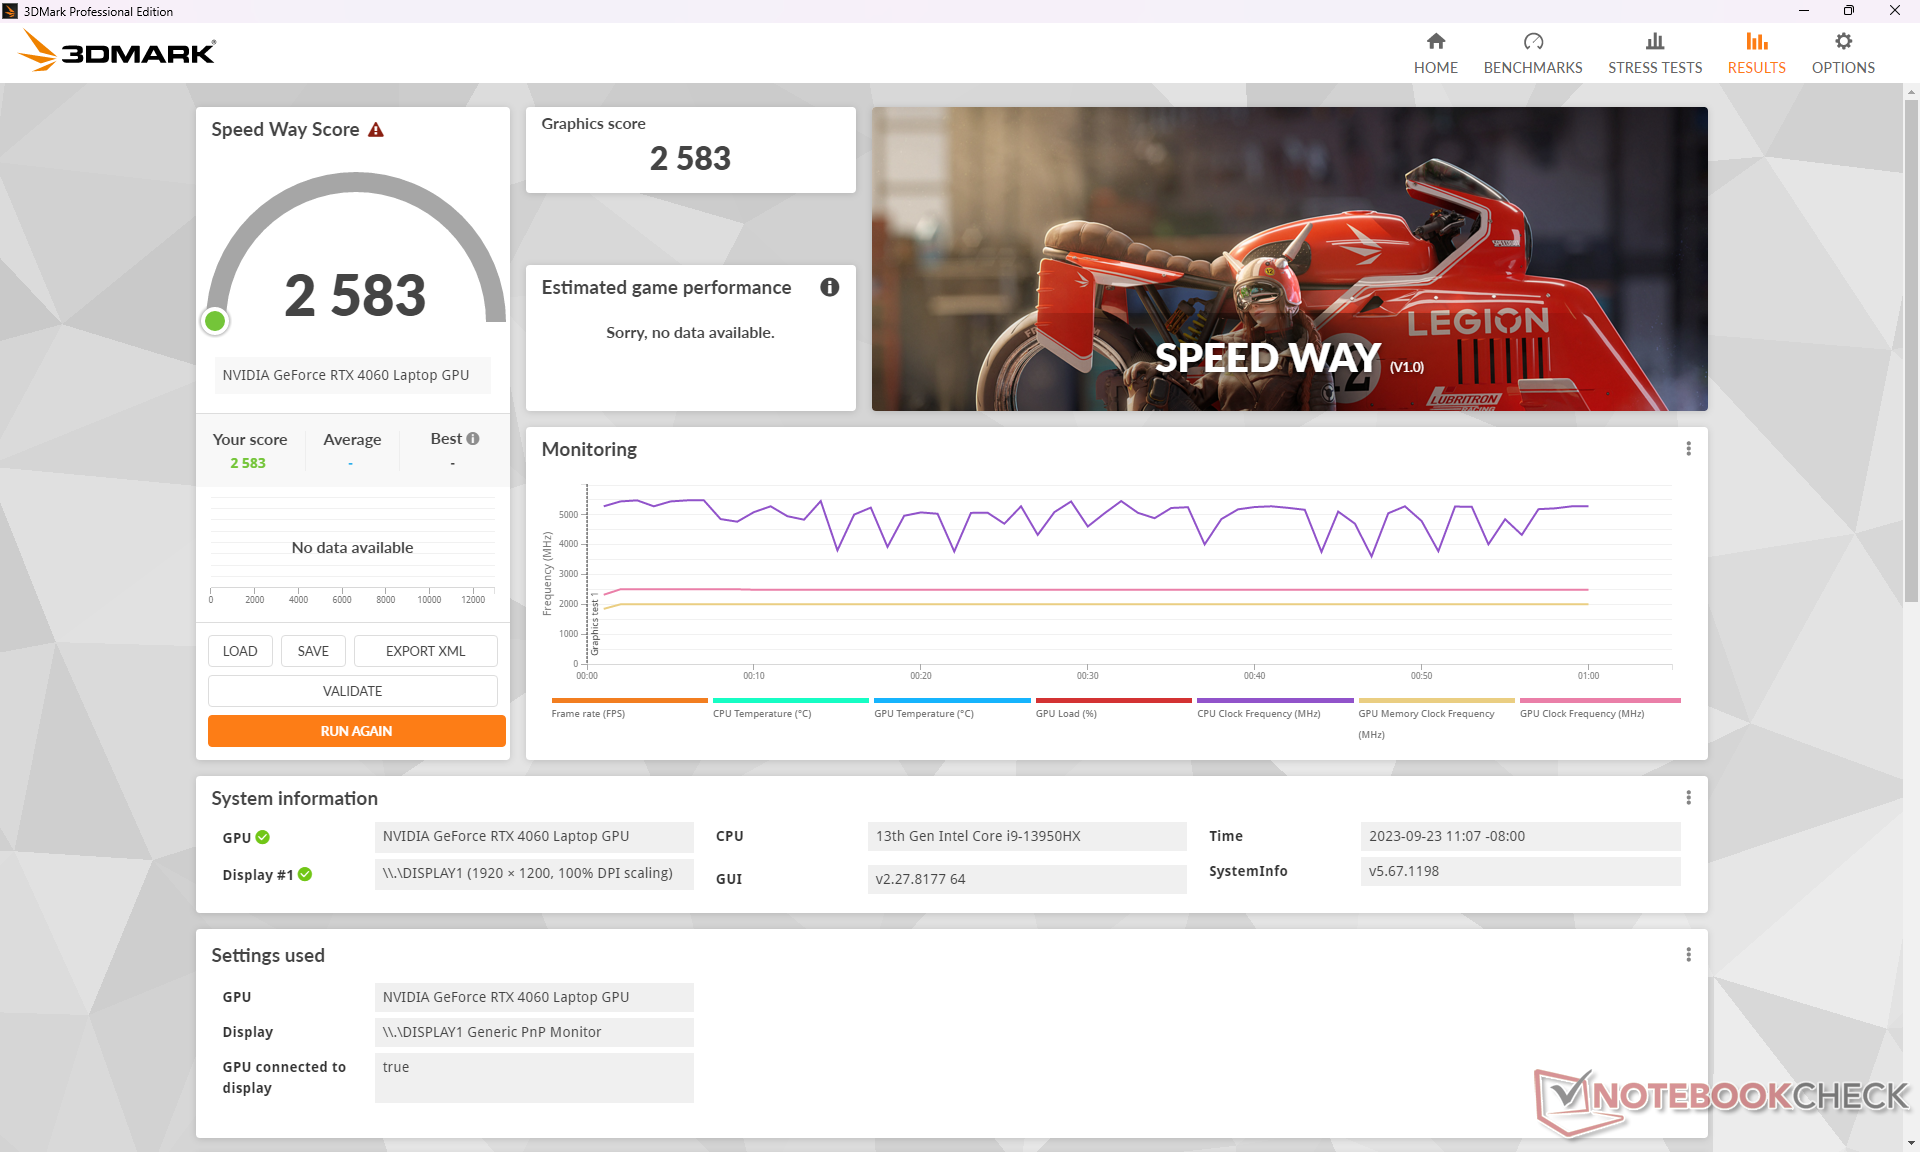
Det är irriterande att MSI har programmerat MSI Center att automatiskt växla till Extreme Performance-läget när det upptäcker att 3DMark körs och det finns tyvärr inget enkelt sätt att inaktivera detta. Vi tycker att detta är frustrerande eftersom det tar bort kontrollen från slutanvändaren. Den automatiska växlingen sker inte när spel körs.
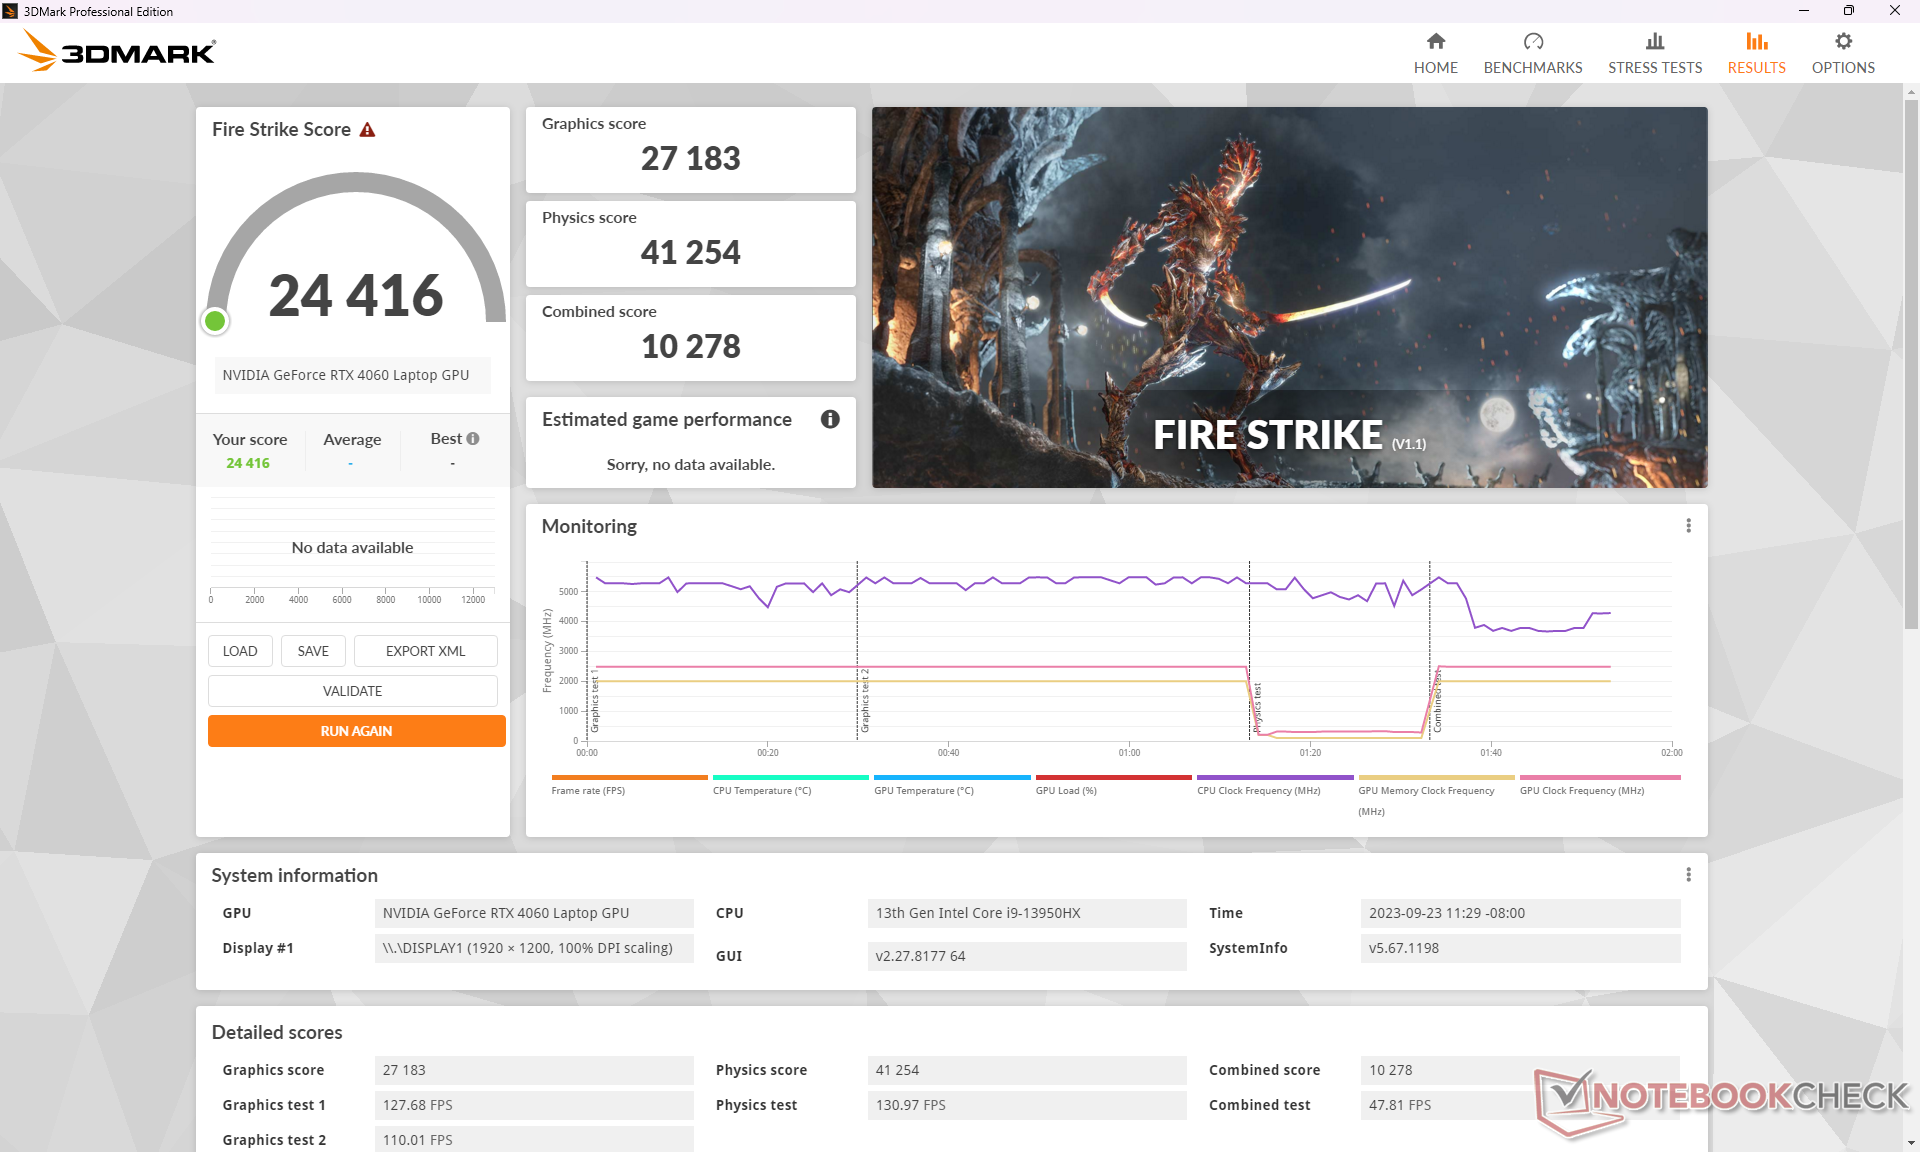
Aktiveringen av Cooler Boost verkar inte påverka CPU- eller GPU-prestandan nämnvärt, vilket framgår av våra Fire Strike -resultat nedan. Funktionen är alltså inte avgörande för maximal prestanda och rekommenderas endast om man vill ha svalare drifttemperaturer.
| Kraftprofil | Fire Strike Grafik | Fire Strike Fysik | Kombinerat resultat |
| Läget Extreme Performance (Cooler Boost på) | 27127 | 41525 | 11480 |
| Extremt prestandaläge (kylarförstärkning av) | 27183 (0%) | 41254 (-1%) | 10278 (-10%) |
| Batteridrift | 19528 (-28%) | 18623 (-55%) | 5986 (-48%) |
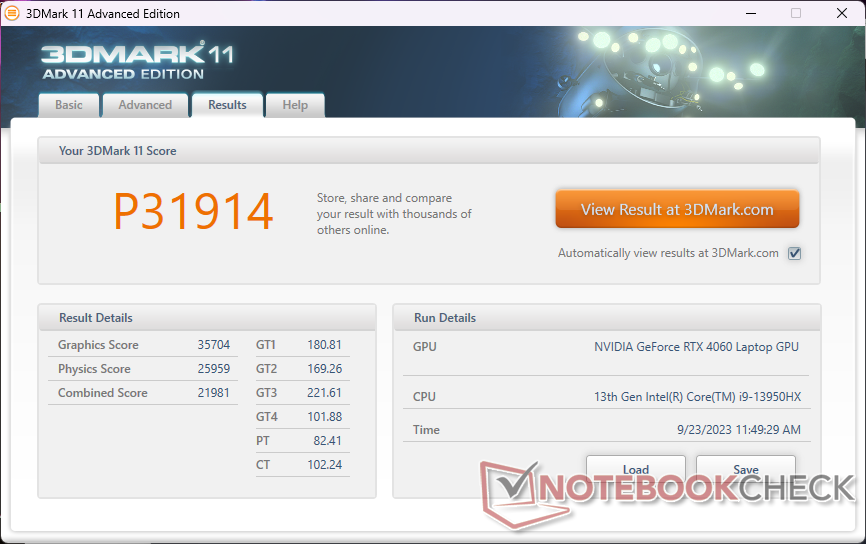
| 3DMark 11 Performance | 31914 poäng | |
| 3DMark Fire Strike Score | 24416 poäng | |
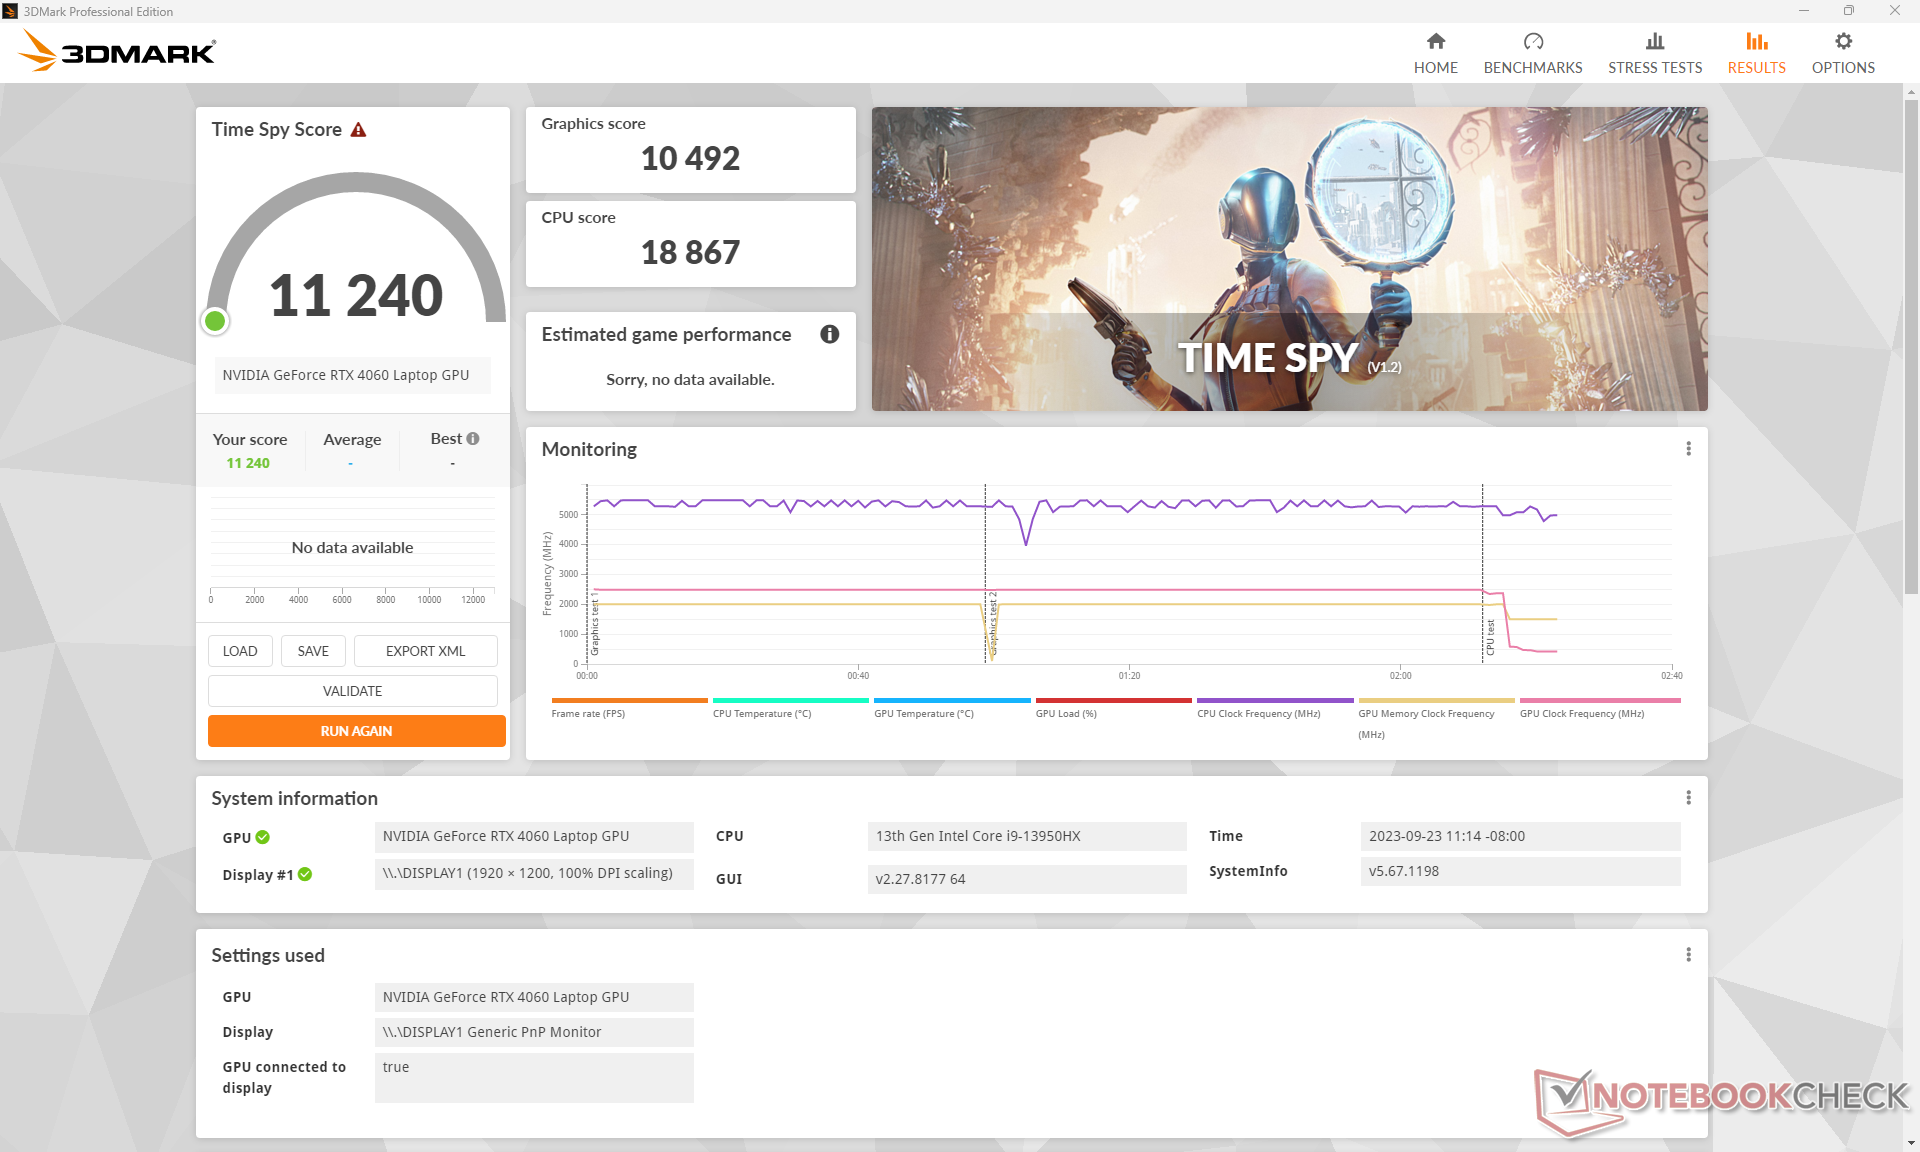
| 3DMark Time Spy Score | 11240 poäng | |
Hjälp | ||
* ... mindre är bättre
Spelprestanda
I likhet med RTX 2060 och RTX 3060 är RTX 4060 perfekt för 1080p60-spel. Alla testade spel körs mycket bra med maximala inställningar på 1080p, men nyare och mer krävande spel som Ratchet and Clank Rift Apart tenderar att sjunka under 60 FPS. Lägre inställningar eller DLSS rekommenderas i sådana fall, särskilt eftersom huvudskärmen saknar G-Sync-stöd.
| Tiny Tina's Wonderlands | |
| 1920x1080 Low Preset (DX12) | |
| Alienware m16 R1 AMD | |
| Lenovo Legion Slim 7i 16 Gen 8 | |
| MSI Raider GE68HX 13VF | |
| Genomsnitt NVIDIA GeForce RTX 4060 Laptop GPU (164.4 - 235, n=9) | |
| 1920x1080 Medium Preset (DX12) | |
| Alienware m16 R1 AMD | |
| Lenovo Legion Slim 7i 16 Gen 8 | |
| MSI Raider GE68HX 13VF | |
| Genomsnitt NVIDIA GeForce RTX 4060 Laptop GPU (116 - 192.3, n=9) | |
| 1920x1080 High Preset (DX12) | |
| Alienware m16 R1 AMD | |
| Lenovo Legion Slim 7i 16 Gen 8 | |
| MSI Raider GE68HX 13VF | |
| Genomsnitt NVIDIA GeForce RTX 4060 Laptop GPU (86.6 - 121.2, n=10) | |
| 1920x1080 Badass Preset (DX12) | |
| Asus Zephyrus Duo 16 GX650PY-NM006W | |
| Alienware m16 R1 AMD | |
| Lenovo Legion Slim 7i 16 Gen 8 | |
| MSI Raider GE68HX 13VF | |
| Genomsnitt NVIDIA GeForce RTX 4060 Laptop GPU (67.5 - 92.7, n=11) | |
| Ratchet & Clank Rift Apart | |
| 1920x1080 Low Preset | |
| Genomsnitt NVIDIA GeForce RTX 4060 Laptop GPU (84.7 - 86, n=3) | |
| MSI Raider GE68HX 13VF | |
| 1920x1080 Medium Preset AA:T | |
| MSI Raider GE68HX 13VF | |
| Genomsnitt NVIDIA GeForce RTX 4060 Laptop GPU (73.4 - 75, n=4) | |
| 1920x1080 High Preset AA:T | |
| Genomsnitt NVIDIA GeForce RTX 4060 Laptop GPU (59 - 60.6, n=4) | |
| MSI Raider GE68HX 13VF | |
| 1920x1080 Very High Preset AA:T | |
| Genomsnitt NVIDIA GeForce RTX 4060 Laptop GPU (51.6 - 54.8, n=4) | |
| MSI Raider GE68HX 13VF | |
Witcher 3 FPS Chart
| låg | med. | hög | ultra | |
|---|---|---|---|---|
| The Witcher 3 (2015) | 556.3 | 364.9 | 213.1 | 103.5 |
| Dota 2 Reborn (2015) | 232 | 207 | 199 | 182.2 |
| Final Fantasy XV Benchmark (2018) | 223 | 151.3 | 103.2 | |
| X-Plane 11.11 (2018) | 209 | 184 | 141.1 | |
| Far Cry 5 (2018) | 191 | 158 | 147 | 138 |
| Strange Brigade (2018) | 487 | 291 | 232 | 194 |
| Cyberpunk 2077 1.6 (2022) | 129.1 | 103 | 88.3 | 80.4 |
| Tiny Tina's Wonderlands (2022) | 233.9 | 184.6 | 116.5 | 88.3 |
| F1 22 (2022) | 288 | 271 | 206 | 65.5 |
| Ratchet & Clank Rift Apart (2023) | 84.7 | 75 | 59 | 51.6 |
Utsläpp
Systembuller - balanserat läge rekommenderas för de flesta scenarier
Fläktljudet är en blandad kompott. De två fläktarna är mycket känsliga för belastning på skärmen, vilket innebär att de kommer att öka kraftigt och snabbt när du bara startar applikationer eller surfar på webben, även när den är inställd på energiprofilen Balanserad. Fläktljudet är hörbart även i det tysta läget, men pulseringen är mycket mindre frekvent. I allmänhet kan användare förvänta sig en ljudnivå på mellan 25 och 38 dB(A) när de surfar eller strömmar video, även i det tysta läget.
Fläktljudet vid spel kan variera kraftigt beroende på vilken energiprofil som valts. Om du kör Witcher 3 i lägena Balanserad eller Extrem prestanda skulle resultera i en ljudnivå på 46,2 dB(A) respektive 57 dB(A). Om Cooler Boost är aktiverat kommer maxvärdet att stiga ännu högre till 60,1 dB(A), vilket gör den till en av de mest högljudda 16-tums bärbara speldatorerna. Tack och lov är förlusten av grafikprestanda vid spel i balanserat läge mycket marginell, så inställningarna Extreme Performance och Cooler Boost rekommenderas endast om du vill ha svalare drifttemperaturer eller överklockar GPU:n manuellt.
Ljudnivå
| Låg belastning |
| 25 / 31.3 / 37.5 dB(A) |
| Hög belastning |
| 44 / 60.1 dB(A) |
 | ||
30 dB tyst 40 dB(A) hörbar 50 dB(A) högt ljud |
||
min: | ||
| MSI Raider GE68HX 13VF GeForce RTX 4060 Laptop GPU, i9-13950HX, Samsung PM9B1 1024GB MZVL41T0HBLB | MSI GE67 HX 12UGS GeForce RTX 3070 Ti Laptop GPU, i7-12800HX, Samsung PM9A1 MZVL21T0HCLR | HP Omen 16-xf0376ng GeForce RTX 4070 Laptop GPU, R7 7840HS, WDC PC SN810 512GB | Alienware m16 R1 AMD GeForce RTX 4080 Laptop GPU, R9 7845HX, Kioxia XG8 KXG80ZNV1T02 | Lenovo Legion Slim 7i 16 Gen 8 GeForce RTX 4070 Laptop GPU, i9-13900H, Samsung PM9A1 MZVL21T0HCLR | Asus ROG Zephyrus M16 GU604VY-NM042X GeForce RTX 4090 Laptop GPU, i9-13900H, Samsung PM9A1 MZVL22T0HBLB | |
|---|---|---|---|---|---|---|
| Noise | 12% | 9% | 12% | 16% | 5% | |
| av / miljö * (dB) | 23.3 | 22.7 3% | 24 -3% | 22.9 2% | 22.8 2% | 24 -3% |
| Idle Minimum * (dB) | 25 | 22.9 8% | 25 -0% | 22.9 8% | 23.6 6% | 24 4% |
| Idle Average * (dB) | 31.3 | 22.9 27% | 29 7% | 29.7 5% | 23.6 25% | 29.96 4% |
| Idle Maximum * (dB) | 37.5 | 22.9 39% | 32 15% | 29.7 21% | 25.7 31% | 34.27 9% |
| Load Average * (dB) | 44 | 44.4 -1% | 44 -0% | 29.8 32% | 27.6 37% | 35.89 18% |
| Witcher 3 ultra * (dB) | 57 | 55.7 2% | 44 23% | 54.7 4% | 54.4 5% | 57.5 -1% |
| Load Maximum * (dB) | 60.1 | 57.4 4% | 46 23% | 54.7 9% | 54.4 9% | 57.54 4% |
* ... mindre är bättre
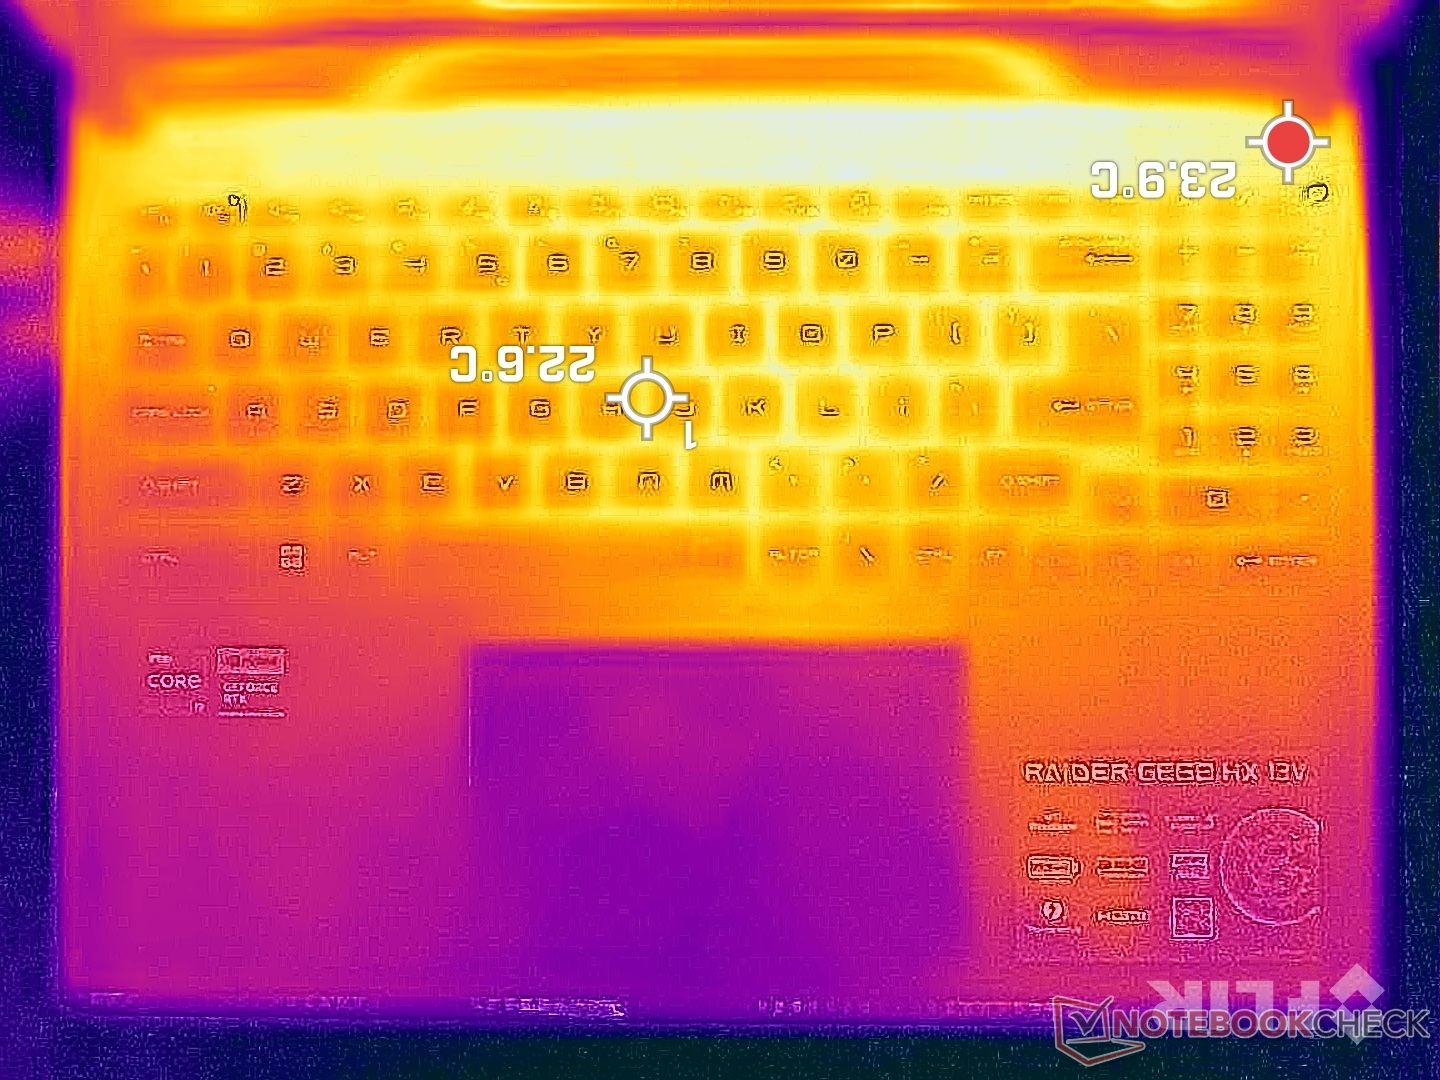
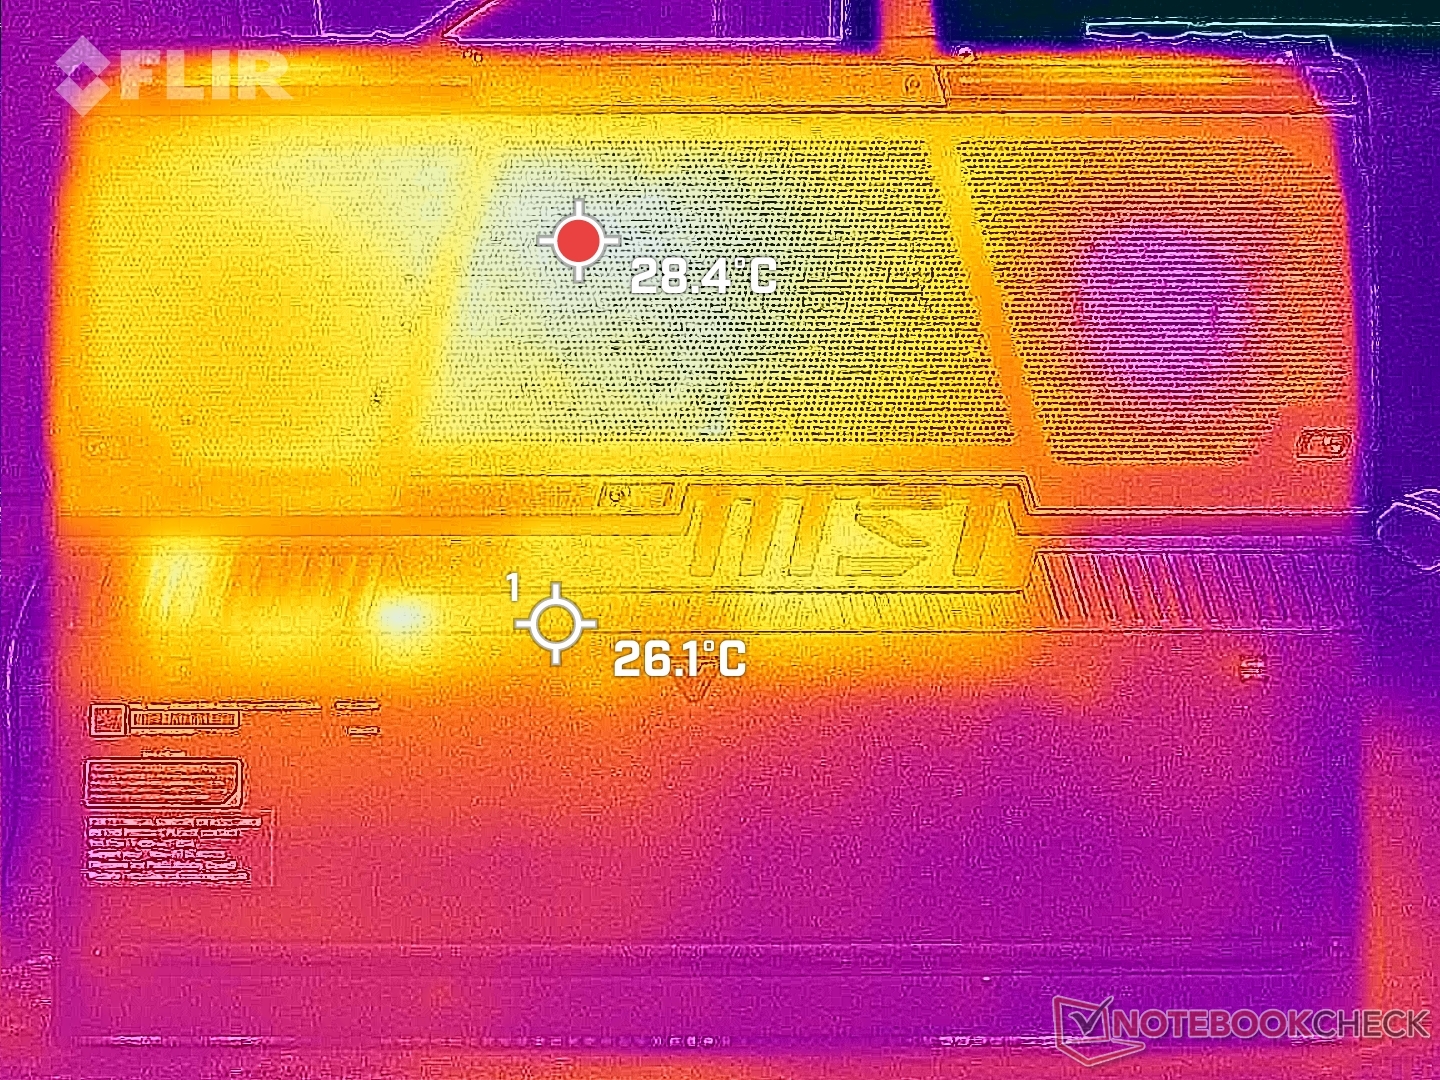
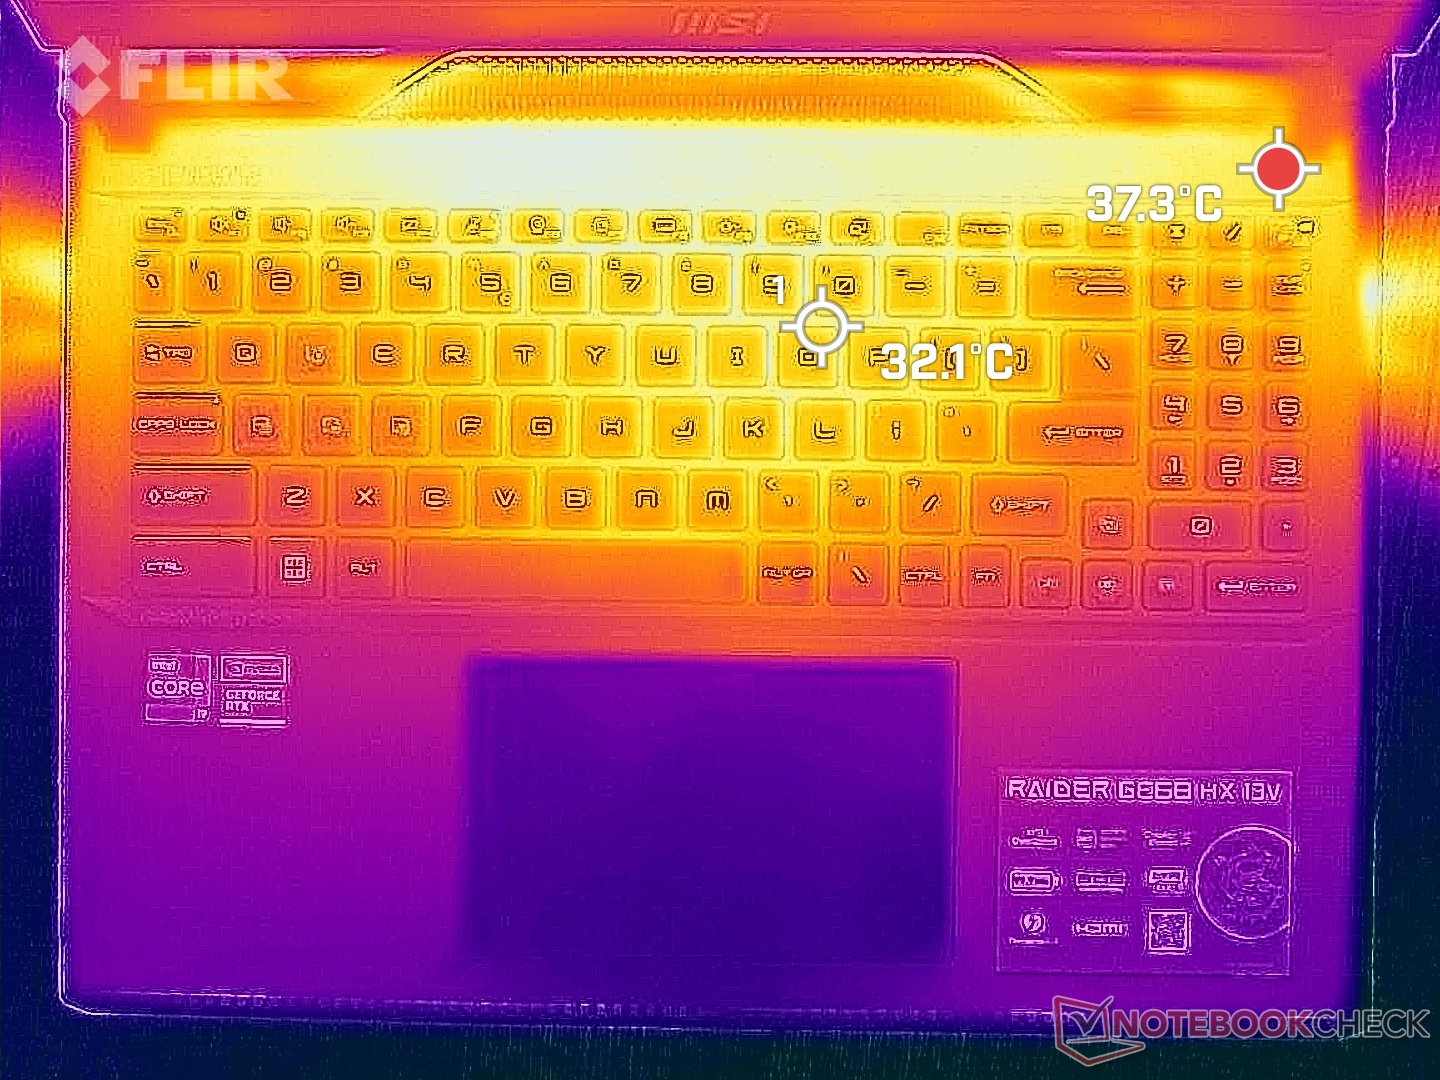
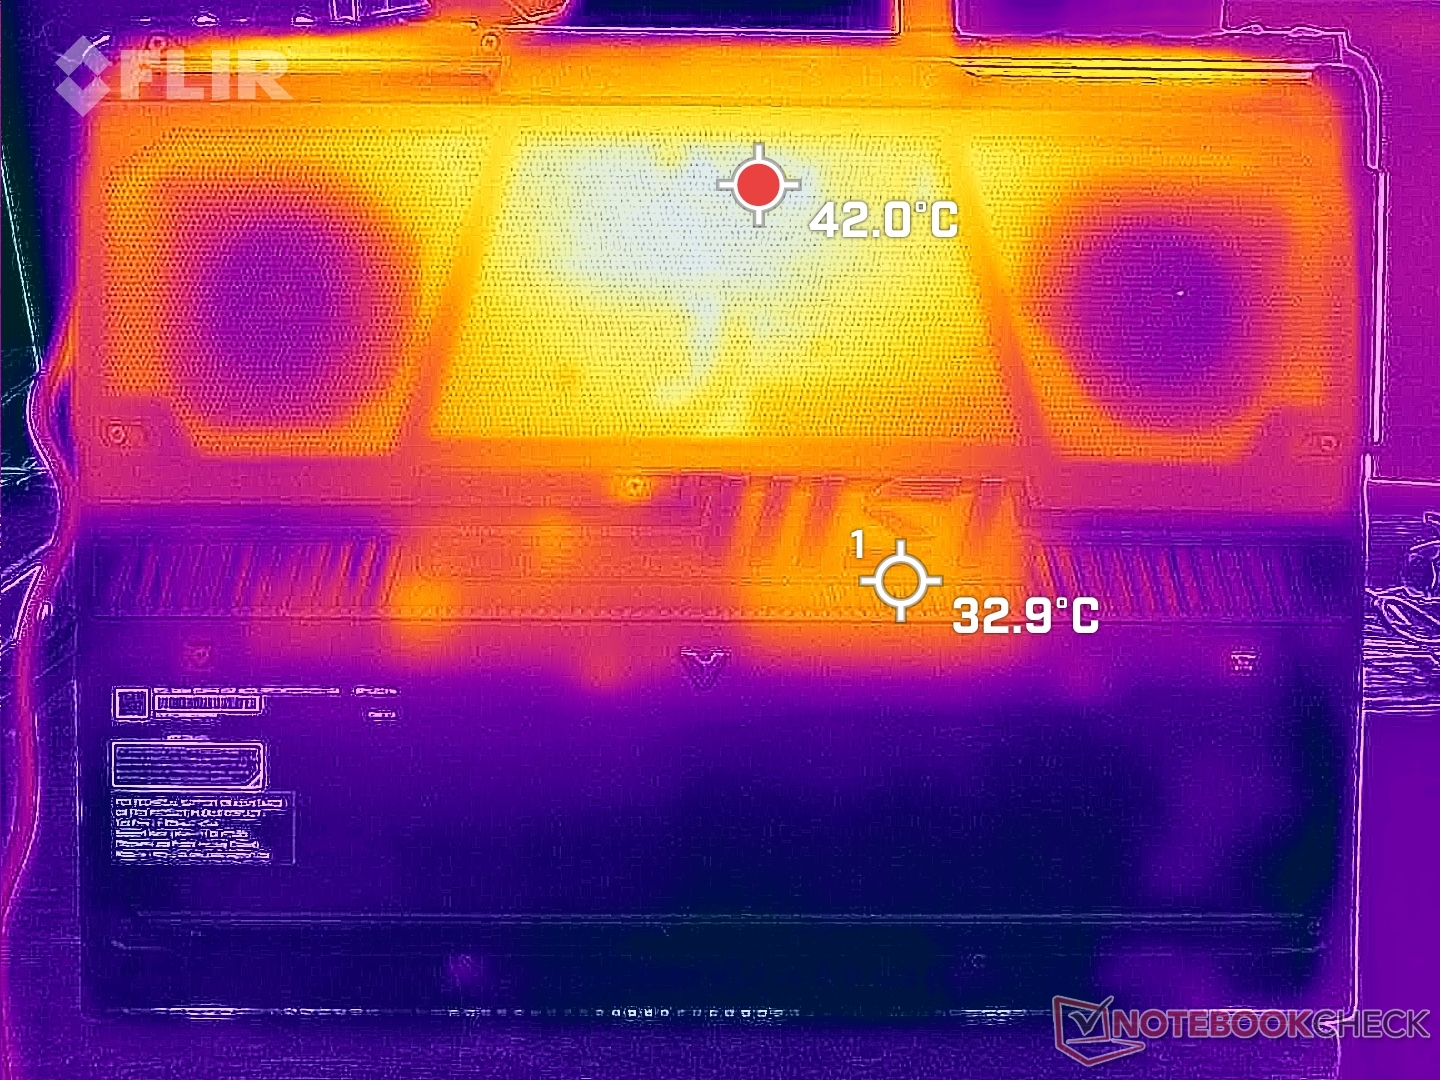
Temperatur
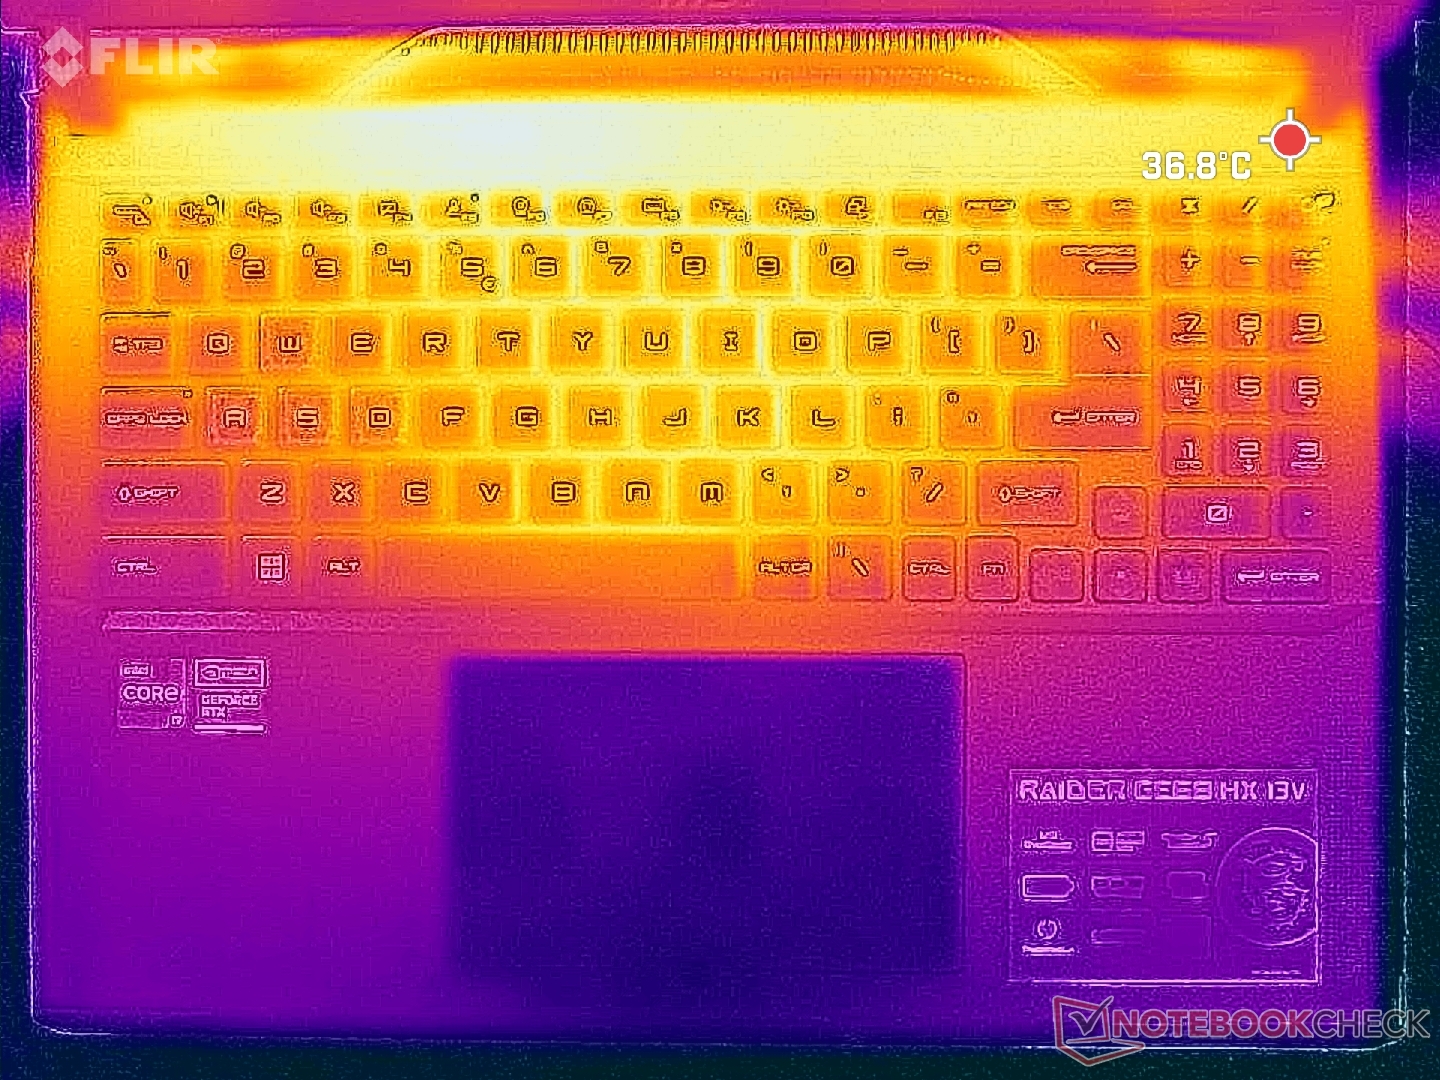
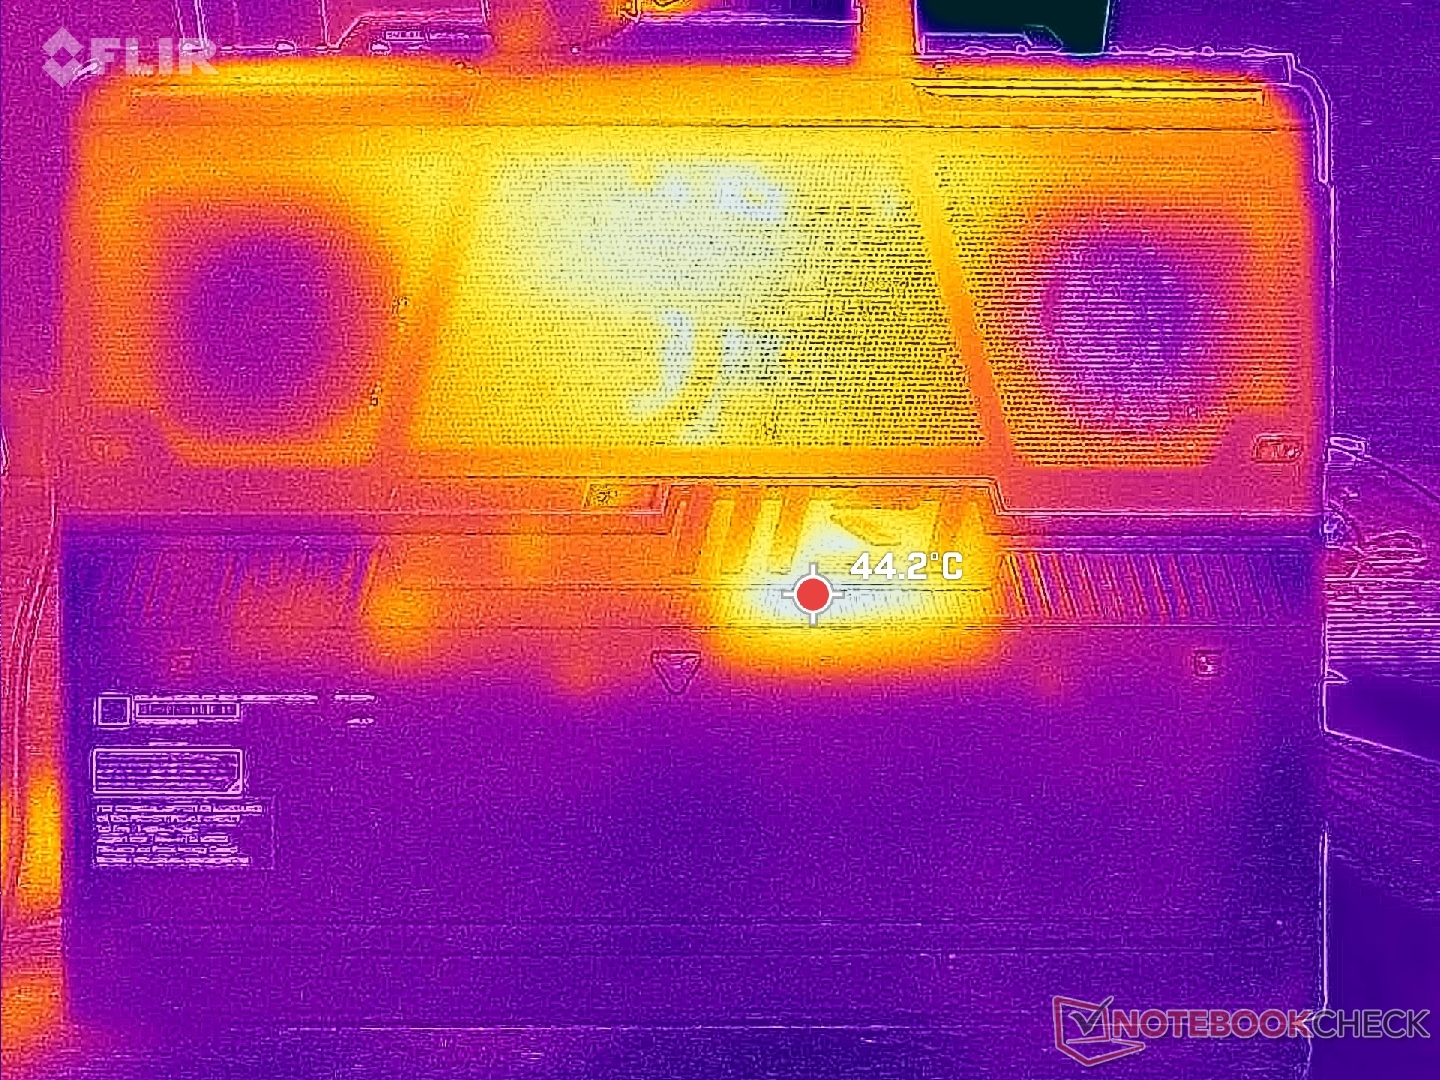
Ytans temperaturutveckling är symmetrisk på grund av hur kylningslösningen är utformad. Tangentbordets mittpunkt kan nå upp till 40 C vilket är mycket svalare än vad vi registrerade på HP Omen 16 eller Legion Slim 7i 16 G8 där hotspots kan vara upp till 45 till 50 C vardera. De generellt högre fläktarna och tjockare byggnaden av GE68HX arbetar till förmån för MSI ur detta perspektiv.
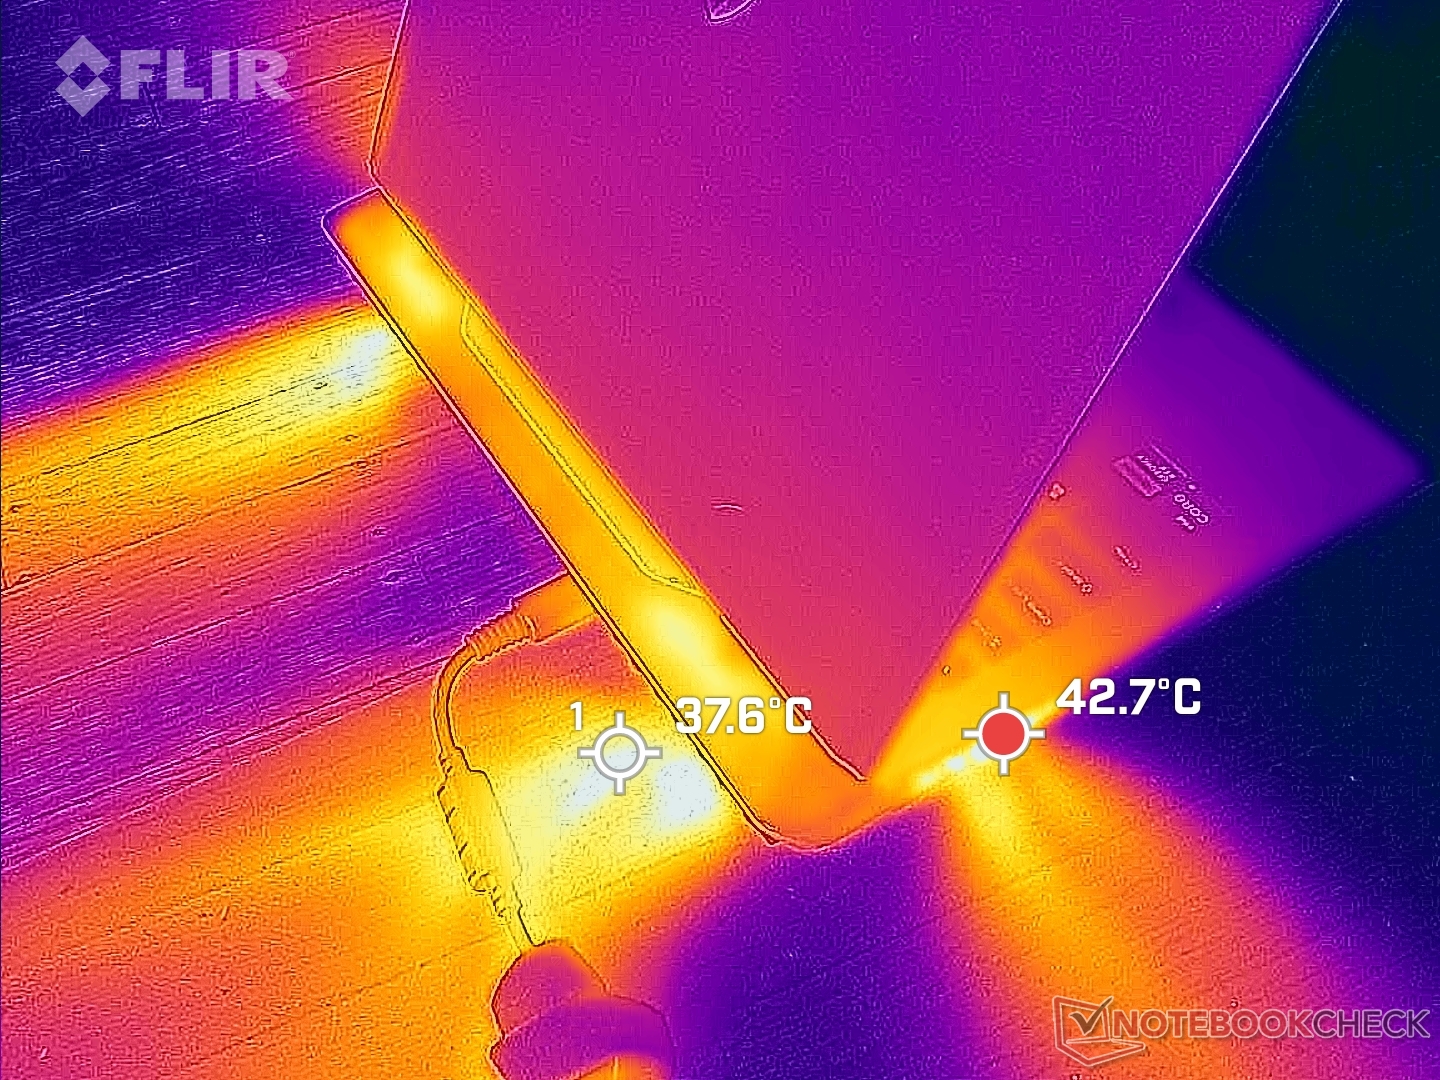
(±) Den maximala temperaturen på ovansidan är 41.4 °C / 107 F, jämfört med genomsnittet av 40.4 °C / 105 F , allt från 21.2 till 68.8 °C för klassen Gaming.
(-) Botten värms upp till maximalt 45.4 °C / 114 F, jämfört med genomsnittet av 43.2 °C / 110 F
(+) Vid tomgångsbruk är medeltemperaturen för ovansidan 27.7 °C / 82 F, jämfört med enhetsgenomsnittet på 33.9 °C / ### class_avg_f### F.
(±) När du spelar The Witcher 3 är medeltemperaturen för ovansidan 34 °C / 93 F, jämfört med enhetsgenomsnittet på 33.9 °C / ## #class_avg_f### F.
(+) Handledsstöden och pekplattan är kallare än hudtemperaturen med maximalt 29.6 °C / 85.3 F och är därför svala att ta på.
(±) Medeltemperaturen för handledsstödsområdet på liknande enheter var 28.8 °C / 83.8 F (-0.8 °C / -1.5 F).
| MSI Raider GE68HX 13VF Intel Core i9-13950HX, NVIDIA GeForce RTX 4060 Laptop GPU | MSI GE67 HX 12UGS Intel Core i7-12800HX, NVIDIA GeForce RTX 3070 Ti Laptop GPU | HP Omen 16-xf0376ng AMD Ryzen 7 7840HS, NVIDIA GeForce RTX 4070 Laptop GPU | Alienware m16 R1 AMD AMD Ryzen 9 7845HX, NVIDIA GeForce RTX 4080 Laptop GPU | Lenovo Legion Slim 7i 16 Gen 8 Intel Core i9-13900H, NVIDIA GeForce RTX 4070 Laptop GPU | Asus ROG Zephyrus M16 GU604VY-NM042X Intel Core i9-13900H, NVIDIA GeForce RTX 4090 Laptop GPU | |
|---|---|---|---|---|---|---|
| Heat | 9% | -12% | -10% | -6% | -6% | |
| Maximum Upper Side * (°C) | 41.4 | 34.4 17% | 49 -18% | 48 -16% | 49.8 -20% | 50 -21% |
| Maximum Bottom * (°C) | 45.4 | 42 7% | 57 -26% | 39 14% | 48.8 -7% | 58 -28% |
| Idle Upper Side * (°C) | 29.8 | 24 19% | 31 -4% | 37 -24% | 29.4 1% | 26 13% |
| Idle Bottom * (°C) | 31.4 | 33.2 -6% | 31 1% | 36.2 -15% | 30 4% | 28 11% |
* ... mindre är bättre
Stresstest
CPU:n ökade till 4,1 GHz och 183 W när Prime95-stressen initierades innan den återgick till 3,6 GHz, 134 W och 93 C bara några sekunder senare. Att upprepa detta test på förra årets modell med den äldre 12:e generationens Core i7-12800HX skulle resultera i en mycket lägre CPU-paketeffekt på bara 55 W för att visa hur mycket mer krävande den nya 13:e generationens CPU kan vara.
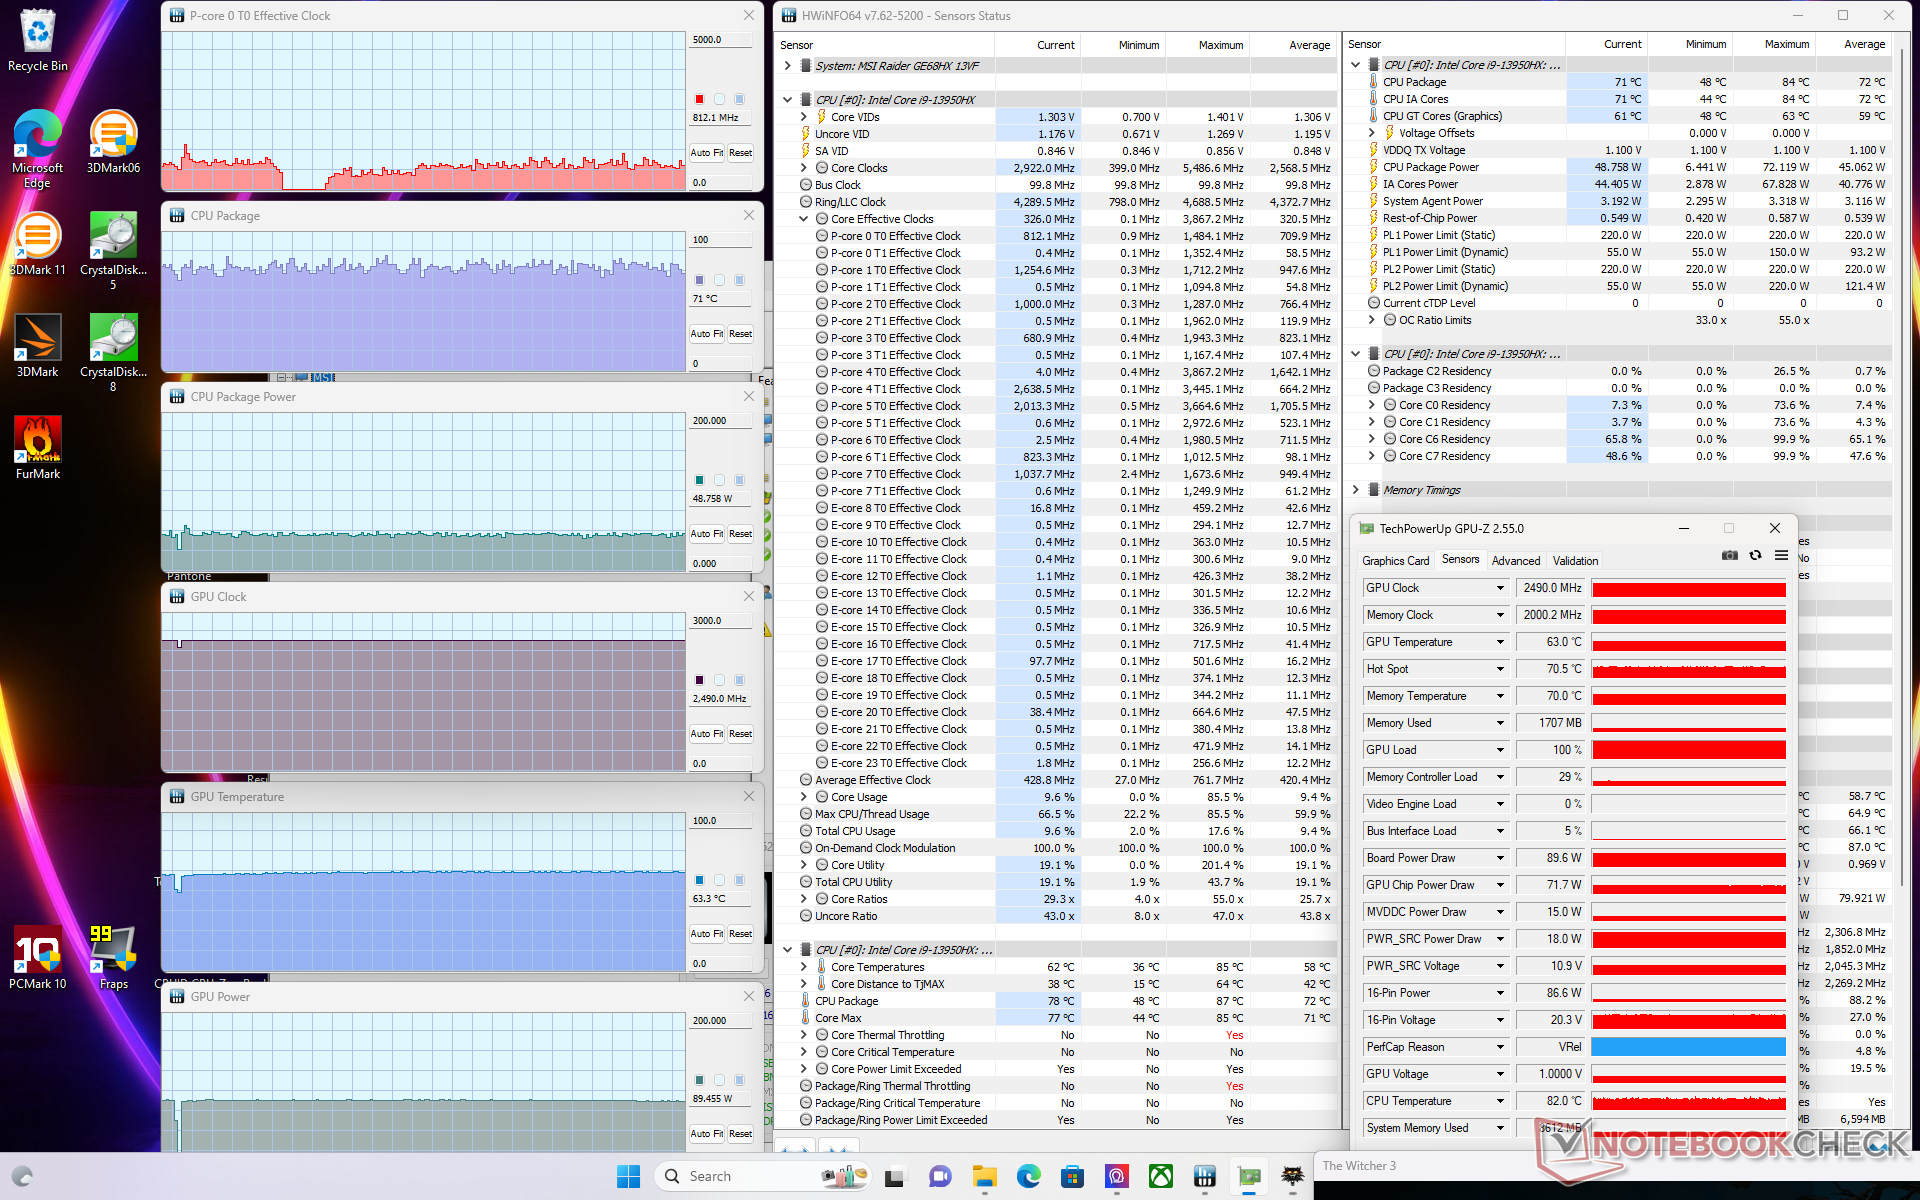
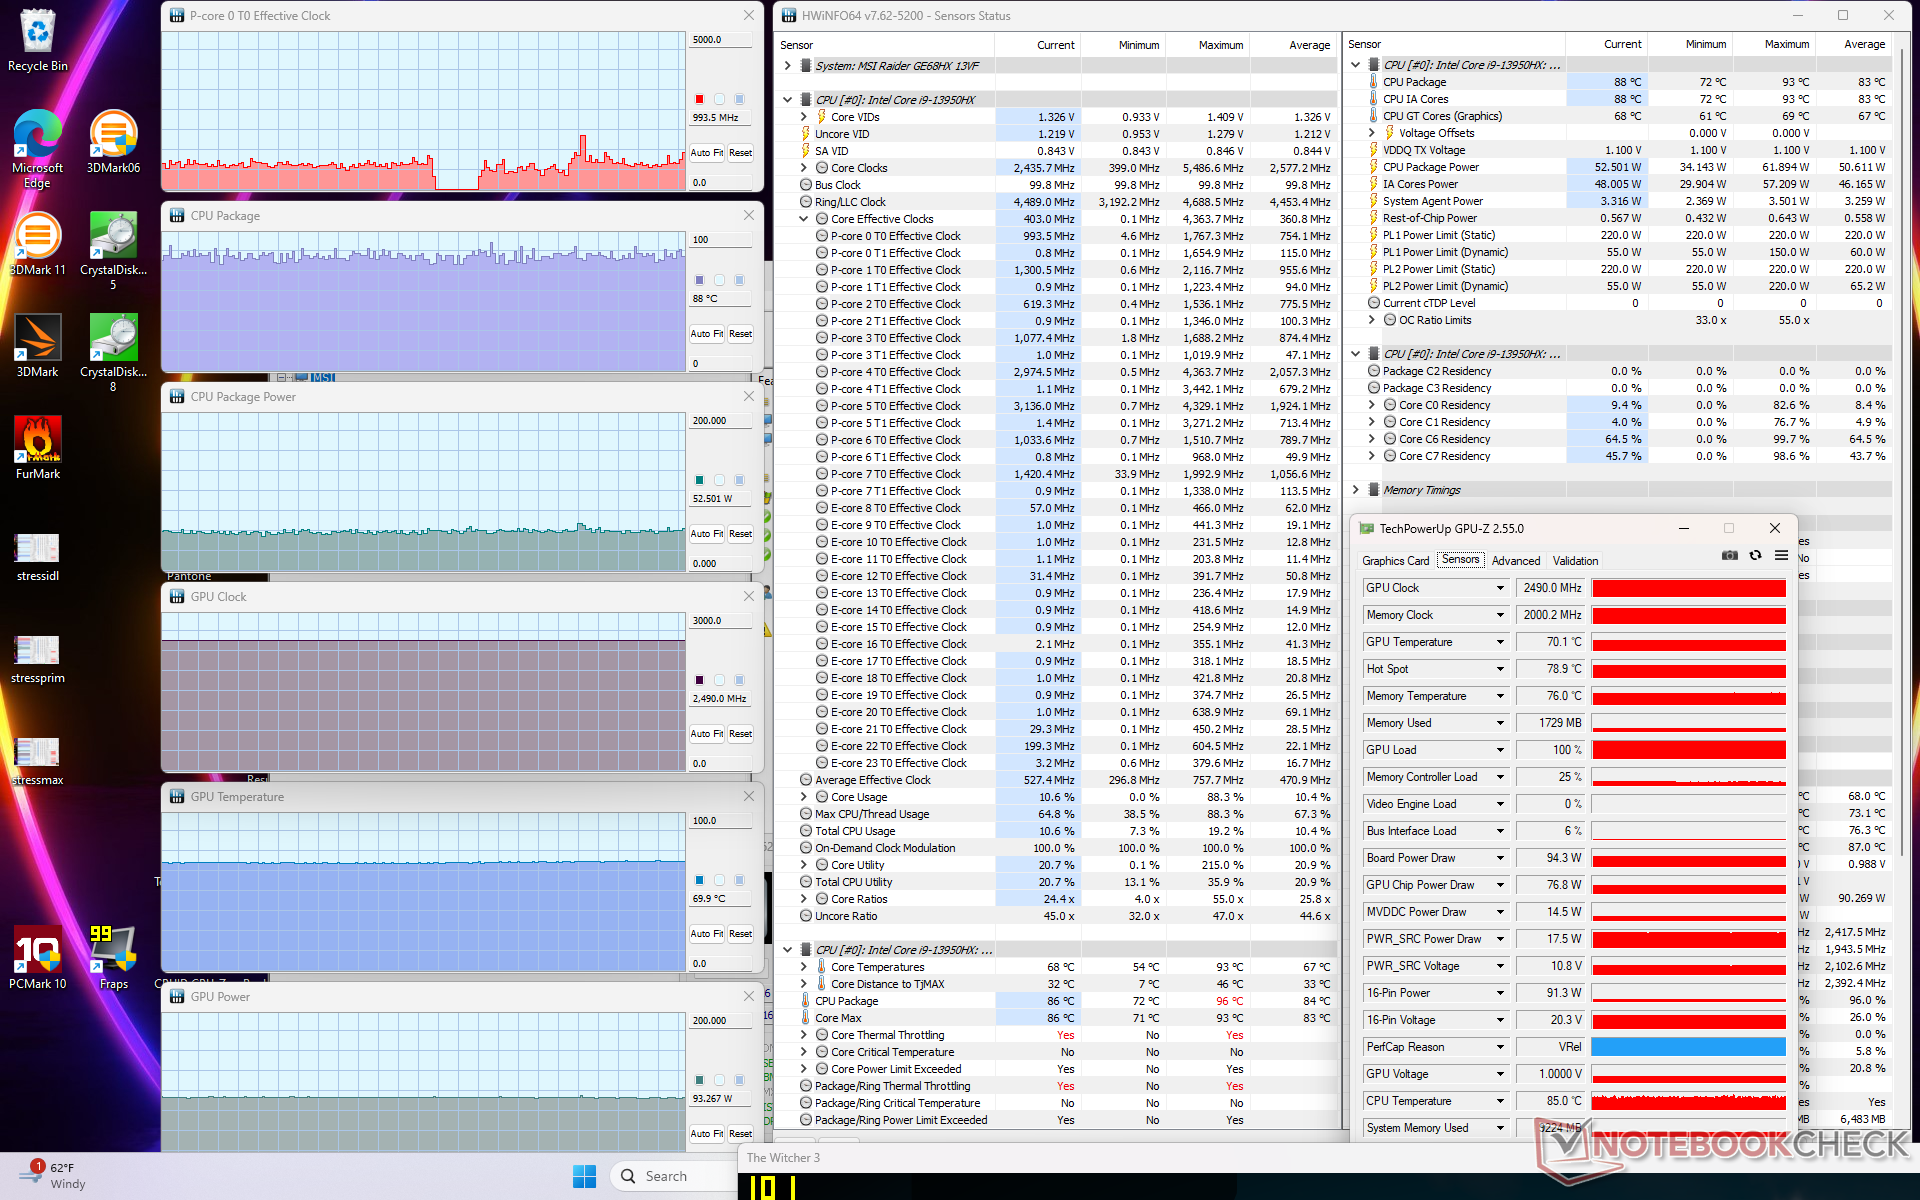
GPU-klockfrekvens och temperatur skulle stabiliseras vid 2475 MHz och 84 C när man kör Witcher 3 i balanserat läge. Intressant nog skulle klockfrekvensen öka marginellt till 2490 MHz om man kör i Extreme Performance-läget medan GPU-temperaturen skulle minska mer markant till 70 C eller till och med bara 63 C om Cooler Boost är aktivt, vilket framgår av våra skärmdumpar och tabellen nedan. De flesta andra MSI gaming laptops skulle också uppvisa liknande resultat. Det rekommenderas därför att spela i läget Balanced eftersom påverkan på GPU-prestandan är mycket marginell i förhållande till de enorma skillnaderna i fläktljud mellan de förinställda effektprofilerna. Prestandaskillnaderna mellan lägena Balanserad och Prestanda är vanligtvis mer betydande på andra bärbara speldatorer som Asus Zephyrus-serie.
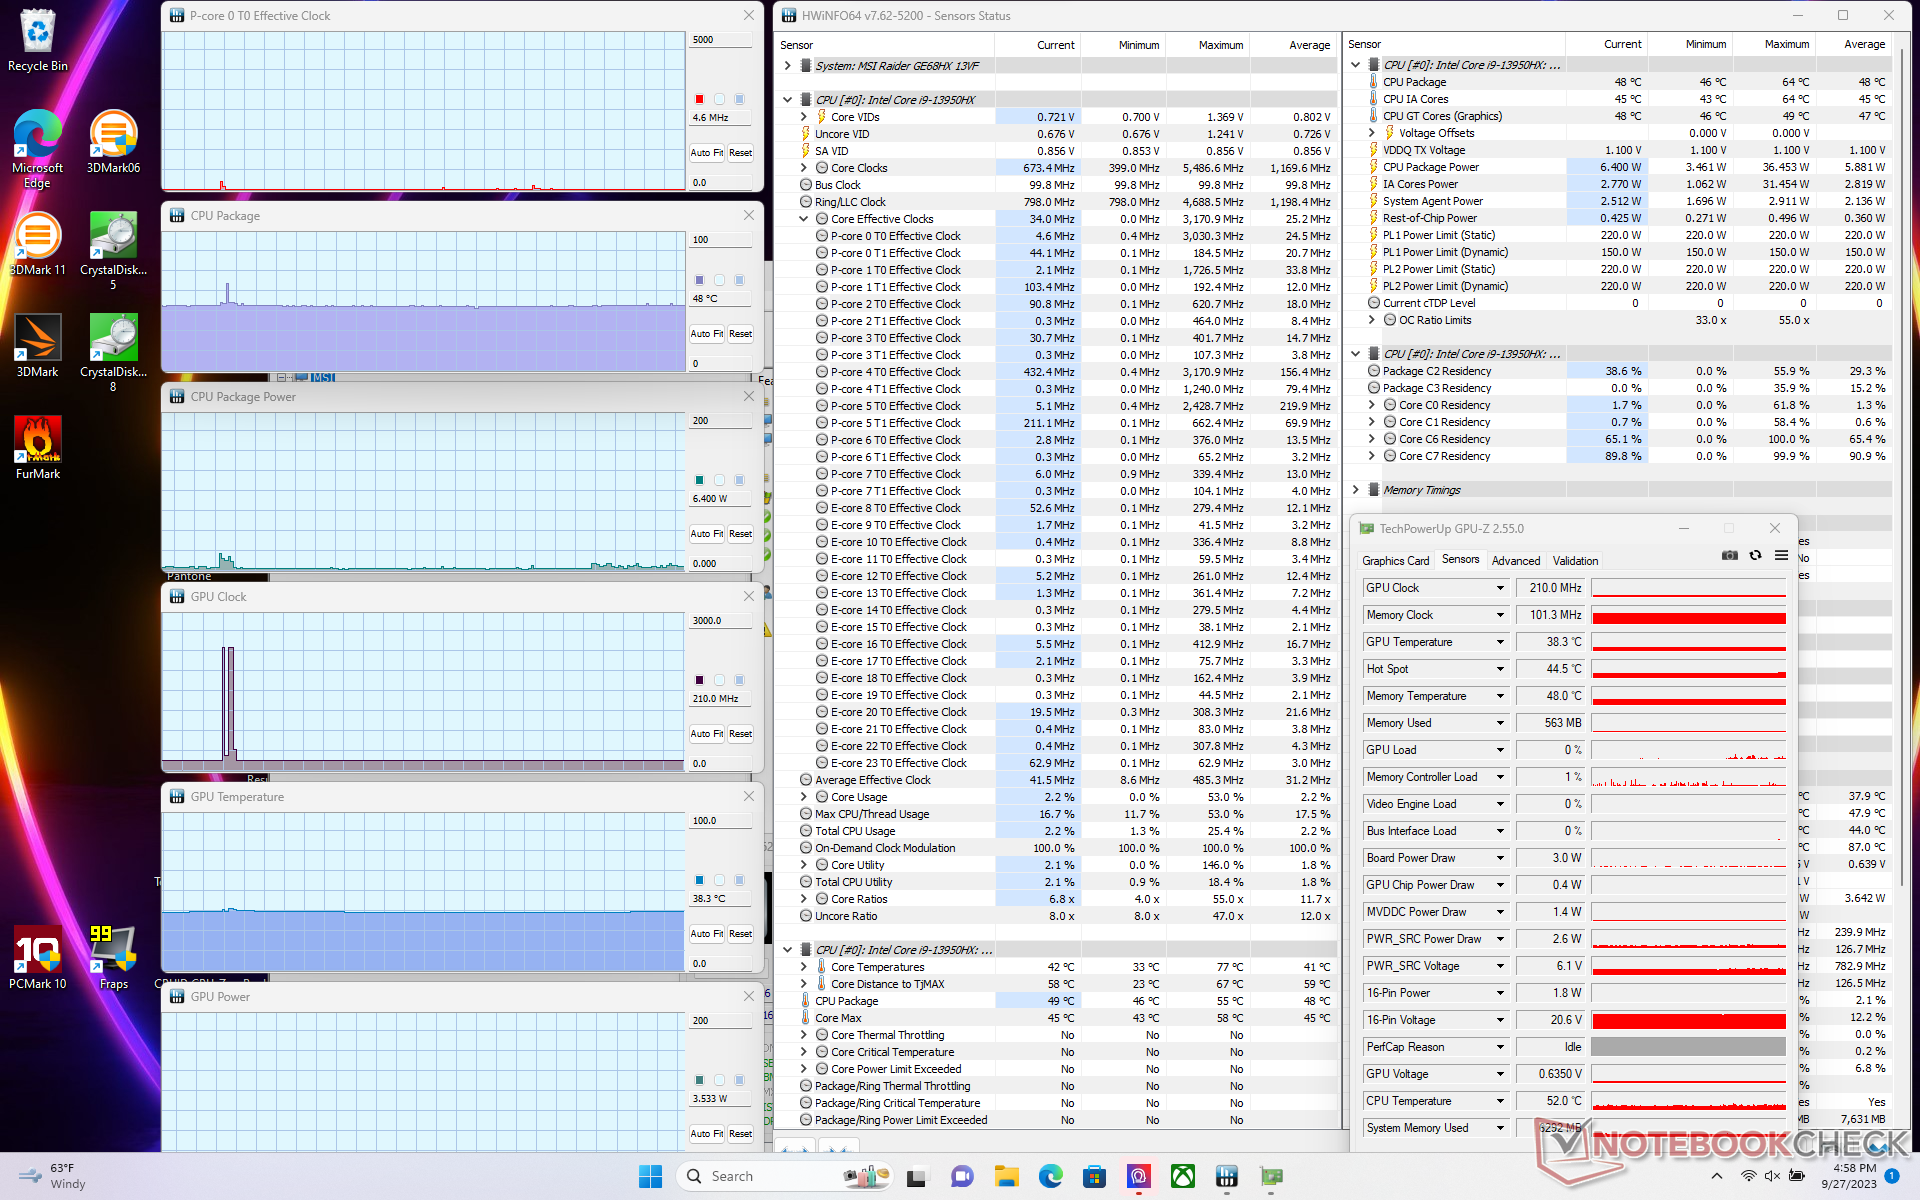
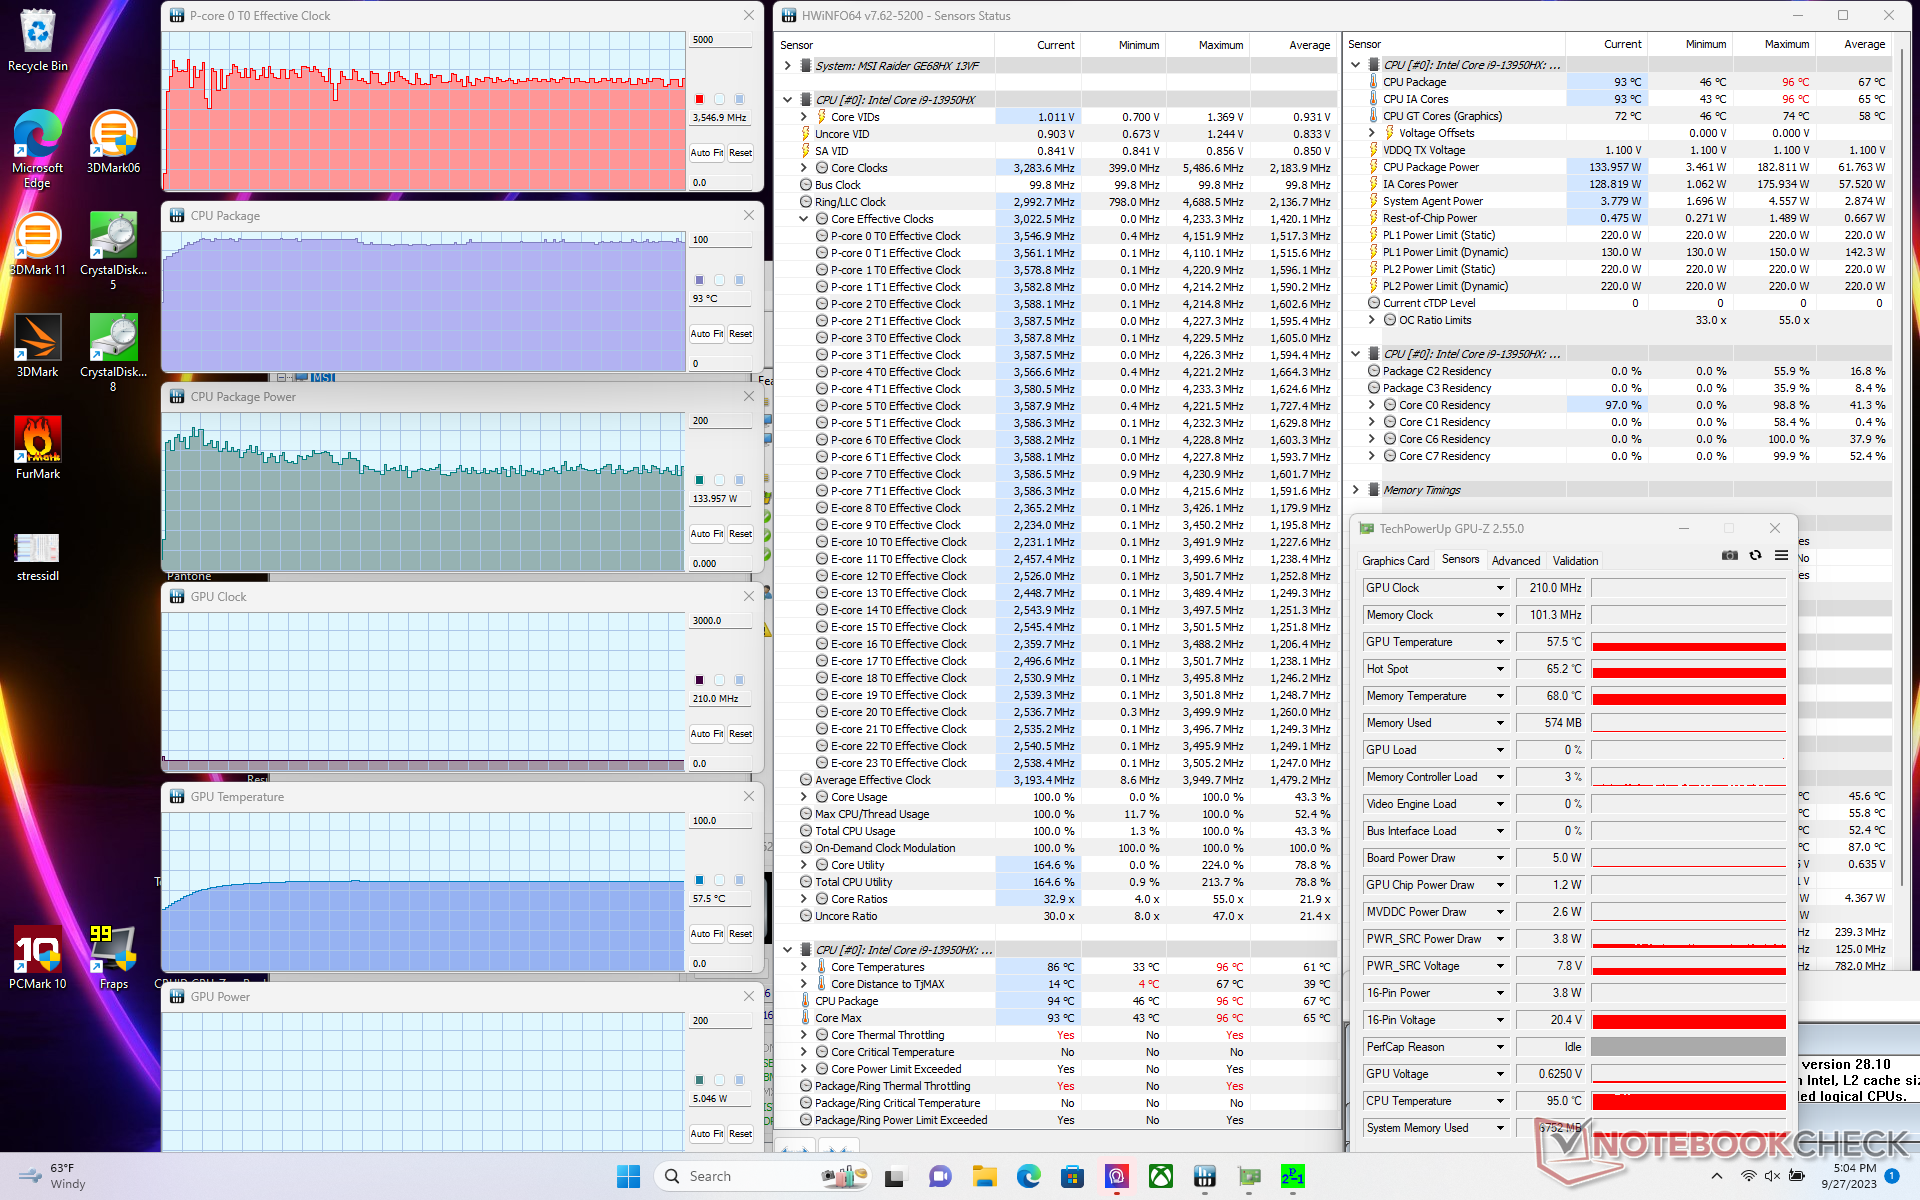
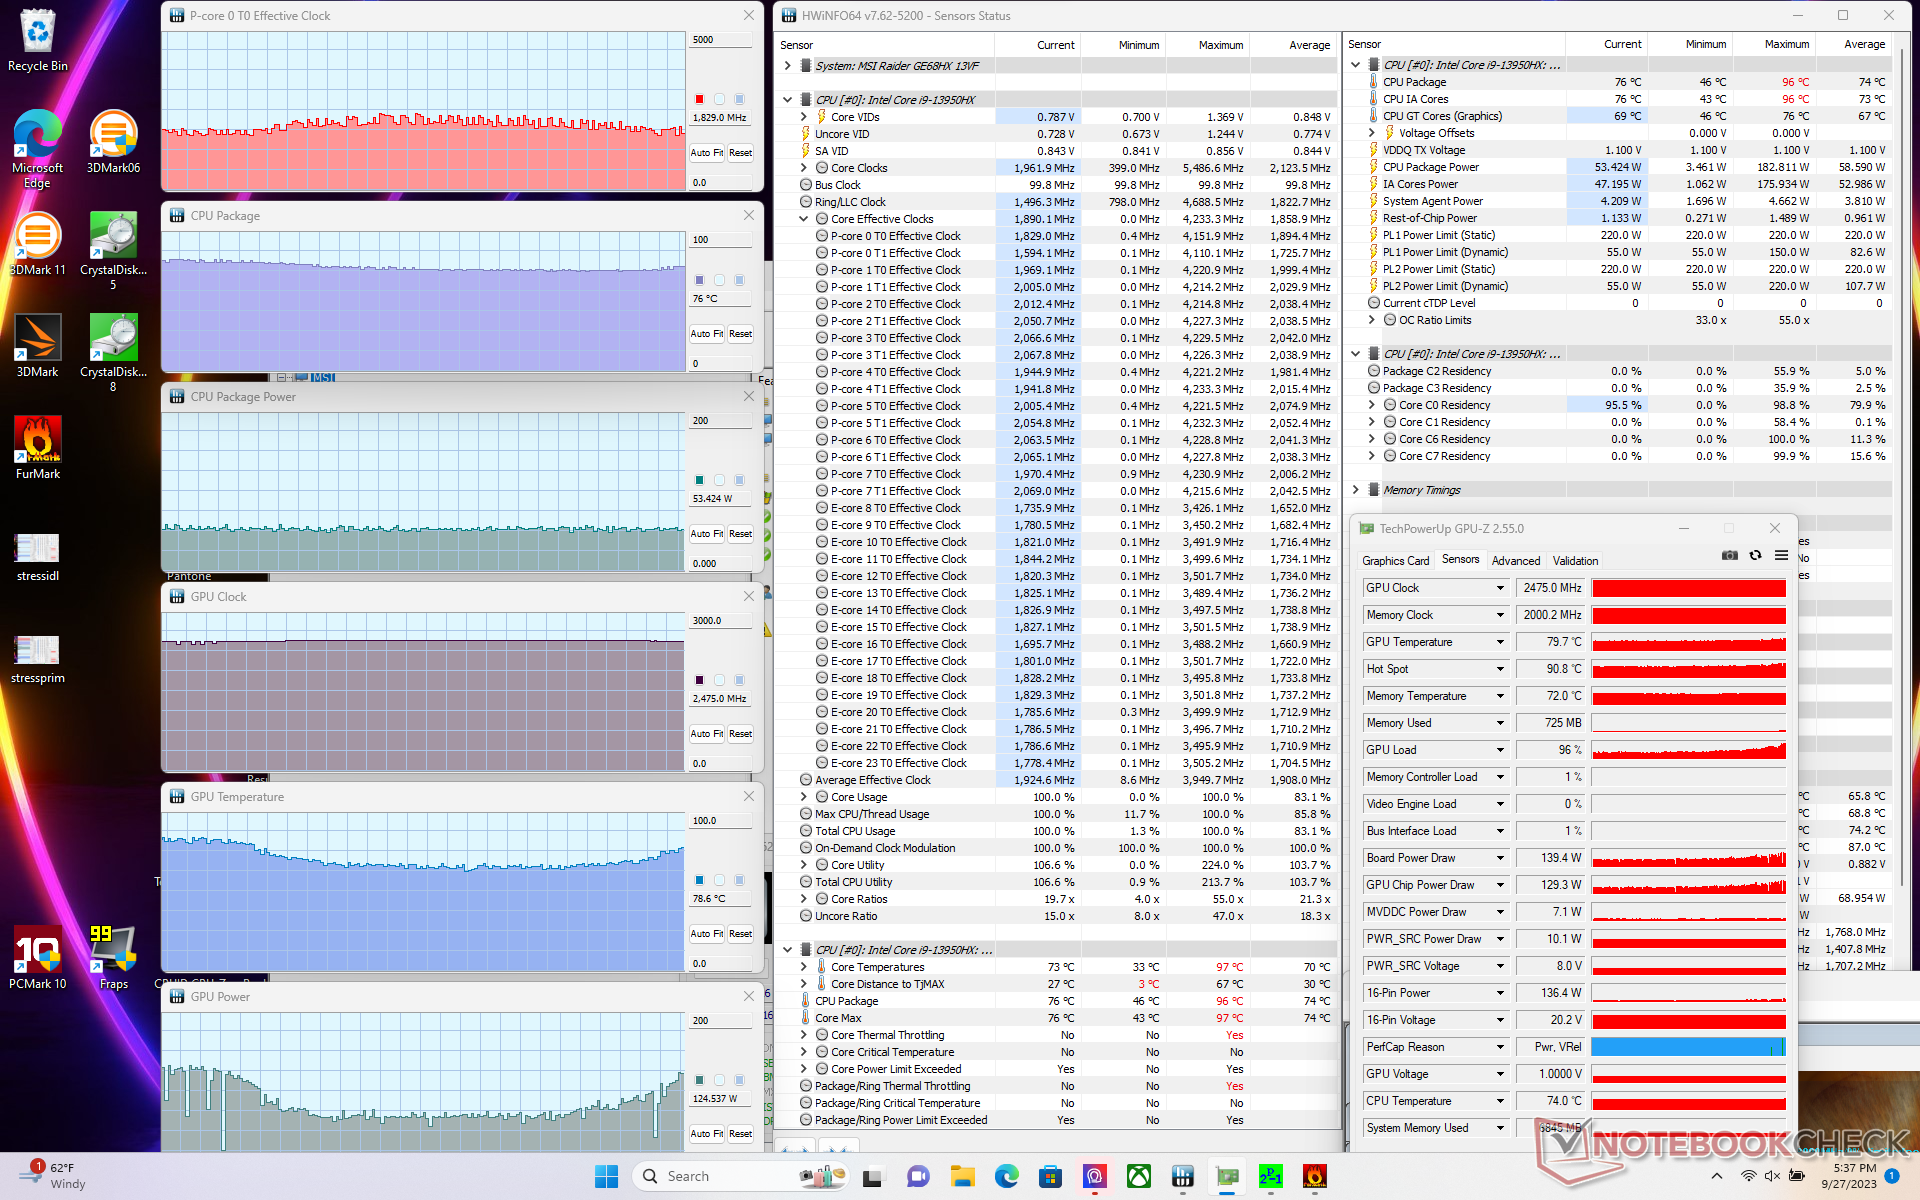
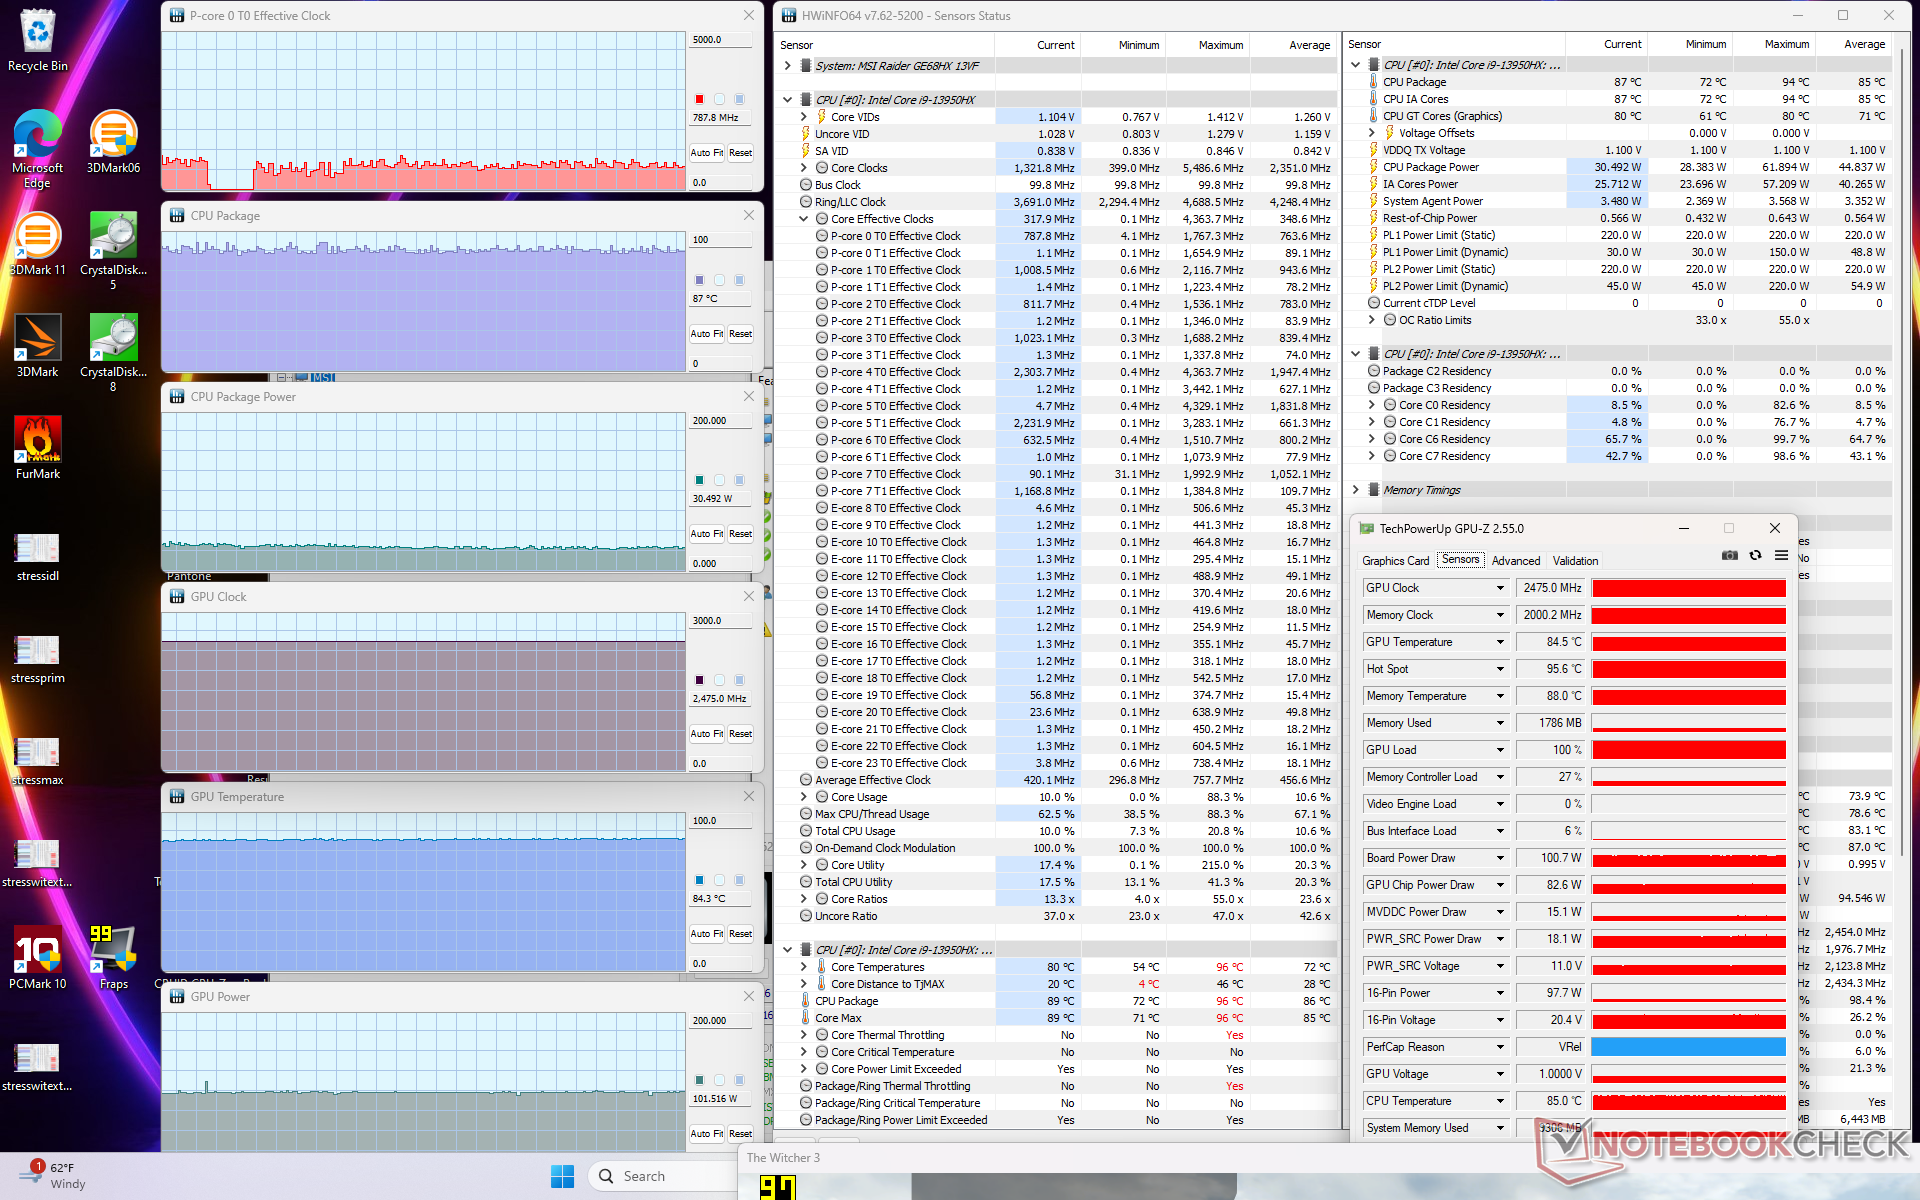
| CPU-klocka (GHz) | GPU-klocka (MHz) | Genomsnittlig CPU-temperatur (°C) | Genomsnittlig GPU-temperatur (°C) | |
| System i viloläge | -- | -- | 48 | 38 |
| Prime95 Stress (Extreme Performance mode w/ Cooler Boost off) | ~3.6 | -- | 93 | 58 |
| Prime95 + FurMark Stress (Extreme Performance mode w/ Cooler Boost off) | ~1.9 | 2475 | 73 - 78 | 63 - 81 |
| Witcher 3 Stress (balanserat läge) | ~0,8 | 2475 | 87 | 84 |
| Witcher 3 Stress (Extreme Performance mode w/ Cooler Boost off) | ~0.8 | 2490 | 88 | 70 |
| Witcher 3 Stress (Extreme Performance-lägemed Cooler Boost på) | ~0,8 | 2490 | 71 | 63 |
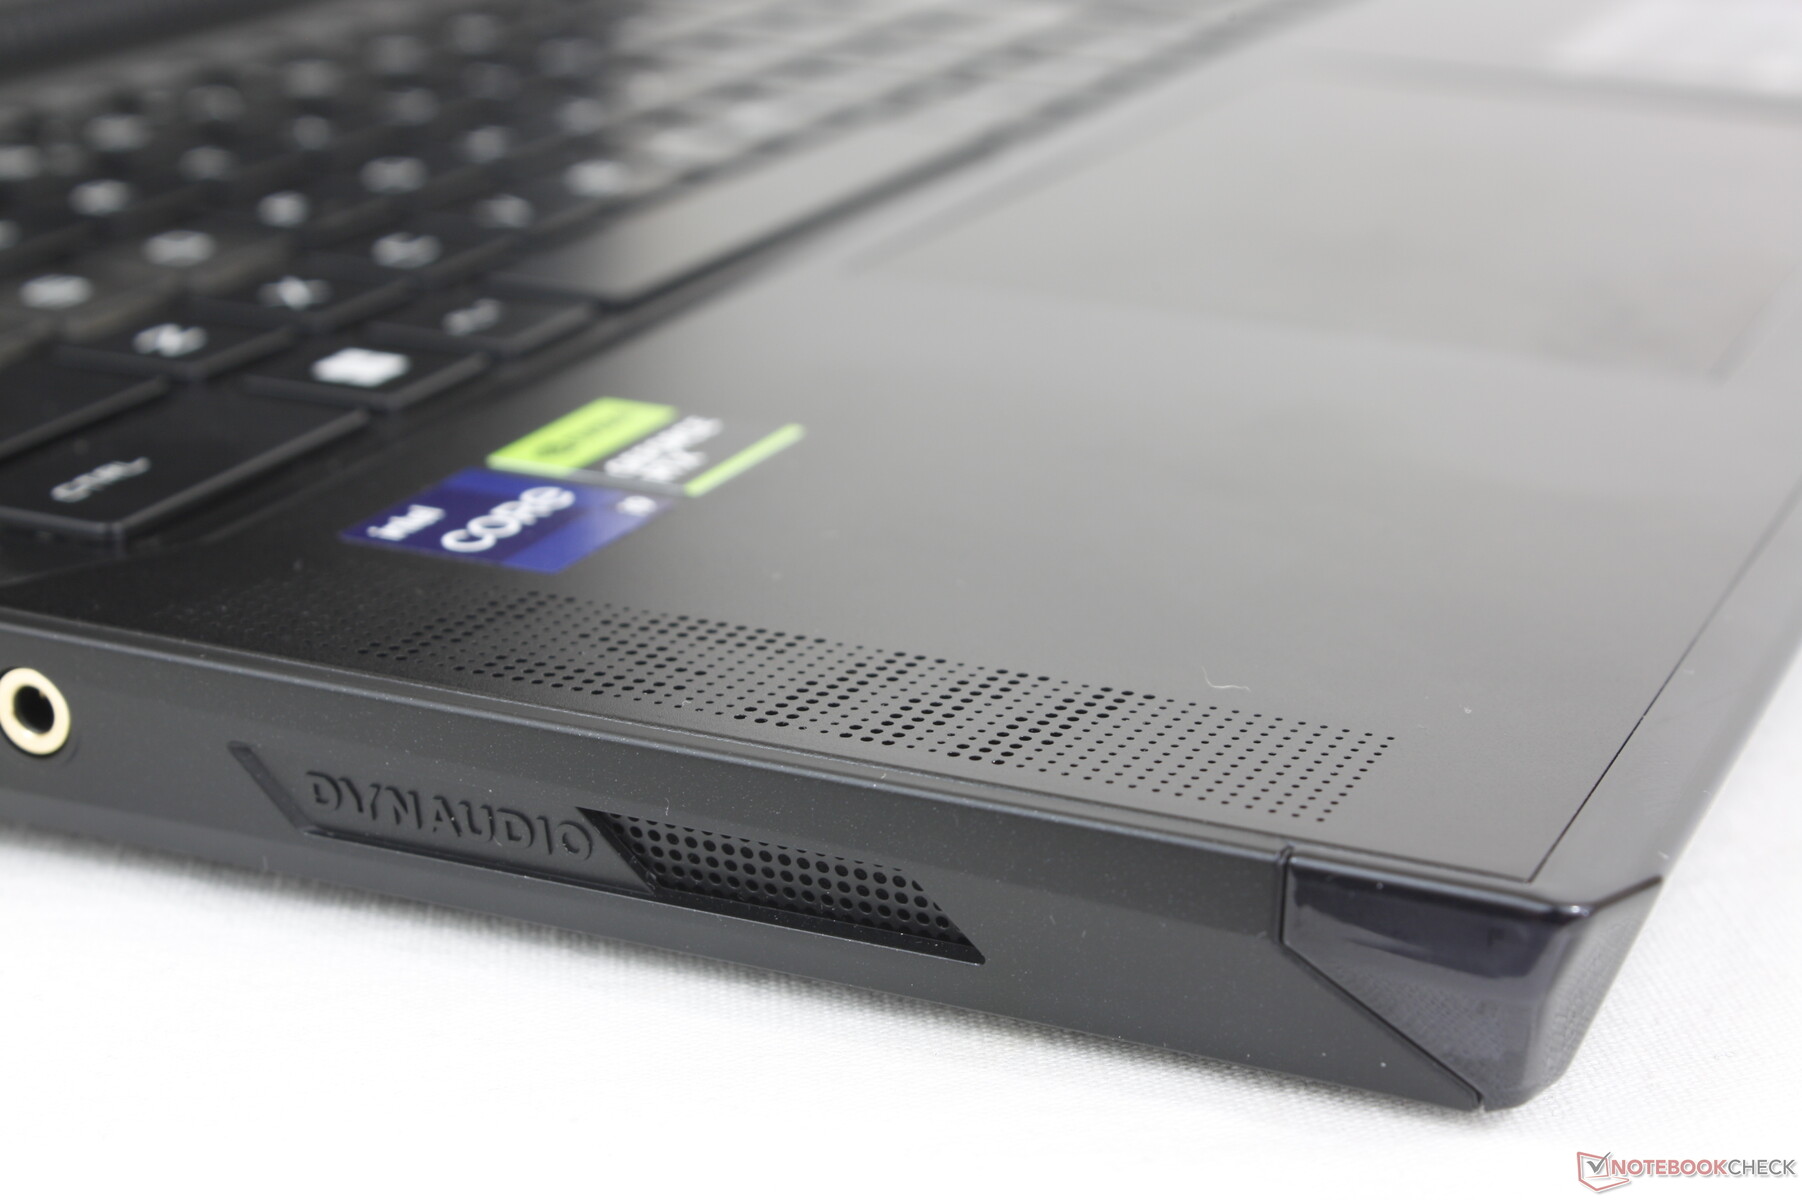
Högtalare
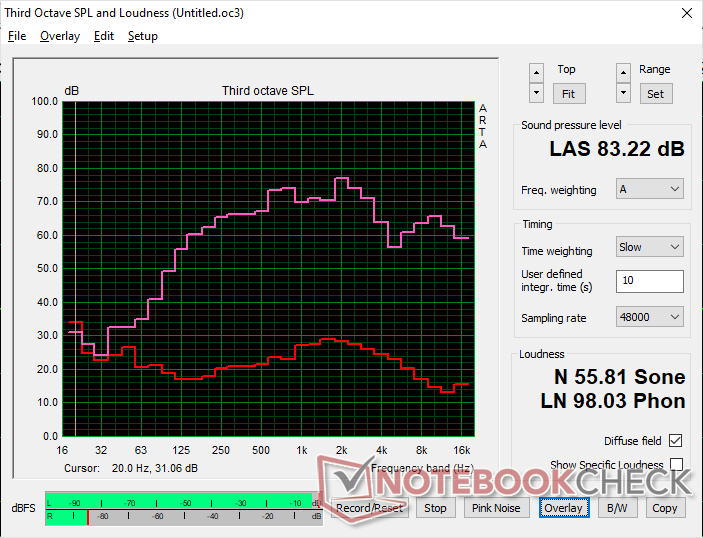
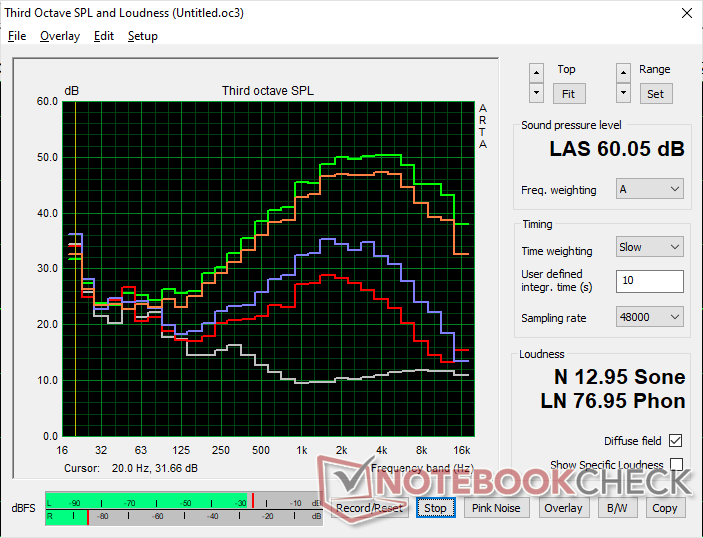
MSI Raider GE68HX 13VF ljudanalys
(+) | högtalare kan spela relativt högt (83.2 dB)
Bas 100 - 315 Hz
(±) | reducerad bas - i genomsnitt 6% lägre än medianen
(±) | linjäriteten för basen är genomsnittlig (9.5% delta till föregående frekvens)
Mellan 400 - 2000 Hz
(±) | högre mellan - i genomsnitt 5.6% högre än median
(+) | mids är linjära (5.8% delta till föregående frekvens)
Högsta 2 - 16 kHz
(+) | balanserade toppar - endast 4.5% från medianen
(±) | linjäriteten för toppar är genomsnittlig (9.5% delta till föregående frekvens)
Totalt 100 - 16 000 Hz
(+) | det totala ljudet är linjärt (13.3% skillnad mot median)
Jämfört med samma klass
» 19% av alla testade enheter i den här klassen var bättre, 5% liknande, 76% sämre
» Den bästa hade ett delta på 6%, genomsnittet var 18%, sämst var 132%
Jämfört med alla testade enheter
» 14% av alla testade enheter var bättre, 3% liknande, 83% sämre
» Den bästa hade ett delta på 4%, genomsnittet var 23%, sämst var 134%
Apple MacBook Pro 16 2021 M1 Pro ljudanalys
(+) | högtalare kan spela relativt högt (84.7 dB)
Bas 100 - 315 Hz
(+) | bra bas - bara 3.8% från medianen
(+) | basen är linjär (5.2% delta till föregående frekvens)
Mellan 400 - 2000 Hz
(+) | balanserad mellan - endast 1.3% från medianen
(+) | mids är linjära (2.1% delta till föregående frekvens)
Högsta 2 - 16 kHz
(+) | balanserade toppar - endast 1.9% från medianen
(+) | toppar är linjära (2.7% delta till föregående frekvens)
Totalt 100 - 16 000 Hz
(+) | det totala ljudet är linjärt (4.6% skillnad mot median)
Jämfört med samma klass
» 0% av alla testade enheter i den här klassen var bättre, 0% liknande, 100% sämre
» Den bästa hade ett delta på 5%, genomsnittet var 17%, sämst var 45%
Jämfört med alla testade enheter
» 0% av alla testade enheter var bättre, 0% liknande, 100% sämre
» Den bästa hade ett delta på 4%, genomsnittet var 23%, sämst var 134%
Energihantering - högre prestanda, högre förbrukning
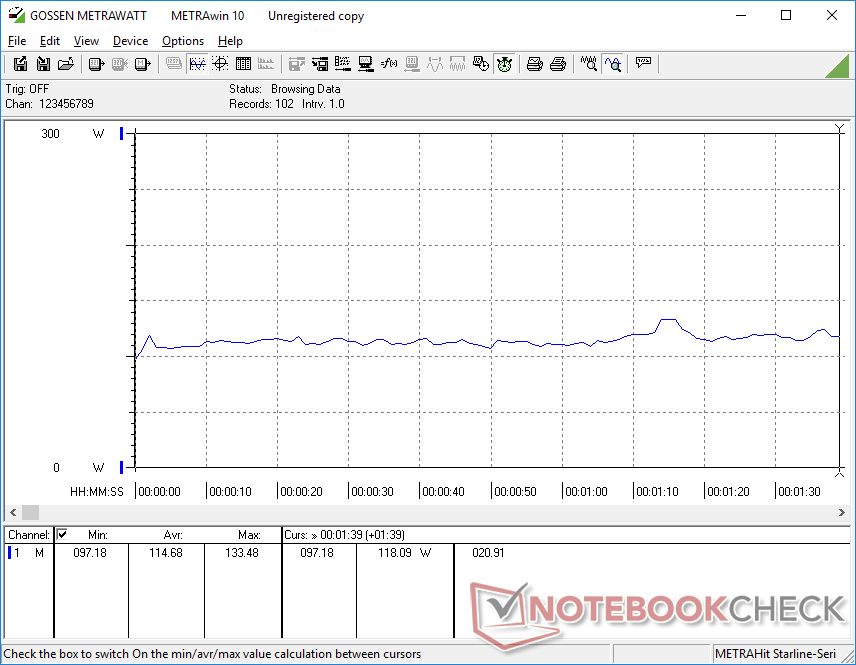
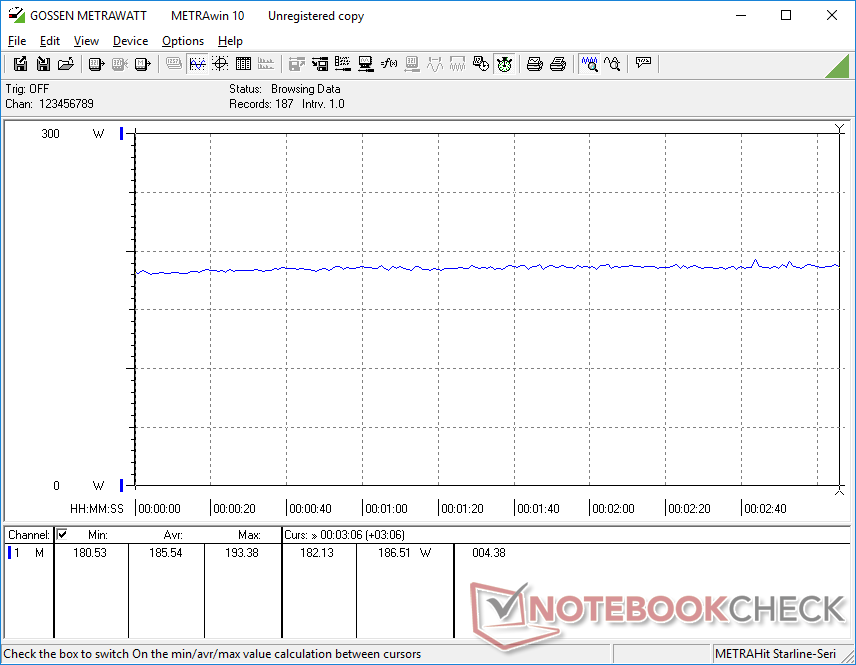
Strömförbrukning
Strömförbrukningen vid tomgångskörning på skrivbordet är ungefär densamma som på förra årets modell. Tomgångskörning i iGPU-läge med lysdioderna avstängda skulle spara så mycket som 8 W jämfört med tomgångskörning i dGPU-läge med de främre lysdioderna aktiva.
Körning Witcher 3 skulle kräva 22 procent mindre ström än på förra årets RTX 3070 Ti-drivna GE67HX, vilket korrelerar med den 10 till 15 långsammare råa grafikprestandan hos vår RTX 4060. Omvänt skulle körning av Prime95 kräva 21 procent mer ström än tidigare för en 35 till 40 procents ökning av flertrådsprestandan.
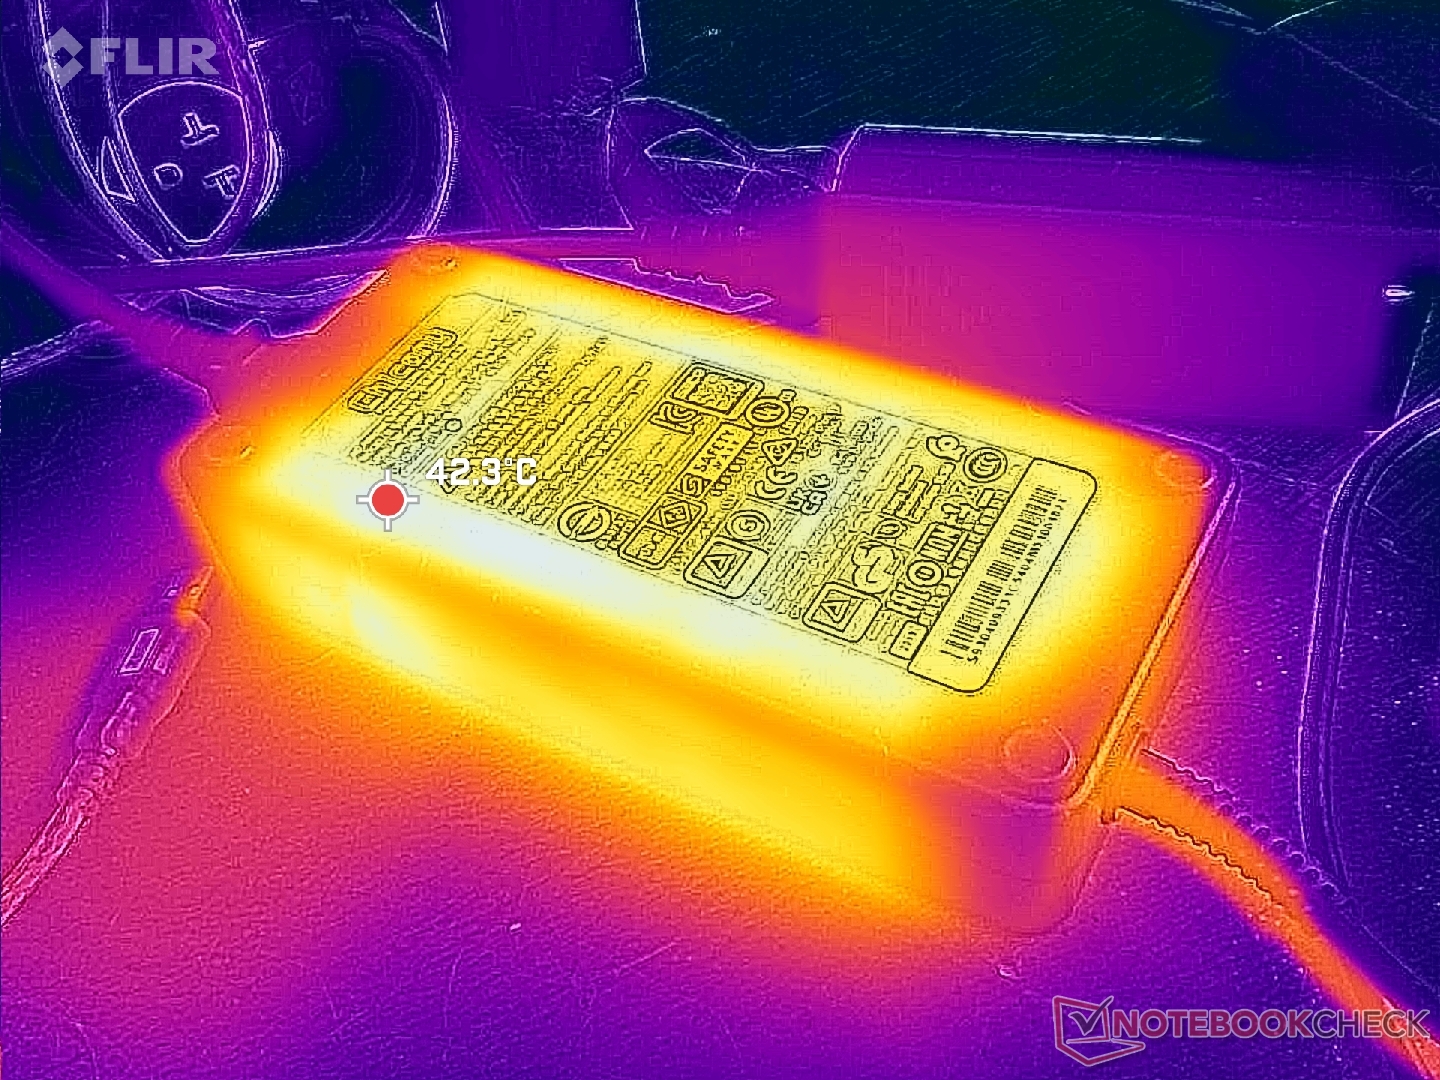
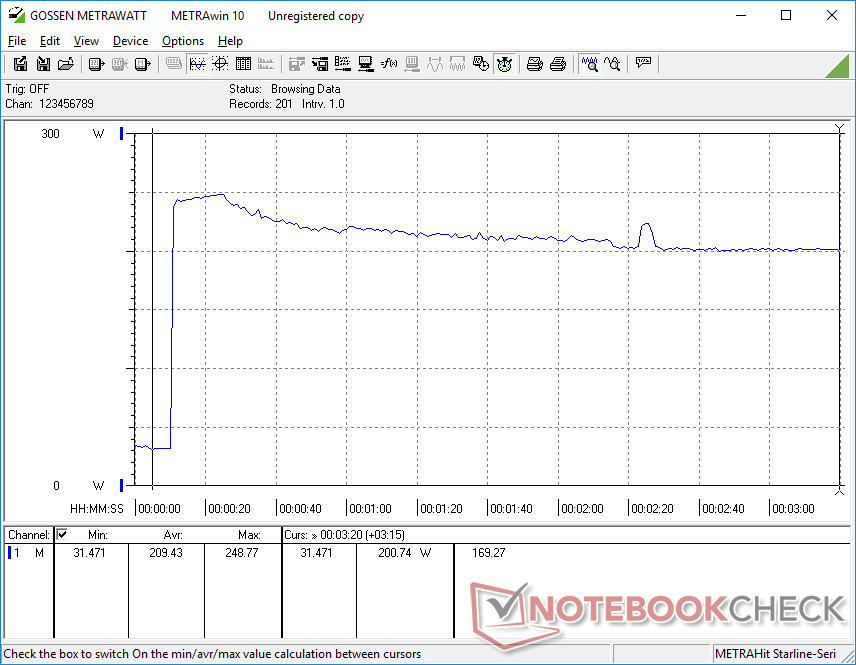
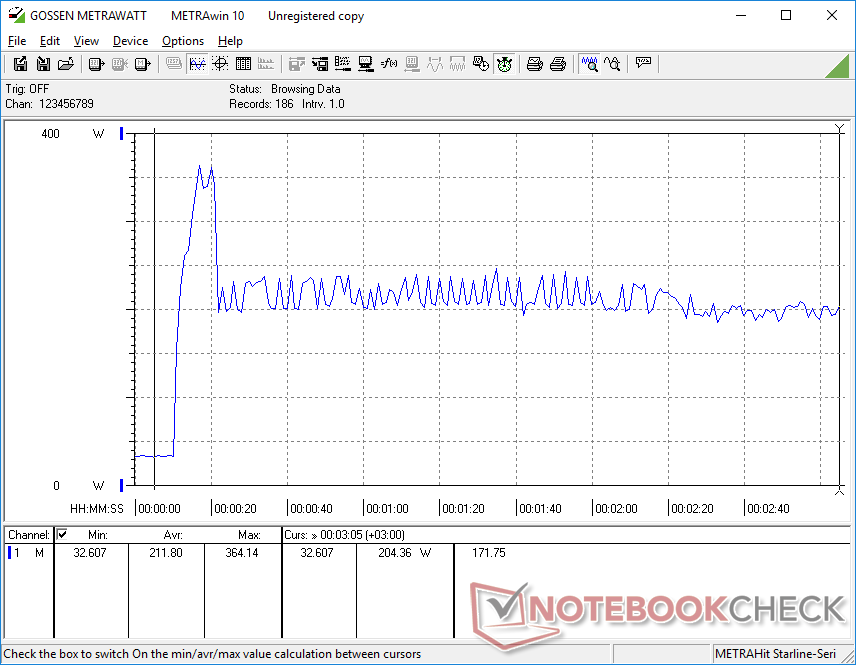
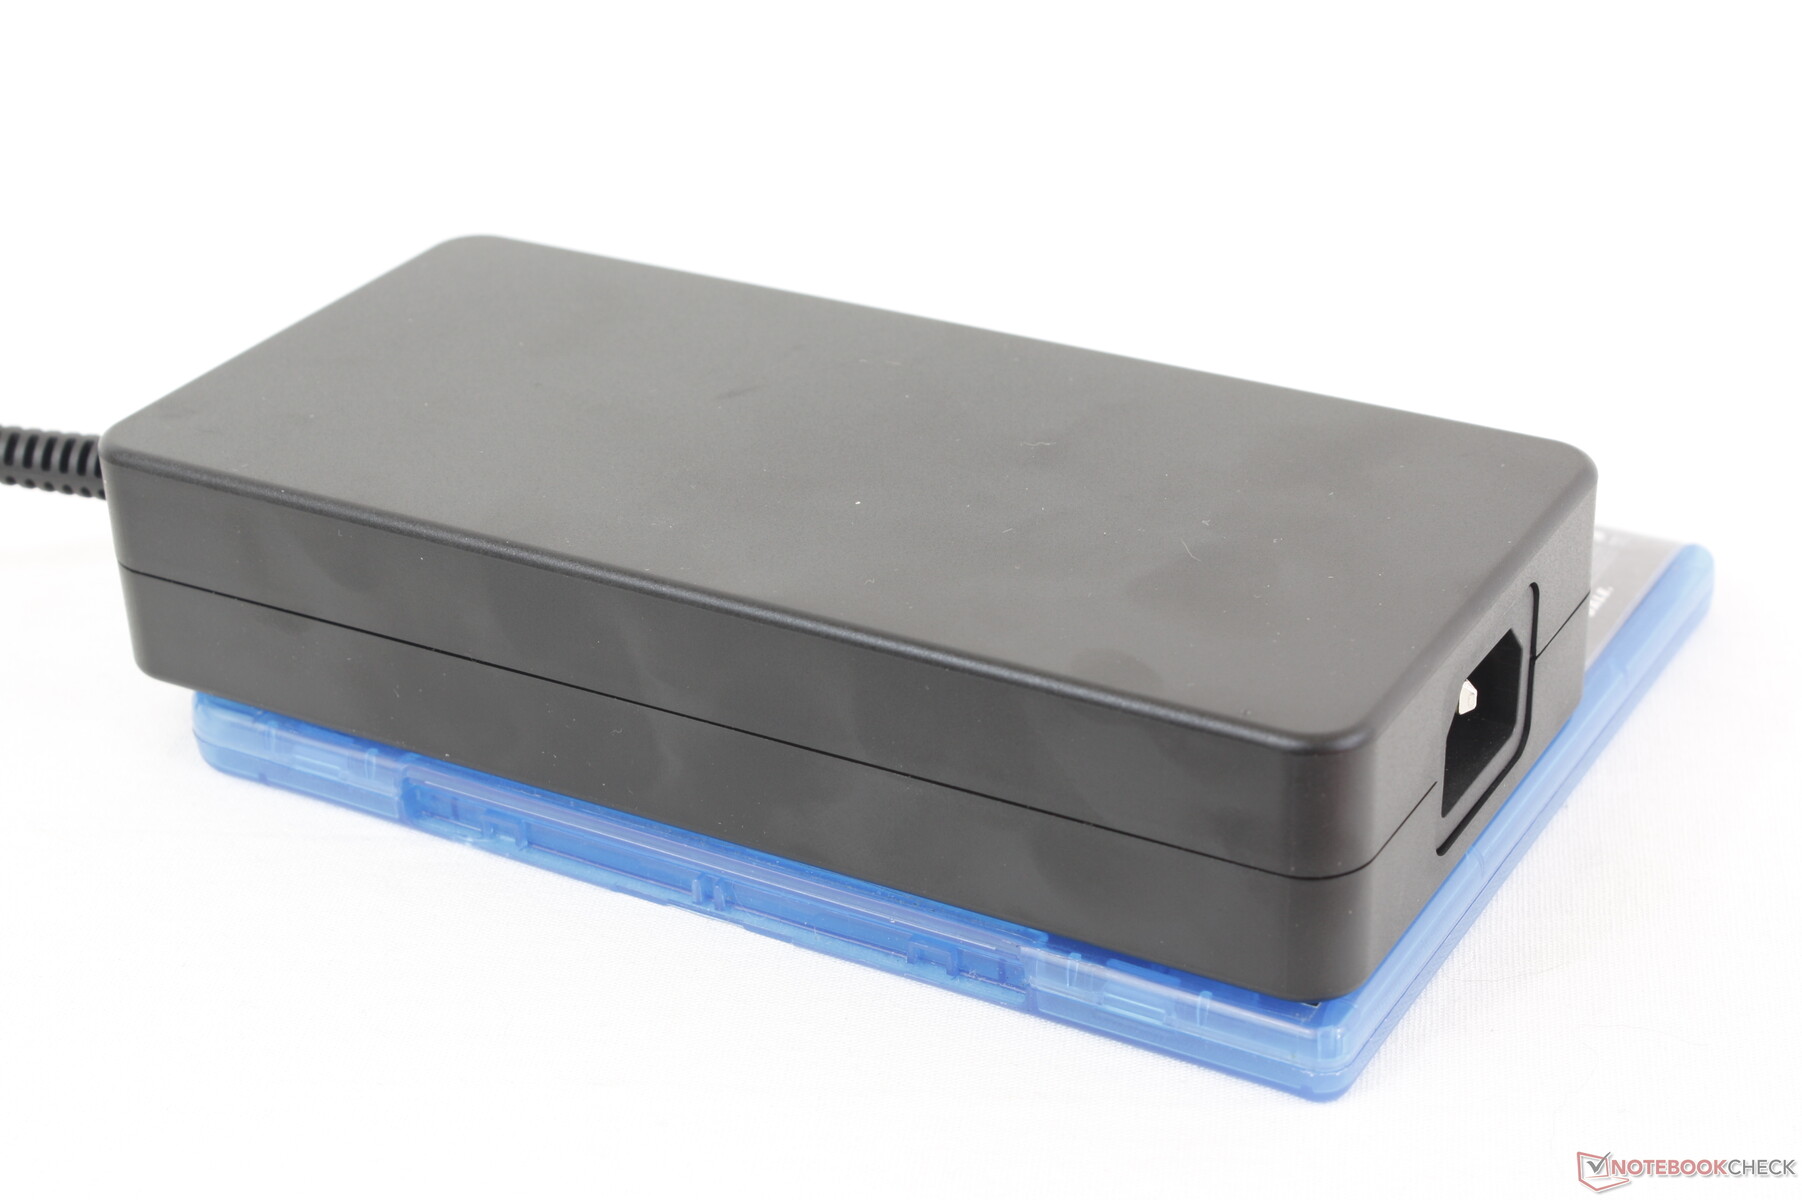
Vi kunde registrera en tillfällig maximal förbrukning på 365 W från den stora (~18 x 8,5 x 3,5 cm) 280 W AC-adaptern när vi startade både Prime95- och FurMark-stressen. Denna hastighet skulle falla och stabiliseras på cirka 204 W efter bara några sekunder, vilket visas i graferna nedan. MSI har ännu inte infört GaN-laddning till skillnad från de senaste bärbara Razer Blade-datorerna.
| Av/Standby | |
| Låg belastning | |
| Hög belastning |
|
Förklaring:
min: | |
| MSI Raider GE68HX 13VF i9-13950HX, GeForce RTX 4060 Laptop GPU, Samsung PM9B1 1024GB MZVL41T0HBLB, IPS, 1900x1200, 16" | MSI GE67 HX 12UGS i7-12800HX, GeForce RTX 3070 Ti Laptop GPU, Samsung PM9A1 MZVL21T0HCLR, OLED, 1920x1080, 15.6" | HP Omen 16-xf0376ng R7 7840HS, GeForce RTX 4070 Laptop GPU, WDC PC SN810 512GB, IPS, 1920x1080, 16.1" | Alienware m16 R1 AMD R9 7845HX, GeForce RTX 4080 Laptop GPU, Kioxia XG8 KXG80ZNV1T02, IPS, 2560x1600, 16" | Lenovo Legion Slim 7i 16 Gen 8 i9-13900H, GeForce RTX 4070 Laptop GPU, Samsung PM9A1 MZVL21T0HCLR, IPS, 2560x1600, 16" | Asus ROG Zephyrus M16 GU604VY-NM042X i9-13900H, GeForce RTX 4090 Laptop GPU, Samsung PM9A1 MZVL22T0HBLB, IPS, 2560x1600, 16" | |
|---|---|---|---|---|---|---|
| Power Consumption | 1% | 34% | -81% | -12% | -4% | |
| Idle Minimum * (Watt) | 15.8 | 16.1 -2% | 9 43% | 39 -147% | 22 -39% | 20 -27% |
| Idle Average * (Watt) | 19.4 | 17.1 12% | 14 28% | 44.6 -130% | 29 -49% | 24 -24% |
| Idle Maximum * (Watt) | 27.3 | 26.6 3% | 20 27% | 68.1 -149% | 39.5 -45% | 25 8% |
| Load Average * (Watt) | 114.7 | 116.3 -1% | 84 27% | 129.8 -13% | 98.7 14% | 107 7% |
| Witcher 3 ultra * (Watt) | 185.5 | 237 -28% | 140.9 24% | 285 -54% | 171.8 7% | 208 -12% |
| Load Maximum * (Watt) | 364.2 | 291.1 20% | 176 52% | 327.3 10% | 213.2 41% | 267 27% |
* ... mindre är bättre
Power Consumption Witcher 3 / Stresstest
Power Consumption external Monitor
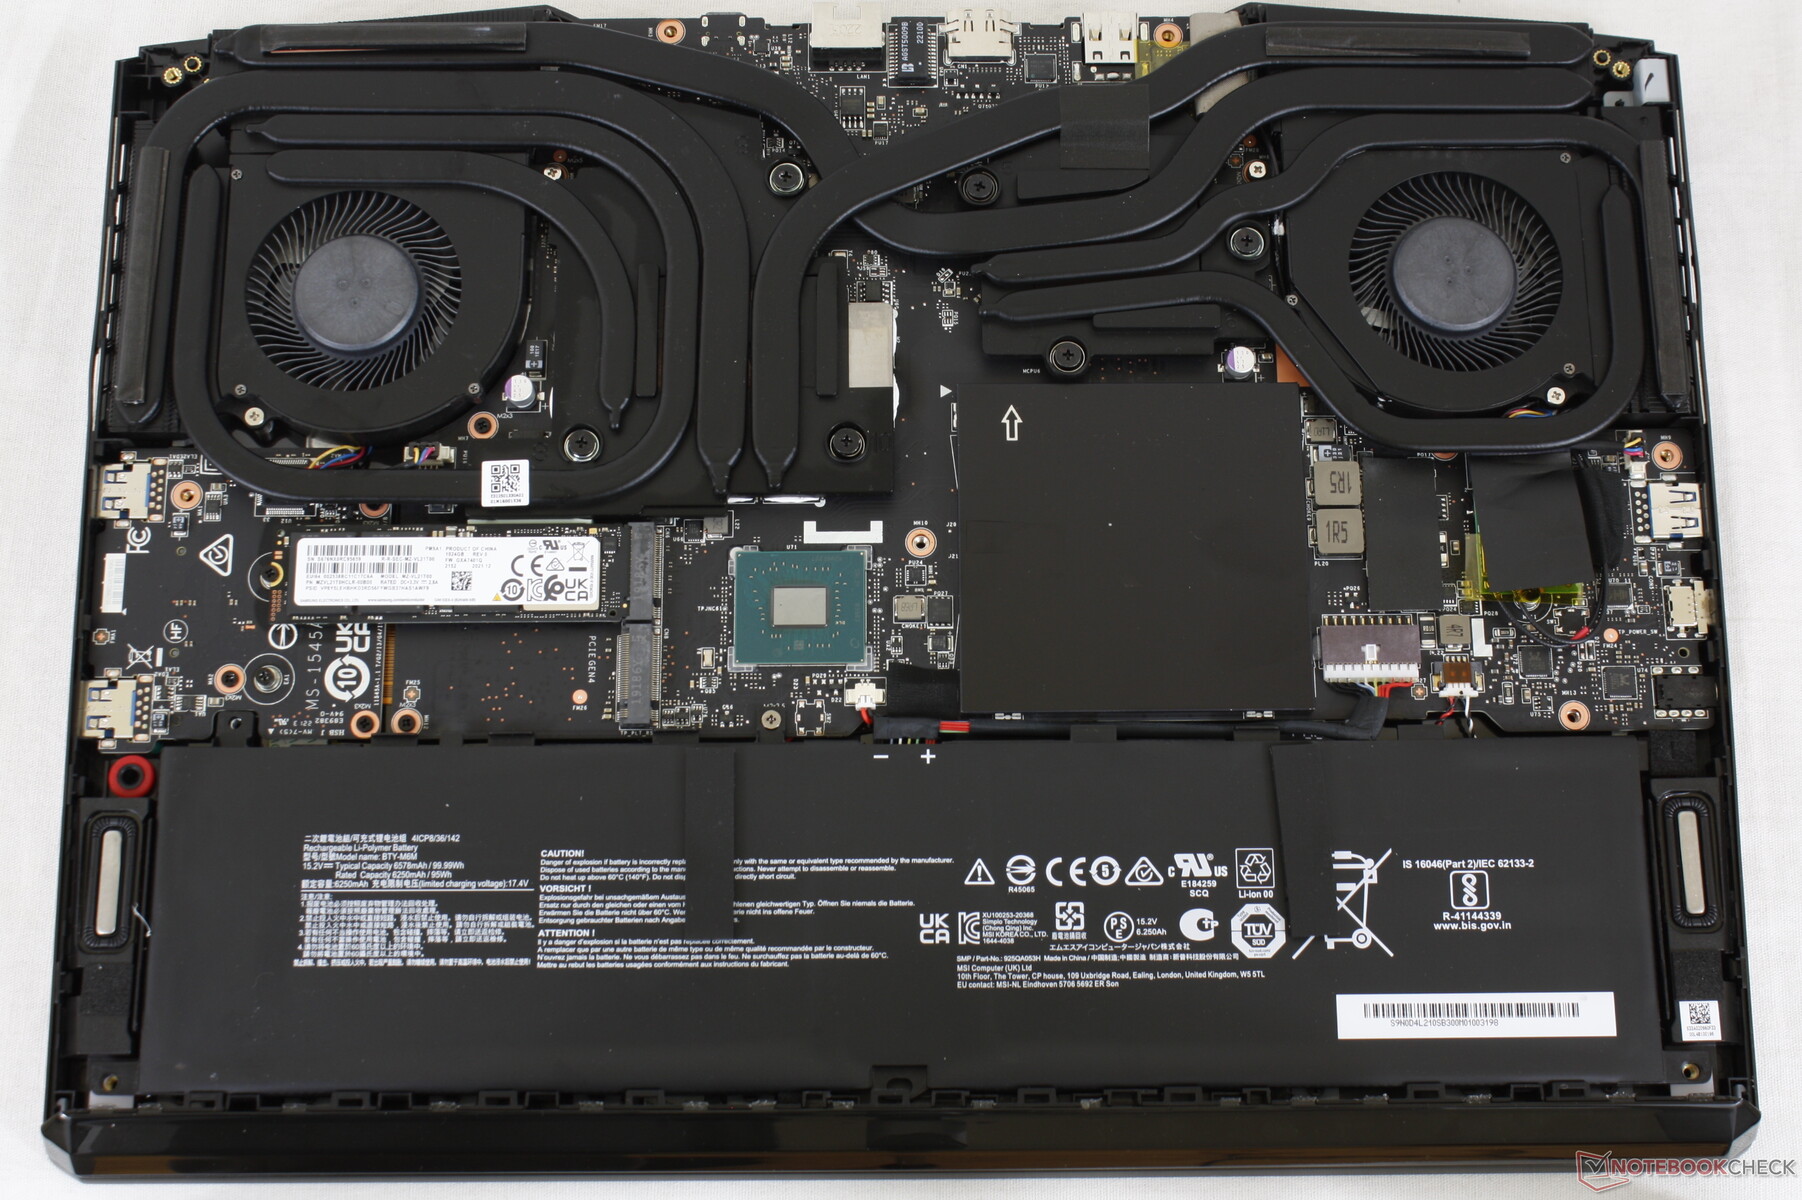
Batteritid
Batterikapaciteten är så hög som den lagligen kan vara med 99,9 Wh. Körtiderna är mycket bra för en 16-tums bärbar speldator med drygt 6,5 timmars WLAN-surfning i verkligheten med den balanserade energiprofilen och med iGPU:n aktiv. Det här är en av de mest långlivade 16-tums bärbara speldatorer vi har testat hittills.
Tyvärr är laddningen från tom till full kapacitet relativt långsam på 2,5 timmar jämfört med 1,5 timmar på de flesta andra bärbara datorer. Dessutom skulle ingen av våra USB-C AC-adaptrar ladda den bärbara datorn via någon av de tre USB-C-portarna trots att MSI annonserar Power Delivery.
| MSI Raider GE68HX 13VF i9-13950HX, GeForce RTX 4060 Laptop GPU, 99.9 Wh | MSI GE67 HX 12UGS i7-12800HX, GeForce RTX 3070 Ti Laptop GPU, 99.9 Wh | HP Omen 16-xf0376ng R7 7840HS, GeForce RTX 4070 Laptop GPU, 83 Wh | Alienware m16 R1 AMD R9 7845HX, GeForce RTX 4080 Laptop GPU, 86 Wh | Lenovo Legion Slim 7i 16 Gen 8 i9-13900H, GeForce RTX 4070 Laptop GPU, 99.9 Wh | Asus ROG Zephyrus M16 GU604VY-NM042X i9-13900H, GeForce RTX 4090 Laptop GPU, 90 Wh | |
|---|---|---|---|---|---|---|
| Batteridrifttid | -2% | -16% | -52% | -42% | 12% | |
| Reader / Idle (h) | 8.8 | 8.4 -5% | 4 -55% | 5.1 -42% | ||
| WiFi v1.3 (h) | 6.8 | 5.6 -18% | 5.7 -16% | 3.7 -46% | 4.4 -35% | 4.3 -37% |
| Load (h) | 1.8 | 2.1 17% | 0.8 -56% | 0.9 -50% | 2.9 61% | |
| H.264 (h) | 4.8 |
För
Emot
Omdöme - Inte dåligt, men missar målet
Även om vi uppskattar att tillverkaren går i en annan riktning med sin design av bärbara speldatorer, anser vi bestämt att förändringarna inte bör ske på bekostnad av slutanvändarens servicevänlighet. GE68HX är svårare att öppna än förra årets design och detta kan vara särskilt problematiskt på en gaminglaptop där ägarna är mer benägna att själva lägga till ytterligare RAM-minne och lagringsutrymme. För det andra är den nya designen märkbart tjockare och tyngre än det "renare" utseendet hos GE67HX, vilket kanske inte passar så bra för många användare.
Det finns fortfarande en handfull fördelar med det nyare chassit. För det första känns gångjärnen robustare än tidigare medan resten av chassit är lika starkt. För det andra är kärntemperaturerna svalare än på GE67HX, vilket ger bättre överklockningspotential. Prestandan är till och med något snabbare än förväntat med standardströmförsörjningsprofilen och standardinställningarna. Och slutligen kan vissa användare uppskatta den större klickplattan och den nya numpaden för andra applikationer än spel.
Prestanda och temperaturer gynnas av den tjockare chassidesignen, men alla kommer inte att vara nöjda med den tyngre vikten, svårare service och sämre skärmalternativ med tanke på det höga startpriset.
För $1700 USD och uppåt verkar dock kompromisserna med färger, G-Sync och SSD-prestanda onödiga för en modell i den avancerade GE-serien. Sådana kompromisser är mer förväntade för modeller i de lägre MSI Sword- eller Katana-serierna istället. Tillverkaren ligger också efter när det gäller laddningsteknik; mindre och mer portabla GaN-laddare från Razer kan leverera lika mycket ström medan USB-C-laddningsstödet på GE68HX verkar opålitligt.
Alternativ somLenovo Legion Slim 7i 16 Gen 8, Asus ROG Zephyrus M16eller Razer Blade 16 kanske inte alltid erbjuder Core-HX-processorer, men de är mycket mer portabla samtidigt som de har liknande grafikalternativ och bättre skärmar.
Pris och tillgänglighet
MSI Raider GE68HX 13VF
- 09/30/2023 v7 (old)
Allen Ngo
Genomskinlighet
Valet av enheter som ska granskas görs av vår redaktion. Testprovet köptes fritt av författaren på hans/hennes egen bekostnad. Långivaren hade inget inflytande på denna recension och inte heller fick tillverkaren en kopia av denna recension innan publiceringen. Det fanns ingen skyldighet att publicera denna recension. Som ett oberoende medieföretag är Notebookcheck inte föremål för auktoritet från tillverkare, återförsäljare eller förlag.
This is how Notebookcheck is testingEvery year, Notebookcheck independently reviews hundreds of laptops and smartphones using standardized procedures to ensure that all results are comparable. We have continuously developed our test methods for around 20 years and set industry standards in the process. In our test labs, high-quality measuring equipment is utilized by experienced technicians and editors. These tests involve a multi-stage validation process. Our complex rating system is based on hundreds of well-founded measurements and benchmarks, which maintains objectivity.
Price comparison

