Test: Lenovo Legion C7 15IMH05 - Allt-i-allo för gamers och kreatörer med tre års garanti (Sammanfattning)
Testgrupp
Gradering | Datum | Modell | Vikt | Höjd | Storlek | Upplösning | Pris |
|---|---|---|---|---|---|---|---|
| 85.5 % v7 (old) | 04/2021 | Lenovo Legion C7 15IMH05 82EH0030GE i7-10875H, GeForce RTX 2070 Max-Q | 2.3 kg | 19.9 mm | 15.60" | 1920x1080 | |
| 85.4 % v7 (old) | 03/2021 | Alienware m15 R4 i9-10980HK, GeForce RTX 3070 Laptop GPU | 2.3 kg | 20 mm | 15.60" | 1920x1080 | |
| 85 % v7 (old) | 02/2021 | Asus ROG Strix G15 G513QR R9 5900HX, GeForce RTX 3070 Laptop GPU | 2.3 kg | 27.2 mm | 15.60" | 1920x1080 | |
| 86 % v7 (old) | Schenker XMG Pro 15 (Early 2021, RTX 3080) i7-10870H, GeForce RTX 3080 Laptop GPU | 2 kg | 19.8 mm | 15.60" | 1920x1080 |

Anslutningar


| Networking | |
| iperf3 transmit AX12 | |
| Alienware m15 R4 | |
| Lenovo Legion 7 15IMH05-81YT001VGE | |
| Lenovo Legion C7 15IMH05 82EH0030GE | |
| Asus ROG Strix G15 G513QR | |
| Genomsnitt Intel Wi-Fi 6 AX201 (49.8 - 1775, n=324) | |
| Schenker XMG Pro 15 (Early 2021, RTX 3080) | |
| iperf3 receive AX12 | |
| Alienware m15 R4 | |
| Schenker XMG Pro 15 (Early 2021, RTX 3080) | |
| Lenovo Legion 7 15IMH05-81YT001VGE | |
| Lenovo Legion C7 15IMH05 82EH0030GE | |
| Asus ROG Strix G15 G513QR | |
| Genomsnitt Intel Wi-Fi 6 AX201 (136 - 1743, n=324) | |


")
")
 GeForce RTX 3080 Laptop GPU, i7-10870H, Samsung SSD 970 EVO Plus 1TB")
 GeForce RTX 3080 Laptop GPU, i7-10870H, Samsung SSD 970 EVO Plus 1TB")


| |||||||||||||||||||||||||
Distribution av ljusstyrkan: 87 %
Mitt på batteriet: 358 cd/m²
Kontrast: 1048:1 (Svärta: 0.42 cd/m²)
ΔE ColorChecker Calman: 6.32 | ∀{0.5-29.43 Ø4.72}
calibrated: 4.13
ΔE Greyscale Calman: 7.56 | ∀{0.09-98 Ø4.97}
100% sRGB (Argyll 1.6.3 3D)
88% AdobeRGB 1998 (Argyll 1.6.3 3D)
99.5% AdobeRGB 1998 (Argyll 3D)
99.8% sRGB (Argyll 3D)
91.9% Display P3 (Argyll 3D)
Gamma: 2.64
CCT: 7681 K
| Lenovo Legion C7 15IMH05 82EH0030GE BOW CQ NV156FHM-NY5, IPS, 1920x1080, 15.6" | Alienware m15 R4 LG Philips LGD066E, IPS, 1920x1080, 15.6" | Asus ROG Strix G15 G513QR LQ156M1JW25, IPS, 1920x1080, 15.6" | Schenker XMG Pro 15 (Early 2021, RTX 3080) AU Optronics AUO7A8C (B156HAN12.0), IPS, 1920x1080, 15.6" | Lenovo Legion 7 15IMH05-81YT001VGE AUO048E, IPS, 1920x1080, 15.6" | |
|---|---|---|---|---|---|
| Display | -18% | -21% | -18% | -17% | |
| Display P3 Coverage (%) | 91.9 | 69.4 -24% | 67.7 -26% | 69.2 -25% | 70.3 -24% |
| sRGB Coverage (%) | 99.8 | 99 -1% | 94.3 -6% | 99.7 0% | 99.4 0% |
| AdobeRGB 1998 Coverage (%) | 99.5 | 70.5 -29% | 68.2 -31% | 70.8 -29% | 71.3 -28% |
| Response Times | -93% | -83% | -80% | -62% | |
| Response Time Grey 50% / Grey 80% * (ms) | 14 ? | 7.4 ? 47% | 8.2 ? 41% | 3.6 ? 74% | 8 ? 43% |
| Response Time Black / White * (ms) | 3 ? | 10 ? -233% | 9.2 ? -207% | 10 ? -233% | 8 ? -167% |
| PWM Frequency (Hz) | |||||
| Screen | 22% | 14% | 26% | 32% | |
| Brightness middle (cd/m²) | 440 | 333 -24% | 308 -30% | 327 -26% | 470 7% |
| Brightness (cd/m²) | 414 | 303 -27% | 288 -30% | 335 -19% | 468 13% |
| Brightness Distribution (%) | 87 | 86 -1% | 86 -1% | 89 2% | 85 -2% |
| Black Level * (cd/m²) | 0.42 | 0.29 31% | 0.23 45% | 0.22 48% | 0.21 50% |
| Contrast (:1) | 1048 | 1148 10% | 1339 28% | 1486 42% | 2238 114% |
| Colorchecker dE 2000 * | 6.32 | 1.8 72% | 3.28 48% | 2.18 66% | 3.28 48% |
| Colorchecker dE 2000 max. * | 9.96 | 4.49 55% | 8.51 15% | 4.24 57% | 7.31 27% |
| Colorchecker dE 2000 calibrated * | 4.13 | 1.13 73% | 0.83 80% | 1 76% | 0.8 81% |
| Greyscale dE 2000 * | 7.56 | 1.9 75% | 5 34% | 2.6 66% | 4.49 41% |
| Gamma | 2.64 83% | 2.265 97% | 2.057 107% | 2.123 104% | 2.4 92% |
| CCT | 7681 85% | 6840 95% | 7393 88% | 6815 95% | 7438 87% |
| Color Space (Percent of AdobeRGB 1998) (%) | 88 | 71 -19% | 68 -23% | 71 -19% | 65 -26% |
| Color Space (Percent of sRGB) (%) | 100 | 93 -7% | 90 -10% | 93 -7% | 99 -1% |
| Totalt genomsnitt (program/inställningar) | -30% /
-0% | -30% /
-5% | -24% /
5% | -16% /
11% |
* ... mindre är bättre
Visa svarstider
| ↔ Svarstid svart till vitt | ||
|---|---|---|
| 3 ms ... stiga ↗ och falla ↘ kombinerat | ↗ 1 ms stiga |  |
| ↘ 2 ms hösten | ||
| Skärmen visar väldigt snabba svarsfrekvenser i våra tester och borde vara mycket väl lämpad för fartfyllt spel. I jämförelse sträcker sig alla testade enheter från 0.1 (minst) till 240 (maximalt) ms. » 14 % av alla enheter är bättre. Det betyder att den uppmätta svarstiden är bättre än genomsnittet av alla testade enheter (19.8 ms). | ||
| ↔ Svarstid 50 % grått till 80 % grått | ||
| 14 ms ... stiga ↗ och falla ↘ kombinerat | ↗ 7 ms stiga |  |
| ↘ 7 ms hösten | ||
| Skärmen visar bra svarsfrekvens i våra tester, men kan vara för långsam för konkurrenskraftiga spelare. I jämförelse sträcker sig alla testade enheter från 0.165 (minst) till 636 (maximalt) ms. » 28 % av alla enheter är bättre. Det betyder att den uppmätta svarstiden är bättre än genomsnittet av alla testade enheter (31 ms). | ||
Skärmflimmer / PWM (Puls-Width Modulation)
| Skärmflimmer / PWM upptäcktes inte |  | ||
Som jämförelse: 52 % av alla testade enheter använder inte PWM för att dämpa skärmen. Om PWM upptäcktes mättes ett medelvärde av 7769 (minst: 5 - maximum: 343500) Hz. | |||
| Cinebench R15 | |
| CPU Single 64Bit | |
| Genomsnitt av klass Gaming (188.8 - 343, n=109, senaste 2 åren) | |
| Asus ROG Strix G15 G513QR | |
| Lenovo Legion 7 15IMH05-81YT001VGE | |
| Lenovo Legion C7 15IMH05 82EH0030GE | |
| Genomsnitt Intel Core i7-10875H (190 - 220, n=37) | |
| Schenker XMG Pro 15 (Early 2021, RTX 3080) | |
| Alienware m15 R4 | |
| Lenovo Legion C7 15IMH05 82EH0030GE (Hoechstleistung) | |
| Lenovo Legion C7 15IMH05 82EH0030GE (Fluestermodus) | |
| CPU Multi 64Bit | |
| Genomsnitt av klass Gaming (1578 - 6271, n=108, senaste 2 åren) | |
| Asus ROG Strix G15 G513QR | |
| Schenker XMG Pro 15 (Early 2021, RTX 3080) | |
| Lenovo Legion C7 15IMH05 82EH0030GE | |
| Lenovo Legion 7 15IMH05-81YT001VGE | |
| Lenovo Legion C7 15IMH05 82EH0030GE (Hoechstleistung) | |
| Alienware m15 R4 | |
| Genomsnitt Intel Core i7-10875H (1003 - 1833, n=38) | |
| Lenovo Legion C7 15IMH05 82EH0030GE (Fluestermodus) | |
| Blender - v2.79 BMW27 CPU | |
| Lenovo Legion C7 15IMH05 82EH0030GE (Fluestermodus) | |
| Genomsnitt Intel Core i7-10875H (259 - 535, n=30) | |
| Lenovo Legion C7 15IMH05 82EH0030GE | |
| Schenker XMG Pro 15 (Early 2021, RTX 3080) | |
| Lenovo Legion C7 15IMH05 82EH0030GE (Hoechstleistung) | |
| Alienware m15 R4 | |
| Lenovo Legion 7 15IMH05-81YT001VGE | |
| Asus ROG Strix G15 G513QR | |
| Genomsnitt av klass Gaming (80 - 330, n=107, senaste 2 åren) | |
| 7-Zip 18.03 | |
| 7z b 4 -mmt1 | |
| Genomsnitt av klass Gaming (4199 - 7436, n=108, senaste 2 åren) | |
| Asus ROG Strix G15 G513QR | |
| Lenovo Legion 7 15IMH05-81YT001VGE | |
| Alienware m15 R4 | |
| Lenovo Legion C7 15IMH05 82EH0030GE | |
| Genomsnitt Intel Core i7-10875H (5071 - 5780, n=31) | |
| Lenovo Legion C7 15IMH05 82EH0030GE (Hoechstleistung) | |
| Schenker XMG Pro 15 (Early 2021, RTX 3080) | |
| Lenovo Legion C7 15IMH05 82EH0030GE (Fluestermodus) | |
| 7z b 4 | |
| Genomsnitt av klass Gaming (33491 - 148086, n=108, senaste 2 åren) | |
| Asus ROG Strix G15 G513QR | |
| Lenovo Legion C7 15IMH05 82EH0030GE (Hoechstleistung) | |
| Lenovo Legion 7 15IMH05-81YT001VGE | |
| Alienware m15 R4 | |
| Lenovo Legion C7 15IMH05 82EH0030GE | |
| Schenker XMG Pro 15 (Early 2021, RTX 3080) | |
| Genomsnitt Intel Core i7-10875H (29844 - 49562, n=31) | |
| Lenovo Legion C7 15IMH05 82EH0030GE (Fluestermodus) | |
| Cinebench R20 | |
| CPU (Single Core) | |
| Genomsnitt av klass Gaming (442 - 895, n=109, senaste 2 åren) | |
| Asus ROG Strix G15 G513QR | |
| Lenovo Legion 7 15IMH05-81YT001VGE | |
| Lenovo Legion C7 15IMH05 82EH0030GE (Hoechstleistung) | |
| Genomsnitt Intel Core i7-10875H (430 - 524, n=32) | |
| Lenovo Legion C7 15IMH05 82EH0030GE | |
| Alienware m15 R4 | |
| Schenker XMG Pro 15 (Early 2021, RTX 3080) | |
| Lenovo Legion C7 15IMH05 82EH0030GE (Fluestermodus) | |
| CPU (Multi Core) | |
| Genomsnitt av klass Gaming (4029 - 16108, n=109, senaste 2 åren) | |
| Asus ROG Strix G15 G513QR | |
| Lenovo Legion 7 15IMH05-81YT001VGE | |
| Alienware m15 R4 | |
| Lenovo Legion C7 15IMH05 82EH0030GE (Hoechstleistung) | |
| Genomsnitt Intel Core i7-10875H (1986 - 4176, n=32) | |
| Schenker XMG Pro 15 (Early 2021, RTX 3080) | |
| Lenovo Legion C7 15IMH05 82EH0030GE | |
| Lenovo Legion C7 15IMH05 82EH0030GE (Fluestermodus) | |
| Geekbench 5.5 | |
| Single-Core | |
| Genomsnitt av klass Gaming (986 - 2474, n=108, senaste 2 åren) | |
| Asus ROG Strix G15 G513QR | |
| Lenovo Legion 7 15IMH05-81YT001VGE | |
| Alienware m15 R4 | |
| Lenovo Legion C7 15IMH05 82EH0030GE | |
| Lenovo Legion C7 15IMH05 82EH0030GE (Hoechstleistung) | |
| Genomsnitt Intel Core i7-10875H (1233 - 1371, n=29) | |
| Schenker XMG Pro 15 (Early 2021, RTX 3080) | |
| Lenovo Legion C7 15IMH05 82EH0030GE (Fluestermodus) | |
| Multi-Core | |
| Genomsnitt av klass Gaming (6460 - 27010, n=108, senaste 2 åren) | |
| Lenovo Legion 7 15IMH05-81YT001VGE | |
| Lenovo Legion C7 15IMH05 82EH0030GE | |
| Lenovo Legion C7 15IMH05 82EH0030GE (Hoechstleistung) | |
| Alienware m15 R4 | |
| Schenker XMG Pro 15 (Early 2021, RTX 3080) | |
| Genomsnitt Intel Core i7-10875H (5715 - 8620, n=29) | |
| Asus ROG Strix G15 G513QR | |
| Lenovo Legion C7 15IMH05 82EH0030GE (Fluestermodus) | |
| HWBOT x265 Benchmark v2.2 - 4k Preset | |
| Genomsnitt av klass Gaming (11.5 - 44.3, n=108, senaste 2 åren) | |
| Asus ROG Strix G15 G513QR | |
| Lenovo Legion 7 15IMH05-81YT001VGE | |
| Alienware m15 R4 | |
| Lenovo Legion C7 15IMH05 82EH0030GE (Hoechstleistung) | |
| Lenovo Legion C7 15IMH05 82EH0030GE | |
| Genomsnitt Intel Core i7-10875H (7.27 - 14.1, n=27) | |
| Schenker XMG Pro 15 (Early 2021, RTX 3080) | |
| Lenovo Legion C7 15IMH05 82EH0030GE (Fluestermodus) | |
| LibreOffice - 20 Documents To PDF | |
| Schenker XMG Pro 15 (Early 2021, RTX 3080) | |
| Lenovo Legion C7 15IMH05 82EH0030GE (Fluestermodus) | |
| Lenovo Legion C7 15IMH05 82EH0030GE | |
| Lenovo Legion 7 15IMH05-81YT001VGE | |
| Asus ROG Strix G15 G513QR | |
| Genomsnitt Intel Core i7-10875H (30.2 - 84.3, n=30) | |
| Alienware m15 R4 | |
| Genomsnitt av klass Gaming (19 - 88.8, n=108, senaste 2 åren) | |
| Lenovo Legion C7 15IMH05 82EH0030GE (Hoechstleistung) | |
| R Benchmark 2.5 - Overall mean | |
| Lenovo Legion C7 15IMH05 82EH0030GE (Fluestermodus) | |
| Schenker XMG Pro 15 (Early 2021, RTX 3080) | |
| Genomsnitt Intel Core i7-10875H (0.546 - 0.662, n=29) | |
| Lenovo Legion C7 15IMH05 82EH0030GE | |
| Alienware m15 R4 | |
| Lenovo Legion C7 15IMH05 82EH0030GE (Hoechstleistung) | |
| Lenovo Legion 7 15IMH05-81YT001VGE | |
| Asus ROG Strix G15 G513QR | |
| Genomsnitt av klass Gaming (0.3439 - 0.759, n=109, senaste 2 åren) | |
* ... mindre är bättre
| PCMark 8 Home Score Accelerated v2 | 4388 poäng | |
| PCMark 8 Creative Score Accelerated v2 | 6297 poäng | |
| PCMark 8 Work Score Accelerated v2 | 5551 poäng | |
| PCMark 10 Score | 6263 poäng | |
Hjälp | ||
| DPC Latencies / LatencyMon - interrupt to process latency (max), Web, Youtube, Prime95 | |
| Alienware m15 R4 | |
| Lenovo Legion C7 15IMH05 82EH0030GE | |
| Lenovo Legion 7 15IMH05-81YT001VGE | |
| Schenker XMG Pro 15 (Early 2021, RTX 3080) | |
| Asus ROG Strix G15 G513QR | |
* ... mindre är bättre

| Lenovo Legion C7 15IMH05 82EH0030GE Samsung PM981a MZVLB1T0HBLR | Alienware m15 R4 Micron 2300 1TB MTFDHBA1T0TDV | Asus ROG Strix G15 G513QR SK Hynix HFM001TD3JX013N | Schenker XMG Pro 15 (Early 2021, RTX 3080) Samsung SSD 970 EVO Plus 1TB | Lenovo Legion 7 15IMH05-81YT001VGE 2x Samsung PM981a MZVLB1T0HBLR (RAID 0) | Genomsnitt Samsung PM981a MZVLB1T0HBLR | Genomsnitt av klass Gaming | |
|---|---|---|---|---|---|---|---|
| CrystalDiskMark 5.2 / 6 | 5% | 19% | 9% | 2% | 66% | ||
| Write 4K (MB/s) | 107.9 | 93.7 -13% | 160.9 49% | 110.4 2% | 139.7 ? 29% | 202 ? 87% | |
| Read 4K (MB/s) | 48.48 | 48.1 -1% | 54 11% | 55.1 14% | 49.9 ? 3% | 78.2 ? 61% | |
| Write Seq (MB/s) | 2910 | 2785 -4% | 2944 1% | 2036 ? -30% | 3726 ? 28% | ||
| Read Seq (MB/s) | 2015 | 2598 29% | 2781 38% | 2014 ? 0% | 3617 ? 80% | ||
| Write 4K Q32T1 (MB/s) | 413 | 481.9 17% | 495.2 20% | 466.6 13% | 461 ? 12% | 611 ? 48% | |
| Read 4K Q32T1 (MB/s) | 468.9 | 521 11% | 593 26% | 517 10% | 499 ? 6% | 712 ? 52% | |
| Write Seq Q32T1 (MB/s) | 3016 | 3362 11% | 3283 9% | 3424 14% | 2903 ? -4% | 5242 ? 74% | |
| Read Seq Q32T1 (MB/s) | 3533 | 3200 -9% | 3549 0% | 3519 0% | 3479 ? -2% | 7011 ? 98% | |
| Write 4K Q8T8 (MB/s) | 1496 | 1491 ? | 1306 ? | ||||
| Read 4K Q8T8 (MB/s) | 1597 | 1499 ? | 1633 ? | ||||
| AS SSD | -23% | 2% | 24% | 1% | 1% | 50% | |
| Seq Read (MB/s) | 2804 | 2658 -5% | 2881 3% | 2959 6% | 3088 10% | 2553 ? -9% | 5511 ? 97% |
| Seq Write (MB/s) | 2765 | 2769 0% | 1570 -43% | 2521 -9% | 2561 -7% | 2084 ? -25% | 3916 ? 42% |
| 4K Read (MB/s) | 44.96 | 46.07 2% | 52.4 17% | 50.9 13% | 43.01 -4% | 53.1 ? 18% | 70.2 ? 56% |
| 4K Write (MB/s) | 98.3 | 87.2 -11% | 124 26% | 141.1 44% | 102 4% | 131.2 ? 33% | 215 ? 119% |
| 4K-64 Read (MB/s) | 1503 | 1372 -9% | 1334 -11% | 2110 40% | 1549 3% | 1477 ? -2% | 1627 ? 8% |
| 4K-64 Write (MB/s) | 1845 | 1247 -32% | 2189 19% | 2329 26% | 1378 -25% | 1805 ? -2% | 2909 ? 58% |
| Access Time Read * (ms) | 0.058 | 0.052 10% | 0.055 5% | 0.034 41% | 0.051 12% | 0.04983 ? 14% | 0.06507 ? -12% |
| Access Time Write * (ms) | 0.038 | 0.098 -158% | 0.03 21% | 0.026 32% | 0.037 3% | 0.04222 ? -11% | 0.03935 ? -4% |
| Score Read (Points) | 1828 | 1684 -8% | 1675 -8% | 2457 34% | 1901 4% | 1786 ? -2% | 2248 ? 23% |
| Score Write (Points) | 2220 | 1611 -27% | 2470 11% | 2722 23% | 1737 -22% | 2144 ? -3% | 3515 ? 58% |
| Score Total (Points) | 4983 | 4166 -16% | 4943 -1% | 6412 29% | 4583 -8% | 4826 ? -3% | 6841 ? 37% |
| Copy ISO MB/s (MB/s) | 1904 | 1277 -33% | 2275 19% | 2684 41% | 2098 ? 10% | 3102 ? 63% | |
| Copy Program MB/s (MB/s) | 567 | 575 1% | 593 5% | 544 -4% | 500 ? -12% | 963 ? 70% | |
| Copy Game MB/s (MB/s) | 1112 | 1272 14% | 1408 27% | 1116 0% | 1132 ? 2% | 2062 ? 85% | |
| Totalt genomsnitt (program/inställningar) | -9% /
-11% | 2% /
2% | 22% /
22% | 5% /
3% | 2% /
1% | 58% /
56% |
* ... mindre är bättre
Continuous read speed: DiskSpd Read Loop, Queue Depth 8

| 3DMark 11 Performance | 22214 poäng | |
| 3DMark Cloud Gate Standard Score | 45007 poäng | |
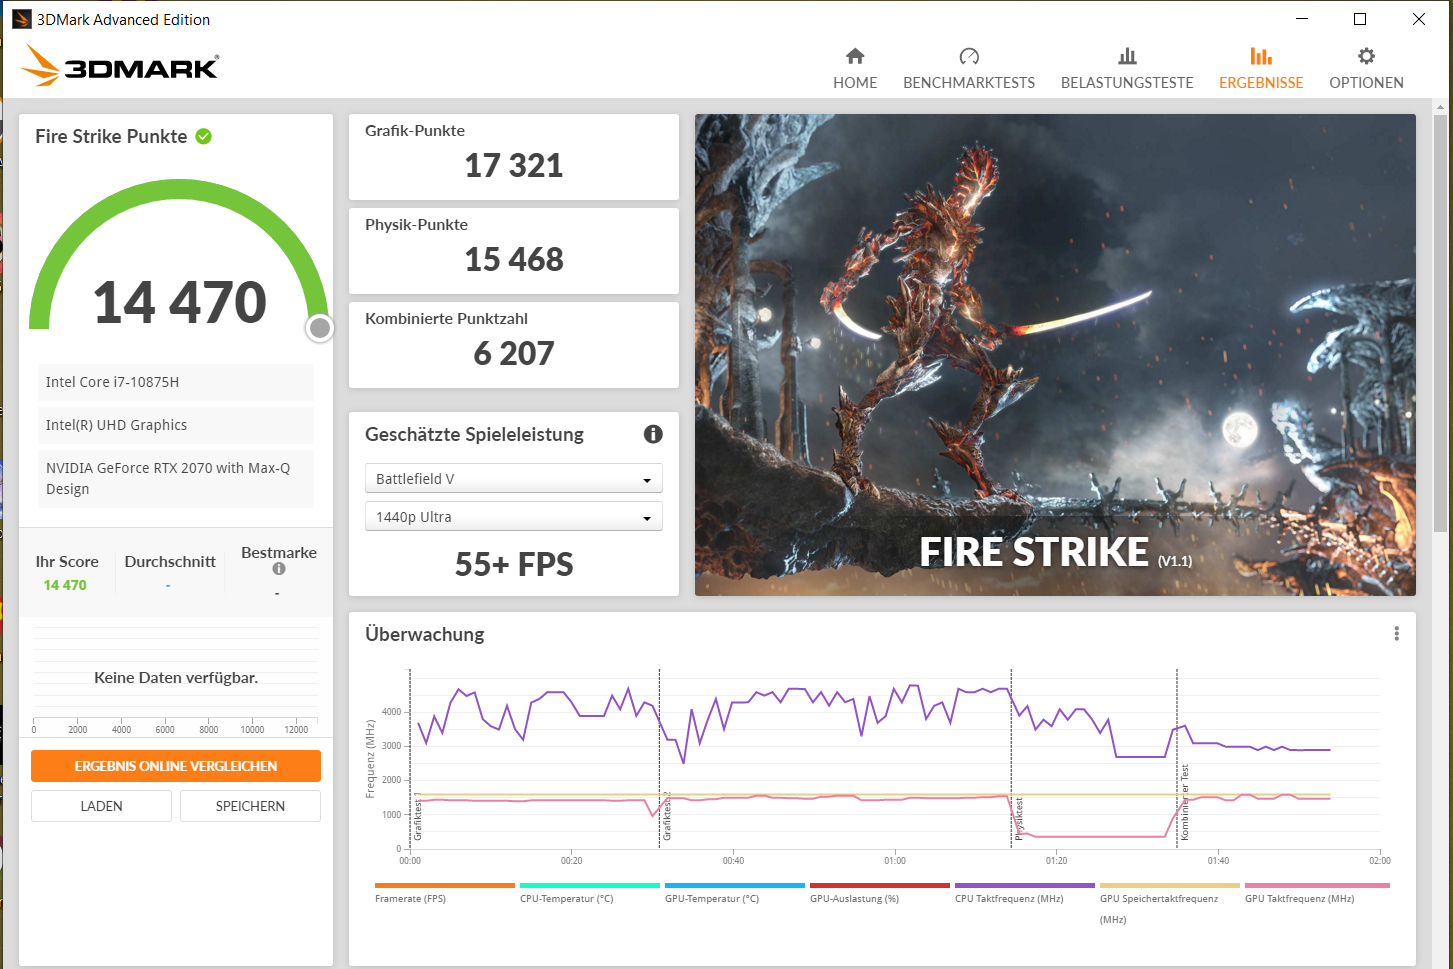
| 3DMark Fire Strike Score | 16977 poäng | |
| 3DMark Time Spy Score | 7411 poäng | |
Hjälp | ||
| 3DMark 11 - 1280x720 Performance GPU | |
| Genomsnitt av klass Gaming (21841 - 80022, n=106, senaste 2 åren) | |
| Alienware m15 R4 | |
| Schenker XMG Pro 15 (Early 2021, RTX 3080) | |
| Asus ROG Strix G15 G513QR | |
| Lenovo Legion 7 15IMH05-81YT001VGE | |
| Lenovo Legion C7 15IMH05 82EH0030GE (Hoechstleistung) | |
| Lenovo Legion C7 15IMH05 82EH0030GE | |
| Genomsnitt NVIDIA GeForce RTX 2070 Max-Q (14723 - 27694, n=31) | |
| The Witcher 3 - 1920x1080 Ultra Graphics & Postprocessing (HBAO+) | |
| Genomsnitt av klass Gaming (95 - 240, n=8, senaste 2 åren) | |
| Alienware m15 R4 | |
| Schenker XMG Pro 15 (Early 2021, RTX 3080) | |
| Asus ROG Strix G15 G513QR | |
| Lenovo Legion 7 15IMH05-81YT001VGE | |
| Lenovo Legion C7 15IMH05 82EH0030GE (Hoechstleistung) | |
| Lenovo Legion C7 15IMH05 82EH0030GE | |
| Genomsnitt NVIDIA GeForce RTX 2070 Max-Q (56 - 83.8, n=31) | |
| Dota 2 Reborn - 1920x1080 ultra (3/3) best looking | |
| Genomsnitt av klass Gaming (84.8 - 248, n=110, senaste 2 åren) | |
| Alienware m15 R4 | |
| Lenovo Legion 7 15IMH05-81YT001VGE | |
| Lenovo Legion C7 15IMH05 82EH0030GE | |
| Lenovo Legion C7 15IMH05 82EH0030GE (Hoechstleistung) | |
| Genomsnitt NVIDIA GeForce RTX 2070 Max-Q (105.8 - 126, n=13) | |
| Schenker XMG Pro 15 (Early 2021, RTX 3080) | |
| Lenovo Legion C7 15IMH05 82EH0030GE (Fluestermodus) | |
| Asus ROG Strix G15 G513QR | |
| X-Plane 11.11 - 1920x1080 high (fps_test=3) | |
| Genomsnitt av klass Gaming (52.1 - 143.5, n=113, senaste 2 åren) | |
| Alienware m15 R4 | |
| Lenovo Legion 7 15IMH05-81YT001VGE | |
| Lenovo Legion C7 15IMH05 82EH0030GE (Hoechstleistung) | |
| Lenovo Legion C7 15IMH05 82EH0030GE | |
| Schenker XMG Pro 15 (Early 2021, RTX 3080) | |
| Genomsnitt NVIDIA GeForce RTX 2070 Max-Q (61.6 - 85.3, n=11) | |
| Lenovo Legion C7 15IMH05 82EH0030GE (Fluestermodus) | |
| Asus ROG Strix G15 G513QR | |
| Far Cry 5 - 1920x1080 Ultra Preset AA:T | |
| Genomsnitt av klass Gaming (70 - 151, n=9, senaste 2 åren) | |
| Lenovo Legion 7 15IMH05-81YT001VGE | |
| Alienware m15 R4 | |
| Lenovo Legion C7 15IMH05 82EH0030GE (Hoechstleistung) | |
| Lenovo Legion C7 15IMH05 82EH0030GE | |
| Asus ROG Strix G15 G513QR | |
| Genomsnitt NVIDIA GeForce RTX 2070 Max-Q (67 - 101, n=7) | |
| Shadow of the Tomb Raider - 1920x1080 Highest Preset AA:T | |
| Lenovo Legion 7 15IMH05-81YT001VGE | |
| Genomsnitt av klass Gaming (96 - 116, n=2, senaste 2 åren) | |
| Schenker XMG Pro 15 (Early 2021, RTX 3080) | |
| Lenovo Legion C7 15IMH05 82EH0030GE | |
| Genomsnitt NVIDIA GeForce RTX 2070 Max-Q (57 - 89, n=12) | |
| Dirt 5 - 1920x1080 Ultra High Preset | |
| Lenovo Legion C7 15IMH05 82EH0030GE | |
| Genomsnitt NVIDIA GeForce RTX 2070 Max-Q (n=1) | |
| Hitman 3 - 1920x1080 Maximum Settings AF:16x | |
| Lenovo Legion C7 15IMH05 82EH0030GE | |
| Genomsnitt NVIDIA GeForce RTX 2070 Max-Q (n=1) | |
| låg | med. | hög | ultra | |
|---|---|---|---|---|
| The Witcher 3 (2015) | 301 | 221 | 130 | 72.4 |
| Dota 2 Reborn (2015) | 155 | 139 | 131 | 125 |
| X-Plane 11.11 (2018) | 115 | 101 | 84.4 | |
| Far Cry 5 (2018) | 160 | 113 | 105 | 99 |
| Shadow of the Tomb Raider (2018) | 144 | 107 | 96 | 86 |
| Serious Sam 4 (2020) | 120 | 82.6 | 73.2 | 59.8 |
| Watch Dogs Legion (2020) | 123 | 88.2 | 77.5 | 51.5 |
| Dirt 5 (2020) | 168 | 92.1 | 75.5 | 56.6 |
| Assassin´s Creed Valhalla (2020) | 102 | 71 | 59 | 53 |
| Immortals Fenyx Rising (2020) | 124 | 84 | 76 | 70 |
| Cyberpunk 2077 1.0 (2020) | 115 | 65 | 54.9 | 47.1 |
| Hitman 3 (2021) | 192.7 | 117.2 | 104.5 | 95.5 |
Ljudnivå
| Låg belastning |
| 24.9 / 24.9 / 24.9 dB(A) |
| Hög belastning |
| 34.6 / 47.7 dB(A) |
 | ||
30 dB tyst 40 dB(A) hörbar 50 dB(A) högt ljud |
||
min: | ||
(±) Den maximala temperaturen på ovansidan är 41.4 °C / 107 F, jämfört med genomsnittet av 40.4 °C / 105 F , allt från 21.2 till 68.8 °C för klassen Gaming.
(-) Botten värms upp till maximalt 45.1 °C / 113 F, jämfört med genomsnittet av 43.2 °C / 110 F
(+) Vid tomgångsbruk är medeltemperaturen för ovansidan 25.4 °C / 78 F, jämfört med enhetsgenomsnittet på 33.9 °C / ### class_avg_f### F.
(±) När du spelar The Witcher 3 är medeltemperaturen för ovansidan 33.1 °C / 92 F, jämfört med enhetsgenomsnittet på 33.9 °C / ## #class_avg_f### F.
(+) Handledsstöden och pekplattan är kallare än hudtemperaturen med maximalt 30.6 °C / 87.1 F och är därför svala att ta på.
(±) Medeltemperaturen för handledsstödsområdet på liknande enheter var 28.8 °C / 83.8 F (-1.8 °C / -3.3 F).
Lenovo Legion C7 15IMH05 82EH0030GE ljudanalys
(±) | högtalarljudstyrkan är genomsnittlig men bra (72 dB)
Bas 100 - 315 Hz
(-) | nästan ingen bas - i genomsnitt 20.7% lägre än medianen
(±) | linjäriteten för basen är genomsnittlig (10.6% delta till föregående frekvens)
Mellan 400 - 2000 Hz
(+) | balanserad mellan - endast 3.7% från medianen
(+) | mids är linjära (5.9% delta till föregående frekvens)
Högsta 2 - 16 kHz
(+) | balanserade toppar - endast 2.6% från medianen
(+) | toppar är linjära (4.4% delta till föregående frekvens)
Totalt 100 - 16 000 Hz
(±) | linjäriteten för det totala ljudet är genomsnittlig (15.3% skillnad mot median)
Jämfört med samma klass
» 34% av alla testade enheter i den här klassen var bättre, 6% liknande, 60% sämre
» Den bästa hade ett delta på 6%, genomsnittet var 18%, sämst var 132%
Jämfört med alla testade enheter
» 22% av alla testade enheter var bättre, 4% liknande, 74% sämre
» Den bästa hade ett delta på 4%, genomsnittet var 24%, sämst var 134%
| Av/Standby | |
| Låg belastning | |
| Hög belastning |
|
Förklaring:
min: | |
| Lenovo Legion C7 15IMH05 82EH0030GE i7-10875H, GeForce RTX 2070 Max-Q, 80 Wh | Alienware m15 R4 i9-10980HK, GeForce RTX 3070 Laptop GPU, 86 Wh | Asus ROG Strix G15 G513QR R9 5900HX, GeForce RTX 3070 Laptop GPU, 90 Wh | Schenker XMG Pro 15 (Early 2021, RTX 3080) i7-10870H, GeForce RTX 3080 Laptop GPU, 73 Wh | Lenovo Legion 7 15IMH05-81YT001VGE i9-10980HK, GeForce RTX 2080 Super Max-Q, 80 Wh | Genomsnitt av klass Gaming | |
|---|---|---|---|---|---|---|
| Batteridrifttid | -54% | 45% | -5% | -40% | 2% | |
| Reader / Idle (h) | 12.7 | 3.7 -71% | 8.4 -34% | 8.71 ? -31% | ||
| H.264 (h) | 7.1 | 13.5 90% | 5.5 -23% | 1.5 -79% | 8.28 ? 17% | |
| WiFi v1.3 (h) | 5.9 | 2.7 -54% | 7.4 25% | 7.2 22% | 3.4 -42% | 6.96 ? 18% |
| Load (h) | 1.4 | 0.9 -36% | 1.7 21% | 1.6 14% | 1.4 0% | 1.47 ? 5% |
För
Emot
Läs den fullständiga versionen av den här recensionen på engelska här.
Legion C7 gör vad den ska: Den kan köra alla aktuella spel smidigt i 1080p med högsta inställningar. Faktum att den aldrig låter för mycket eller blir för varm gör den också lämplig för andra användningsområden.
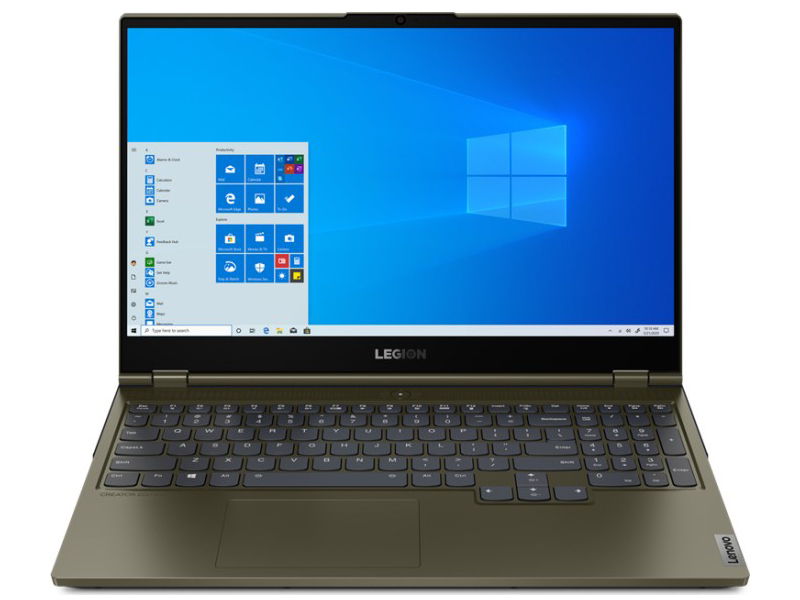
Lenovo Legion C7 15IMH05 är en välavrundad laptop för både gamers och kreatörer.
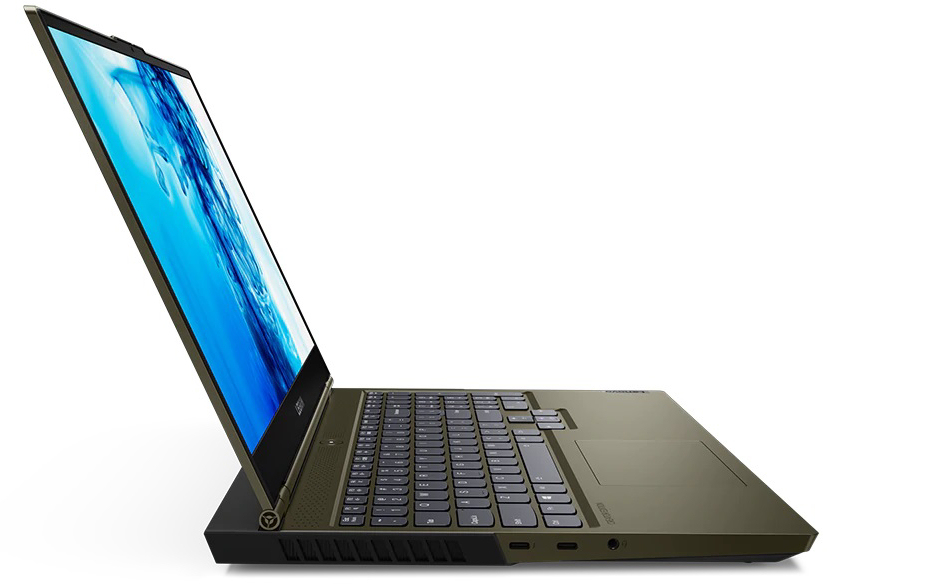
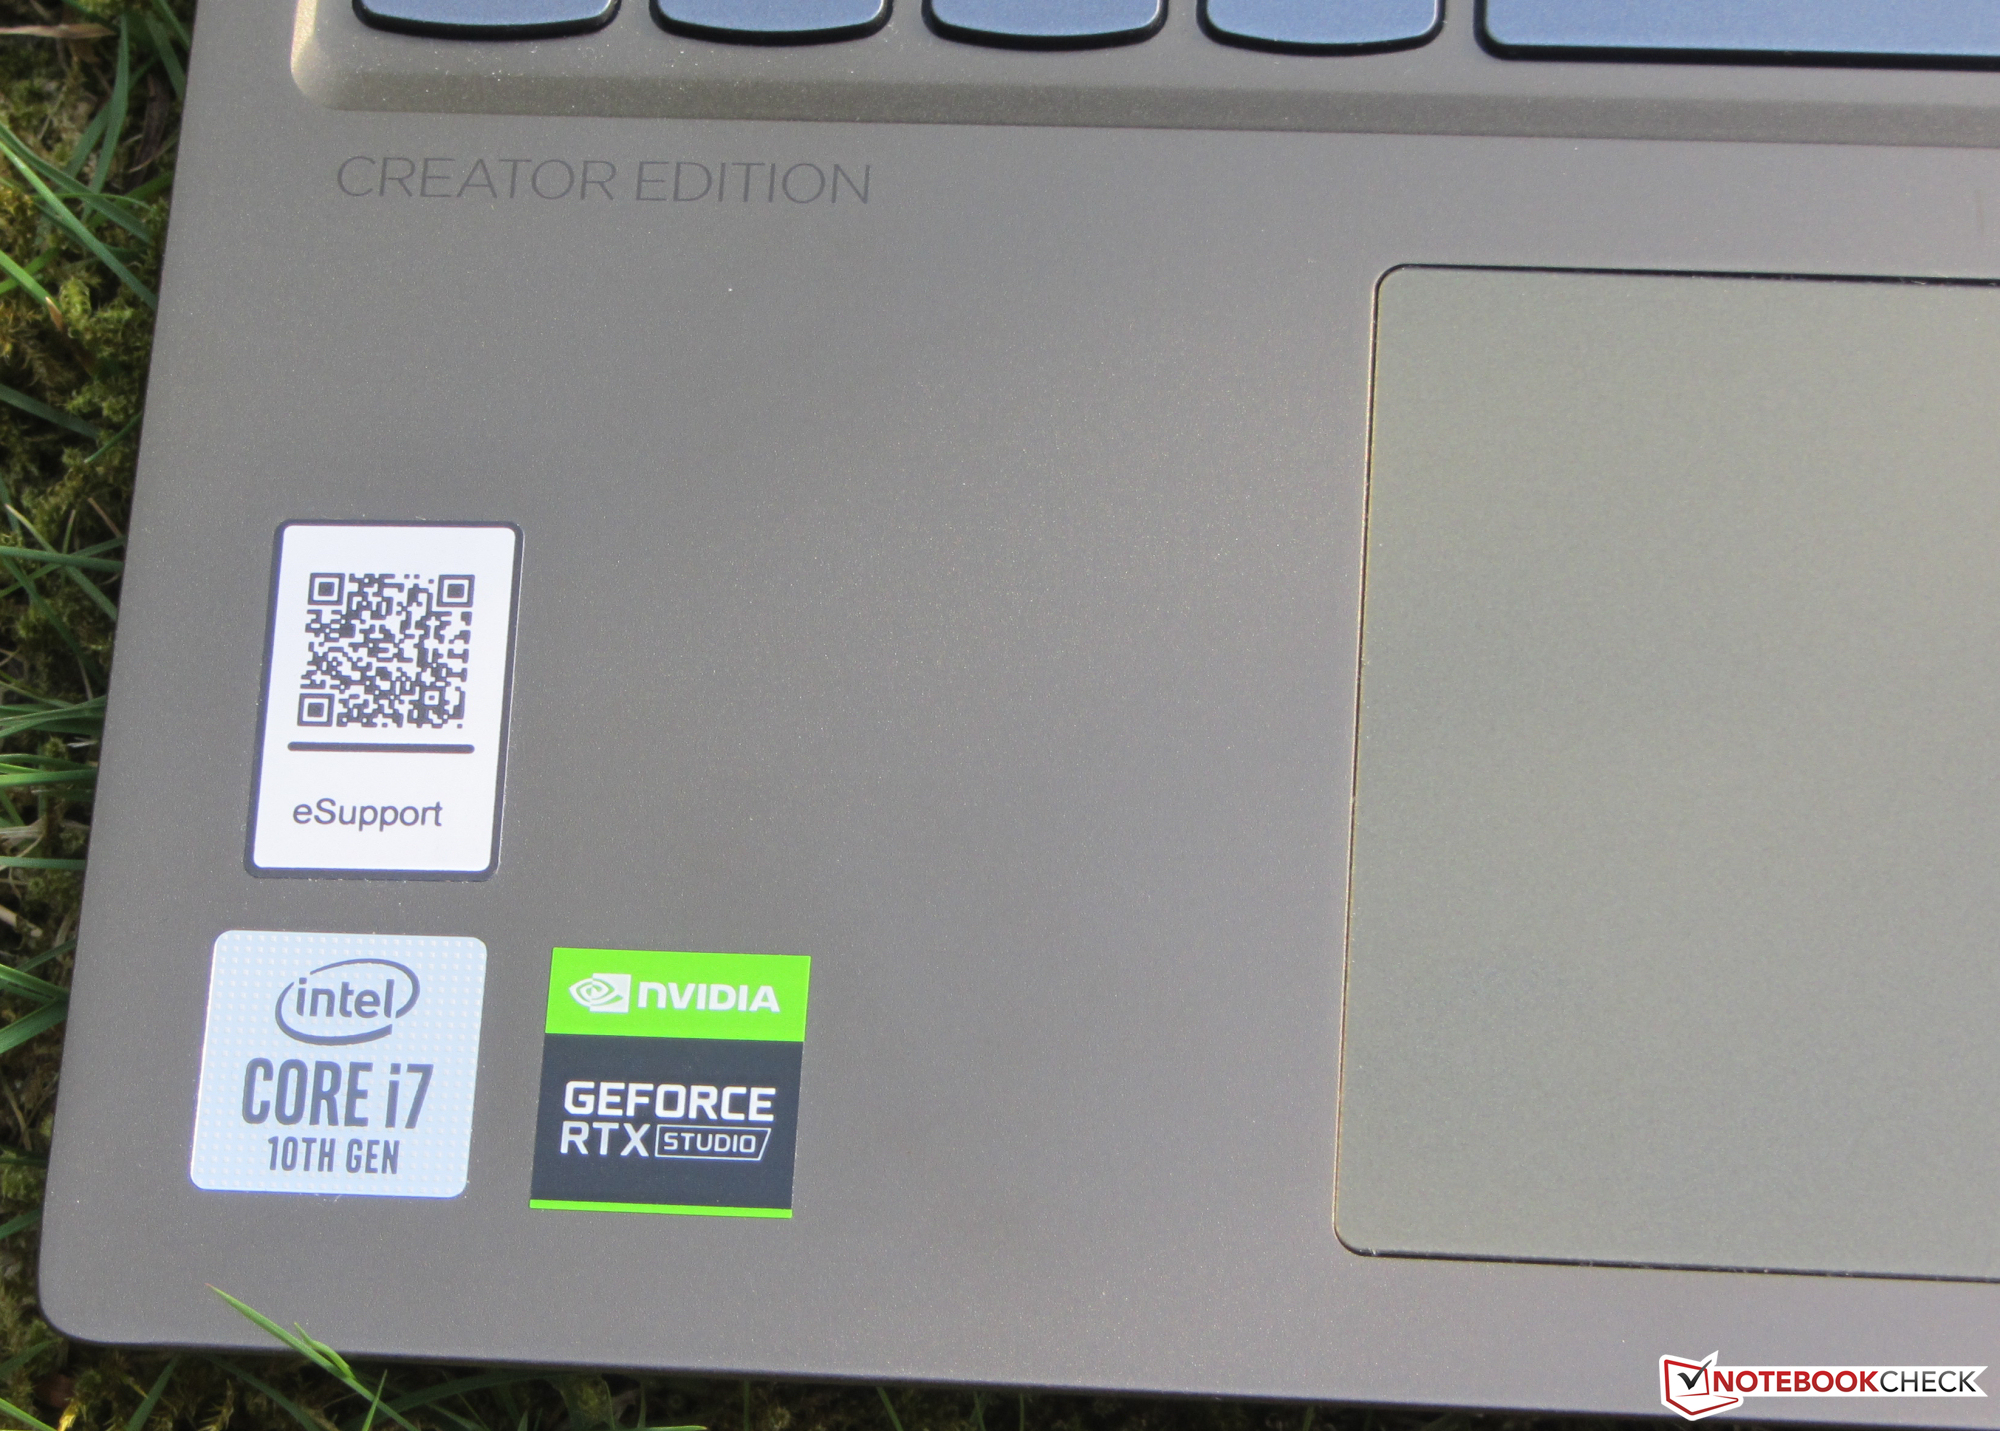
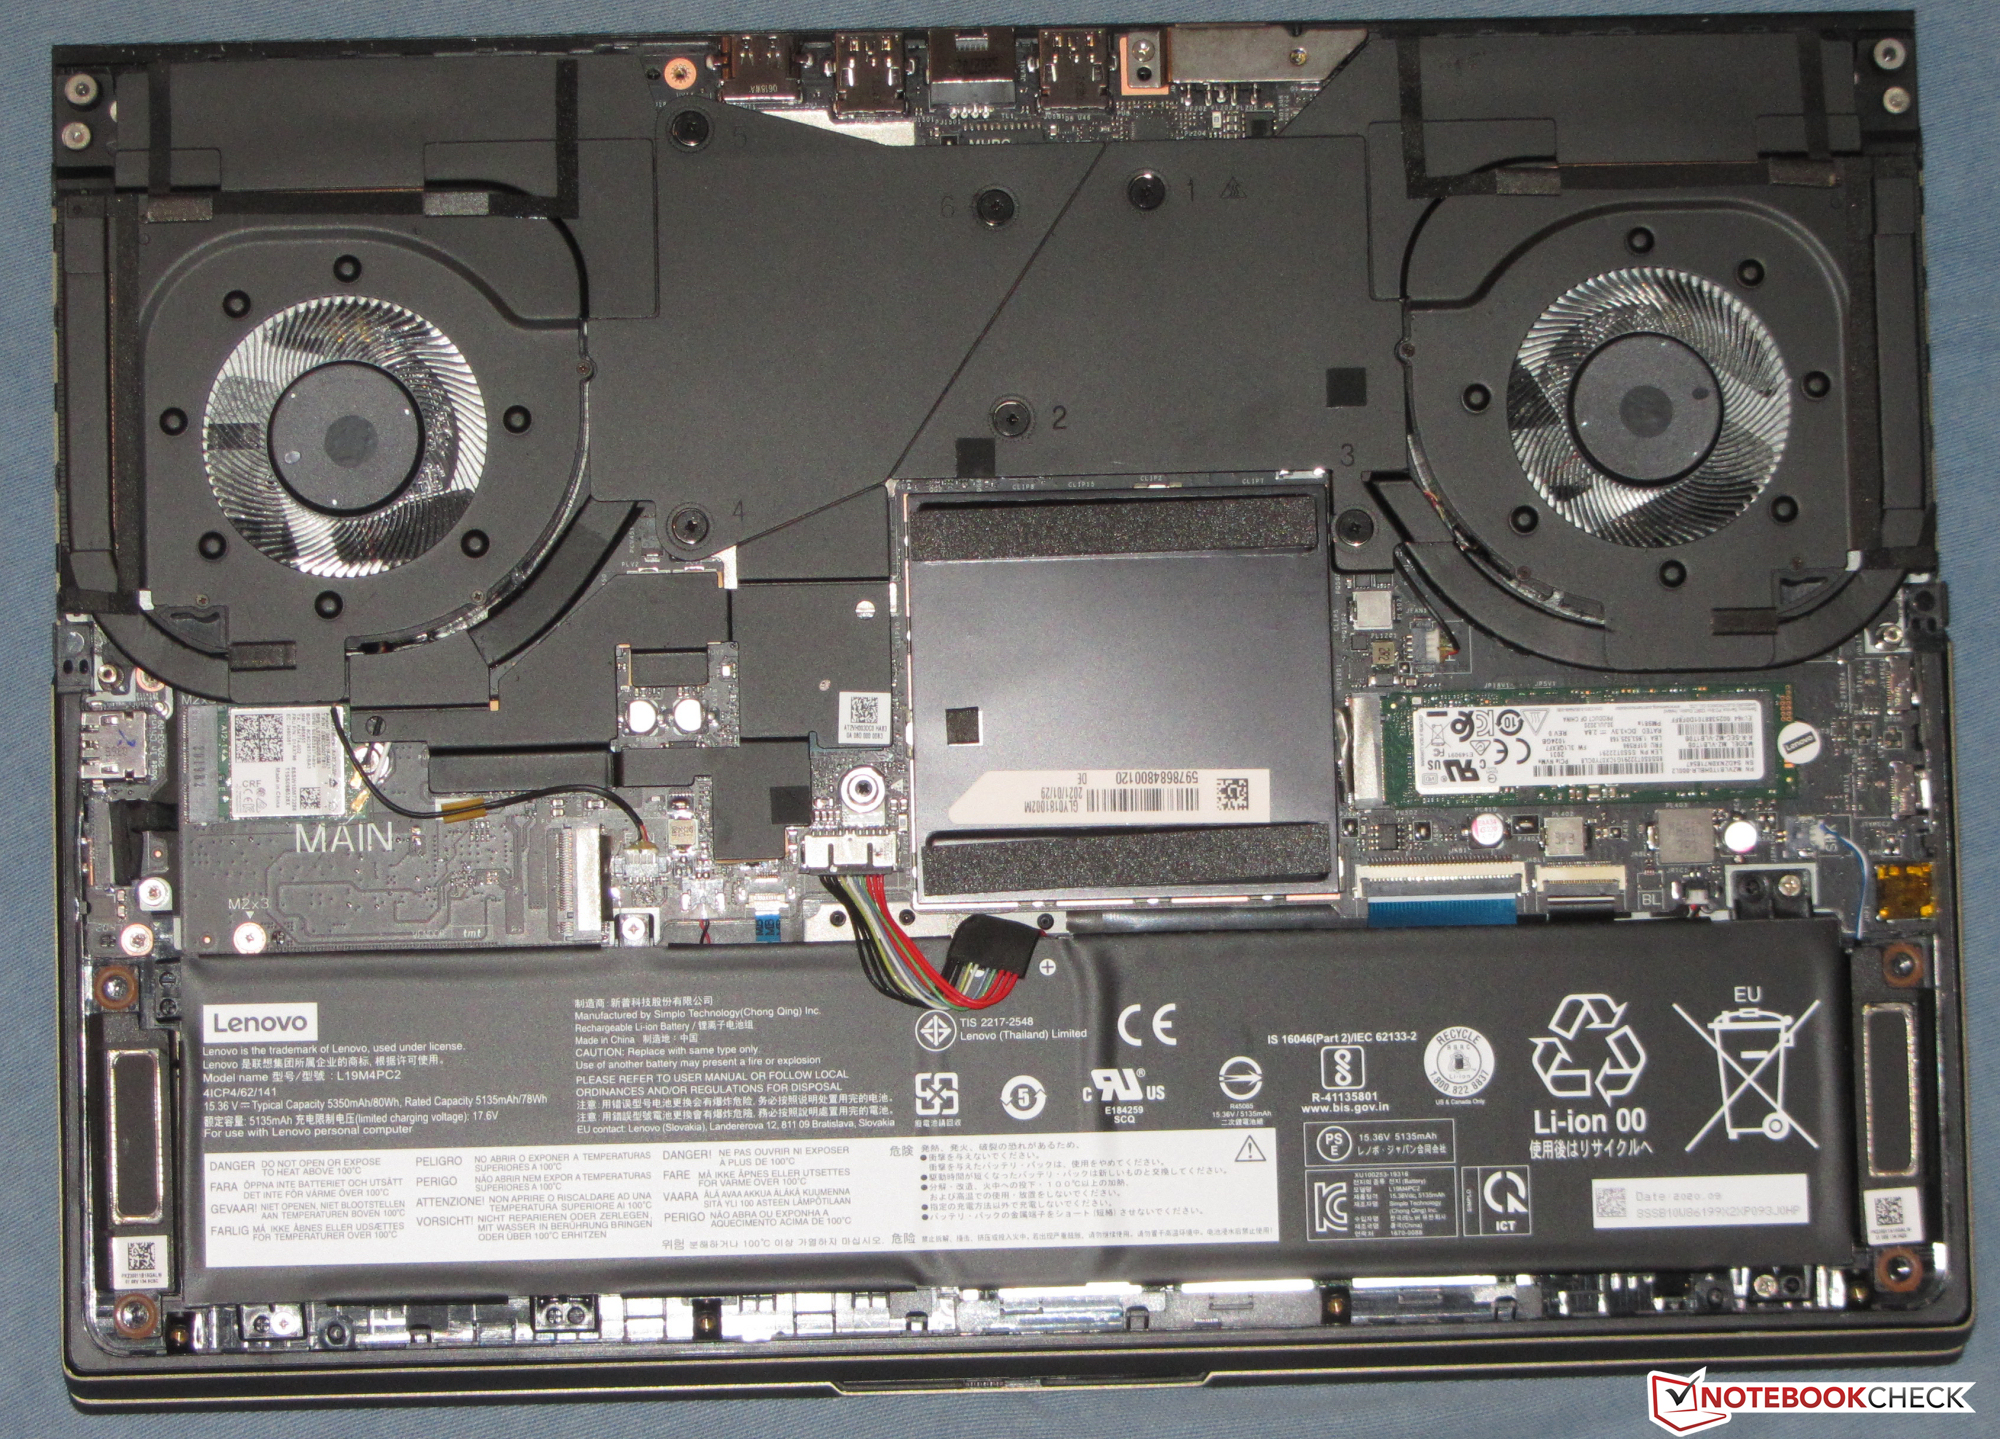
Tack vare en Core i7-10875H CPU, en GeForce RTX 2070 Max-Q GPU, 32 GB RAM med dubbla kanaler (max 64 GB) samt en SSD-enhet på 1 TB kan Lenovos laptop hantera alla aktuella program. Om så behövs går det att installera en andra NVMe SSD i enheten. Thunderbolt 3-porten gör det också möjligt att ansluta en extern GPU till datorn.
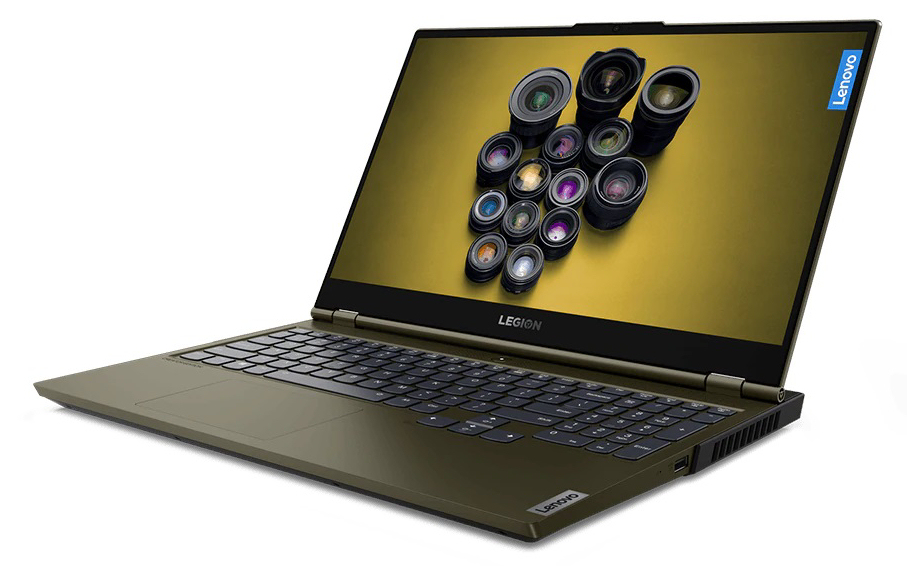
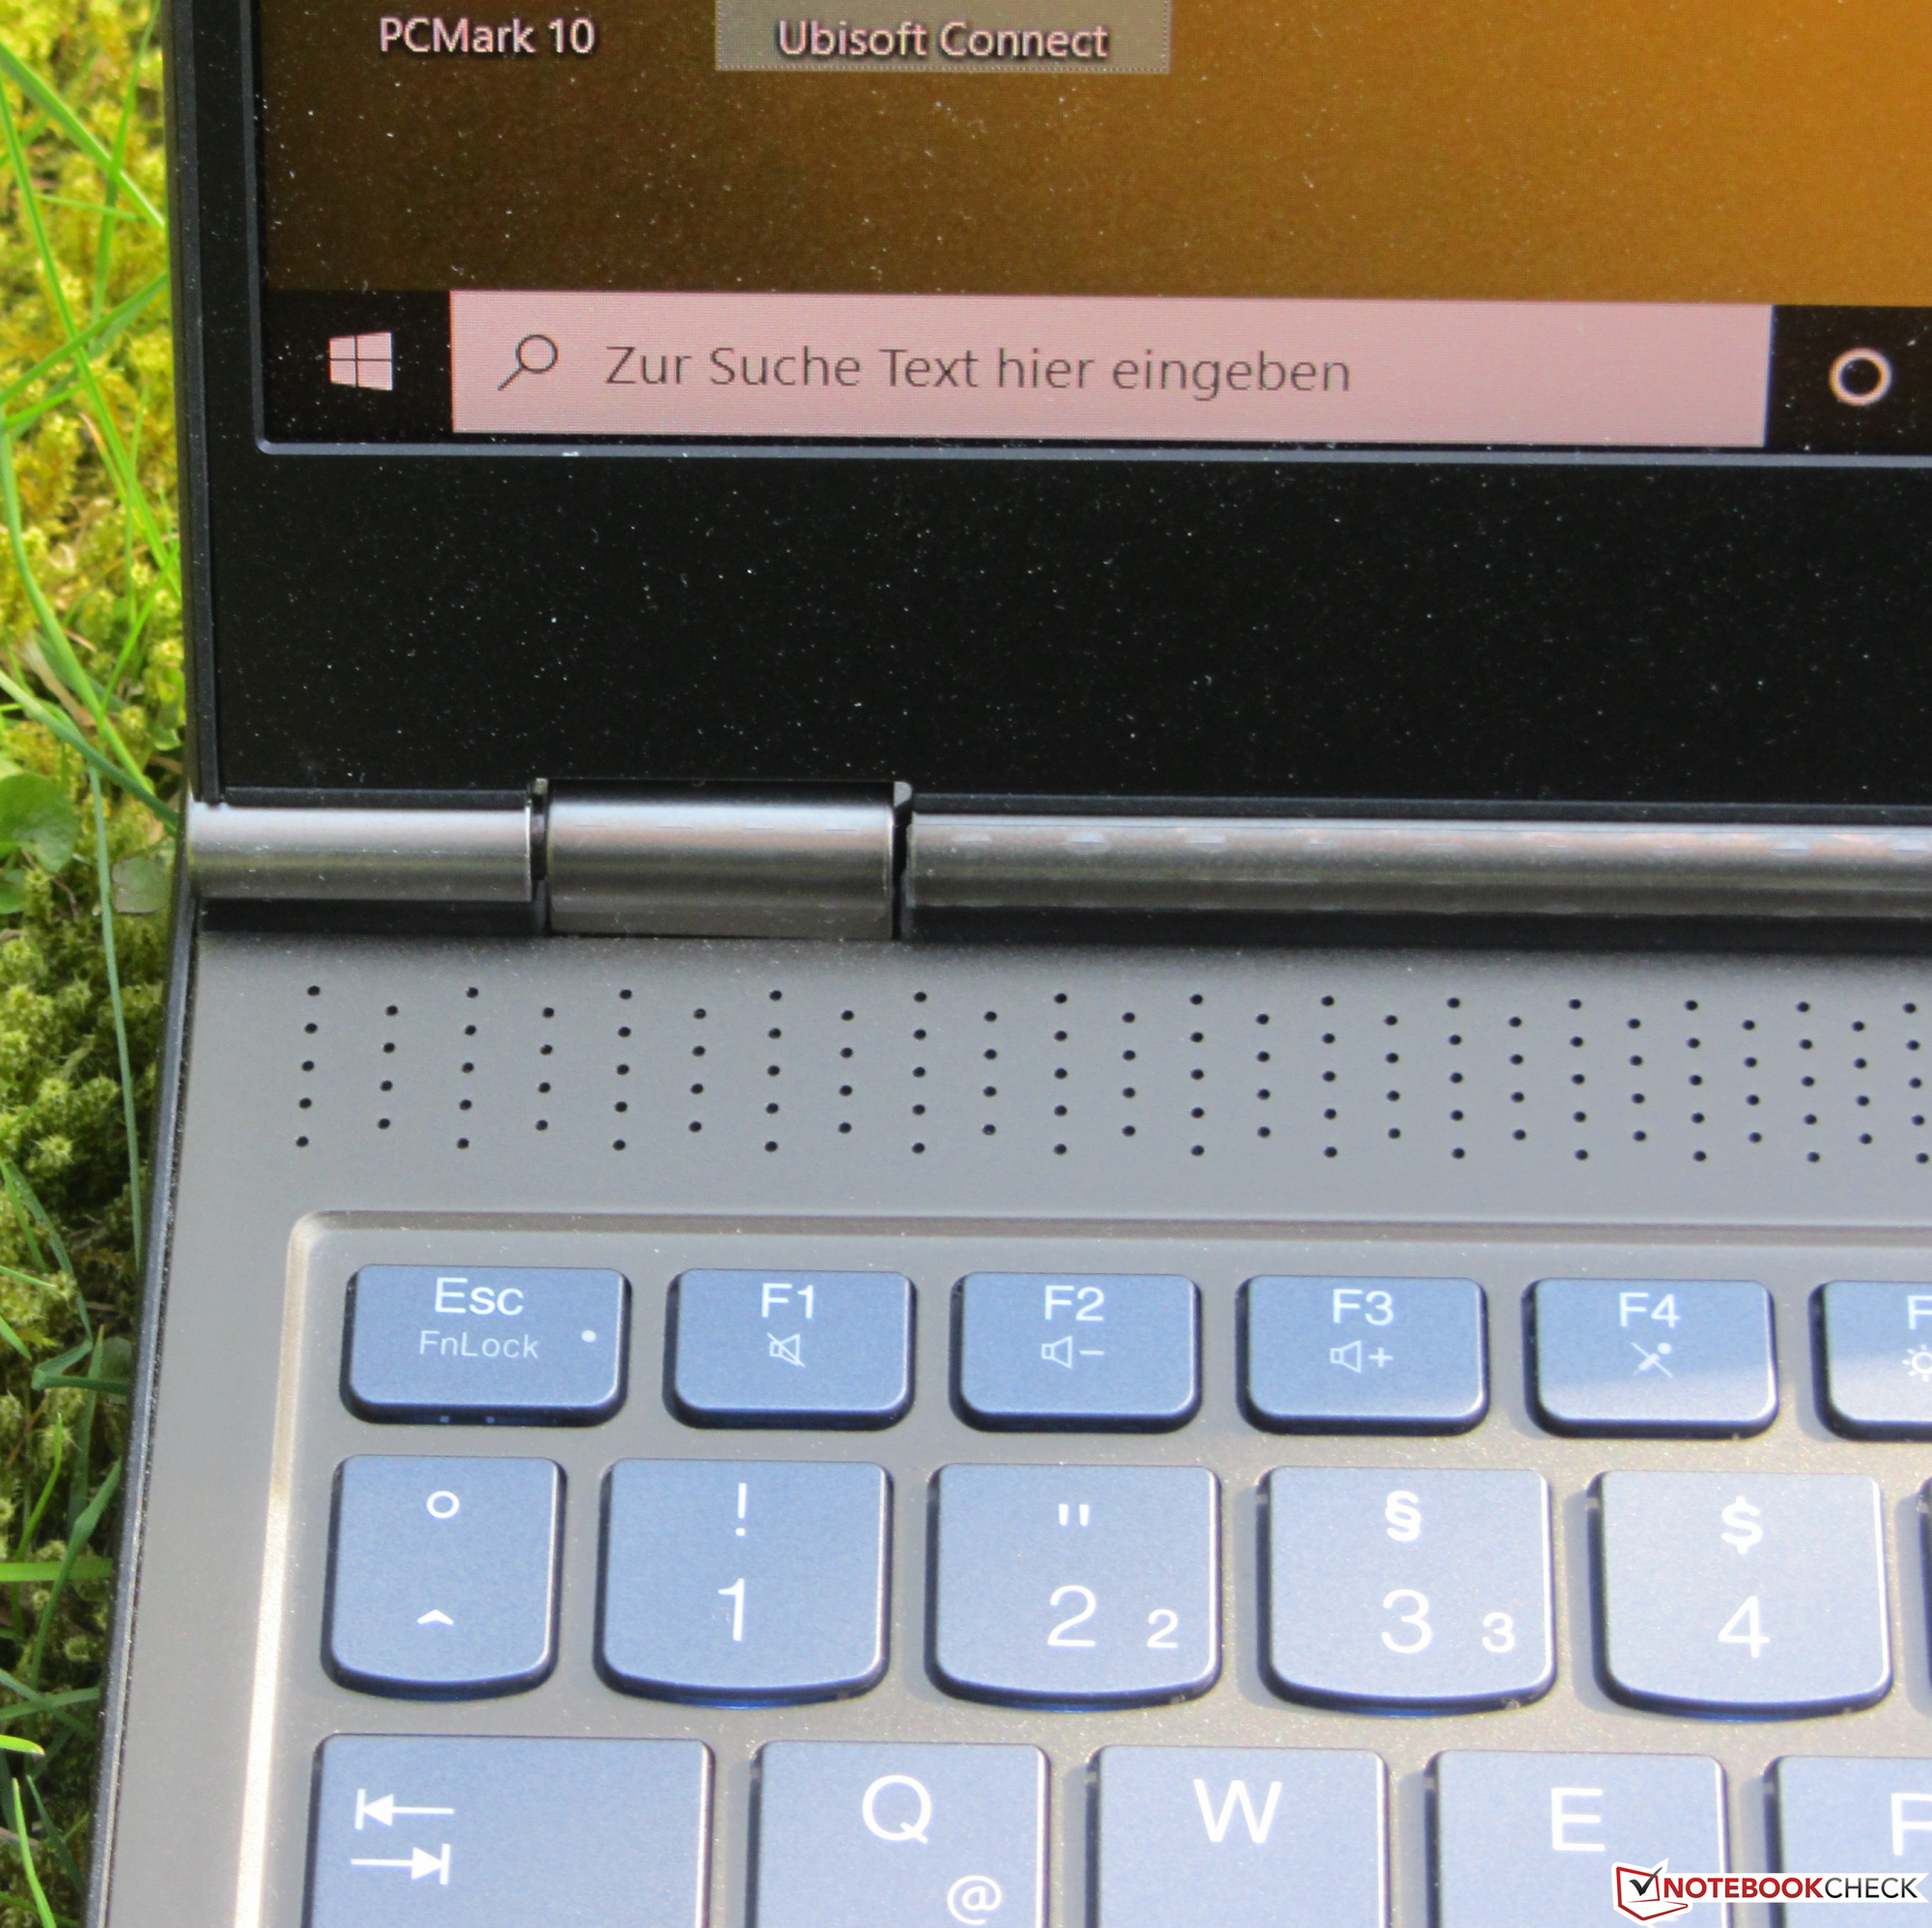
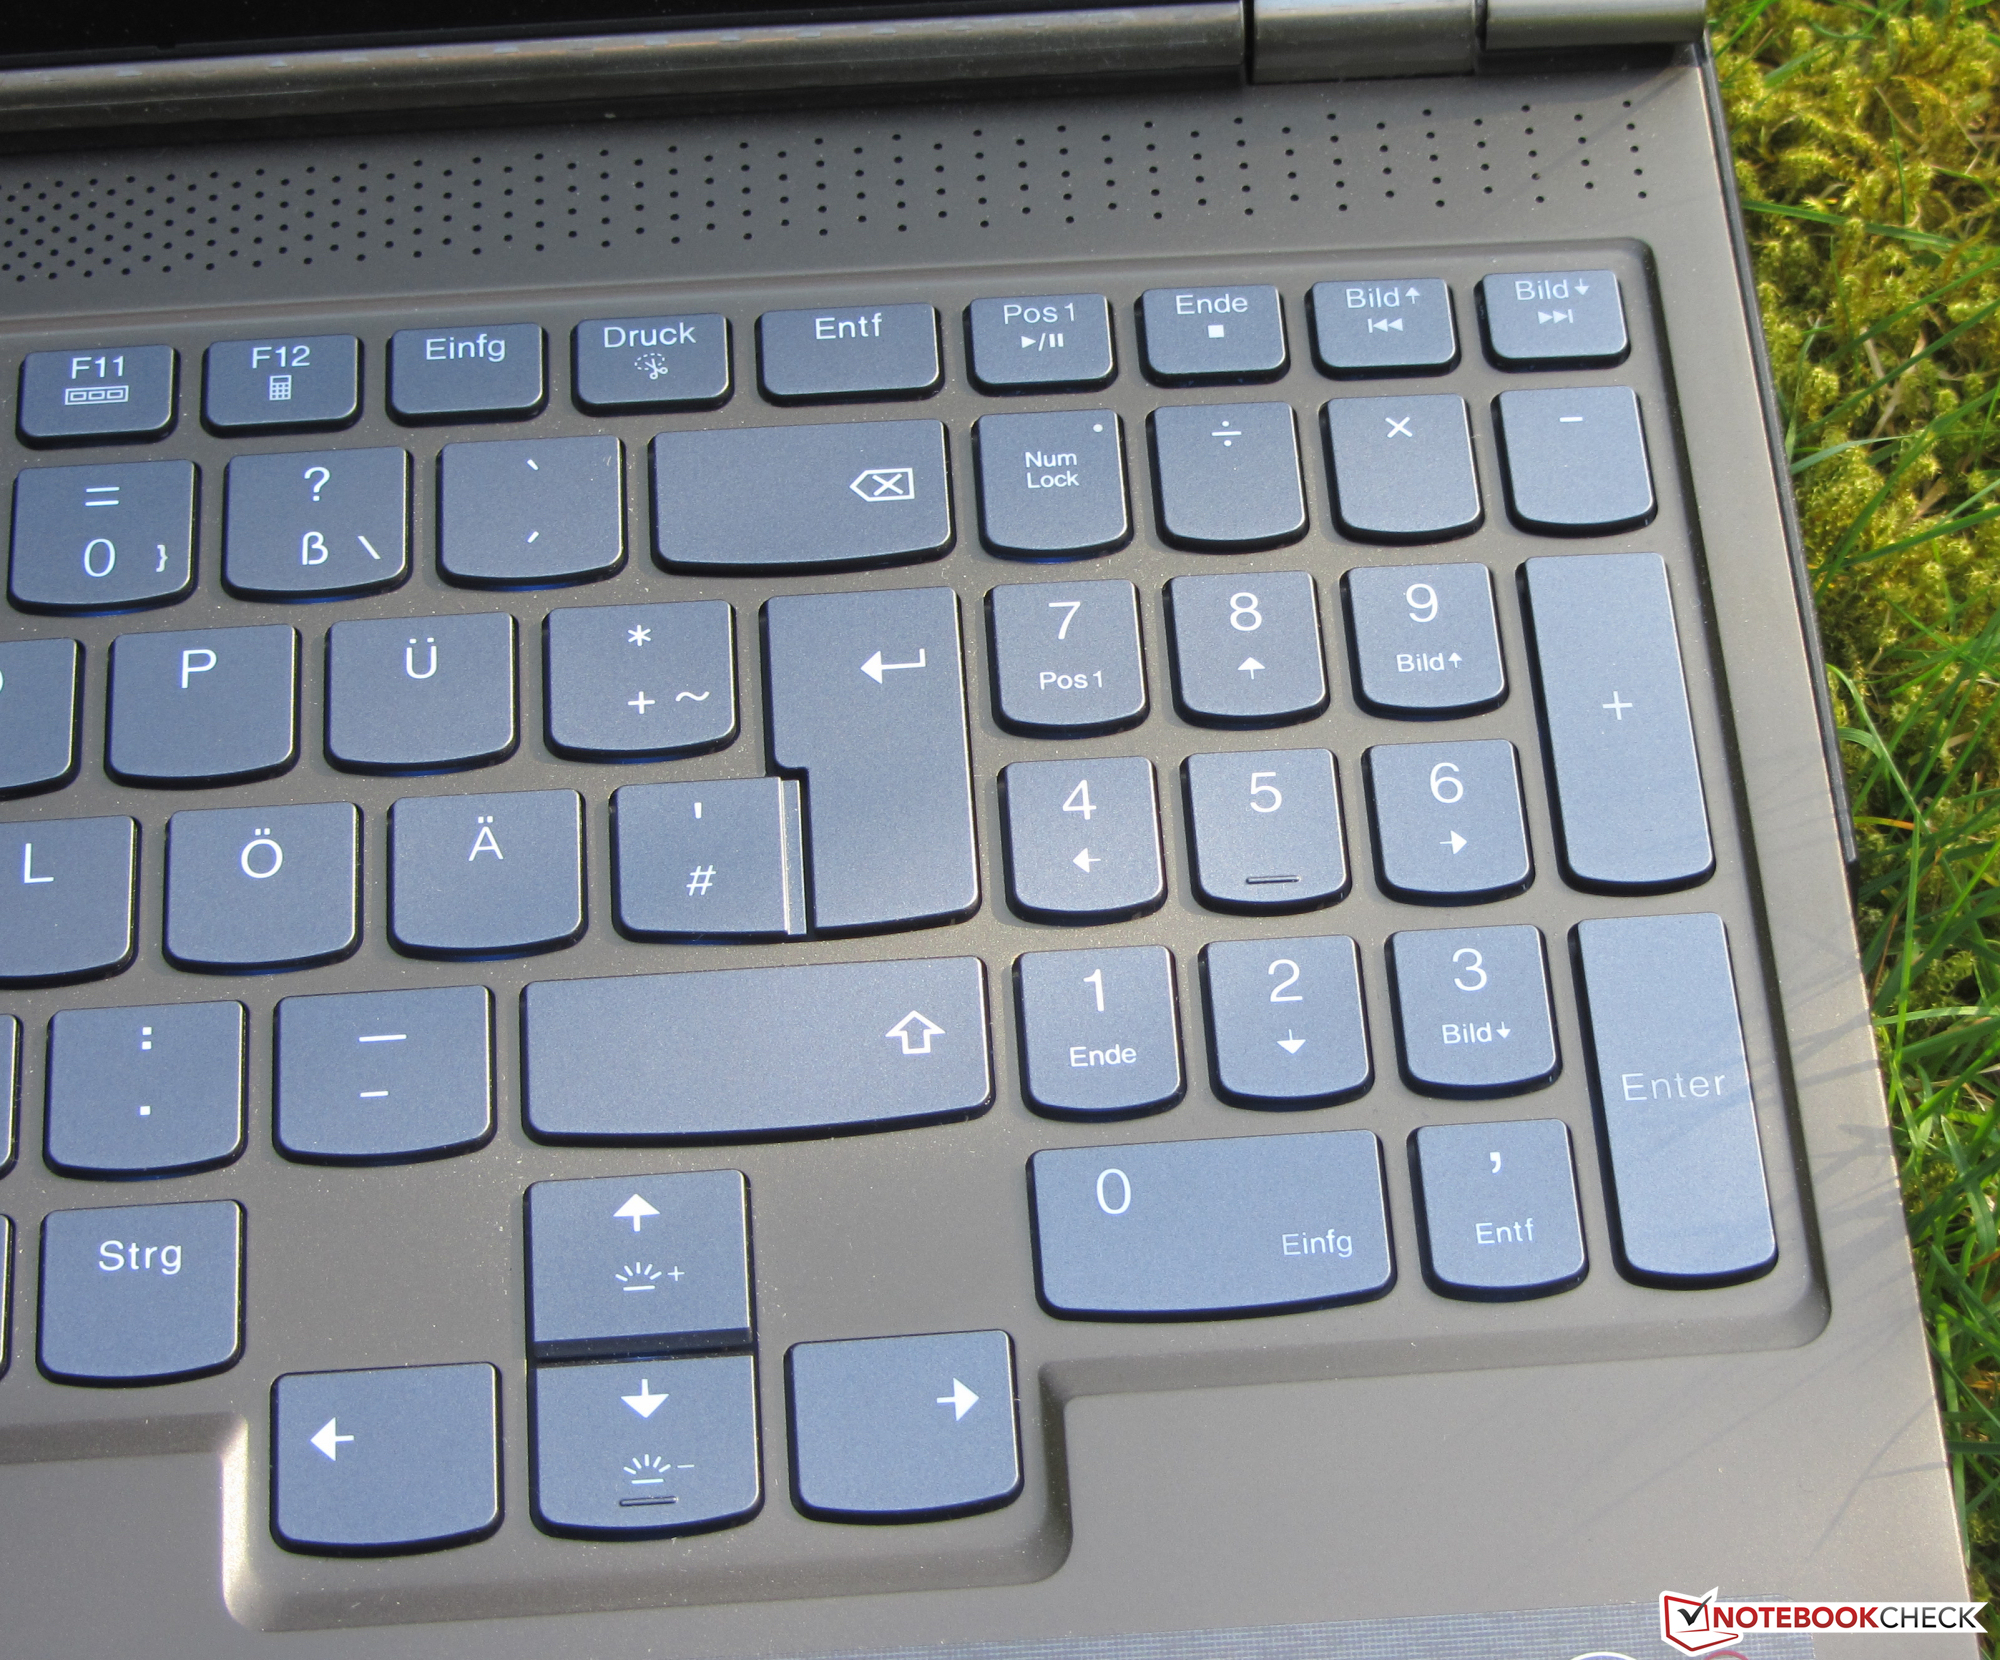
Batteritiden ligger på en bra nivå för en enhet av det här slaget. Full HD-skärmen har 144 Hz bilduppdatering, en matt yta, bra betraktningsvinklar och snabba responstider. Vidare har den stöd för Dolby Vision (en variant av HDR) och täcker 100% av sRGB-omfånget. Både kontrast och ljusstyrka ligger på en bra nivå. Det bakgrundsbelysta tangentbordet är skapligt. Dessutom ger Lenovo tre års garanti på C7.
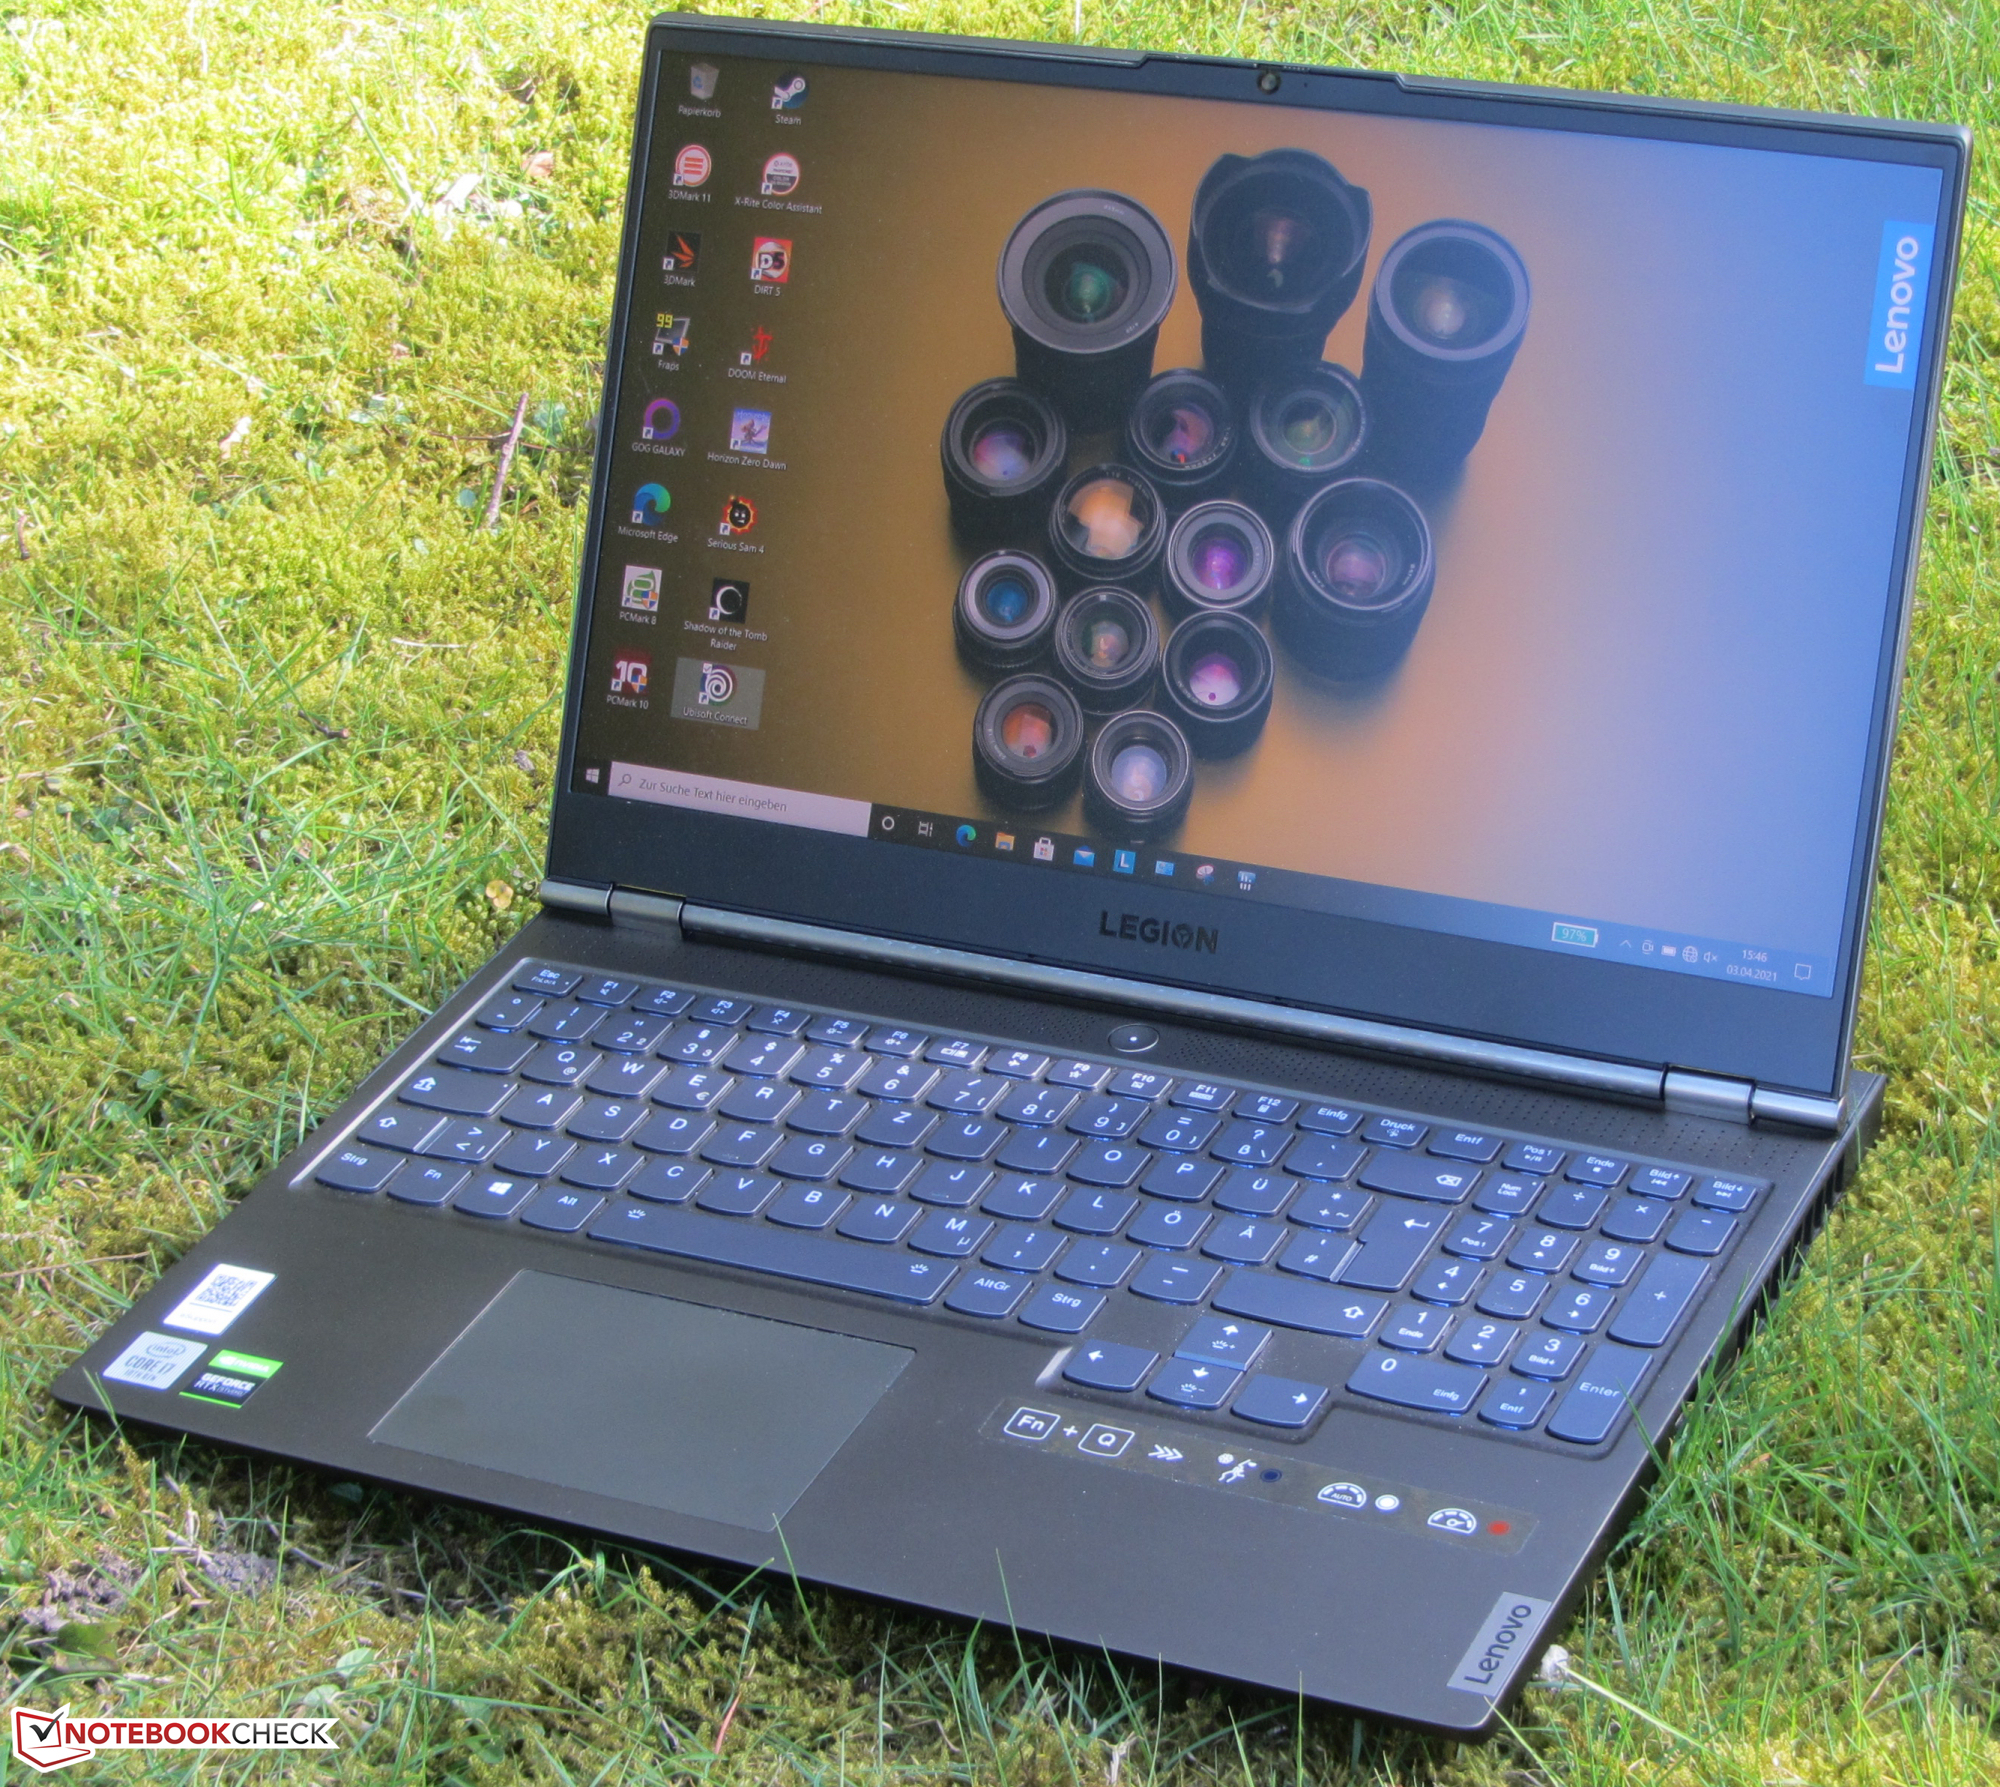
Lenovo Legion C7 15IMH05 82EH0030GE
- 04/14/2021 v7 (old)
Sascha Mölck
Price comparison
