Recension av Lenovo Legion Pro 5 16IRX8 laptop: En rejäl summa på 1 600 dollar för GeForce RTX 4060
Legion Pro 5 16 IRX8 (eller Legion Pro 5i 16 Gen 8) är efterföljaren till 2022 Legion Pro 5i 16 Gen 7. Den innehåller flera förändringar, bland annat en översyn av chassit med 13:e generationens Intel Raptor Lake-H CPU och Nvidia Ada Lovelace GPU-alternativ som ersätter de äldre 12:e generationens Alder Lake-H respektive Ampere-alternativen. Det är en spelmodell i övre mellanklassen som ligger mellan IdeaPad gaming-serien på instegsnivå och flaggskeppet Legion Pro 7-serien.
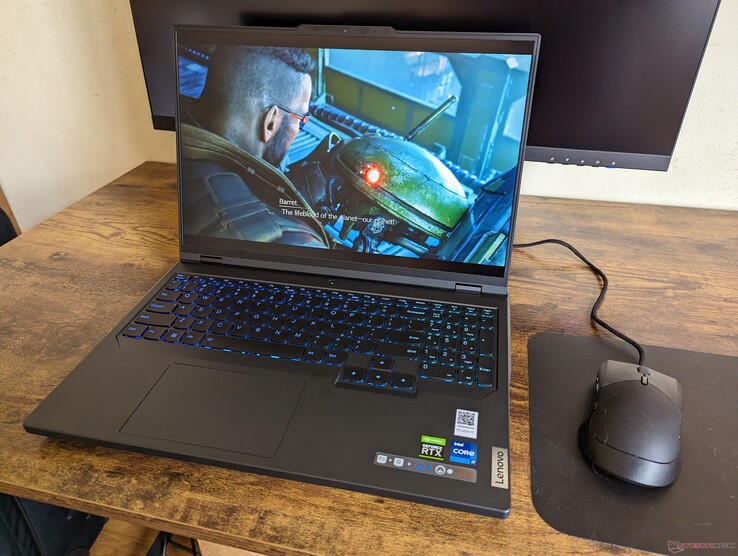
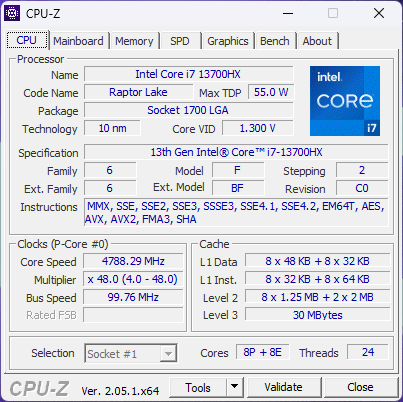
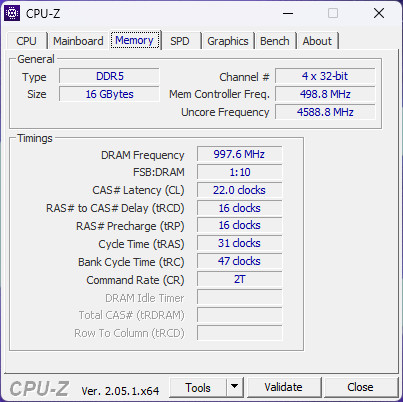
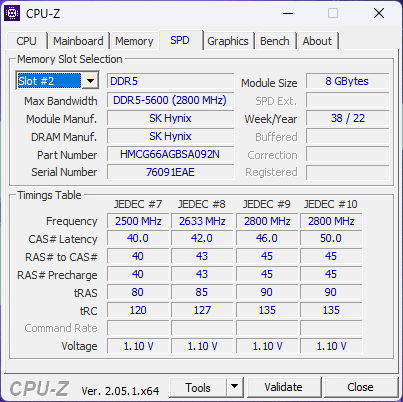
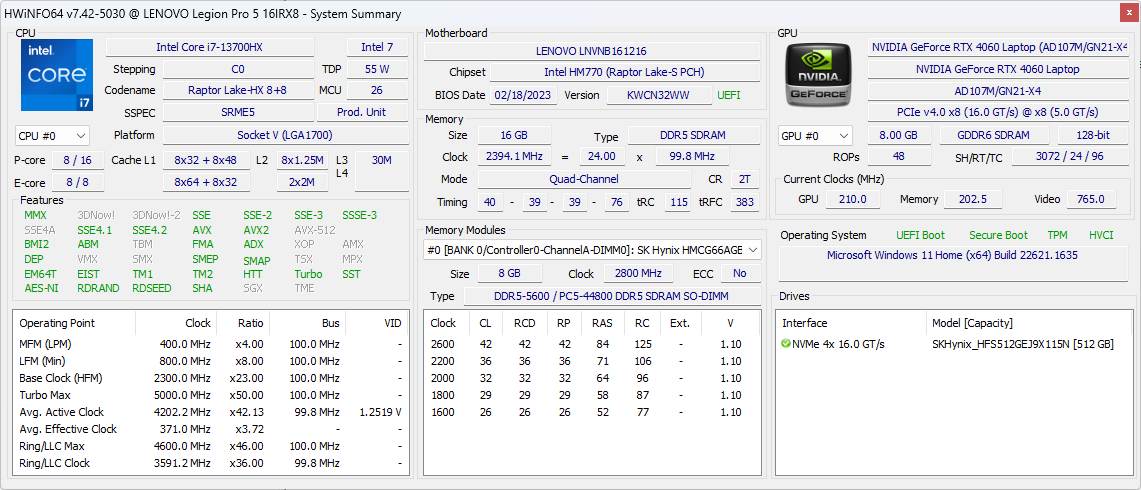
Vår specifika testenhet är en mellankonfiguration med Core i7-13700HX, GeForce RTX 4060 och 165 Hz IPS-skärm för cirka 1 400-1 700 USD. Det finns lägre och högre standardversioner med följande egenskaper Core i5-12500H, RTX 4050, RTX 4070 eller 240 Hz IPS-skärm i stället, men alla skärmalternativ har för närvarande G-Sync och en inbyggd upplösning på 2560 x 1600.
Konkurrenterna till Legion Pro 5 16 inkluderar andra bärbara 16-tums gamingdatorer som t.ex Razer Blade 16,Asus ROG Zephyrus M16,Dell G16 7620eller Gigabyte Aero 16.
Fler recensioner av Lenovo:
Potentiella konkurrenter i jämförelse
Gradering | Datum | Modell | Vikt | Höjd | Storlek | Upplösning | Pris |
|---|---|---|---|---|---|---|---|
| 87.9 % v7 (old) | 05/2023 | Lenovo Legion Pro 5 16IRX8 i7-13700HX, GeForce RTX 4060 Laptop GPU | 2.5 kg | 26.8 mm | 16.00" | 2560x1600 | |
| 87.8 % v7 (old) | 02/2023 | Asus ROG Zephyrus M16 GU603Z i9-12900H, GeForce RTX 3070 Ti Laptop GPU | 2.1 kg | 19.9 mm | 16.00" | 2560x1600 | |
| 91.2 % v7 (old) | 02/2023 | Razer Blade 16 Early 2023 i9-13950HX, GeForce RTX 4080 Laptop GPU | 2.4 kg | 21.99 mm | 16.00" | 2560x1600 | |
| 89.4 % v7 (old) | 02/2023 | Lenovo Legion Pro 7 16IRX8H i9-13900HX, GeForce RTX 4080 Laptop GPU | 2.7 kg | 26 mm | 16.00" | 2560x1600 | |
| 87.7 % v7 (old) | 10/2022 | Lenovo Legion 5 Pro 16ARH7H RTX 3070 Ti R7 6800H, GeForce RTX 3070 Ti Laptop GPU | 2.6 kg | 26.6 mm | 16.00" | 2560x1600 | |
| 89.3 % v7 (old) | 01/2023 | Lenovo Legion S7 16ARHA7 R9 6900HX, Radeon RX 6800S | 2.2 kg | 16.9 mm | 16.00" | 2560x1600 |
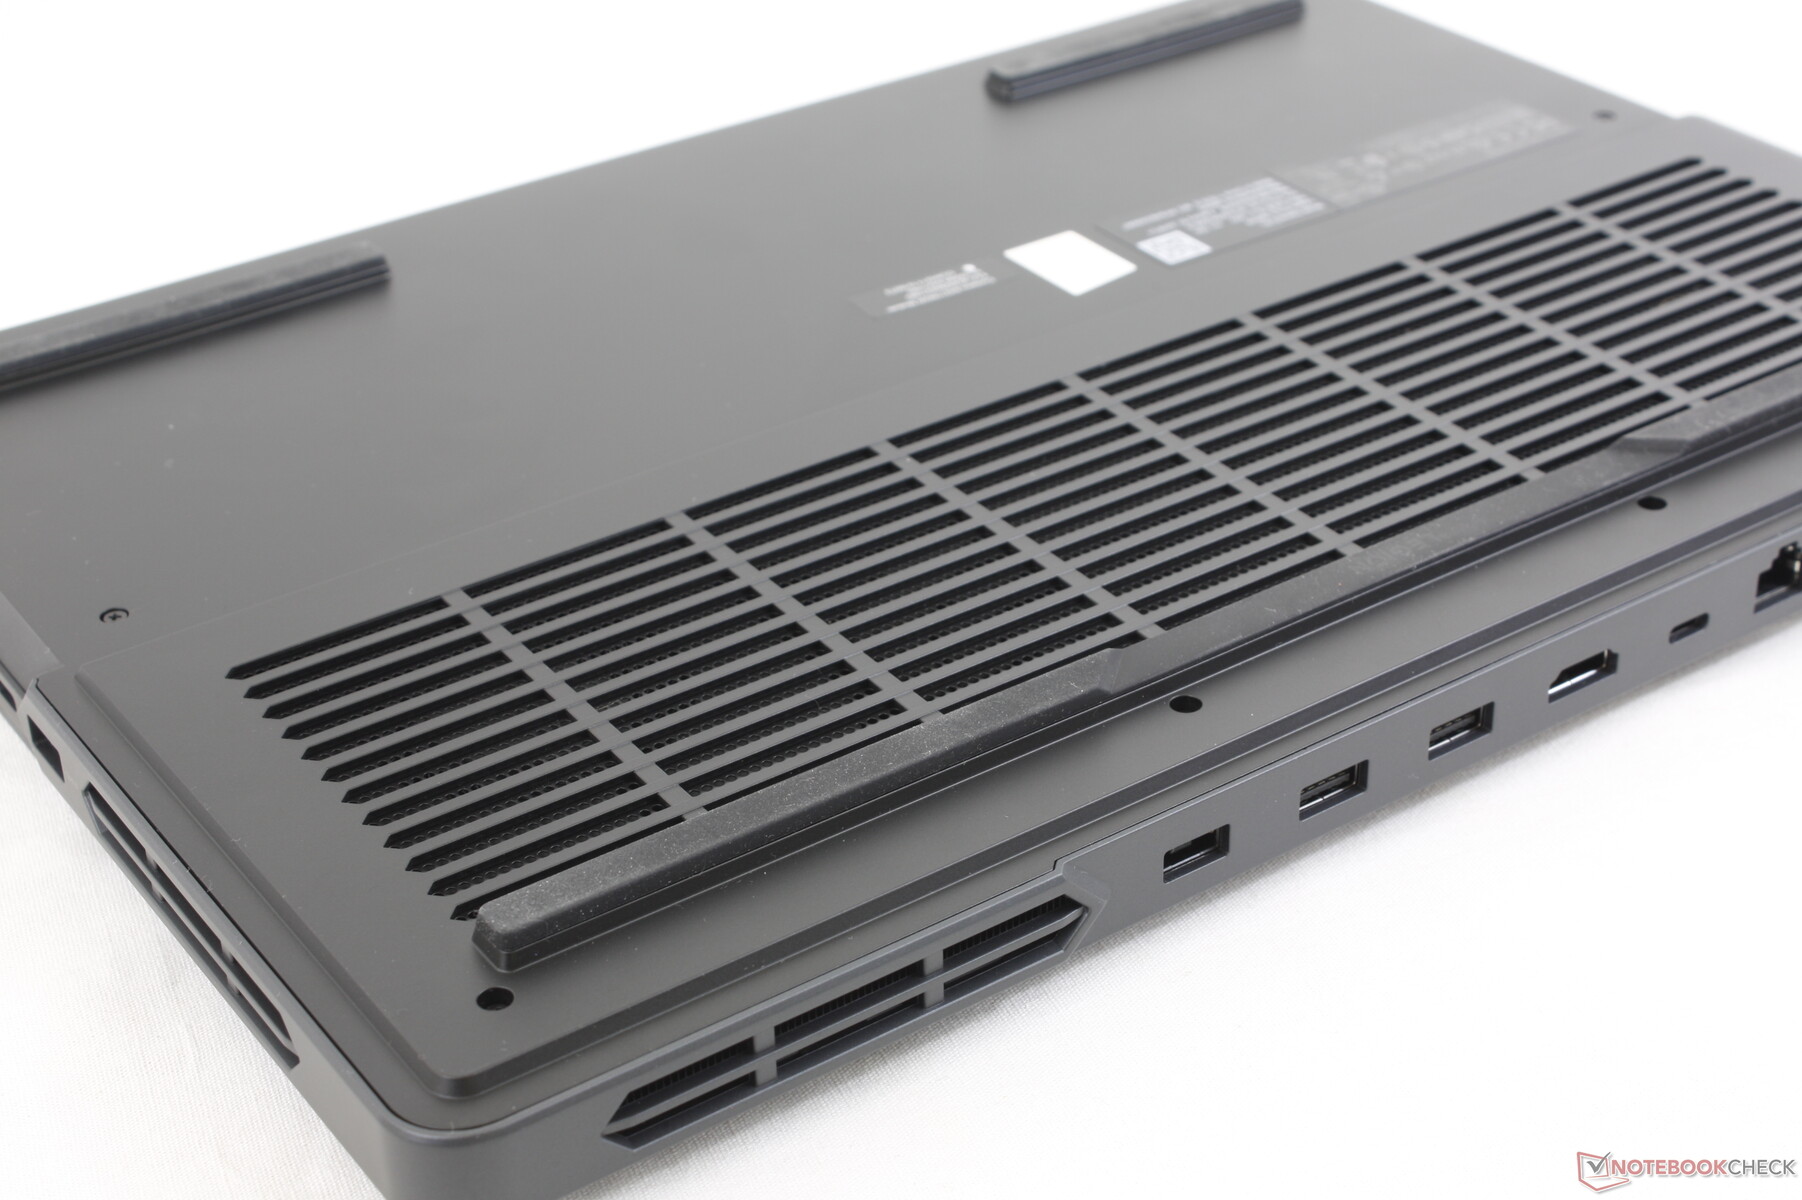
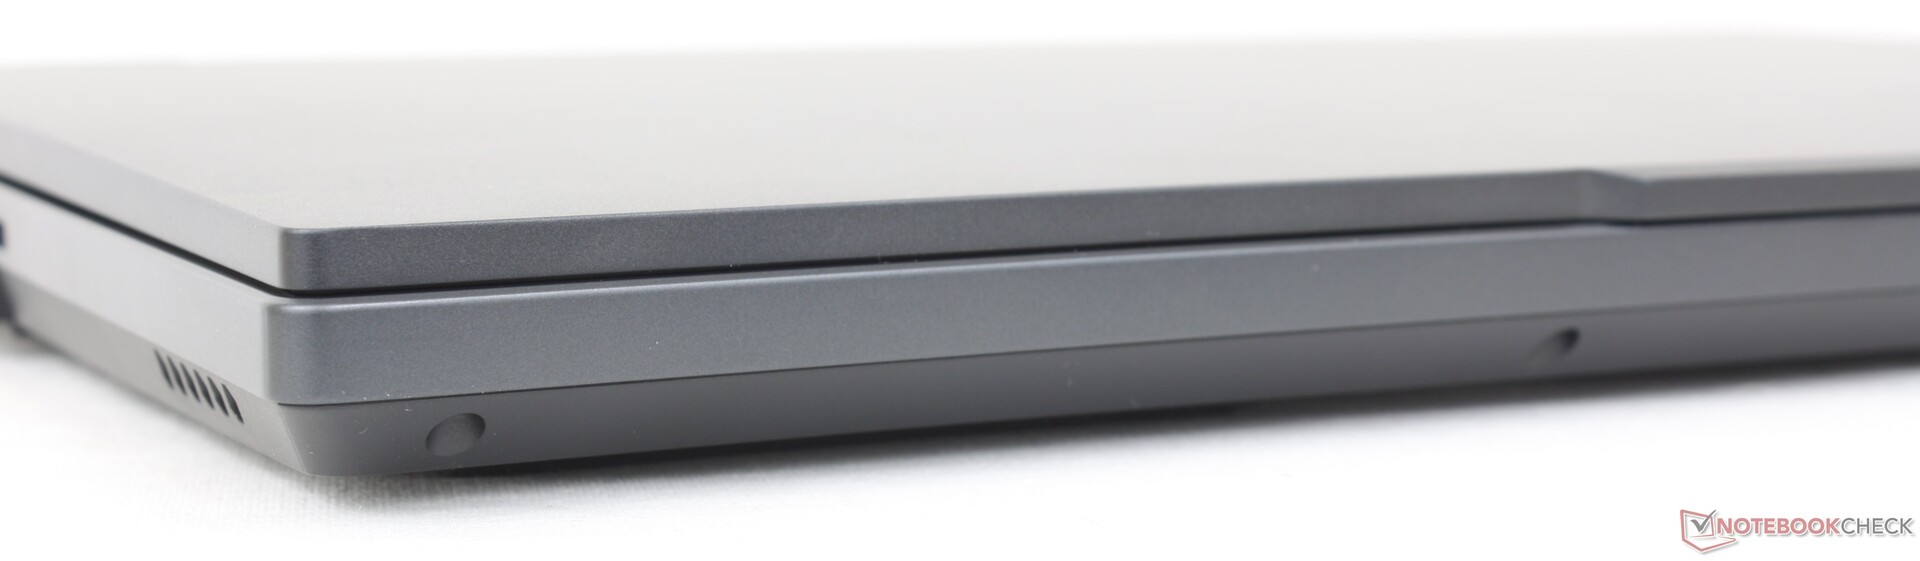
Fall - En smalare Legion
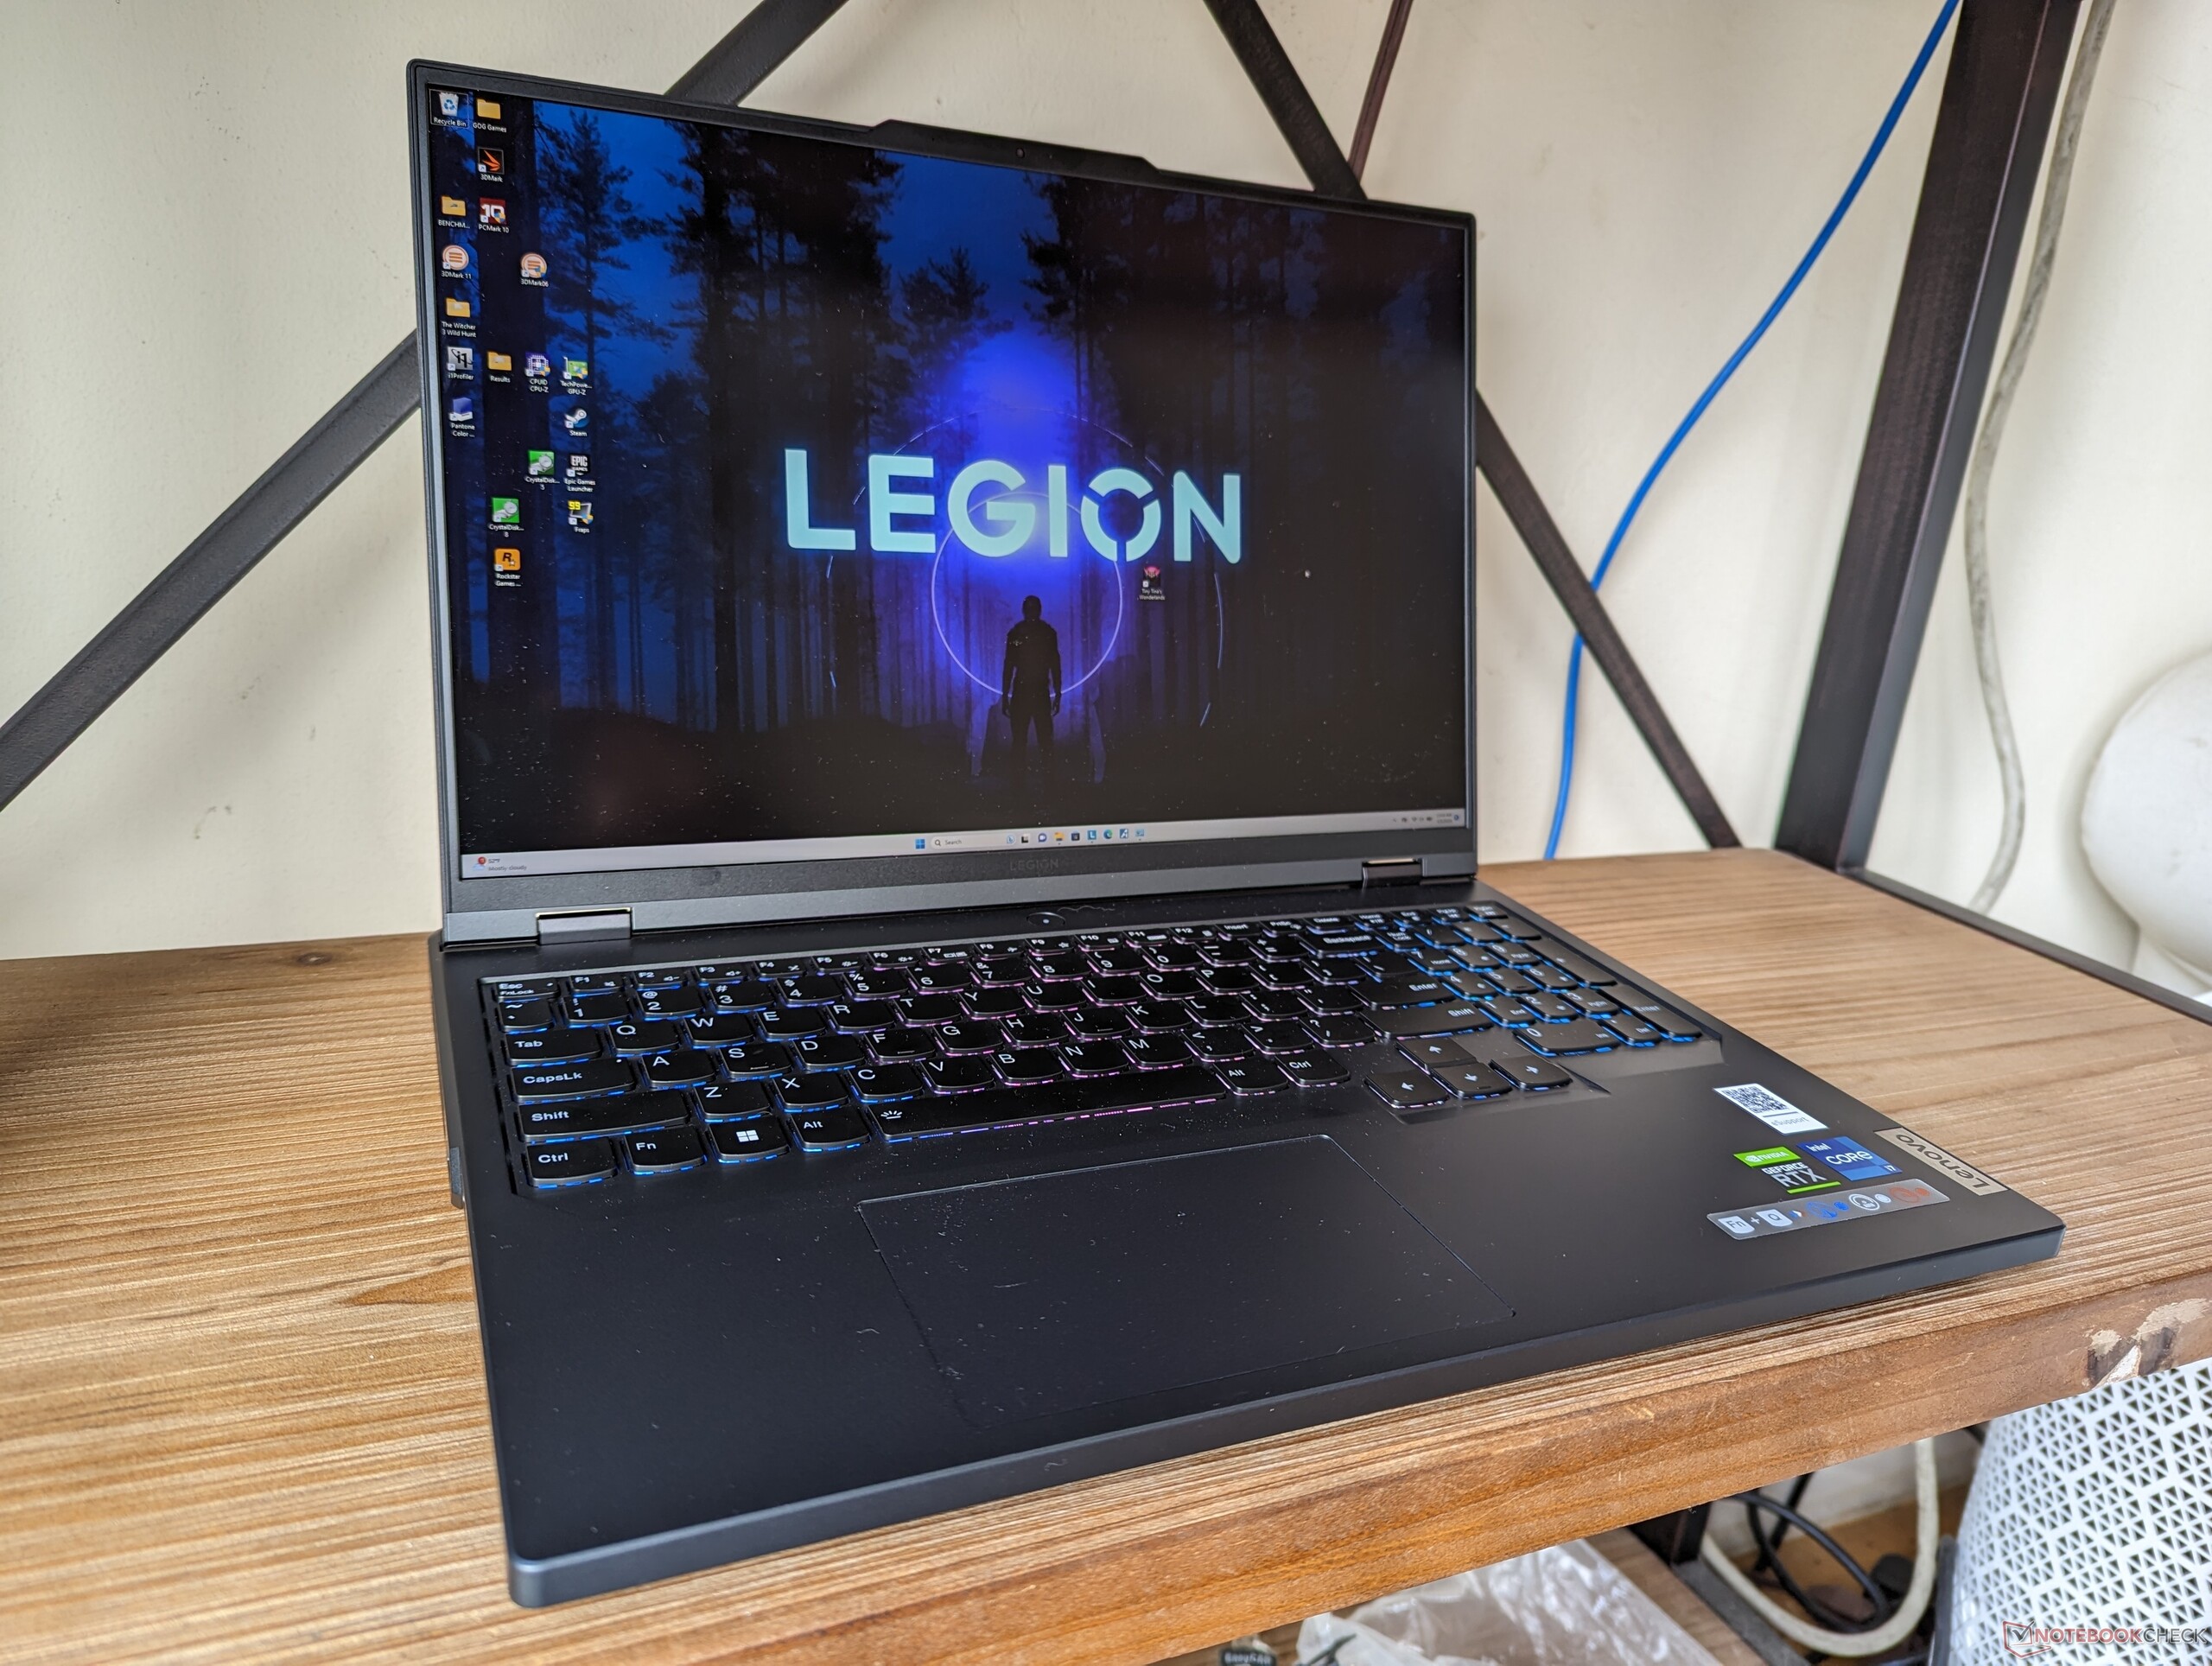
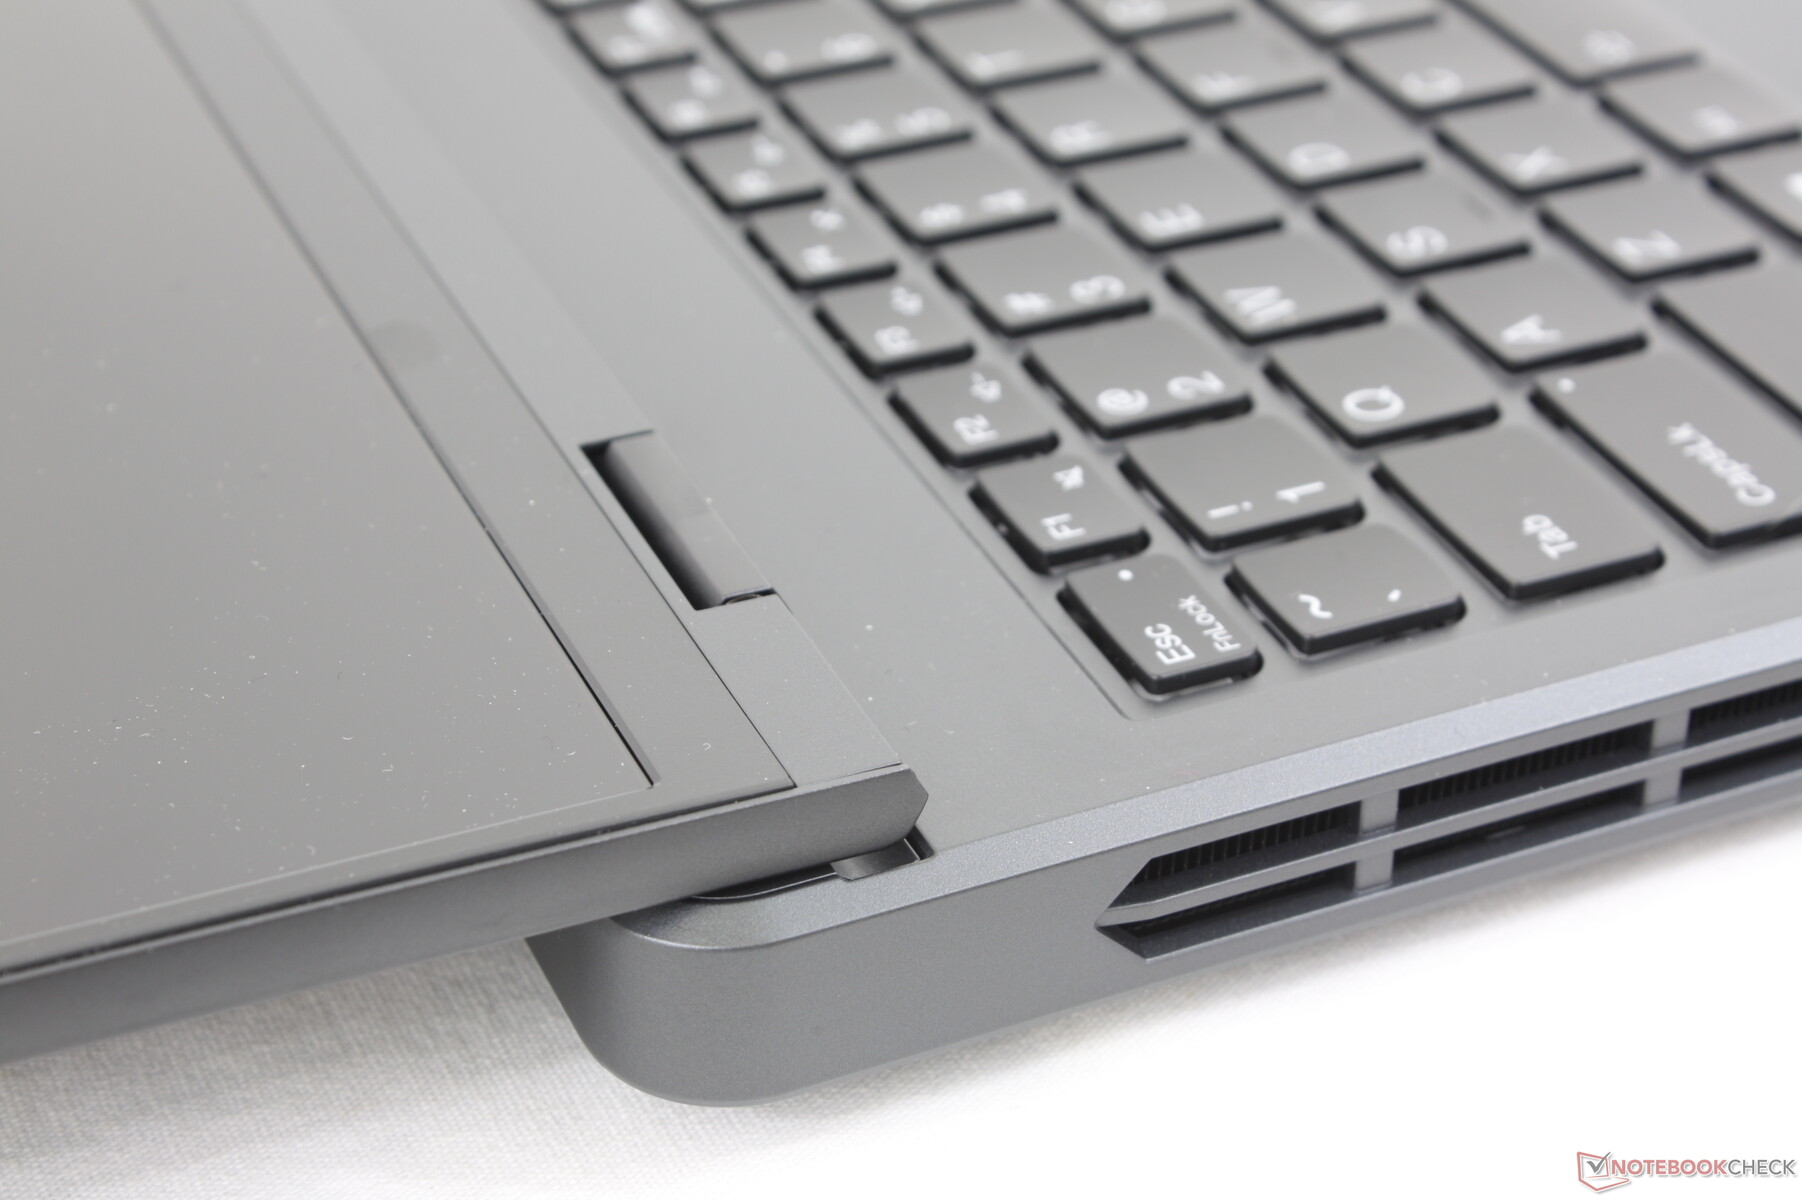
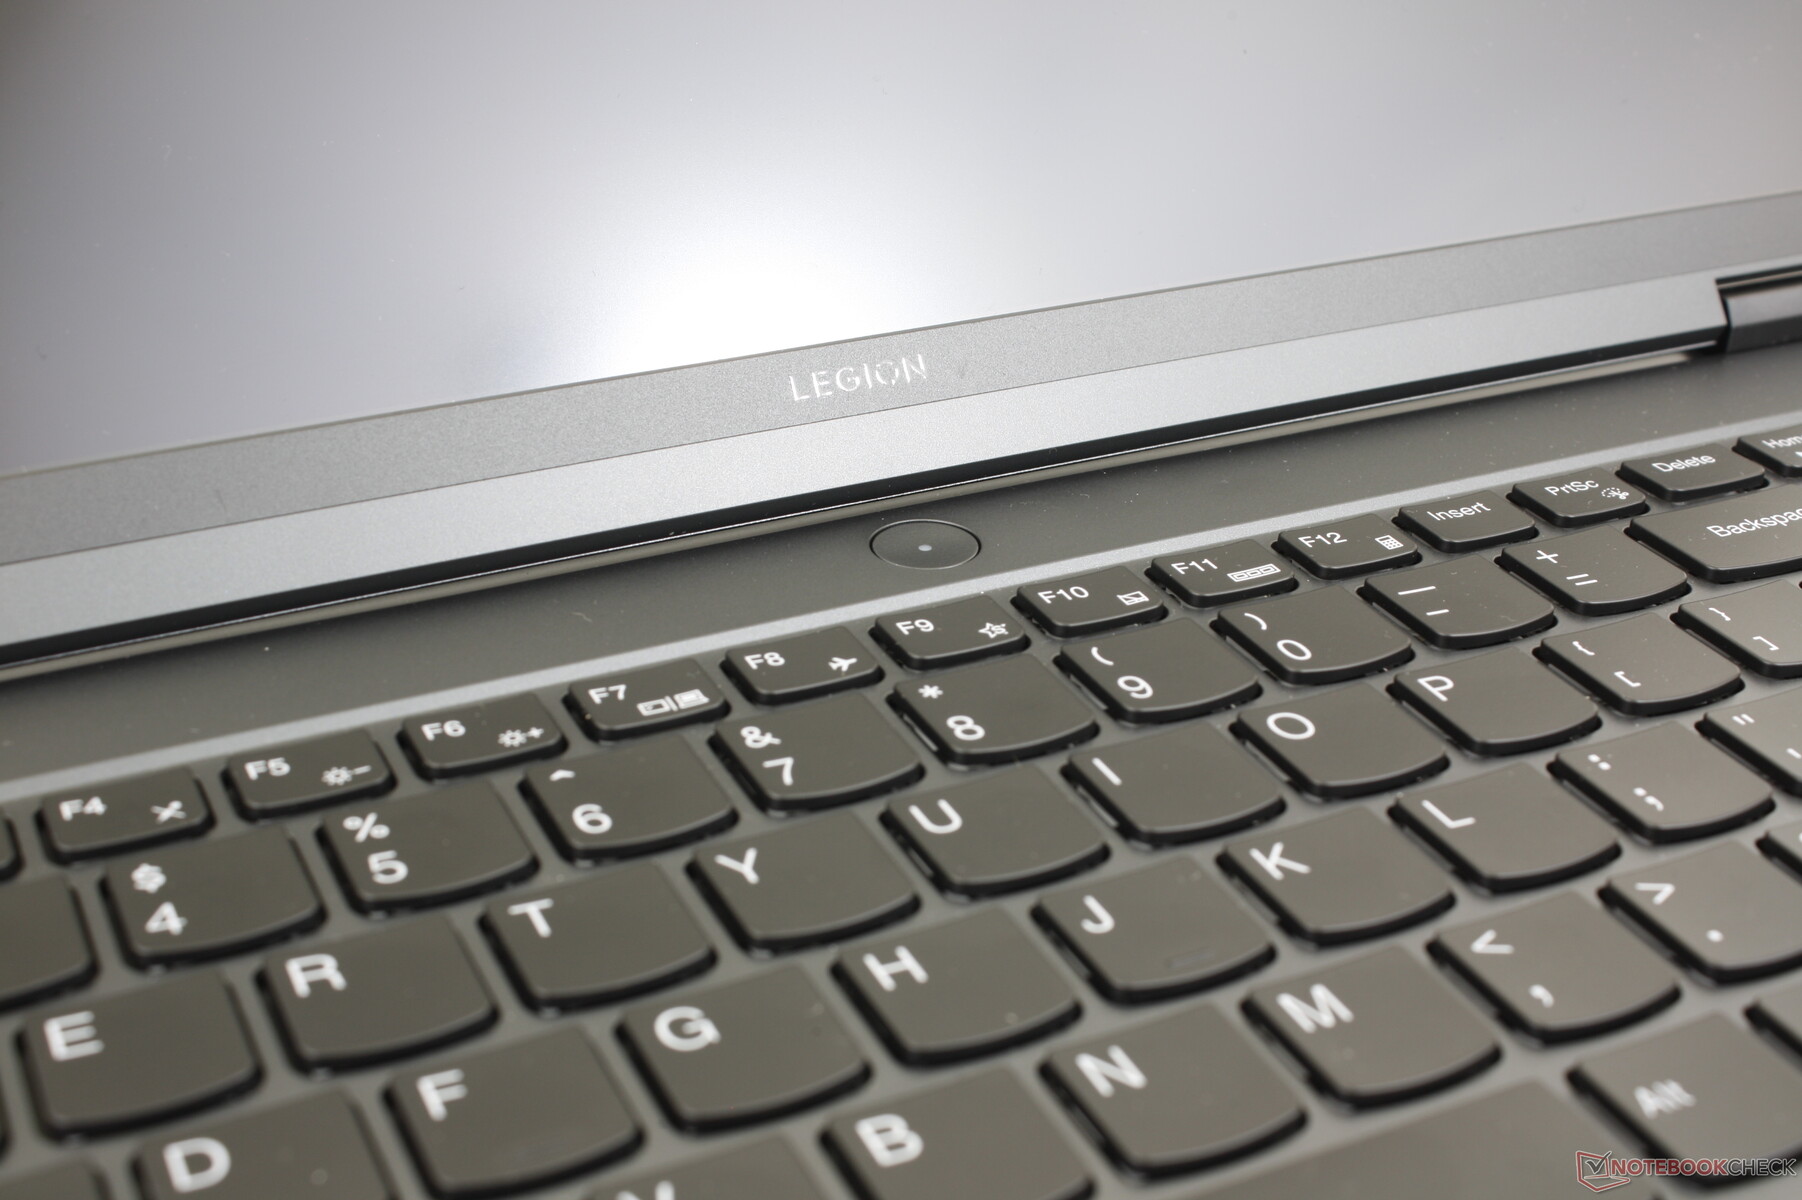
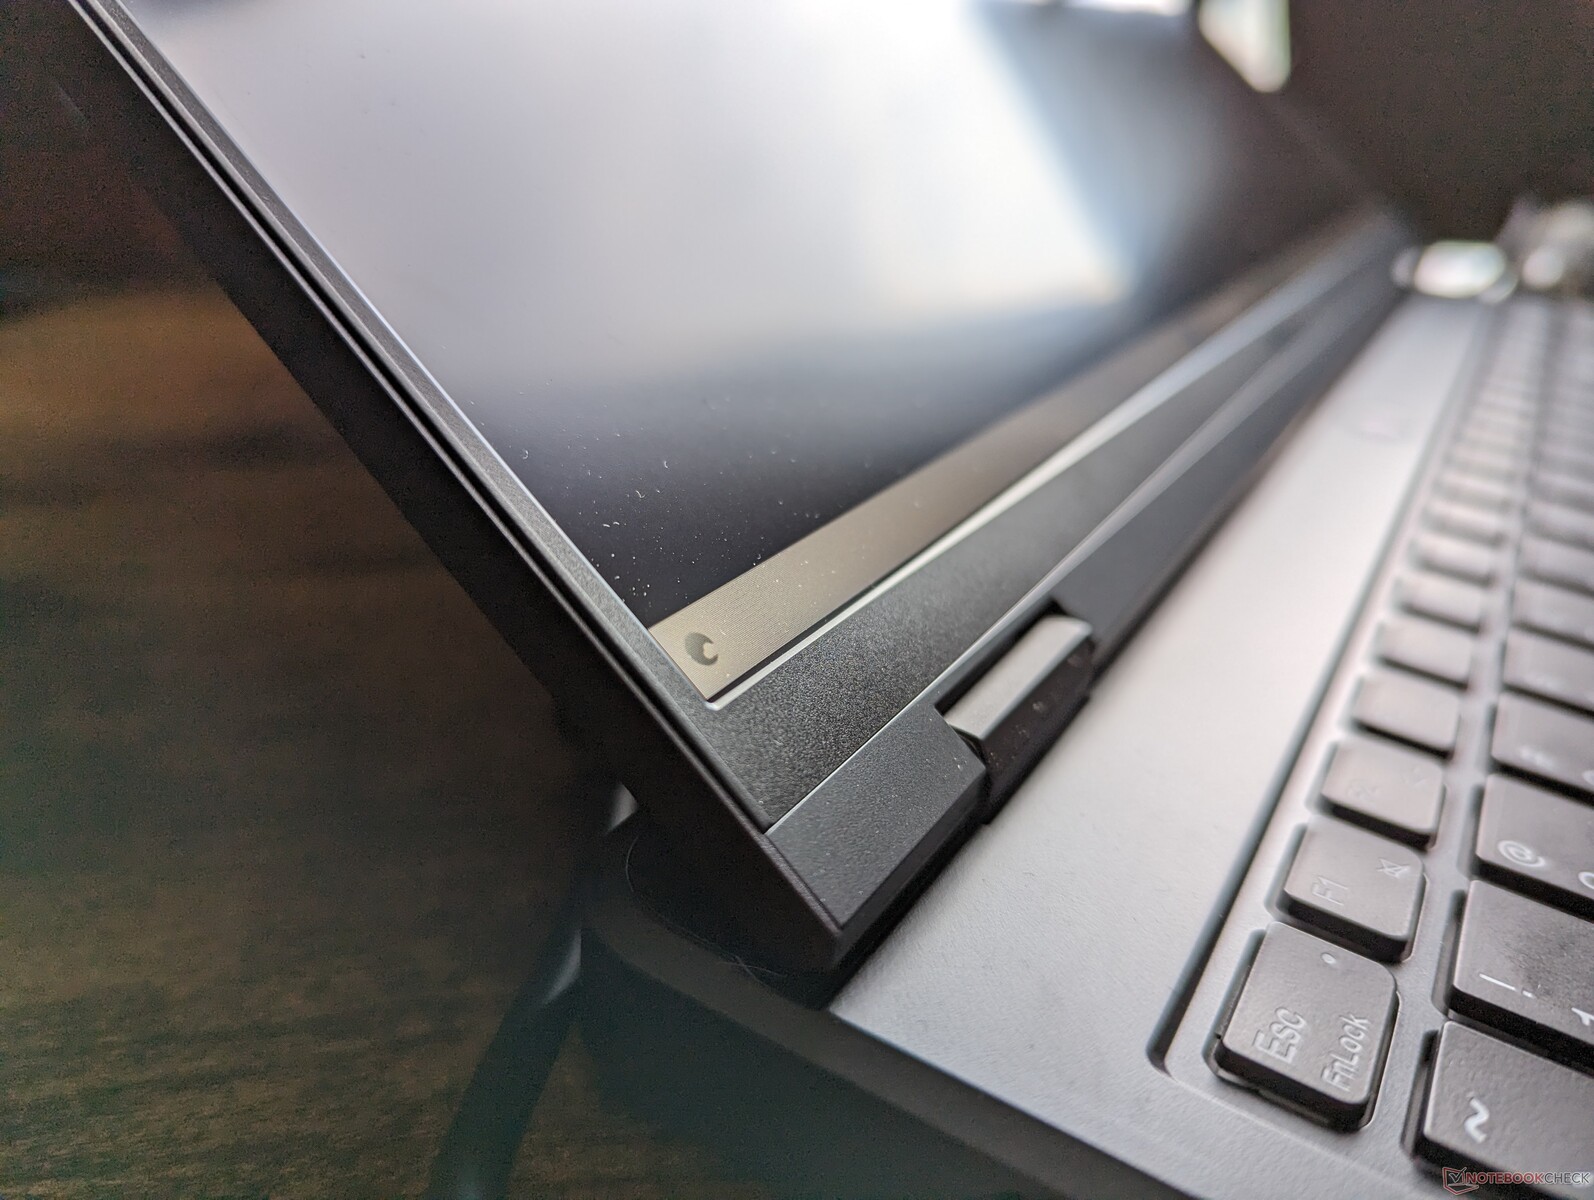
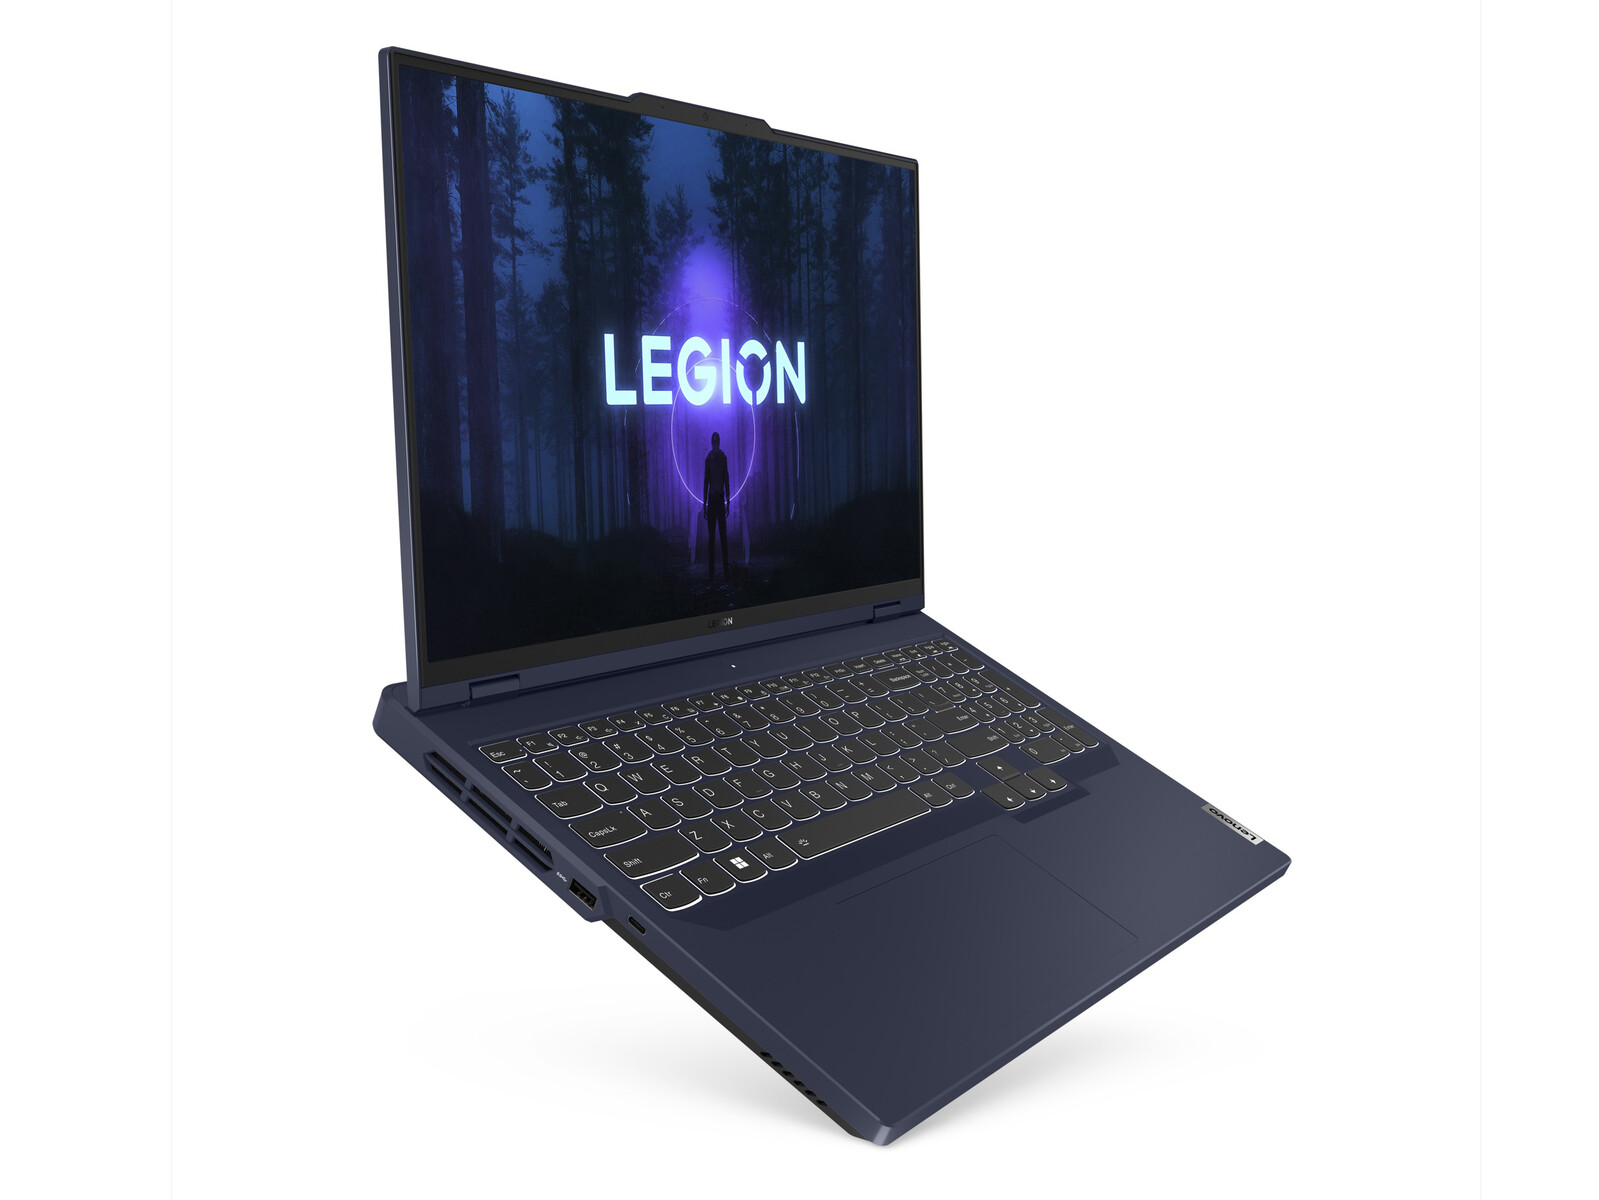
Visuellt har det reviderade chassit färre accenter och vinklar, vilket ger ett plattare och mer professionellt utseende än förra årets modell, särskilt på baksidan. Den tvåfärgade grå och silverfärgningen har försvunnit till förmån för ett mer enhetligt utseende. Vi föredrar den nya designen eftersom den lutar åt minimalism samtidigt som den behåller många av de utmärkande egenskaperna hos Legion.
Chassiets styvhet är utmärkt på vår enhet utan hörbart knarrande eller fruktansvärt svaga punkter. Basen och locket uppvisar mer vridning än den styvare Blade 16, men inte tillräckligt mycket för att det ska vara något stort bekymmer.
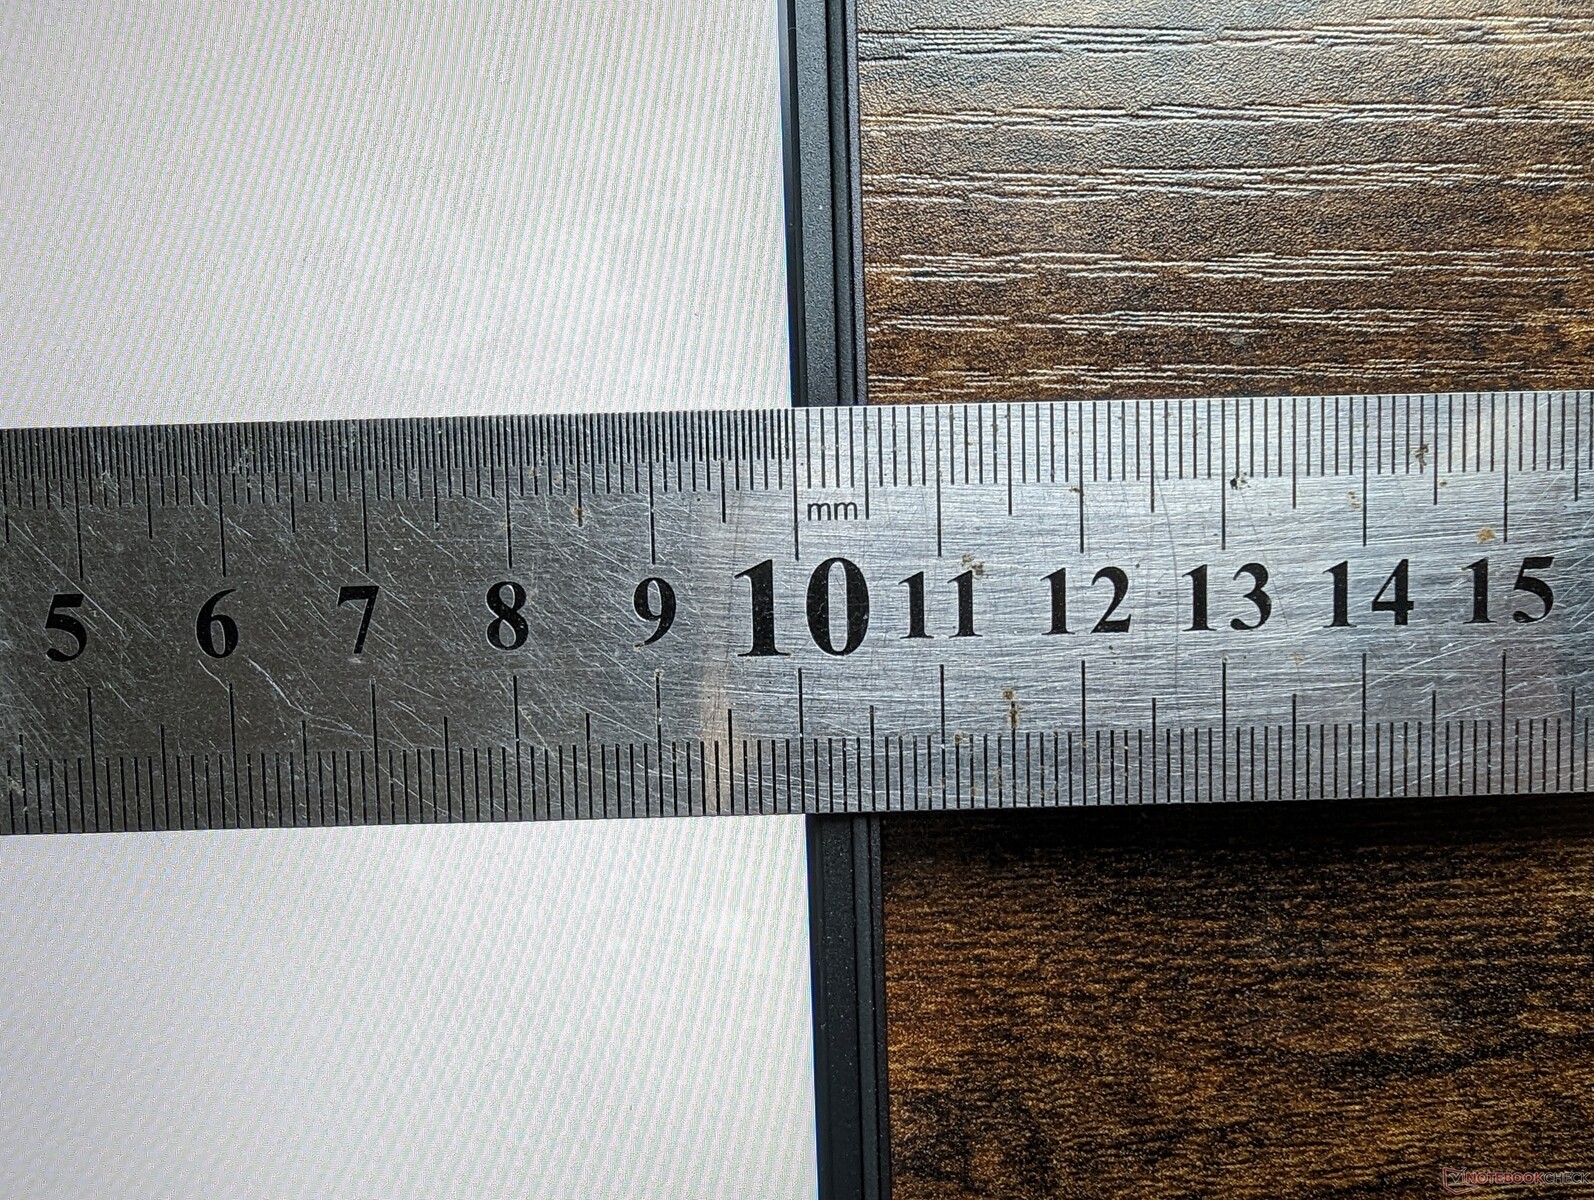
Legion Pro 5 16 är märkbart större och tyngre än många av sina jämnåriga konkurrenter. Aero 16, Blade 16 och Zephyrus M16 är alla tunnare och lättare än Lenovo med upp till 8 mm eller 400 gram, vilket inte är obetydligt. Även om den verkligen inte alls är lika skrymmande som många bärbara 17,3-tums gamingdatorer är Legion Pro 5 16 inte heller det mest resevänliga alternativet i sin 16-tums storleksklass.
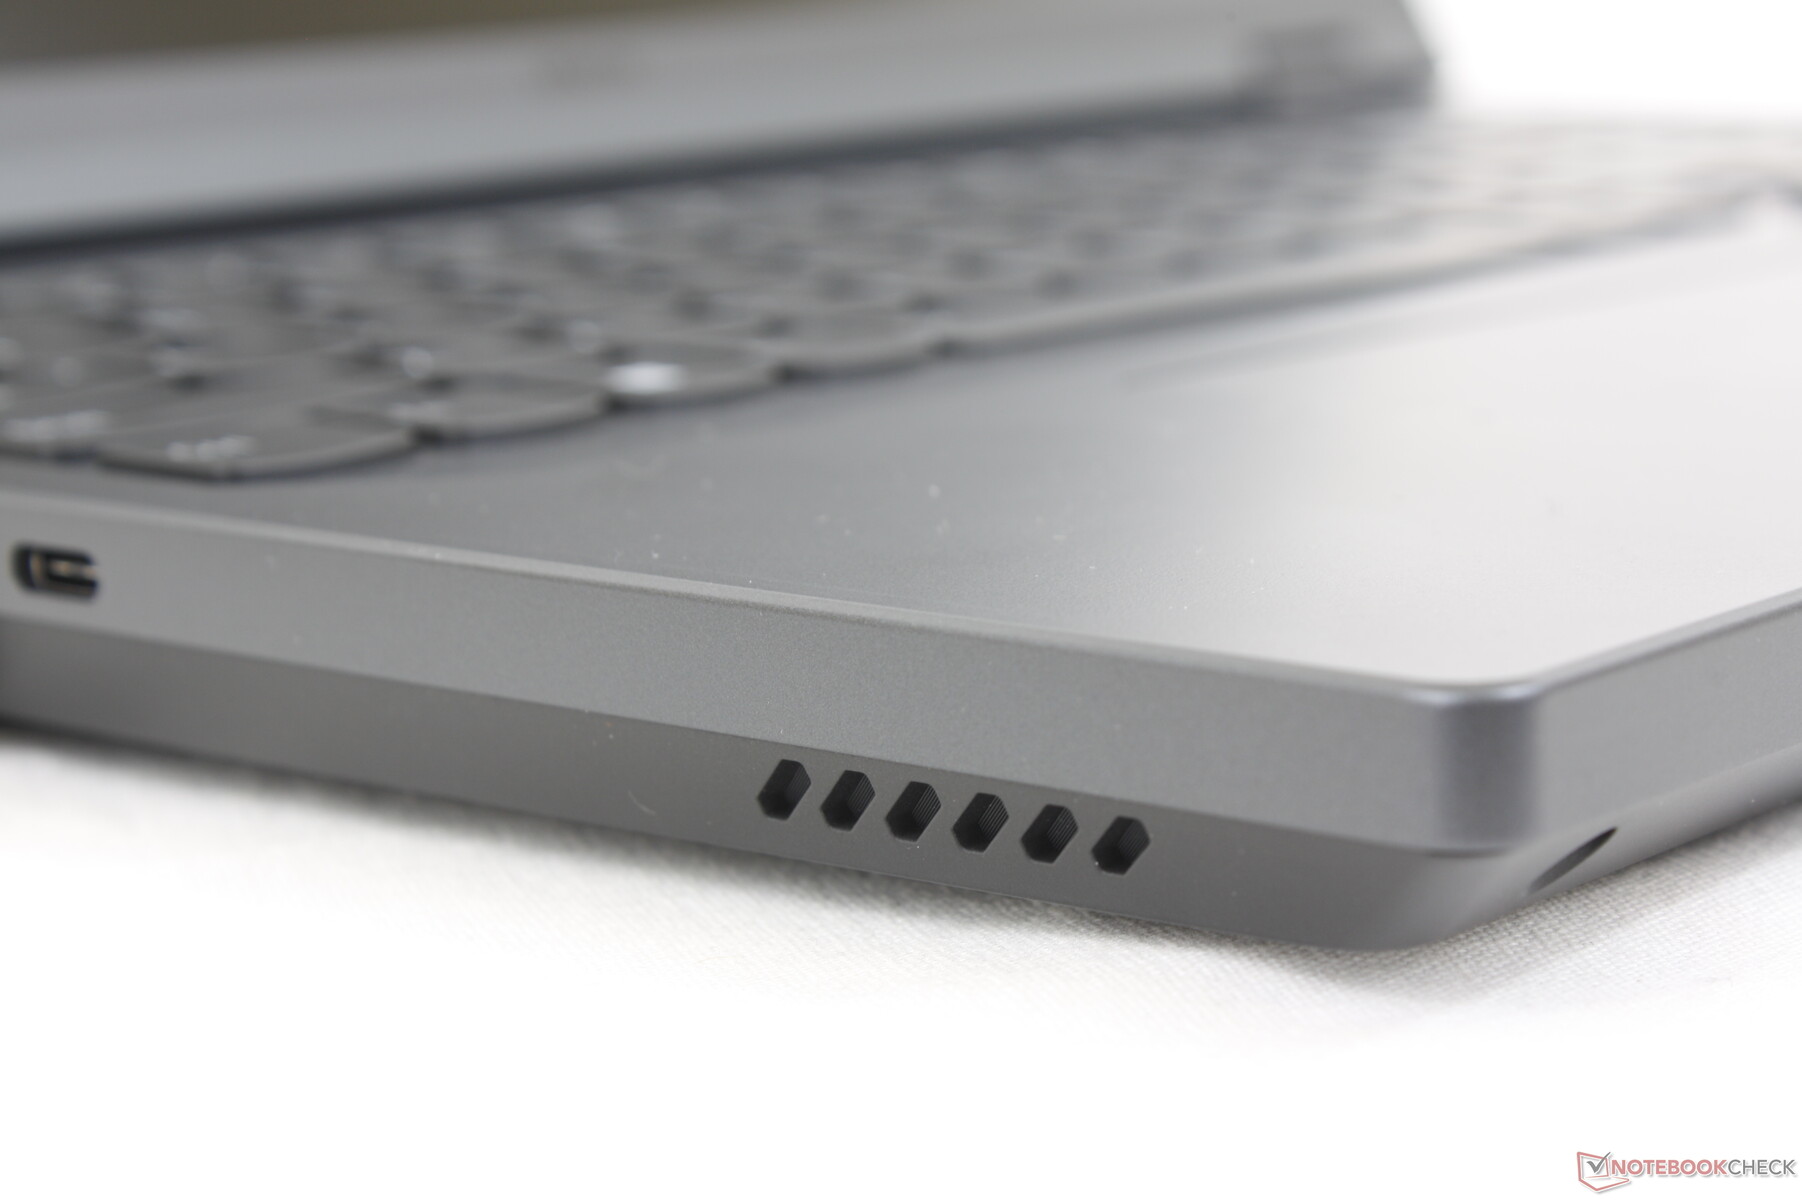
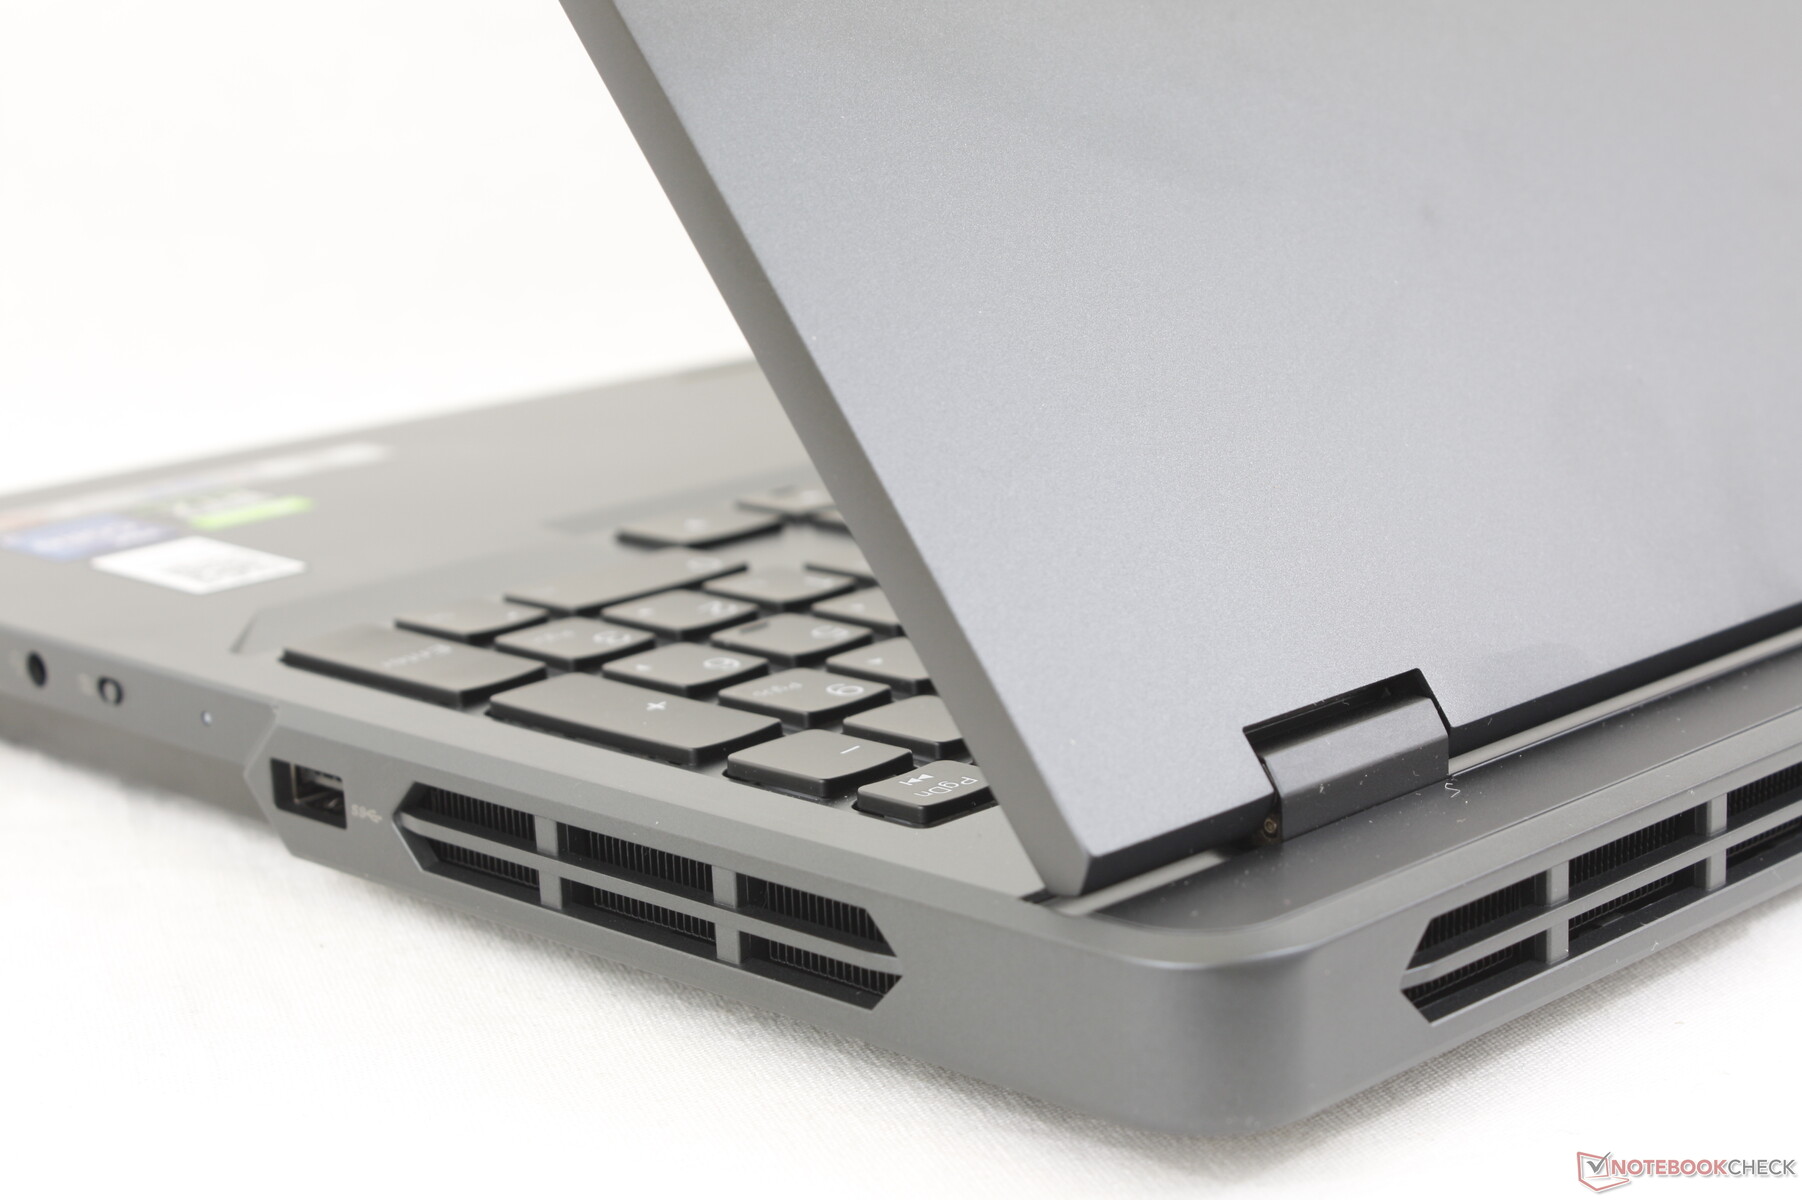
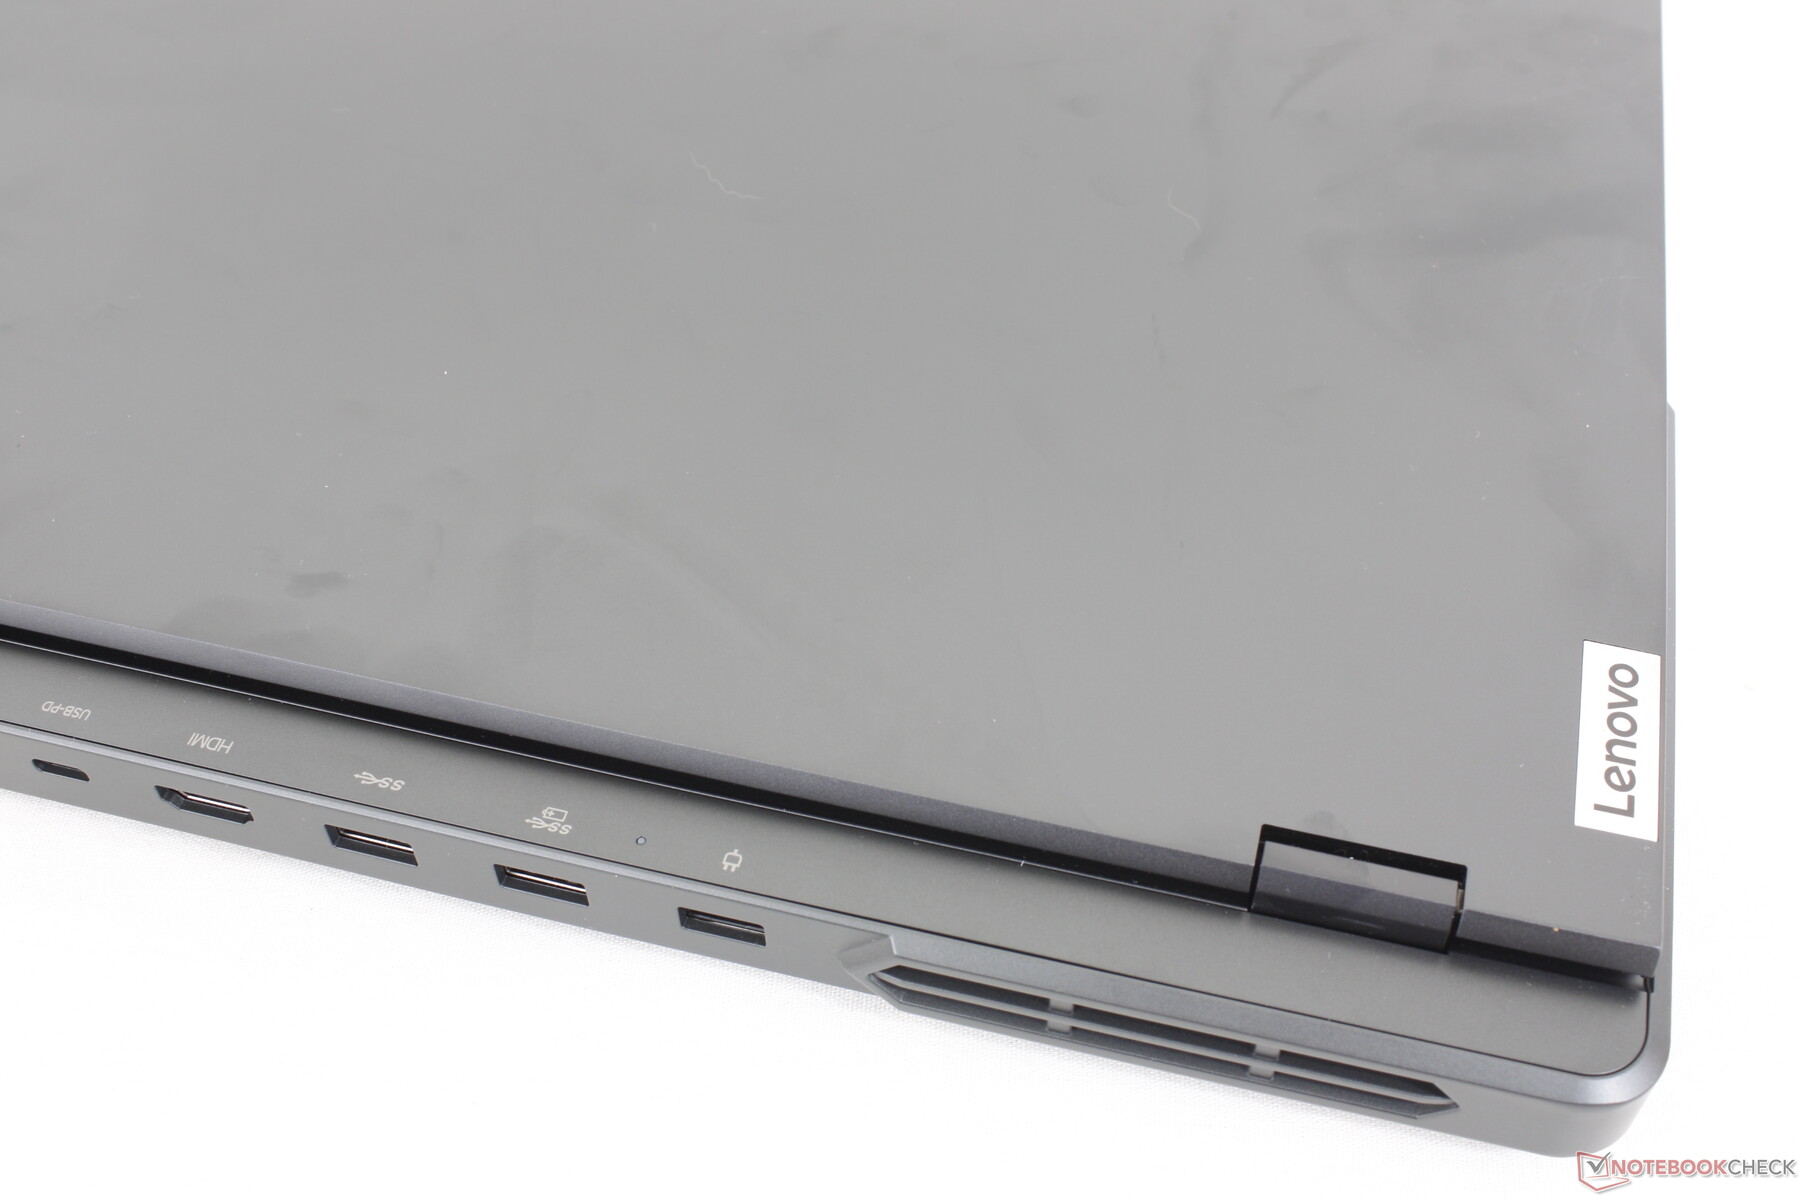
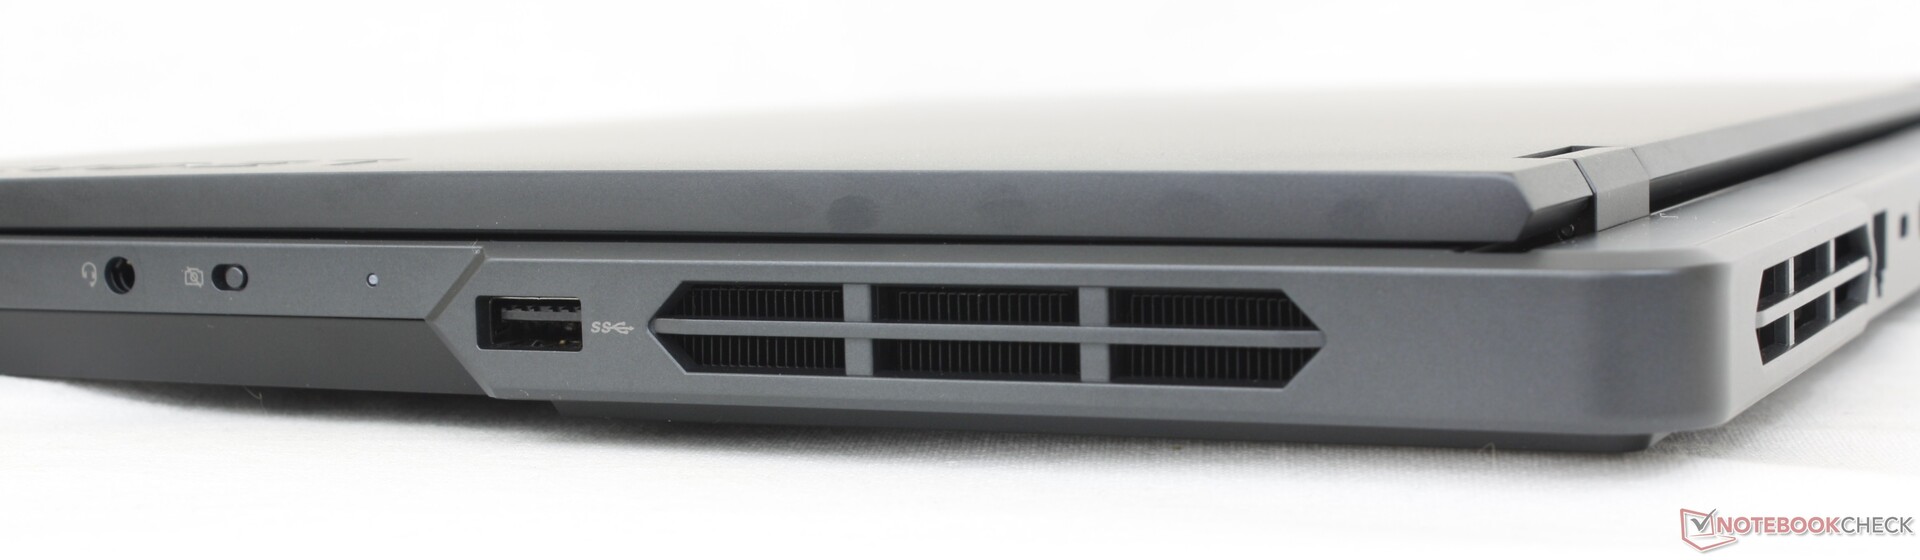
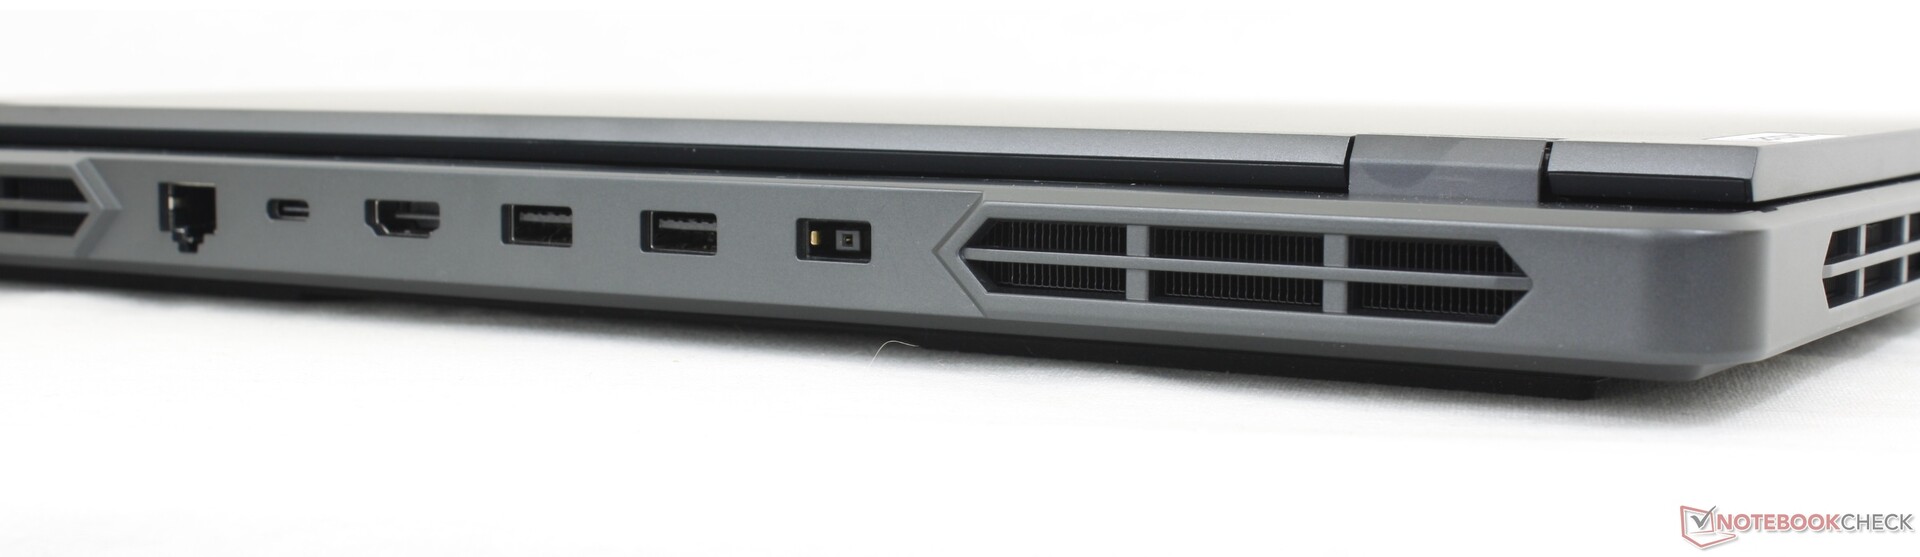
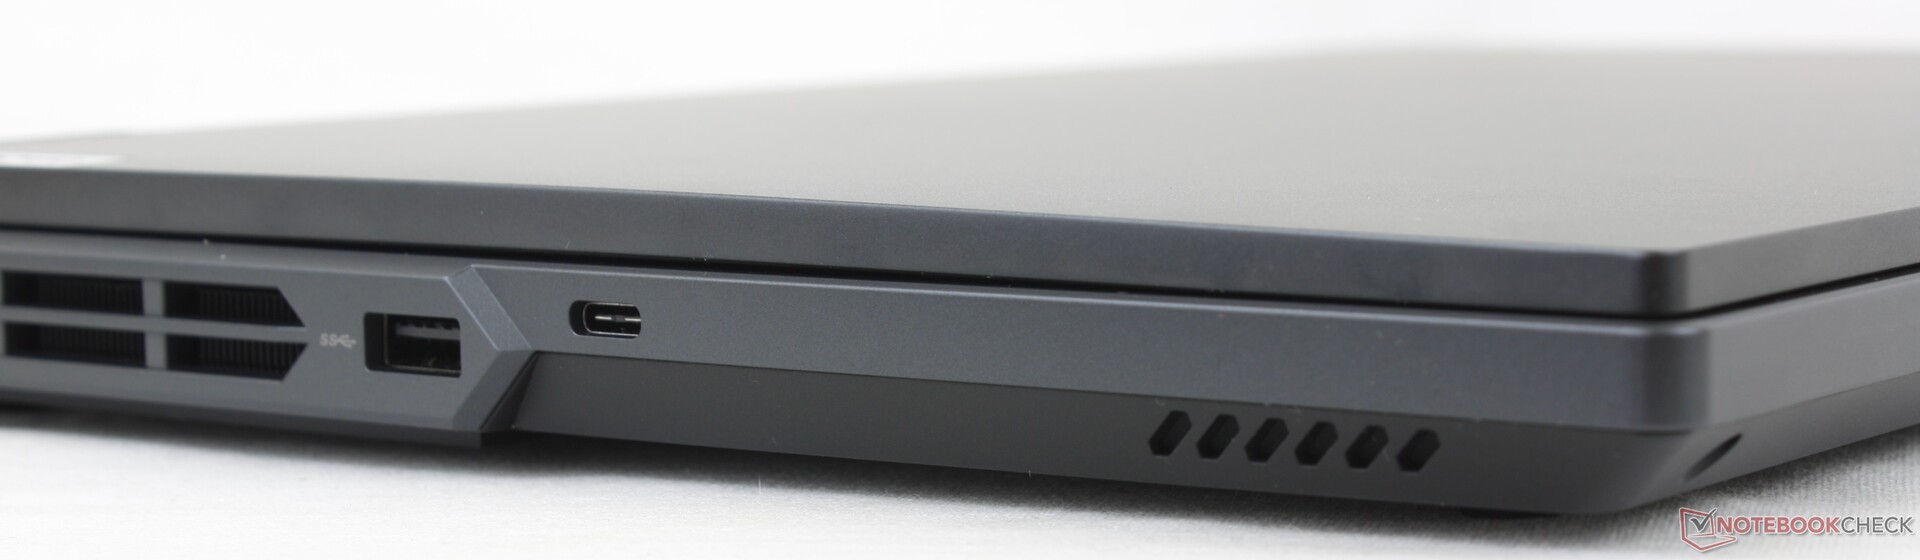
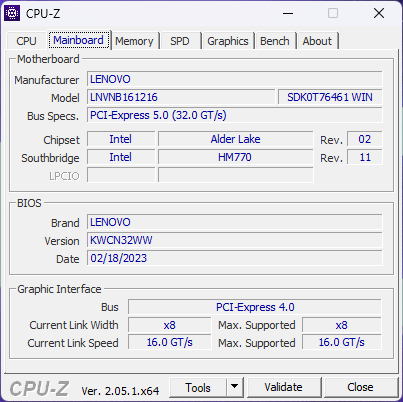
Anslutningsmöjligheter - Många portar men ingen Thunderbolt
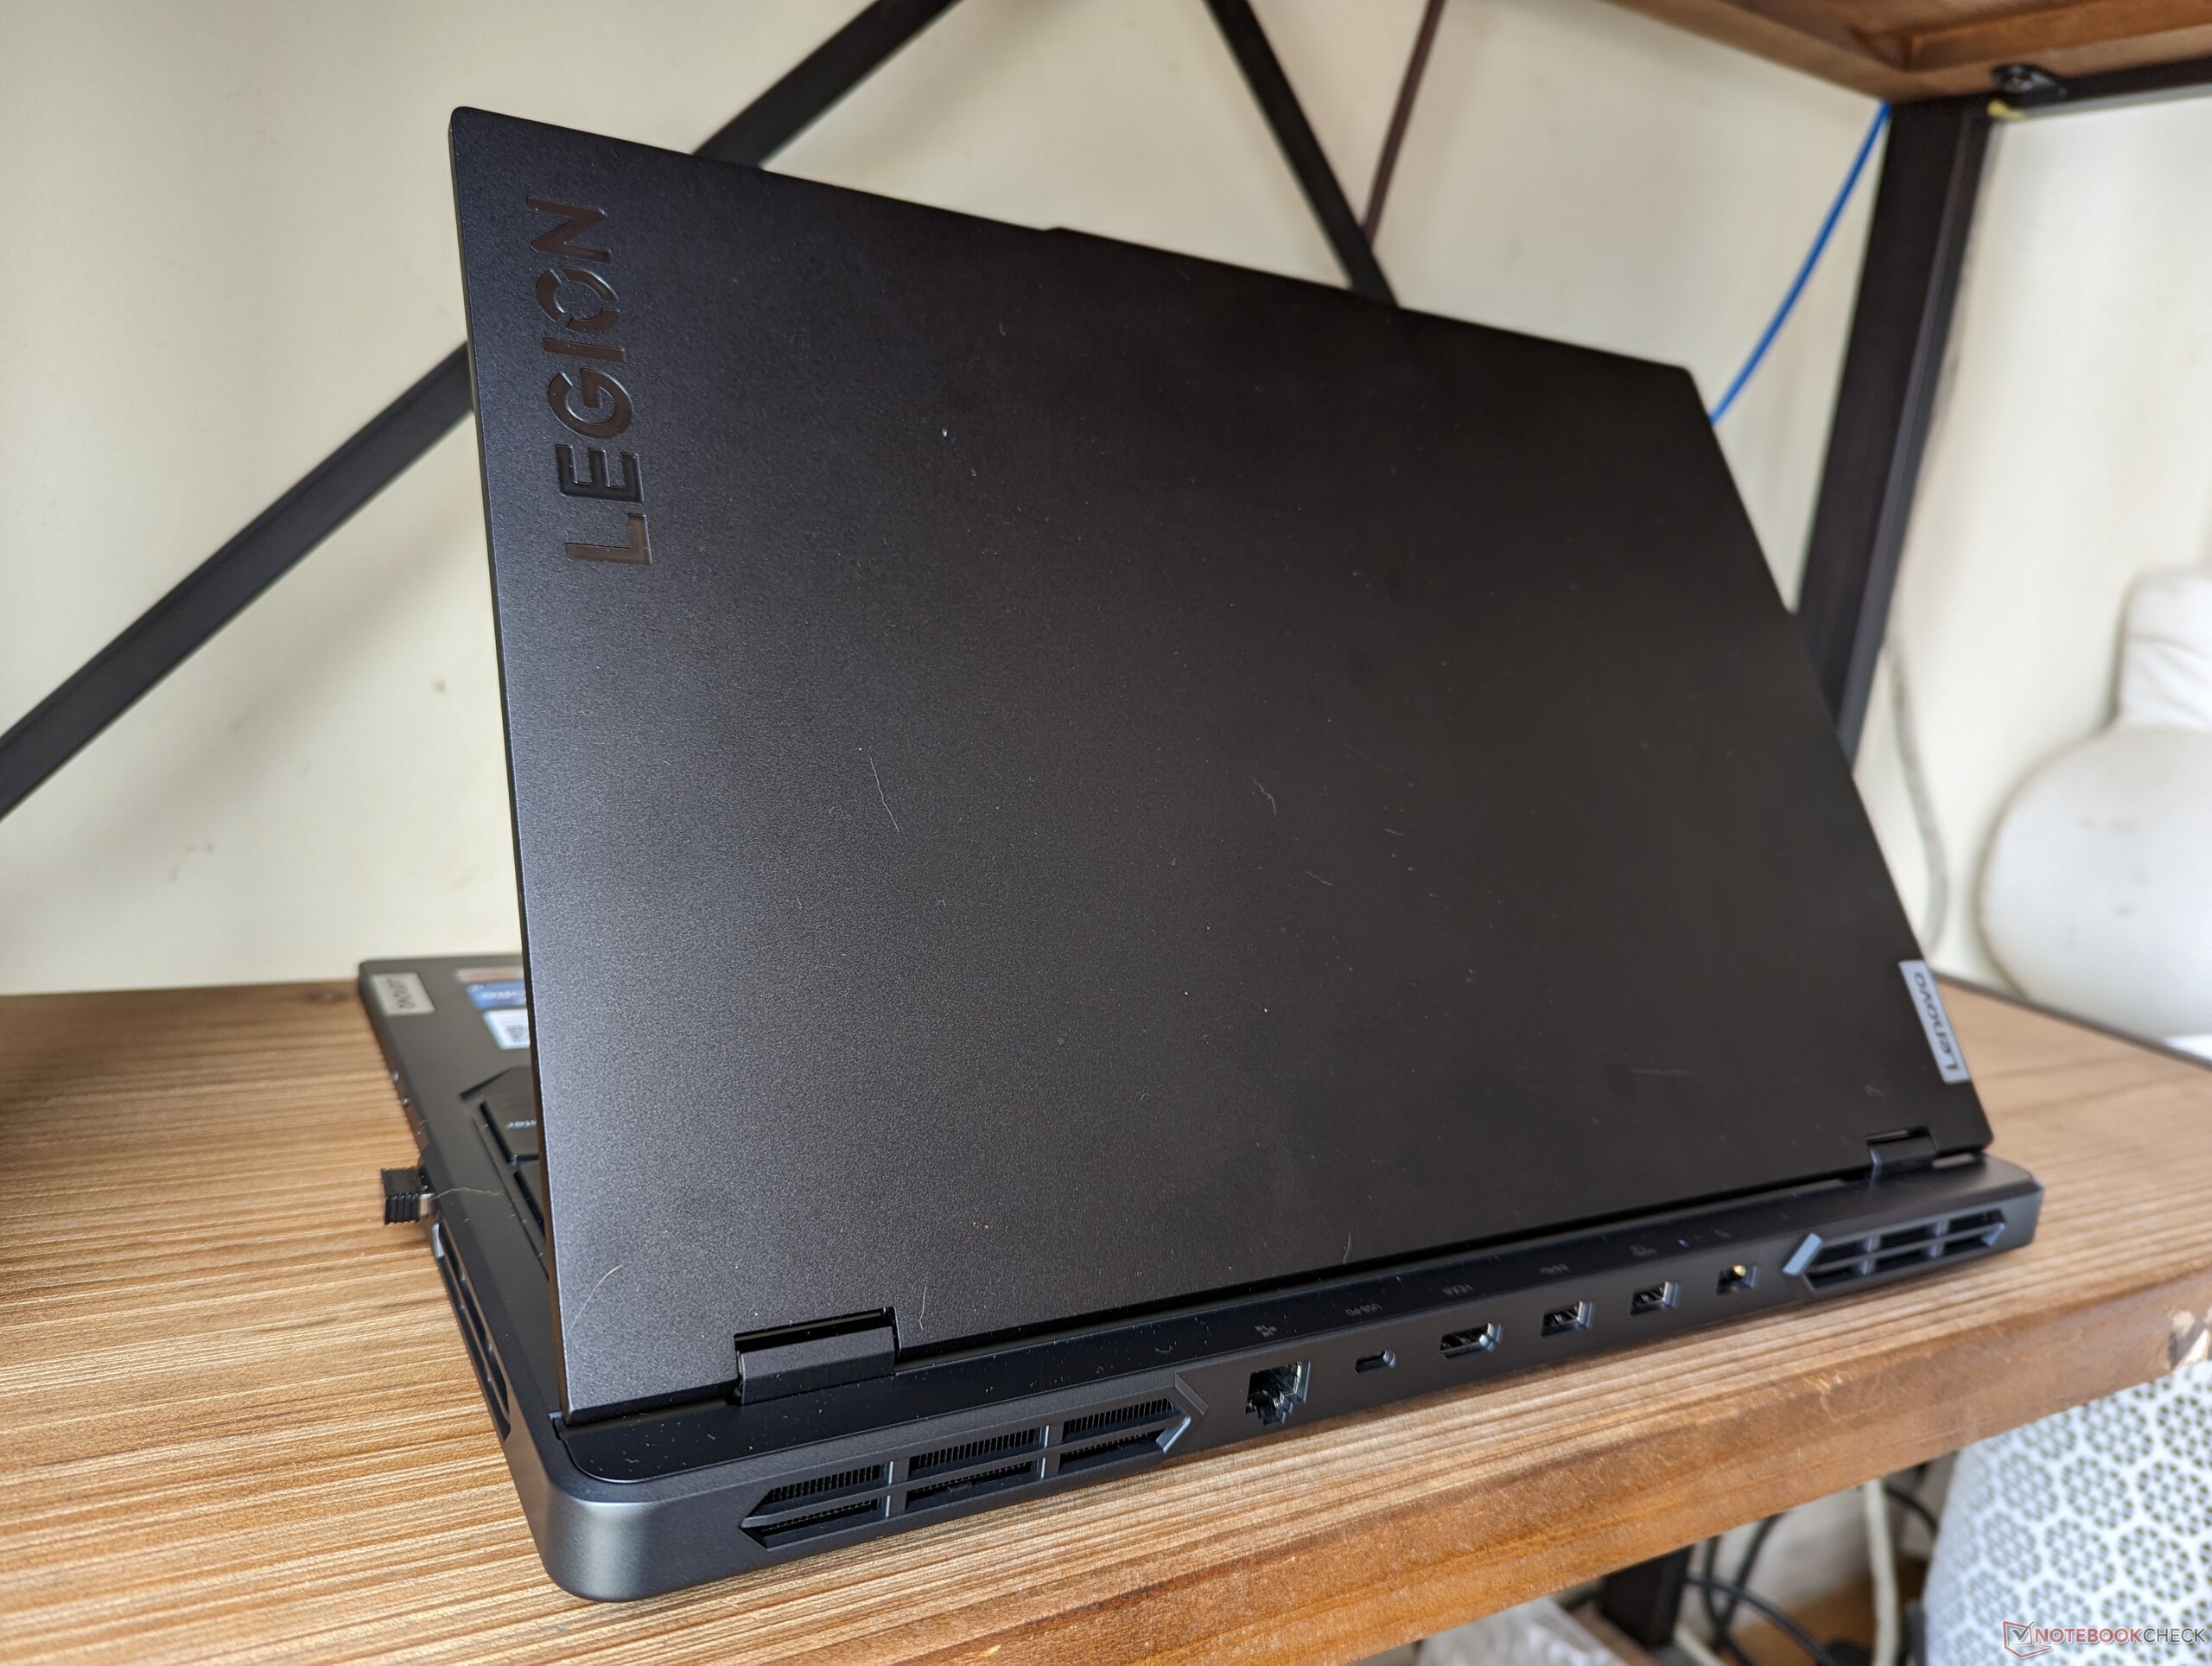
Det finns ett stort antal portar, varav de flesta är placerade på baksidan. Faktum är att modellen delar exakt samma portar och placering som på de högre prissatta modellerna.Legion Pro 7 16IRX8H trots att de båda modellerna är visuellt olik varandra.
Observera att modellen inte har stöd för Thunderbolt. Den har åtminstone en RJ-45-port till skillnad från Blade 16.
De bakre portarna är märkta med ikoner som är synliga från chassits ovansida, vilket framgår av bilden ovan. Ikonerna gör det lättare att ansluta kablar till skillnad från de bakre portarna på Alienware m18, men de lyser tyvärr inte upp.
Kommunikation
En Intel AX211 är standard för Wi-Fi 6E och Bluetooth 5.2. Vi upplevde stabila överföringshastigheter och inga problem när vi kopplade till vårt Asus AXE11000-nätverk på 6 GHz.
Webbkamera
Webbkameran med 1080p eller 2 MP har blivit standard på bärbara datorer för spel. På vår Lenovo var dock den automatiska justeringen av ljusstyrkan långsammare än vanligt, vilket resulterade i en mörkare bild.
Det finns en elektronisk webbkameraavstängare för integritetskontroll men ingen IR-sensor.


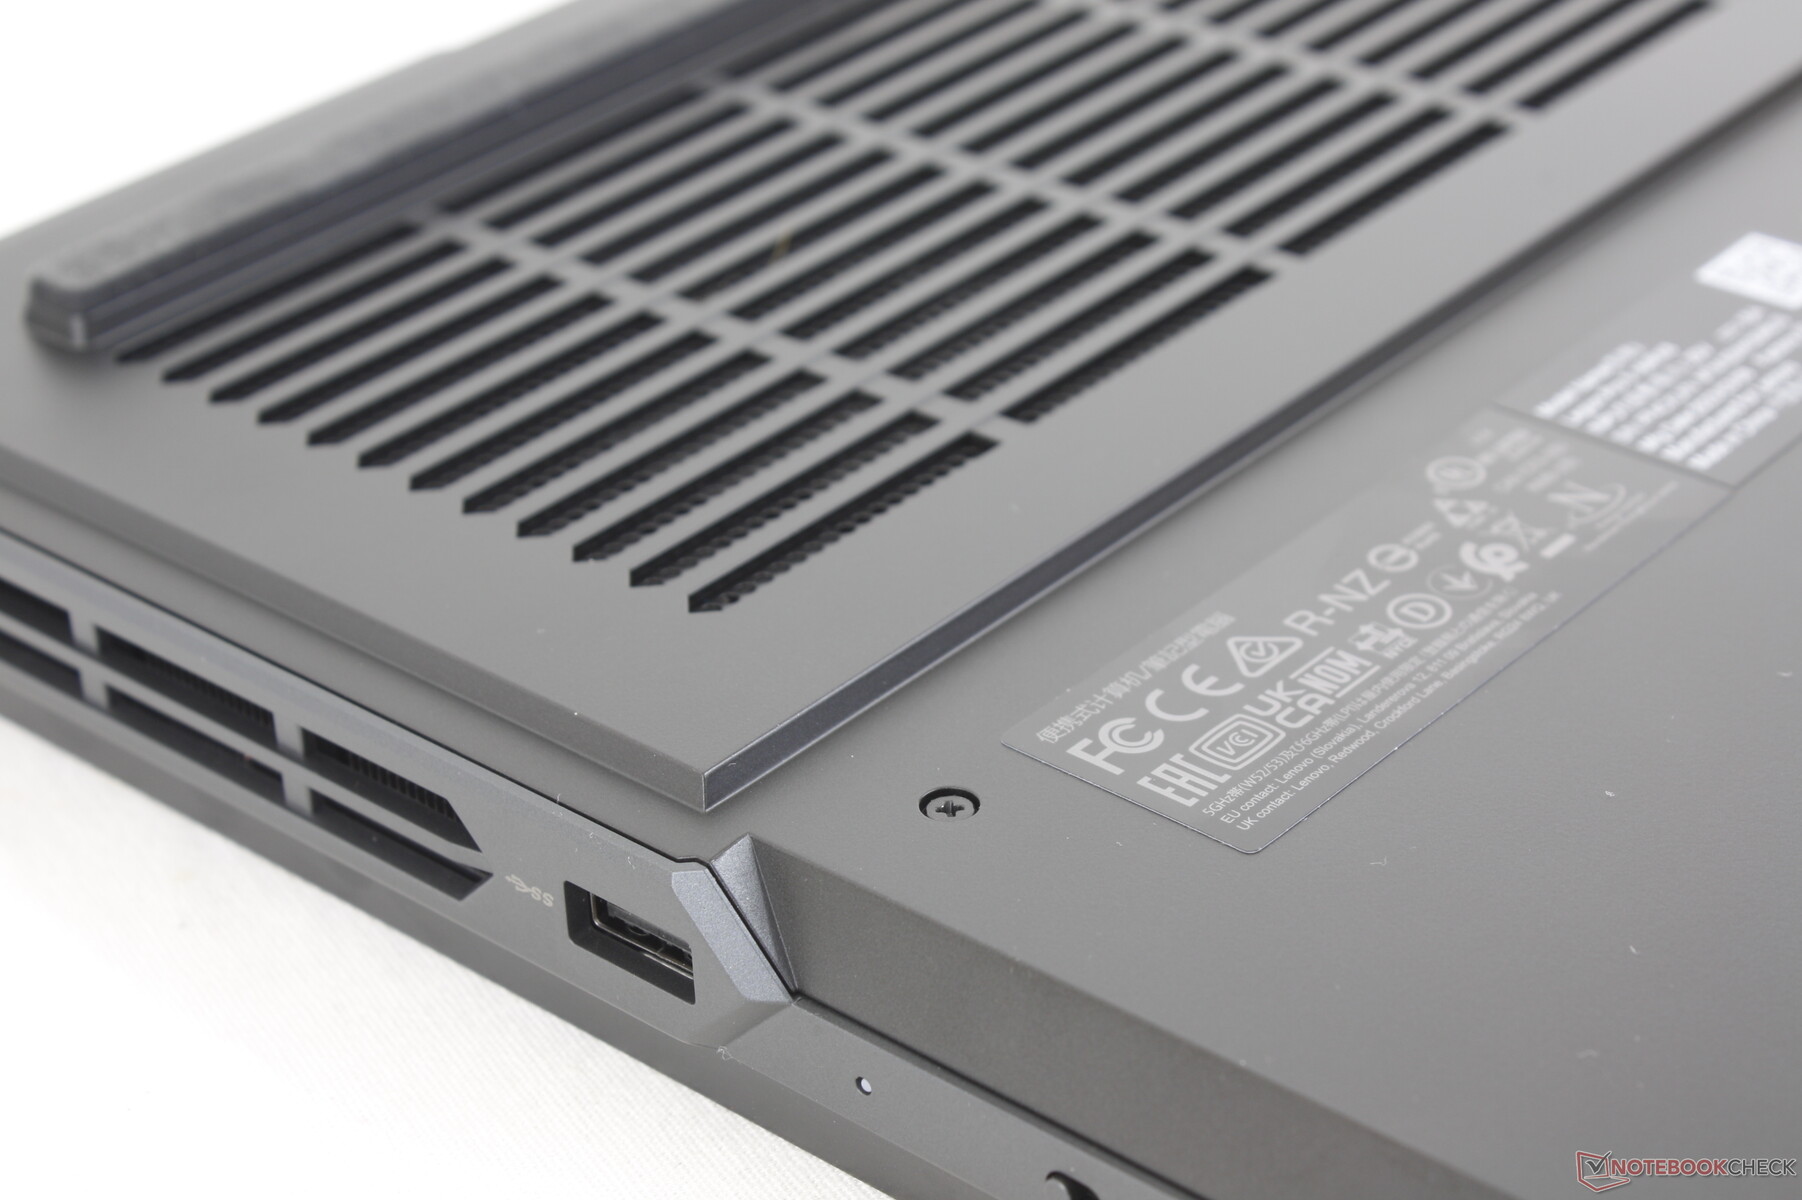
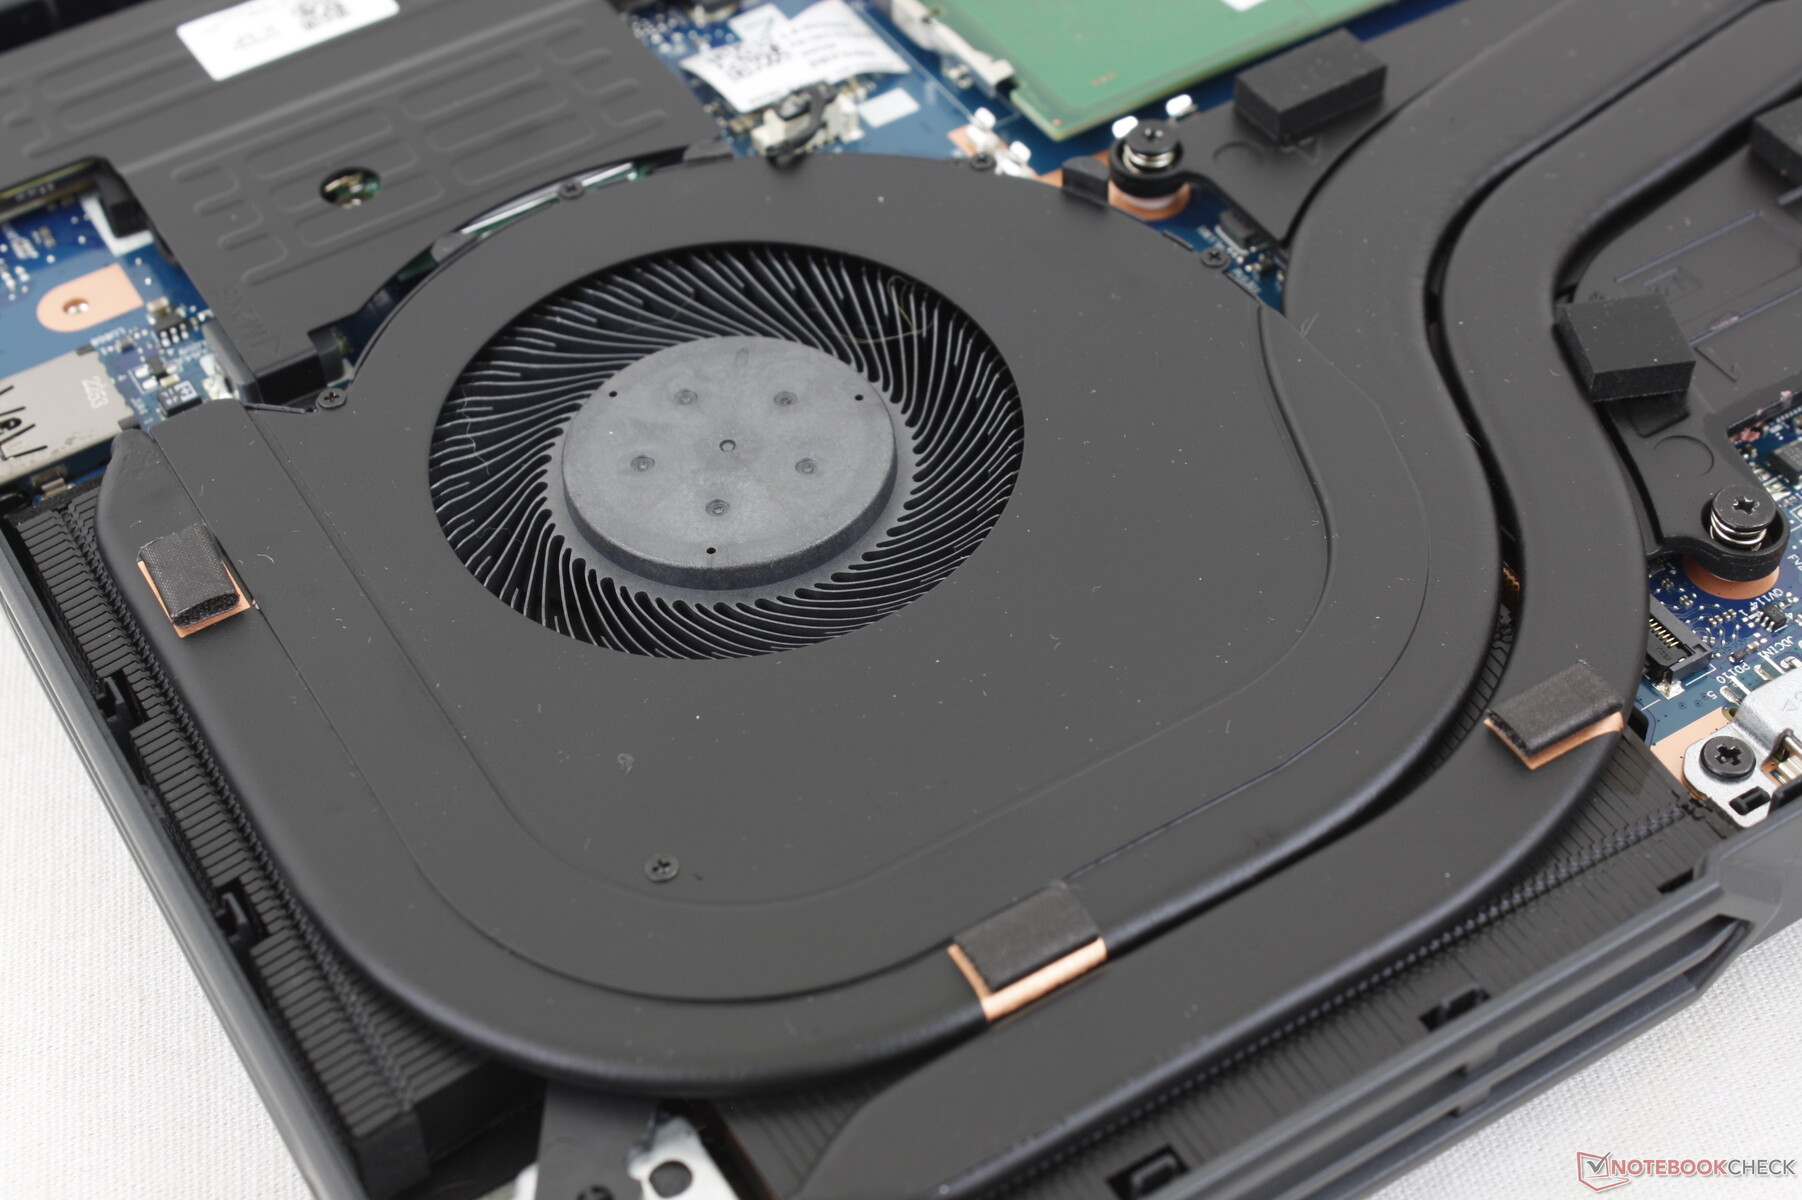
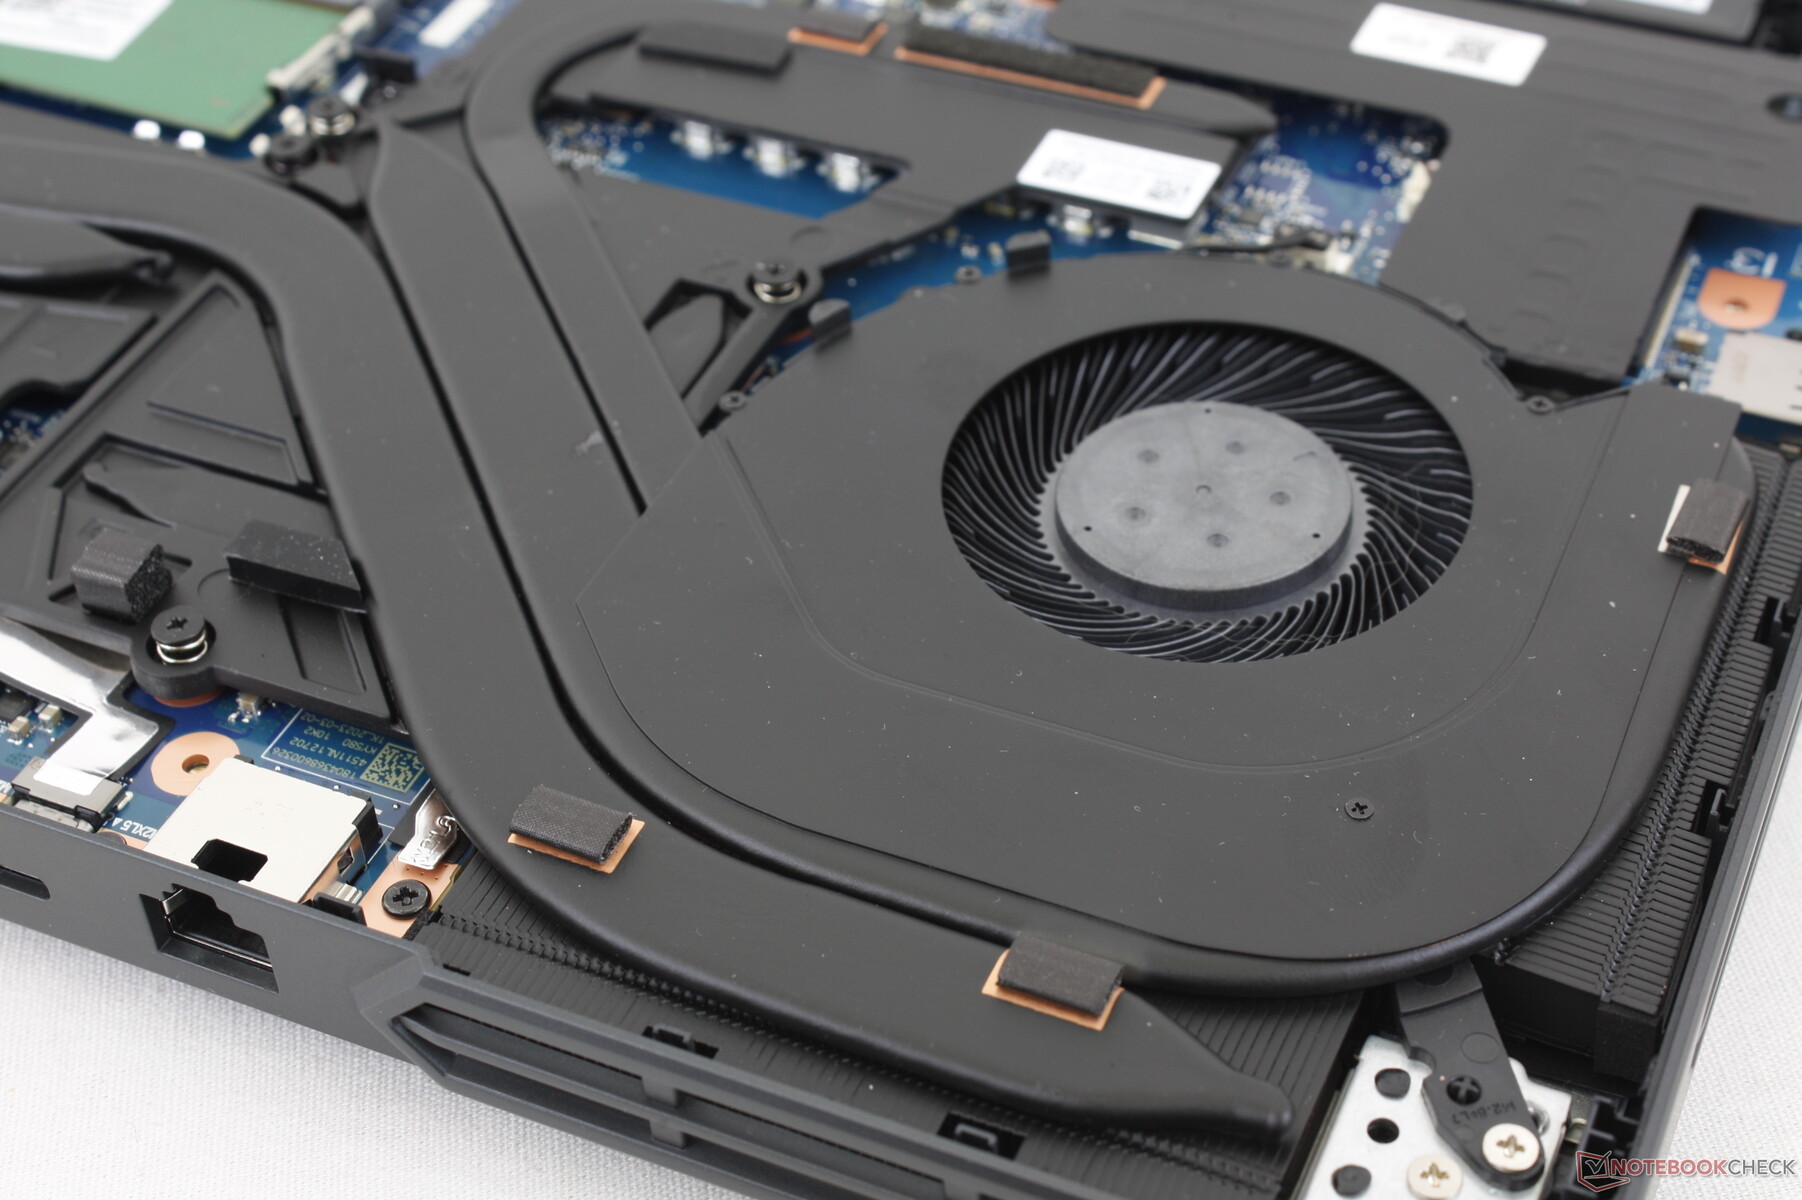
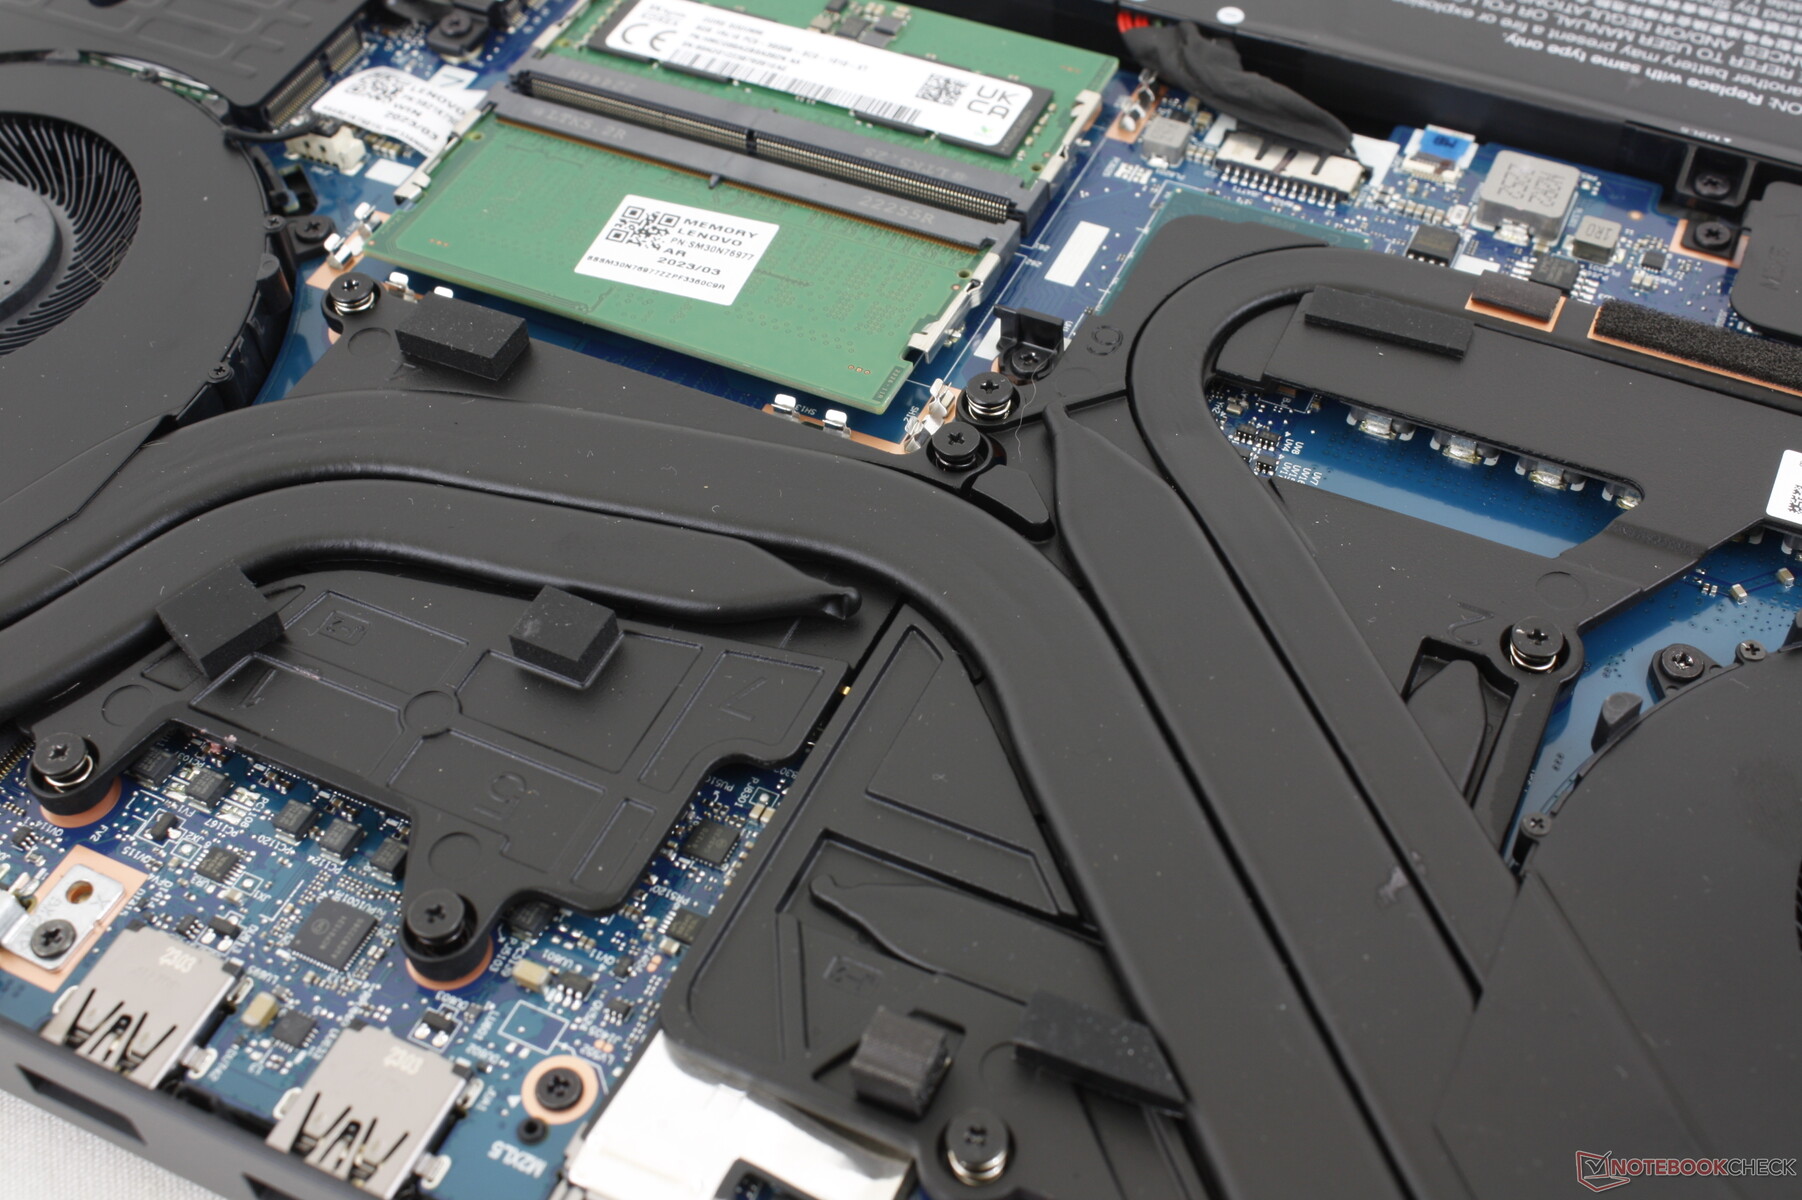
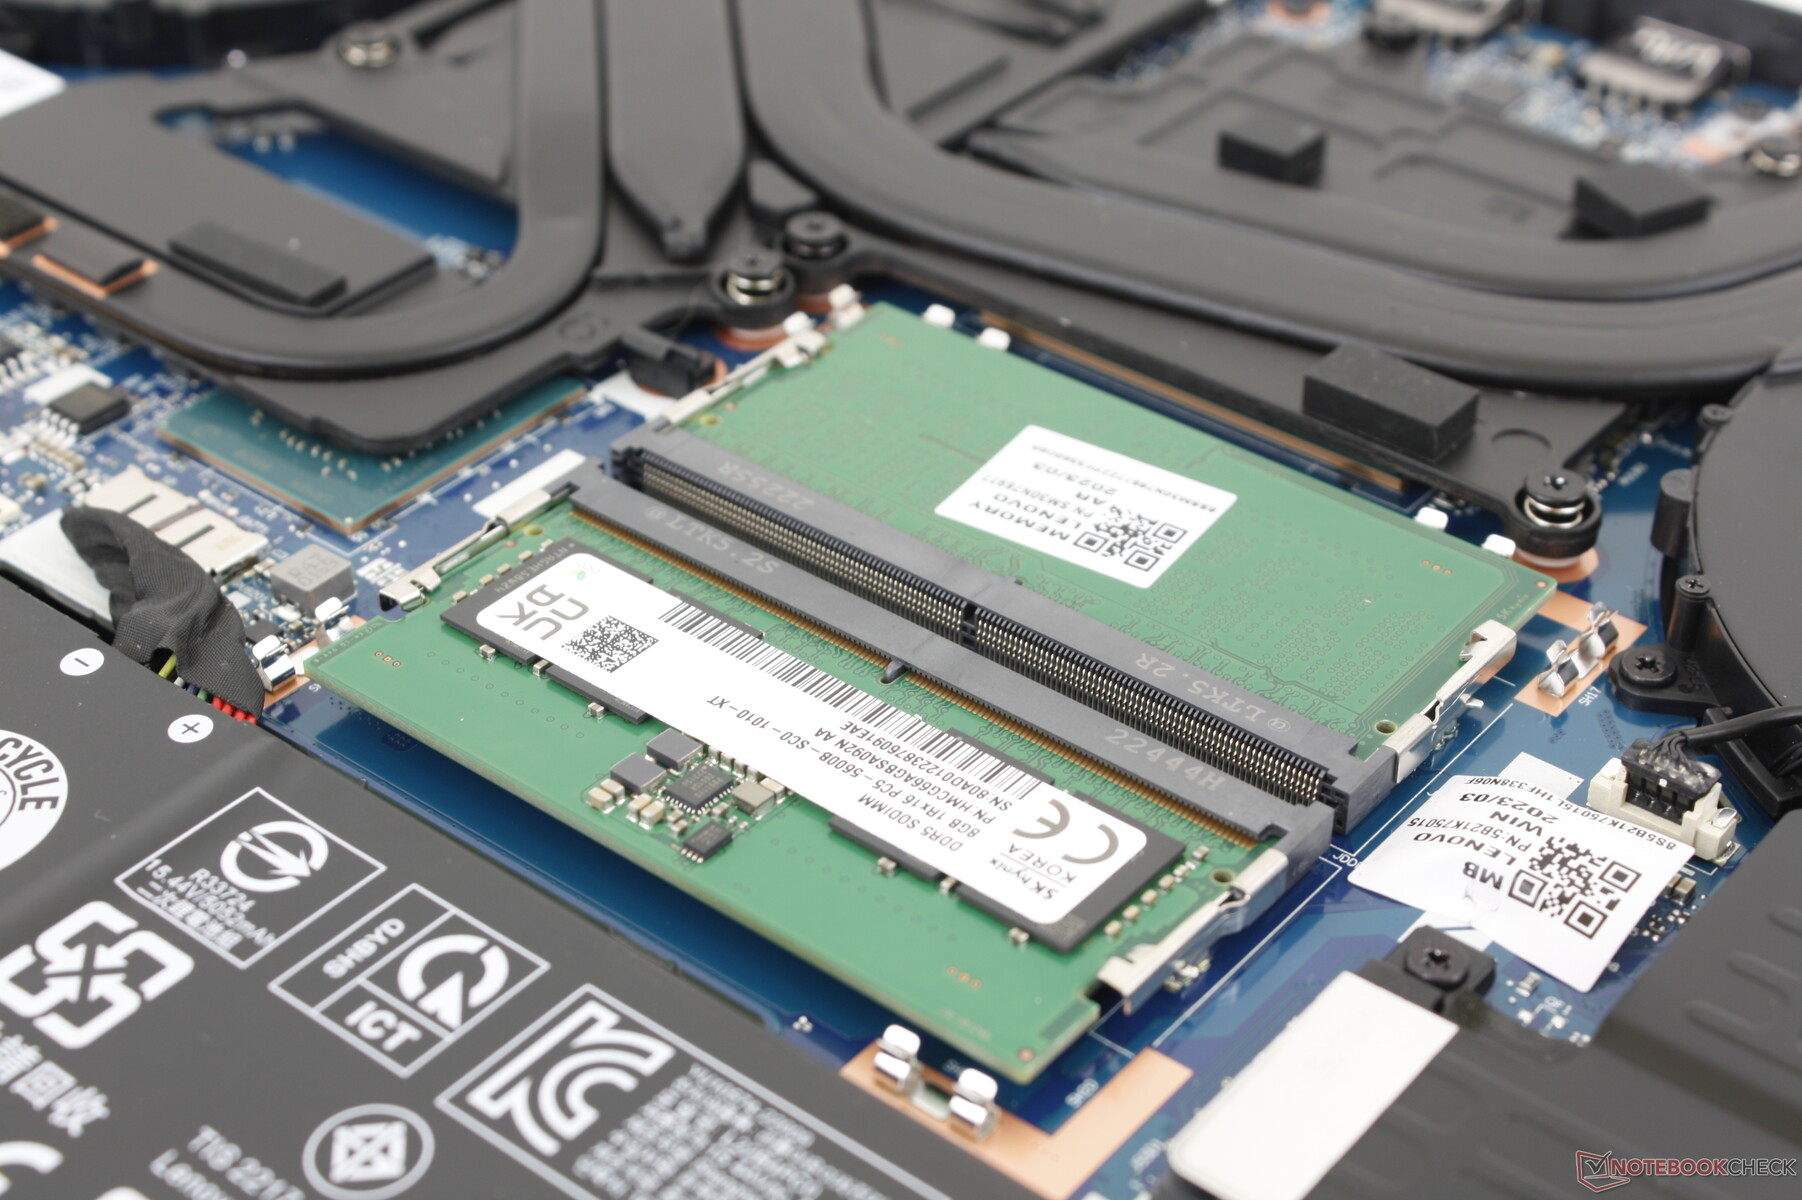
Underhåll
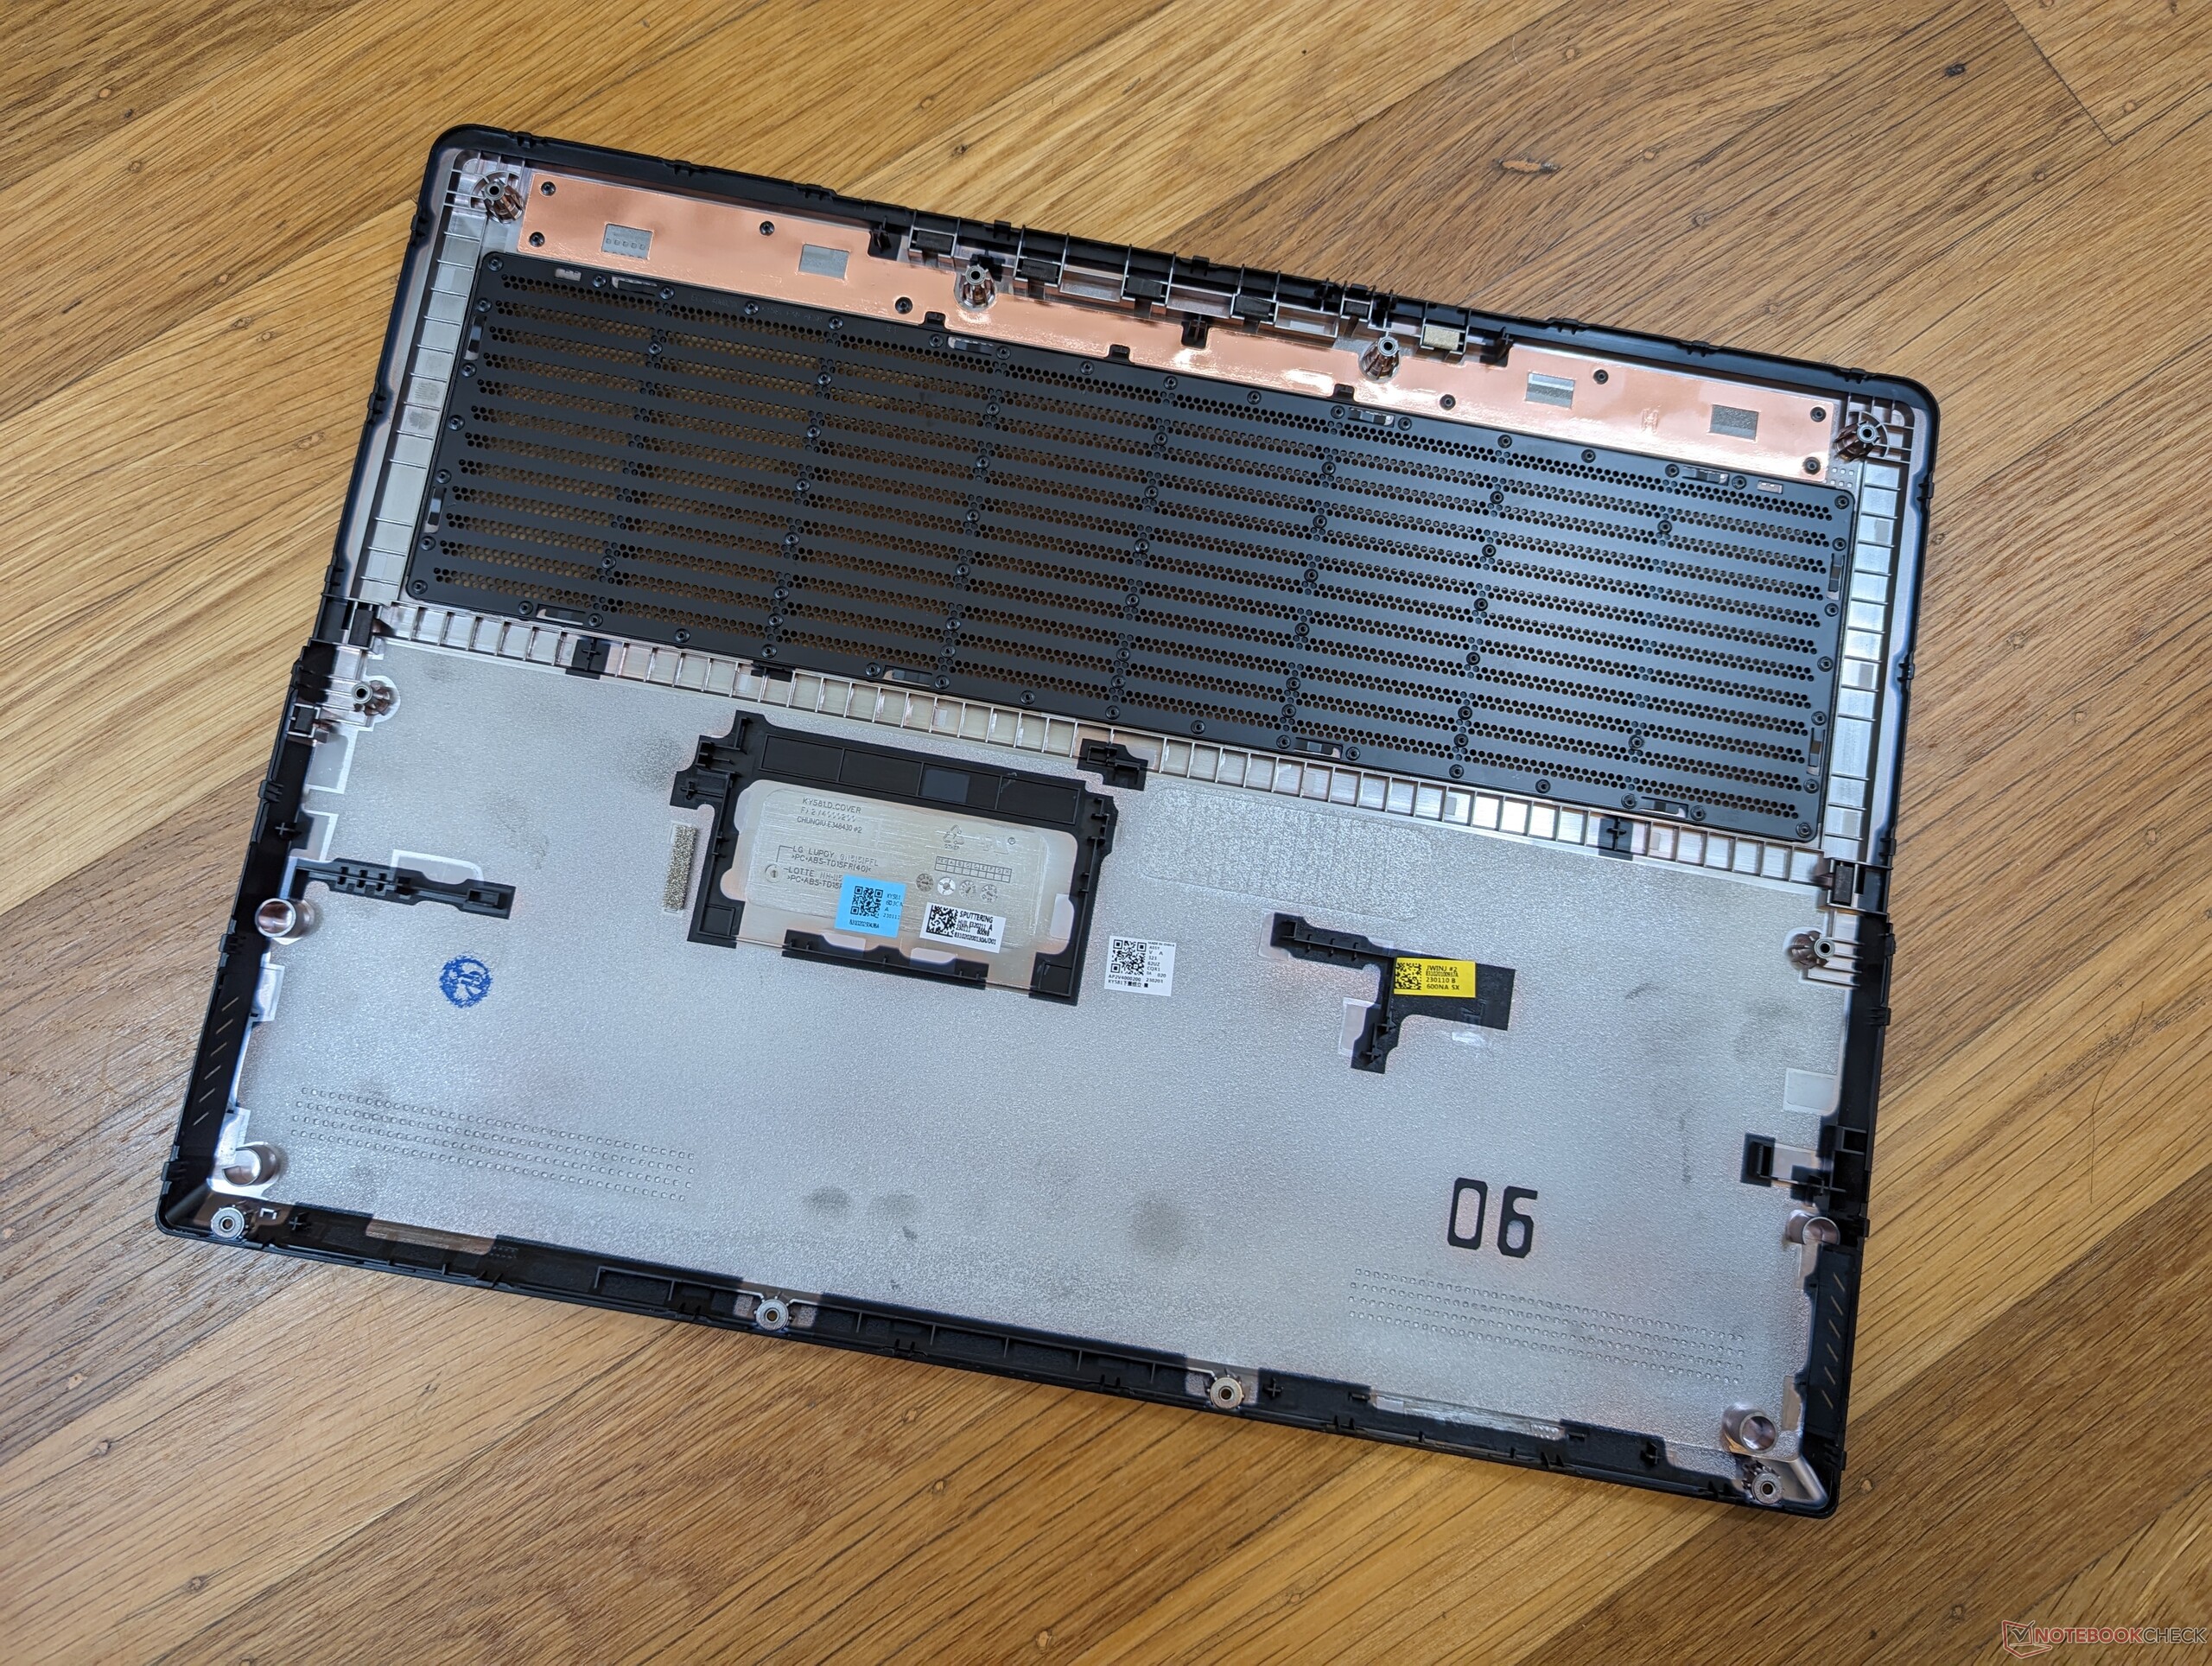
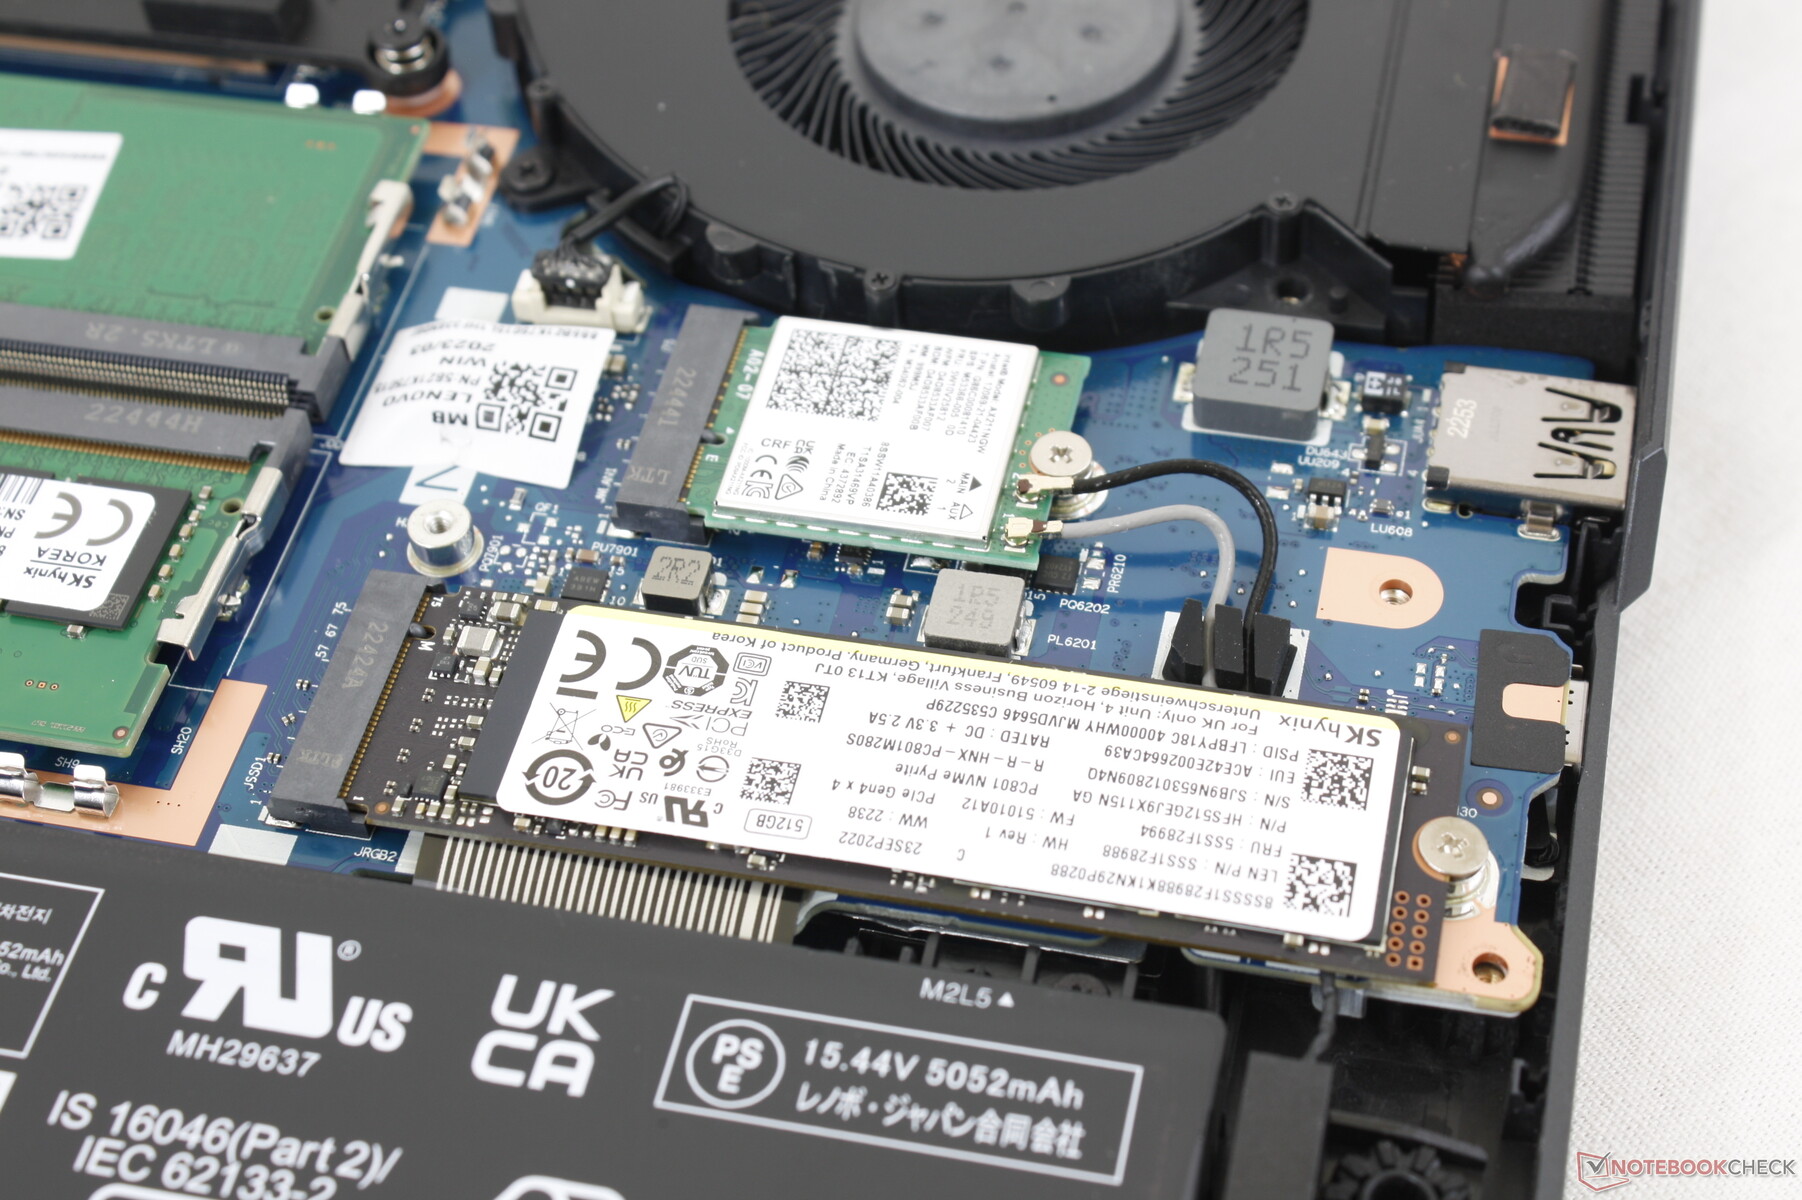
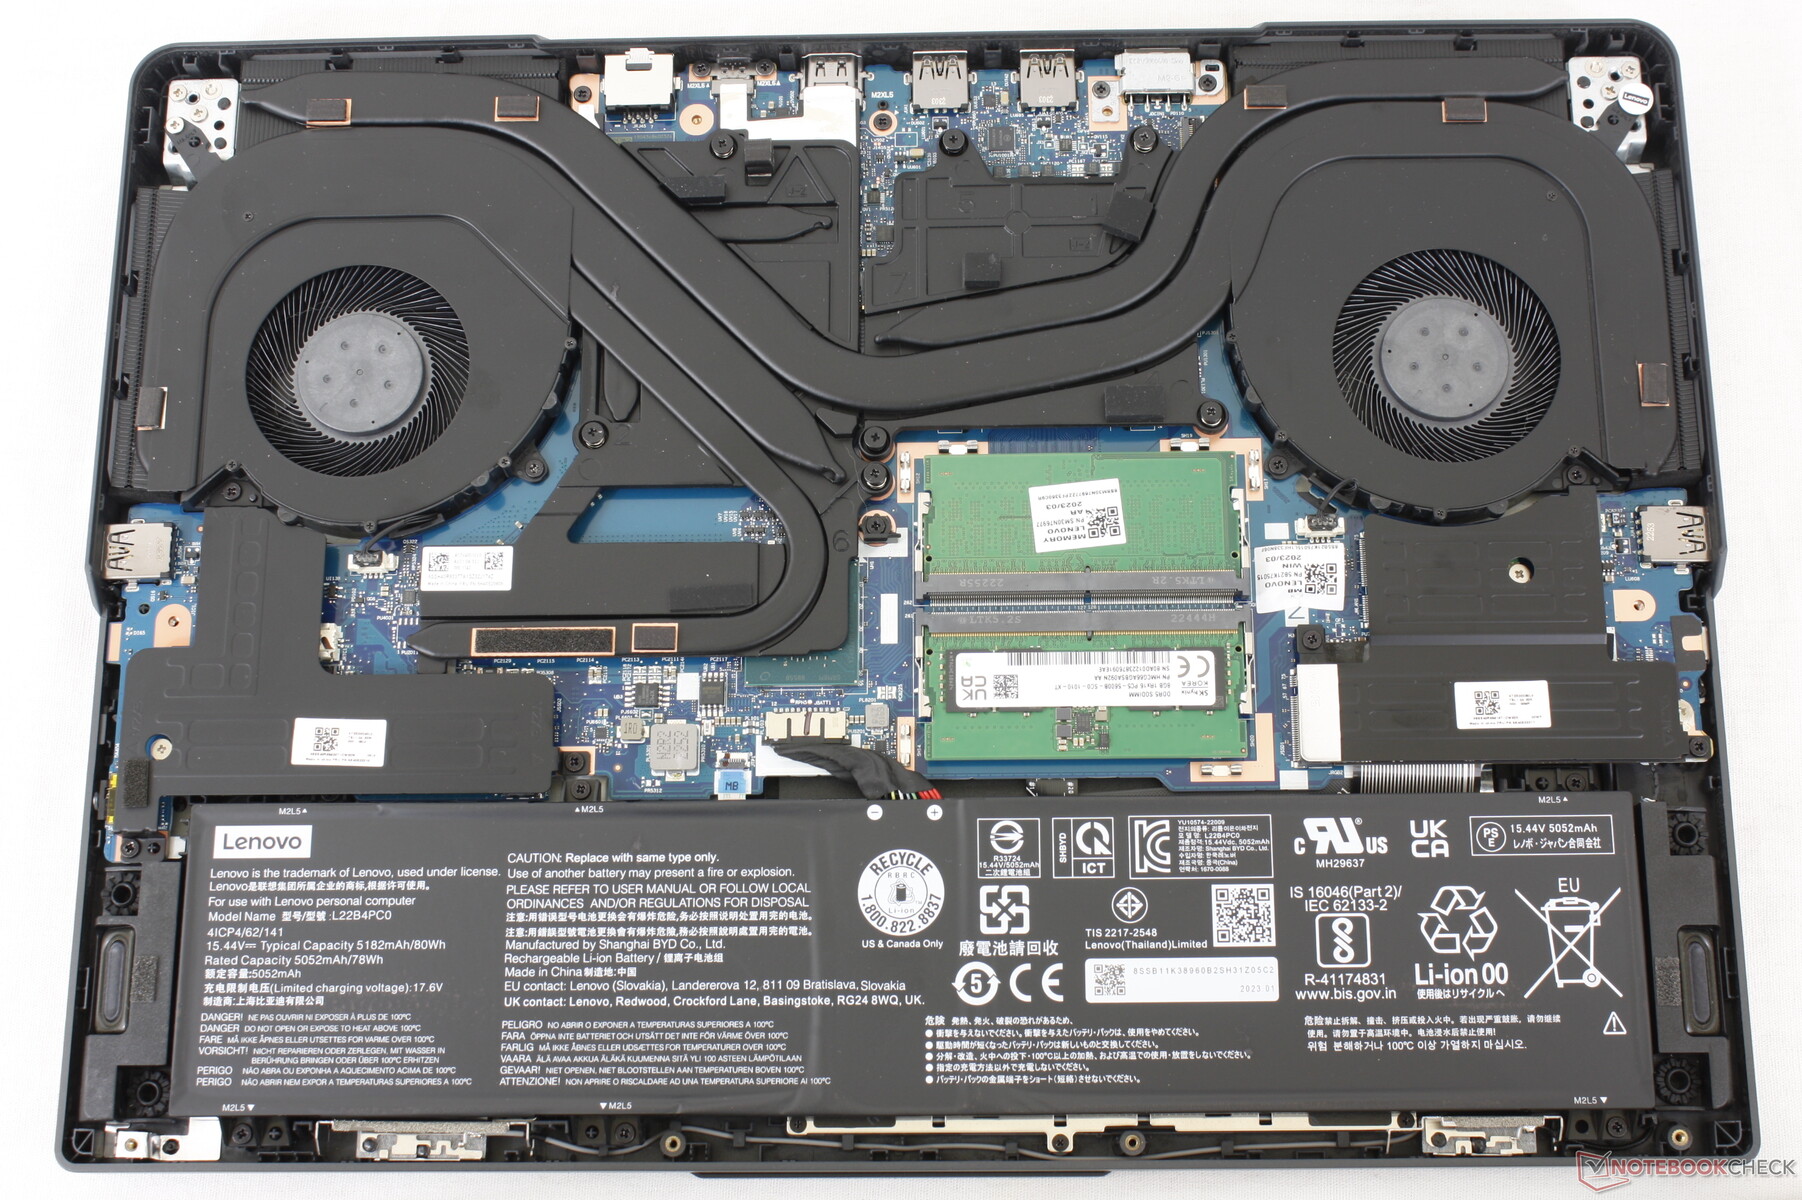
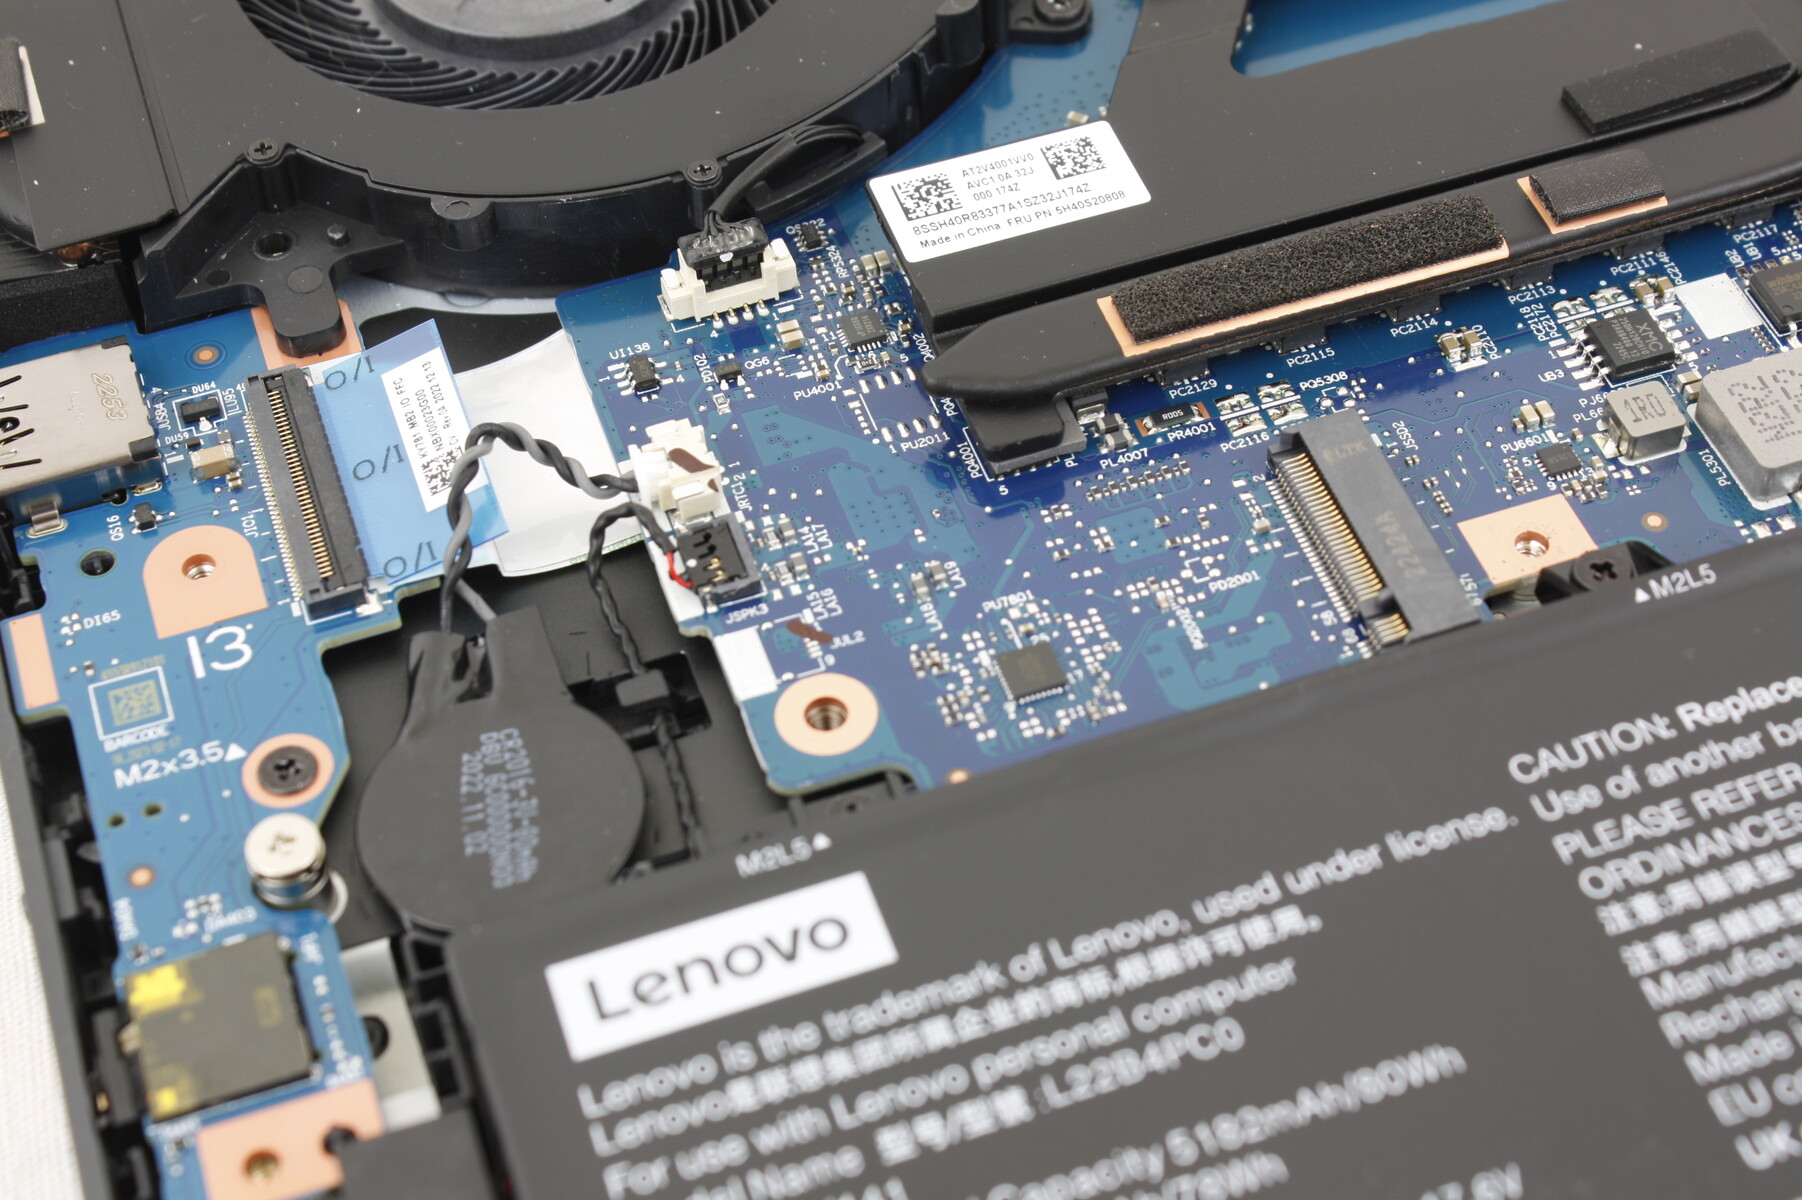
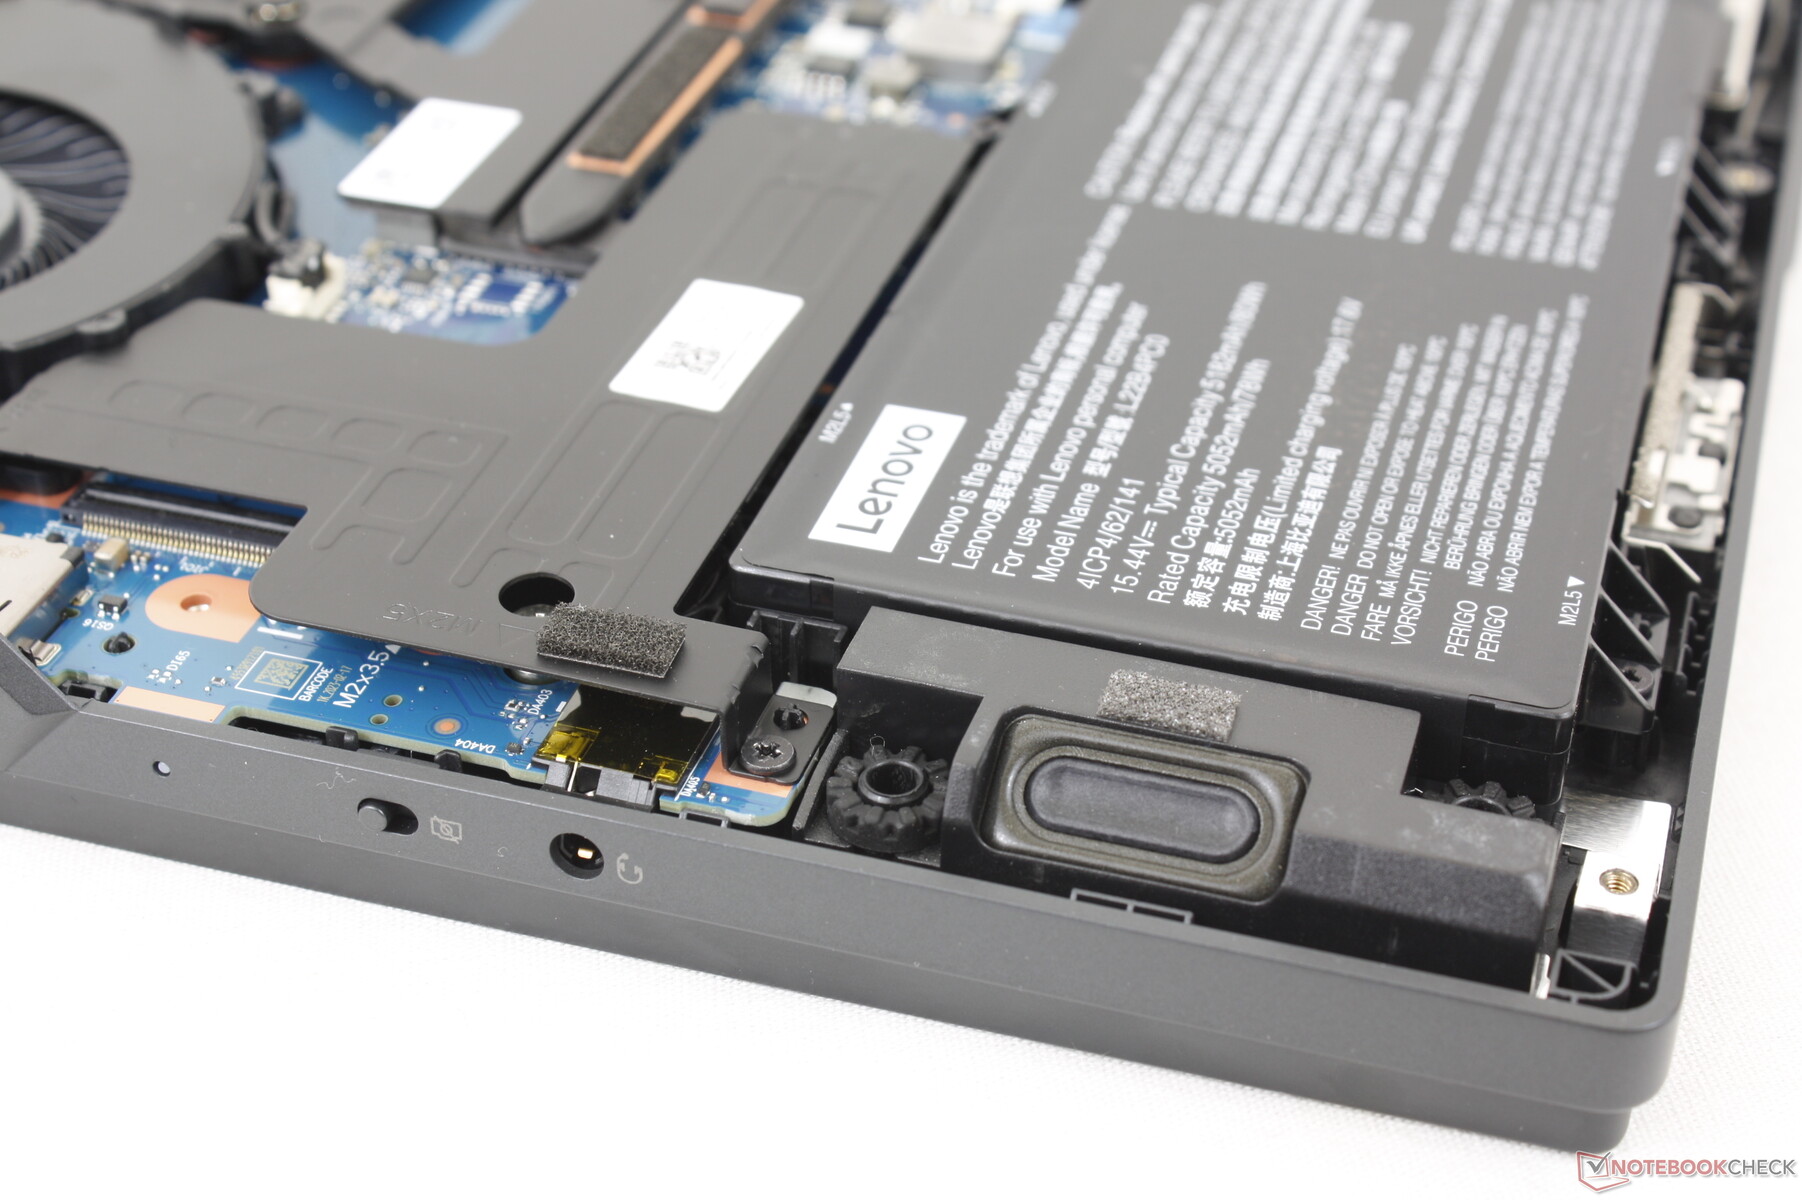
Den nedre panelen kan enkelt tas bort med en Philips-skruvmejsel för att avslöja 2x M.2 2280 PCIe4 x4-fack, 2x SODIMM-fack och den avtagbara WLAN-modulen. Observera att facken och WLAN-platsen är täckta av värmespridare i aluminium.
Tillbehör och garanti
Det finns inget extra i lådan förutom nätadapter och papper. Den vanliga ettåriga begränsningen från tillverkaren gäller om den köps i USA.
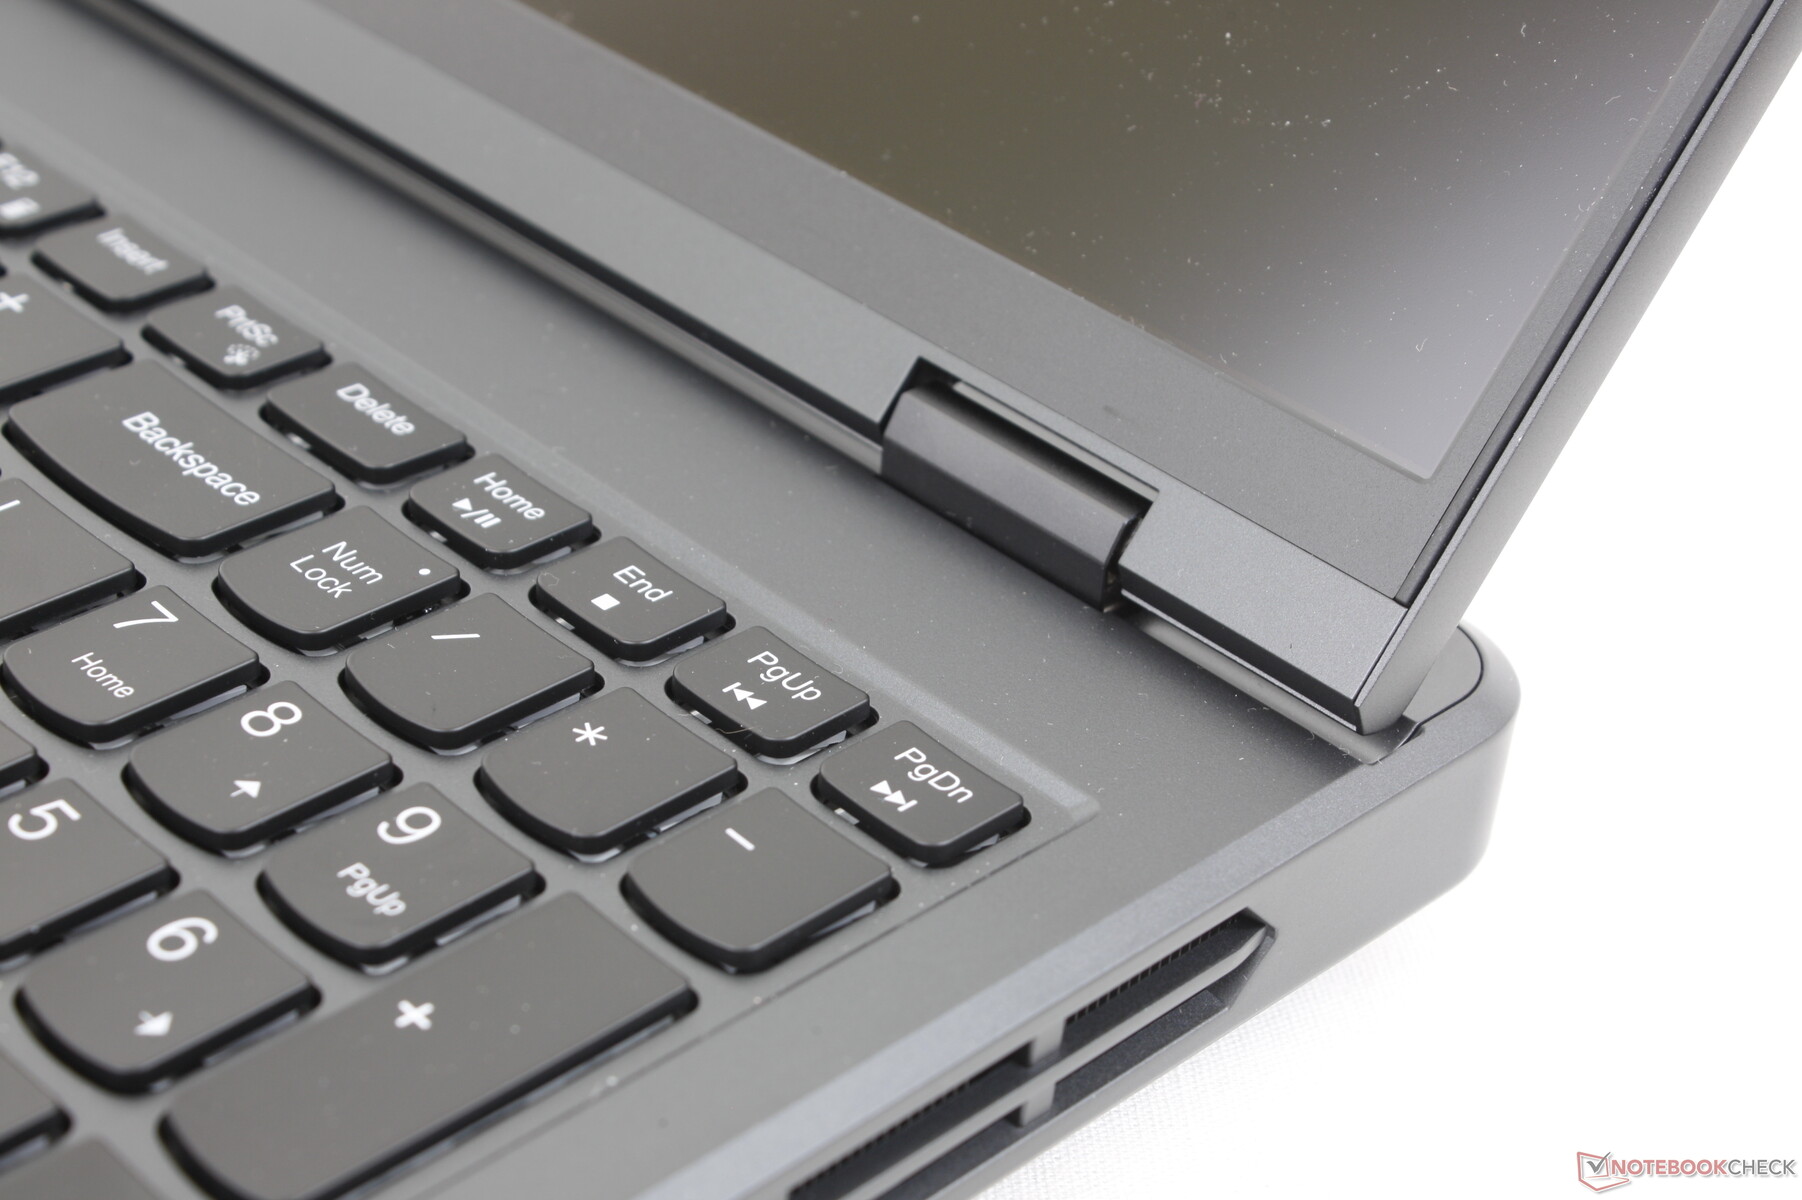
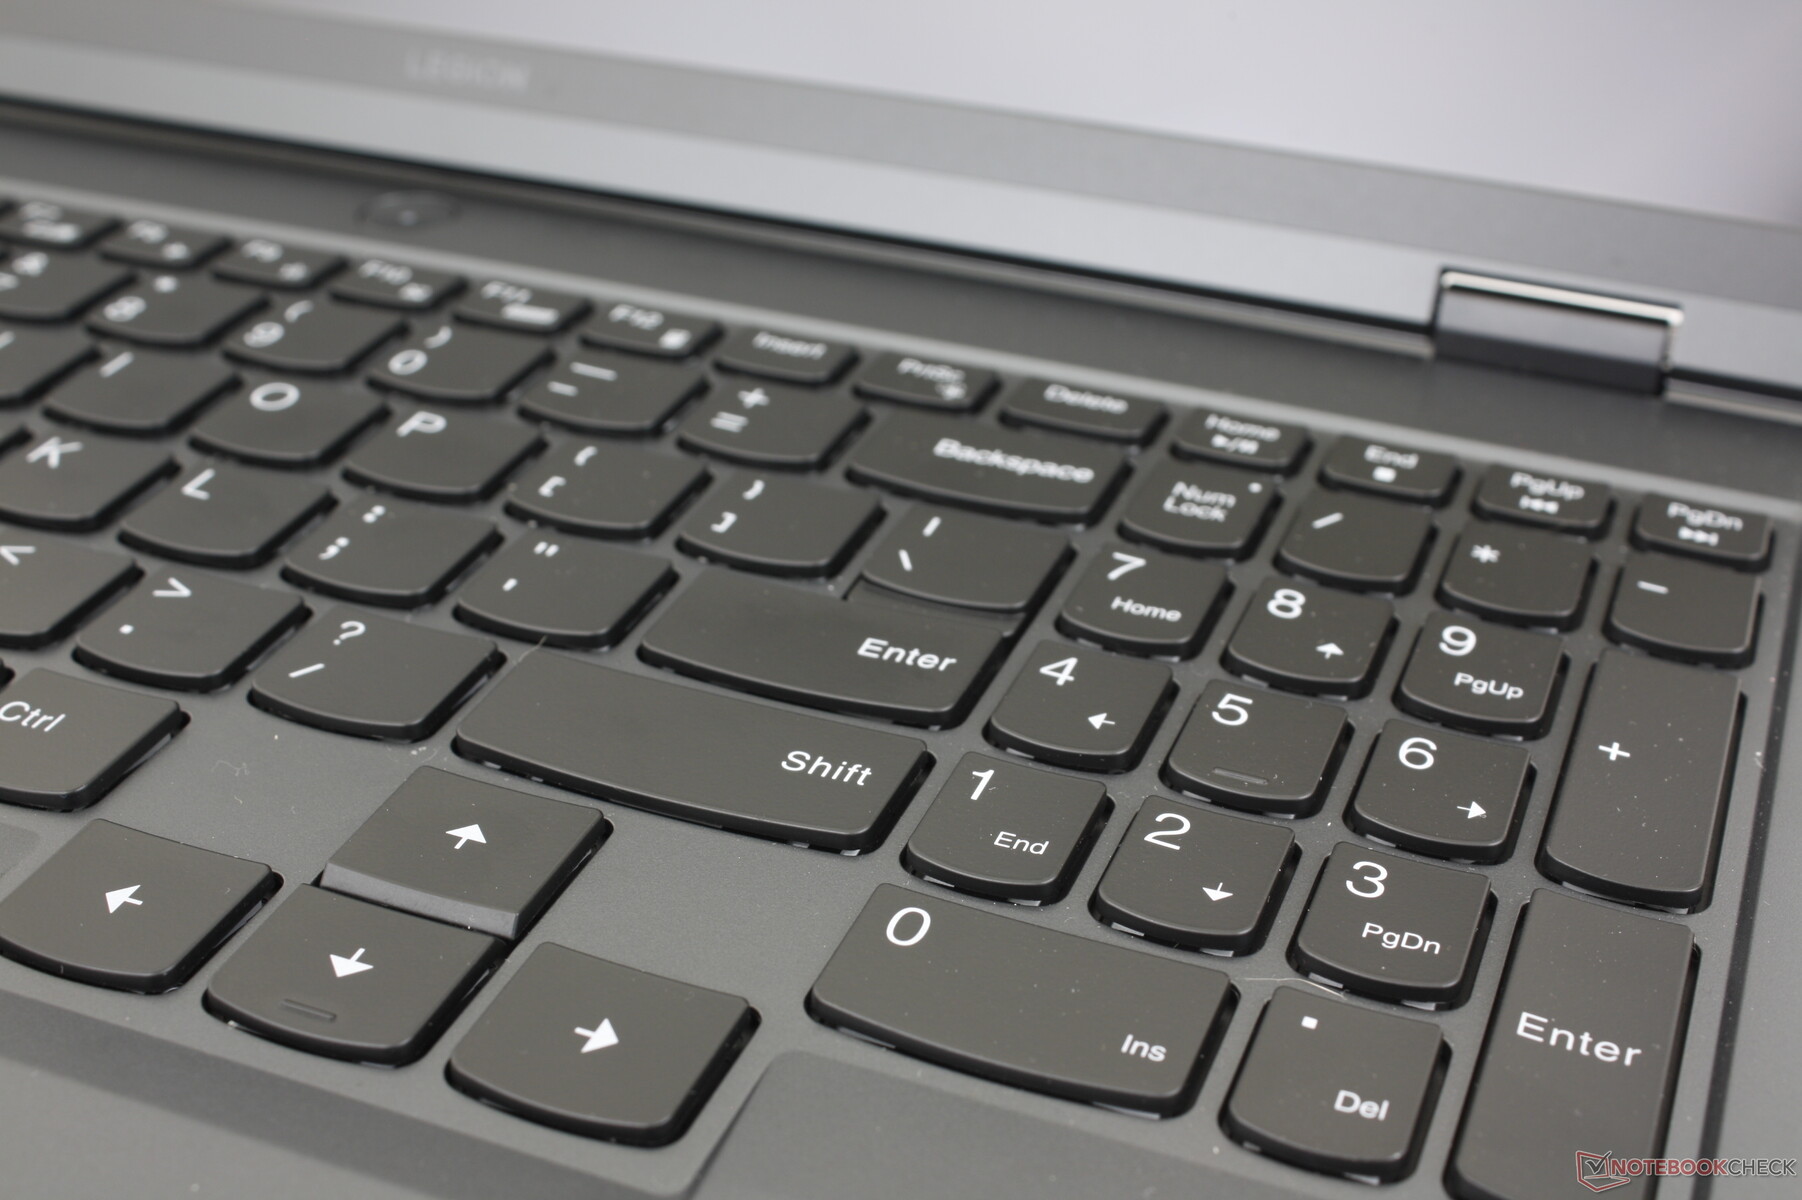
Inmatningsenheter - Bekvämt och rymligt tangentbord
Tangentbord
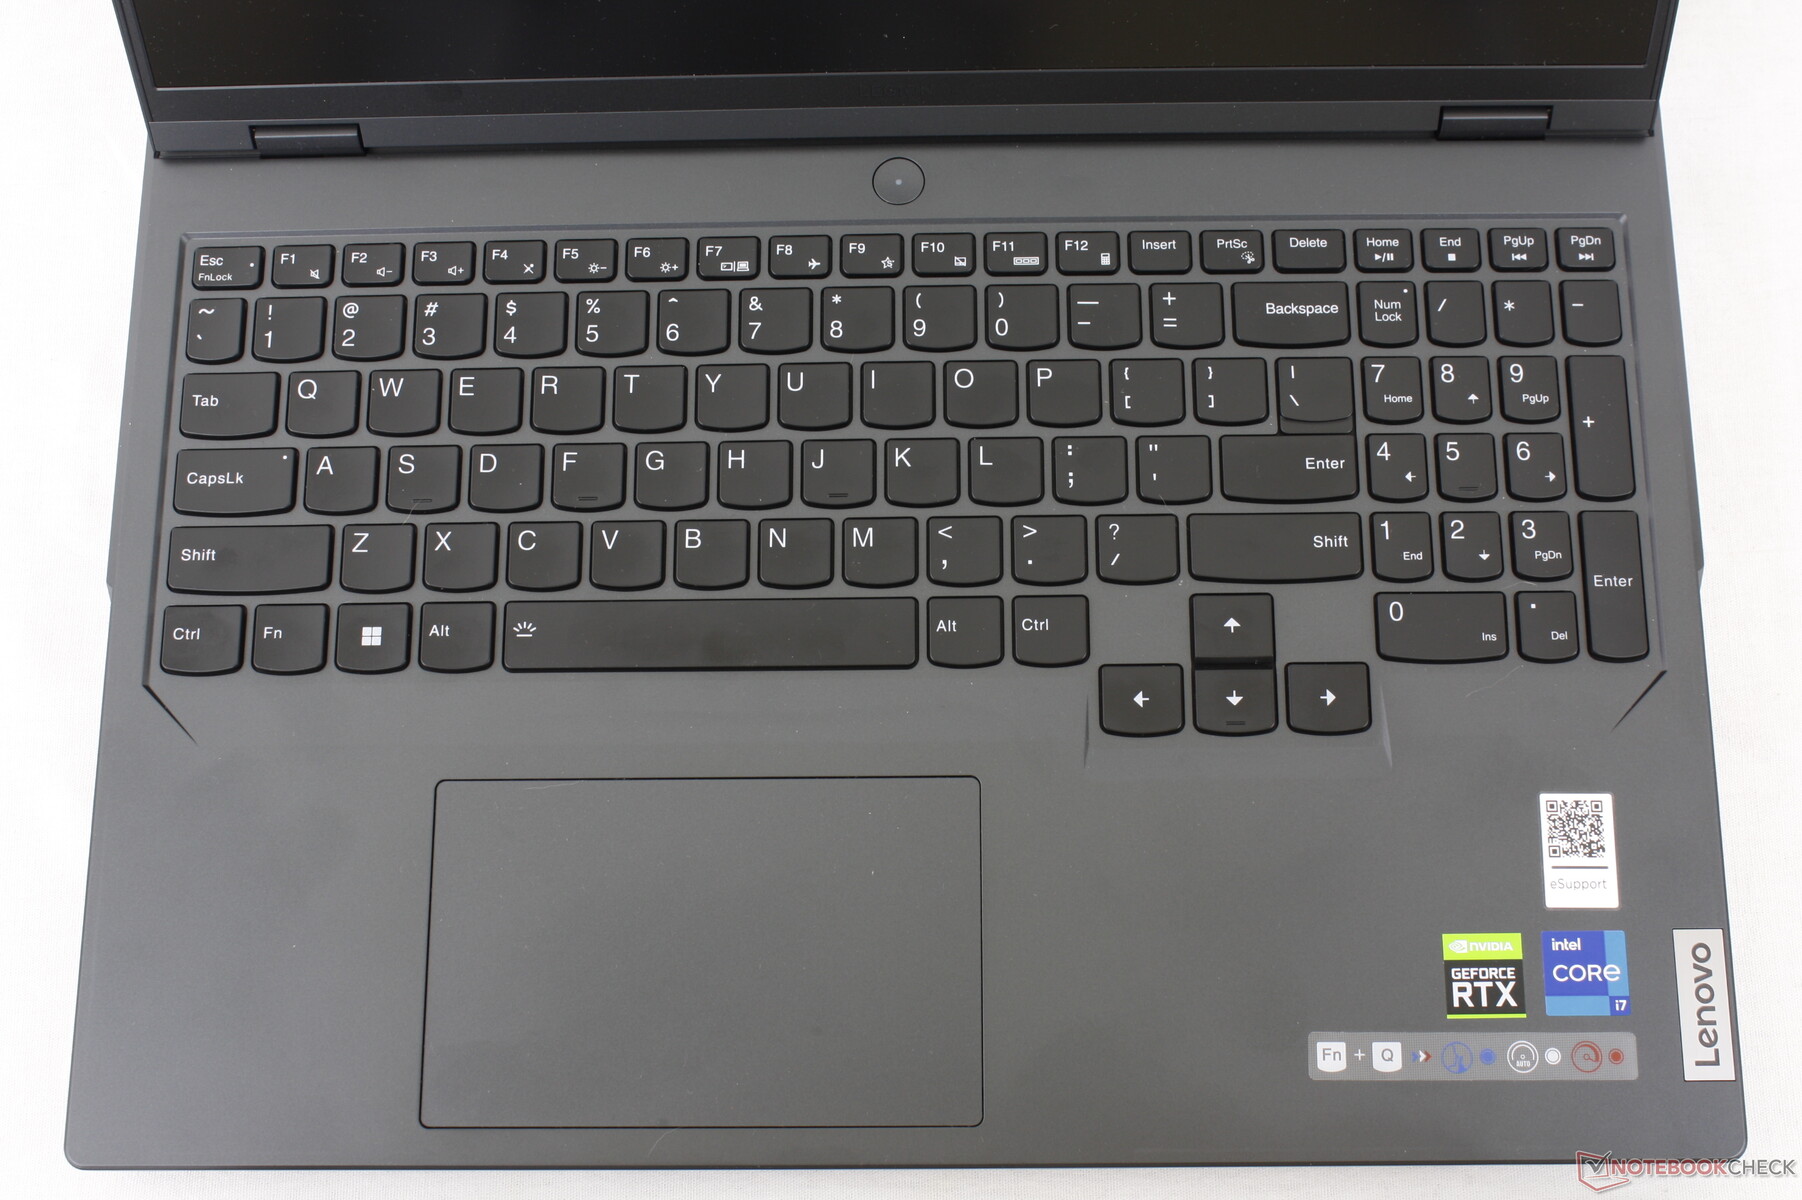
Tangentbordet har en rörlighet på 1,5 mm, en pitch på 0,2 mm och en 100-procentig anti-ghosting för speländamål. Redan nu är enbart resandet och återkopplingen djupare respektive starkare än tangentborden på Razer Blade 16 eller Asus Zephyrus M16 för en mer tillfredsställande skrivupplevelse än någon av konkurrenterna.
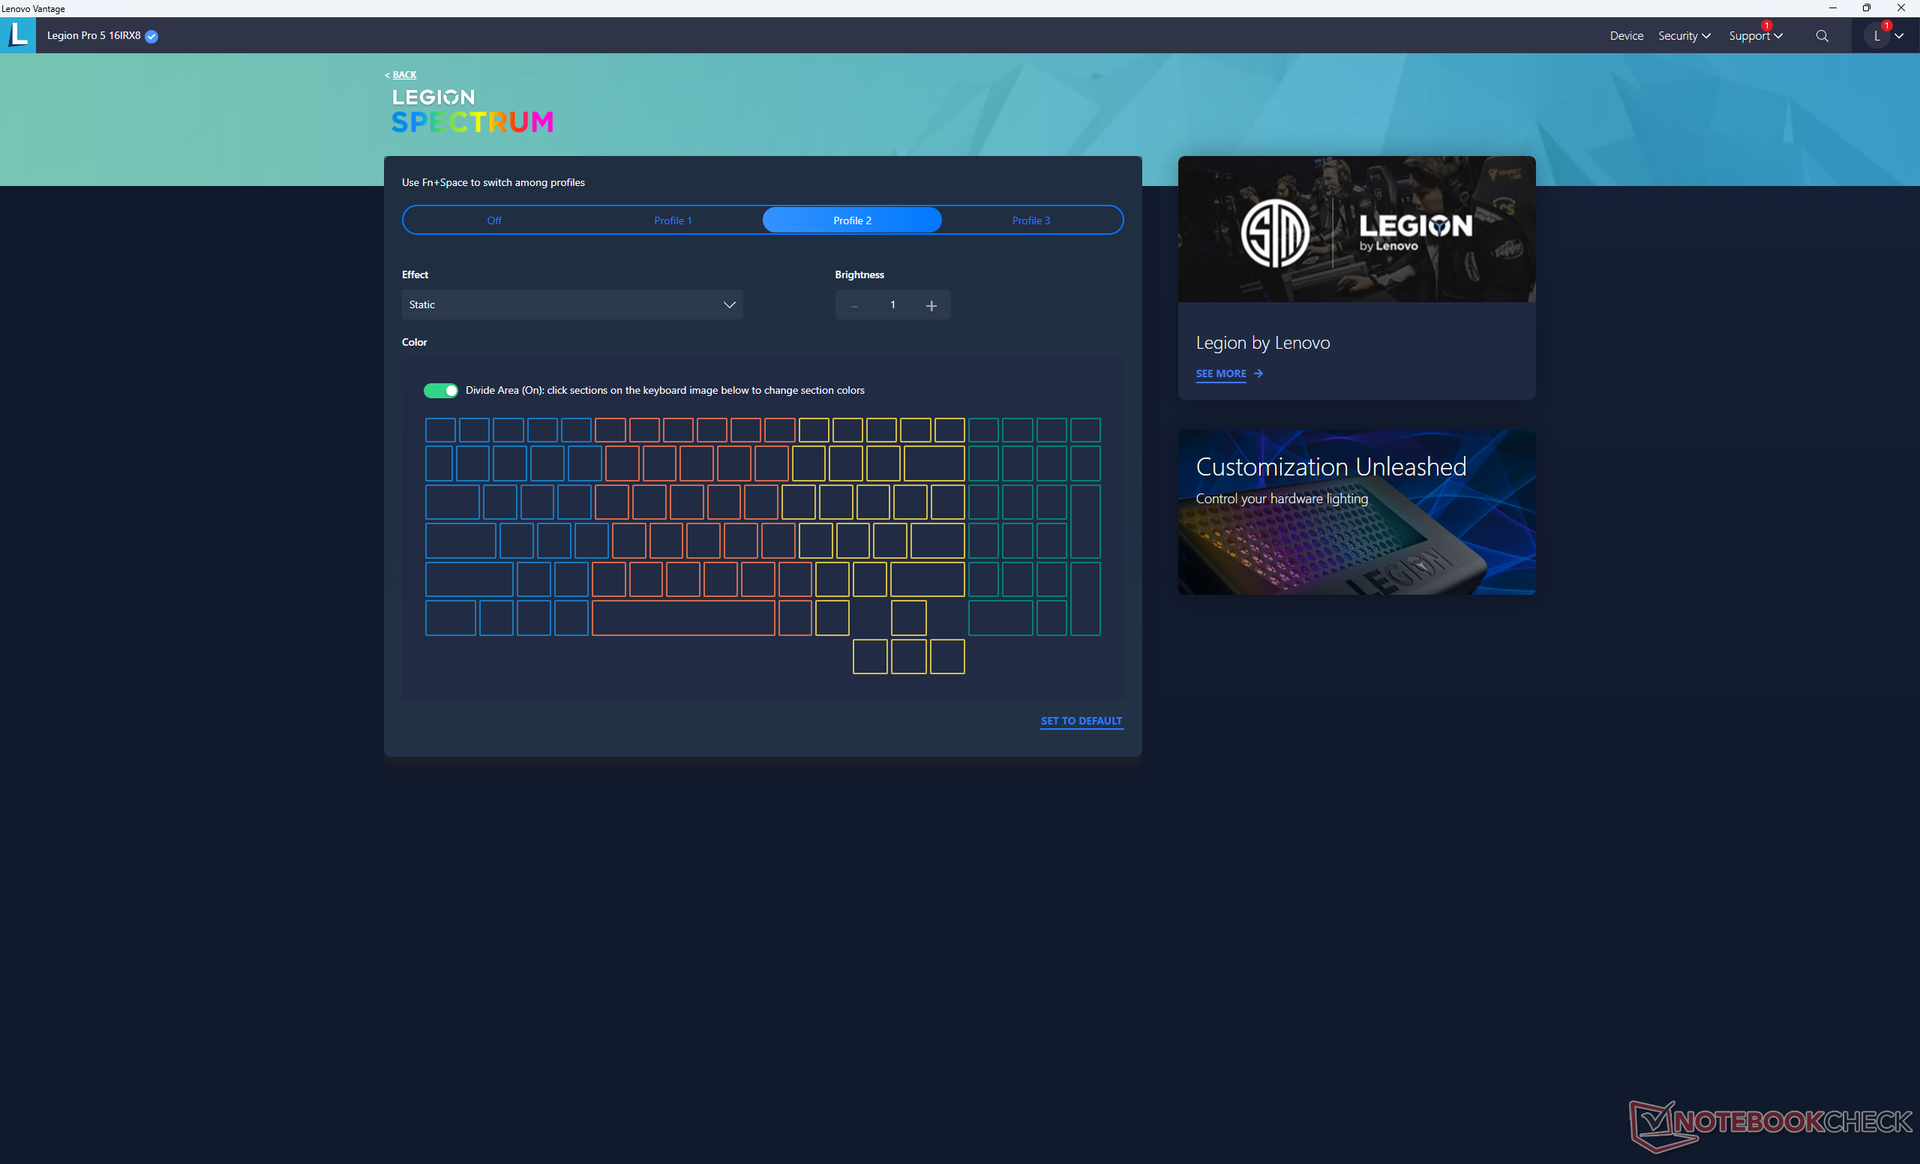
Vissa funktioner förblir exklusiva för den högre serien Legion 7 Pro, till exempel det mekaniska tangentbordet och RGB-belysning per tangent. Det förstnämnda är förståeligt, men vi tycker att det är löjligt att Lenovo inte erbjuder det sistnämnda för vår konfiguration på över 1 500 dollar. Ägarna får nöja sig med RGB-belysning med fyra zoner i stället.
Pekplatta
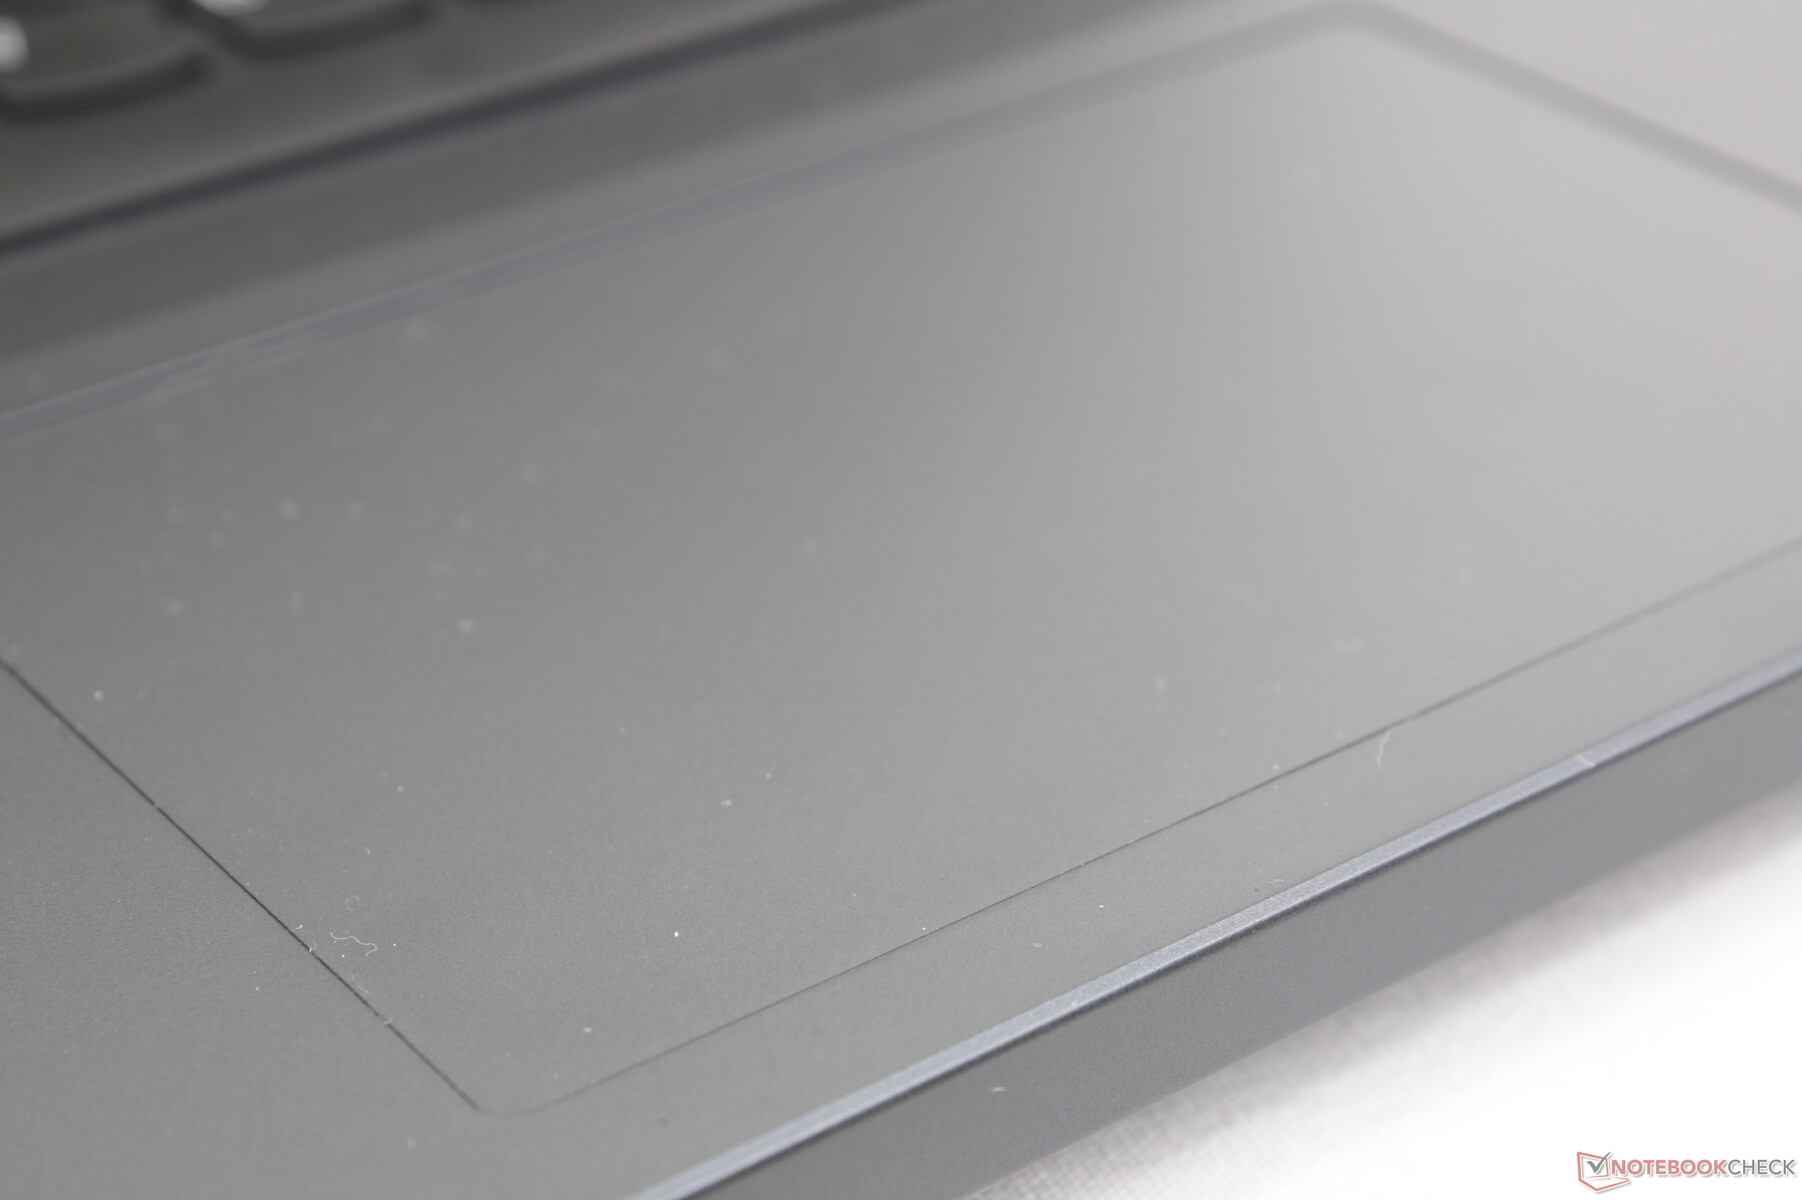
Klickplattan (12 x 7,5 cm) är ungefär lika stor som den som finns påInspiron 16 Plus 7620 (11,5 x 8 cm). Glidningen är smidig och responsiv med bara lite kladd vid lägre hastigheter för mer exakta klick. Rörelsen är dock mycket ytlig när man klickar och återkopplingen är inte särskilt stark. Icke desto mindre fungerar klickplattan tillräckligt tillförlitligt för enkla uppgifter när en mus inte är tillgänglig.

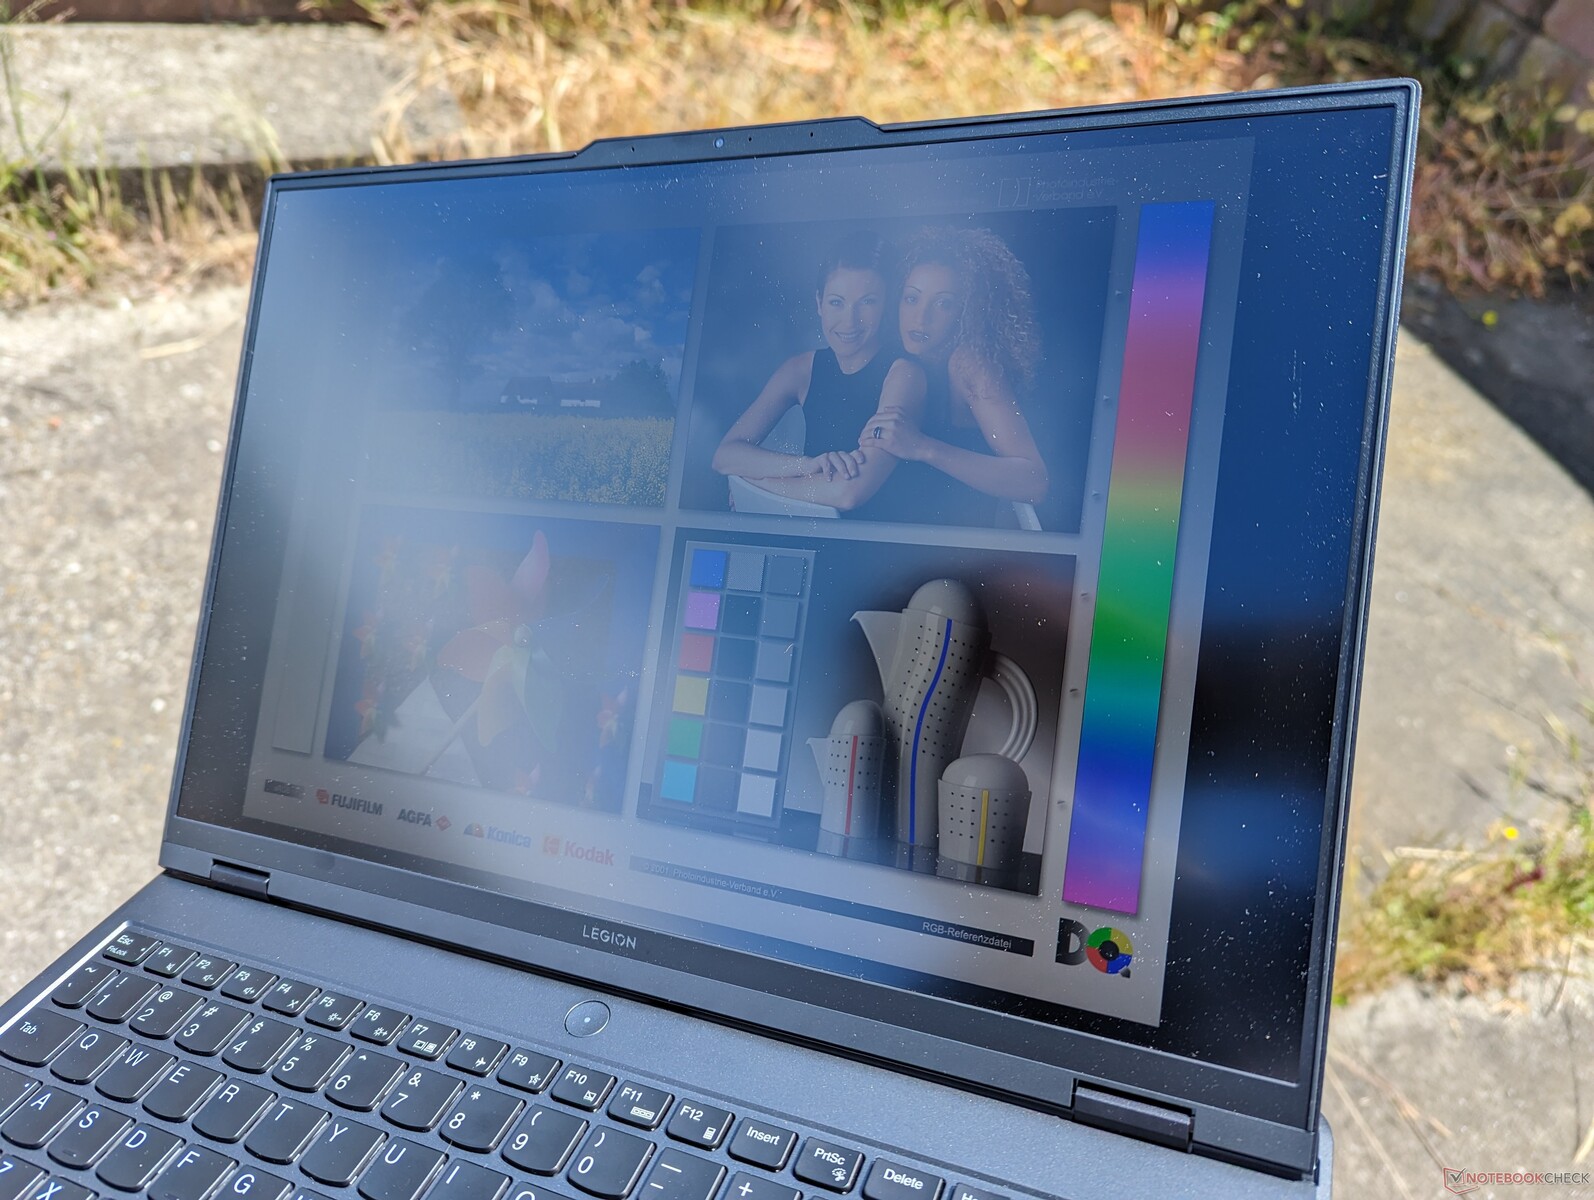
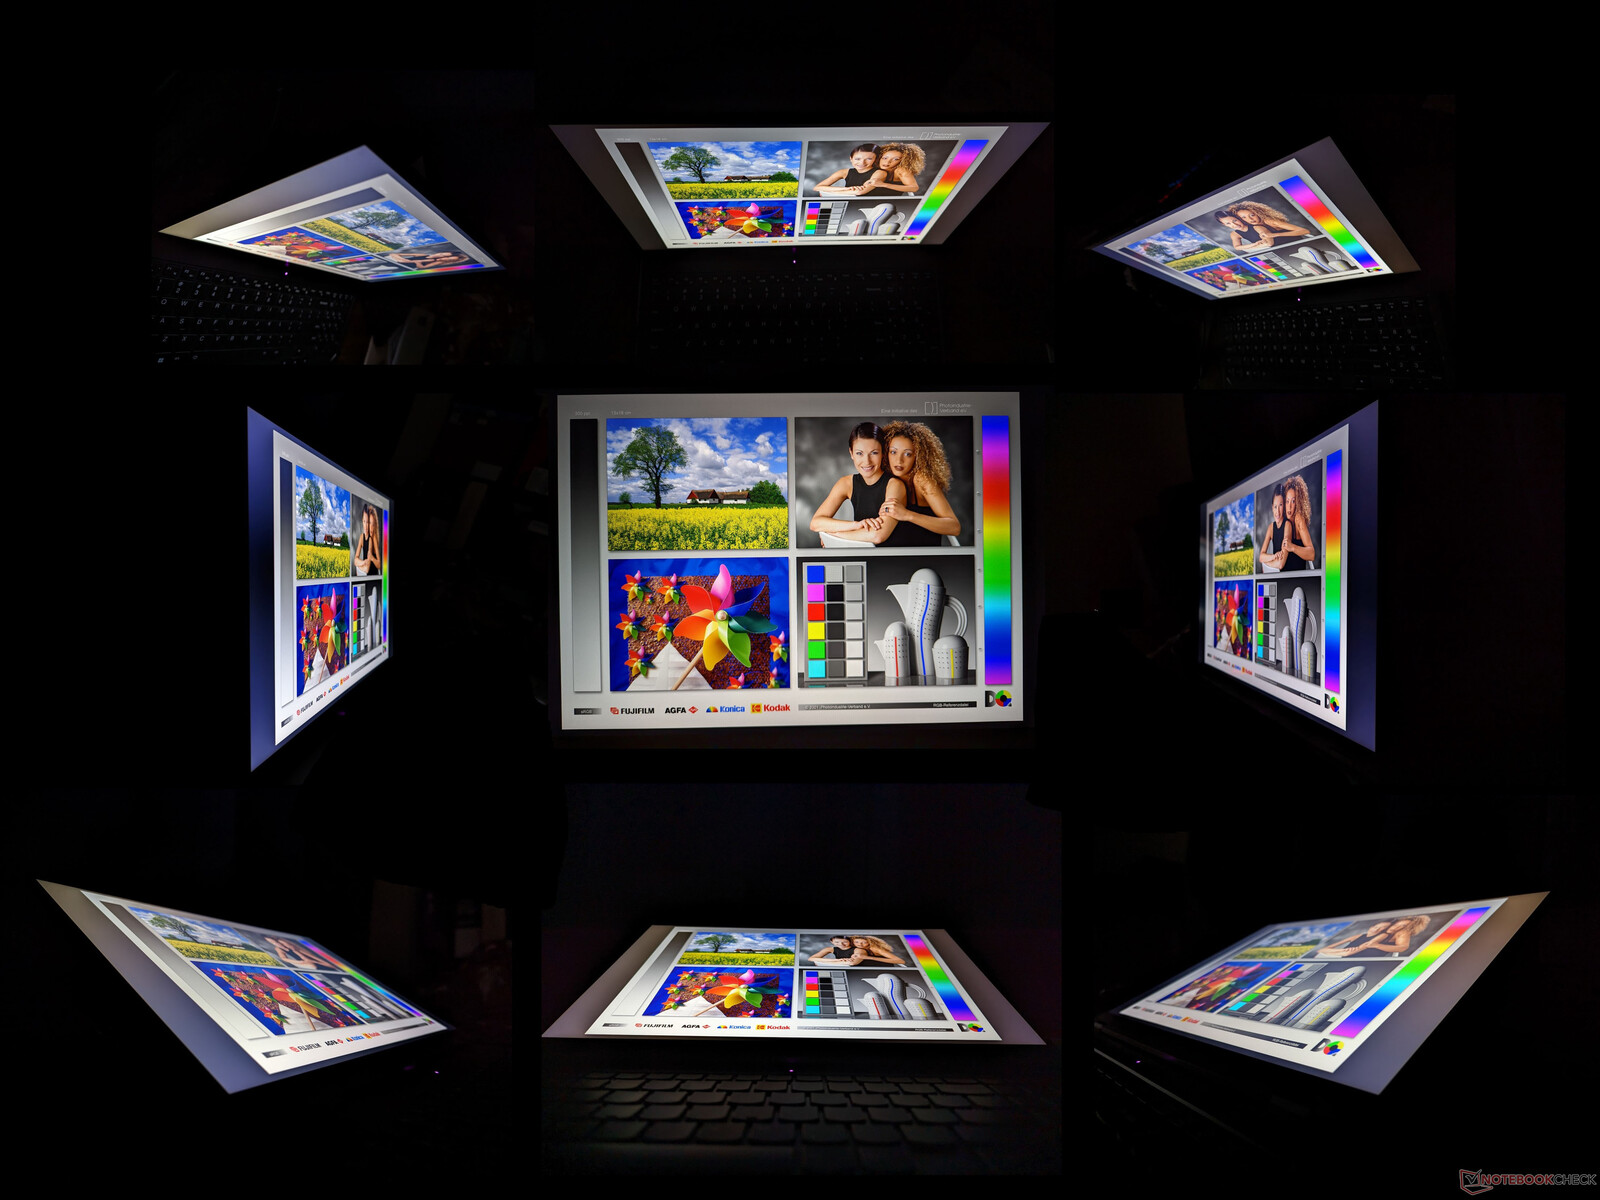
Display - minst 165 Hz
Det finns två bildskärmsalternativ för 2023 Legion Pro 5 16: 165 Hz och 240 Hz. Båda har stöd för G-Sync, 2560 x 1600 nativ upplösning och full sRGB-täckning medan endast 240 Hz-panelen har stöd för HDR400. Basalternativet 165 Hz bör vara mer än tillräckligt för målgruppen av spelare i mellanklassen. Bildkvaliteten är utmärkt med förvånansvärt liten kornighet för en matt panel.
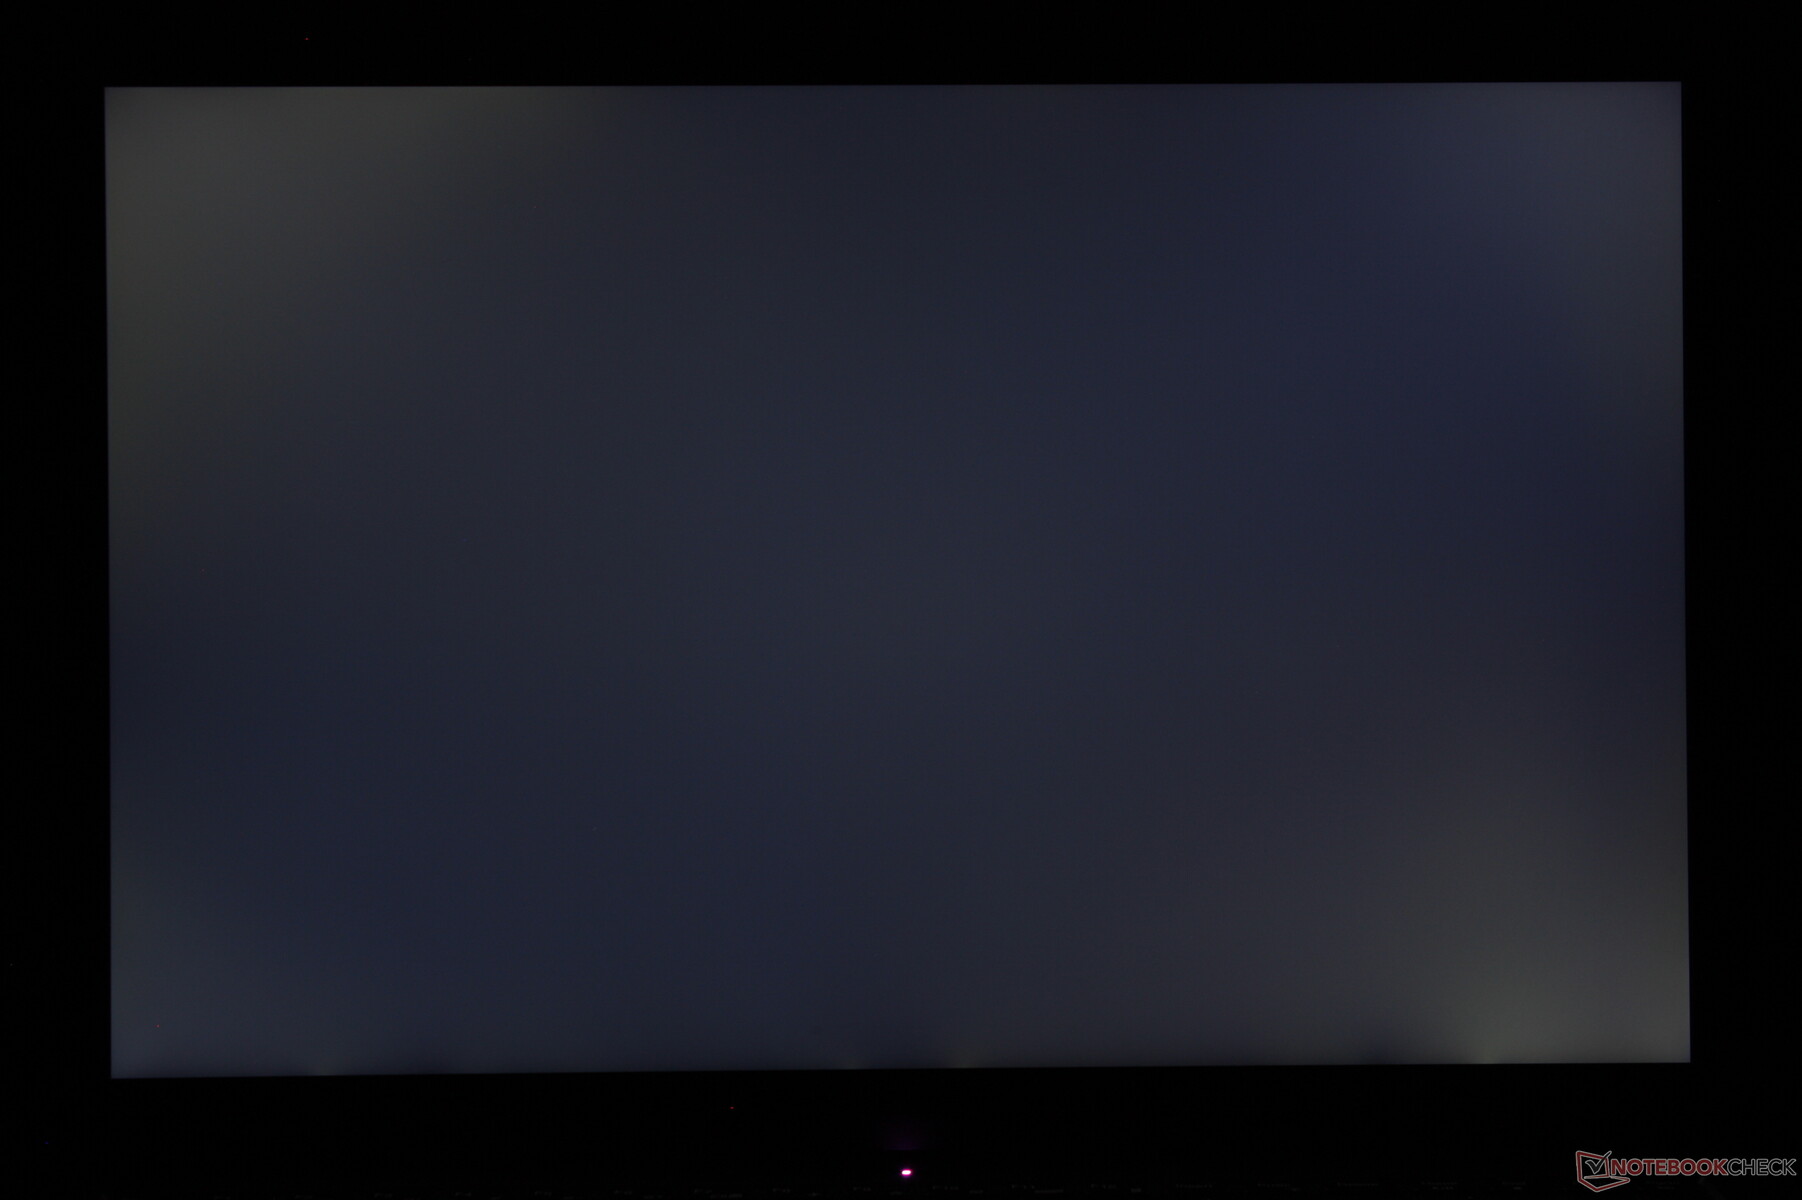
Bakgrundsbelysningsblödning skulle säkert kunna förbättras. Vår enhet skulle uppvisa en ganska stor ljusblödning, vilket vi tycker är på gränsen till oacceptabelt för en bärbar dator för spel i den här prisklassen.
Användare som är intresserade av OLED eller bredare AdobeRGB-färger får se sig om efter mellanklassen Legion Pro 5-serien.

| |||||||||||||||||||||||||
Distribution av ljusstyrkan: 87 %
Mitt på batteriet: 405.7 cd/m²
Kontrast: 1068:1 (Svärta: 0.38 cd/m²)
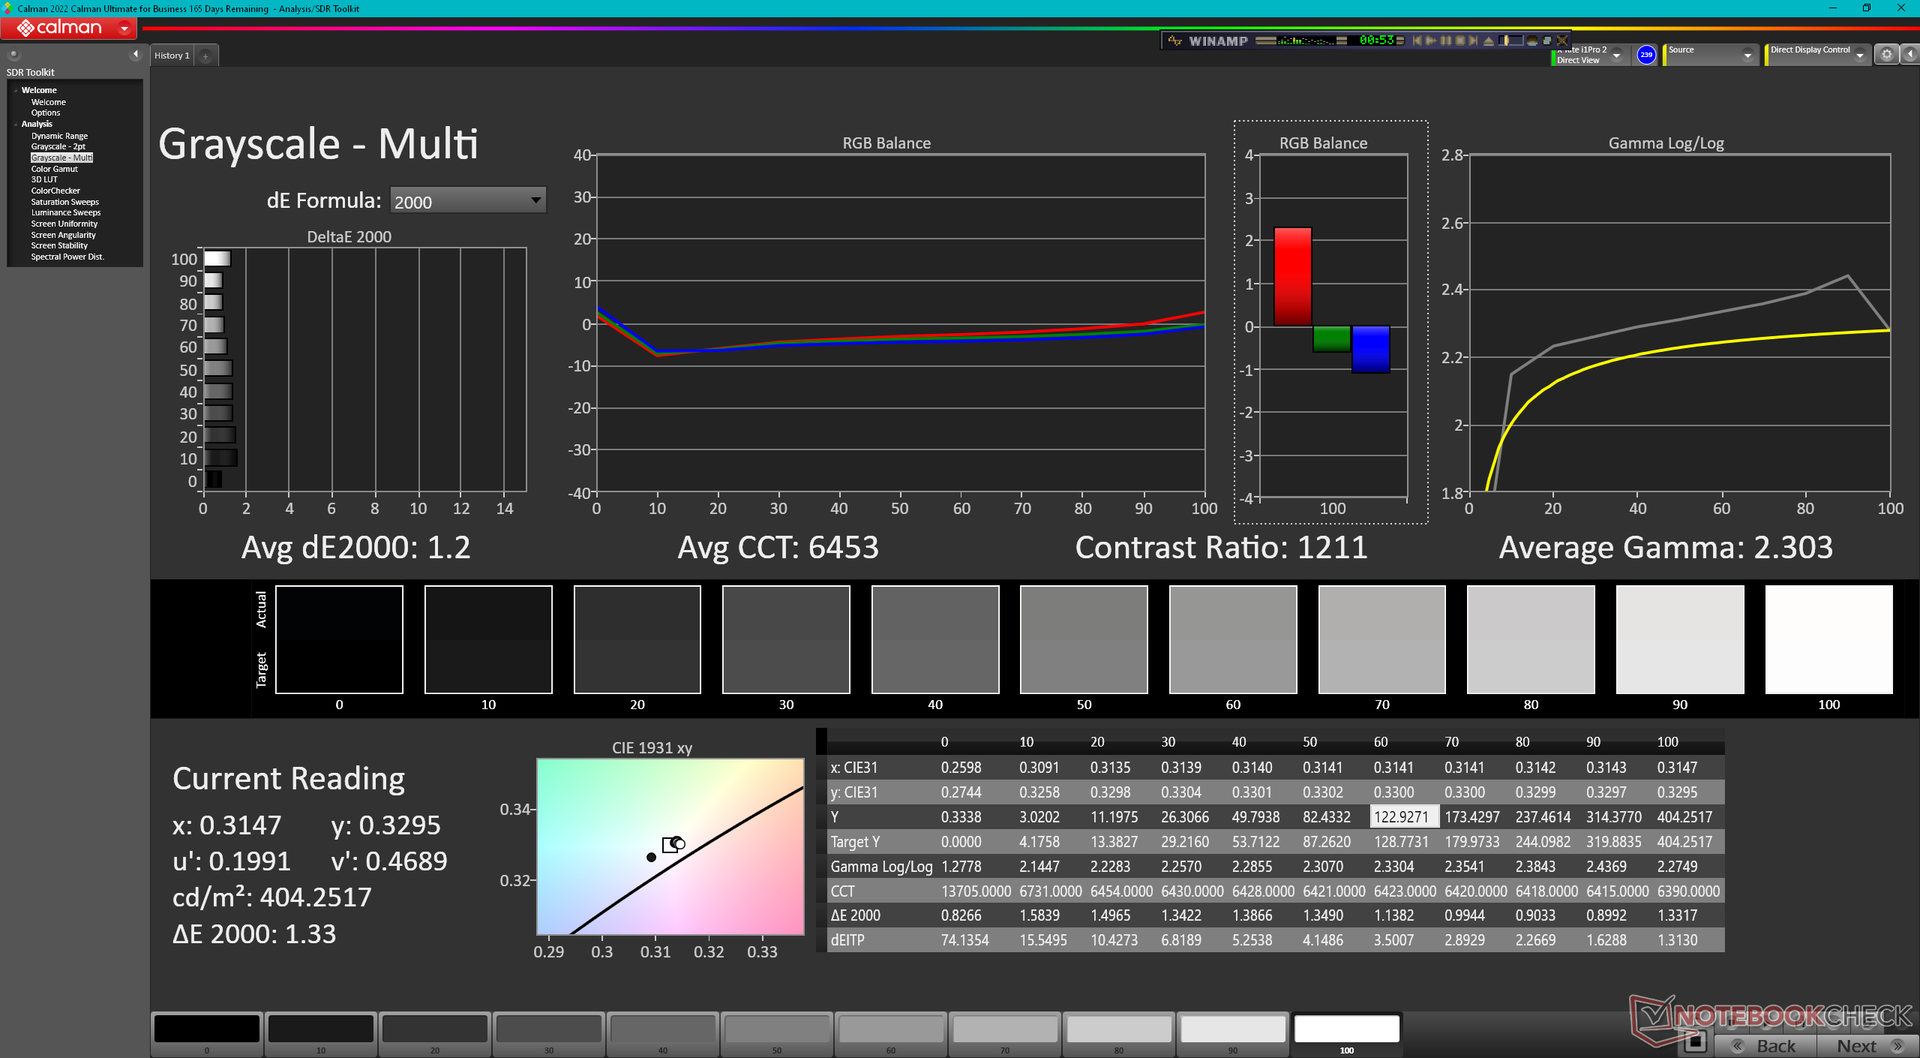
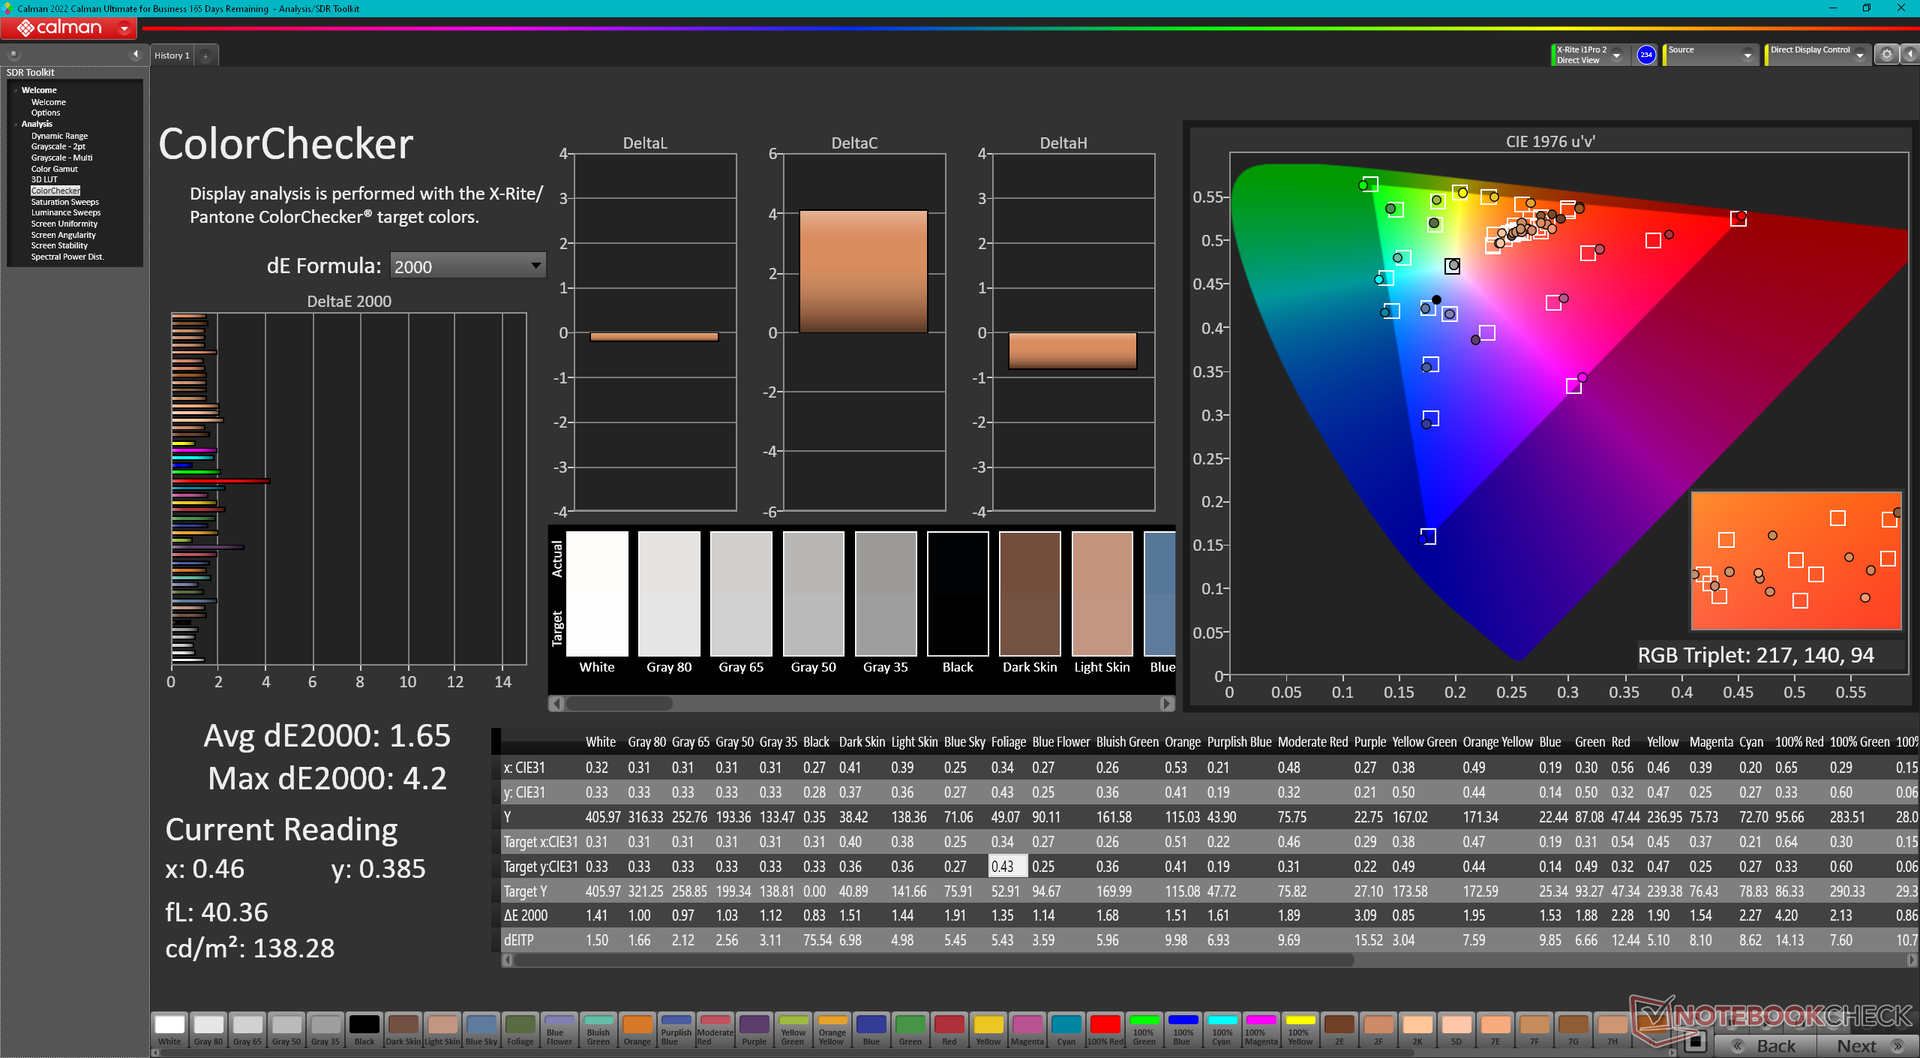
ΔE ColorChecker Calman: 1.65 | ∀{0.5-29.43 Ø4.71}
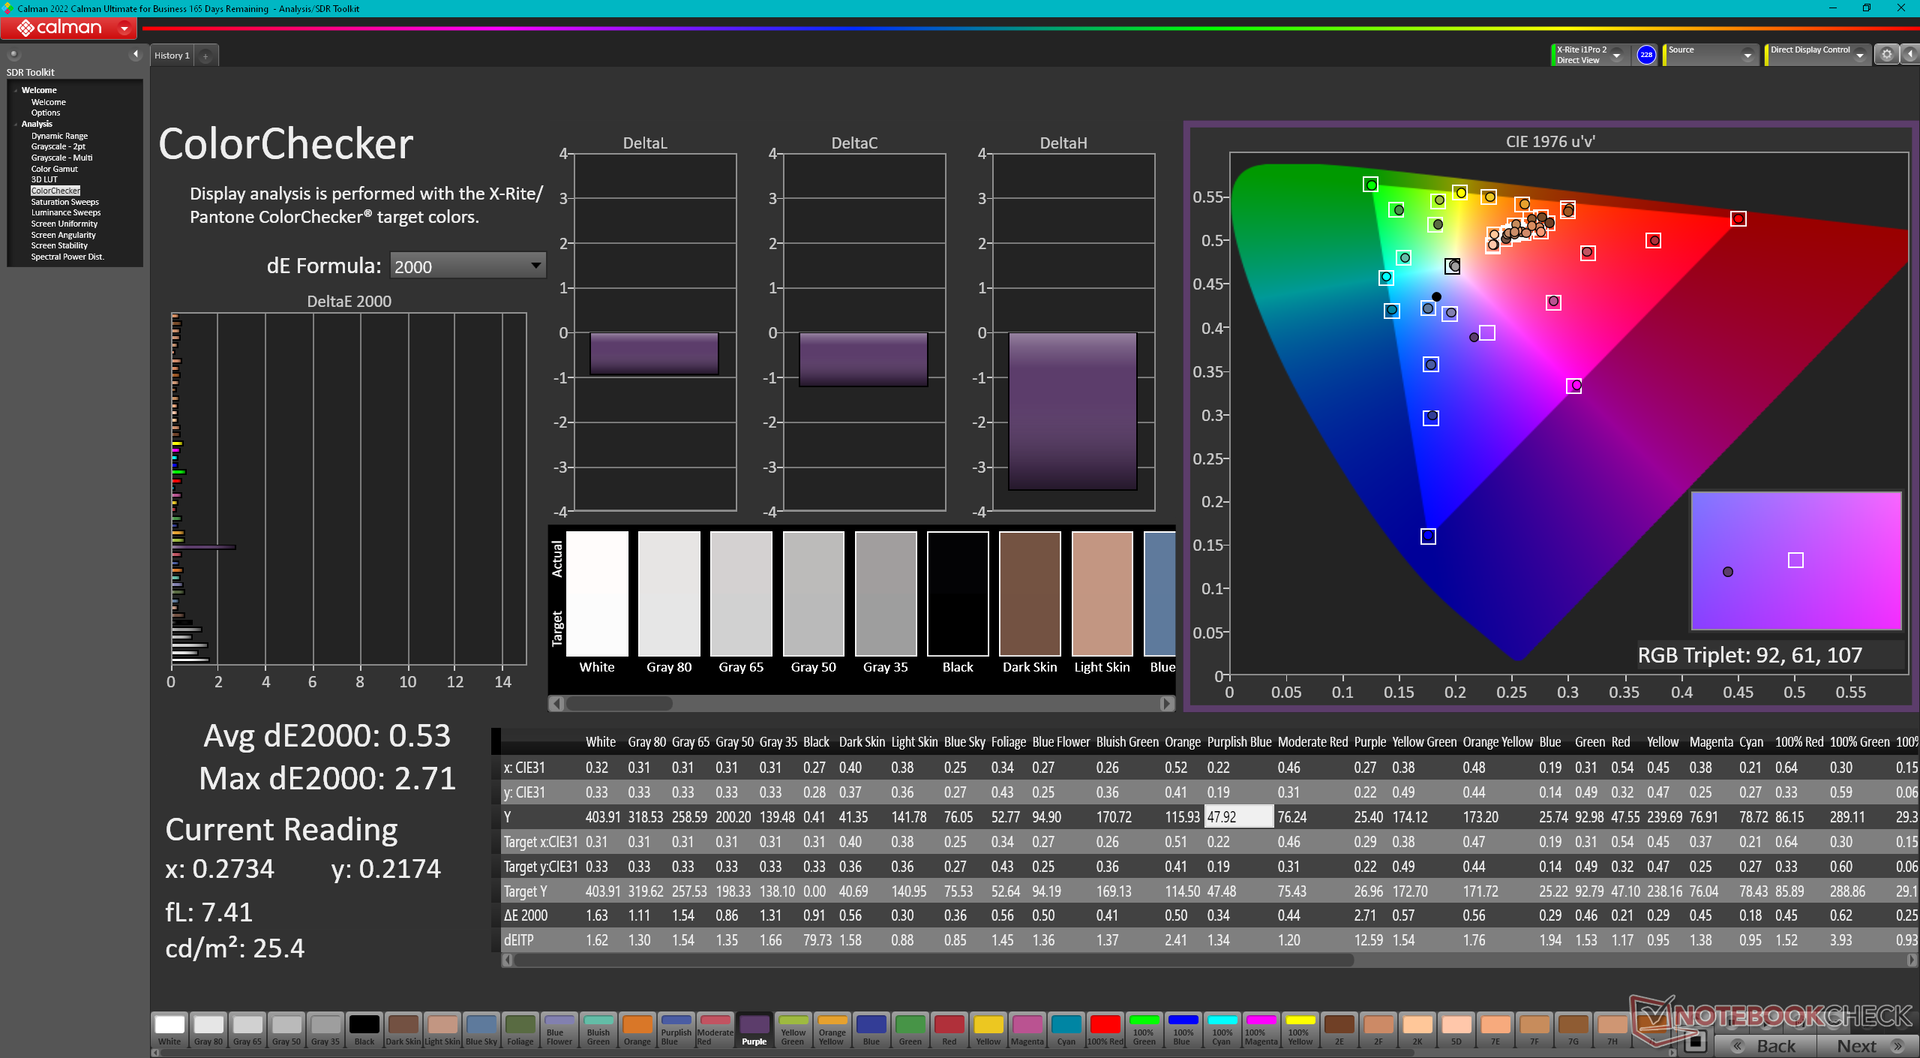
calibrated: 0.53
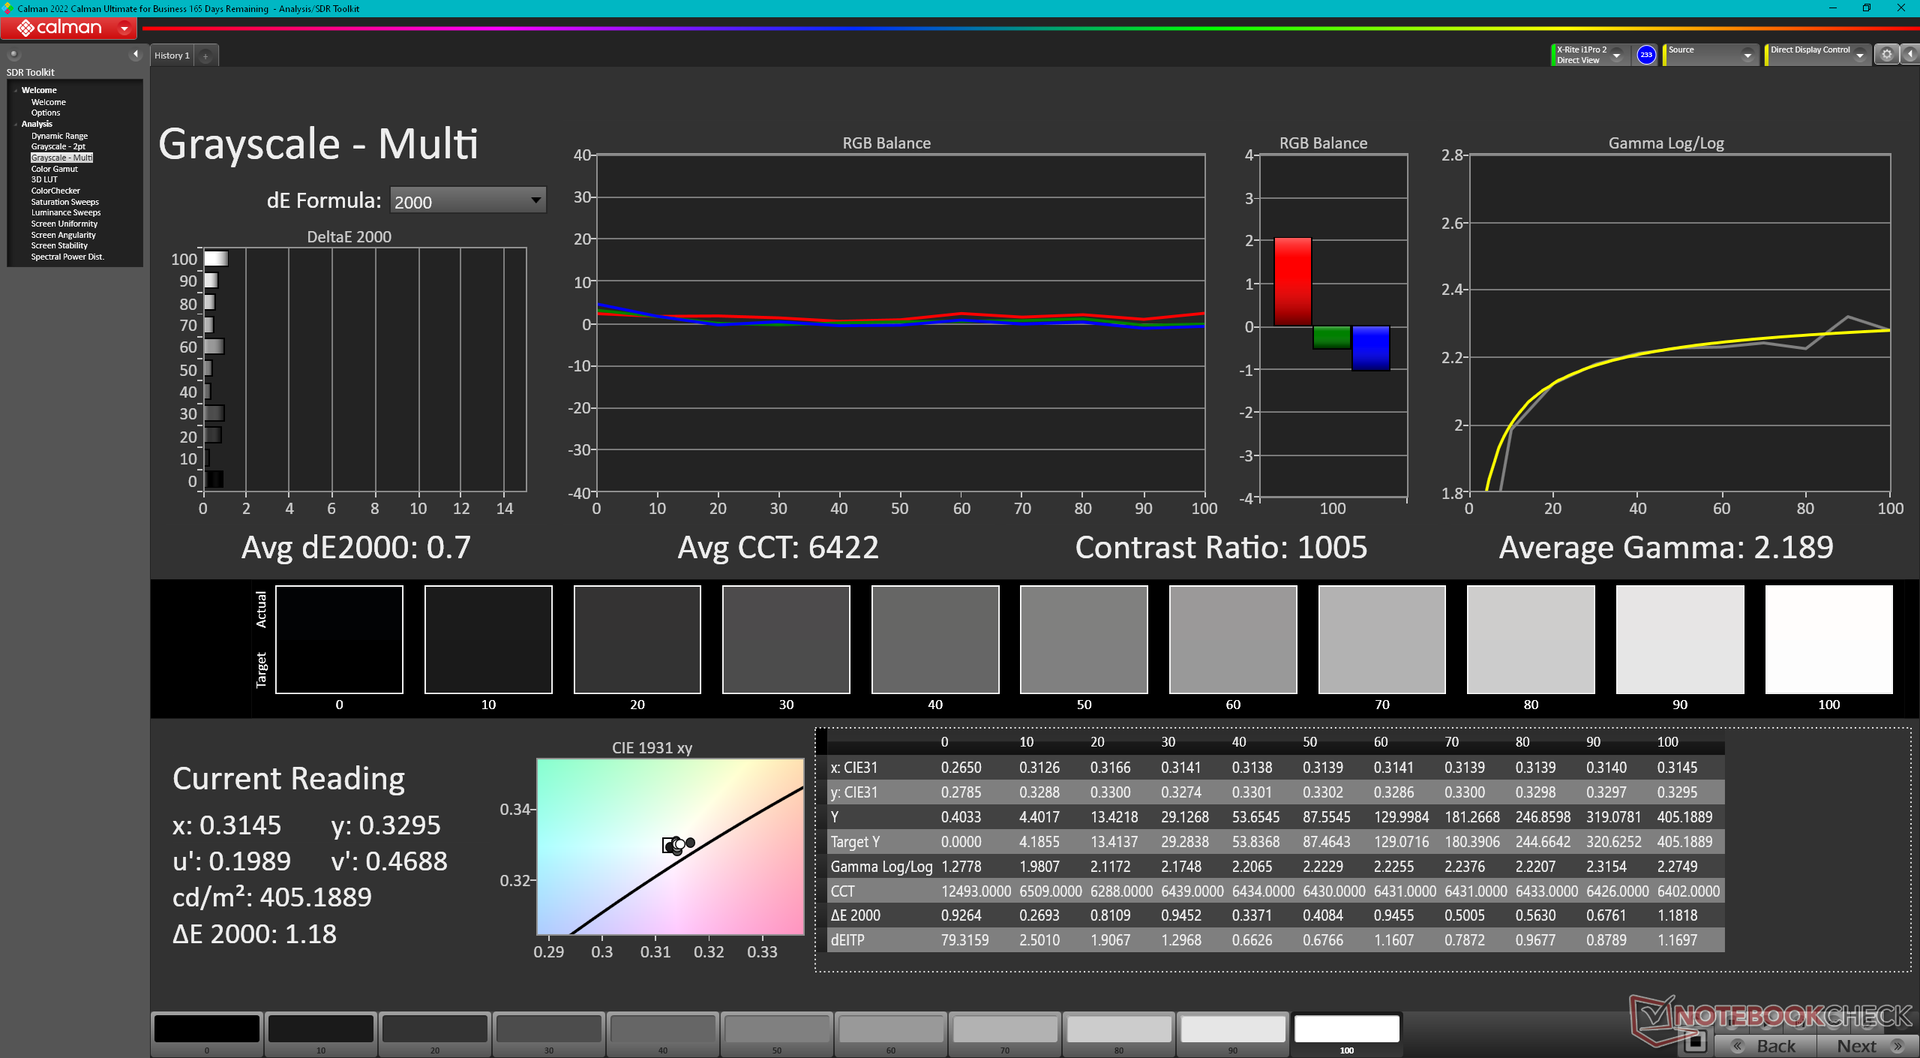
ΔE Greyscale Calman: 1.2 | ∀{0.09-98 Ø4.96}
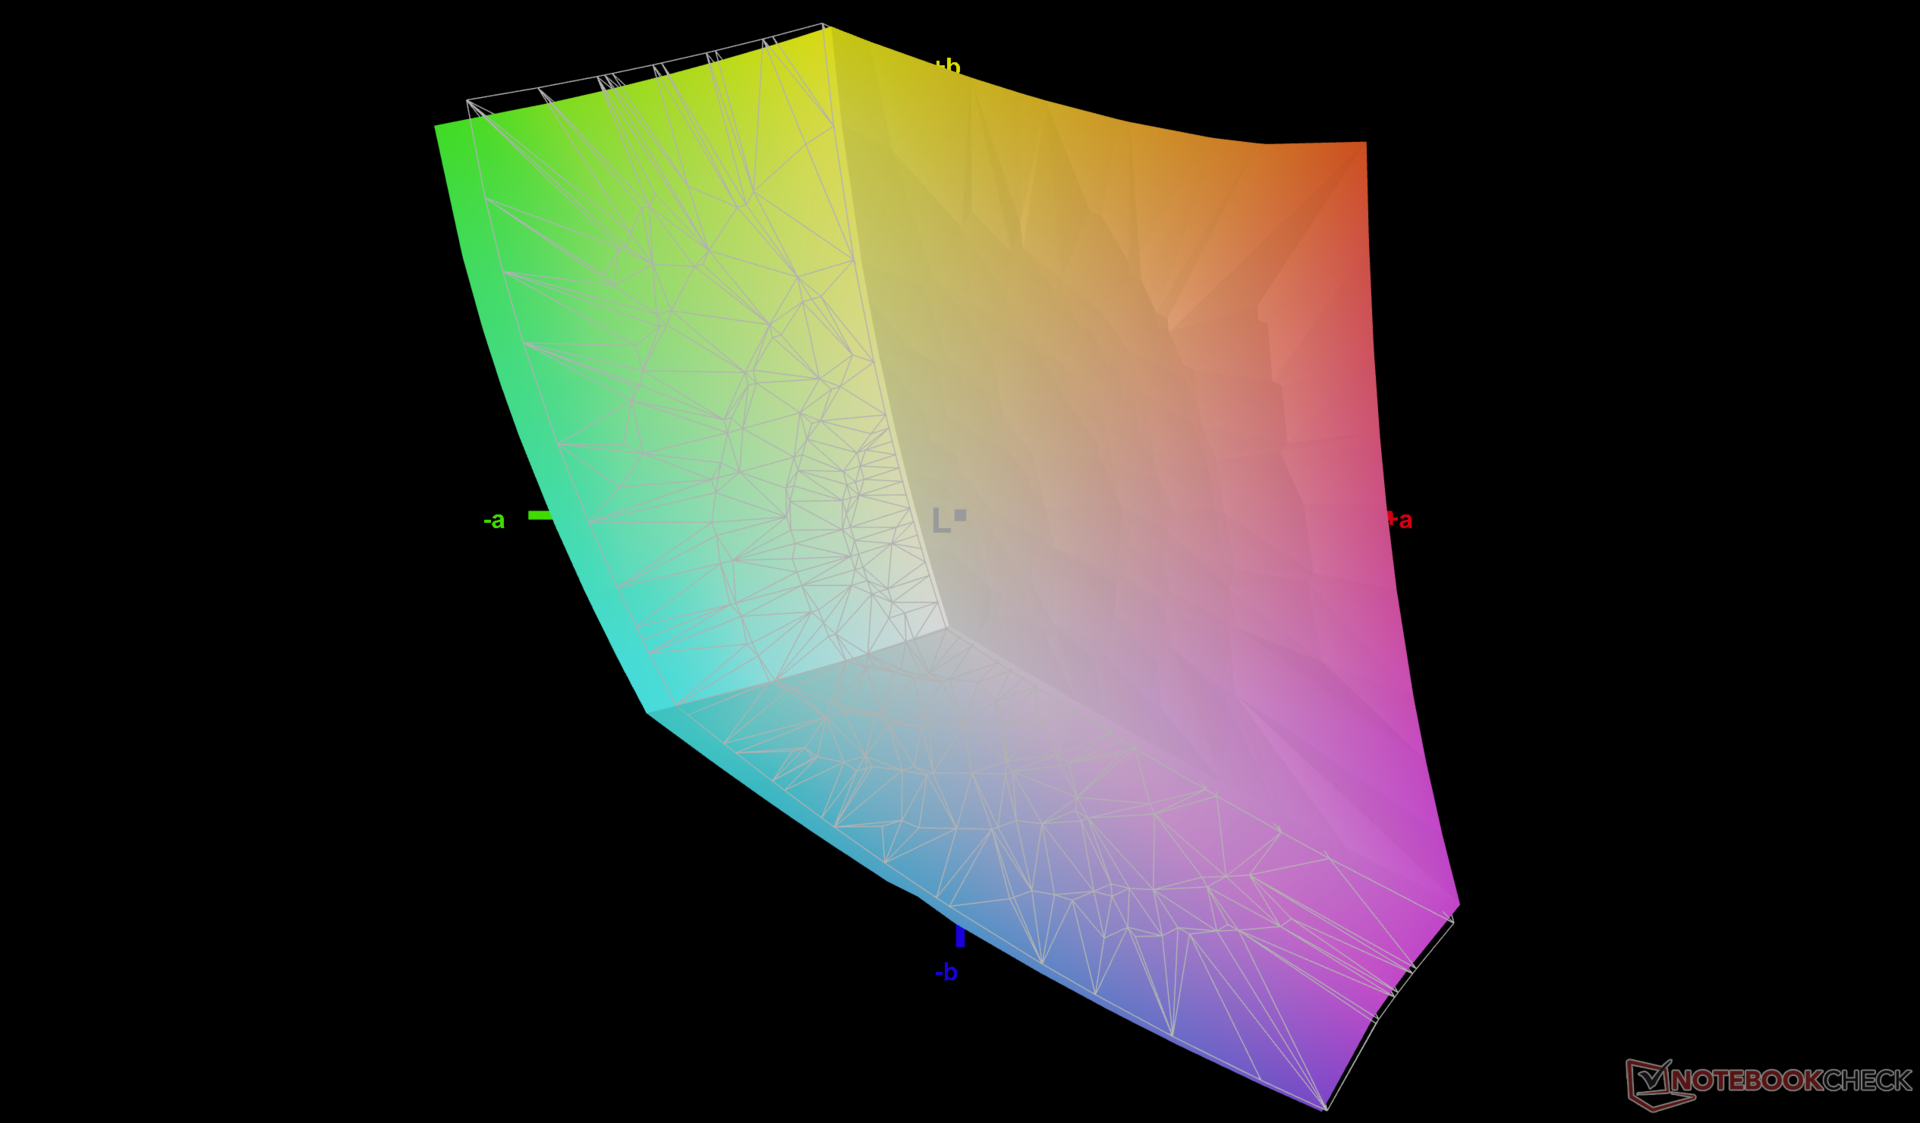
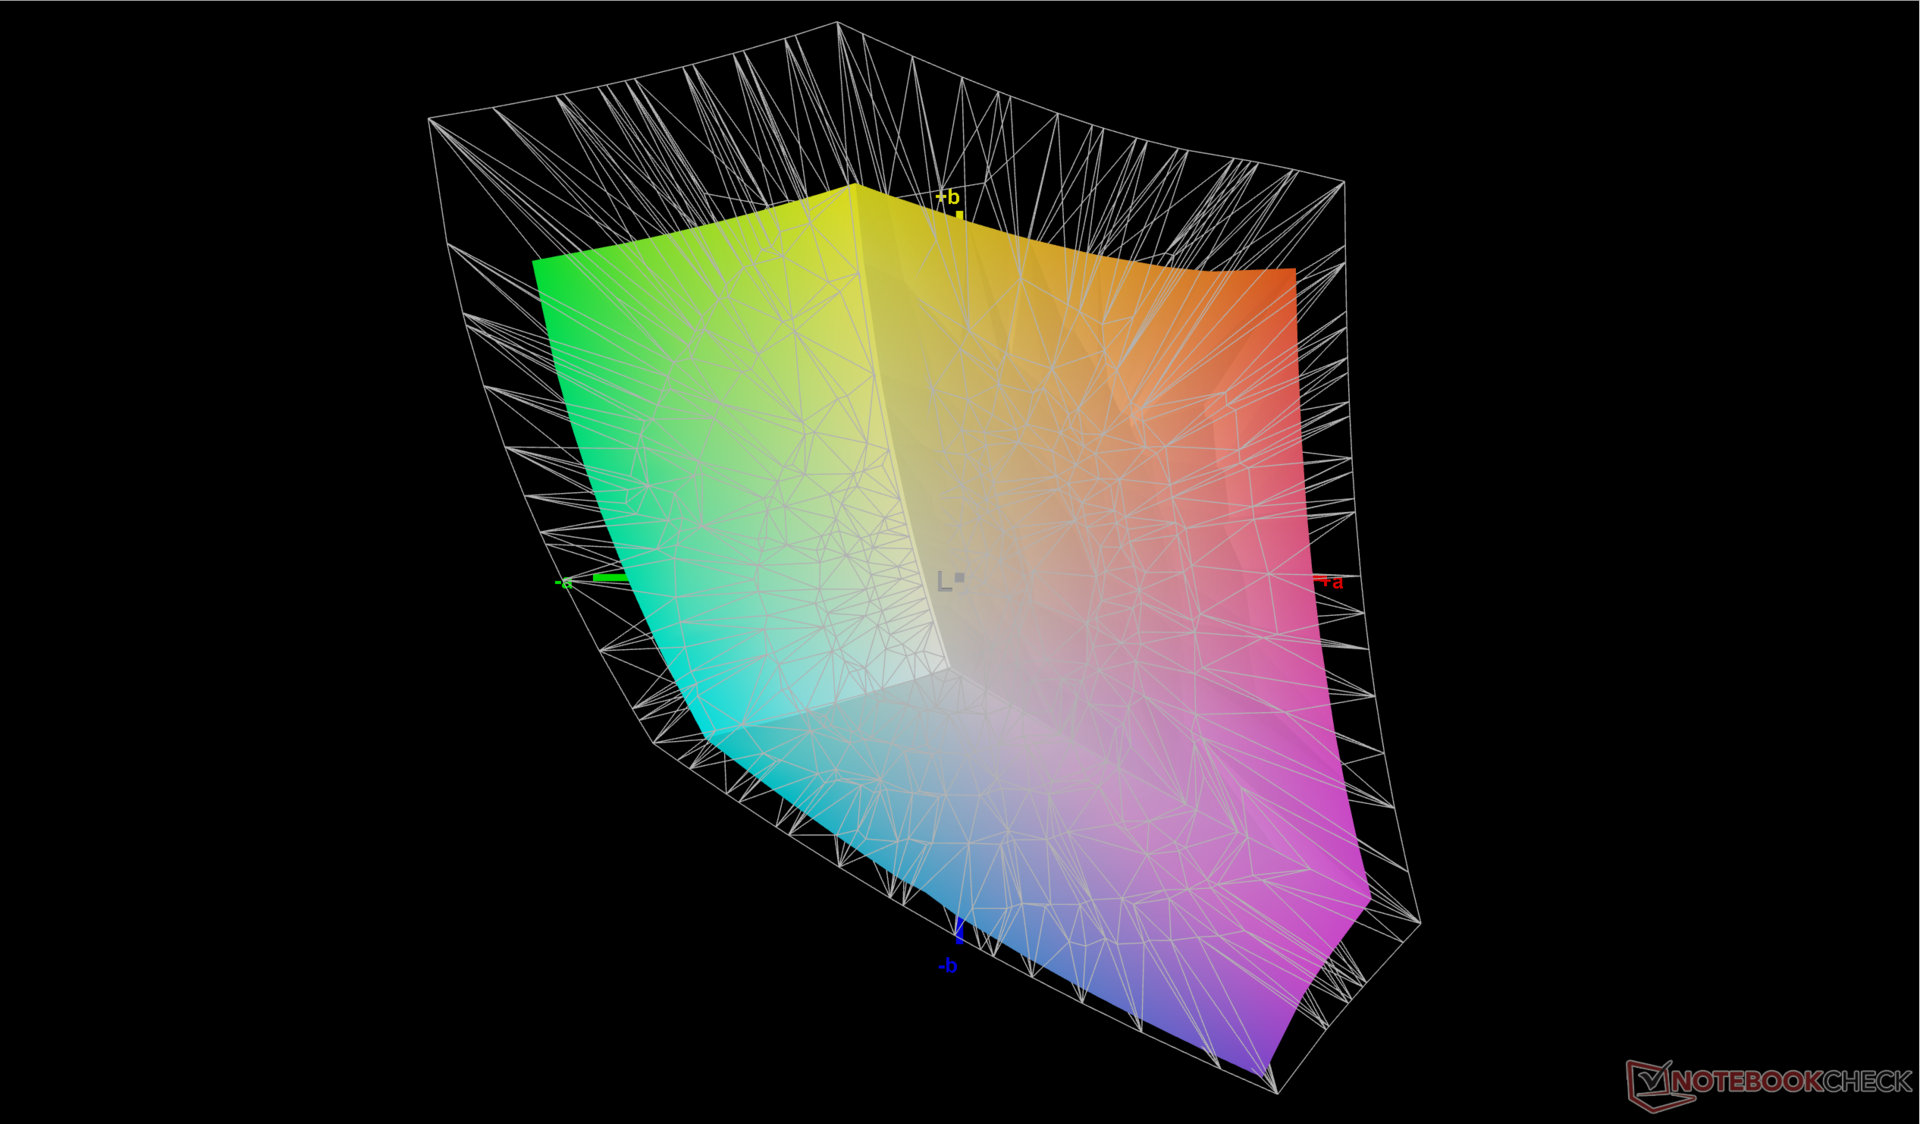
73.3% AdobeRGB 1998 (Argyll 3D)
98.8% sRGB (Argyll 3D)
71.2% Display P3 (Argyll 3D)
Gamma: 2.3
CCT: 6453 K
| Lenovo Legion Pro 5 16IRX8 AU Optronics B160QAN03.1, IPS, 2560x1600, 16" | Asus ROG Zephyrus M16 GU603Z BOE0A0B (BOE CQ NE160QDM-NY3), IPS, 2560x1600, 16" | Razer Blade 16 Early 2023 CSOT T3 MNG007DA4-1, IPS, 2560x1600, 16" | Lenovo Legion Pro 7 16IRX8H MNG007DA2-3 (CSO1628), IPS, 2560x1600, 16" | Lenovo Legion 5 Pro 16ARH7H RTX 3070 Ti BOE CQ NE160QDM-NY1, IPS, 2560x1600, 16" | Lenovo Legion S7 16ARHA7 BOE CQ NE160QDM-NY1, IPS, 2560x1600, 16" | |
|---|---|---|---|---|---|---|
| Display | 14% | 20% | -2% | -4% | -2% | |
| Display P3 Coverage (%) | 71.2 | 92.8 30% | 98.5 38% | 69.1 -3% | 67.3 -5% | 69.8 -2% |
| sRGB Coverage (%) | 98.8 | 98.5 0% | 100 1% | 99.7 1% | 96.1 -3% | 98.1 -1% |
| AdobeRGB 1998 Coverage (%) | 73.3 | 83.1 13% | 89.7 22% | 71.2 -3% | 69.5 -5% | 71.9 -2% |
| Response Times | 26% | 20% | 29% | -4% | 4% | |
| Response Time Grey 50% / Grey 80% * (ms) | 14.5 ? | 7.6 ? 48% | 6.6 ? 54% | 12.3 ? 15% | 14.4 ? 1% | 10 ? 31% |
| Response Time Black / White * (ms) | 10.4 ? | 10 ? 4% | 12 ? -15% | 5.9 ? 43% | 11.2 ? -8% | 12.8 ? -23% |
| PWM Frequency (Hz) | ||||||
| Screen | -62% | -29% | 15% | -22% | -8% | |
| Brightness middle (cd/m²) | 405.7 | 497 23% | 456.8 13% | 511 26% | 522.8 29% | 492.4 21% |
| Brightness (cd/m²) | 368 | 481 31% | 437 19% | 469 27% | 503 37% | 471 28% |
| Brightness Distribution (%) | 87 | 82 -6% | 83 -5% | 86 -1% | 84 -3% | 90 3% |
| Black Level * (cd/m²) | 0.38 | 0.21 45% | 0.35 8% | 0.4 -5% | 0.41 -8% | 0.4 -5% |
| Contrast (:1) | 1068 | 2367 122% | 1305 22% | 1278 20% | 1275 19% | 1231 15% |
| Colorchecker dE 2000 * | 1.65 | 3.53 -114% | 3.7 -124% | 0.95 42% | 2.47 -50% | 1.9 -15% |
| Colorchecker dE 2000 max. * | 4.2 | 6.15 -46% | 6.42 -53% | 2.07 51% | 6.56 -56% | 3.81 9% |
| Colorchecker dE 2000 calibrated * | 0.53 | 3.53 -566% | 0.66 -25% | 0.91 -72% | 0.61 -15% | 0.99 -87% |
| Greyscale dE 2000 * | 1.2 | 1.74 -45% | 2.6 -117% | 0.6 50% | 3 -150% | 1.7 -42% |
| Gamma | 2.3 96% | 2.2 100% | 2.3 96% | 2.176 101% | 2.27 97% | 2.36 93% |
| CCT | 6453 101% | 6418 101% | 6108 106% | 6545 99% | 6719 97% | 6497 100% |
| Totalt genomsnitt (program/inställningar) | -7% /
-33% | 4% /
-12% | 14% /
14% | -10% /
-16% | -2% /
-5% |
* ... mindre är bättre
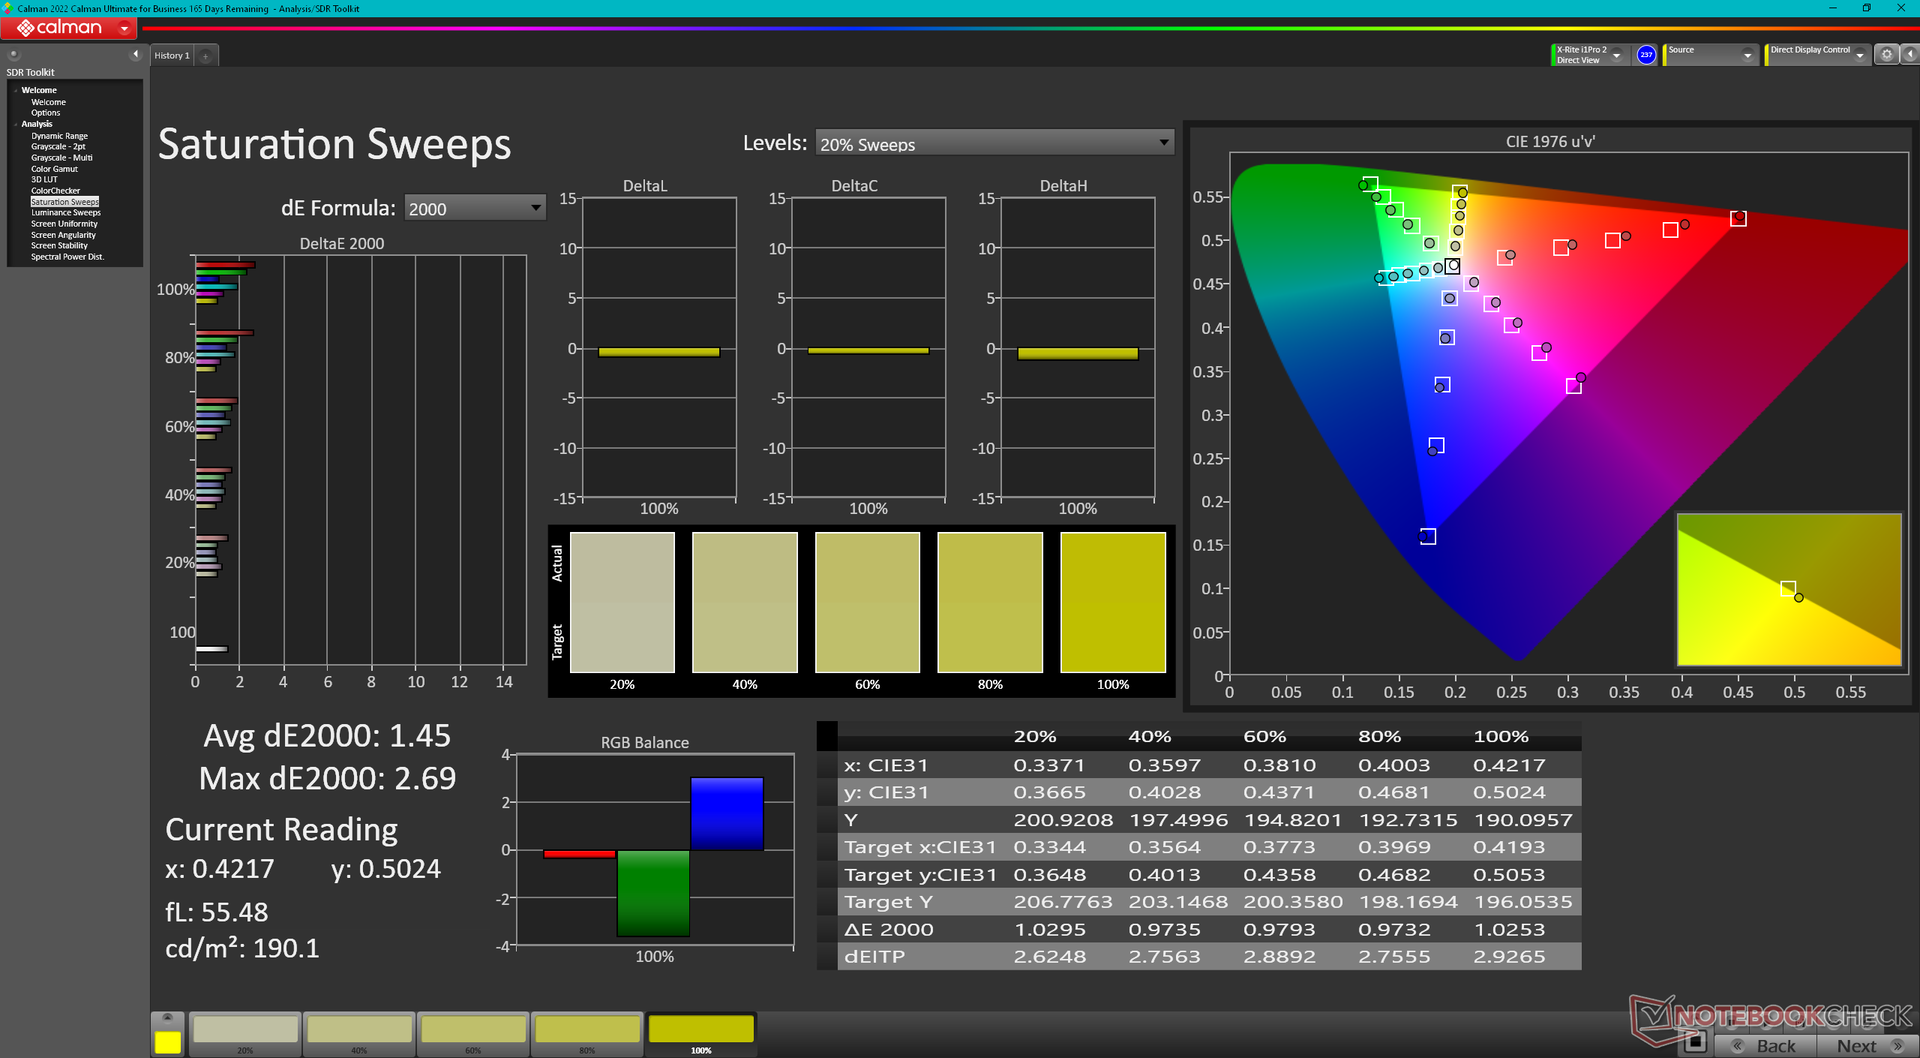
Skärmen är välkalibrerad från början med genomsnittliga deltaE-värden för gråskala och färg på bara 1,2 respektive 1,65. Sådana värden är tillräckligt låga för att en kalibrering av slutanvändaren inte ska behövas. Att kalibrera panelen ändå skulle förbättra färgnoggrannheten ytterligare till <1, vilket framgår av skärmdumparna nedan. Om vi ska vara petiga verkar lila vara den färg som representeras minst exakt av alla testade färger med sitt deltaE på 2,71.

Visa svarstider
| ↔ Svarstid svart till vitt | ||
|---|---|---|
| 10.4 ms ... stiga ↗ och falla ↘ kombinerat | ↗ 5.7 ms stiga | 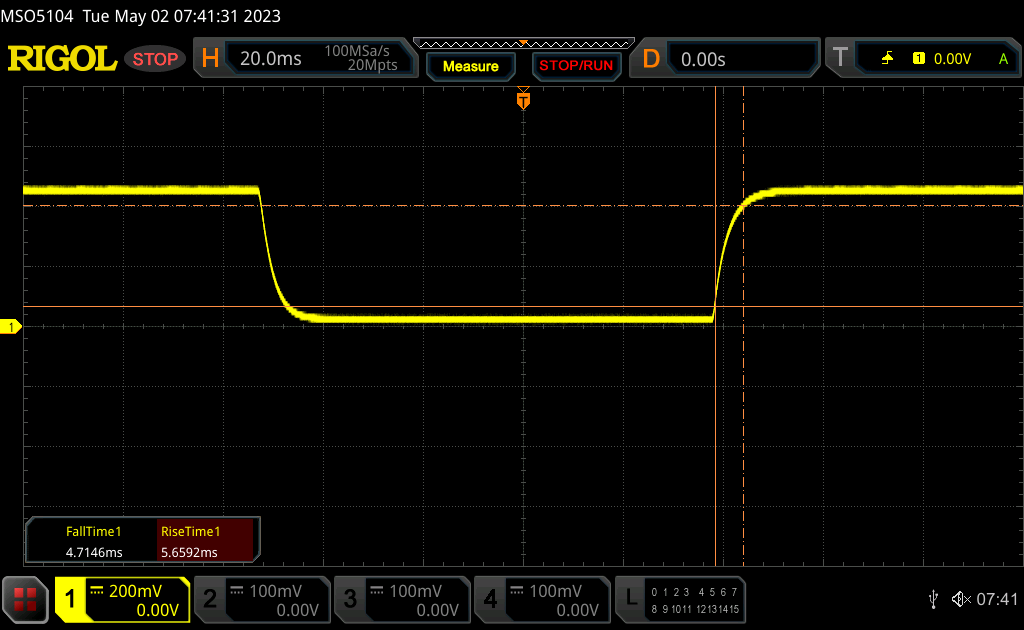 |
| ↘ 4.7 ms hösten | ||
| Skärmen visar bra svarsfrekvens i våra tester, men kan vara för långsam för konkurrenskraftiga spelare. I jämförelse sträcker sig alla testade enheter från 0.1 (minst) till 240 (maximalt) ms. » 28 % av alla enheter är bättre. Det betyder att den uppmätta svarstiden är bättre än genomsnittet av alla testade enheter (19.8 ms). | ||
| ↔ Svarstid 50 % grått till 80 % grått | ||
| 14.5 ms ... stiga ↗ och falla ↘ kombinerat | ↗ 7 ms stiga | 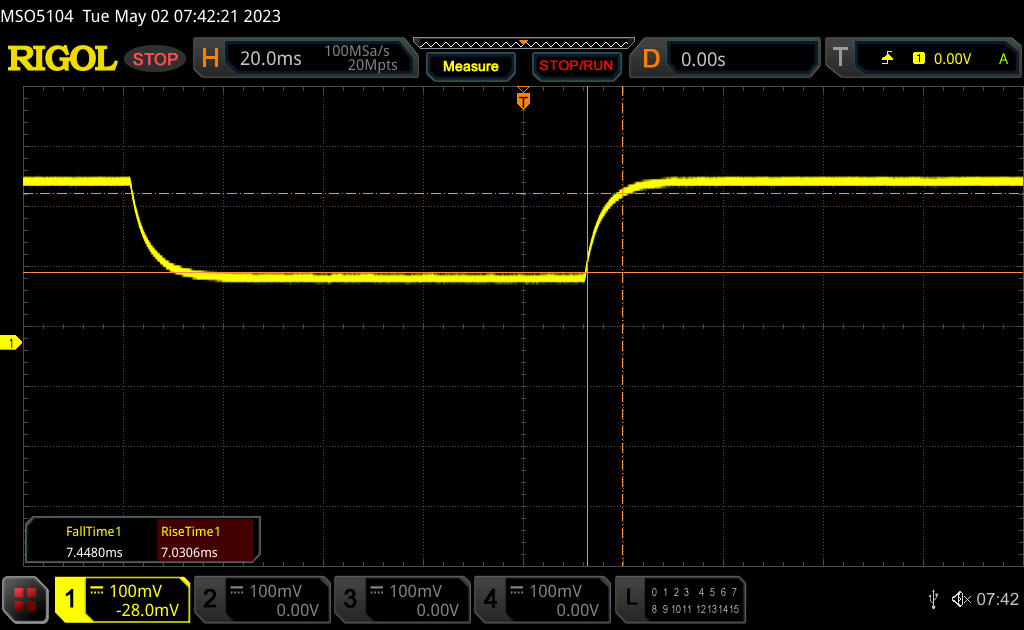 |
| ↘ 7.5 ms hösten | ||
| Skärmen visar bra svarsfrekvens i våra tester, men kan vara för långsam för konkurrenskraftiga spelare. I jämförelse sträcker sig alla testade enheter från 0.165 (minst) till 636 (maximalt) ms. » 29 % av alla enheter är bättre. Det betyder att den uppmätta svarstiden är bättre än genomsnittet av alla testade enheter (31 ms). | ||
Skärmflimmer / PWM (Puls-Width Modulation)
| Skärmflimmer / PWM upptäcktes inte | 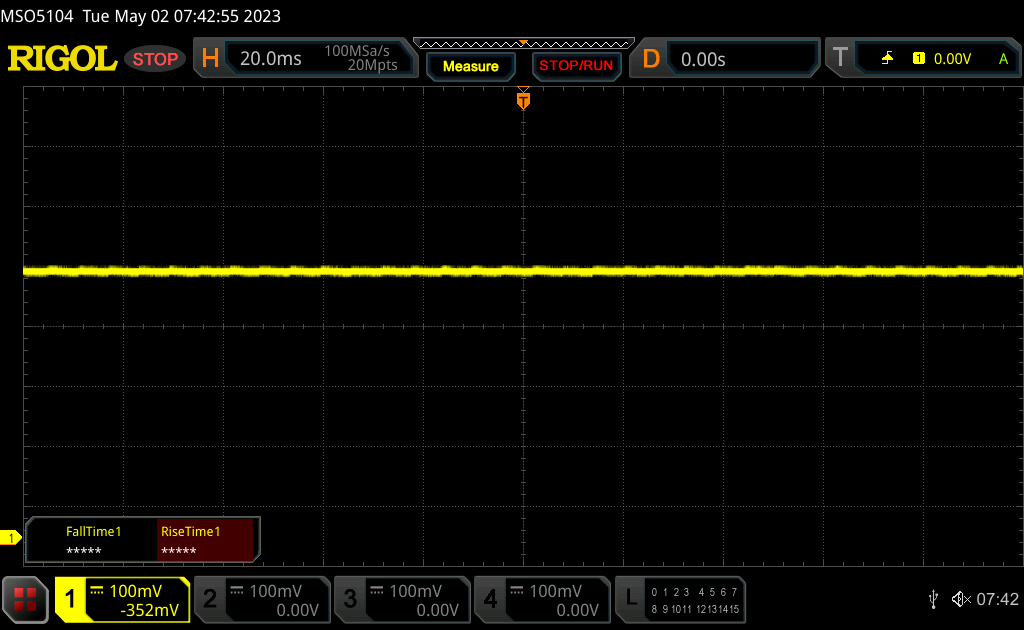 | ||
Som jämförelse: 52 % av alla testade enheter använder inte PWM för att dämpa skärmen. Om PWM upptäcktes mättes ett medelvärde av 7757 (minst: 5 - maximum: 343500) Hz. | |||
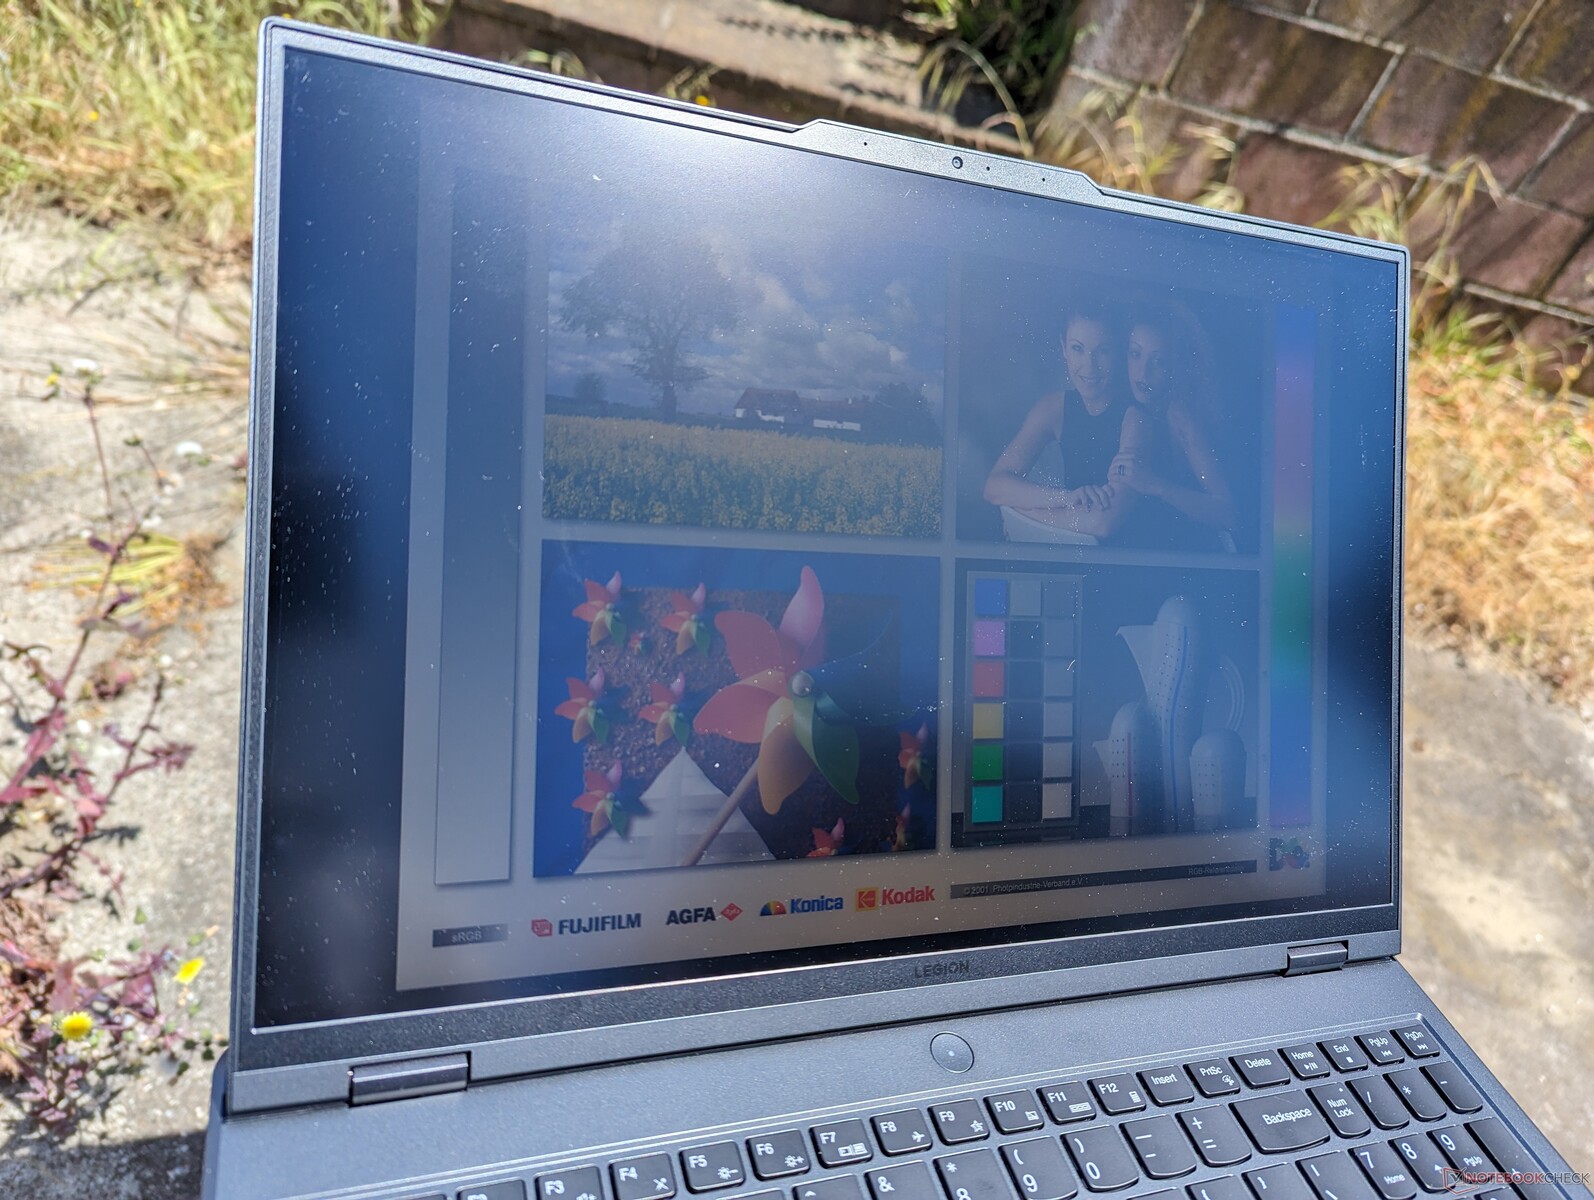
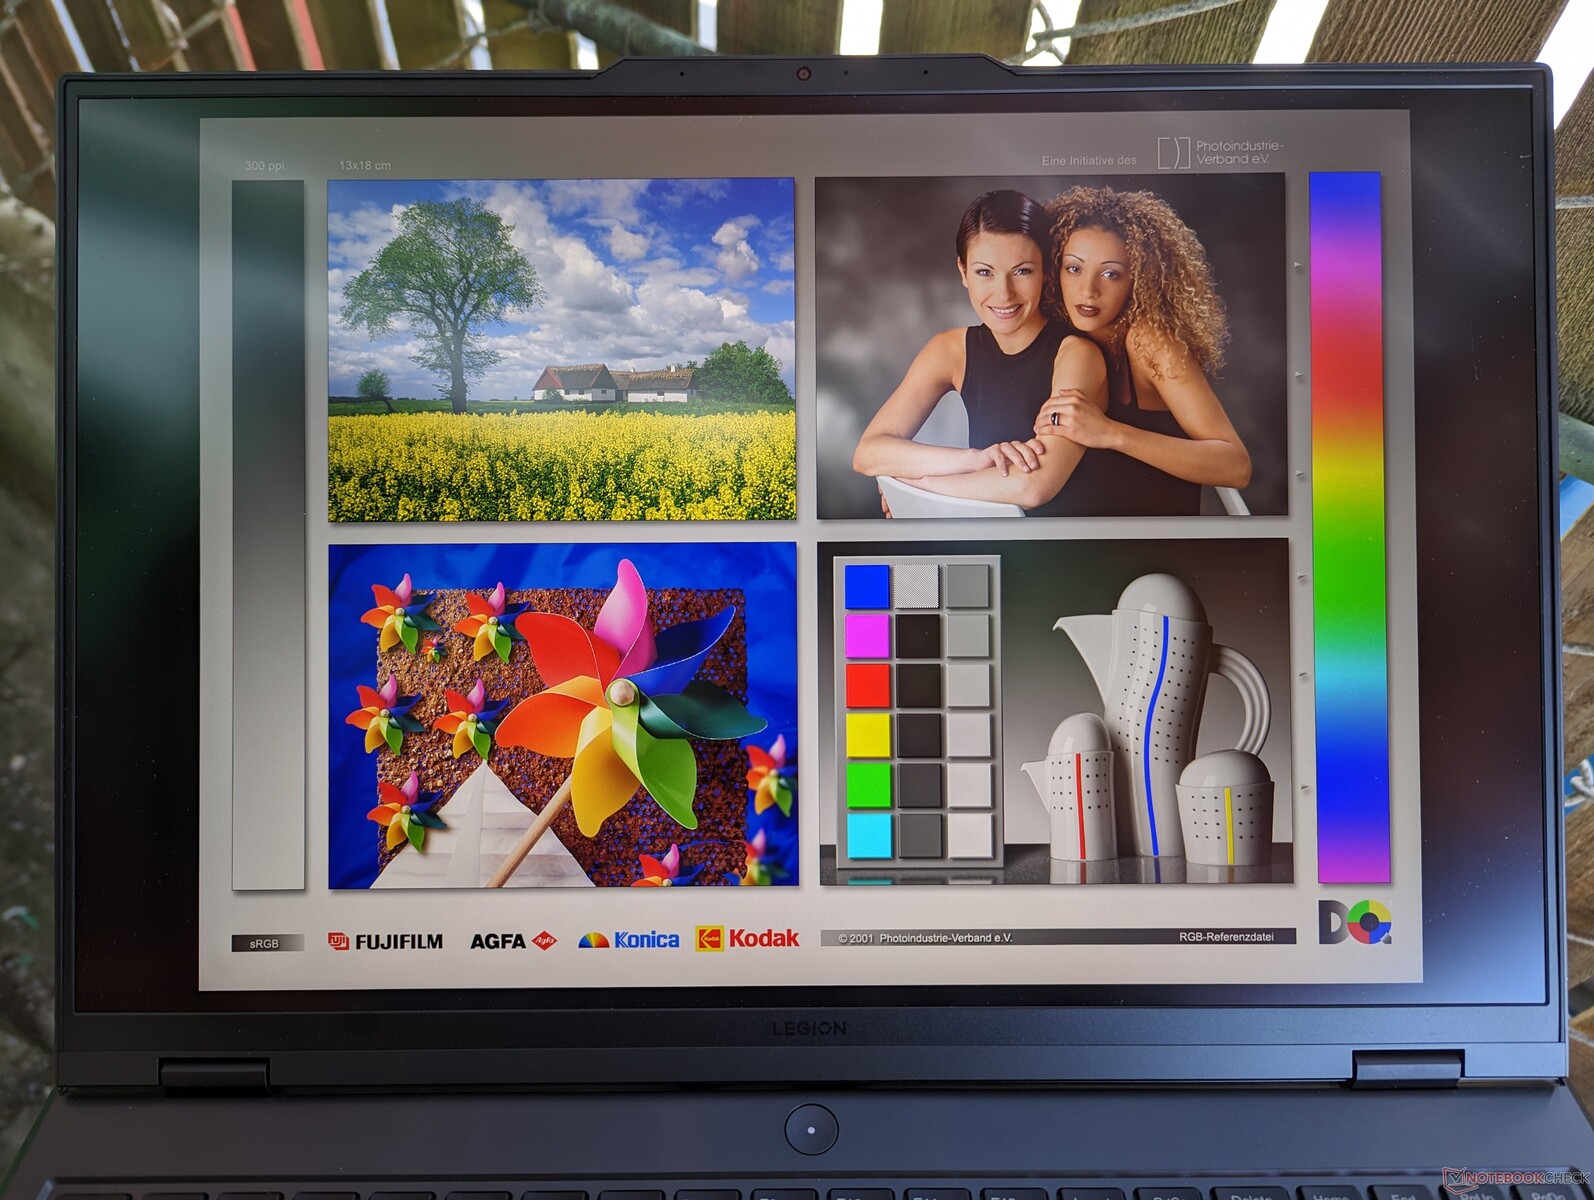
Med 400 nits är skärmen i allmänhet användbar i skugga. Panelalternativet med 240 Hz är något ljusare om synligheten utomhus är ett problem. Skärmarna på de flesta 16-tums spelmaskiner är redan ljusare än på många Ultrabooks i mellanklassen där 300 nits är vanligt.
Prestanda - 13th Gen Raptor Lake
Provningsförhållanden
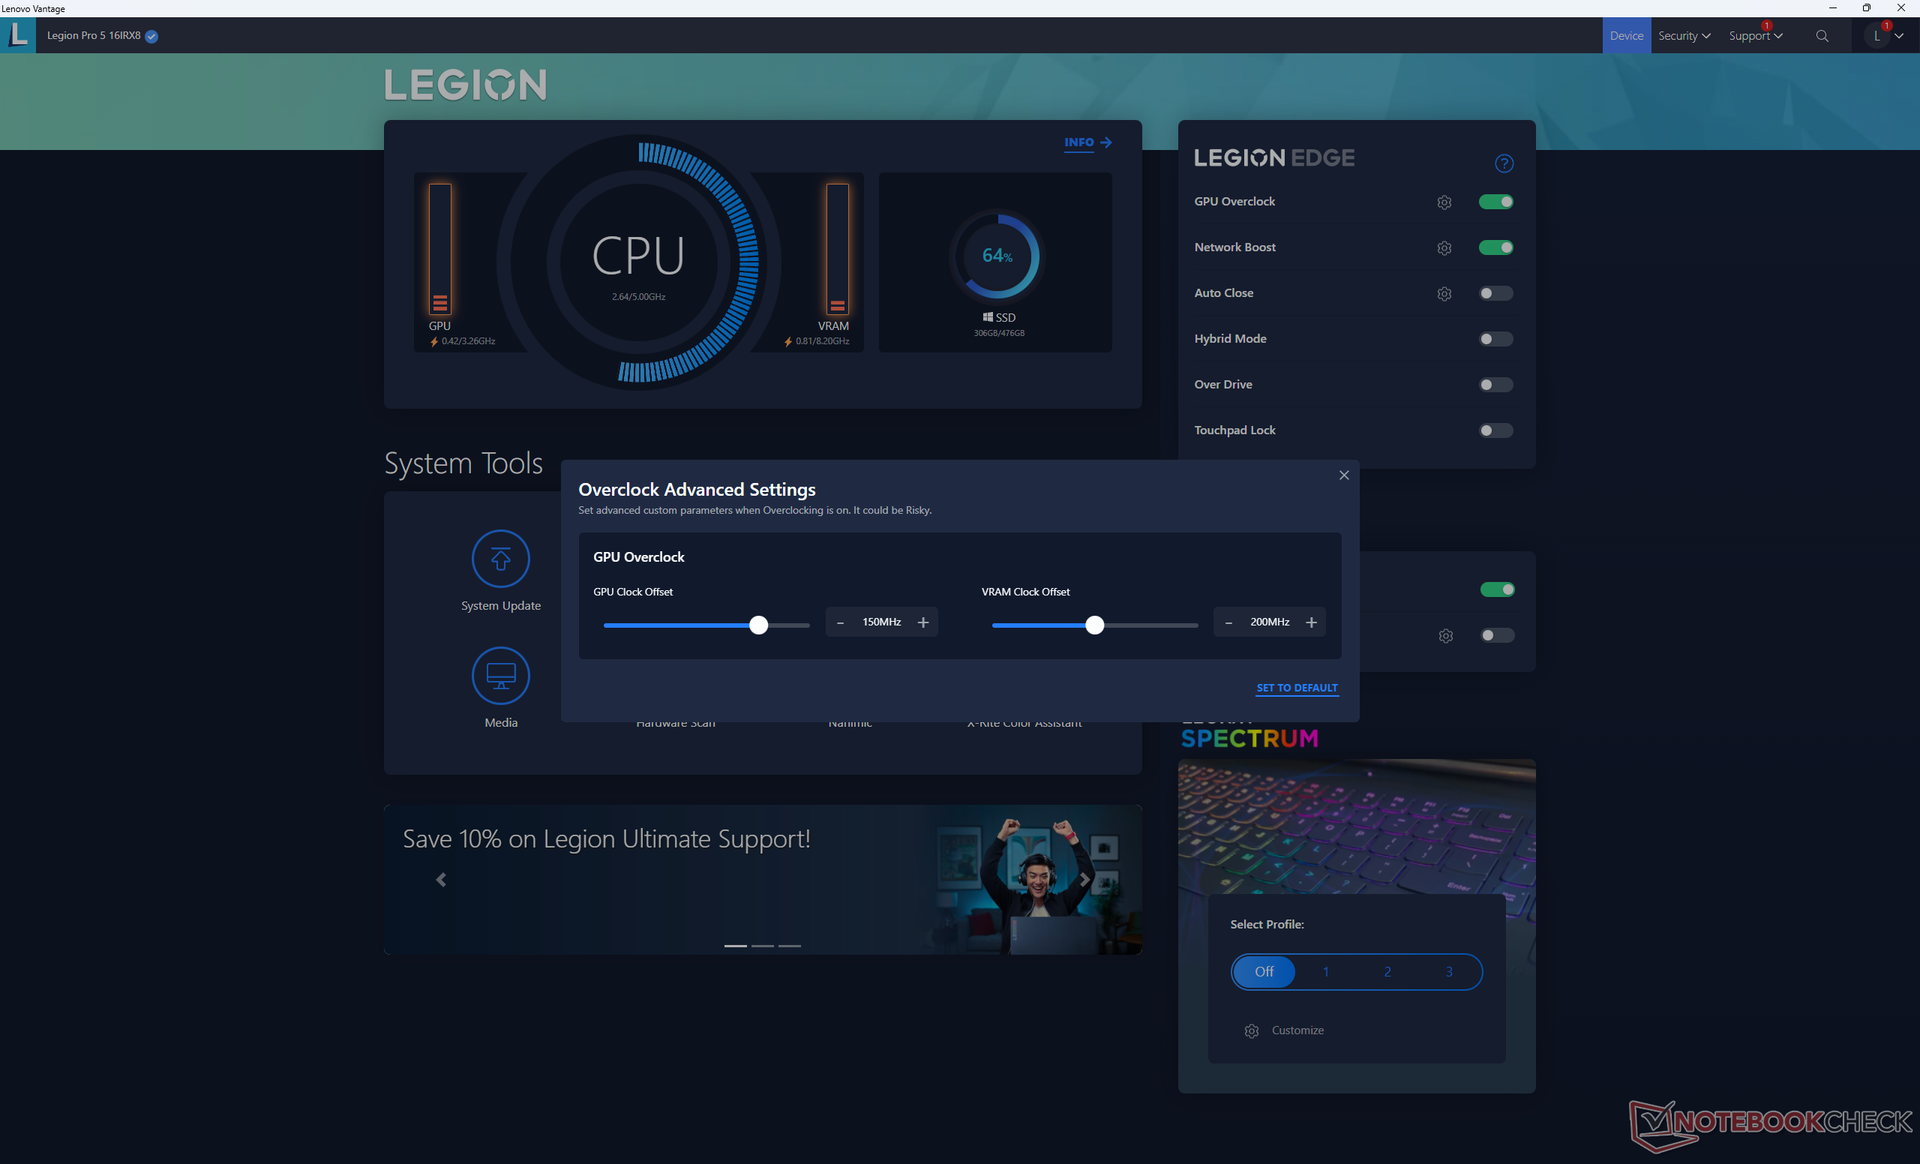
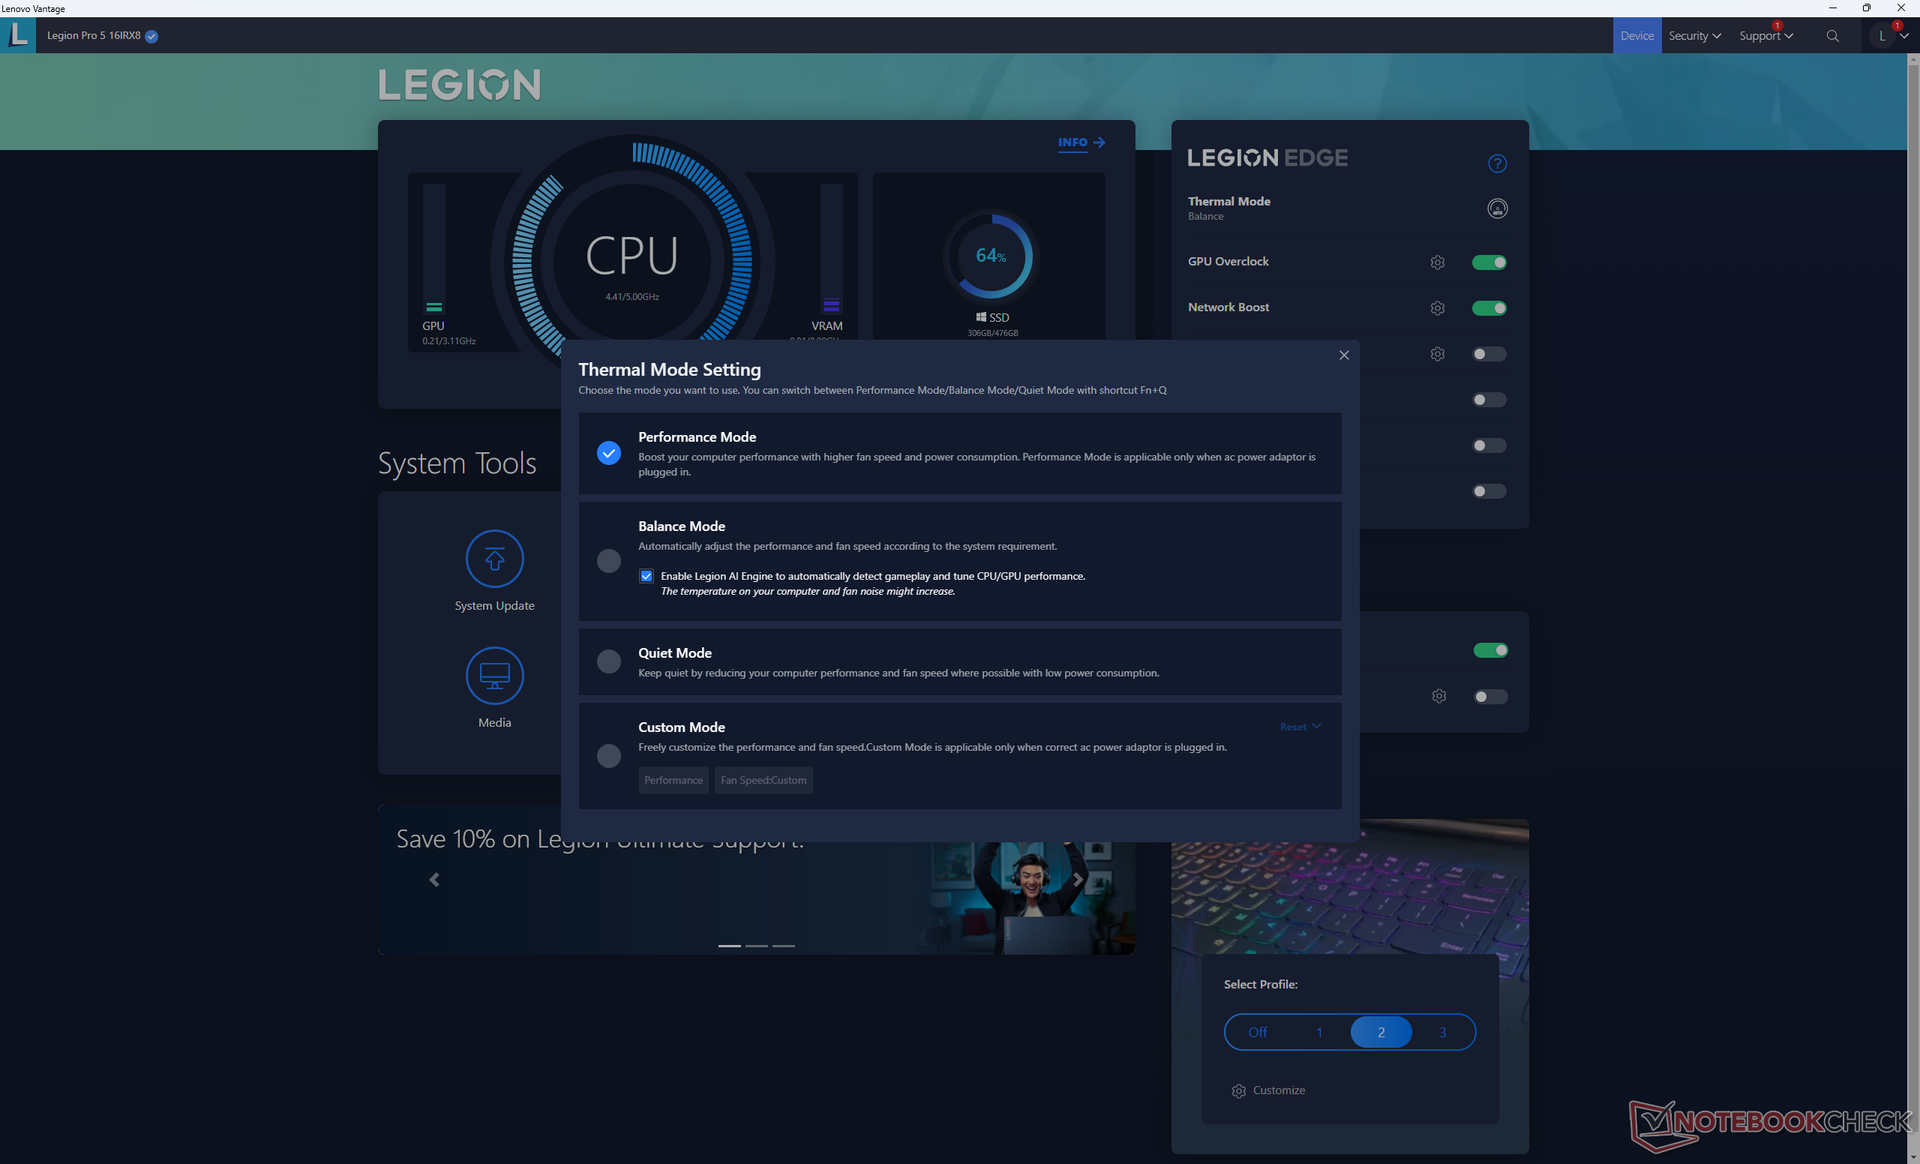
Vi ställde in vår testenhet i prestandaläget med GPU-överklockning aktiv och Hybrid-läget avstängt innan vi körde benchmarks nedan. Alla dessa inställningar är tack och lov lättillgängliga via startskärmen för Lenovo Vantage.
Observera att även om MUX endast stöds för att växla mellan Optimus- och diskret GPU-läge, skulle en omstart av systemet alltid krävas. Avancerad Optimus stöds därför inte. G-Sync för den interna skärmen fungerar endast i dGPU-läge.
Processor
Vår Core i7-13700HX är endast cirka 5 till 15 procent snabbare vid flertrådig belastning än den äldre Core i7-12700H som den ersätter. Fördelarna är mätbara om än relativt små. Den totala prestandan är jämförbar med förra årets Core i9-12900H.
Hållbarheten i prestandan är utmärkt utan några anmärkningsvärda nedgångar över tiden när man kör CineBench R15 xT i en slinga.
Uppgradering till Core i9-13900HX SKU förväntas öka prestandan för flera trådar avsevärt med 50 till 70 procent jämfört med Core i7-13700HX. Om du värdesätter processorprestanda kan det vara värt att hoppa över alternativen Core i5-13500H och Core i7-13700HX för Core i9.
Cinebench R15 Multi Loop
Cinebench R23: Multi Core | Single Core
Cinebench R20: CPU (Multi Core) | CPU (Single Core)
Cinebench R15: CPU Multi 64Bit | CPU Single 64Bit
Blender: v2.79 BMW27 CPU
7-Zip 18.03: 7z b 4 | 7z b 4 -mmt1
Geekbench 5.5: Multi-Core | Single-Core
HWBOT x265 Benchmark v2.2: 4k Preset
LibreOffice : 20 Documents To PDF
R Benchmark 2.5: Overall mean
* ... mindre är bättre
AIDA64: FP32 Ray-Trace | FPU Julia | CPU SHA3 | CPU Queen | FPU SinJulia | FPU Mandel | CPU AES | CPU ZLib | FP64 Ray-Trace | CPU PhotoWorxx
| Performance rating | |
| Lenovo Legion Pro 7 16IRX8H | |
| Razer Blade 16 Early 2023 | |
| Lenovo Legion Pro 5 16IRX8 | |
| Genomsnitt Intel Core i7-13700HX | |
| Lenovo Legion 5 Pro 16ARH7H RTX 3070 Ti | |
| Lenovo Legion S7 16ARHA7 | |
| Asus ROG Zephyrus M16 GU603Z | |
| AIDA64 / CPU Queen | |
| Razer Blade 16 Early 2023 | |
| Razer Blade 16 Early 2023 | |
| Lenovo Legion Pro 7 16IRX8H | |
| Lenovo Legion Pro 5 16IRX8 | |
| Genomsnitt Intel Core i7-13700HX (86532 - 114717, n=11) | |
| Lenovo Legion S7 16ARHA7 | |
| Lenovo Legion 5 Pro 16ARH7H RTX 3070 Ti | |
| Asus ROG Zephyrus M16 GU603Z | |
Systemets prestanda
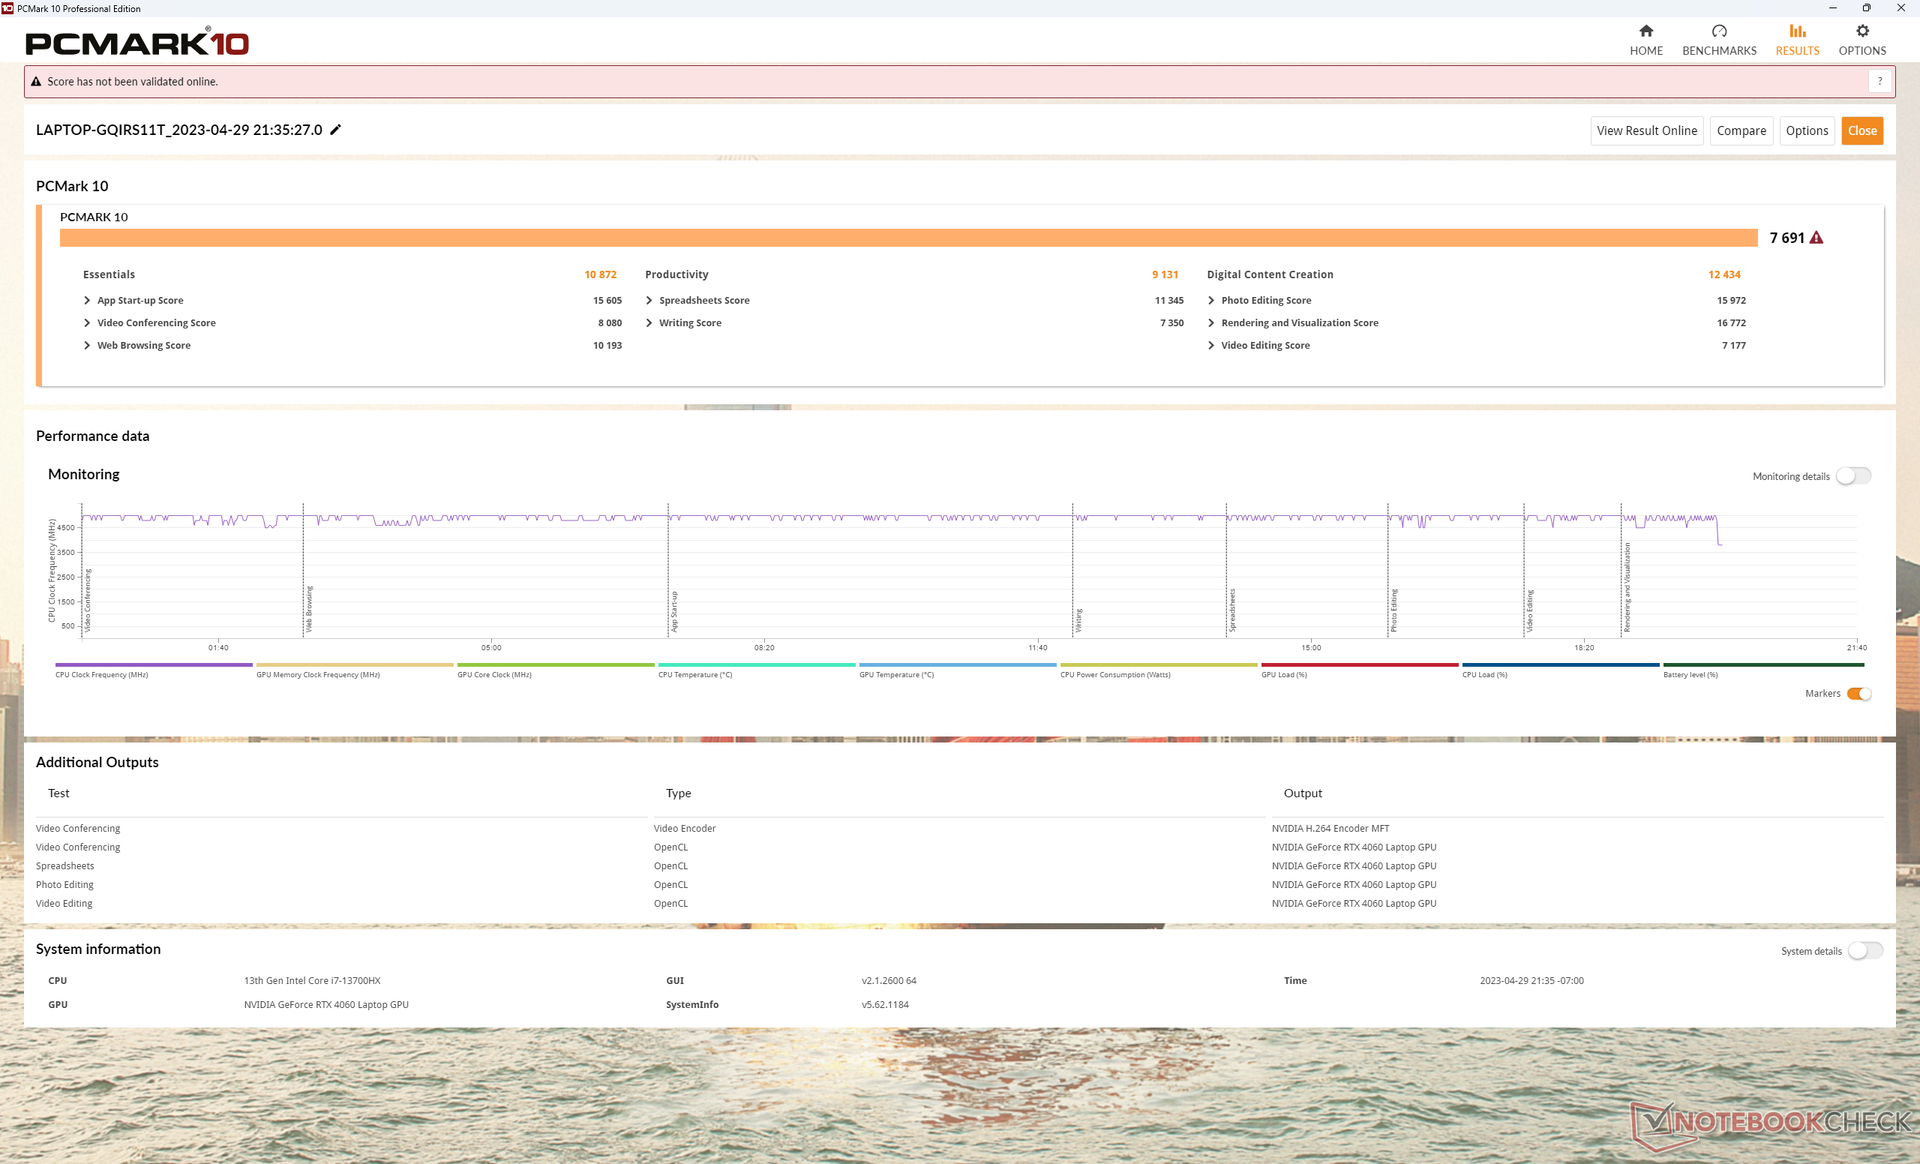
PCMark-resultaten är jämförbara med andra Legion -modeller, t.ex. 2022 Legion 5 Pro 16, trots den nyare generationens processorer i vår 2023-enhet. Detta tyder på att även om CPU:n och GPU:n kan vara snabbare den här gången, kommer de inte nödvändigtvis att köra vardagliga program som kontorsarbete eller webbläsare märkbart snabbare än en bärbar dator för spel från förr.
CrossMark: Overall | Productivity | Creativity | Responsiveness
| PCMark 10 / Score | |
| Razer Blade 16 Early 2023 | |
| Asus ROG Zephyrus M16 GU603Z | |
| Lenovo Legion Pro 7 16IRX8H | |
| Lenovo Legion Pro 5 16IRX8 | |
| Lenovo Legion S7 16ARHA7 | |
| Lenovo Legion 5 Pro 16ARH7H RTX 3070 Ti | |
| Genomsnitt Intel Core i7-13700HX, NVIDIA GeForce RTX 4060 Laptop GPU (6909 - 7743, n=5) | |
| PCMark 10 / Essentials | |
| Lenovo Legion Pro 7 16IRX8H | |
| Razer Blade 16 Early 2023 | |
| Asus ROG Zephyrus M16 GU603Z | |
| Lenovo Legion Pro 5 16IRX8 | |
| Lenovo Legion S7 16ARHA7 | |
| Genomsnitt Intel Core i7-13700HX, NVIDIA GeForce RTX 4060 Laptop GPU (9760 - 11313, n=5) | |
| Lenovo Legion 5 Pro 16ARH7H RTX 3070 Ti | |
| PCMark 10 / Productivity | |
| Lenovo Legion Pro 7 16IRX8H | |
| Asus ROG Zephyrus M16 GU603Z | |
| Lenovo Legion S7 16ARHA7 | |
| Genomsnitt Intel Core i7-13700HX, NVIDIA GeForce RTX 4060 Laptop GPU (9131 - 11018, n=5) | |
| Lenovo Legion 5 Pro 16ARH7H RTX 3070 Ti | |
| Lenovo Legion Pro 5 16IRX8 | |
| Razer Blade 16 Early 2023 | |
| PCMark 10 / Digital Content Creation | |
| Razer Blade 16 Early 2023 | |
| Lenovo Legion Pro 5 16IRX8 | |
| Asus ROG Zephyrus M16 GU603Z | |
| Lenovo Legion 5 Pro 16ARH7H RTX 3070 Ti | |
| Lenovo Legion S7 16ARHA7 | |
| Genomsnitt Intel Core i7-13700HX, NVIDIA GeForce RTX 4060 Laptop GPU (9393 - 12434, n=5) | |
| Lenovo Legion Pro 7 16IRX8H | |
| CrossMark / Overall | |
| Asus ROG Zephyrus M16 GU603Z | |
| Genomsnitt Intel Core i7-13700HX, NVIDIA GeForce RTX 4060 Laptop GPU (1663 - 2105, n=5) | |
| Lenovo Legion S7 16ARHA7 | |
| Lenovo Legion Pro 5 16IRX8 | |
| Lenovo Legion 5 Pro 16ARH7H RTX 3070 Ti | |
| Razer Blade 16 Early 2023 | |
| CrossMark / Productivity | |
| Asus ROG Zephyrus M16 GU603Z | |
| Genomsnitt Intel Core i7-13700HX, NVIDIA GeForce RTX 4060 Laptop GPU (1618 - 1989, n=5) | |
| Lenovo Legion S7 16ARHA7 | |
| Lenovo Legion Pro 5 16IRX8 | |
| Lenovo Legion 5 Pro 16ARH7H RTX 3070 Ti | |
| Razer Blade 16 Early 2023 | |
| CrossMark / Creativity | |
| Genomsnitt Intel Core i7-13700HX, NVIDIA GeForce RTX 4060 Laptop GPU (1710 - 2274, n=5) | |
| Asus ROG Zephyrus M16 GU603Z | |
| Lenovo Legion S7 16ARHA7 | |
| Razer Blade 16 Early 2023 | |
| Lenovo Legion 5 Pro 16ARH7H RTX 3070 Ti | |
| Lenovo Legion Pro 5 16IRX8 | |
| CrossMark / Responsiveness | |
| Asus ROG Zephyrus M16 GU603Z | |
| Genomsnitt Intel Core i7-13700HX, NVIDIA GeForce RTX 4060 Laptop GPU (1269 - 1983, n=5) | |
| Lenovo Legion Pro 5 16IRX8 | |
| Lenovo Legion S7 16ARHA7 | |
| Lenovo Legion 5 Pro 16ARH7H RTX 3070 Ti | |
| Razer Blade 16 Early 2023 | |
| PCMark 10 Score | 7691 poäng | |
Hjälp | ||
| AIDA64 / Memory Latency | |
| Razer Blade 16 Early 2023 | |
| Razer Blade 16 Early 2023 | |
| Razer Blade 16 Early 2023 | |
| Asus ROG Zephyrus M16 GU603Z | |
| Lenovo Legion 5 Pro 16ARH7H RTX 3070 Ti | |
| Genomsnitt Intel Core i7-13700HX (81.5 - 97.9, n=11) | |
| Lenovo Legion S7 16ARHA7 | |
| Lenovo Legion Pro 7 16IRX8H | |
| Lenovo Legion Pro 5 16IRX8 | |
* ... mindre är bättre
DPC-latenstid
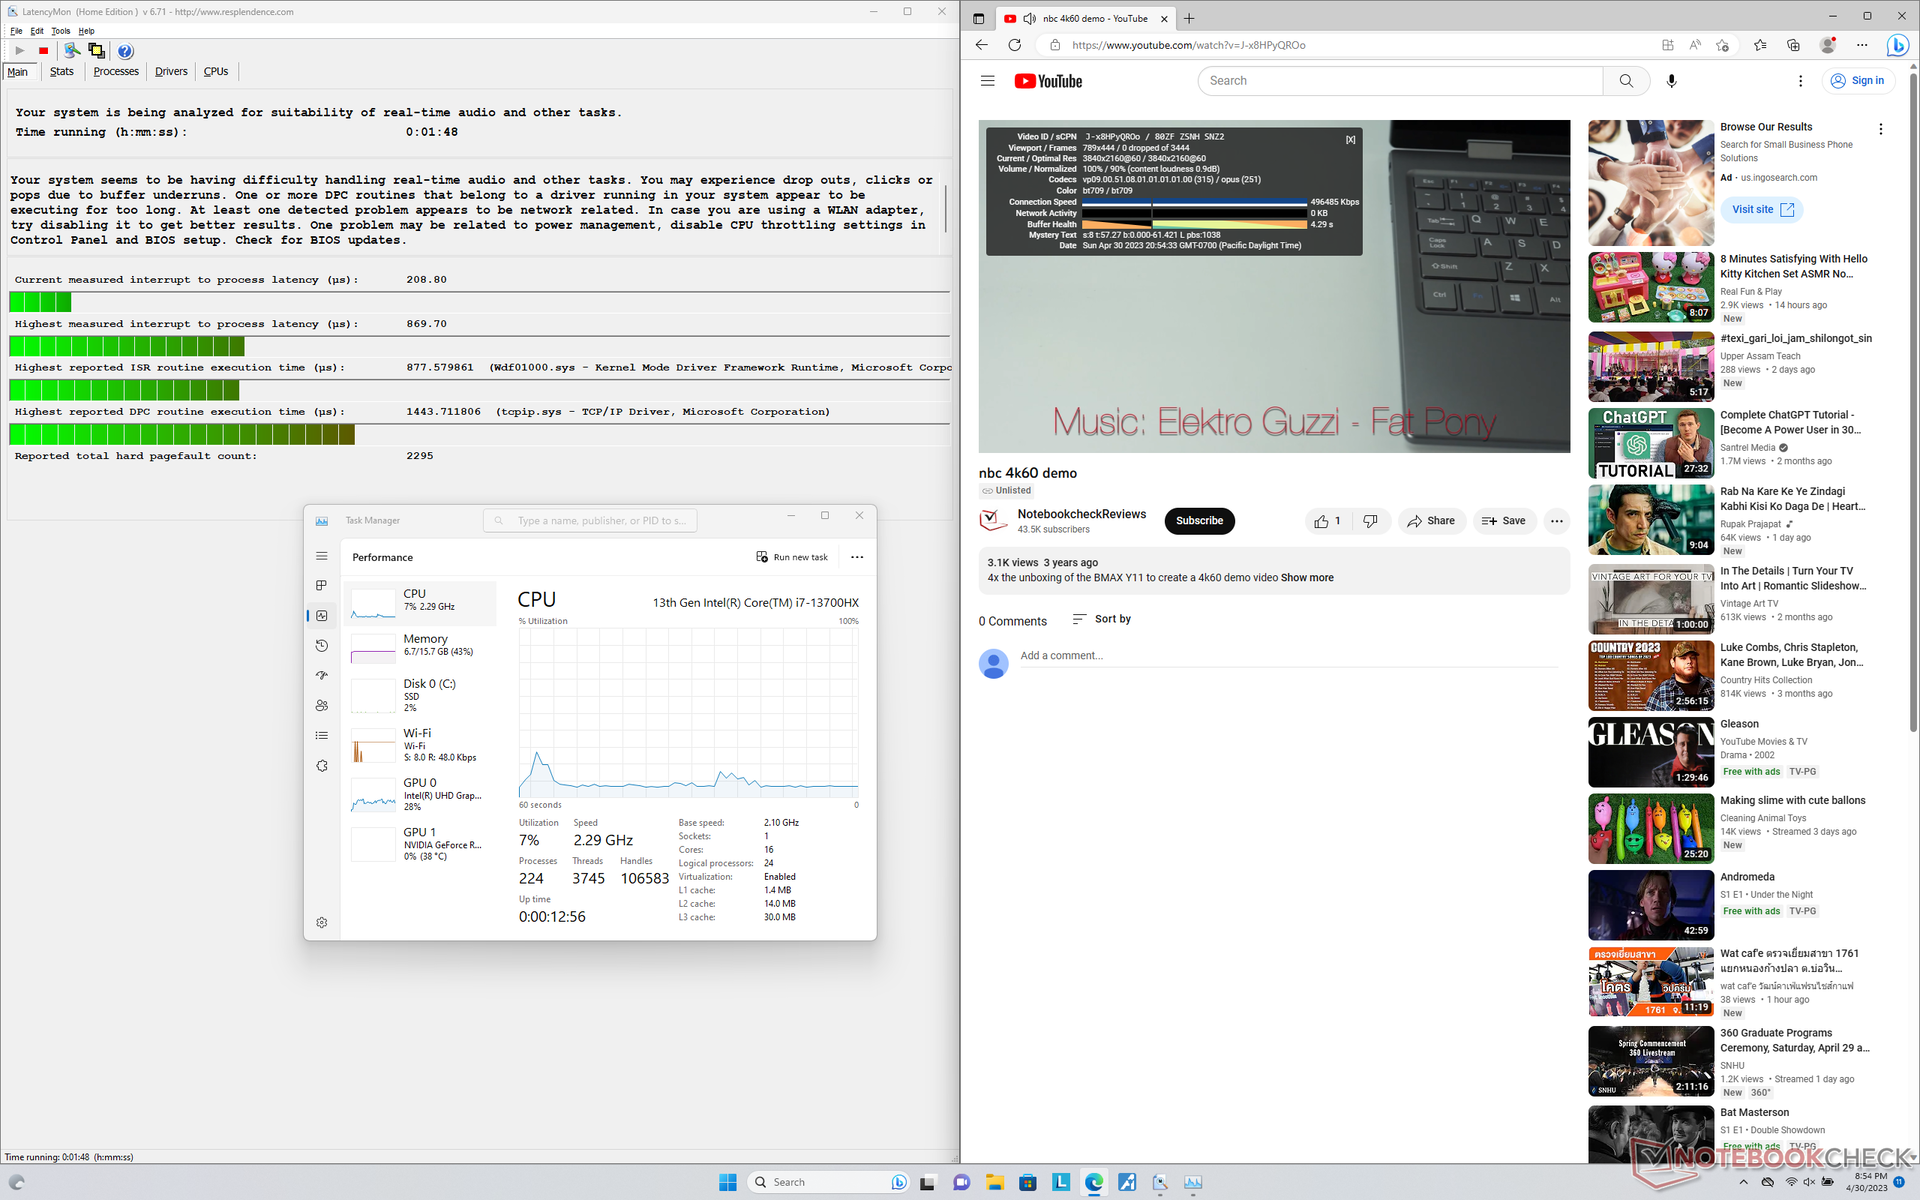
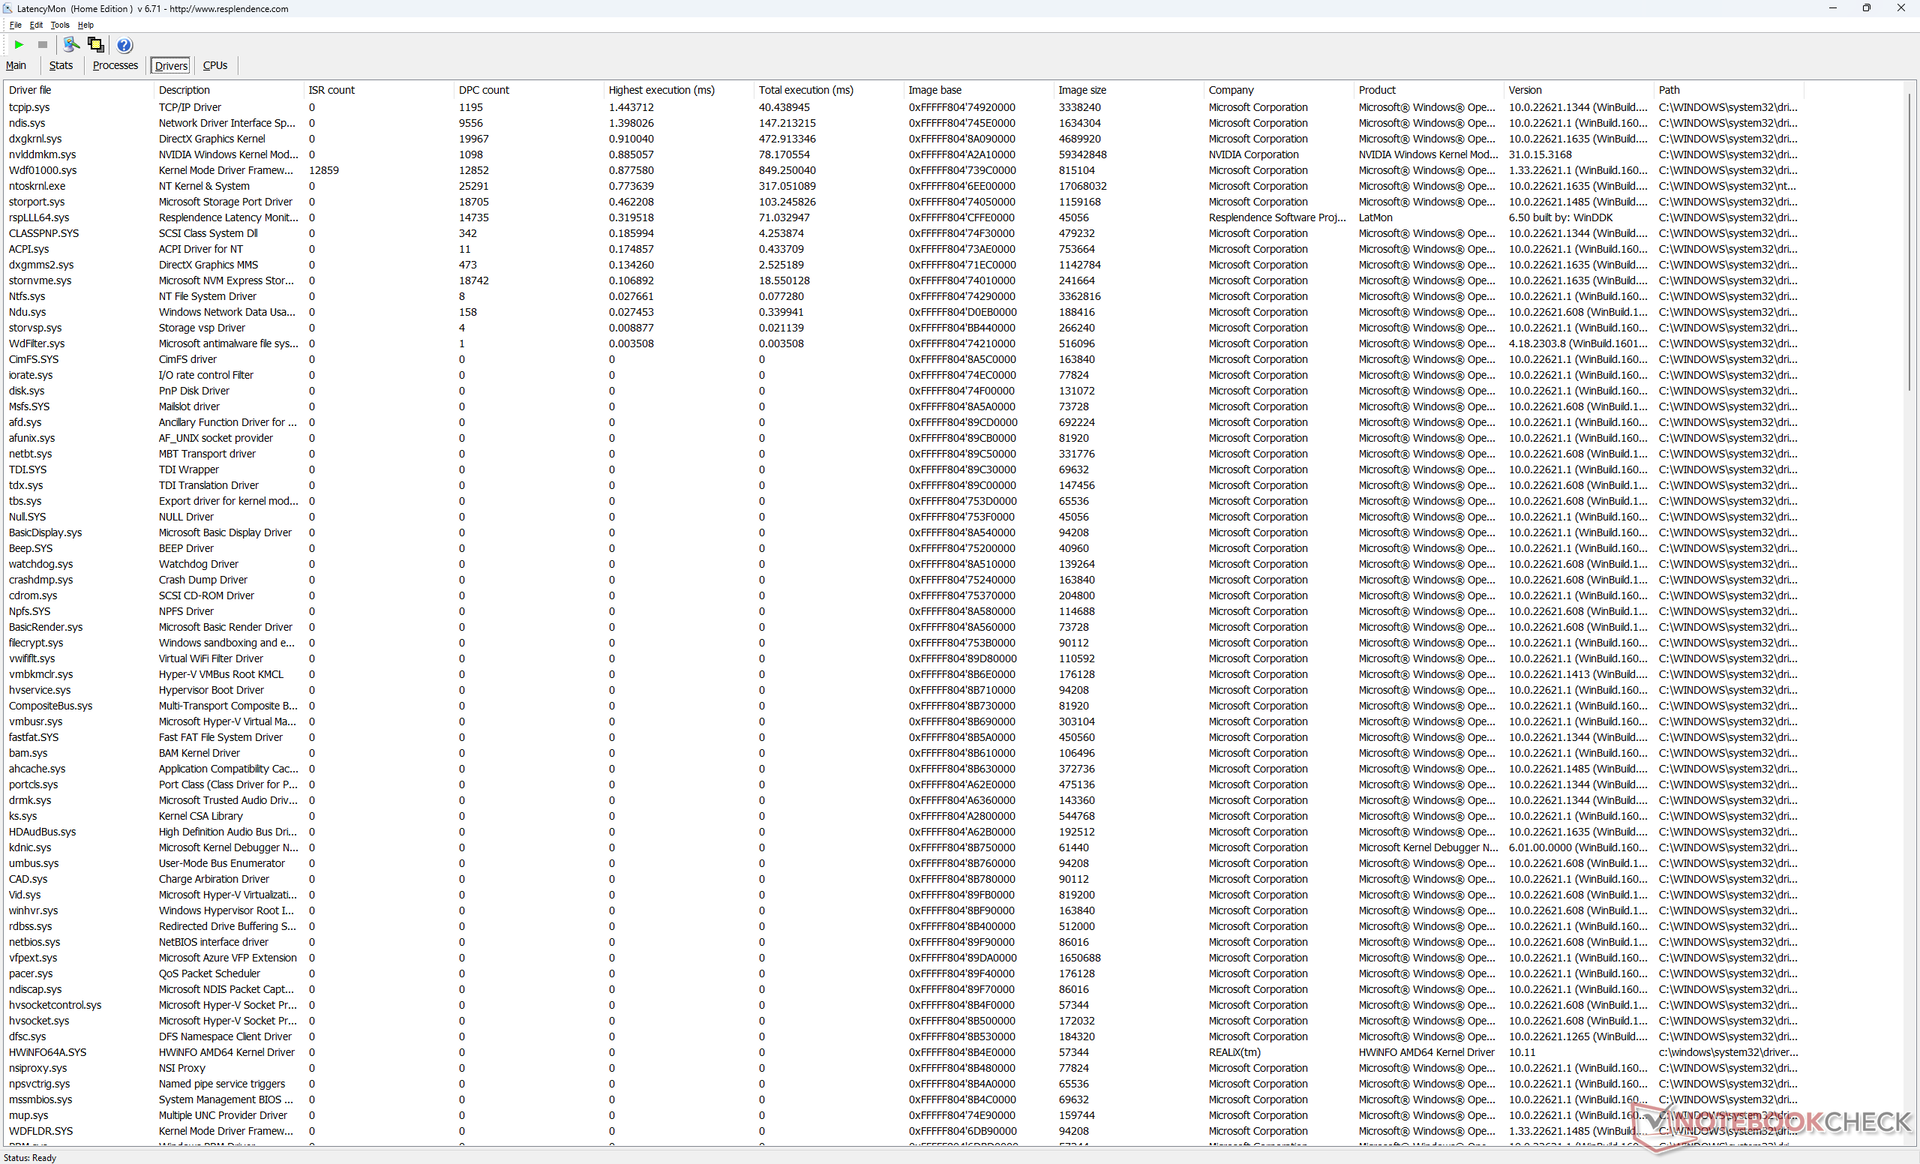
LatencyMon avslöjar mindre DPC-problem när du öppnar flera webbläsarflikar på vår hemsida även i iGPU-läge. uppspelning av 4K-video vid 60 FPS är annars perfekt utan några tappade bilder.
| DPC Latencies / LatencyMon - interrupt to process latency (max), Web, Youtube, Prime95 | |
| Razer Blade 16 Early 2023 | |
| Asus ROG Zephyrus M16 GU603Z | |
| Lenovo Legion S7 16ARHA7 | |
| Lenovo Legion Pro 5 16IRX8 | |
| Lenovo Legion 5 Pro 16ARH7H RTX 3070 Ti | |
| Lenovo Legion Pro 7 16IRX8H | |
* ... mindre är bättre
Lagringsenheter - upp till två PCIe4 x4-enheter
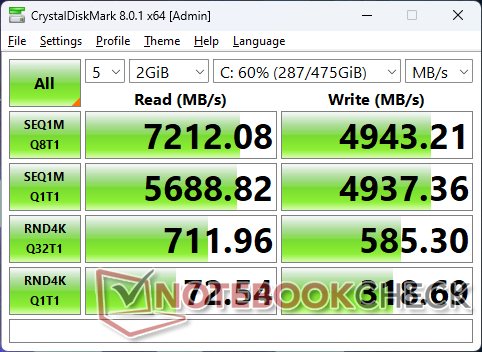
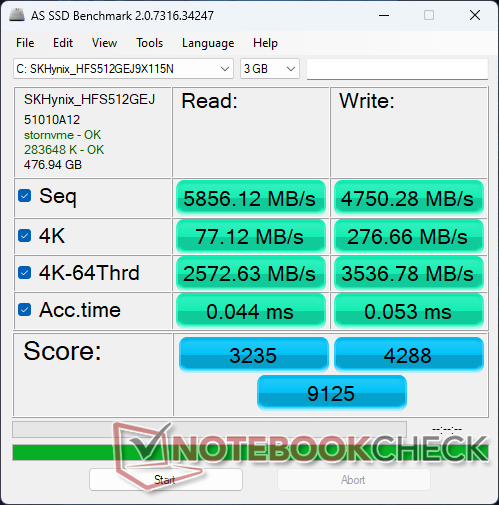
Vår enhet använder samma PCIe4 x4 512 GB SK Hynix-enhet som finns i Lenovo Legion S7 16. Prestandan är utmärkt med sekventiell läs- och skrivhastighet som närmar sig 7200 MB/s respektive 5000 MB/s, vilket kan konkurrera med den populära Samsung PM9A1. Trots detta finns det fortfarande utrymme för förbättringar eftersom överföringshastigheterna periodvis kan strypas till 6300 MB/s i stället för att bibehålla ett platt maximum på 7200 MB/s.

* ... mindre är bättre
Disk Throttling: DiskSpd Read Loop, Queue Depth 8
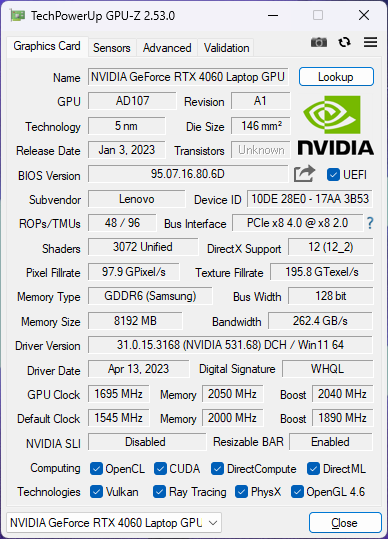
GPU-prestanda - GeForce RTX 4060
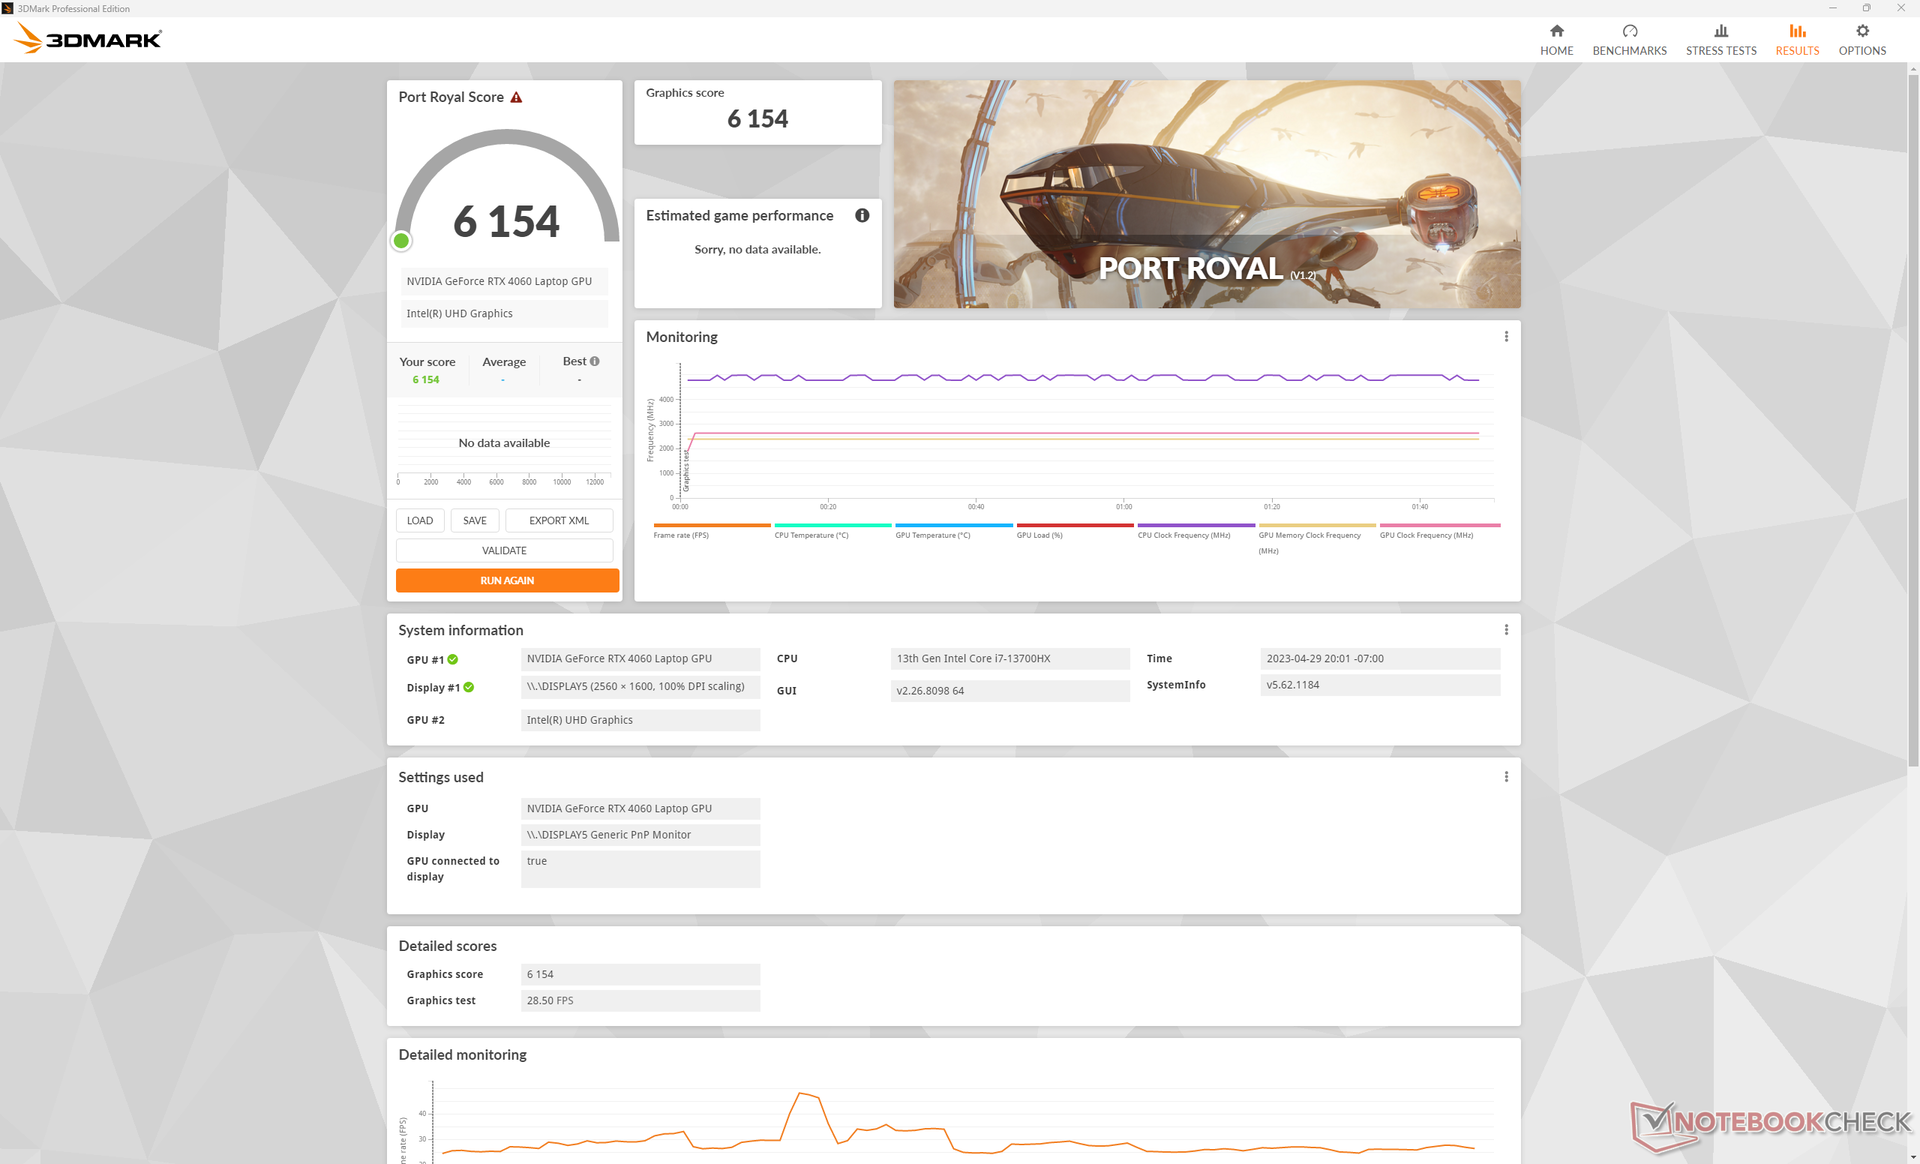
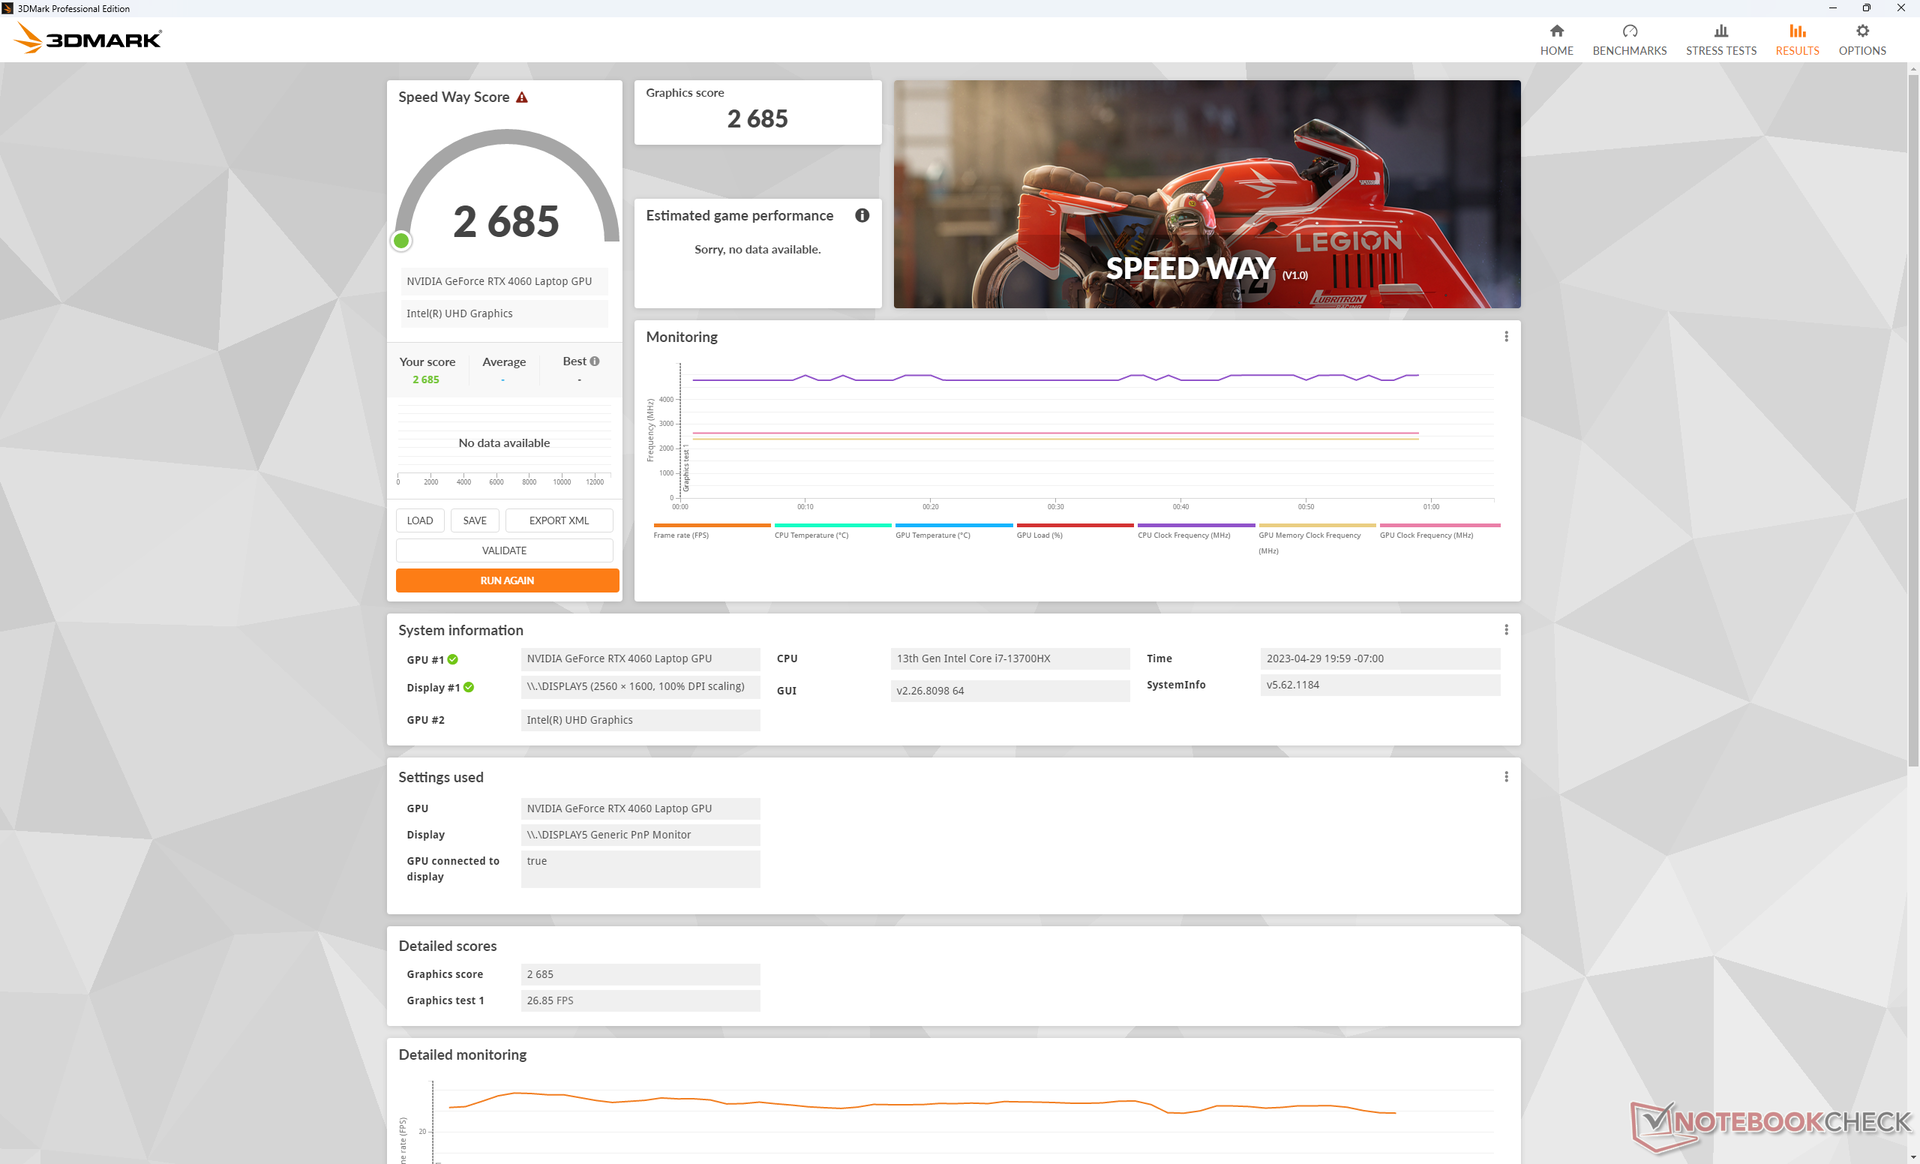
Grafikprestanda är 10 till 15 procent snabbare än den genomsnittliga bärbara datorn i vår databas med samma mobil GeForce RTX 4060 GPU. Således kan Legion Pro 5 16 vara ett bra alternativ för dem som vill maximera grafikprestandan. Den MSI Cyborg 15, till exempel, har samma GPU men den siktar på en mycket lägre 45 W TGP för långsammare prestanda överlag.
Förra årets rTX 3070 Ti är något snabbare än vårt mobila RTX 4060 med cirka 15 procent. Uppgradering från en Bärbar RTX 3060 till vårt RTX 4060 kommer att förbättra prestandan med cirka 20-25 procent, vilket inte är dåligt för ett mellanklasskort. Du måste spela titlar som stöder DLSS3 för att bättre utnyttja RTX 4060 eftersom funktionen inte är tillgänglig på GeForce 30 GPU:er.
Uppgradering till RTX 4070 SKU kommer att förbättra grafikprestandan med 15 till 20 procent jämfört med vårt RTX 4060. För RTX 4080- eller RTX 4090-alternativ måste du dock överväga den högre utrustningen i Legion 7 Pro-serien istället.
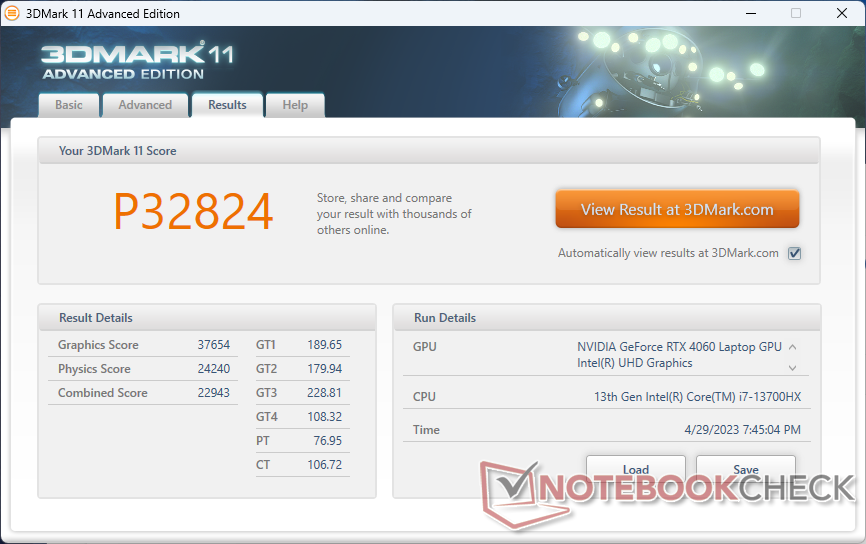
| 3DMark 11 Performance | 32824 poäng | |
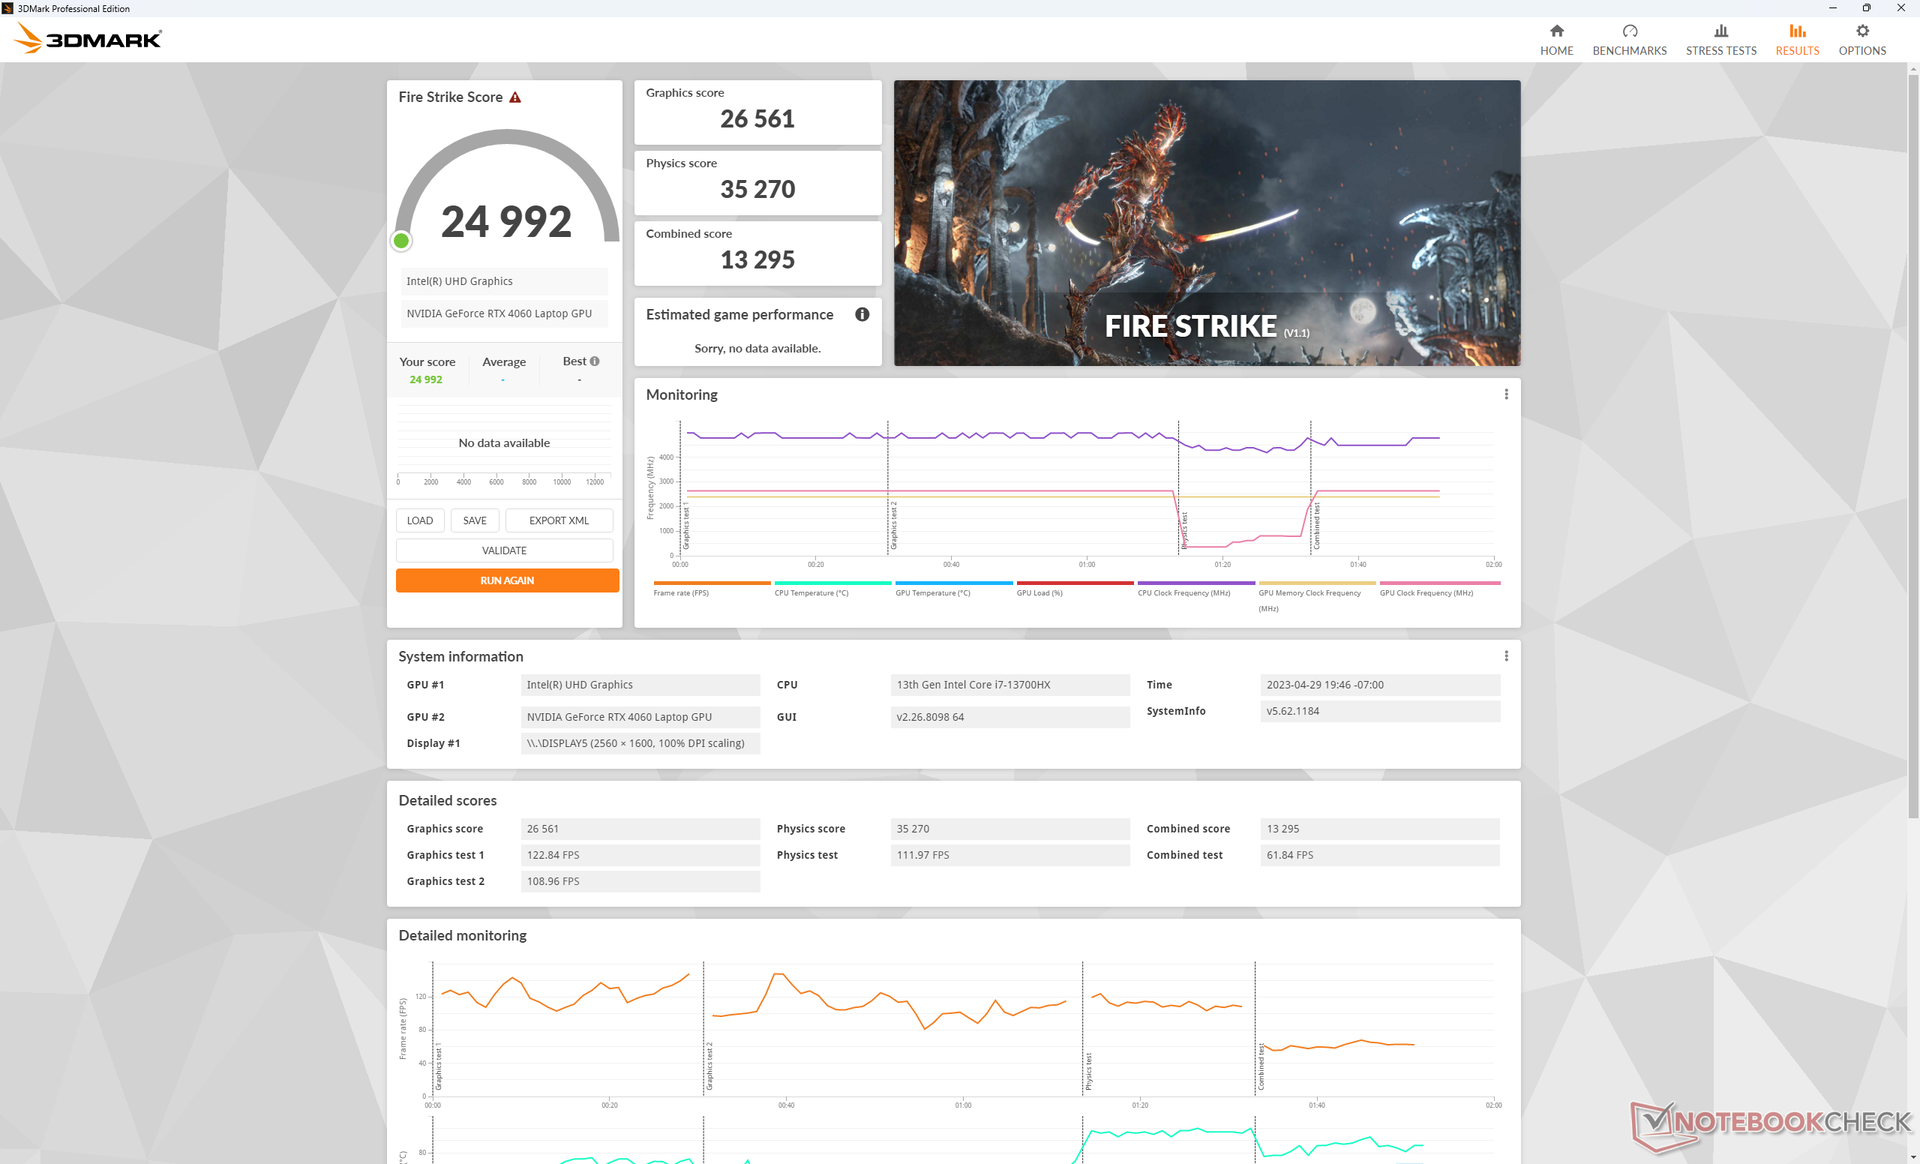
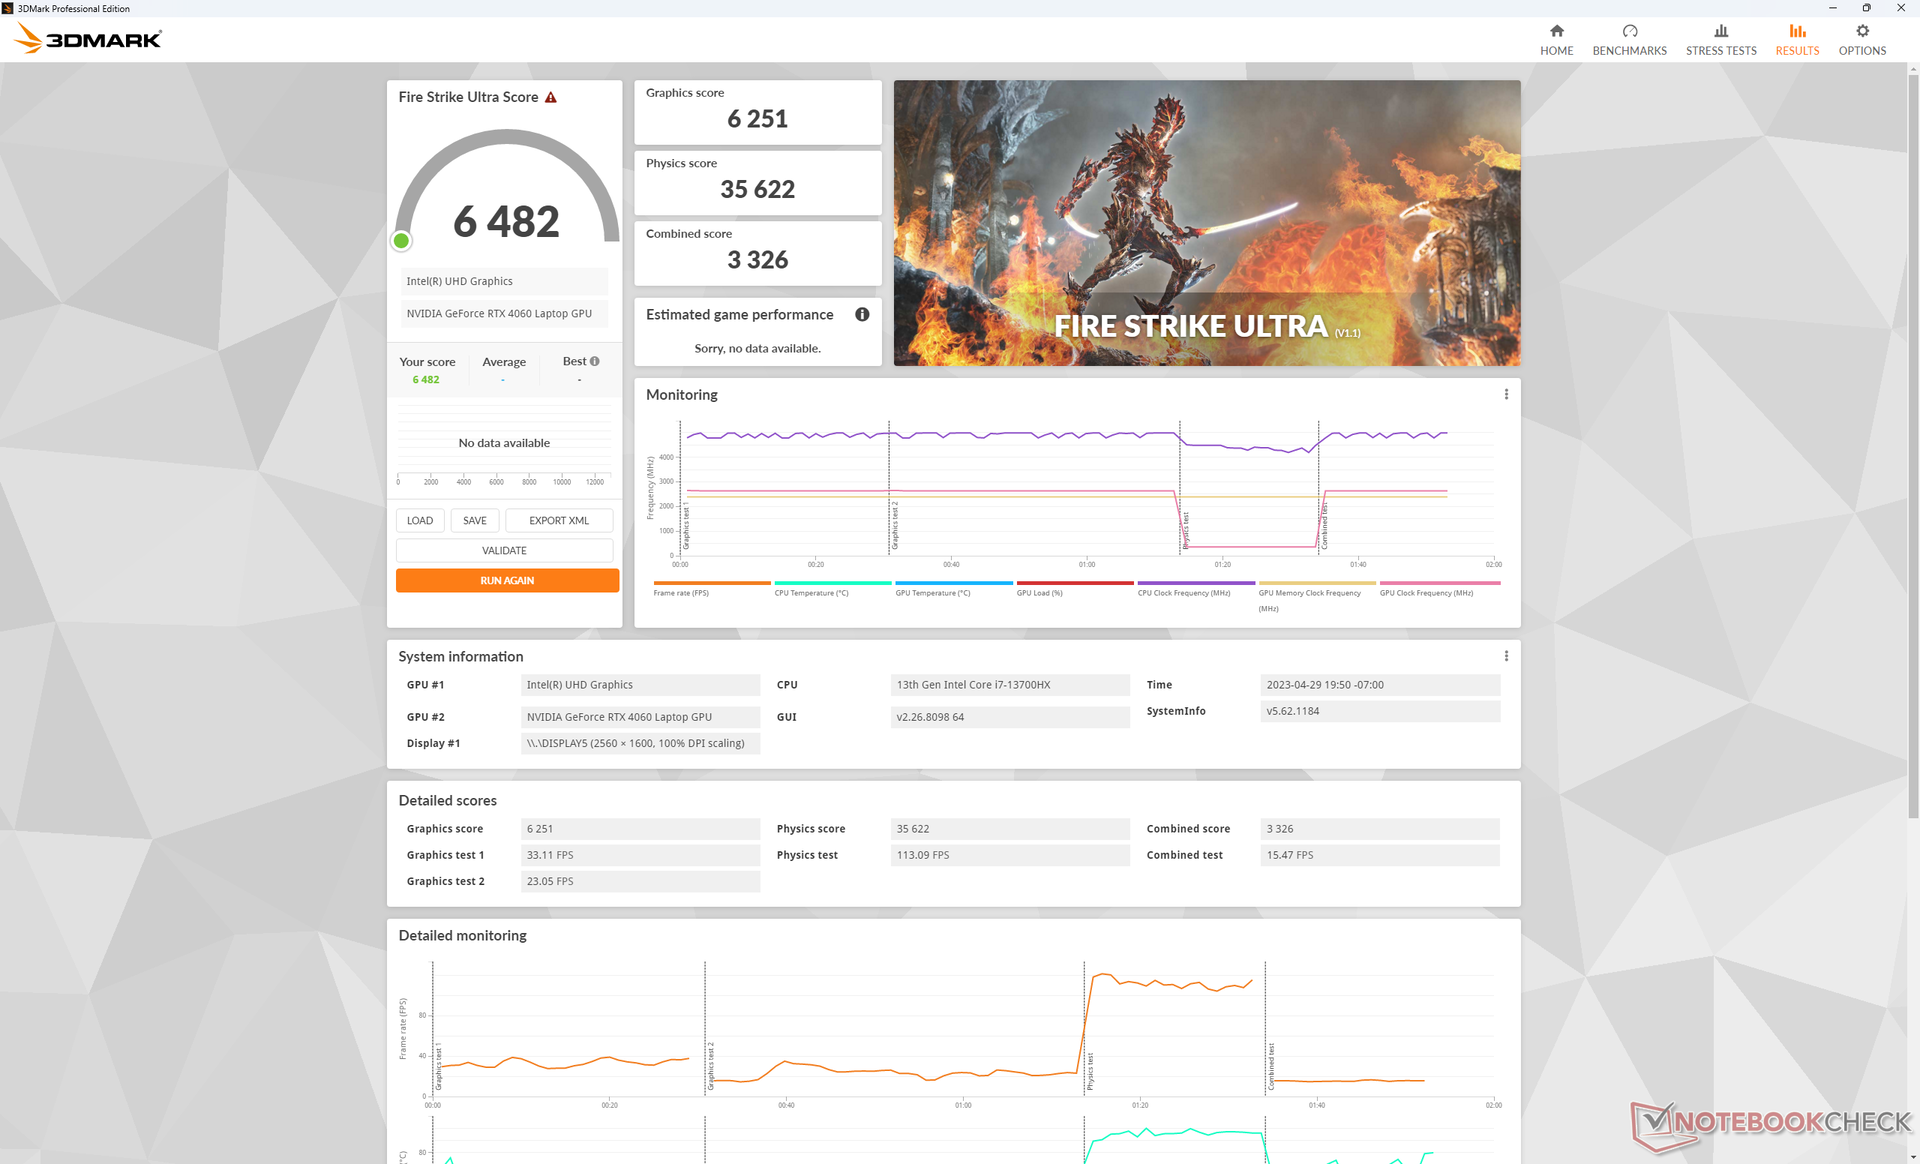
| 3DMark Fire Strike Score | 24992 poäng | |
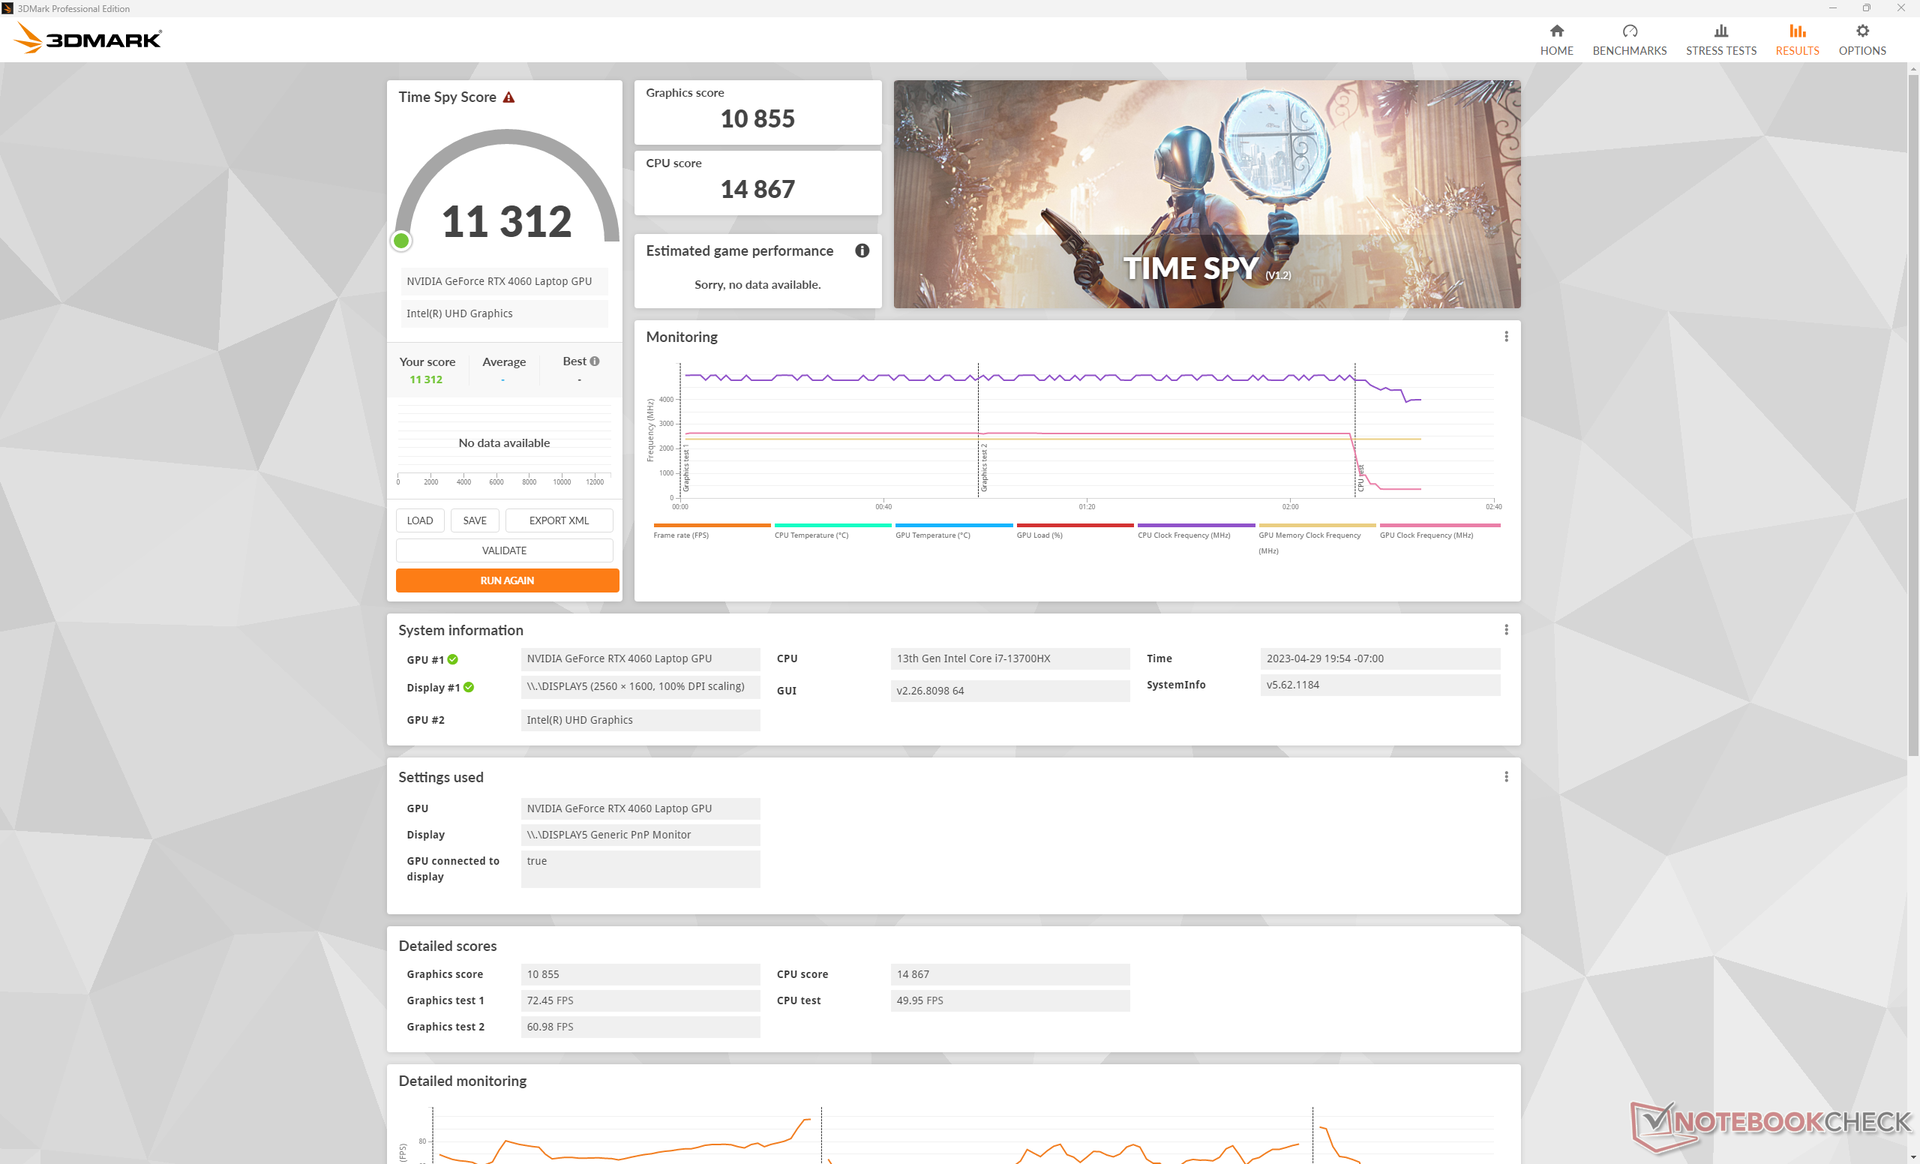
| 3DMark Time Spy Score | 11312 poäng | |
Hjälp | ||
* ... mindre är bättre
Spelprestanda
Alla aktuella titlar kan köra långt över 60 FPS vid 1080p ultrainställningar. För att köra i den ursprungliga QHD+-upplösningen krävs det dock att du sänker vissa inställningar, särskilt för krävande titlar som Returnal eller F1 2022. Att nå stabila 165 FPS för att matcha 165 Hz uppdateringsfrekvens är svårt för de flesta titlar med RTX 3060 i mellanklassen. Istället rekommenderar vi att du siktar på 50 till 100 FPS med G-Sync aktiverat för att minska skärmtårar.
| Returnal | |
| 1920x1080 Low Preset | |
| Genomsnitt NVIDIA GeForce RTX 4060 Laptop GPU (71 - 99, n=5) | |
| Lenovo Legion Pro 5 16IRX8 | |
| 1920x1080 Medium Preset | |
| Genomsnitt NVIDIA GeForce RTX 4060 Laptop GPU (68 - 93, n=5) | |
| Lenovo Legion Pro 5 16IRX8 | |
| 1920x1080 High Preset | |
| Lenovo Legion Pro 5 16IRX8 | |
| Genomsnitt NVIDIA GeForce RTX 4060 Laptop GPU (63 - 87, n=6) | |
| 1920x1080 Epic Preset | |
| Lenovo Legion Pro 5 16IRX8 | |
| Genomsnitt NVIDIA GeForce RTX 4060 Laptop GPU (57 - 75, n=6) | |
| 2560x1440 Epic Preset | |
| Genomsnitt NVIDIA GeForce RTX 4060 Laptop GPU (39 - 59.4, n=5) | |
| Lenovo Legion Pro 5 16IRX8 | |
| 3840x2160 Epic Preset | |
| Genomsnitt NVIDIA GeForce RTX 4060 Laptop GPU (25 - 29, n=2) | |
| Lenovo Legion Pro 5 16IRX8 | |
Witcher 3 FPS Chart
| låg | med. | hög | ultra | QHD | 4K | |
|---|---|---|---|---|---|---|
| GTA V (2015) | 186.7 | 184 | 178.9 | 119.6 | 88.9 | 85.5 |
| The Witcher 3 (2015) | 521.8 | 369.3 | 215.8 | 107.6 | 67.2 | |
| Dota 2 Reborn (2015) | 196.6 | 176.5 | 170.3 | 161.8 | 142.9 | |
| Final Fantasy XV Benchmark (2018) | 222 | 161.2 | 109.8 | 79.4 | 45.4 | |
| X-Plane 11.11 (2018) | 177.4 | 156.3 | 121.9 | 104.4 | ||
| Cyberpunk 2077 1.6 (2022) | 150.7 | 136.6 | 106 | 87.4 | 51.7 | 22.9 |
| Tiny Tina's Wonderlands (2022) | 234.6 | 192.3 | 121.2 | 92.7 | 64.2 | 33.6 |
| F1 22 (2022) | 276 | 274 | 208 | 70.1 | 44.8 | 21.5 |
| Returnal (2023) | 81 | 79 | 75 | 70 | 48 | 25 |
Utsläpp
Systemljud - Beteende vid konstant fläktvarvtal
Fläktljudet vid låg belastning som surfning eller videostreaming tenderar att stabiliseras på 26,6 dB(A) mot en tyst bakgrund på 23 dB(A). Det är tillräckligt högt för att vara hörbart, men inte störande. Fläktarna är tack och lov stabila i varvtal och pulserar inte frekvent i detta tillstånd även när de är i prestandaläget.
Fläktljud vid drift Witcher 3 på Performance skulle stabiliseras på 47,6 dB(A) jämfört med 55 dB(A) vardera på förra årets Legion Pro 5 16 med RTX 3070 Ti grafik och årets Legion Pro 7. Om CPU och GPU belastas betydligt mer, t.ex. med benchmarks eller med mycket krävande spel, kan dock vår Legion Pro 5 16 nå samma 55 dB(A) maximalt.
Spel i balanserat läge är något tystare med 46 dB(A) jämfört med de 47,6 dB(A) som nämns ovan. Skillnaden är så liten att det inte finns någon större anledning att använda Balanced-läget i de flesta spelscenarier...
Ljudnivå
| Låg belastning |
| 23.1 / 23.1 / 26.6 dB(A) |
| Hög belastning |
| 34.7 / 54.8 dB(A) |
 | ||
30 dB tyst 40 dB(A) hörbar 50 dB(A) högt ljud |
||
min: | ||
| Lenovo Legion Pro 5 16IRX8 GeForce RTX 4060 Laptop GPU, i7-13700HX, SK hynix PC801 HFS512GEJ9X115N | Asus ROG Zephyrus M16 GU603Z GeForce RTX 3070 Ti Laptop GPU, i9-12900H, Micron 3400 1TB MTFDKBA1T0TFH | Razer Blade 16 Early 2023 GeForce RTX 4080 Laptop GPU, i9-13950HX, SSSTC CA6-8D1024 | Lenovo Legion Pro 7 16IRX8H GeForce RTX 4080 Laptop GPU, i9-13900HX, Samsung PM9A1 MZVL21T0HCLR | Lenovo Legion 5 Pro 16ARH7H RTX 3070 Ti GeForce RTX 3070 Ti Laptop GPU, R7 6800H, Samsung PM9A1 MZVL21T0HCLR | Lenovo Legion S7 16ARHA7 Radeon RX 6800S, R9 6900HX, SK Hynix HFS001TEJ9X115N | |
|---|---|---|---|---|---|---|
| Noise | -16% | -0% | -17% | -12% | 3% | |
| av / miljö * (dB) | 23 | 23 -0% | 23 -0% | 24 -4% | 23.5 -2% | 23.1 -0% |
| Idle Minimum * (dB) | 23.1 | 23 -0% | 23 -0% | 26 -13% | 23.7 -3% | 23.1 -0% |
| Idle Average * (dB) | 23.1 | 24 -4% | 23 -0% | 28 -21% | 31.1 -35% | 23.1 -0% |
| Idle Maximum * (dB) | 26.6 | 47 -77% | 23.6 11% | 34 -28% | 32.2 -21% | 23.1 13% |
| Load Average * (dB) | 34.7 | 47.91 -38% | 39 -12% | 47 -35% | 38.4 -11% | 31.4 10% |
| Witcher 3 ultra * (dB) | 47.6 | 48.91 -3% | 51.6 -8% | 55 -16% | 54.8 -15% | 51.4 -8% |
| Load Maximum * (dB) | 54.8 | 50.25 8% | 51.3 6% | 56 -2% | 54.8 -0% | 51.2 7% |
* ... mindre är bättre
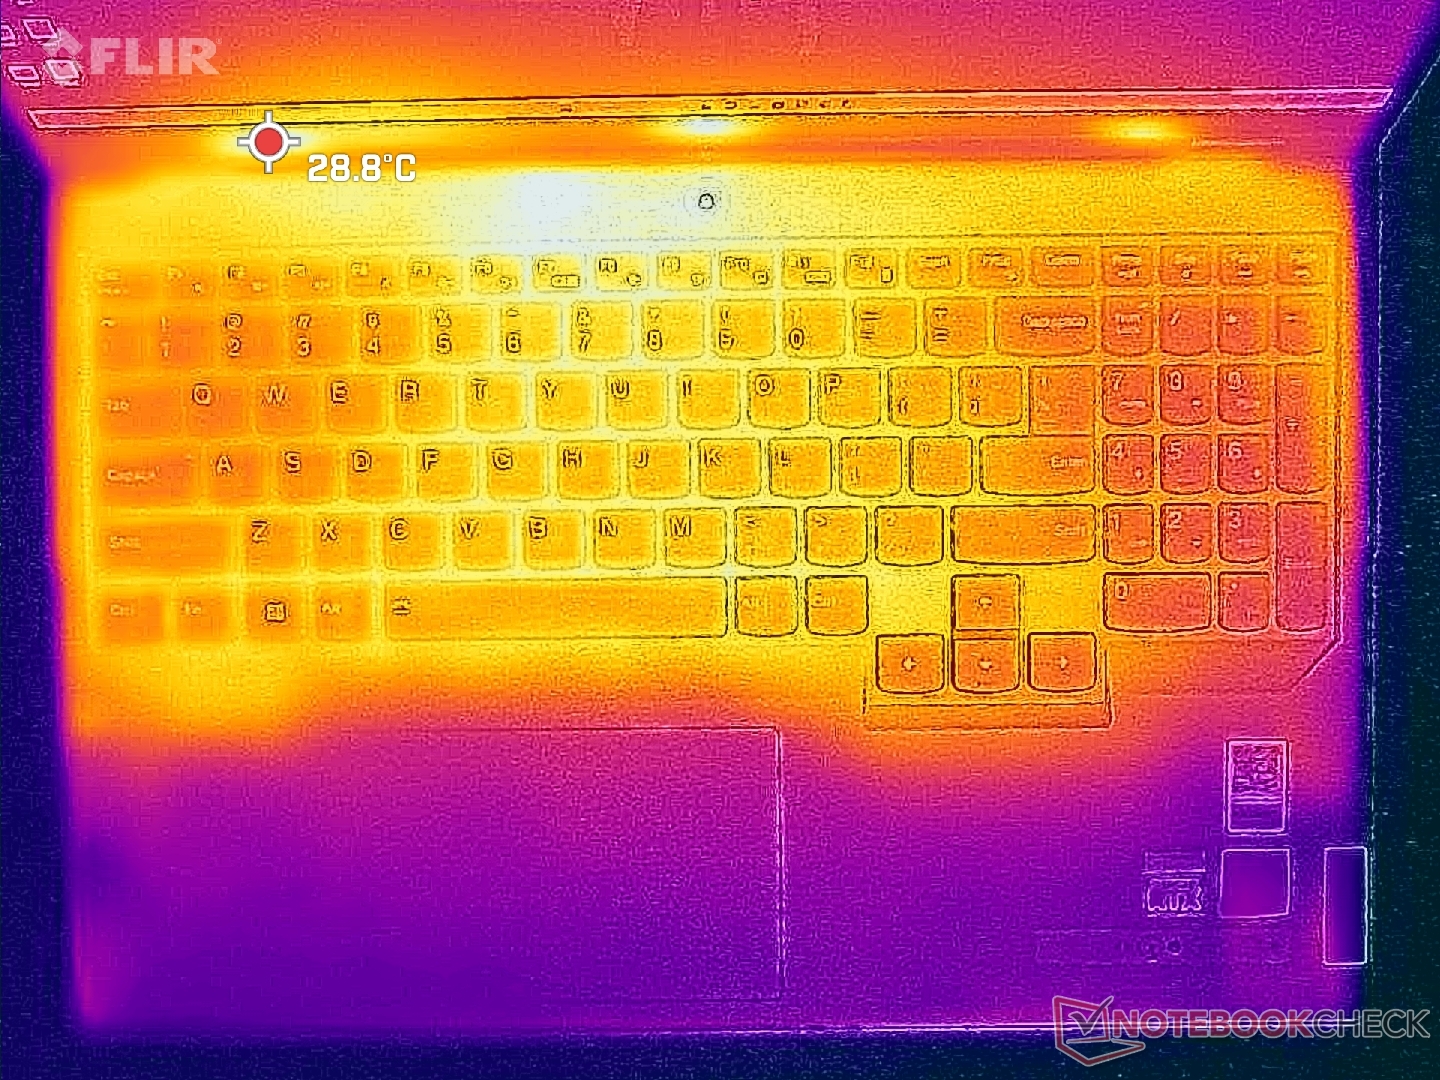
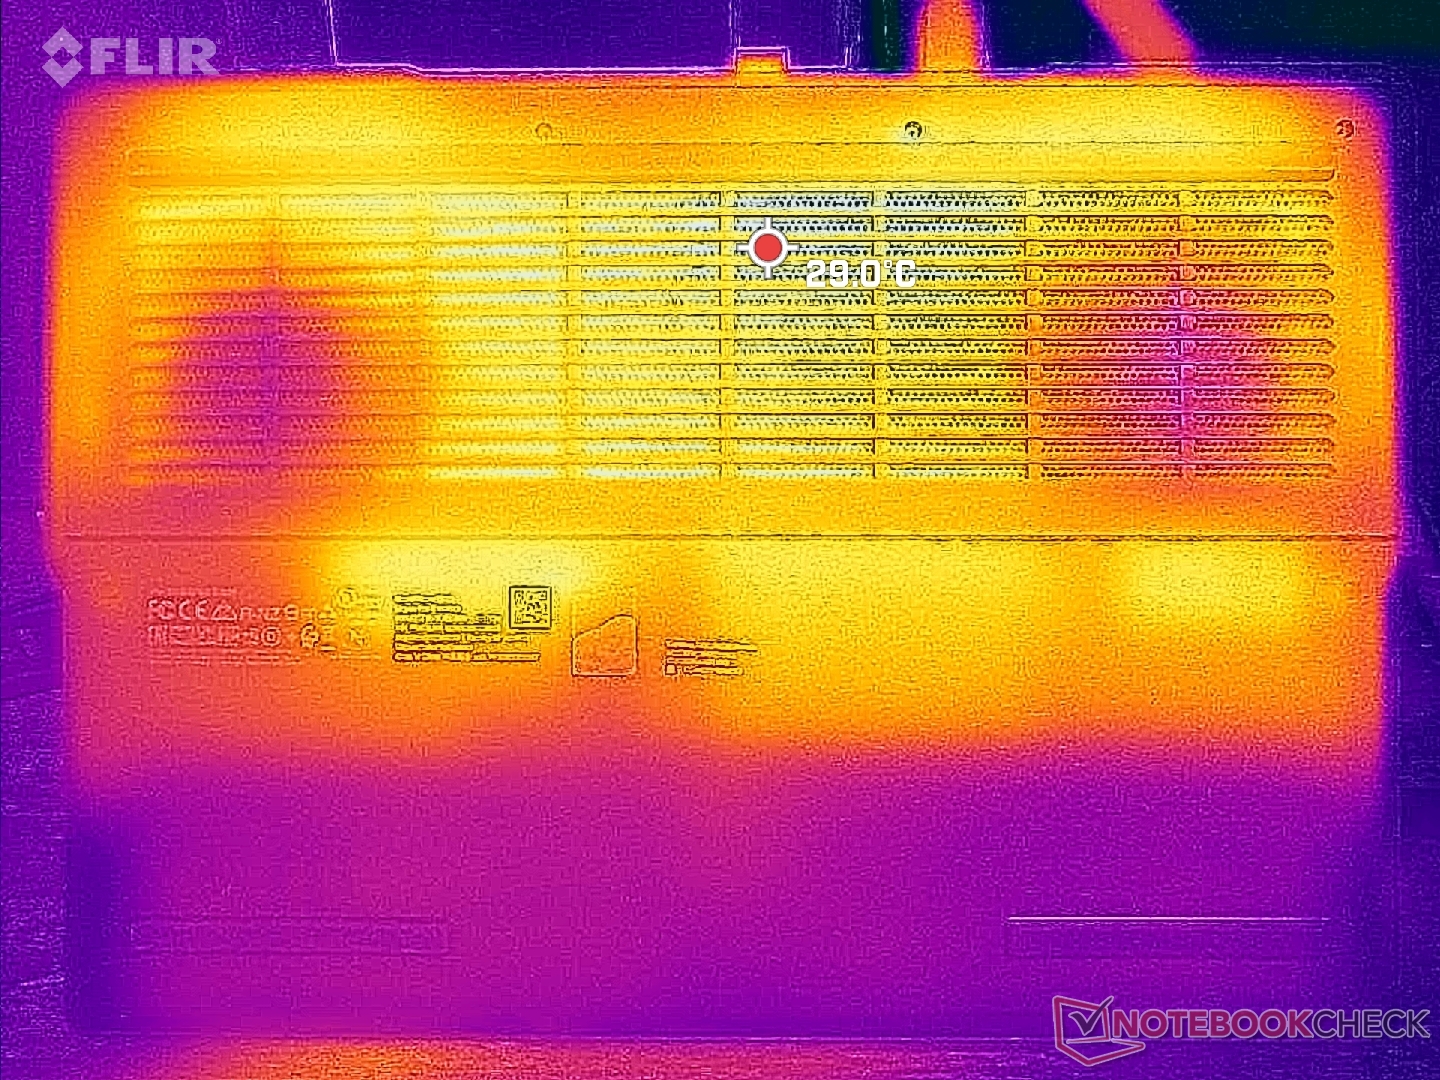
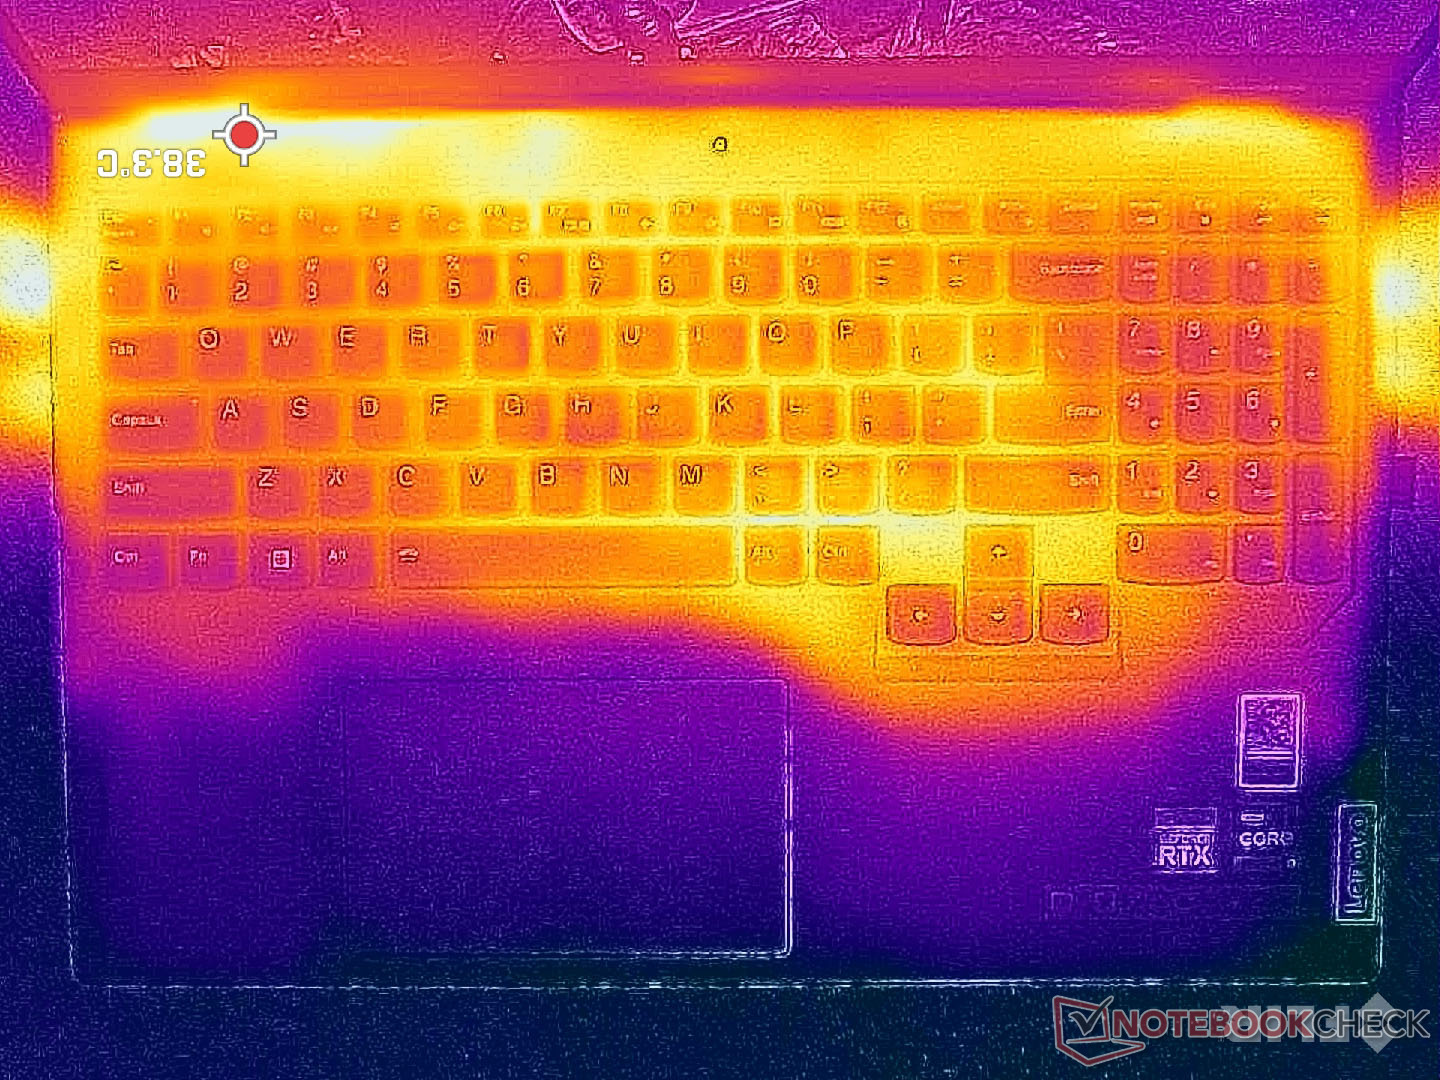
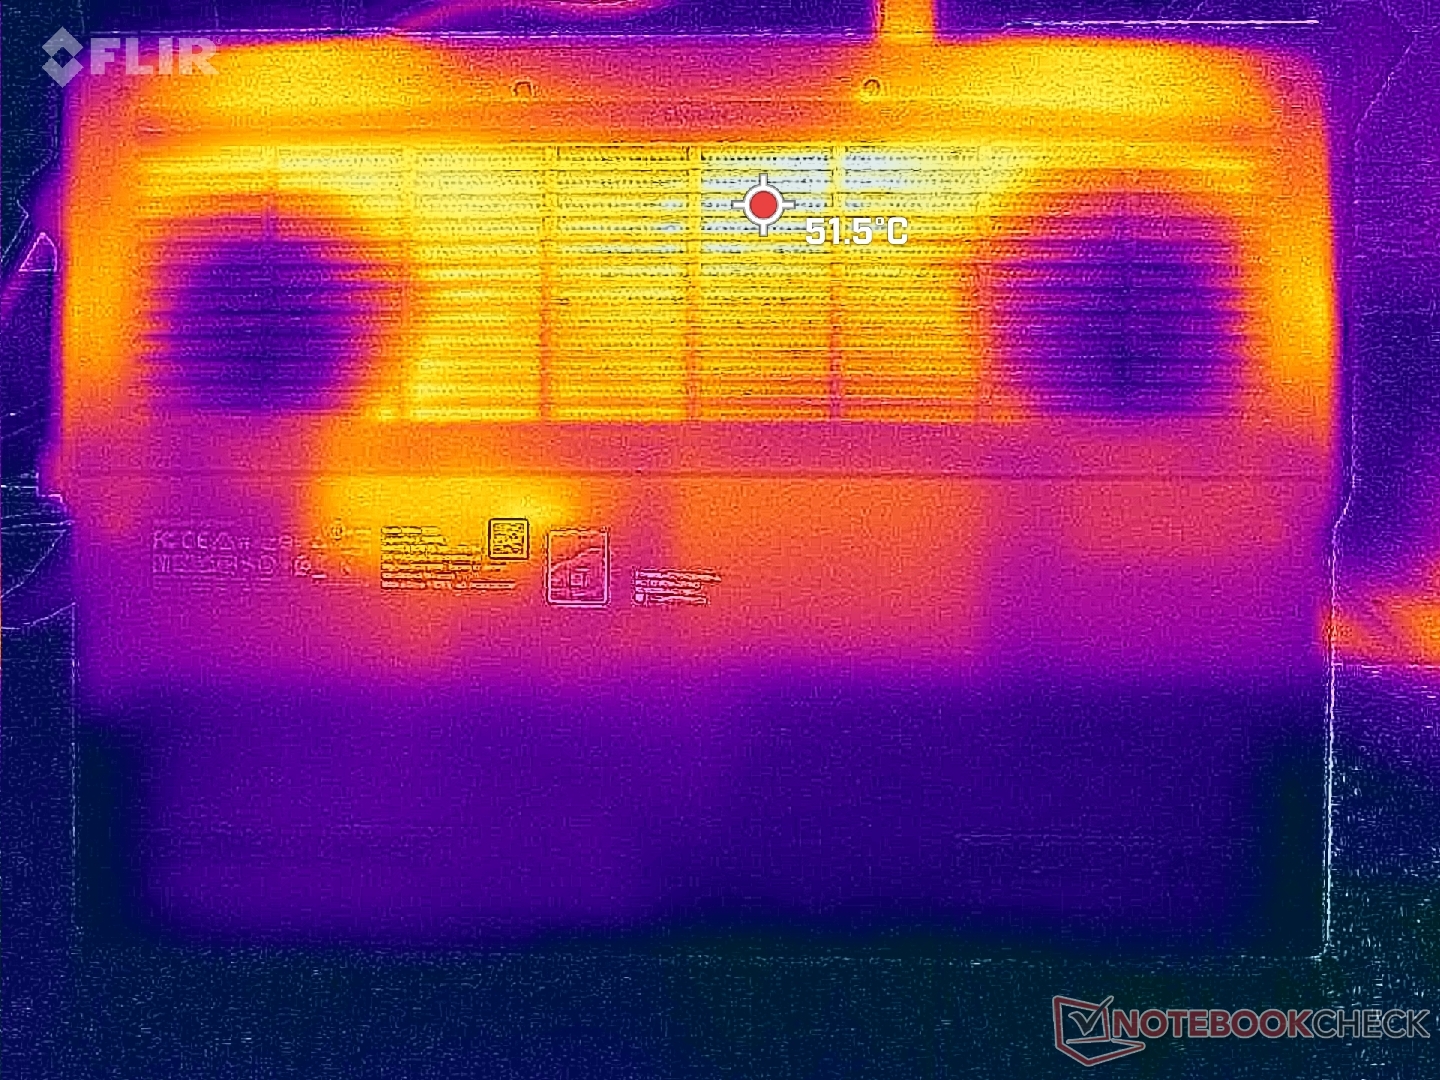
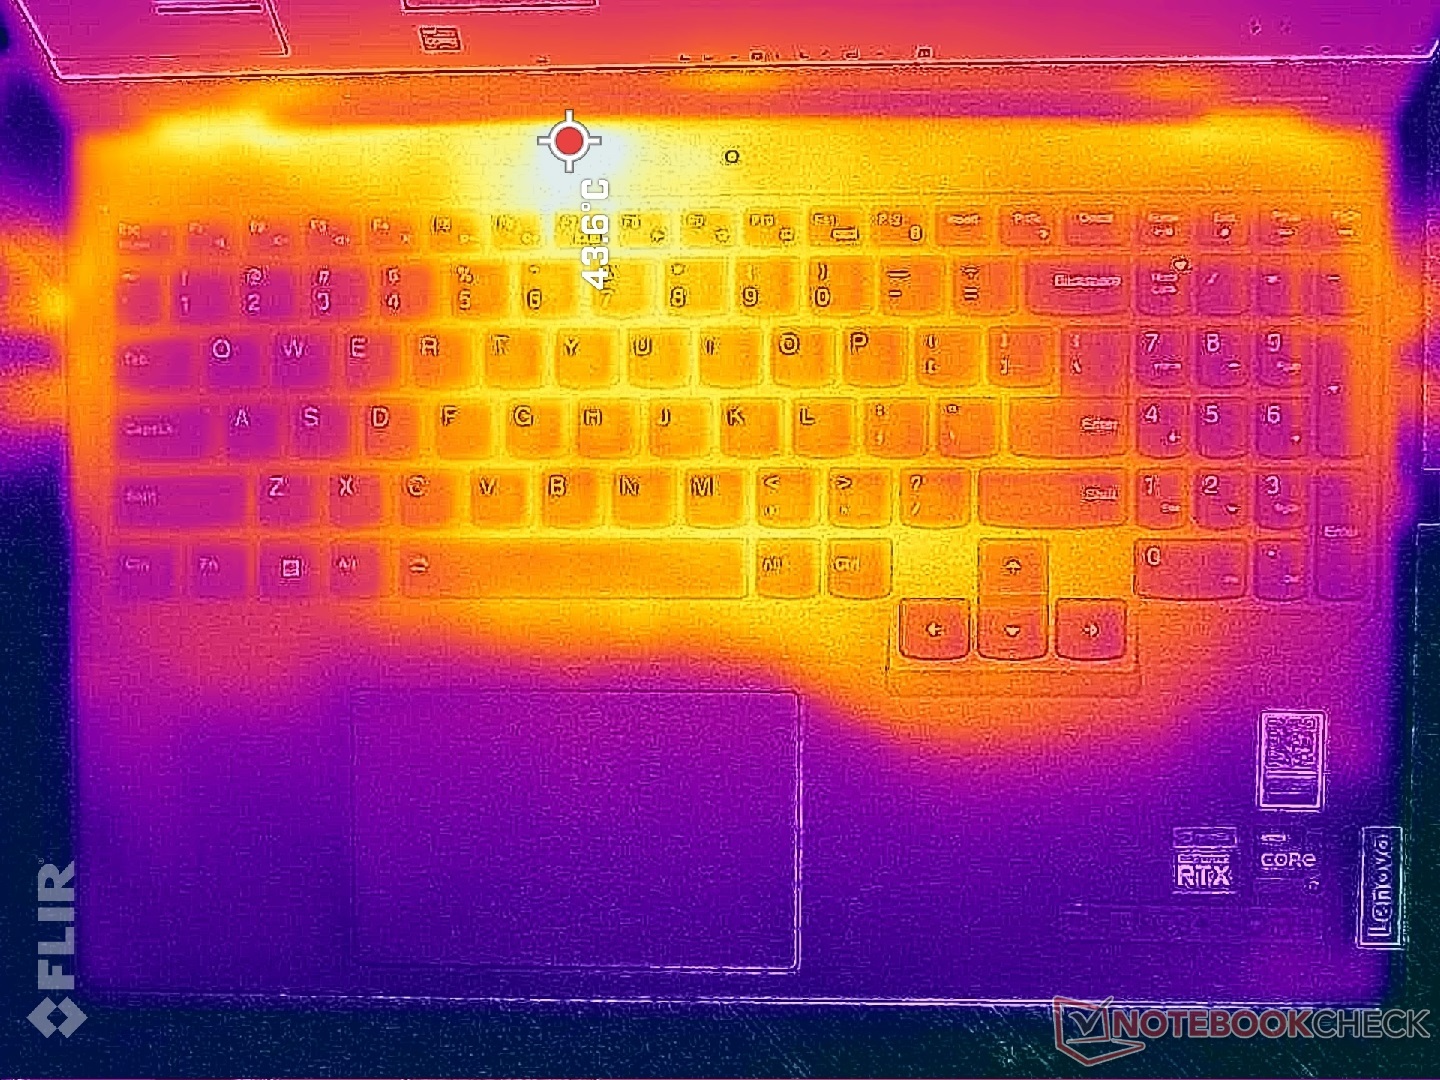
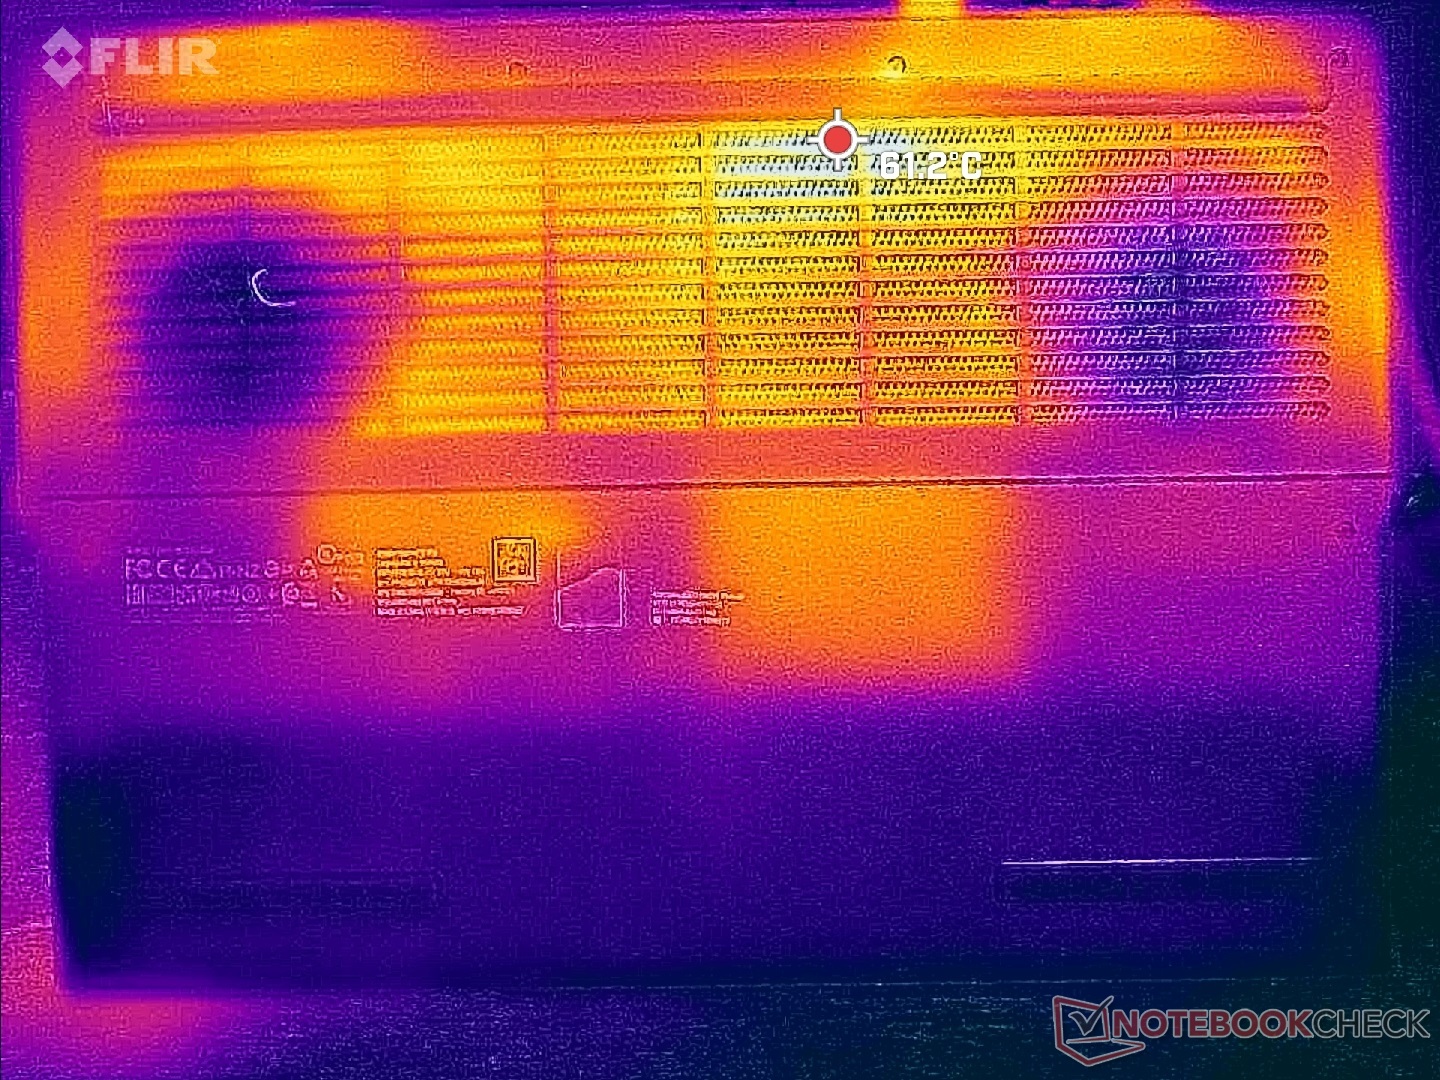
Temperatur - Cool Palm Rests
Yttemperaturen när spel körs kan vara så varm som 43 °C till 50 °C på över- och undersidan. Dessa varma punkter är tack och lov koncentrerade till baksidan där det är osannolikt att huden kommer i kontakt med den. Den tunnare ROG Zephyrus M16 kan vara ännu varmare i genomsnitt och med större hot spots.
Sidorna av tangentbordet är generellt svalare än mitten med några grader C eftersom fläktarna är placerade direkt under, vilket temperaturkartorna nedan visar. Handflator och fingrar är därför mindre benägna att bli obekväma när du spelar.
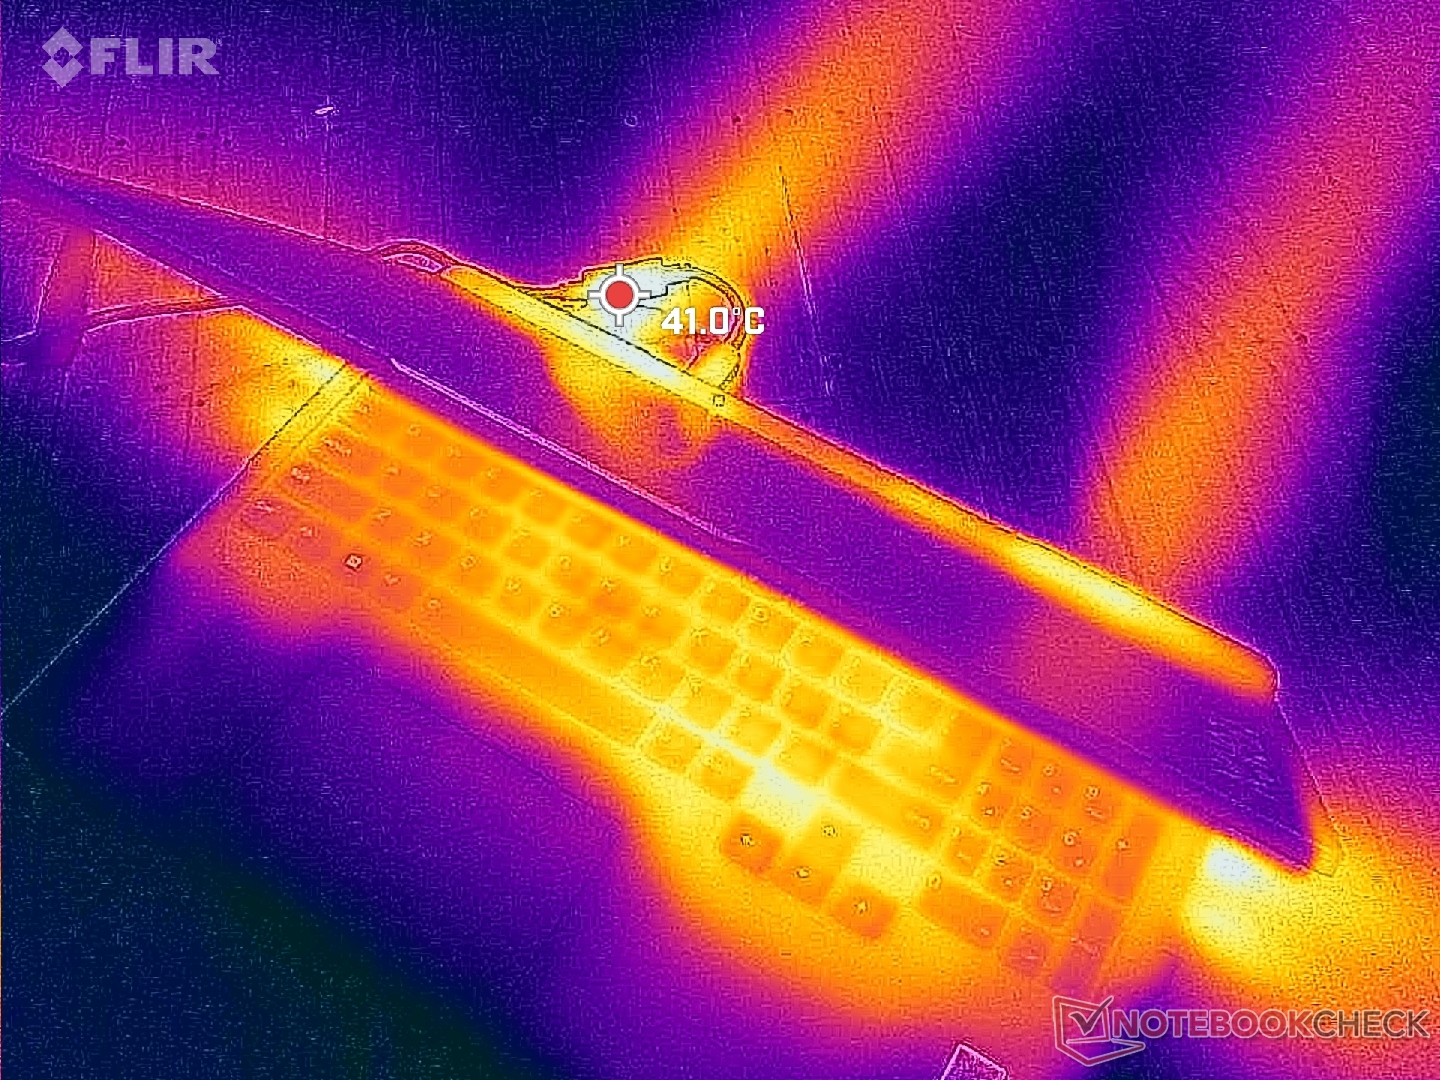
(±) Den maximala temperaturen på ovansidan är 42.8 °C / 109 F, jämfört med genomsnittet av 40.4 °C / 105 F , allt från 21.2 till 68.8 °C för klassen Gaming.
(-) Botten värms upp till maximalt 50 °C / 122 F, jämfört med genomsnittet av 43.2 °C / 110 F
(+) Vid tomgångsbruk är medeltemperaturen för ovansidan 27.2 °C / 81 F, jämfört med enhetsgenomsnittet på 33.9 °C / ### class_avg_f### F.
(±) När du spelar The Witcher 3 är medeltemperaturen för ovansidan 32.4 °C / 90 F, jämfört med enhetsgenomsnittet på 33.9 °C / ## #class_avg_f### F.
(+) Handledsstöden och pekplattan är kallare än hudtemperaturen med maximalt 26.2 °C / 79.2 F och är därför svala att ta på.
(+) Medeltemperaturen för handledsstödsområdet på liknande enheter var 28.8 °C / 83.8 F (+2.6 °C / 4.6 F).
| Lenovo Legion Pro 5 16IRX8 Intel Core i7-13700HX, NVIDIA GeForce RTX 4060 Laptop GPU | Asus ROG Zephyrus M16 GU603Z Intel Core i9-12900H, NVIDIA GeForce RTX 3070 Ti Laptop GPU | Razer Blade 16 Early 2023 Intel Core i9-13950HX, NVIDIA GeForce RTX 4080 Laptop GPU | Lenovo Legion Pro 7 16IRX8H Intel Core i9-13900HX, NVIDIA GeForce RTX 4080 Laptop GPU | Lenovo Legion 5 Pro 16ARH7H RTX 3070 Ti AMD Ryzen 7 6800H, NVIDIA GeForce RTX 3070 Ti Laptop GPU | Lenovo Legion S7 16ARHA7 AMD Ryzen 9 6900HX, AMD Radeon RX 6800S | |
|---|---|---|---|---|---|---|
| Heat | -5% | 8% | -11% | -1% | 5% | |
| Maximum Upper Side * (°C) | 42.8 | 52 -21% | 40 7% | 48 -12% | 43.8 -2% | 46.6 -9% |
| Maximum Bottom * (°C) | 50 | 51 -2% | 37.6 25% | 49 2% | 53 -6% | 50.8 -2% |
| Idle Upper Side * (°C) | 29.6 | 29 2% | 32.4 -9% | 40 -35% | 30 -1% | 26.4 11% |
| Idle Bottom * (°C) | 34 | 33 3% | 31.4 8% | 33 3% | 31.8 6% | 27.2 20% |
* ... mindre är bättre
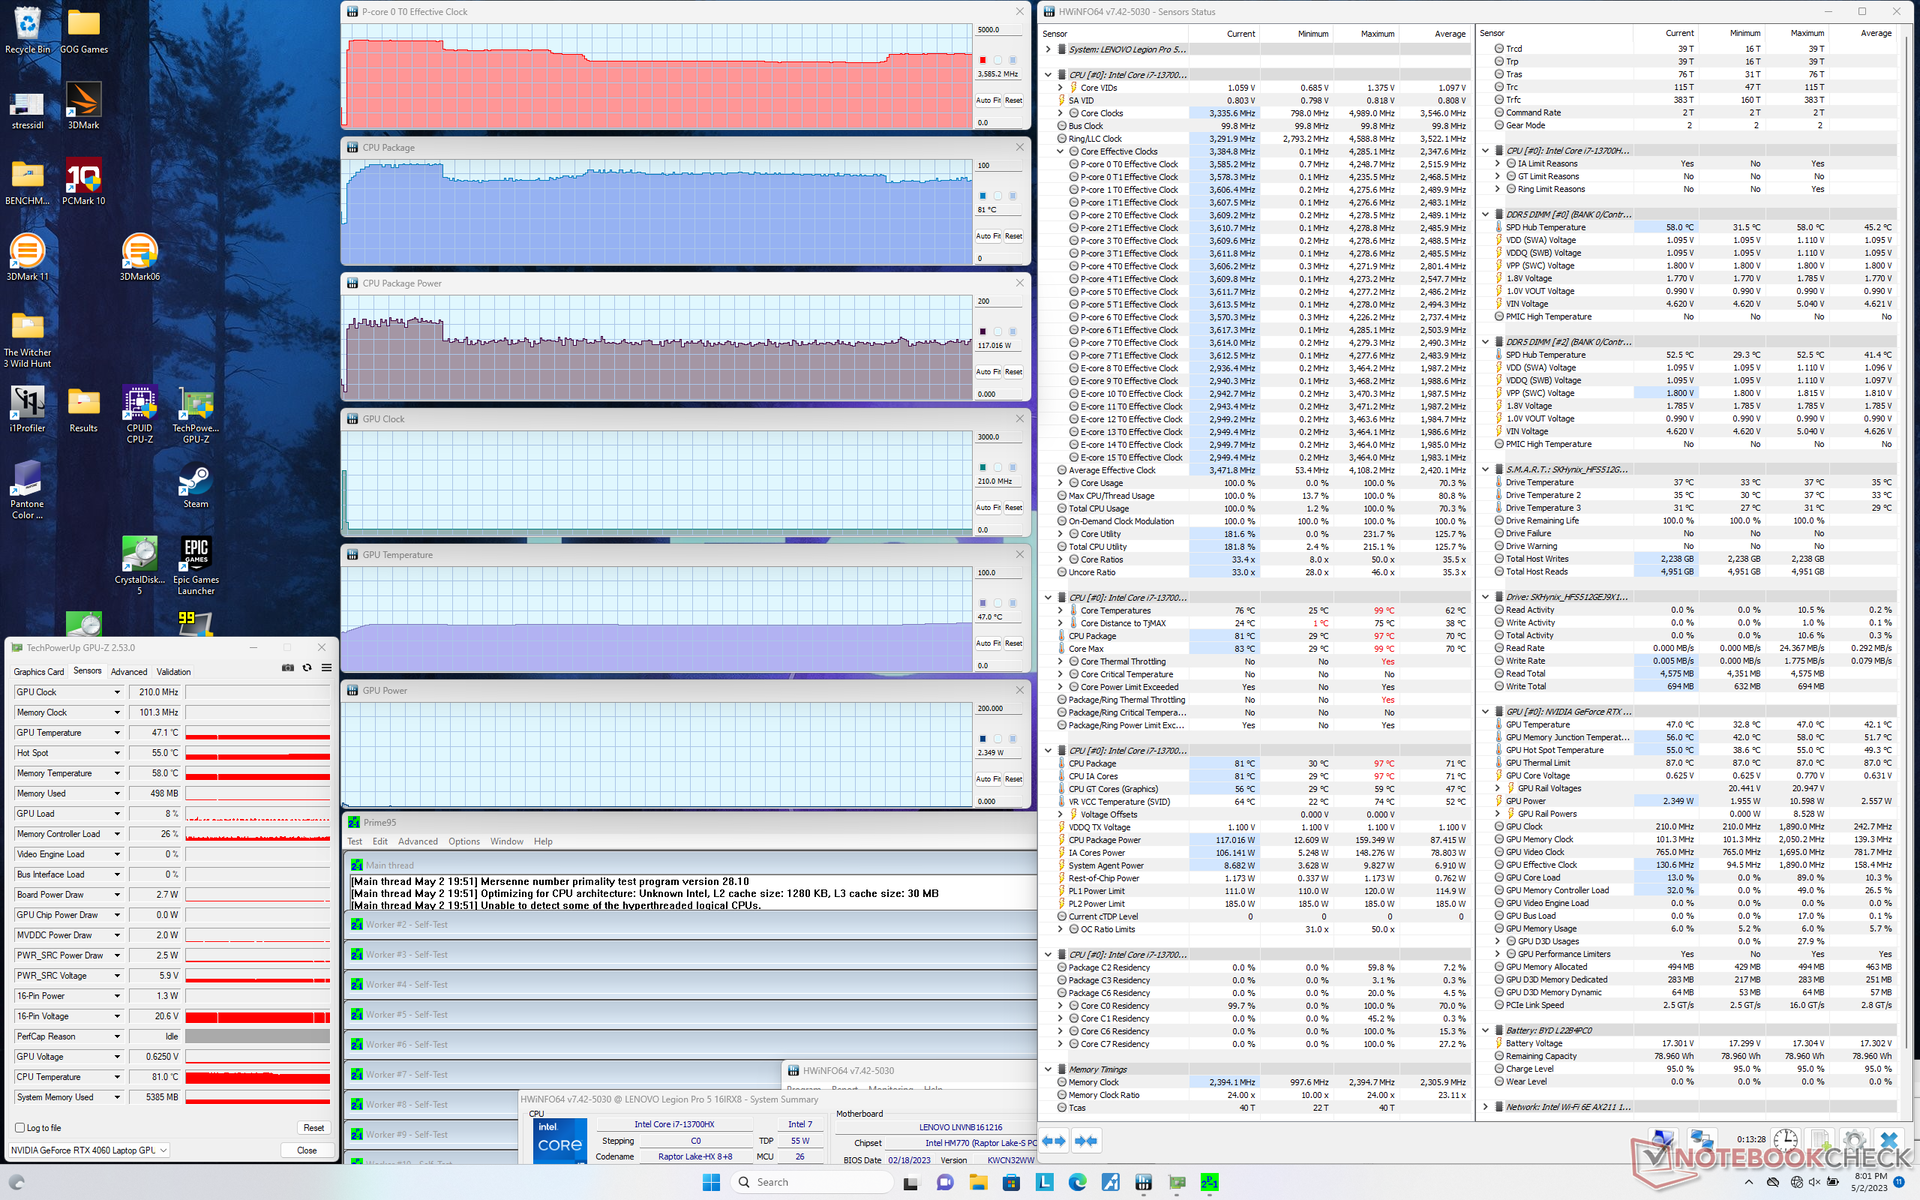
Stresstest
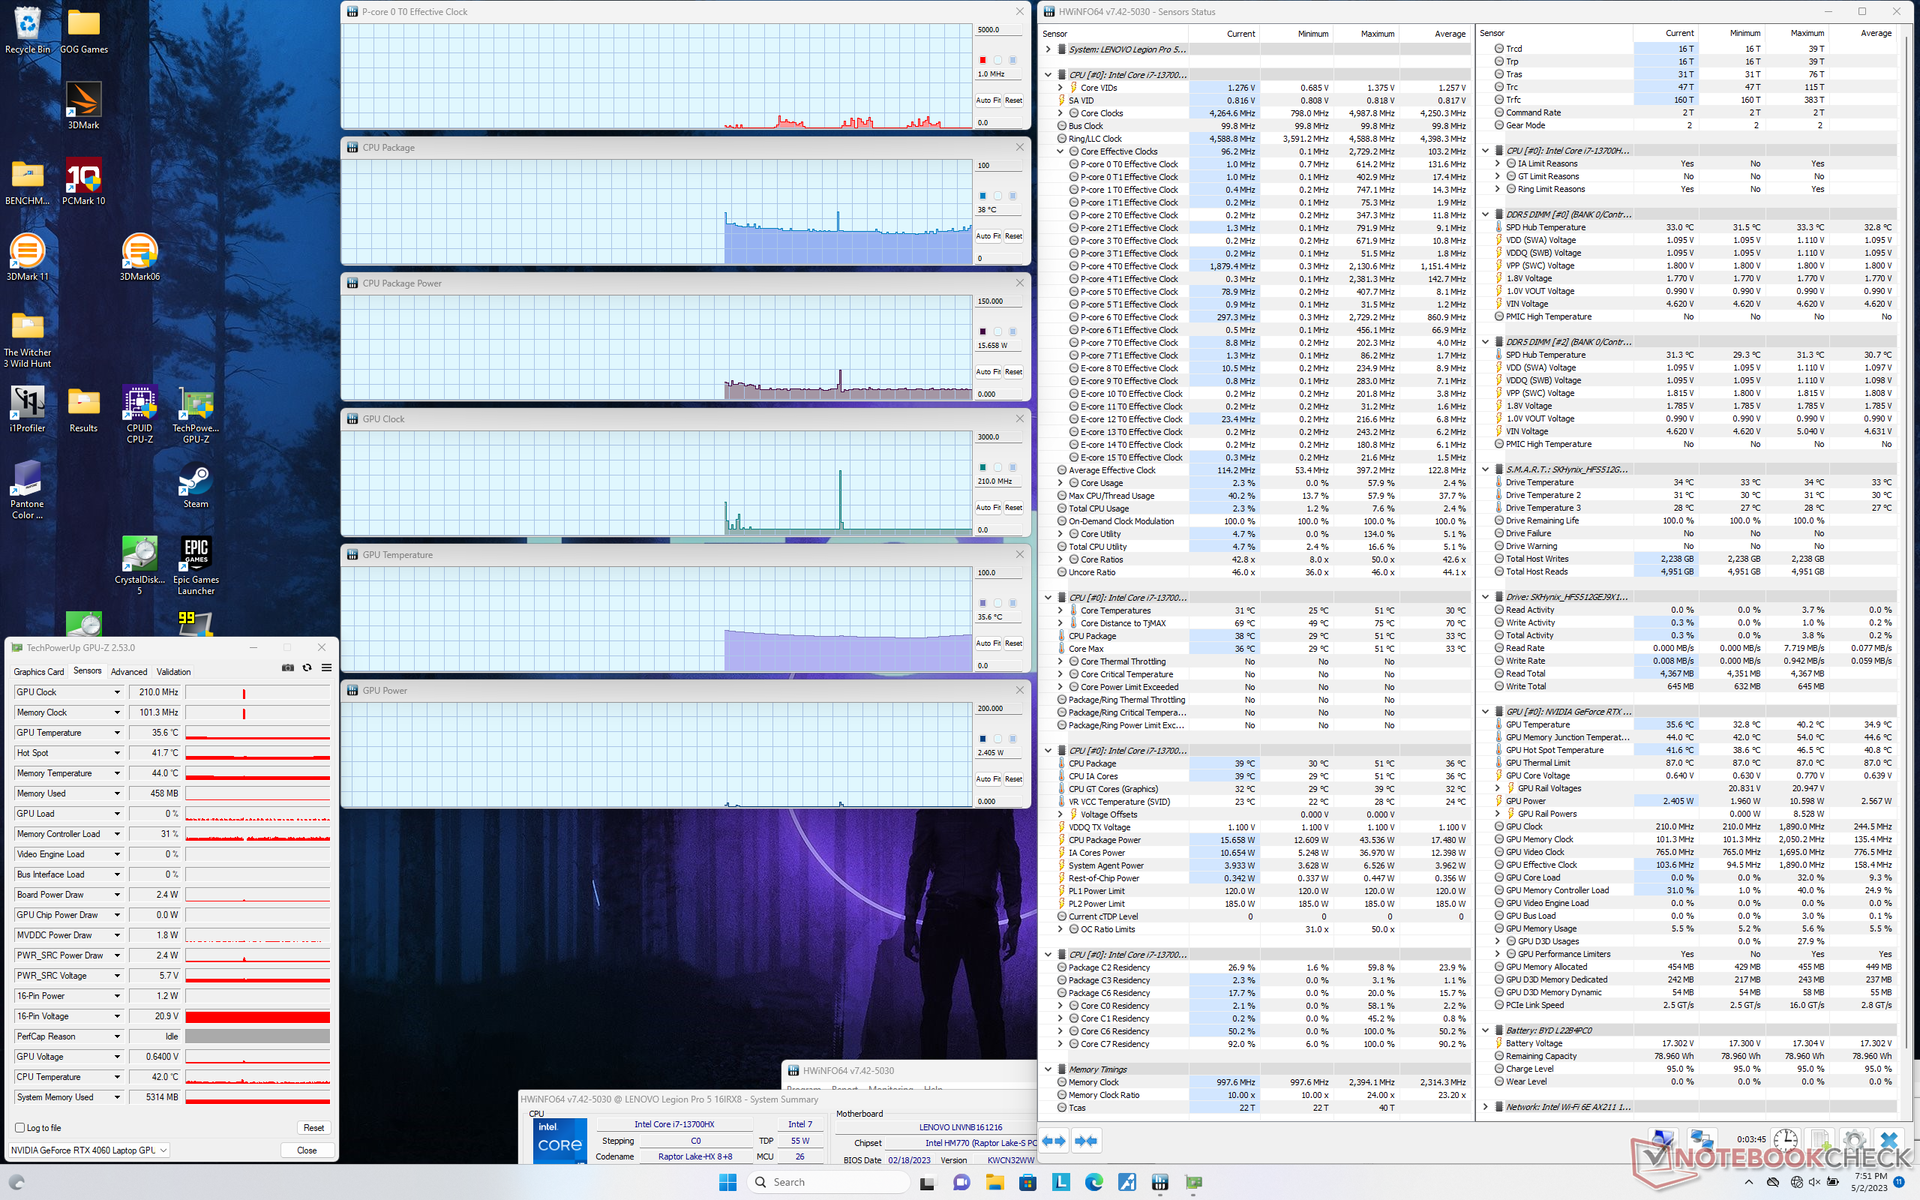
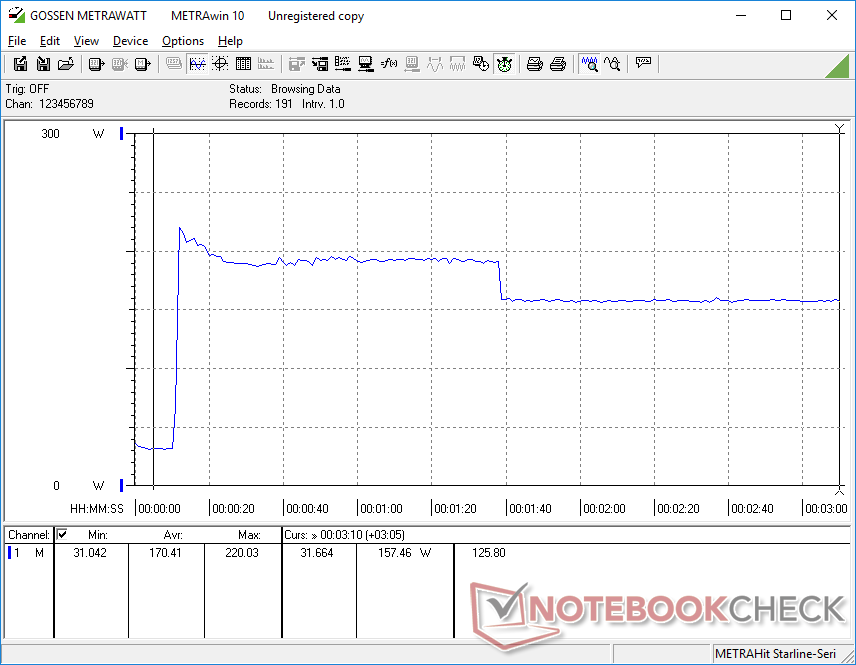
När processorn stressades under Prime95 ökade den till 4,3 GHz, 157 W och 97 C i ungefär en minut. Därefter skulle klockfrekvensen och strömförbrukningen på kortet sjunka till 3,3-3,6 GHz respektive 117 W för att bibehålla en svalare kärntemperatur på 81 C. Maximal Turbo Boost är därför inte hållbart under längre perioder. Genom att upprepa samma test på förra årets långsammare AMD-drivna Legion Pro 5 16 skulle resultera i en varmare CPU-temperatur på 93 C.
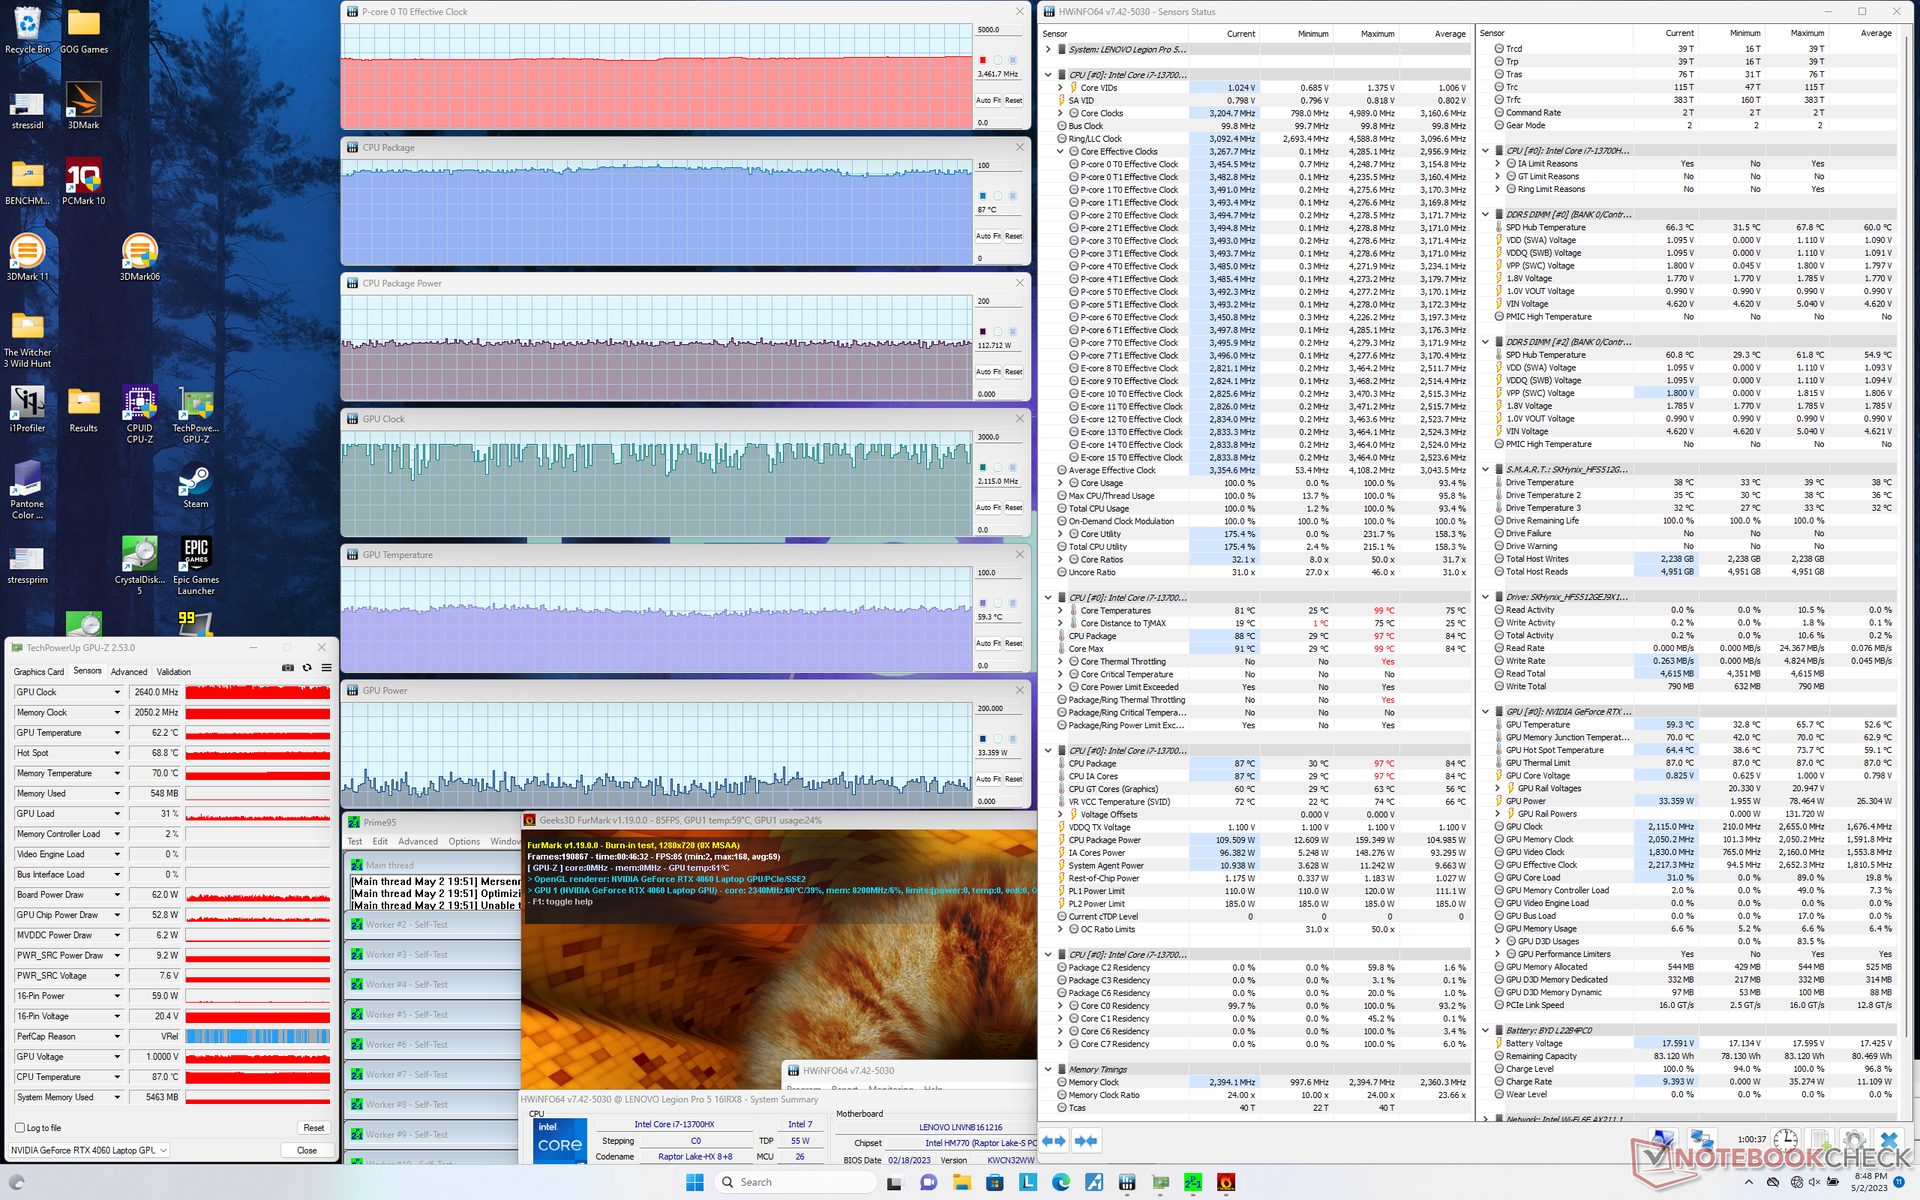
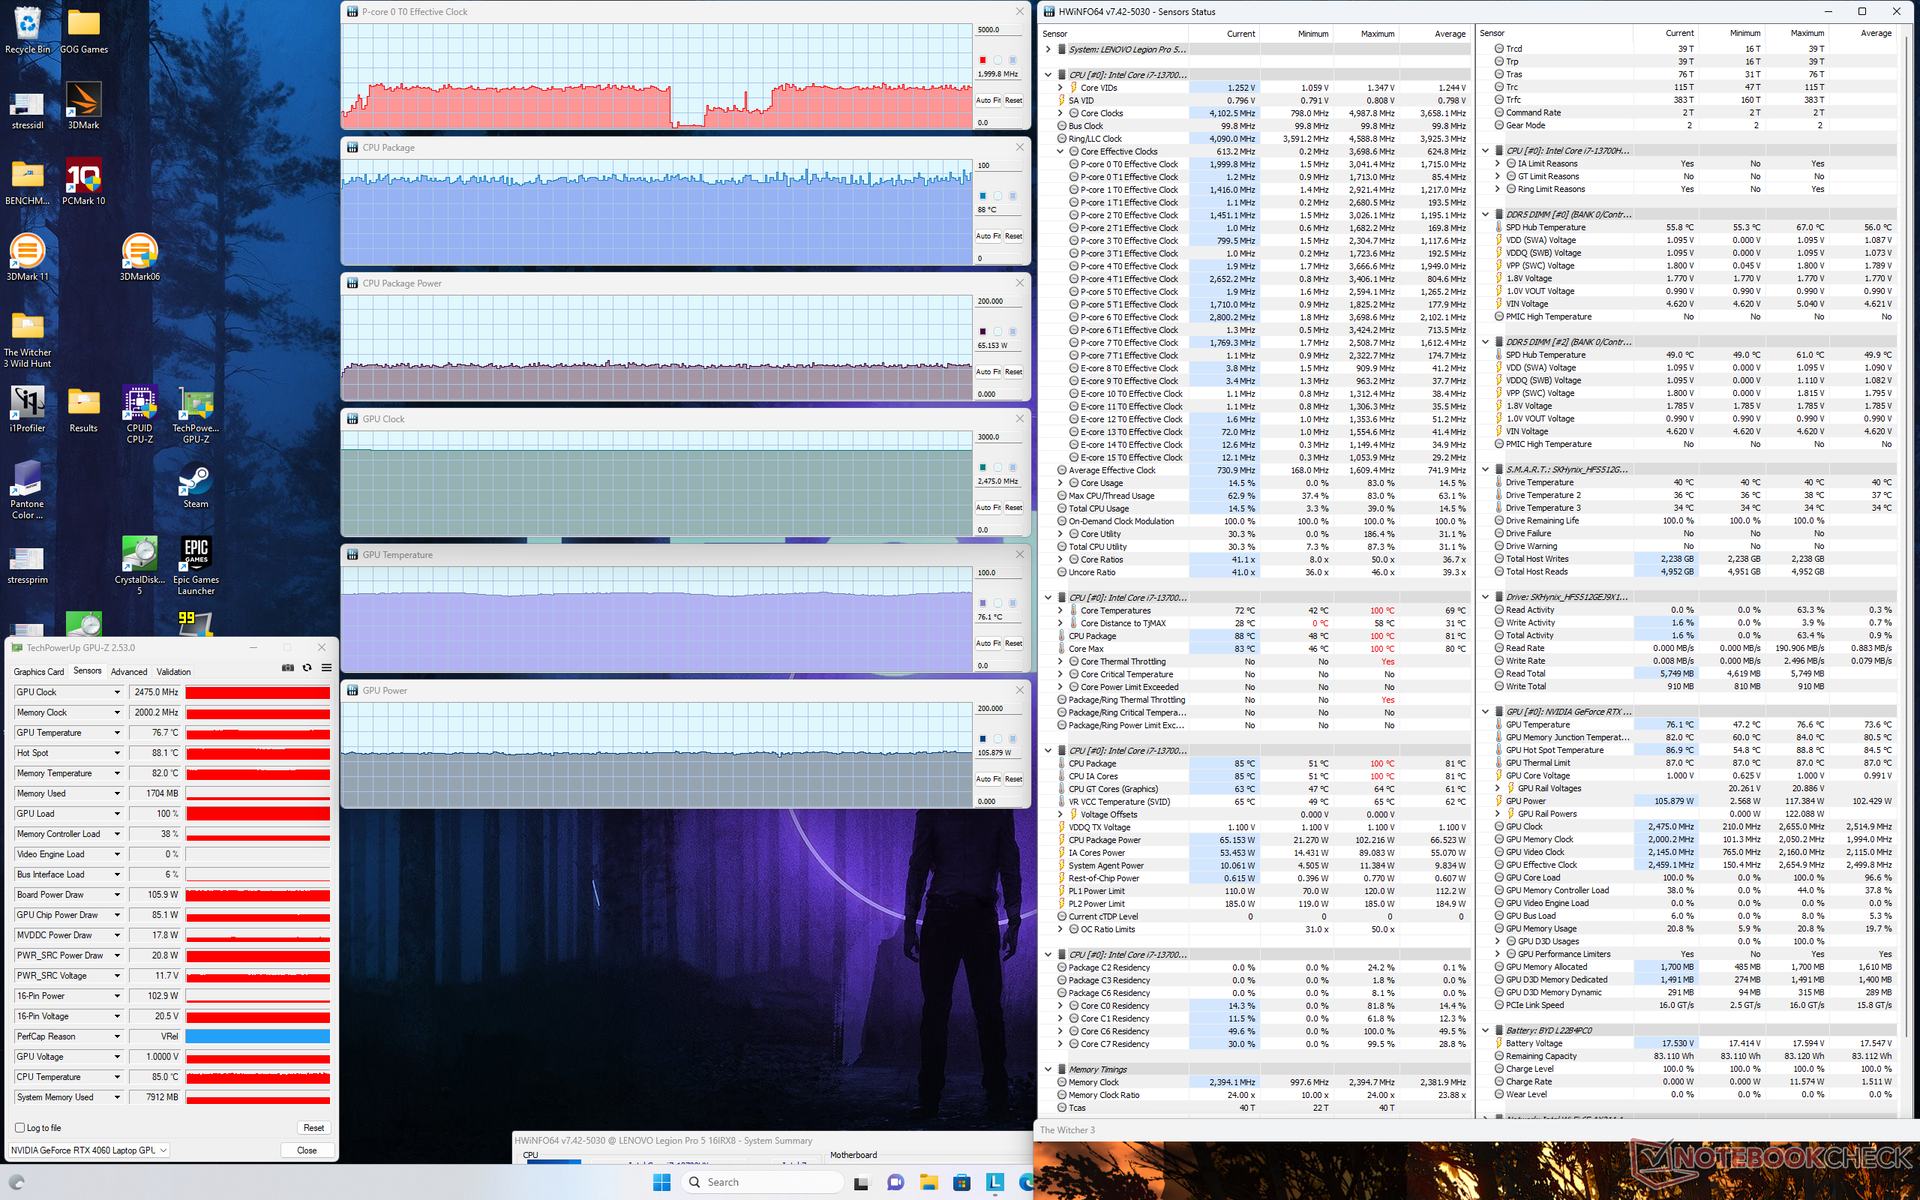
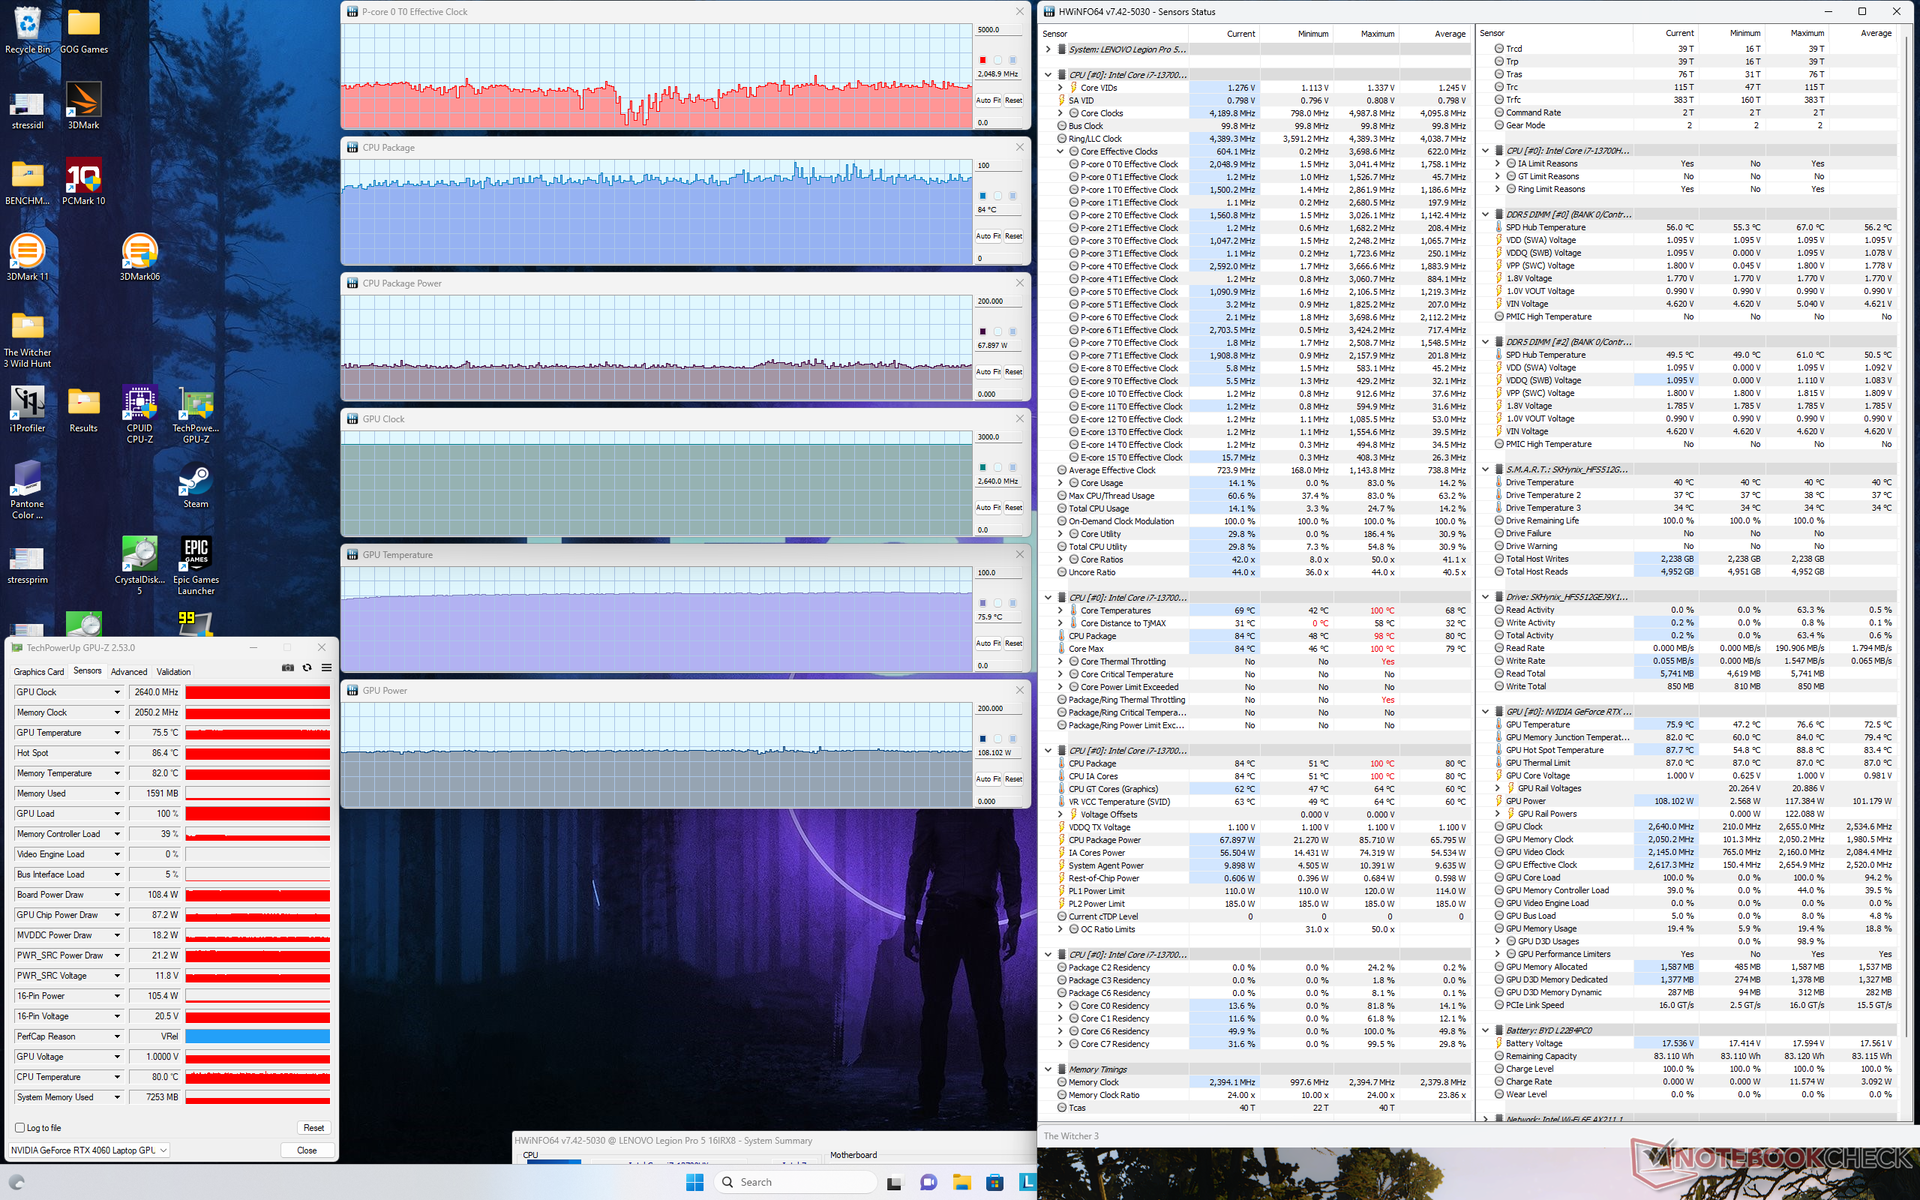
När du kör Witcher 3i läget Prestanda för att representera typiska spelbelastningar skulle vår RTX 4060 GPU stabilisera sig vid 2640 MHz klockfrekvens, 2050 MHz RAM, 76 C och 109 W, vilket är klart lägre än de angivna 140 W på Nvidias kontrollpanel. I balanserat läge skulle GPU:n sjunka något till 2475 MHz klockan, 2000 MHz RAM och 105 W strömförbrukning på kortet, medan kärntemperaturen skulle förbli densamma. Du bör alltså ställa in systemet på Performance-läget för att utnyttja GPU:n fullt ut. Kärntemperaturen är cirka 10 C svalare än på förra årets modell med RTX 3070 Ti eftersom den senare skulle nå en högre 149 W kortströmsuttag.
Att köra på batteri begränsar prestandan som väntat. Ett Fire Strike -test på batterier skulle ge fysik- och grafikpoäng på 21363 respektive 12851 poäng, jämfört med 35270 och 26561 poäng vid nätström.
| CPU-klocka (GHz) | GPU-klocka (MHz) | Genomsnittlig CPU-temperatur (°C) | Genomsnittlig GPU-temperatur (°C) | |
| Systemets tomgång | -- | -- | 37 | 36 |
| Prime95 Stress | 3.3 - 3.6 | -- | 81 - 86 | 47 |
| Prime95 + FurMark Stress | 3.5 | 1714 - 2640 | 87 | 59 |
| Witcher 3 Stress (balanserat läge) | ~2,0 | 2475 | 88 | 76 |
| Witcher 3 Stress (prestationsläge) | ~2,0 | 2640 | 84 | 76 |
Högtalare
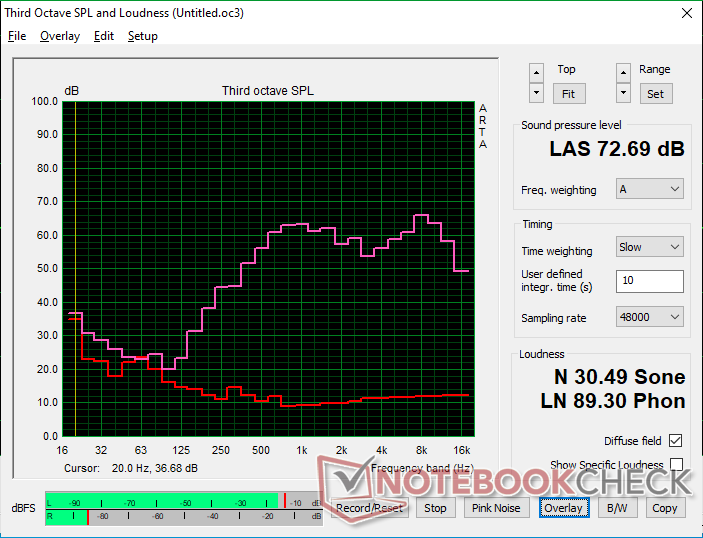
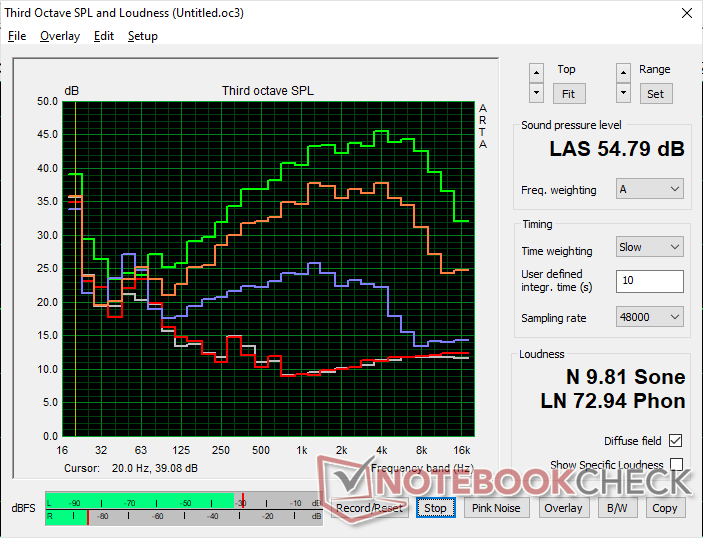
Lenovo Legion Pro 5 16IRX8 ljudanalys
(±) | högtalarljudstyrkan är genomsnittlig men bra (72.7 dB)
Bas 100 - 315 Hz
(-) | nästan ingen bas - i genomsnitt 23.7% lägre än medianen
(±) | linjäriteten för basen är genomsnittlig (10.7% delta till föregående frekvens)
Mellan 400 - 2000 Hz
(+) | balanserad mellan - endast 3.8% från medianen
(±) | linjäriteten för mids är genomsnittlig (7.1% delta till föregående frekvens)
Högsta 2 - 16 kHz
(+) | balanserade toppar - endast 3.7% från medianen
(+) | toppar är linjära (6.7% delta till föregående frekvens)
Totalt 100 - 16 000 Hz
(±) | linjäriteten för det totala ljudet är genomsnittlig (21.9% skillnad mot median)
Jämfört med samma klass
» 79% av alla testade enheter i den här klassen var bättre, 6% liknande, 16% sämre
» Den bästa hade ett delta på 6%, genomsnittet var 18%, sämst var 132%
Jämfört med alla testade enheter
» 63% av alla testade enheter var bättre, 7% liknande, 30% sämre
» Den bästa hade ett delta på 4%, genomsnittet var 23%, sämst var 134%
Apple MacBook Pro 16 2021 M1 Pro ljudanalys
(+) | högtalare kan spela relativt högt (84.7 dB)
Bas 100 - 315 Hz
(+) | bra bas - bara 3.8% från medianen
(+) | basen är linjär (5.2% delta till föregående frekvens)
Mellan 400 - 2000 Hz
(+) | balanserad mellan - endast 1.3% från medianen
(+) | mids är linjära (2.1% delta till föregående frekvens)
Högsta 2 - 16 kHz
(+) | balanserade toppar - endast 1.9% från medianen
(+) | toppar är linjära (2.7% delta till föregående frekvens)
Totalt 100 - 16 000 Hz
(+) | det totala ljudet är linjärt (4.6% skillnad mot median)
Jämfört med samma klass
» 0% av alla testade enheter i den här klassen var bättre, 0% liknande, 100% sämre
» Den bästa hade ett delta på 5%, genomsnittet var 17%, sämst var 45%
Jämfört med alla testade enheter
» 0% av alla testade enheter var bättre, 0% liknande, 100% sämre
» Den bästa hade ett delta på 4%, genomsnittet var 23%, sämst var 134%
Energiförvaltning
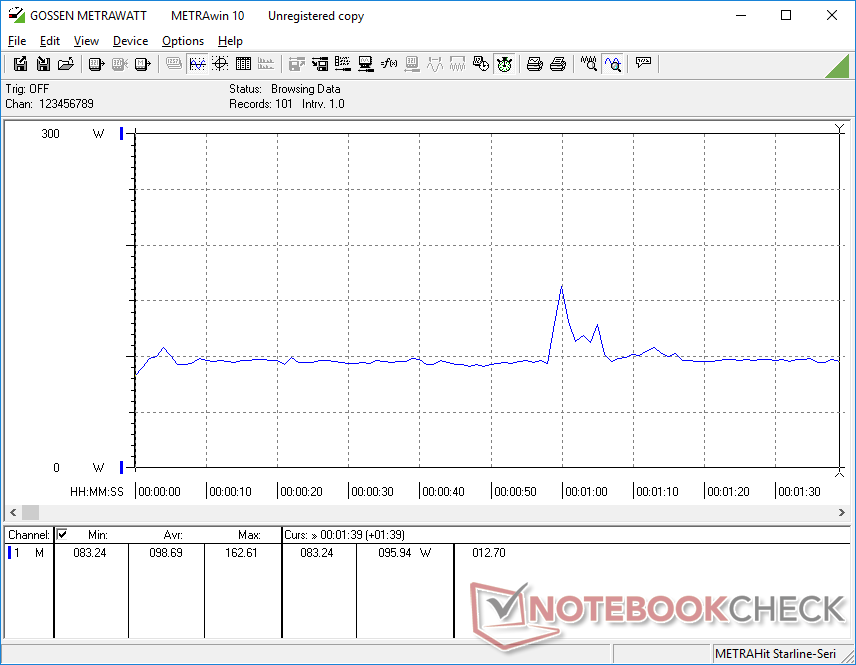
Energiförbrukning - lika krävande som tidigare
Systemet är ovanligt krävande när det går på tomgång på skrivbordet där vi kan mäta minst 24 W jämfört med bara 10 W till 15 W på alternativ som ROG Zephyrus M16 eller Blade 16. Vi såg till och med till att ställa in systemet i energisparläge med iGPU:n aktiv och på minsta ljusstyrka, men resultaten blev inte bättre. Den relativt höga förbrukningen kan delvis vara ansvarig för den kortare batteritid än väntat som noteras i nästa avsnitt.
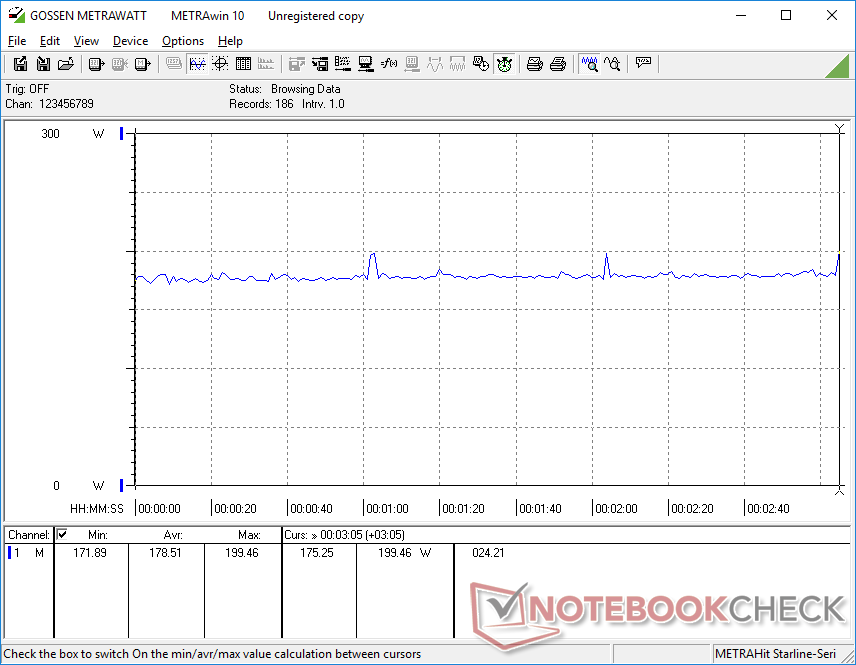
Körning av Witcher 3 skulle dra 179 W jämfört med 209 W på förra årets Legion 5 Pro 16 med RTX 3070 Ti. Just den GPU:n är cirka 15-20 procent snabbare än vår RTX 4060 och med ett högre TGP-mål som tidigare nämnts, vilket korrelerar med dess 15 procent högre strömförbrukning. Prestanda per watt förblir relativt linjär från år till år som ett resultat av detta.
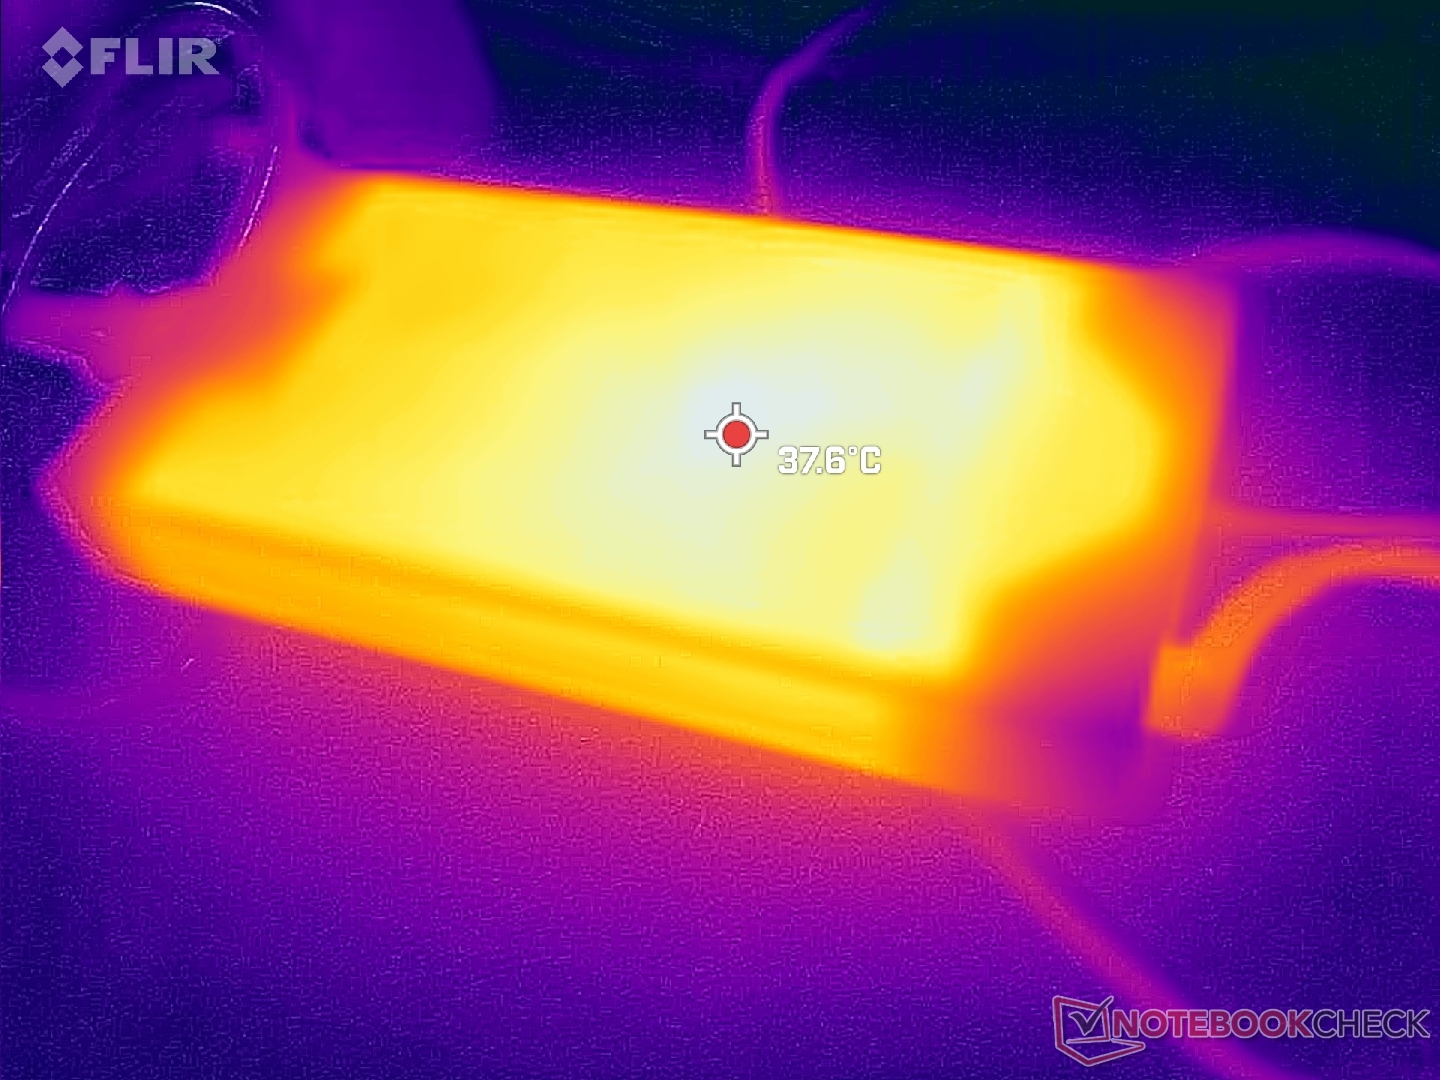
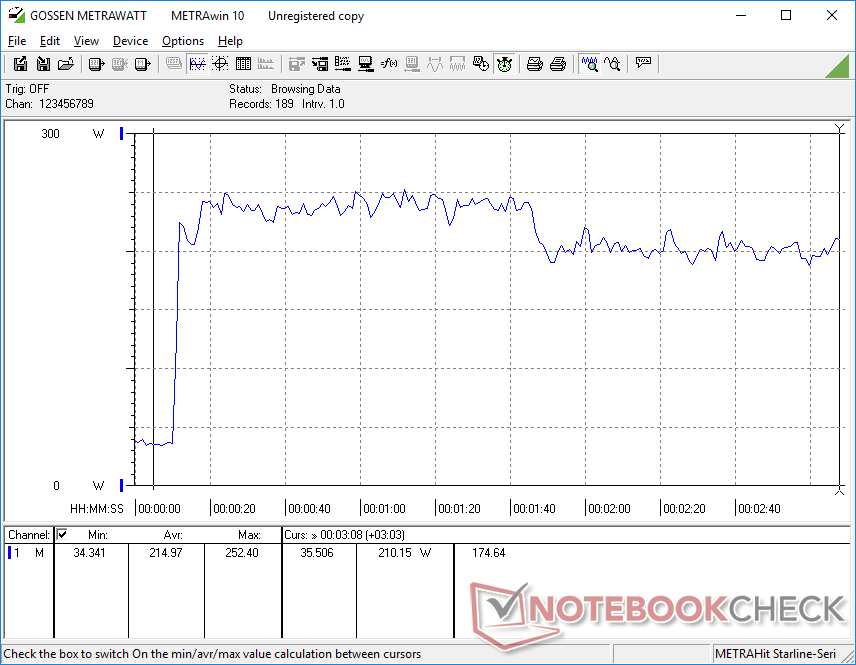
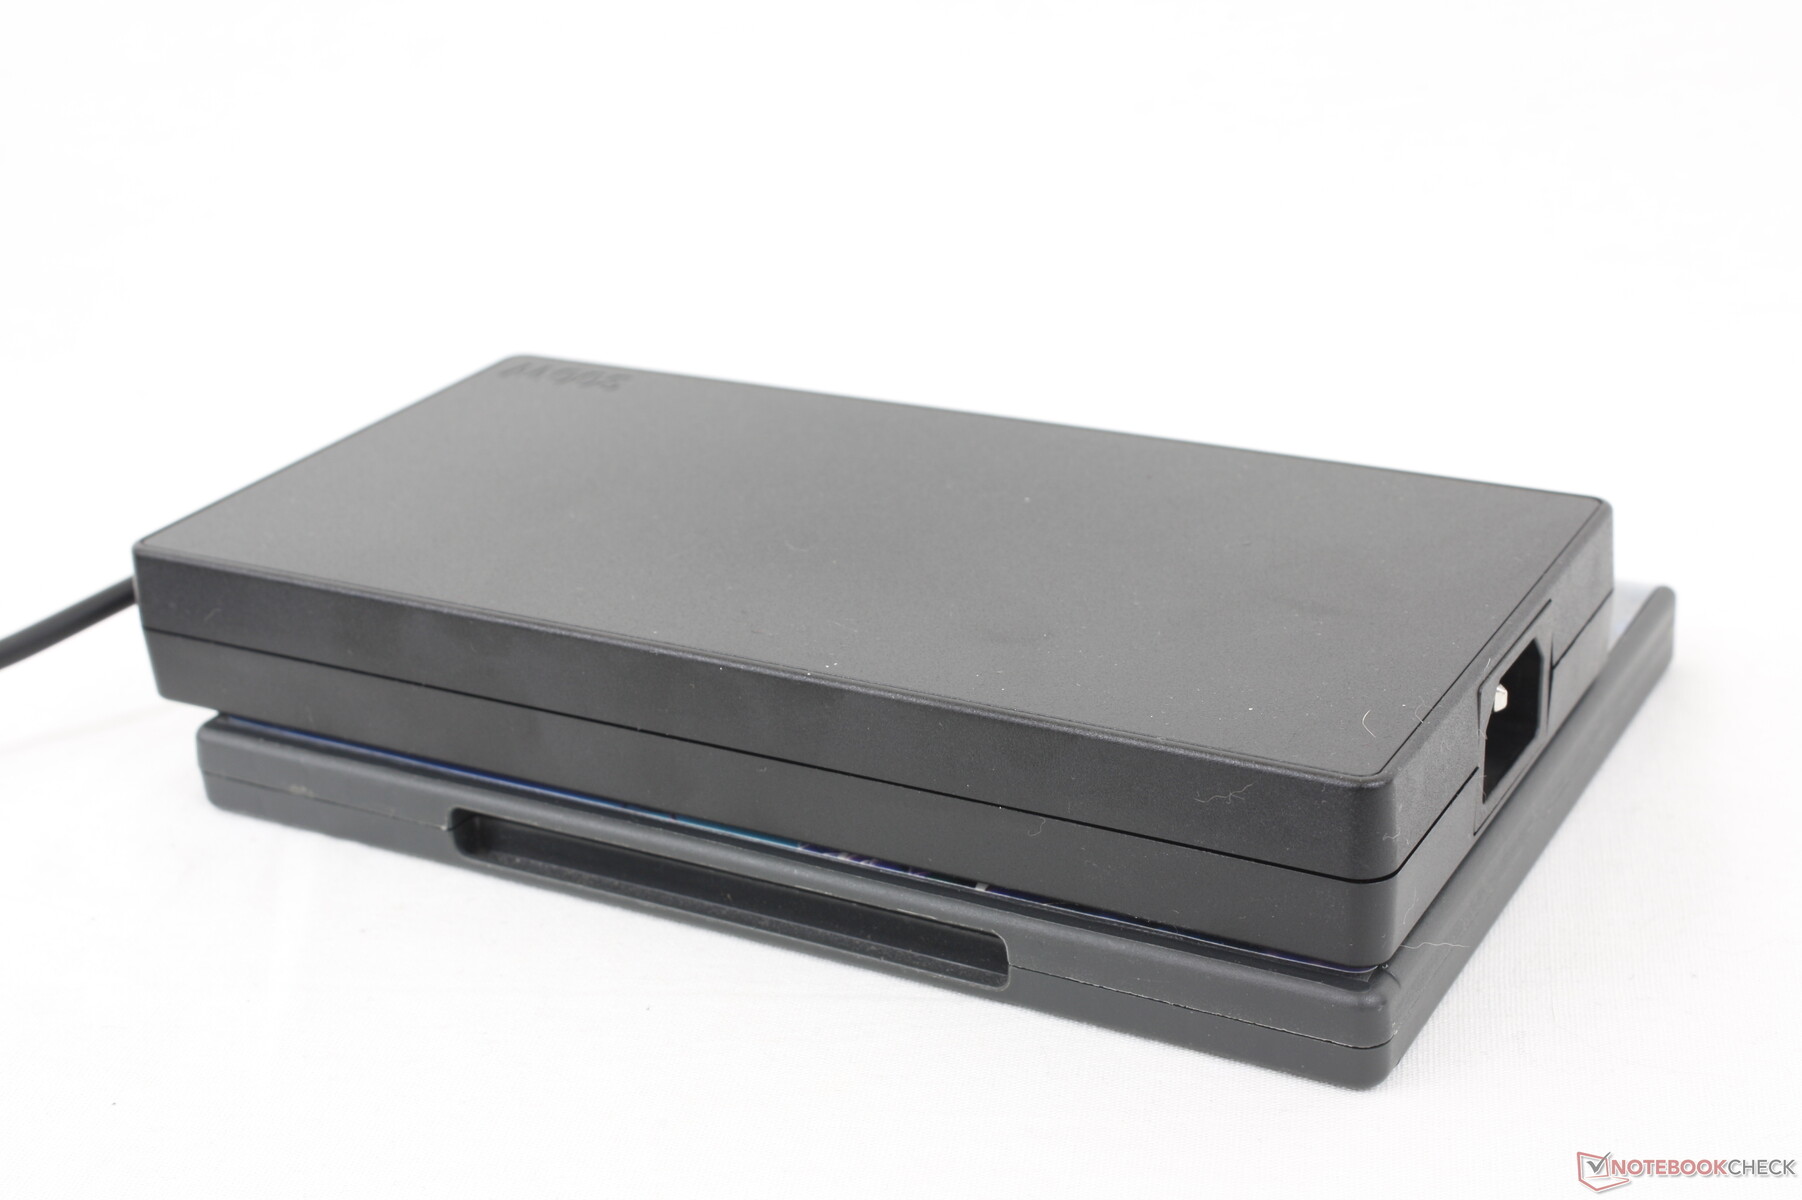
Vi kan mäta ett maximalt uttag på 250 W från den stora (~19,9 x 9,9 x 2,6 cm) 300 W AC-adaptern när både CPU och GPU är 100 procent utnyttjade. Lenovo använder samma 300 W-adapter för många av sina andra Legion -modeller också.
| Av/Standby | |
| Låg belastning | |
| Hög belastning |
|
Förklaring:
min: | |
| Lenovo Legion Pro 5 16IRX8 i7-13700HX, GeForce RTX 4060 Laptop GPU, SK hynix PC801 HFS512GEJ9X115N, IPS, 2560x1600, 16" | Asus ROG Zephyrus M16 GU603Z i9-12900H, GeForce RTX 3070 Ti Laptop GPU, Micron 3400 1TB MTFDKBA1T0TFH, IPS, 2560x1600, 16" | Razer Blade 16 Early 2023 i9-13950HX, GeForce RTX 4080 Laptop GPU, SSSTC CA6-8D1024, IPS, 2560x1600, 16" | Lenovo Legion Pro 7 16IRX8H i9-13900HX, GeForce RTX 4080 Laptop GPU, Samsung PM9A1 MZVL21T0HCLR, IPS, 2560x1600, 16" | Lenovo Legion 5 Pro 16ARH7H RTX 3070 Ti R7 6800H, GeForce RTX 3070 Ti Laptop GPU, Samsung PM9A1 MZVL21T0HCLR, IPS, 2560x1600, 16" | Lenovo Legion S7 16ARHA7 R9 6900HX, Radeon RX 6800S, SK Hynix HFS001TEJ9X115N, IPS, 2560x1600, 16" | |
|---|---|---|---|---|---|---|
| Power Consumption | 27% | -9% | -9% | 10% | 31% | |
| Idle Minimum * (Watt) | 24.5 | 10.8 56% | 15.2 38% | 18 27% | 9.7 60% | 8.8 64% |
| Idle Average * (Watt) | 29.2 | 17 42% | 22.8 22% | 24 18% | 14.8 49% | 14.7 50% |
| Idle Maximum * (Watt) | 34.3 | 17.8 48% | 49.8 -45% | 32 7% | 45.8 -34% | 19.8 42% |
| Load Average * (Watt) | 98.7 | 116 -18% | 121.2 -23% | 130 -32% | 87.2 12% | 85.3 14% |
| Witcher 3 ultra * (Watt) | 178.6 | 144 19% | 242 -35% | 260 -46% | 209 -17% | 167.5 6% |
| Load Maximum * (Watt) | 249.6 | 220 12% | 273.7 -10% | 320 -28% | 275.3 -10% | 230.7 8% |
* ... mindre är bättre
Power Consumption Witcher 3 / Stresstest
Power Consumption external Monitor
Batteritid - Kortare än andra bärbara datorer för spel
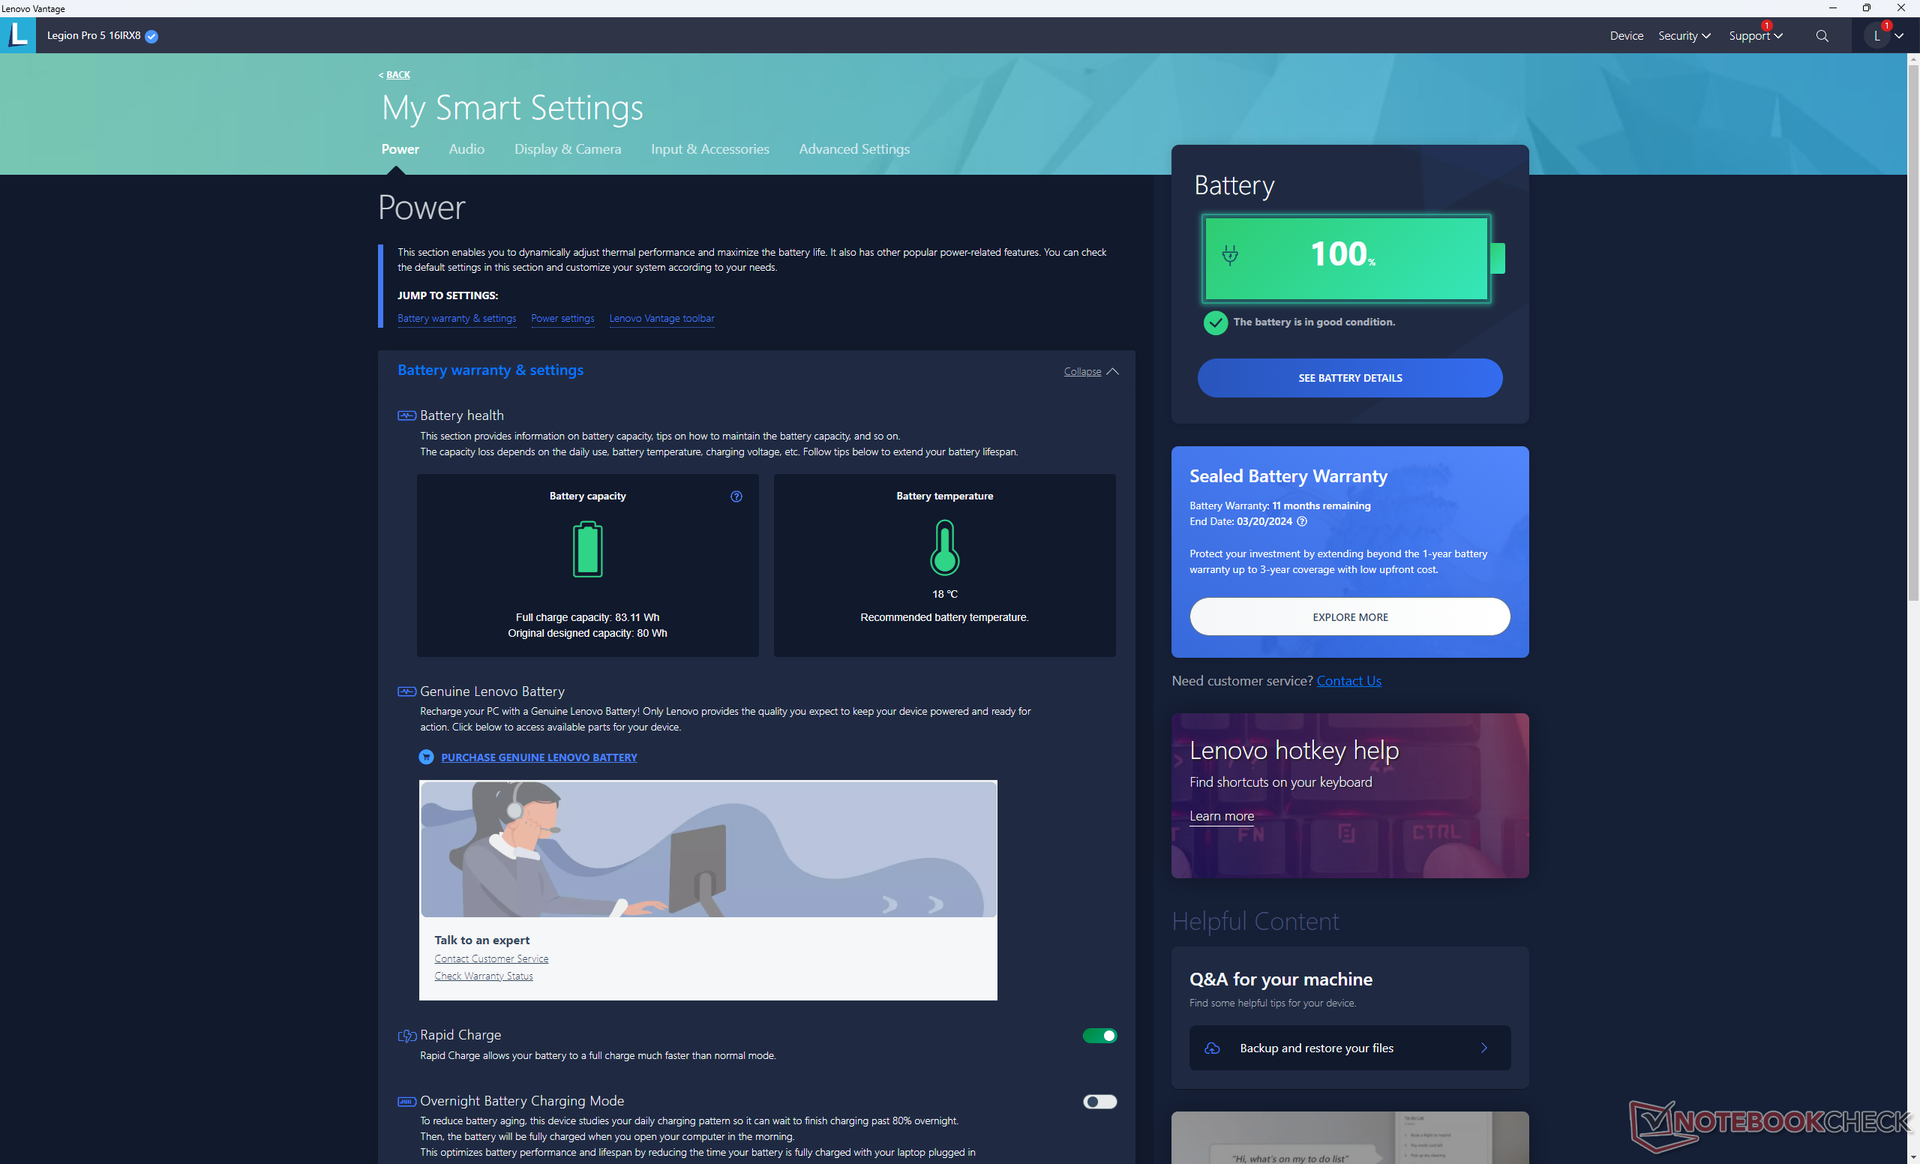
Batterikapaciteten är fortfarande 80 Wh jämfört med 99 Wh på den dyrare Legion 7 Pro serien. Körtiderna är korta, vilket verkar vara en trend bland Legion -modellerna; vi kan bara registrera en WLAN-körtid på under 3,5 timmar, även när vi ställer in iGPU- och balanserade profillägen. The Razer Blade 16 och Asus ROG Zephyrus M16 kan vardera hålla i flera timmar längre i jämförelse.
Laddningen från tom till full är relativt snabb på under 90 minuter med den medföljande nätadaptern. Systemet kan även laddas via mindre USB-C-adaptrar om än i långsammare takt och med begränsad prestanda.
| Lenovo Legion Pro 5 16IRX8 i7-13700HX, GeForce RTX 4060 Laptop GPU, 80 Wh | Asus ROG Zephyrus M16 GU603Z i9-12900H, GeForce RTX 3070 Ti Laptop GPU, 90 Wh | Razer Blade 16 Early 2023 i9-13950HX, GeForce RTX 4080 Laptop GPU, 95.2 Wh | Lenovo Legion Pro 7 16IRX8H i9-13900HX, GeForce RTX 4080 Laptop GPU, 99.9 Wh | Lenovo Legion 5 Pro 16ARH7H RTX 3070 Ti R7 6800H, GeForce RTX 3070 Ti Laptop GPU, 80 Wh | Lenovo Legion S7 16ARHA7 R9 6900HX, Radeon RX 6800S, 71 Wh | |
|---|---|---|---|---|---|---|
| Batteridrifttid | 109% | 71% | 82% | 29% | 82% | |
| Reader / Idle (h) | 6.7 | 8.9 33% | 6.4 -4% | |||
| WiFi v1.3 (h) | 3.4 | 7.4 118% | 6.1 79% | 5.1 50% | 4.4 29% | 6.2 82% |
| Load (h) | 0.7 | 1.4 100% | 1.4 100% | 2.1 200% | ||
| H.264 (h) | 7.3 |
För
Emot
Bedömning - Saknar några funktioner för priset
2023 Legion Pro 5 16 konfigurerad med GeForce RTX 4060-grafik är inte en billig bärbar dator för spel för 1 600 USD. Det är förstås inget problem så länge den är fullmatad med funktioner som gamers faktiskt vill ha. G-Sync, QHD+ 165 Hz, fullständiga sRGB-färger, enkel service och stora piltangenter är alla standard för att göra modellen till en väl avrundad bärbar dator för spel.
Vi kan märka vissa nedskärningar ändå även i den här prisklassen. Modellen utelämnar några viktiga funktioner som RGB-belysning per tangent, Thunderbolt-stöd, Advanced Optimus och AdobeRGB-panelalternativ. Särskilt det sistnämnda innebär att Legion Pro 5 16 kanske inte är den bästa lösningen för användare som både är innehållsskapare eller digitala konstnärer och spelare. Konkurrerande modeller som t.ex.Razer Blade 16, Aero 16, eller Asus ROG Zephyrus M16 är inte bara lättare och tunnare, utan erbjuder också fler skärmalternativ och några av de tidigare nämnda saknade funktionerna.
Den uppdaterade Legion Pro 5 16 täcker nästan allt du vill ha från en bärbar dator för spel i mellanklassen. Vissa önskvärda funktioner som AdobeRGB, Thunderbolt och Advanced Optimus är dock tyvärr utelämnade.
På prestandasidan kommer användare som kanske rockar system med 12:e generationens Intel CPU:er och GeForce RTX 3070 eller högre GPU:er inte att se alltför stora fördelar när de uppgraderar till 13:e generationens Intel med GeForce RTX 4060 eller 4070 grafik. Äldre maskiner som körs med GeForce RTX 20 GPU:er med 11:e generationens Intel- eller AMD Zen 3- CPU:er kanske bör överväga att göra språnget.
Pris och tillgänglighet
Lenovo levererar nu Legion Pro 5 16IRX8 i vår recensionskonfiguration för 1 600 USD.
Lenovo Legion Pro 5 16IRX8
- 05/05/2023 v7 (old)
Allen Ngo
Genomskinlighet
Valet av enheter som ska granskas görs av vår redaktion. Testprovet gavs till författaren som ett lån av tillverkaren eller återförsäljaren för denna recension. Långivaren hade inget inflytande på denna recension och inte heller fick tillverkaren en kopia av denna recension innan publiceringen. Det fanns ingen skyldighet att publicera denna recension. Som ett oberoende medieföretag är Notebookcheck inte föremål för auktoritet från tillverkare, återförsäljare eller förlag.
This is how Notebookcheck is testingEvery year, Notebookcheck independently reviews hundreds of laptops and smartphones using standardized procedures to ensure that all results are comparable. We have continuously developed our test methods for around 20 years and set industry standards in the process. In our test labs, high-quality measuring equipment is utilized by experienced technicians and editors. These tests involve a multi-stage validation process. Our complex rating system is based on hundreds of well-founded measurements and benchmarks, which maintains objectivity.
Price comparison

