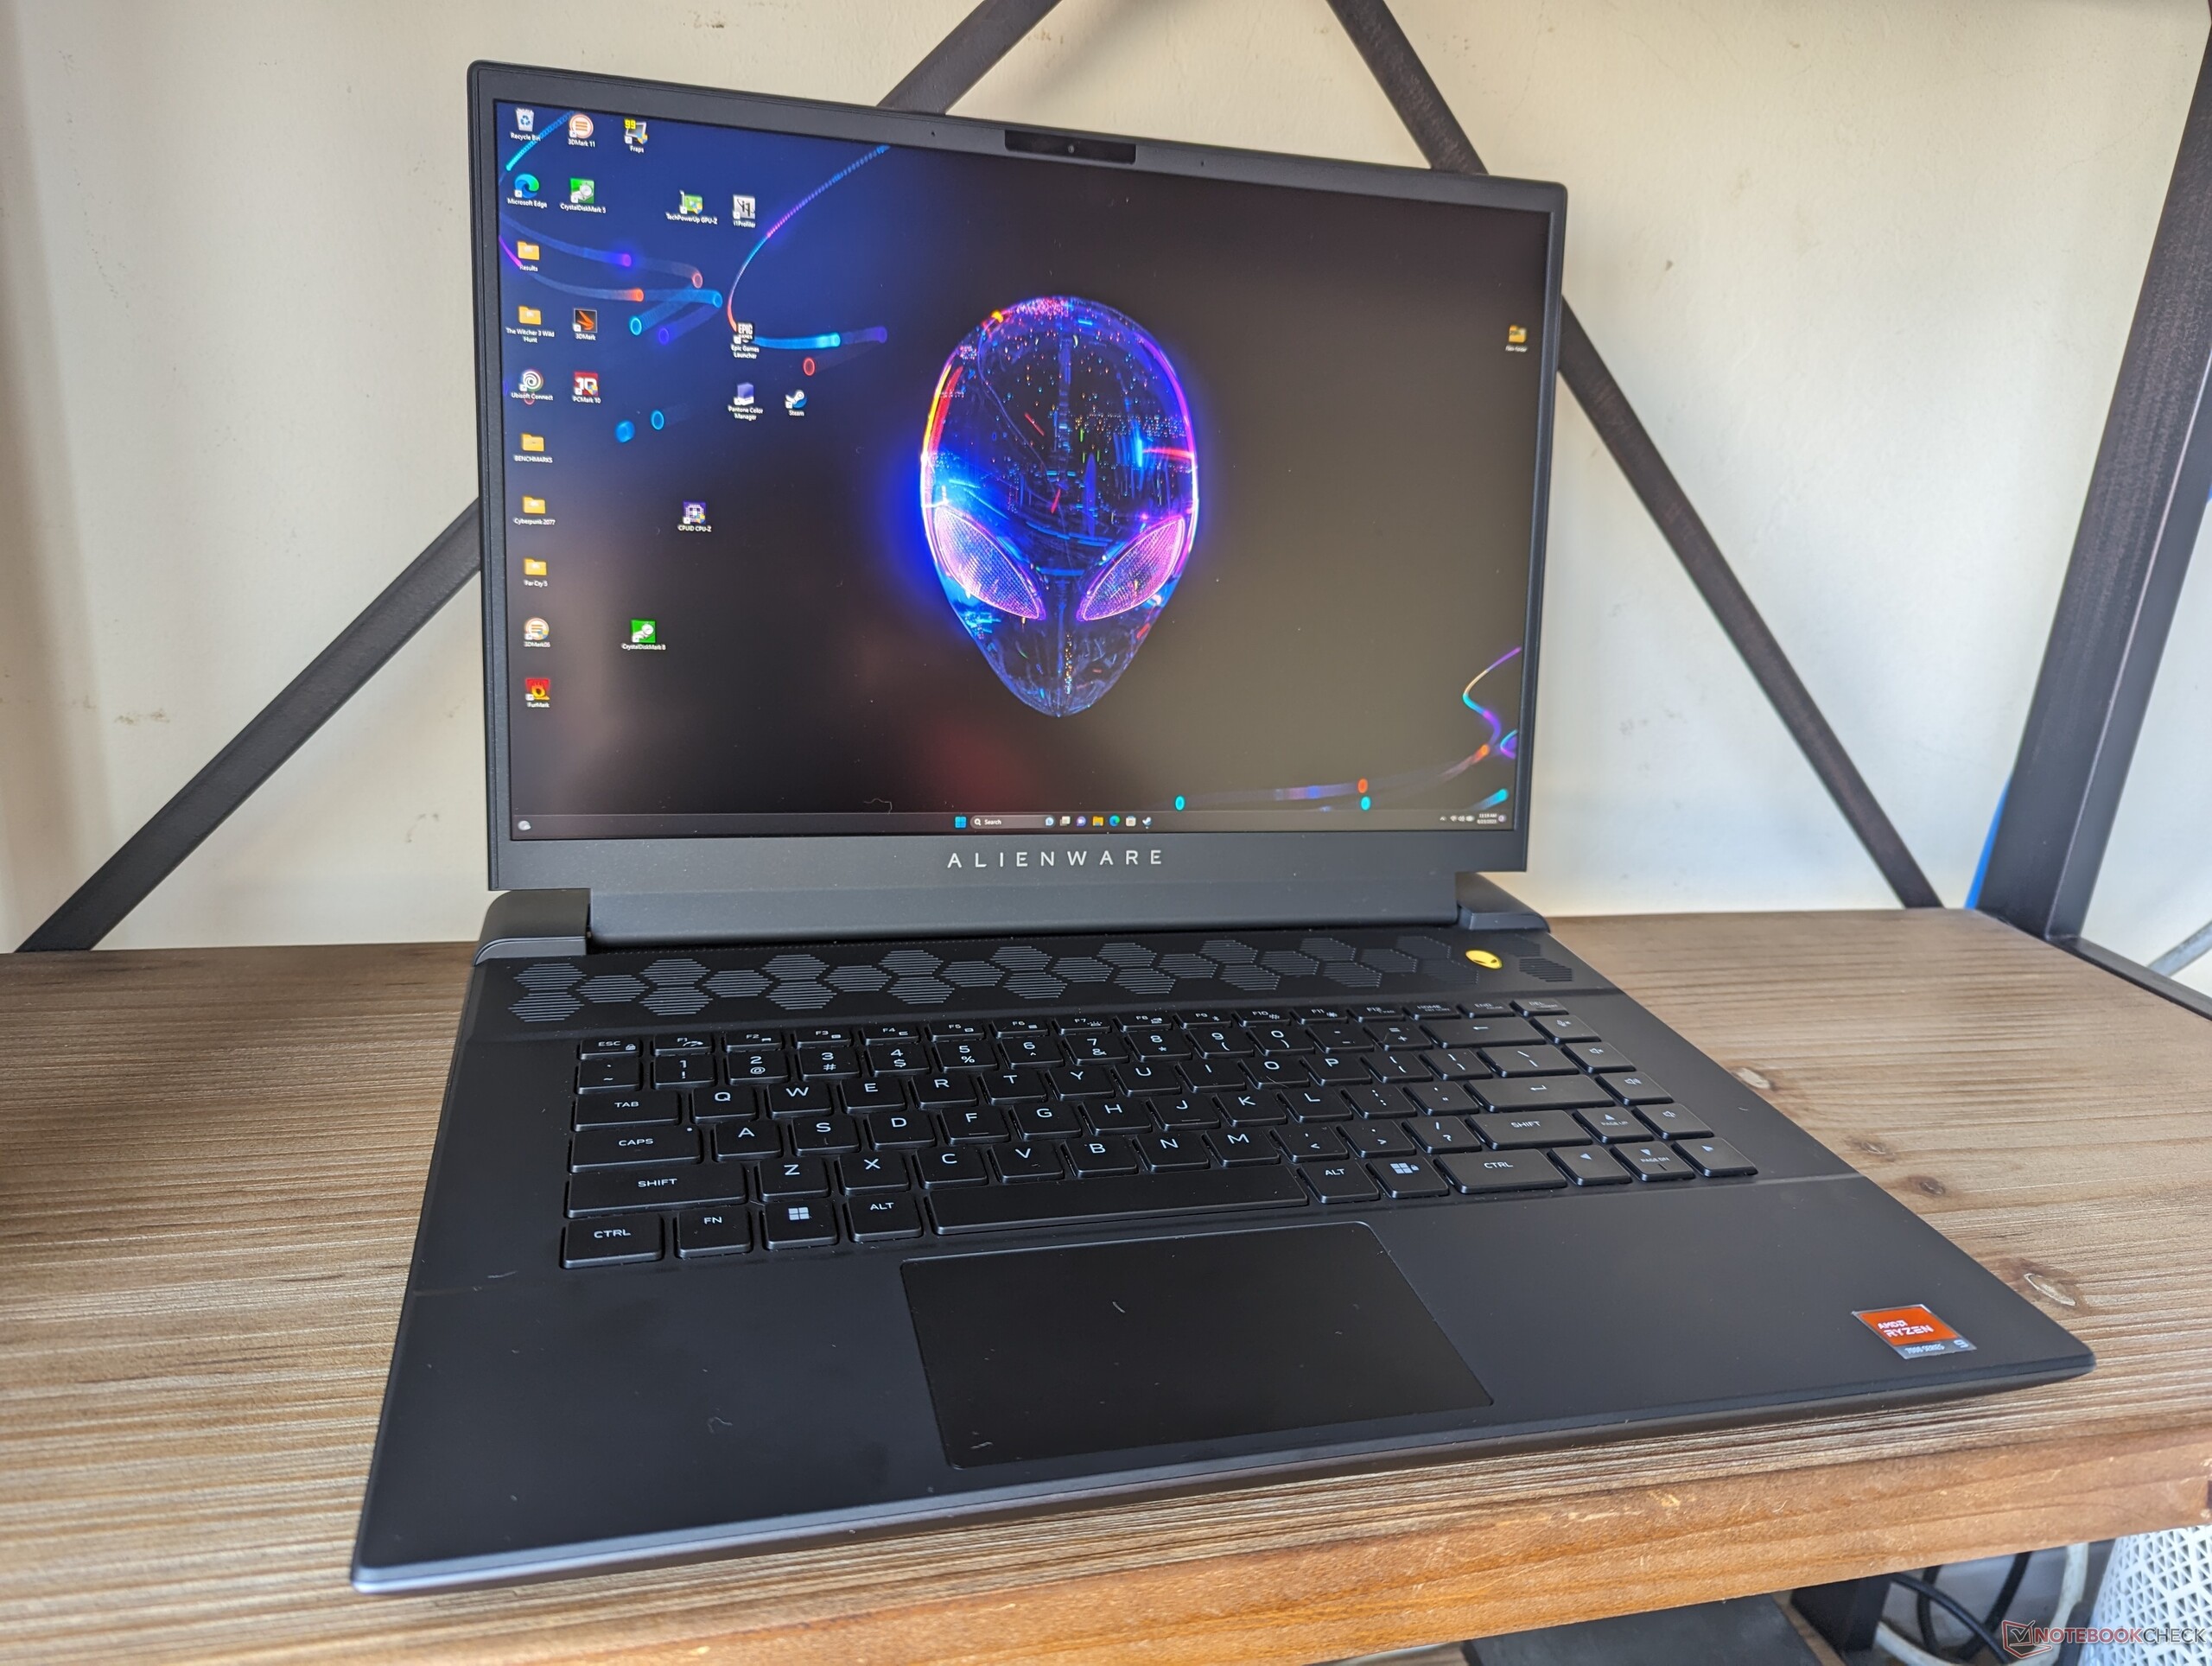
AMD Ryzen 9 7845HX prestandadebut: Alienware m16 R1 laptop recension

Efter att ha lanserat 15,6-tums Alienware m15, 17-tums Alienware m17och 18-tums Alienware m18är Dell nu redo att leverera 16-tums Alienware m16 komplett med de senaste Nvidia Ada Lovelace GPU:erna och valet mellan antingen Intels 13:e generation Raptor Lake eller AMD Zen 4-processorer. Alienware m16 skiljer sig från den senaste Alienware x16 som är en ännu tunnare modell med andra specifikationer och funktioner.
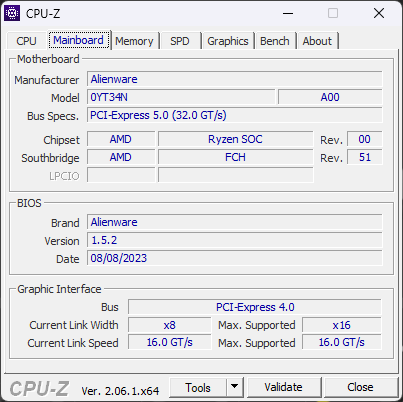
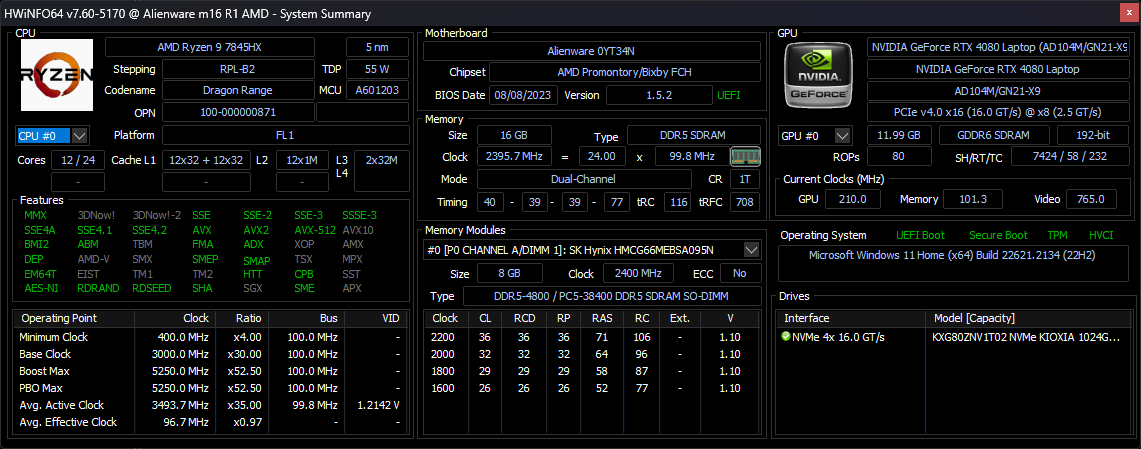
Vår granskningsenhet är en AMD-konfiguration i övre mellanklassen med Ryzen 9 7845HX, 175 W GeForce RTX 4080 GPU och 1600p240 IPS-skärm för cirka 2350 USD. Mindre SKU:er är utrustade med Ryzen 7 7745HX CPU och Radeon RX 7600M GPU för 2150 USD medan de dyrare med Ryzen 9 7945HX och RTX 4090 kan säljas för över 3100 USD+ beroende på RAM- och SSD-preferenser. Intel-versionerna kommer med samma skärm och Nvidia GPU-alternativ men med Core i7-13700HX eller i9-13900HX istället.
Konkurrenterna inkluderar andra 16-tums bärbara speldatorer med flaggskepp som HP Omen 16, Lenovo Legion Pro 7 16, Asus ROG Strix G16eller Razer Blade 16.
Fler recensioner av Dell:
Potentiella konkurrenter i jämförelse
Gradering | Datum | Modell | Vikt | Höjd | Storlek | Upplösning | Pris |
|---|---|---|---|---|---|---|---|
| 89.2 % v7 (old) | 08/2023 | Alienware m16 R1 AMD R9 7845HX, GeForce RTX 4080 Laptop GPU | 3.1 kg | 25.4 mm | 16.00" | 2560x1600 | |
| 88.4 % v7 (old) | 06/2023 | Alienware x16 R1 i9-13900HK, GeForce RTX 4080 Laptop GPU | 2.6 kg | 18.57 mm | 16.00" | 2560x1600 | |
| 87.9 % v7 (old) | 08/2023 | HP Omen Transcend 16 i9-13900HX, GeForce RTX 4070 Laptop GPU | 2.3 kg | 19.8 mm | 16.00" | 2560x1600 | |
| 88.8 % v7 (old) | 06/2023 | Lenovo Legion Pro 7 RTX4090 i9-13900HX, GeForce RTX 4090 Laptop GPU | 2.7 kg | 26 mm | 16.00" | 2560x1600 | |
| 88.4 % v7 (old) | 03/2023 | Asus ROG Strix G16 G614JZ i9-13980HX, GeForce RTX 4080 Laptop GPU | 2.4 kg | 30.4 mm | 16.00" | 2560x1600 | |
| 91.2 % v7 (old) | 02/2023 | Razer Blade 16 Early 2023 i9-13950HX, GeForce RTX 4080 Laptop GPU | 2.4 kg | 21.99 mm | 16.00" | 2560x1600 |
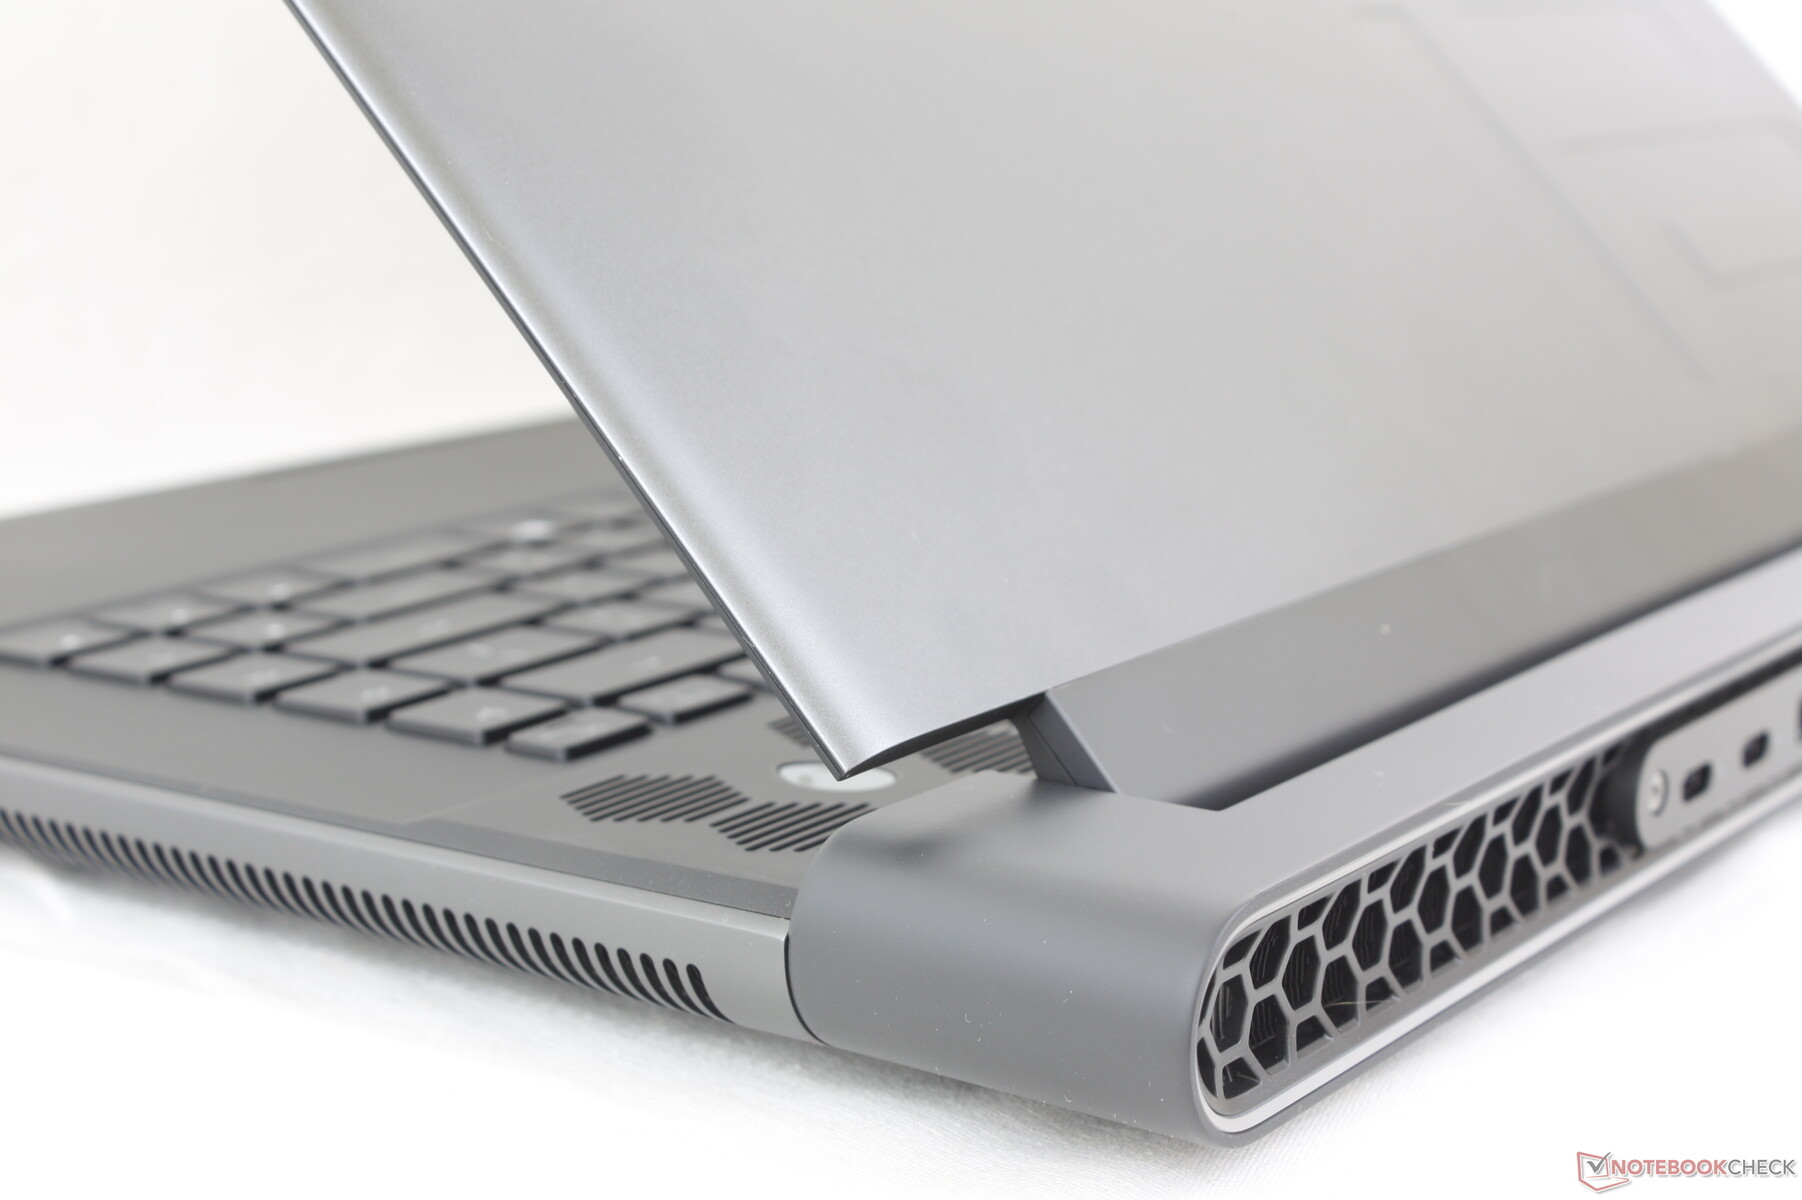
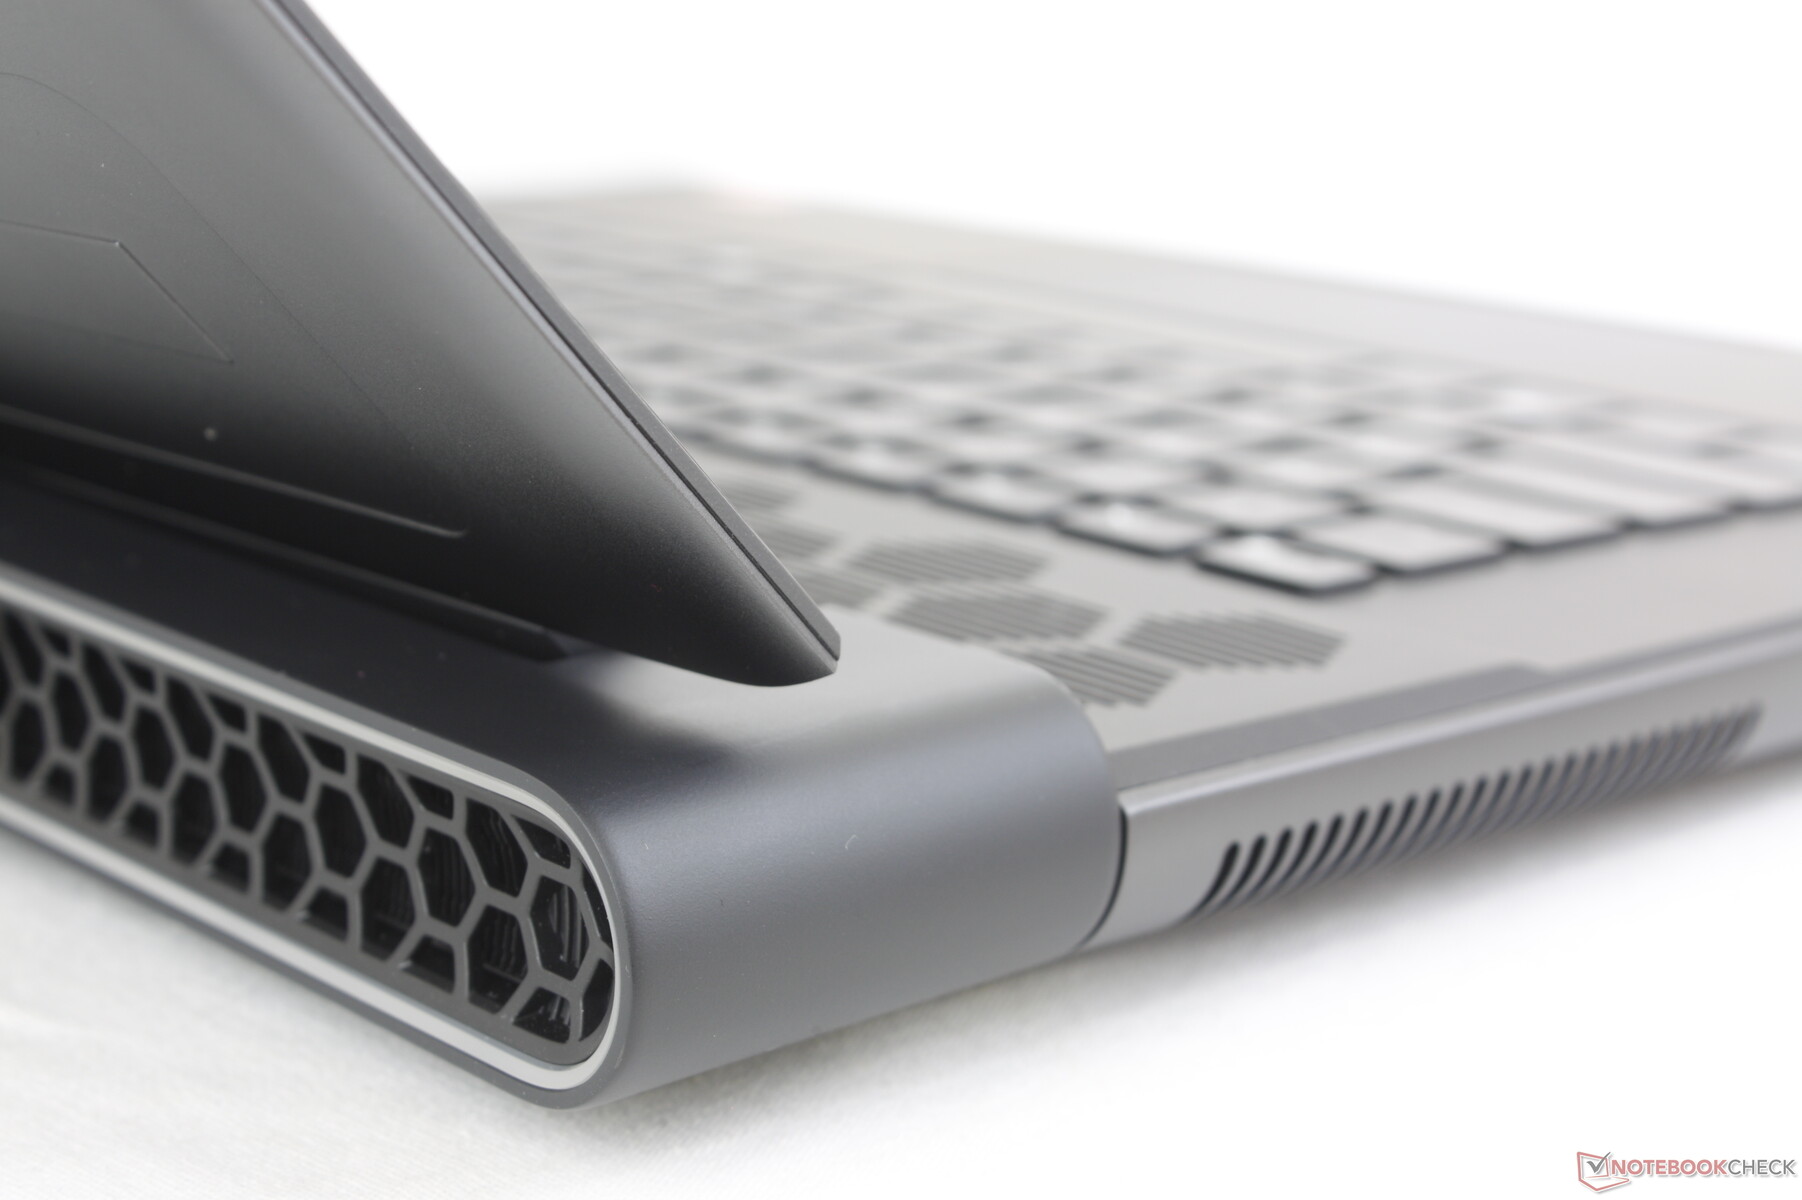
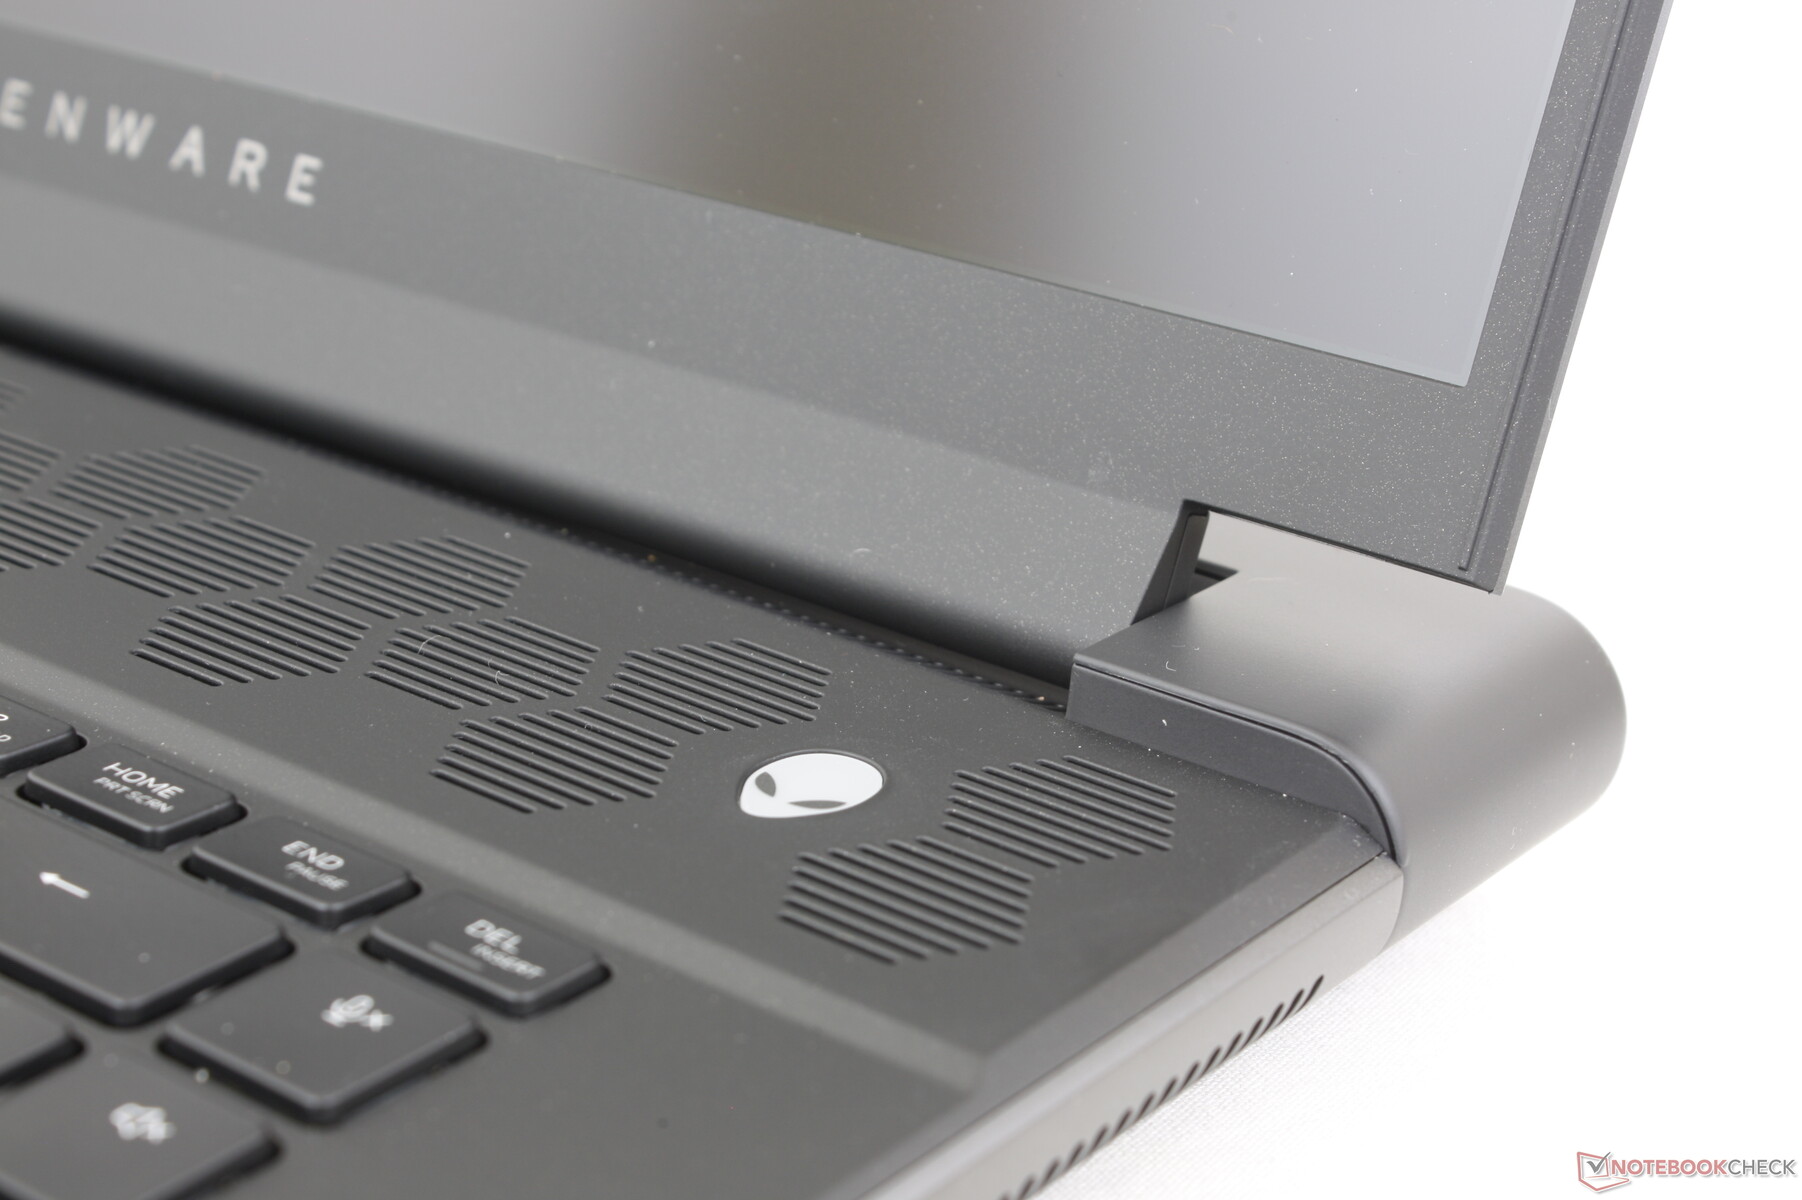
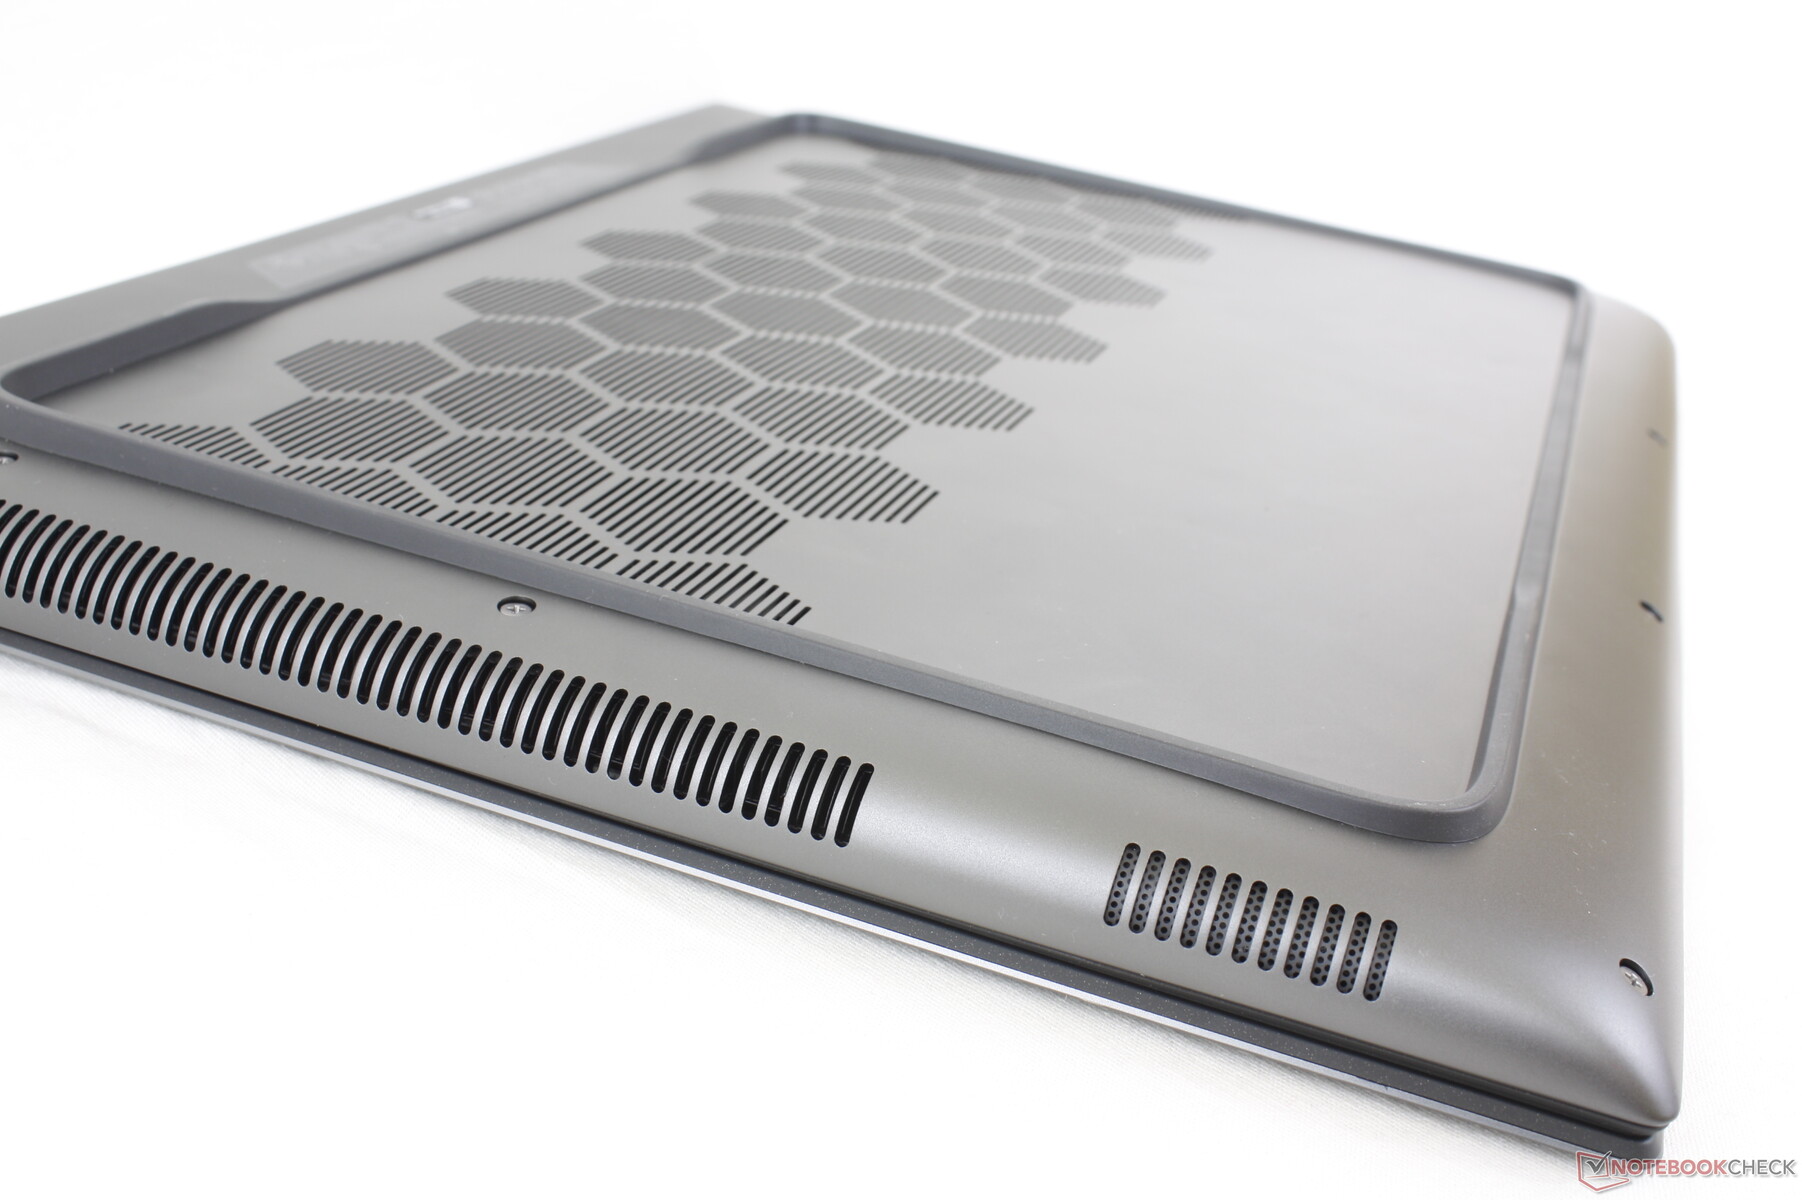
Fodral - Omisskännligt Alienware
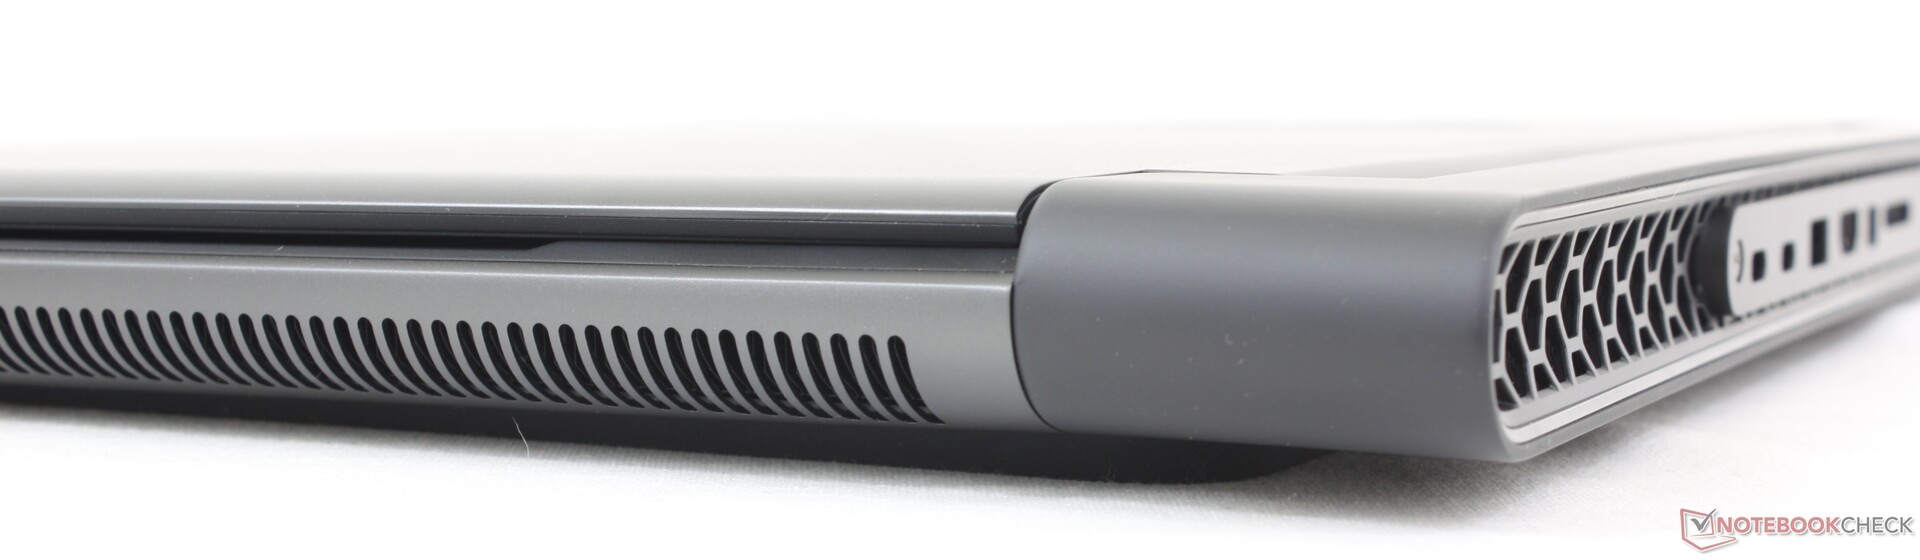
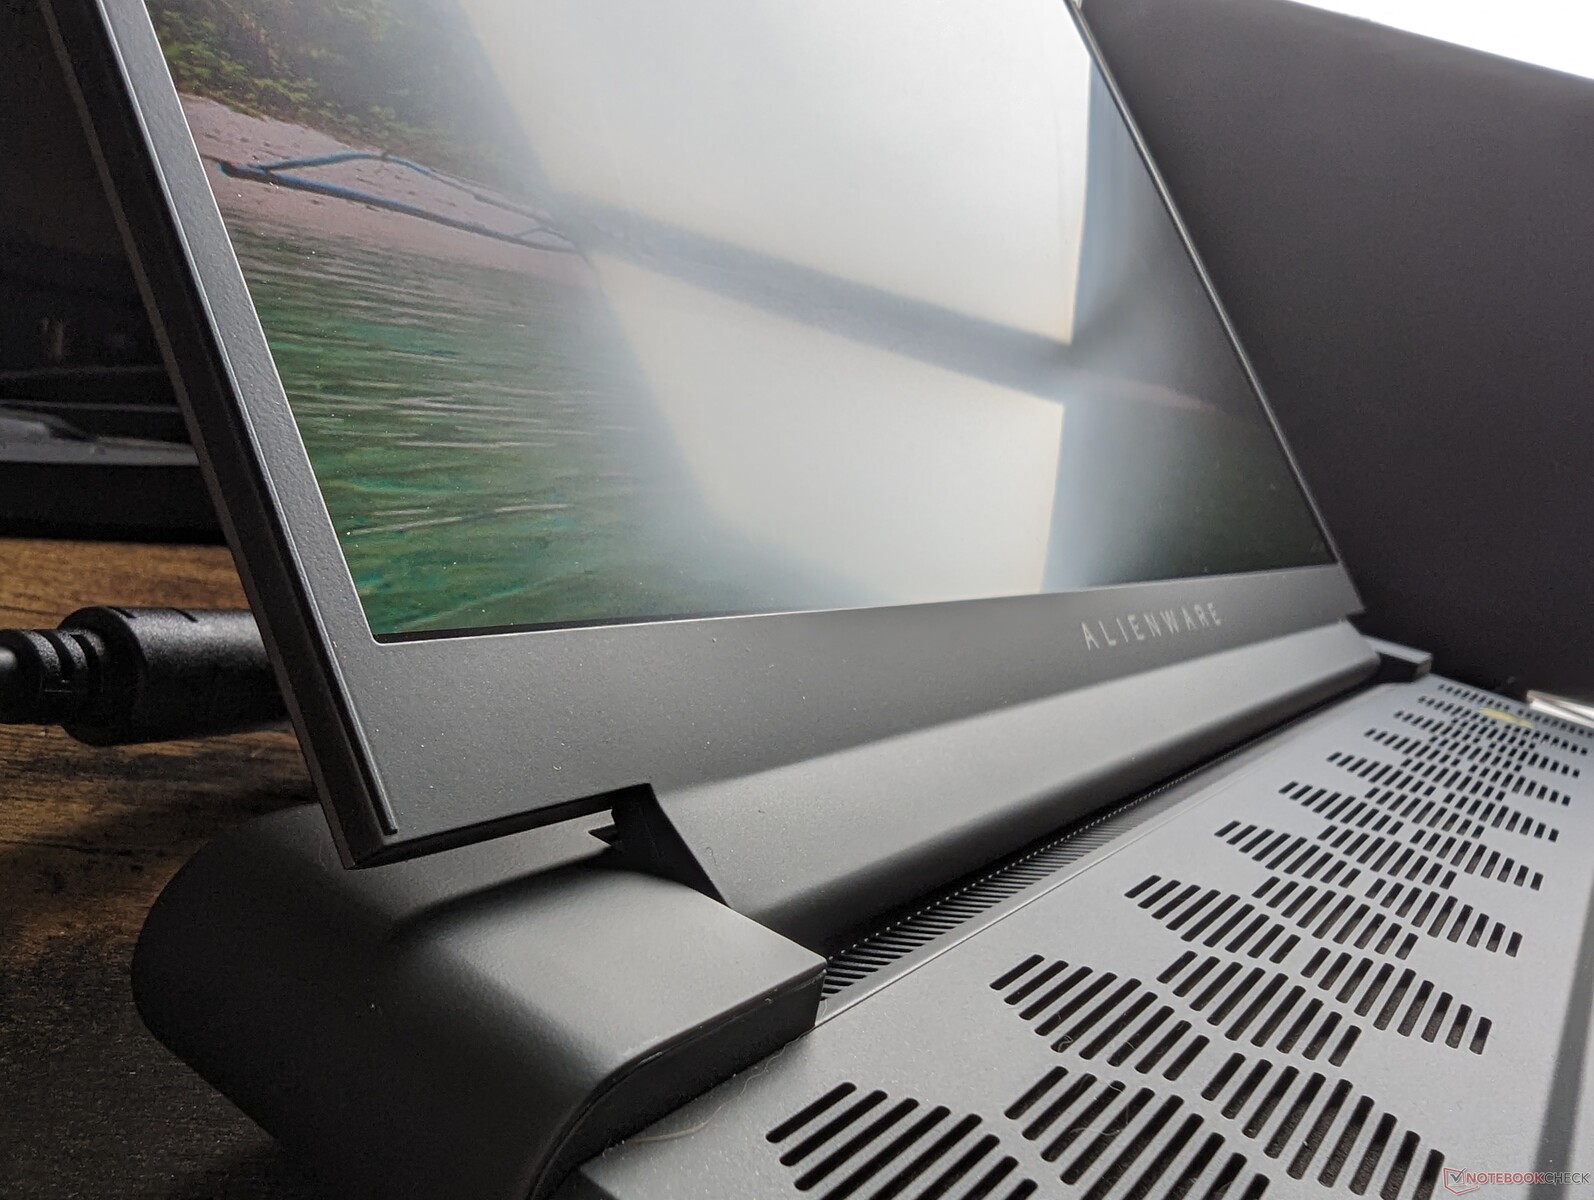
Chassit är i princip en tjockare version av Alienware x16 R1 eftersom båda modellerna är baserade på samma Legend 3.0 industridesign. Den gummerade omkretsfoten, ytterlocket i aluminium, de sexkantiga ventilationsgallren, den bakre LED-ringen och det mattsvarta tangentbordsdäcket är en kombination som inte ses på någon konkurrerande modell. Basen, locket och gångjärnen är alla fasta utan hörbart knakande när man försöker vrida eller böja dem för starkare första intryck än en Asus TUF Gaming A16 eller Lenovo Legion Pro 7 16.
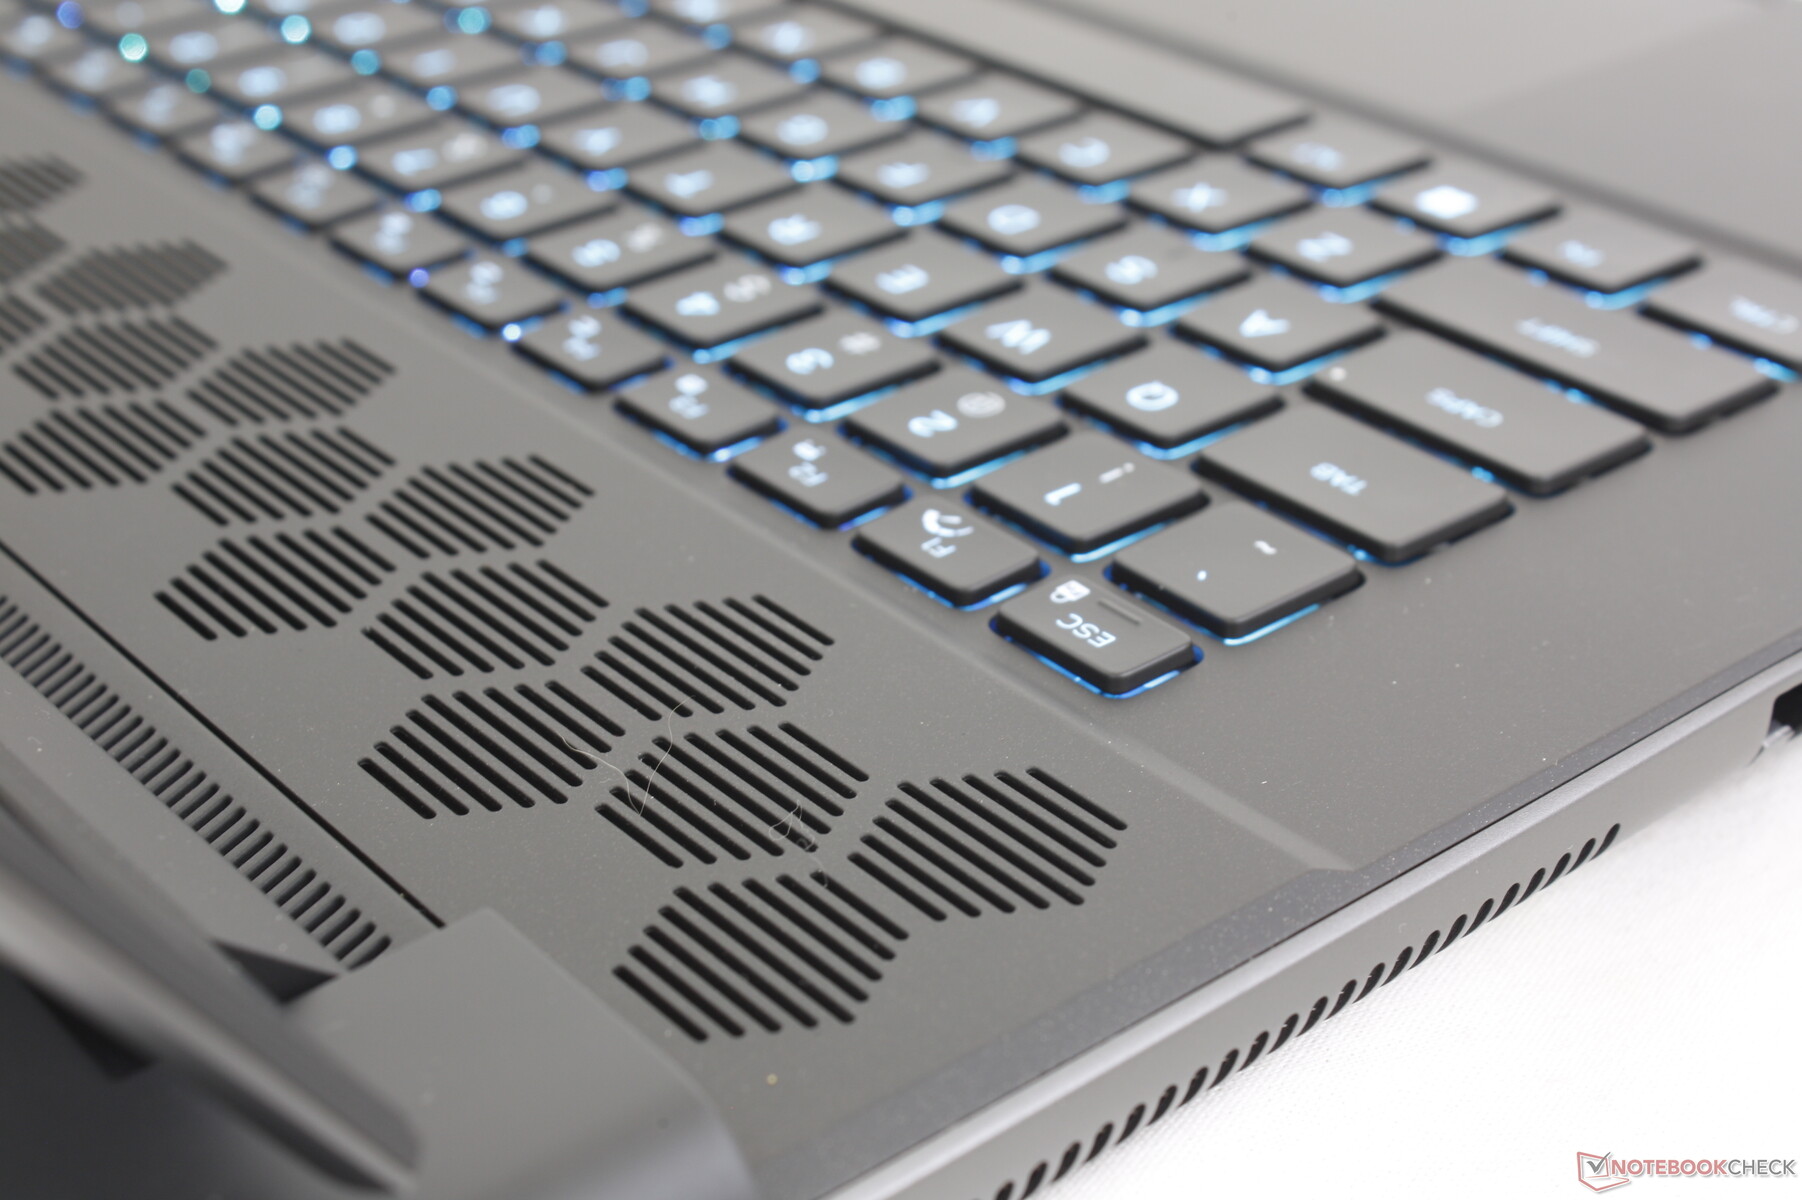
De svarta handflatestöden, klickplattan och tangentbordstangenterna fortsätter att vara fingeravtrycksmagneter. Dell erbjuder inga andra färgalternativ utöver Dark Metallic Moon för tillfället.
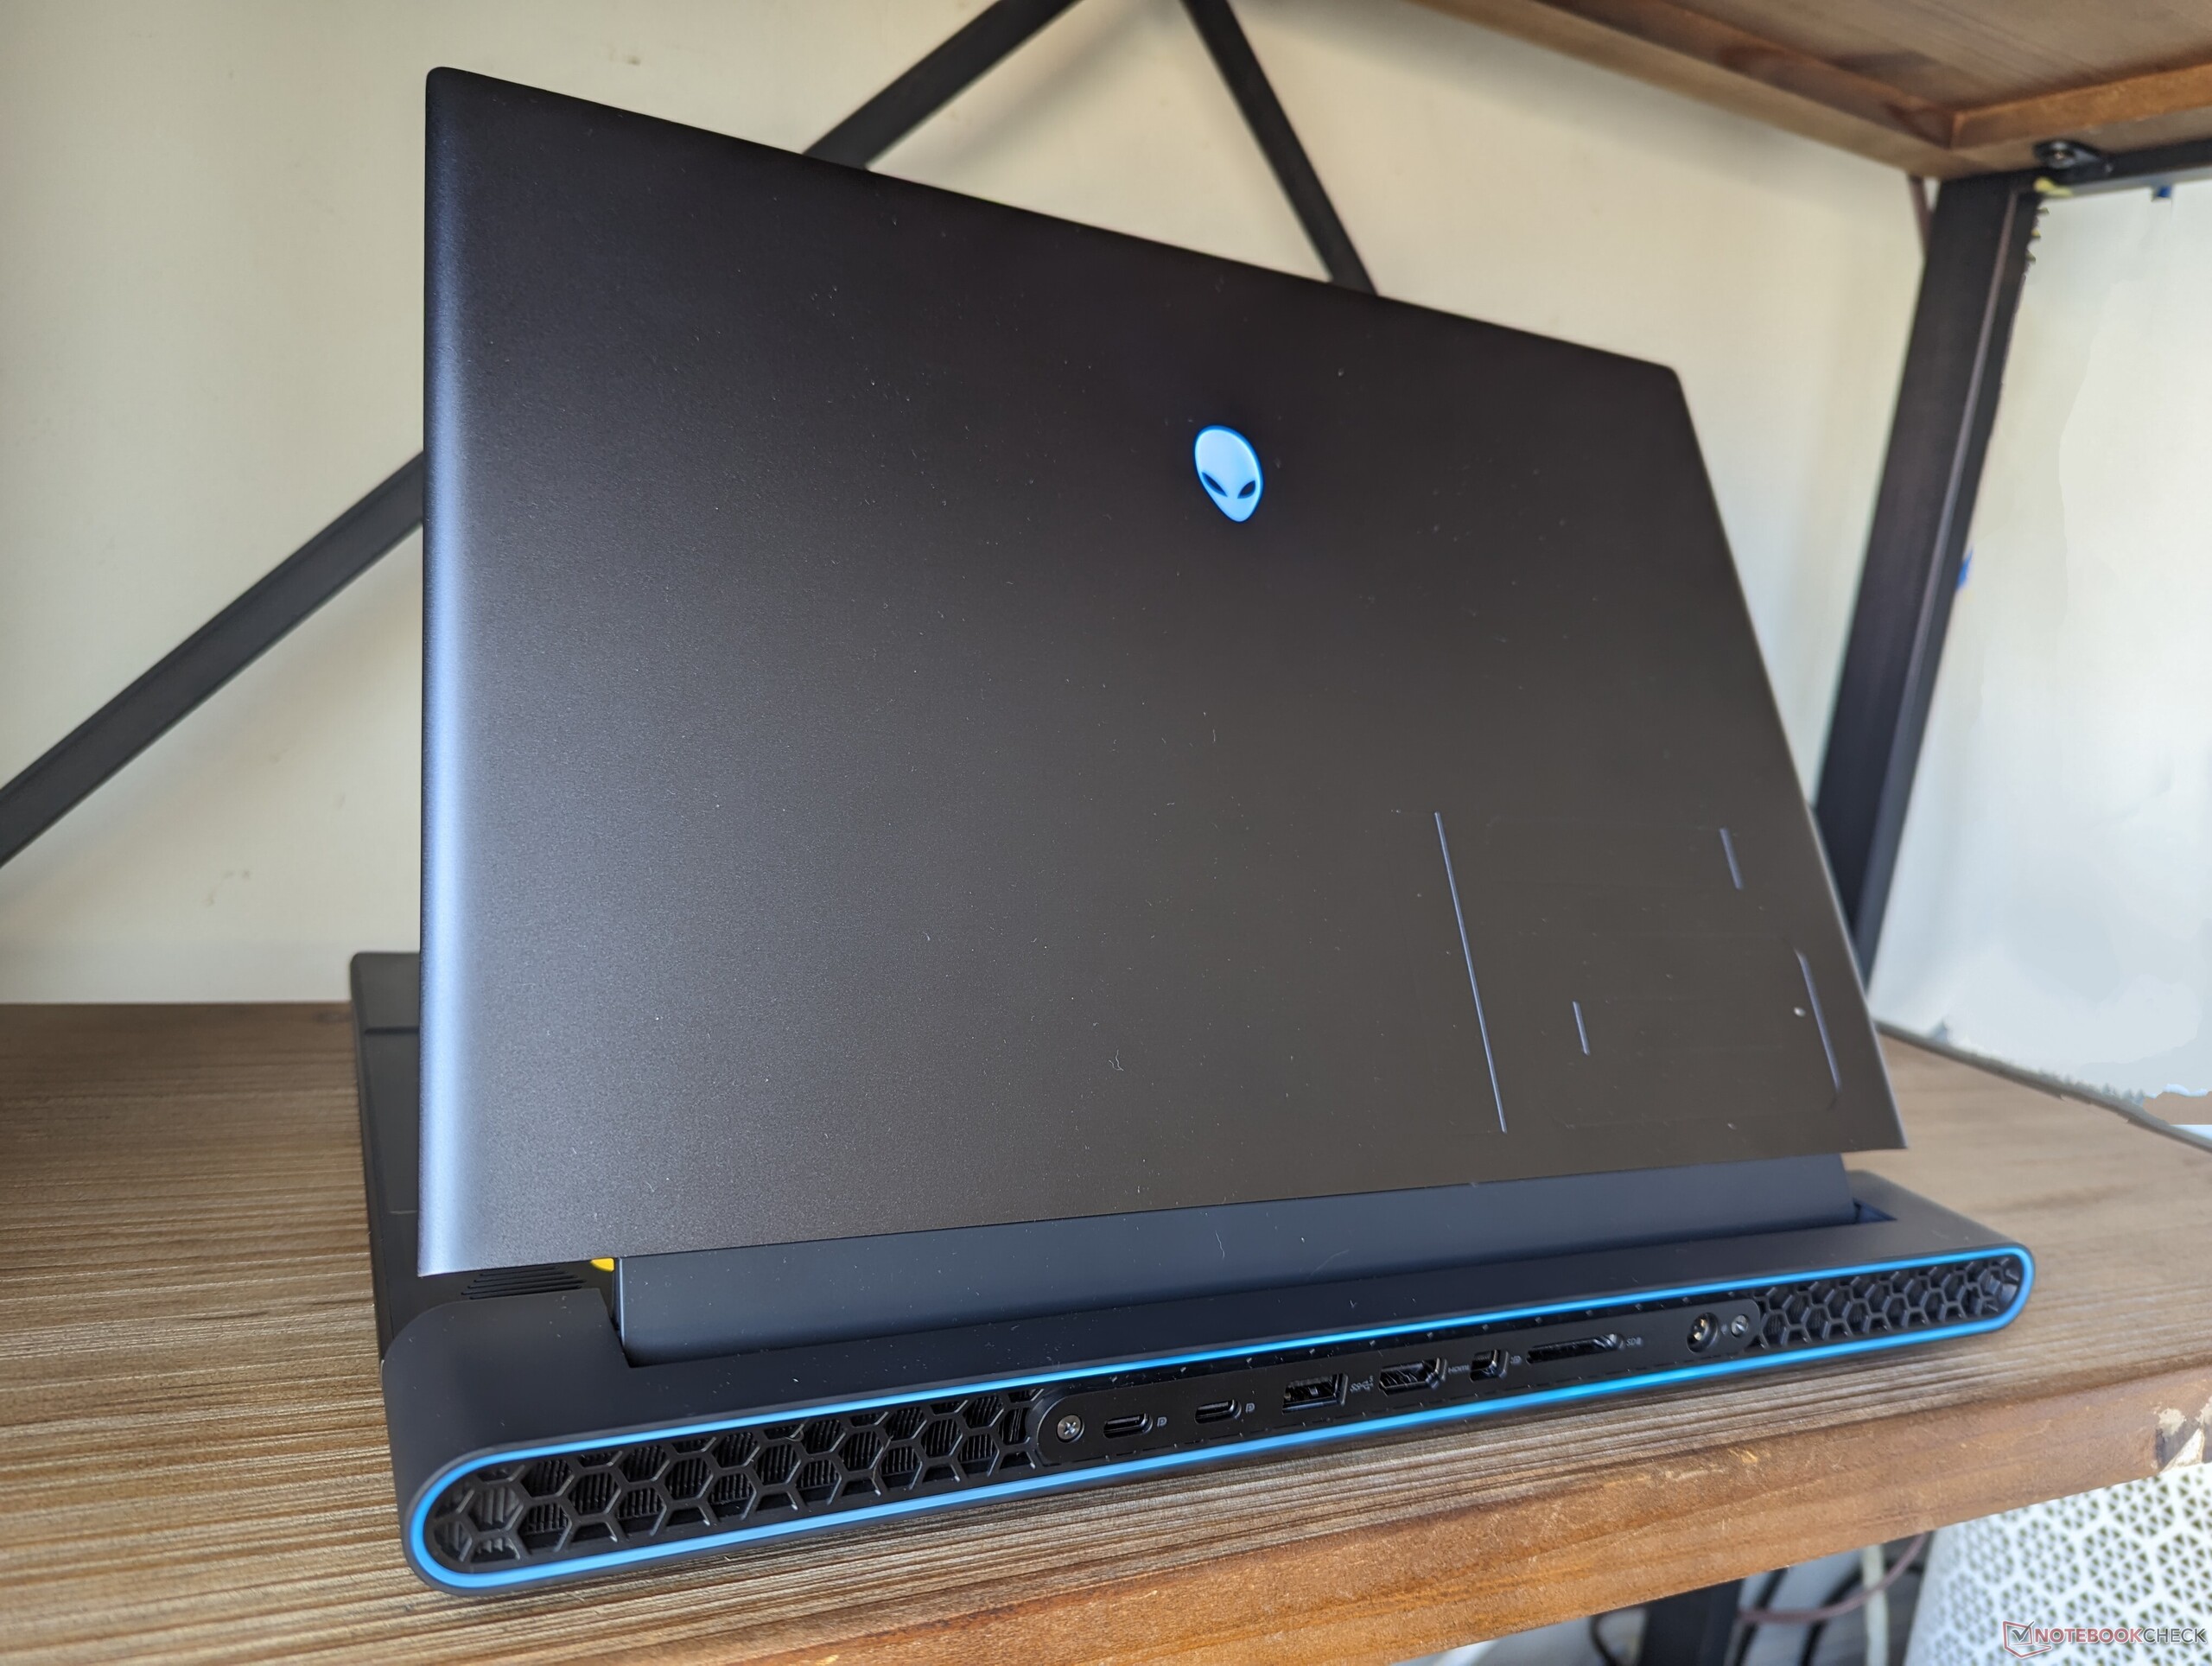
Alienware m16 R1 är en av de tyngsta 16-tums bärbara speldatorerna och även en av de största när det gäller längd och bredd på grund av dess förlängda baksida. Den täta designen ger en mycket robust konstruktion, även om det kostar på bärbarheten. Den Legion Pro 7är till exempel 400 g lättare och har ett mycket mindre fotavtryck samtidigt som den erbjuder liknande HX-klassade processorer och avancerade GPU:er.
Anslutning - Thunderbolt Endast för Intel-versioner
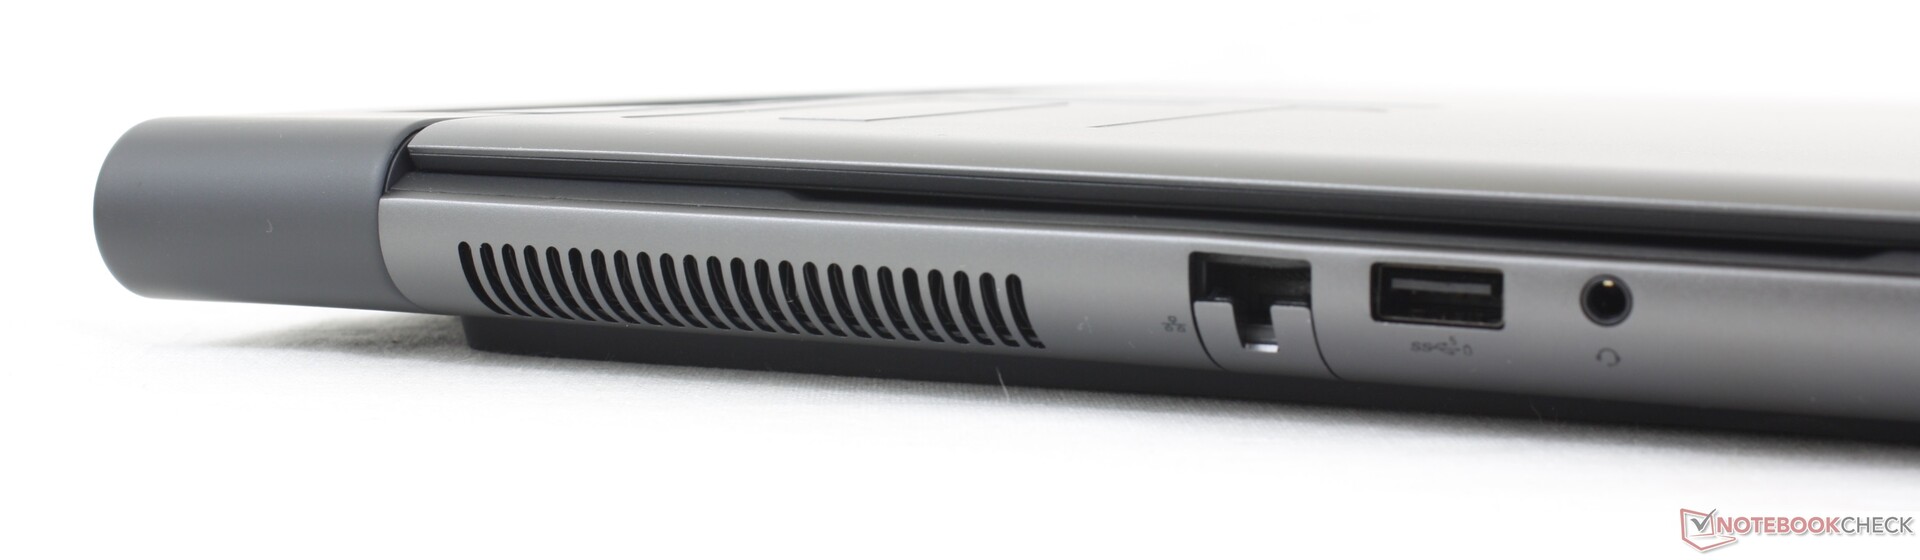
Portalternativen inkluderar allt som finns på Alienware x16 R1 plus RJ-45 och en SD-läsare i full storlek istället för MicroSD. Några portar har också flyttats till den vänstra kanten medan de alla är klämda längs baksidan på x16. Mini-DisplayPort är också anmärkningsvärt eftersom det är ovanligt på nyare bärbara speldatorer.
USB4 och Thunderbolt stöds inte på vår AMD-modell.
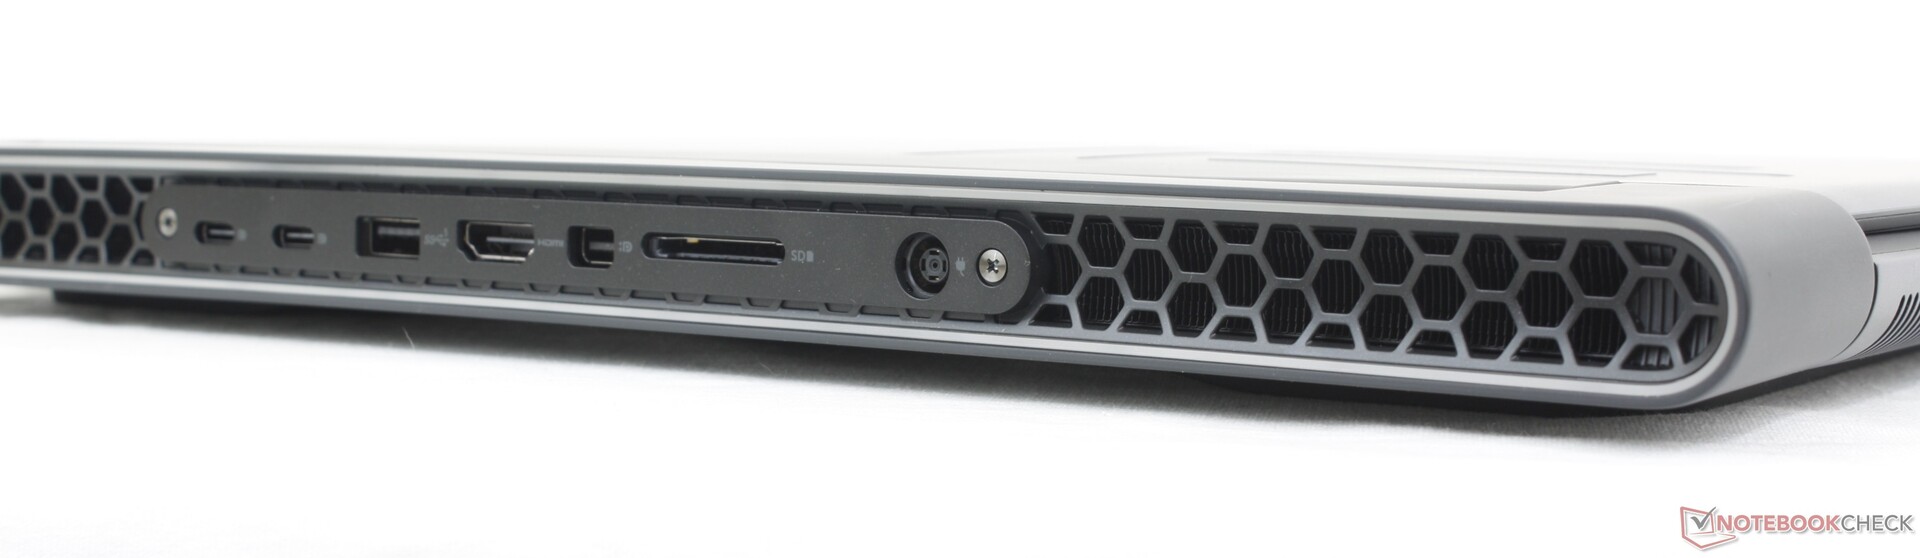
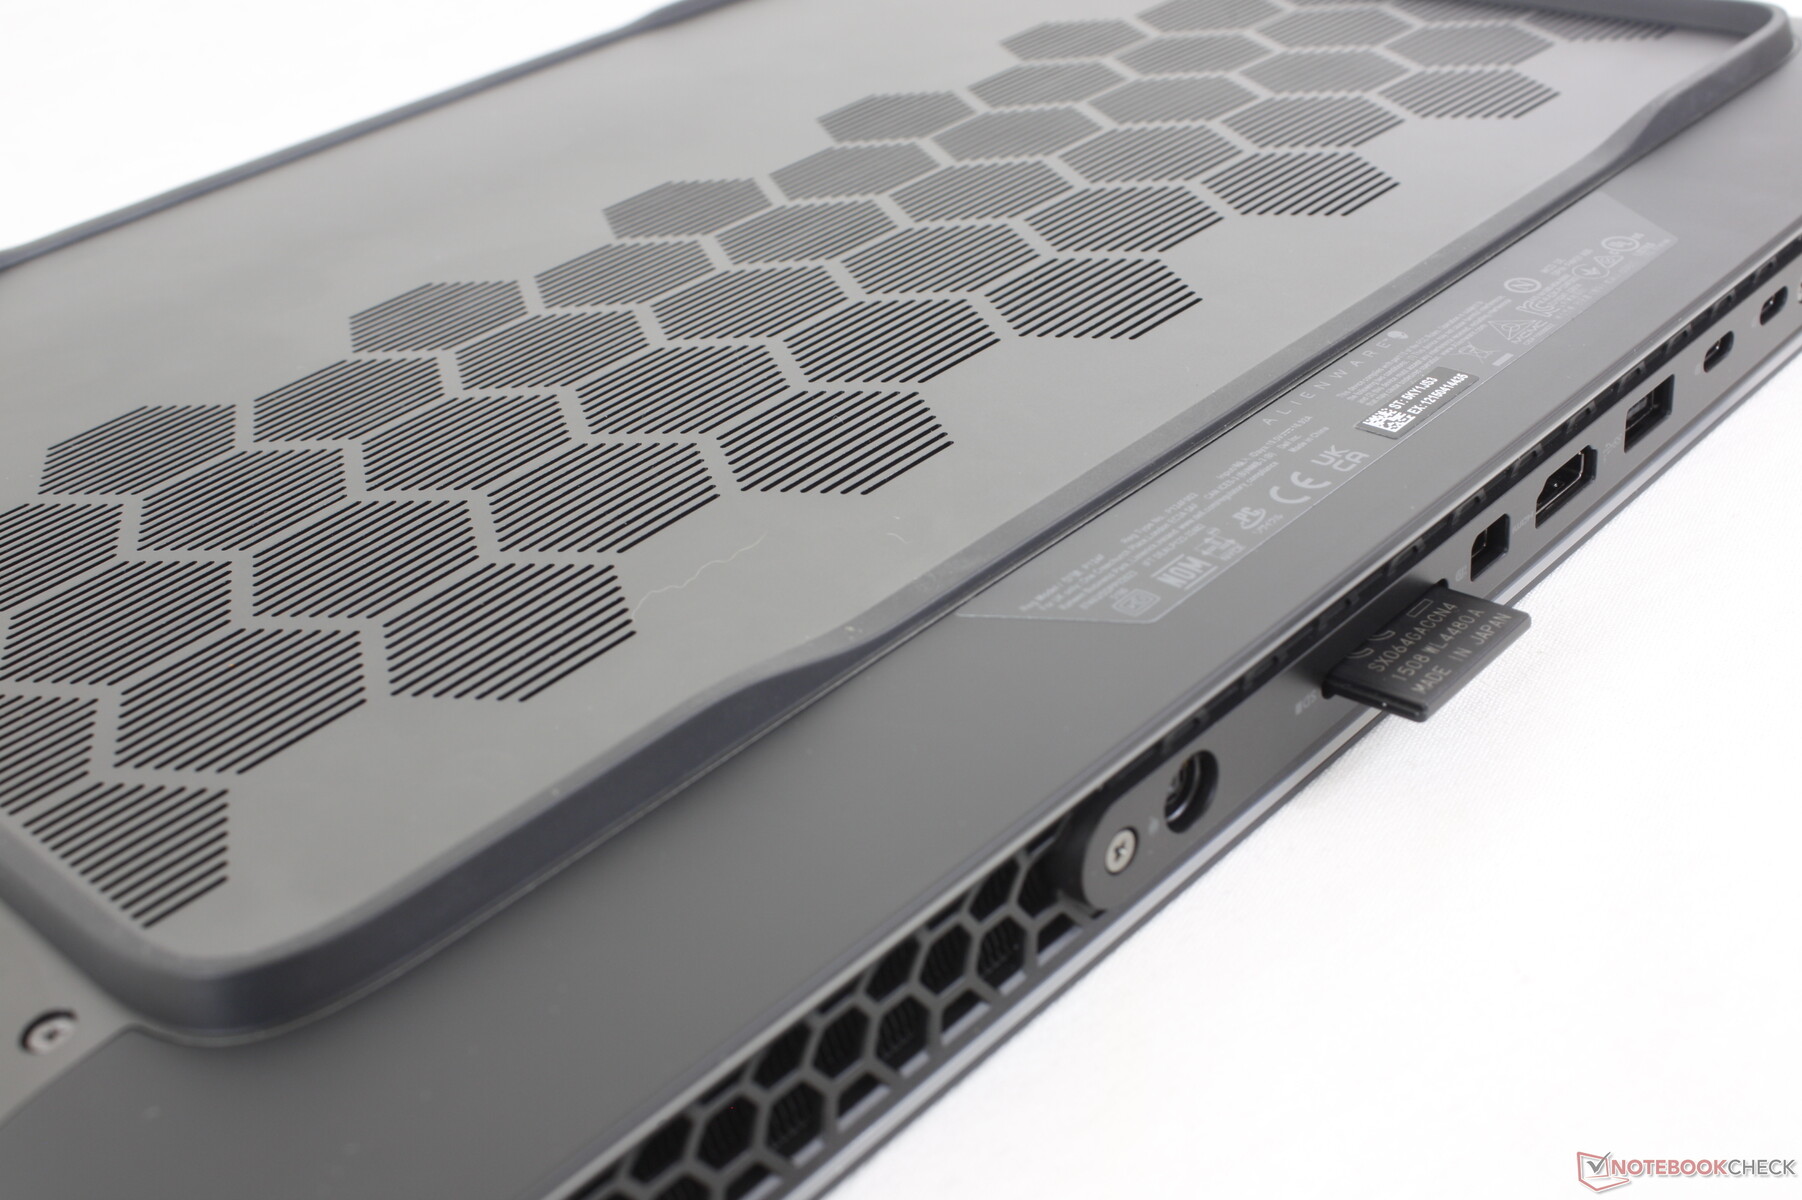
SD-kortläsare
Överföringshastigheterna från SD-kortläsaren är snabbare än på de flesta andra bärbara speldatorer, vilket bör tillfredsställa innehållsskapare. Att flytta 1 GB bilder från vårt UHS-II-testkort till skrivbordet tar bara drygt 5 sekunder.
| SD Card Reader | |
| average JPG Copy Test (av. of 3 runs) | |
| Alienware m16 R1 AMD (Toshiba Exceria Pro SDXC 64 GB UHS-II) | |
| Razer Blade 16 Early 2023 (AV PRO microSD 128 GB V60) | |
| Alienware x16 R1 (AV PRO microSD 128 GB V60) | |
| maximum AS SSD Seq Read Test (1GB) | |
| Alienware x16 R1 (AV PRO microSD 128 GB V60) | |
| Alienware m16 R1 AMD (Toshiba Exceria Pro SDXC 64 GB UHS-II) | |
| Razer Blade 16 Early 2023 (AV PRO microSD 128 GB V60) | |
Kommunikation
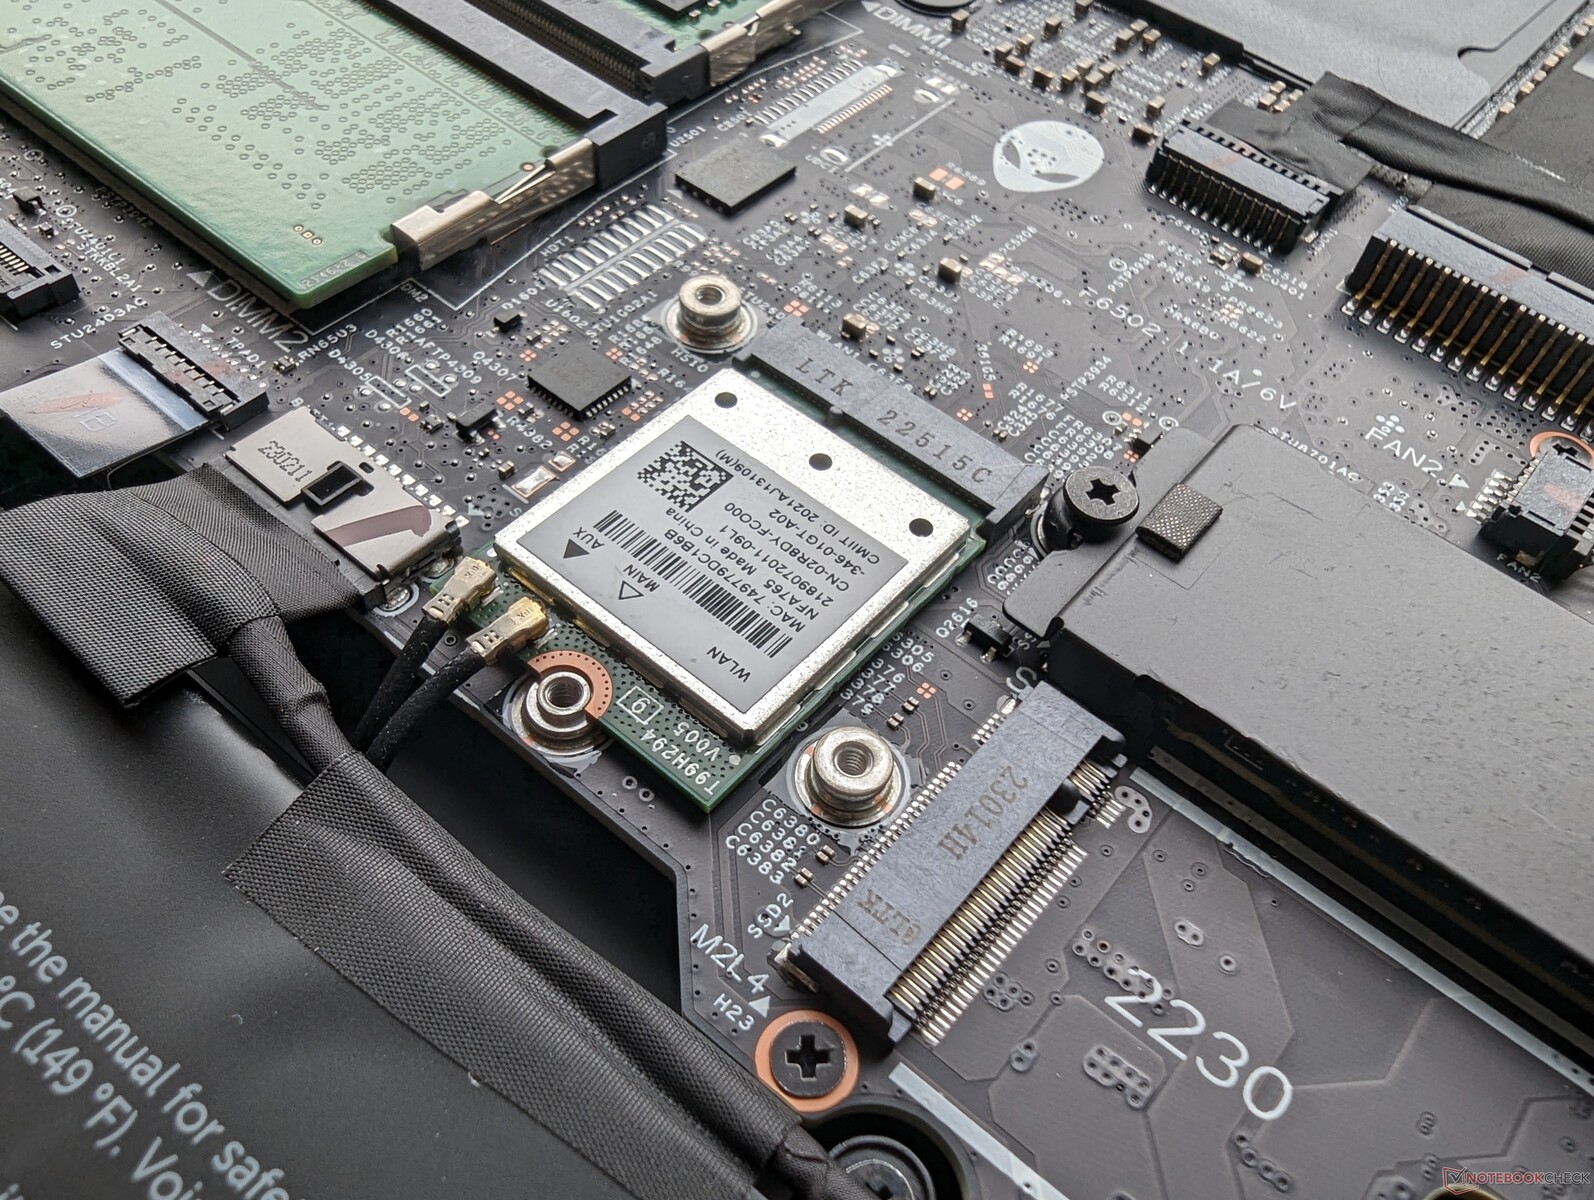
AMD SKU:er levereras med Qualcomm WCN685x medan Intel SKU:er levereras med Killer AX1675, båda med Wi-Fi 6E-anslutning. Prestandan är både stabil och pålitlig när den kopplas till vårt 6 GHz-nätverk.
| Networking | |
| iperf3 transmit AXE11000 | |
| Lenovo Legion Pro 7 RTX4090 | |
| Asus ROG Strix G16 G614JZ | |
| Alienware m16 R1 AMD | |
| HP Omen Transcend 16 | |
| Razer Blade 16 Early 2023 | |
| Alienware x16 R1 | |
| iperf3 receive AXE11000 | |
| Lenovo Legion Pro 7 RTX4090 | |
| Asus ROG Strix G16 G614JZ | |
| Alienware m16 R1 AMD | |
| HP Omen Transcend 16 | |
| Razer Blade 16 Early 2023 | |
| Alienware x16 R1 | |
| iperf3 transmit AXE11000 6GHz | |
| Alienware m16 R1 AMD | |
| HP Omen Transcend 16 | |
| Razer Blade 16 Early 2023 | |
| Alienware x16 R1 | |
| iperf3 receive AXE11000 6GHz | |
| Alienware m16 R1 AMD | |
| HP Omen Transcend 16 | |
| Razer Blade 16 Early 2023 | |
| Alienware x16 R1 | |
Webbkamera
Det finns en 2 MP webbkamera med IR och ingen sekretesslucka, precis som på Alienware x16.


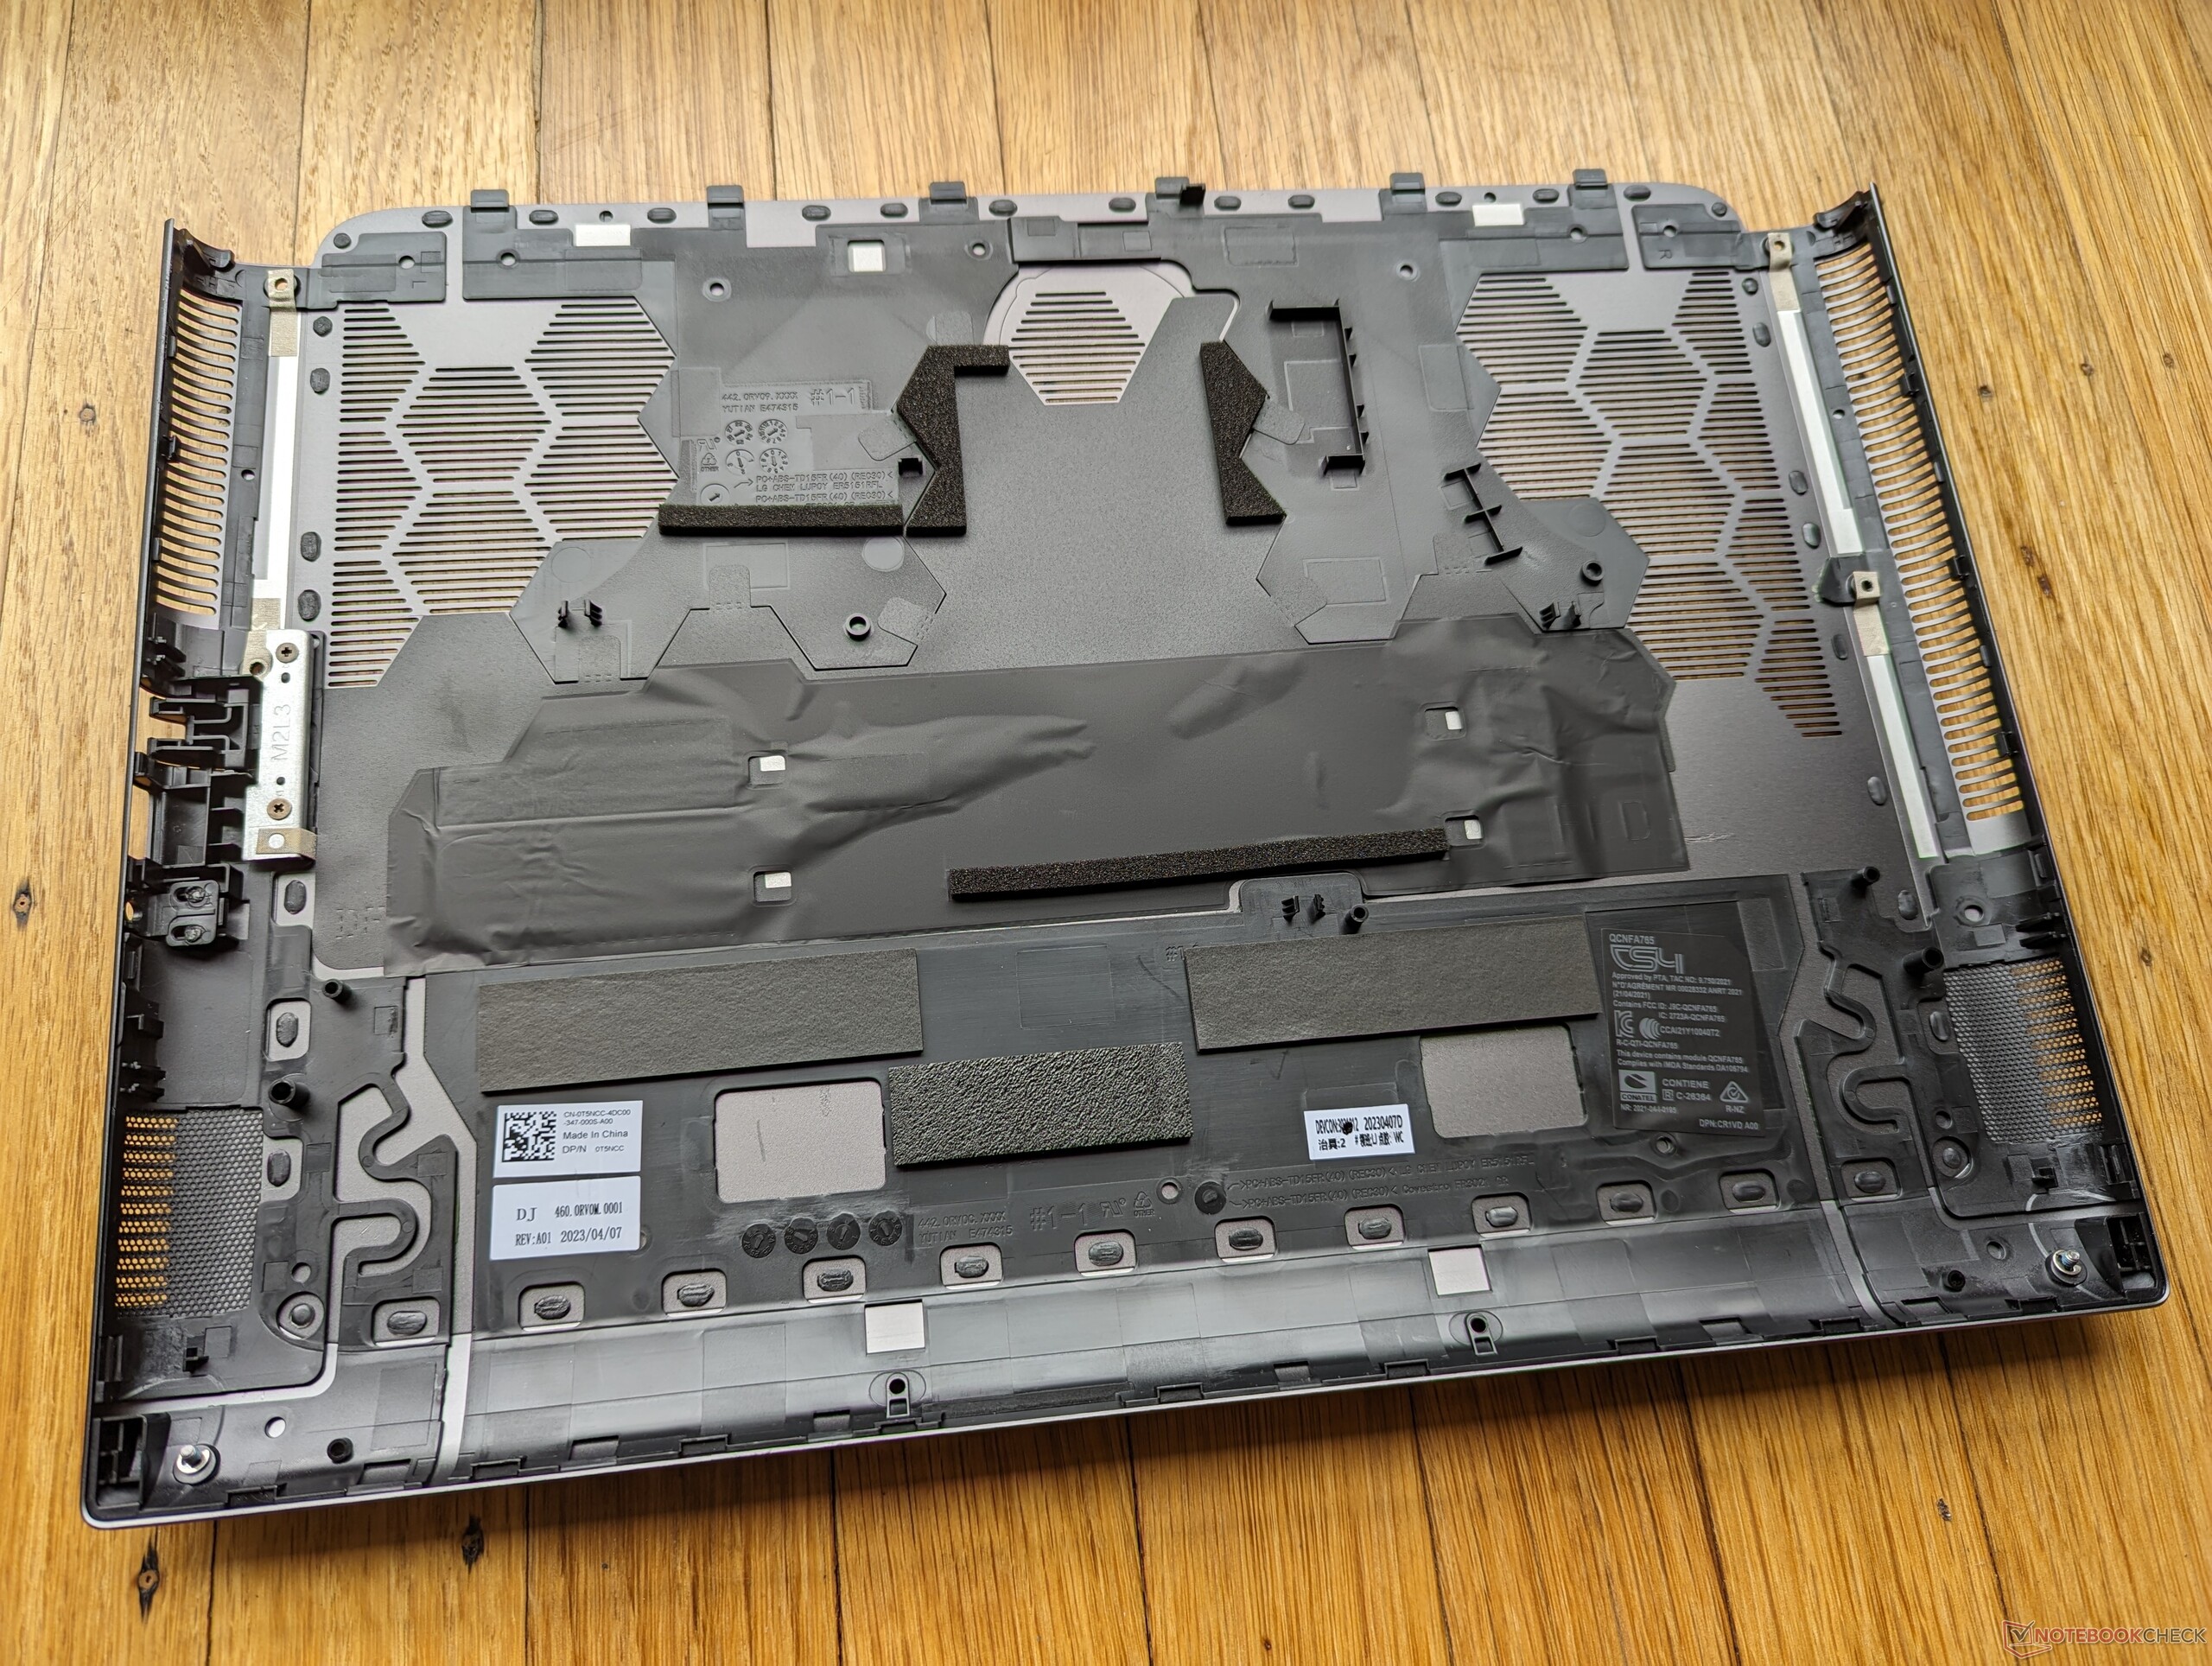
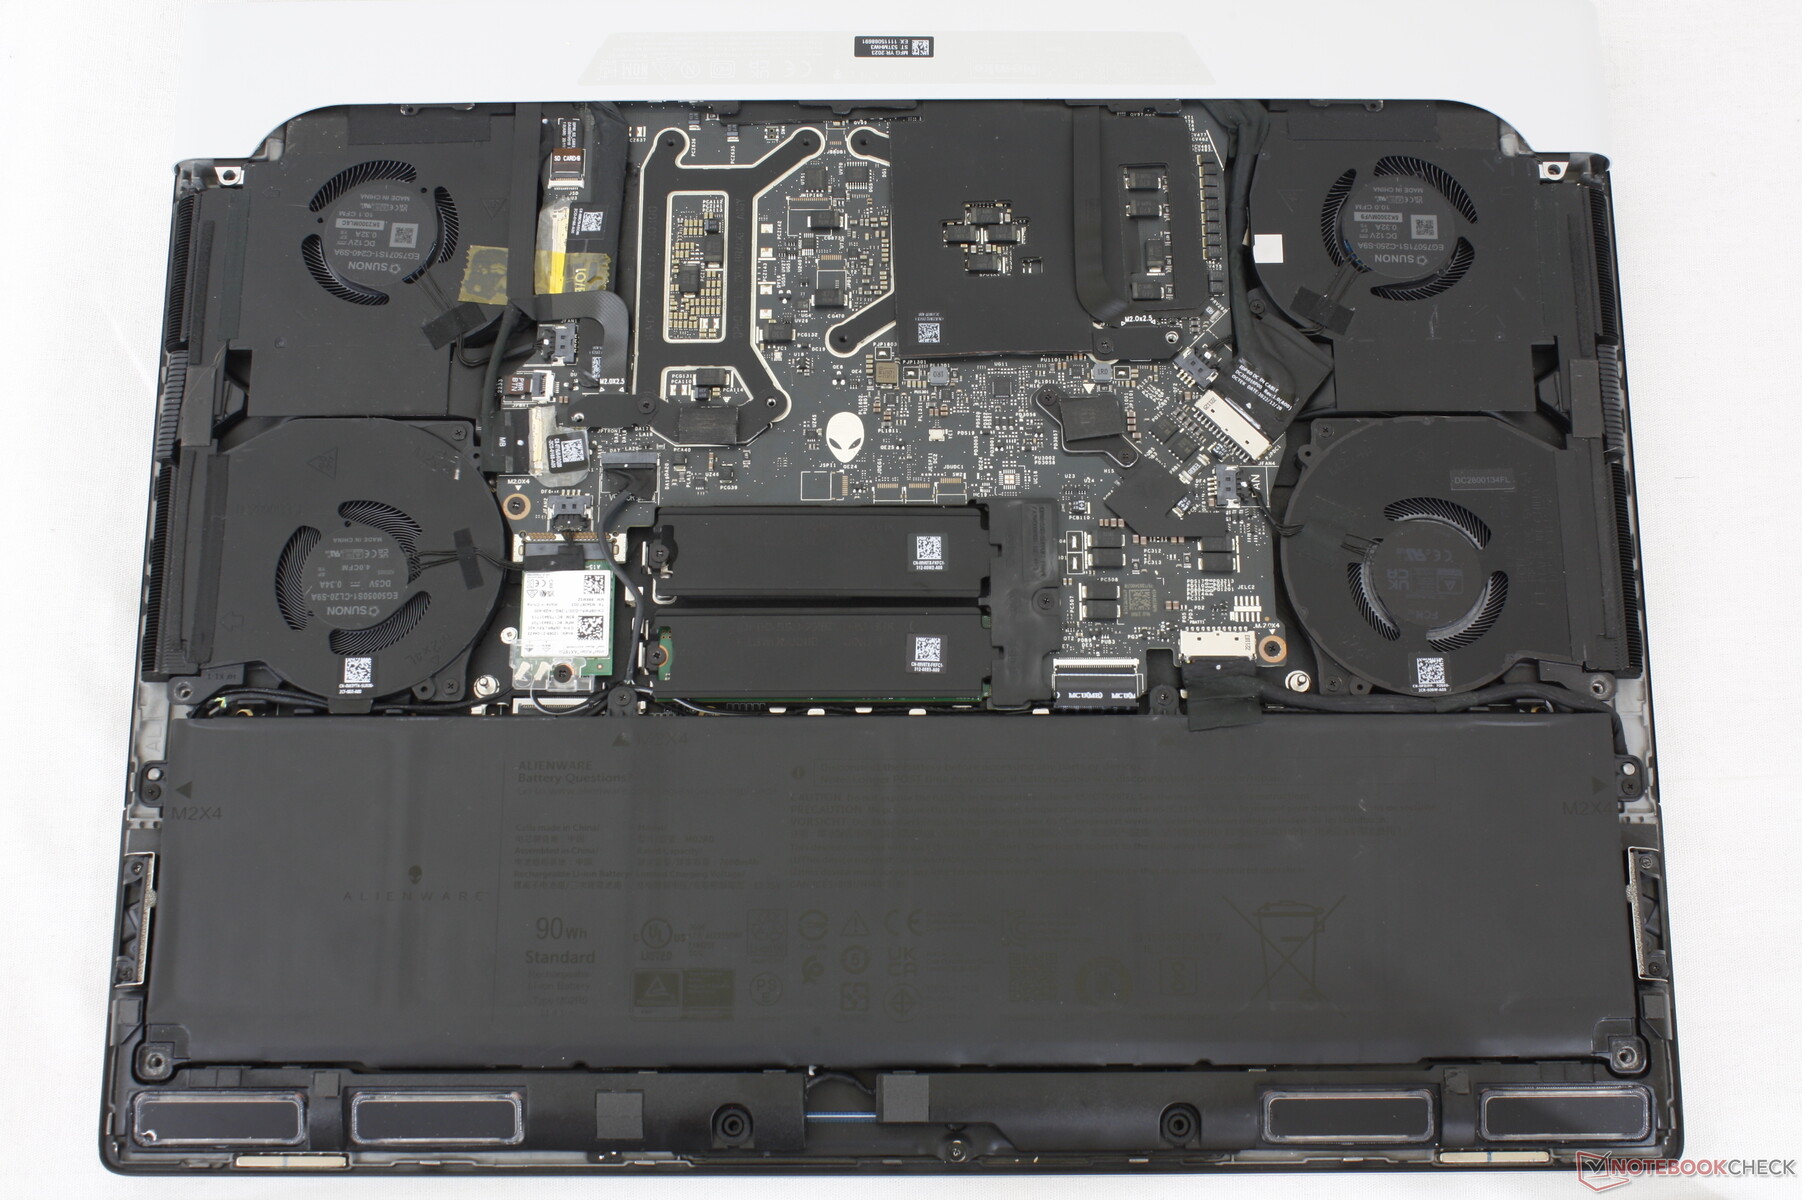
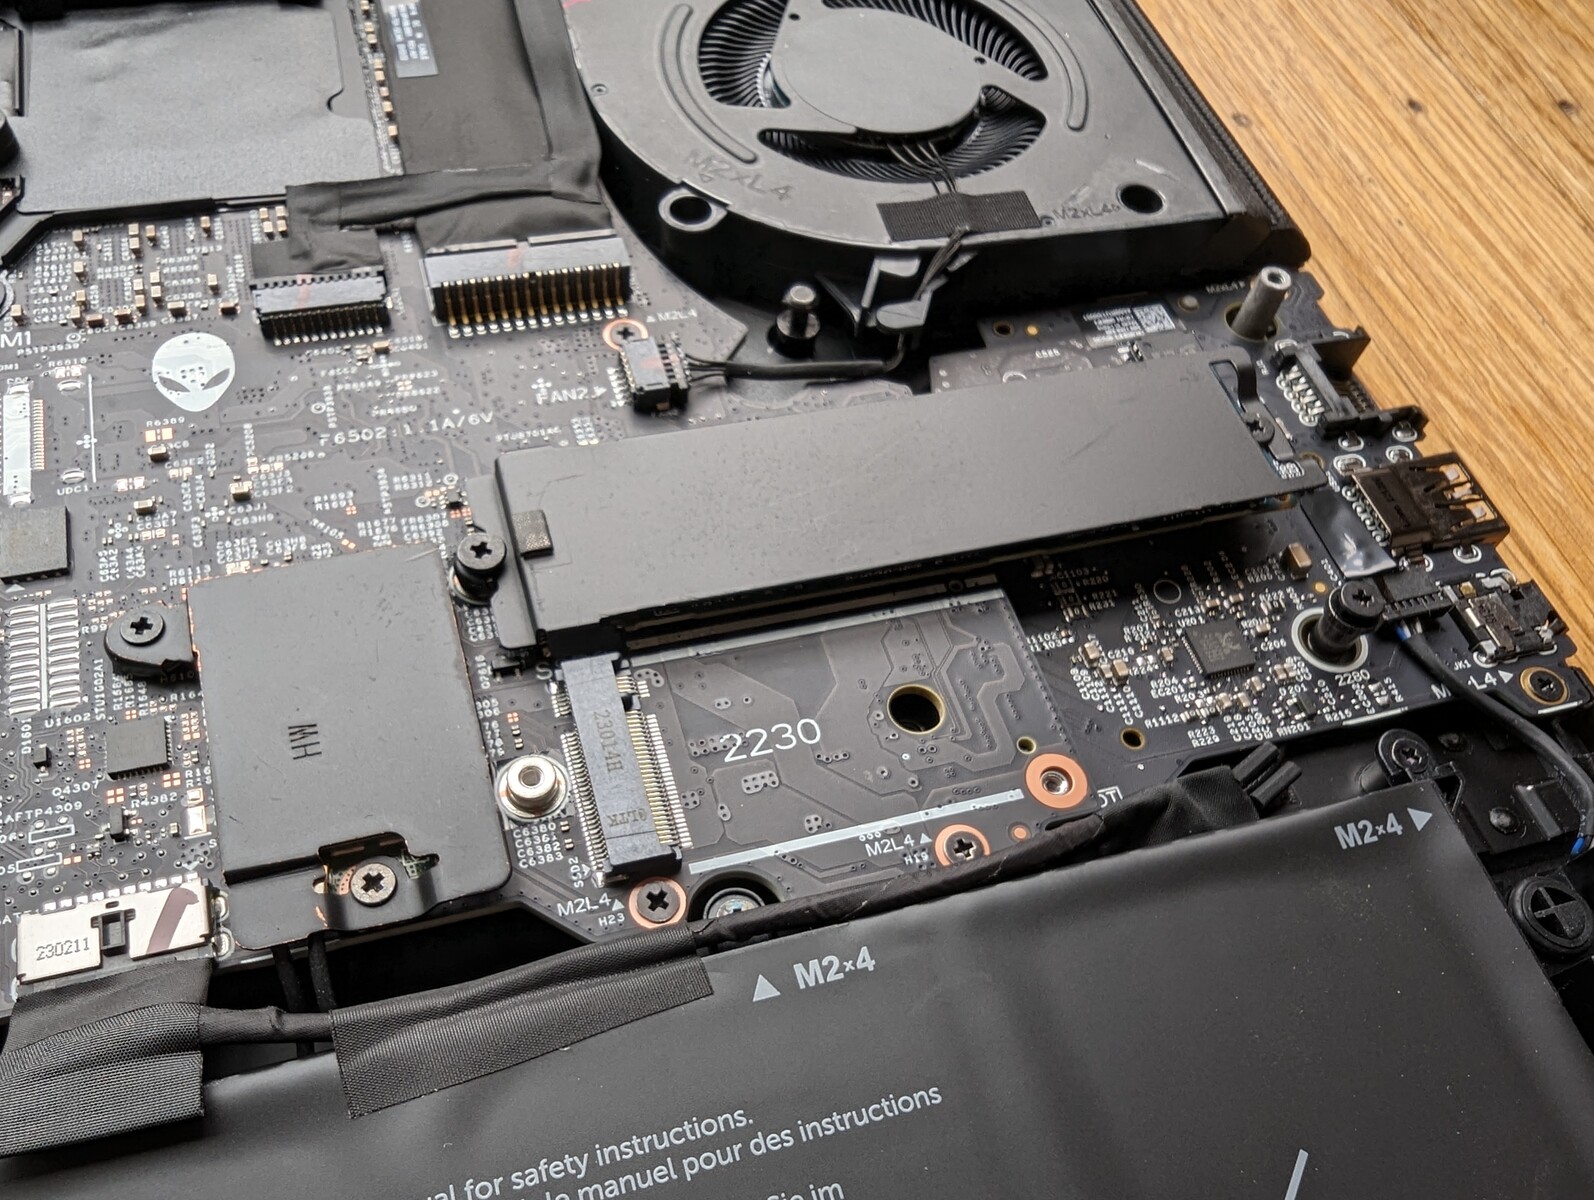
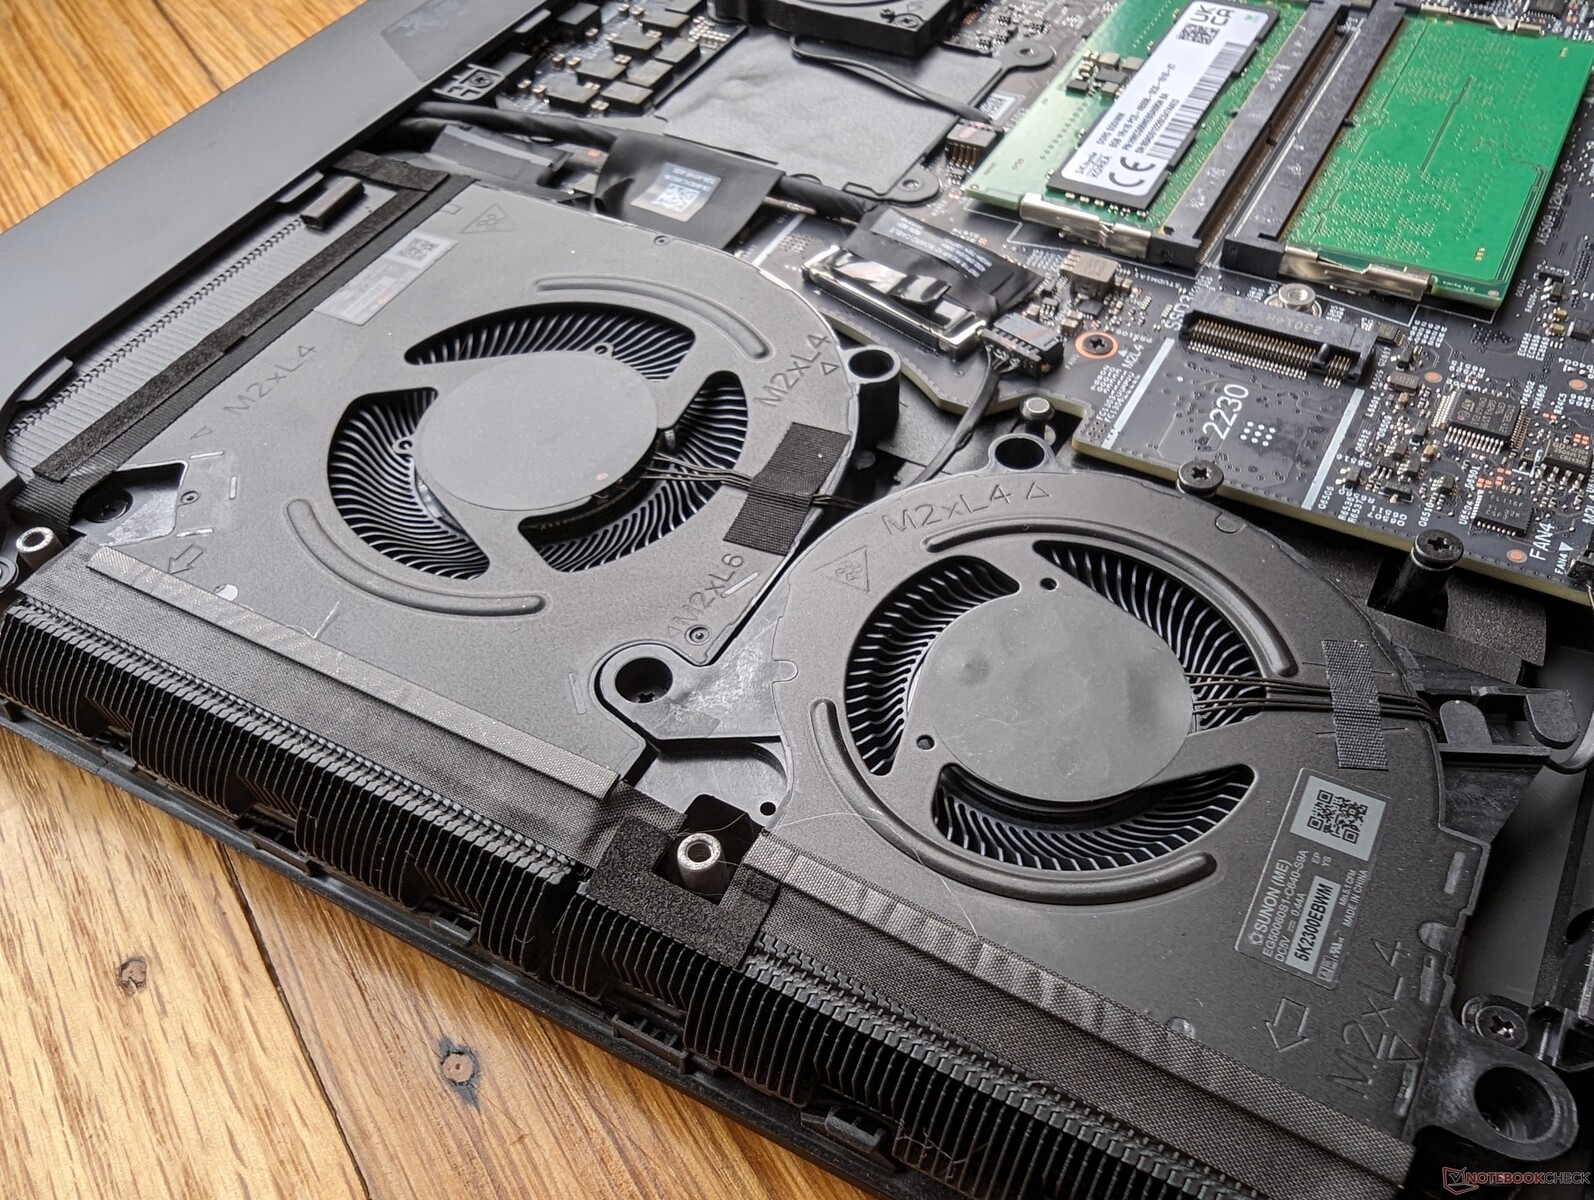
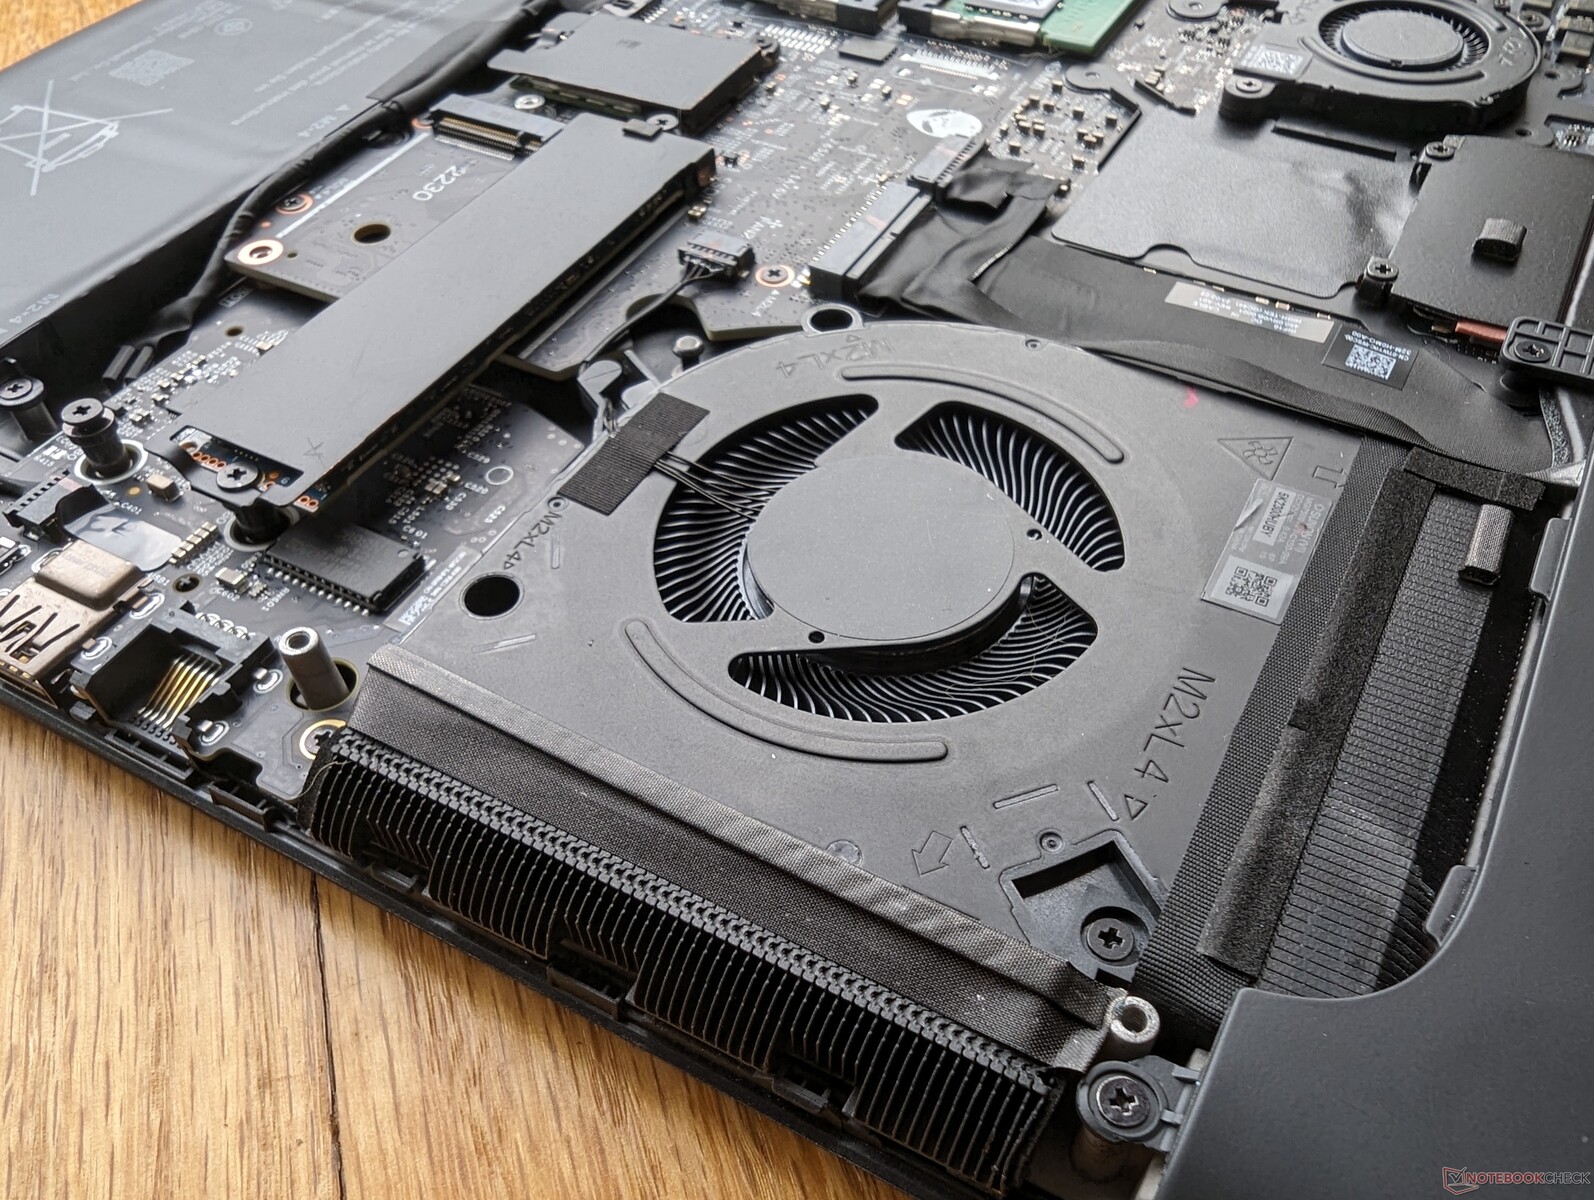
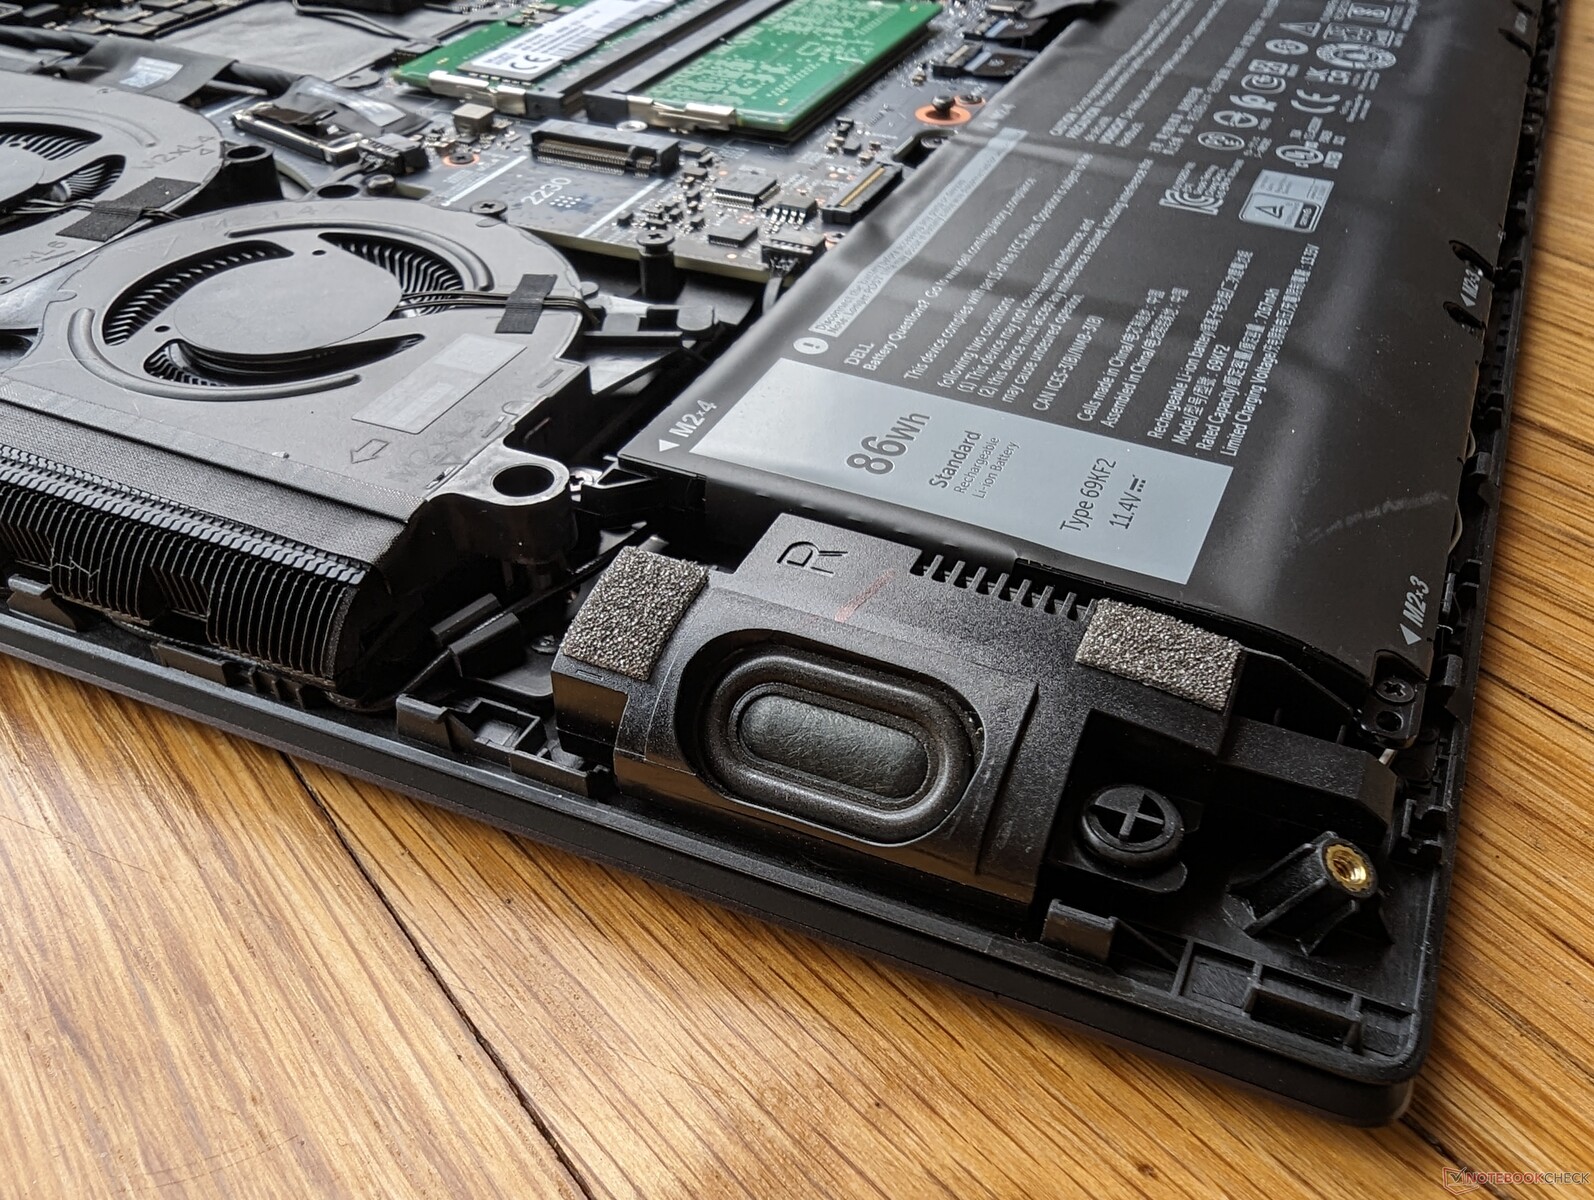
Underhåll
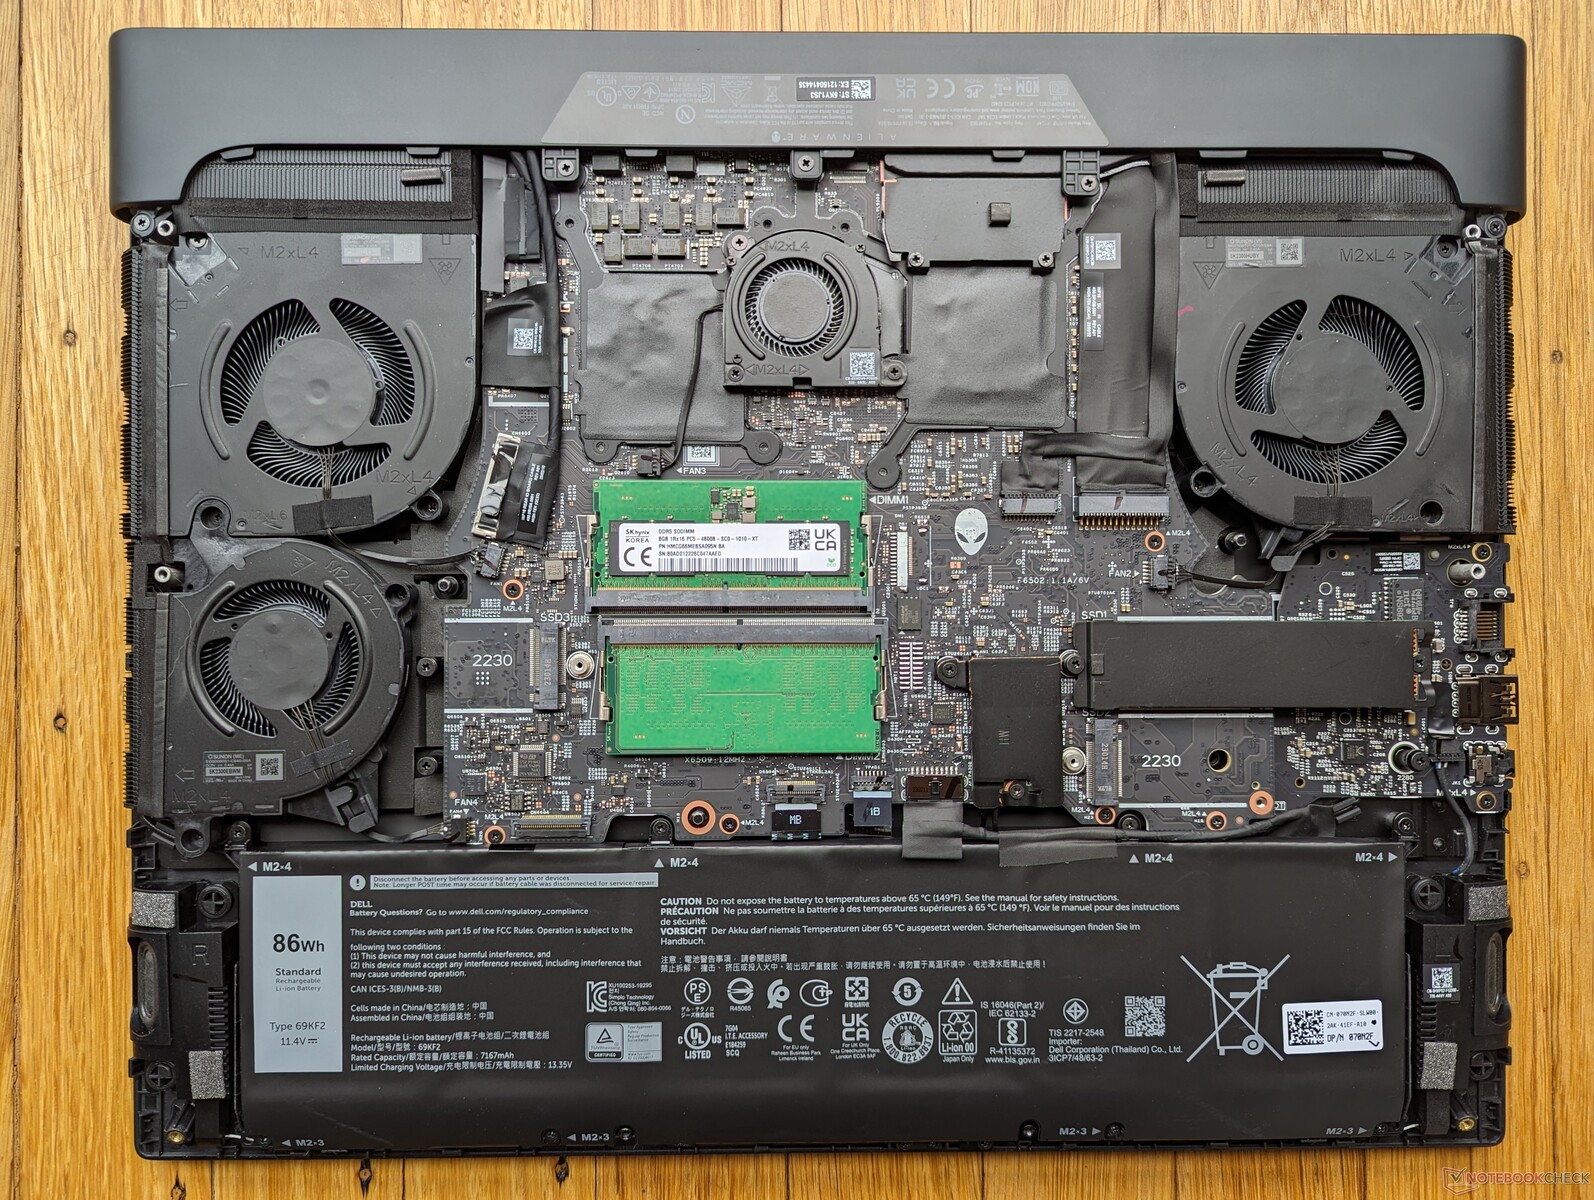
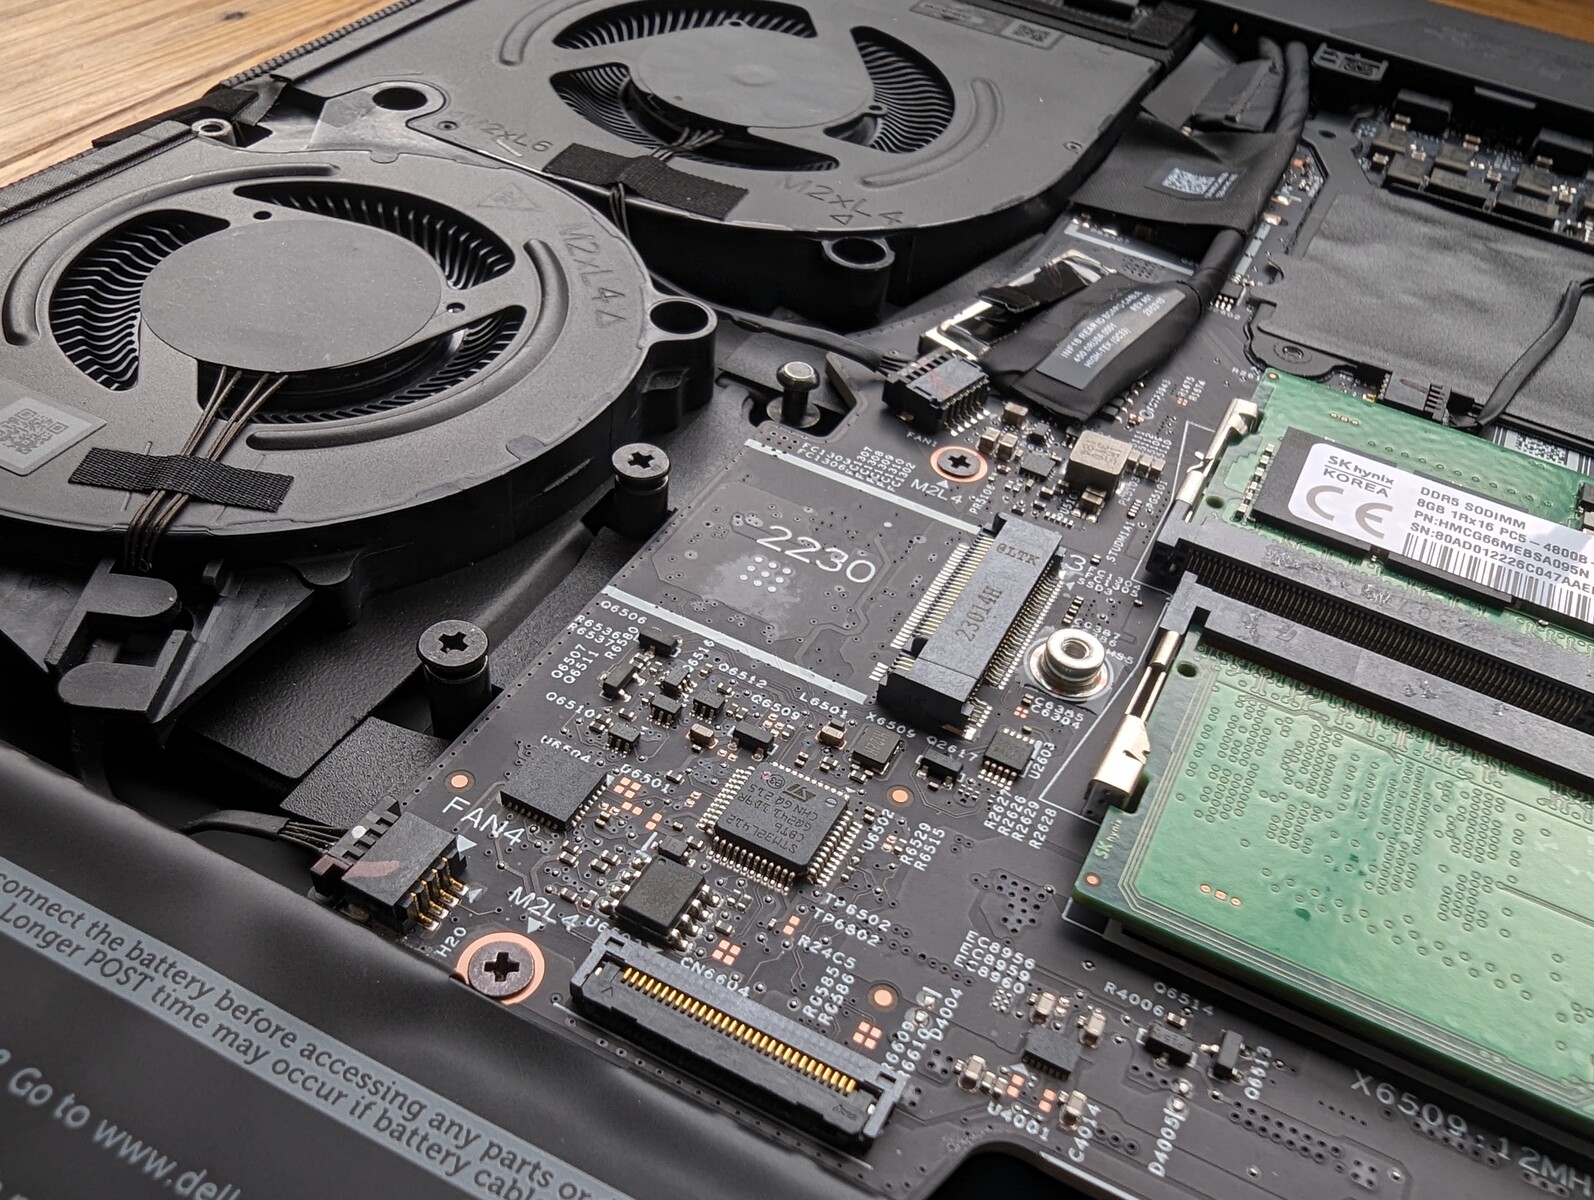
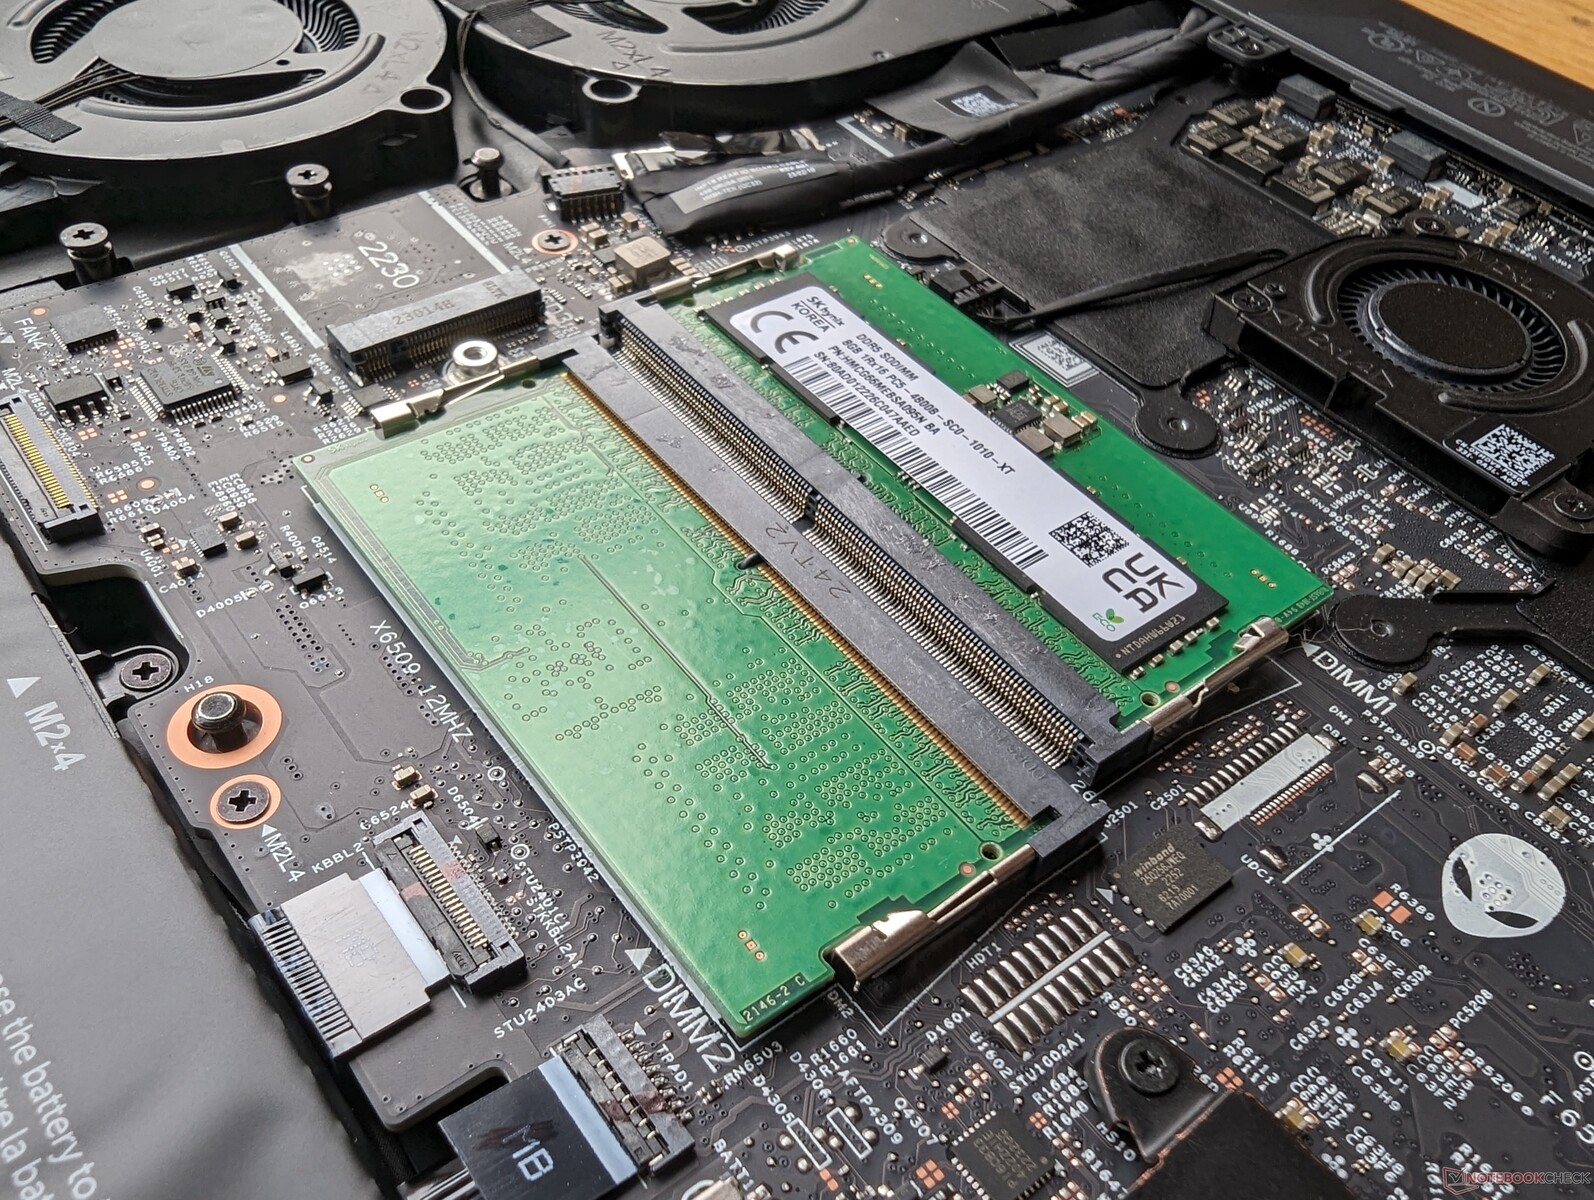
Bottenpanelen fästs med 8 stjärnskruvar för enkel service. Användare har direkt åtkomst till 3x lagringsfack, 2x SODIMM-kortplatser och den löstagbara WLAN-modulen. Observera att moderkortet är upp-och-nedvänt, vilket innebär att processorerna sitter på motsatt sida.
Moderkortets design skiljer sig helt från Alienware x16 även om de två modellerna delar många externa funktioner. Det är istället mest likt Alienware m18.
Tillbehör och garanti
Förpackningen innehåller två Alienware-logotypdekaler tillsammans med den vanliga nätadaptern och pappersarbete. En ettårig begränsad tillverkargaranti gäller vid köp i USA.
Inmatningsenheter - mekaniska eller standard
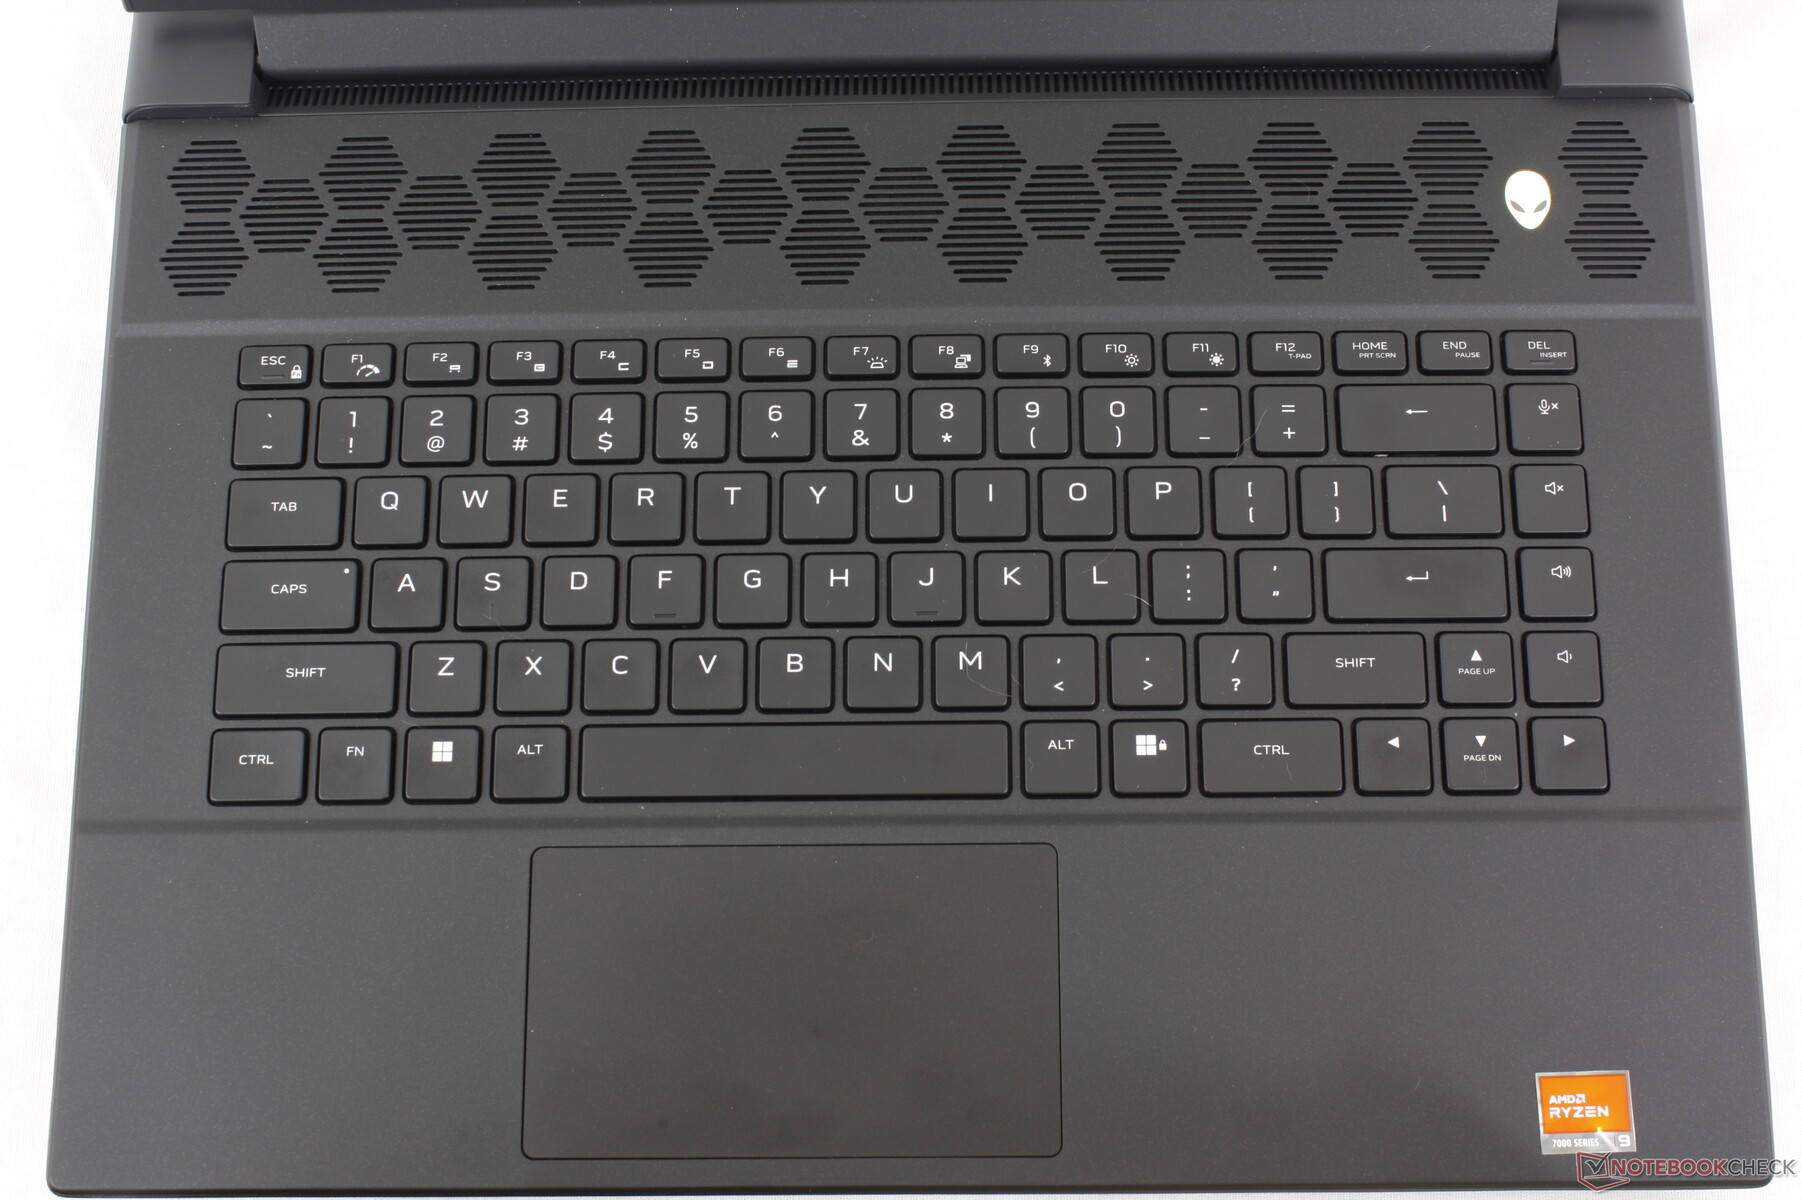
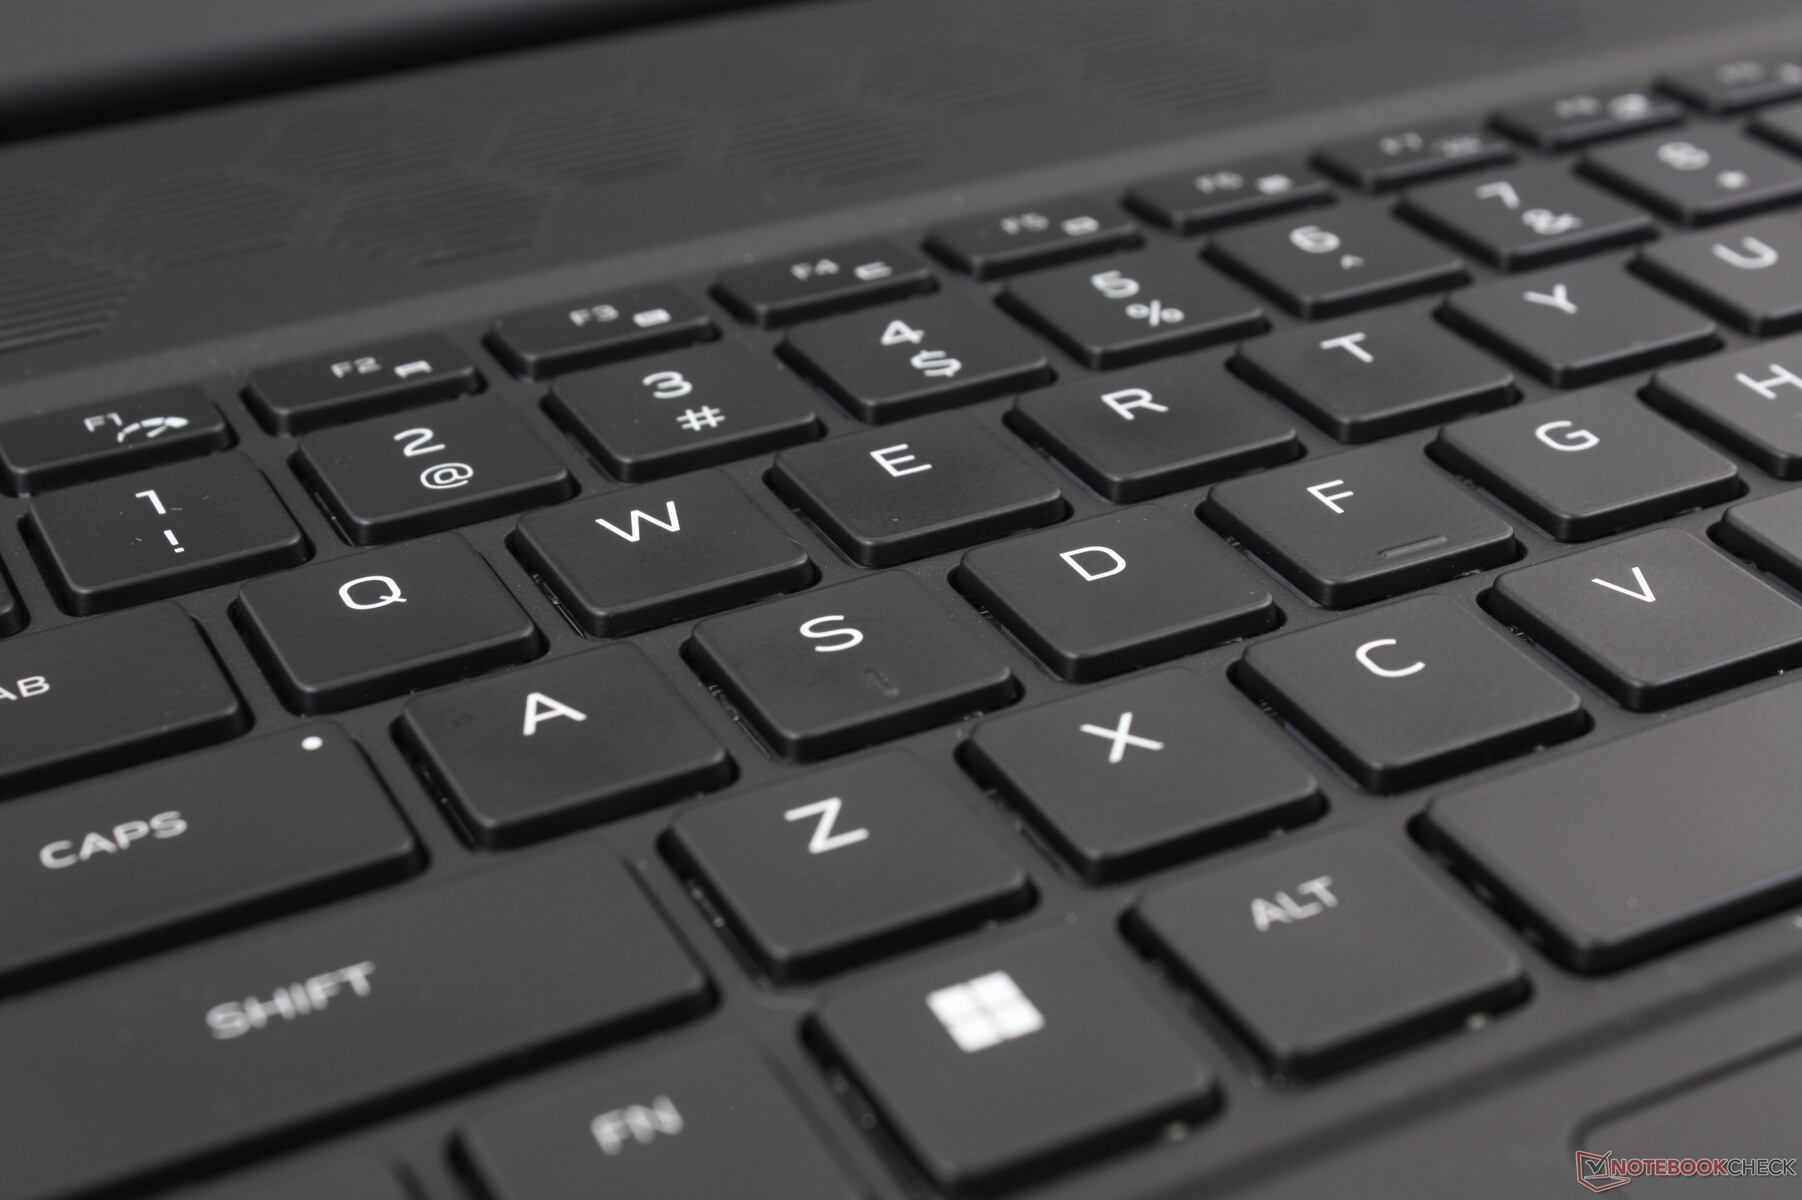
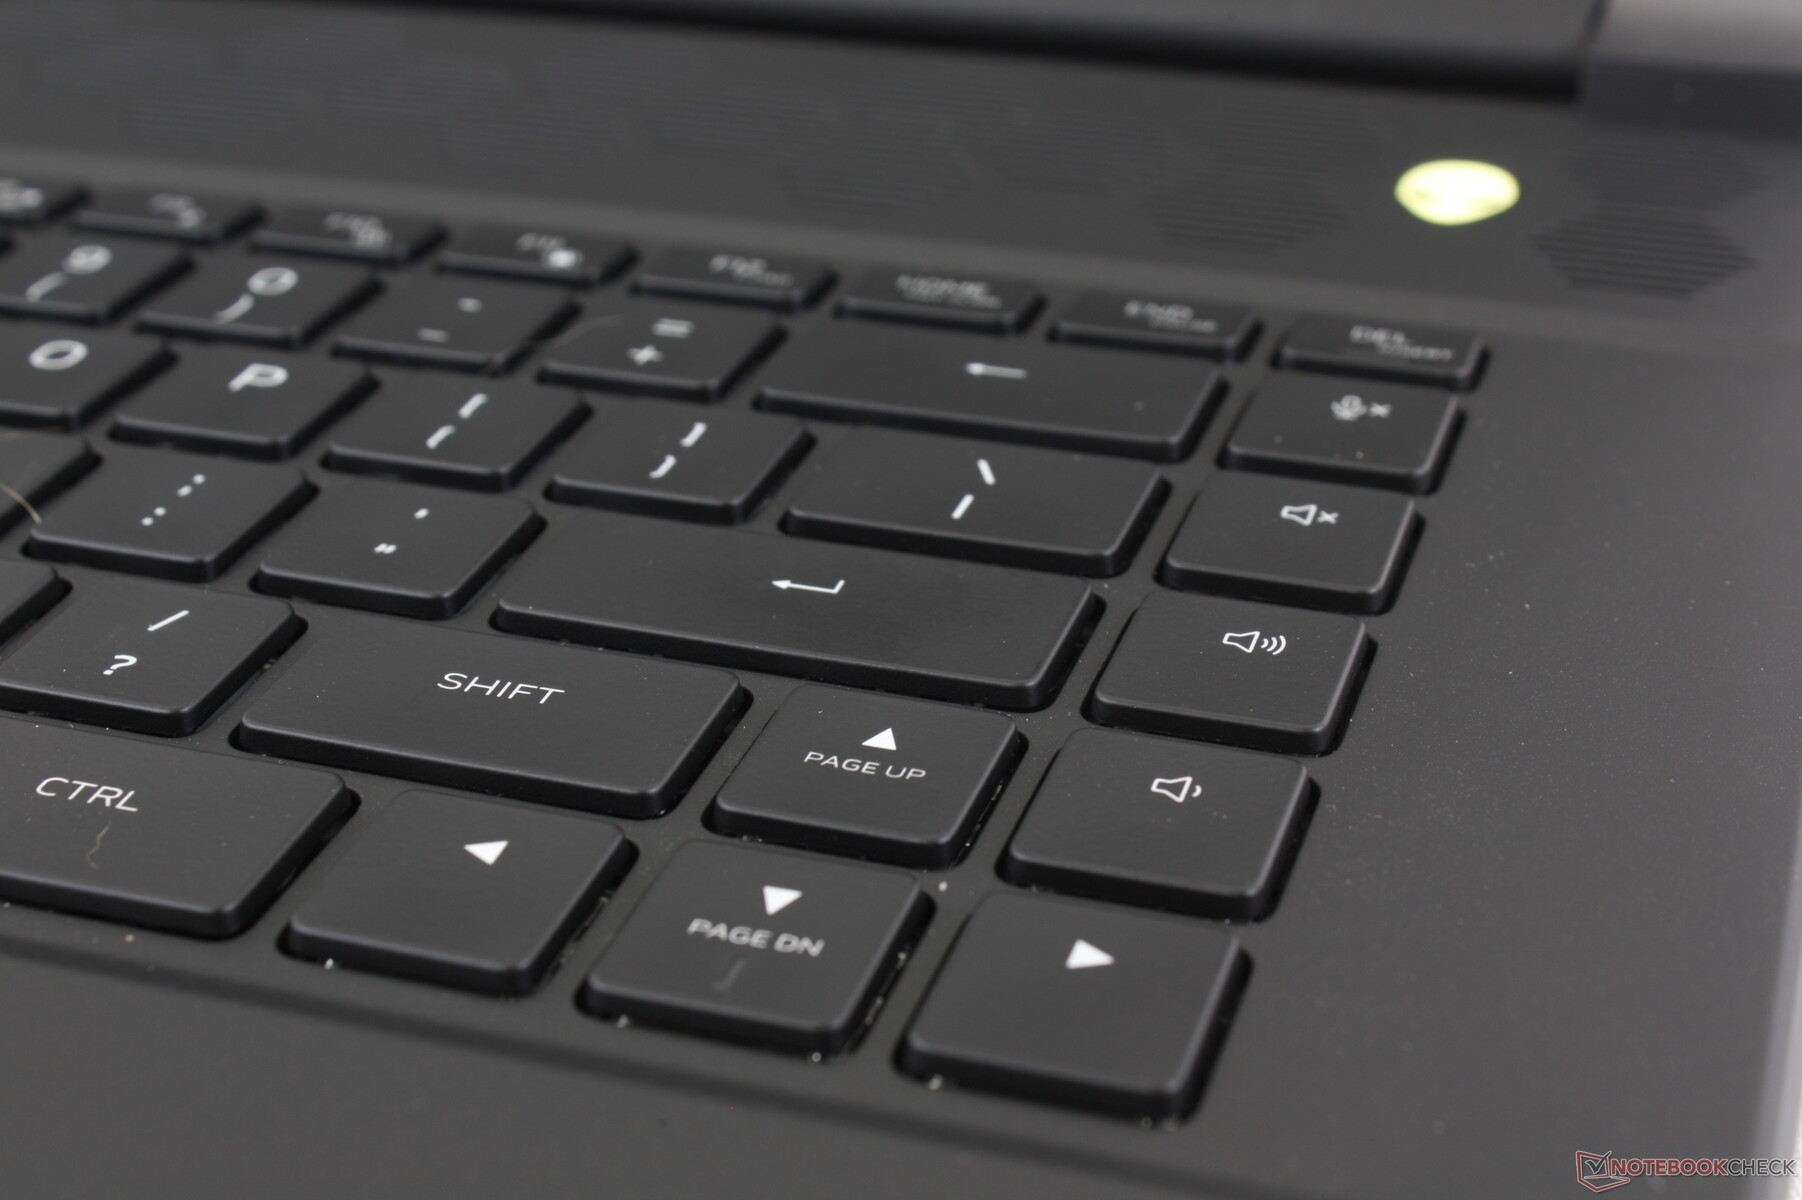
Tangentbord
Användarna kan konfigurera med antingen ett vanligt membranbaserat tangentbord eller ett CherryMX mekaniskt tangentbord med ultralåg profil och RGB-belysning per tangent. CherryMX-tangentbordet introducerades för ett par år sedan på Alienware x17 R1 och det är fortfarande ett av våra favorittangentbord på alla bärbara speldatorer tack vare dess klickfeedback och djupa anslag. Den största nackdelen är naturligtvis det skarpa och mycket högljudda knattret. Du kanske vill överväga alternativet med standardtangentbord istället för ljudkänsliga miljöer som bibliotek, klassrum eller studentrum.
Bakgrundsbelysningen lyser upp alla tangenter och symboler, vilket inte var sant på äldre modeller.
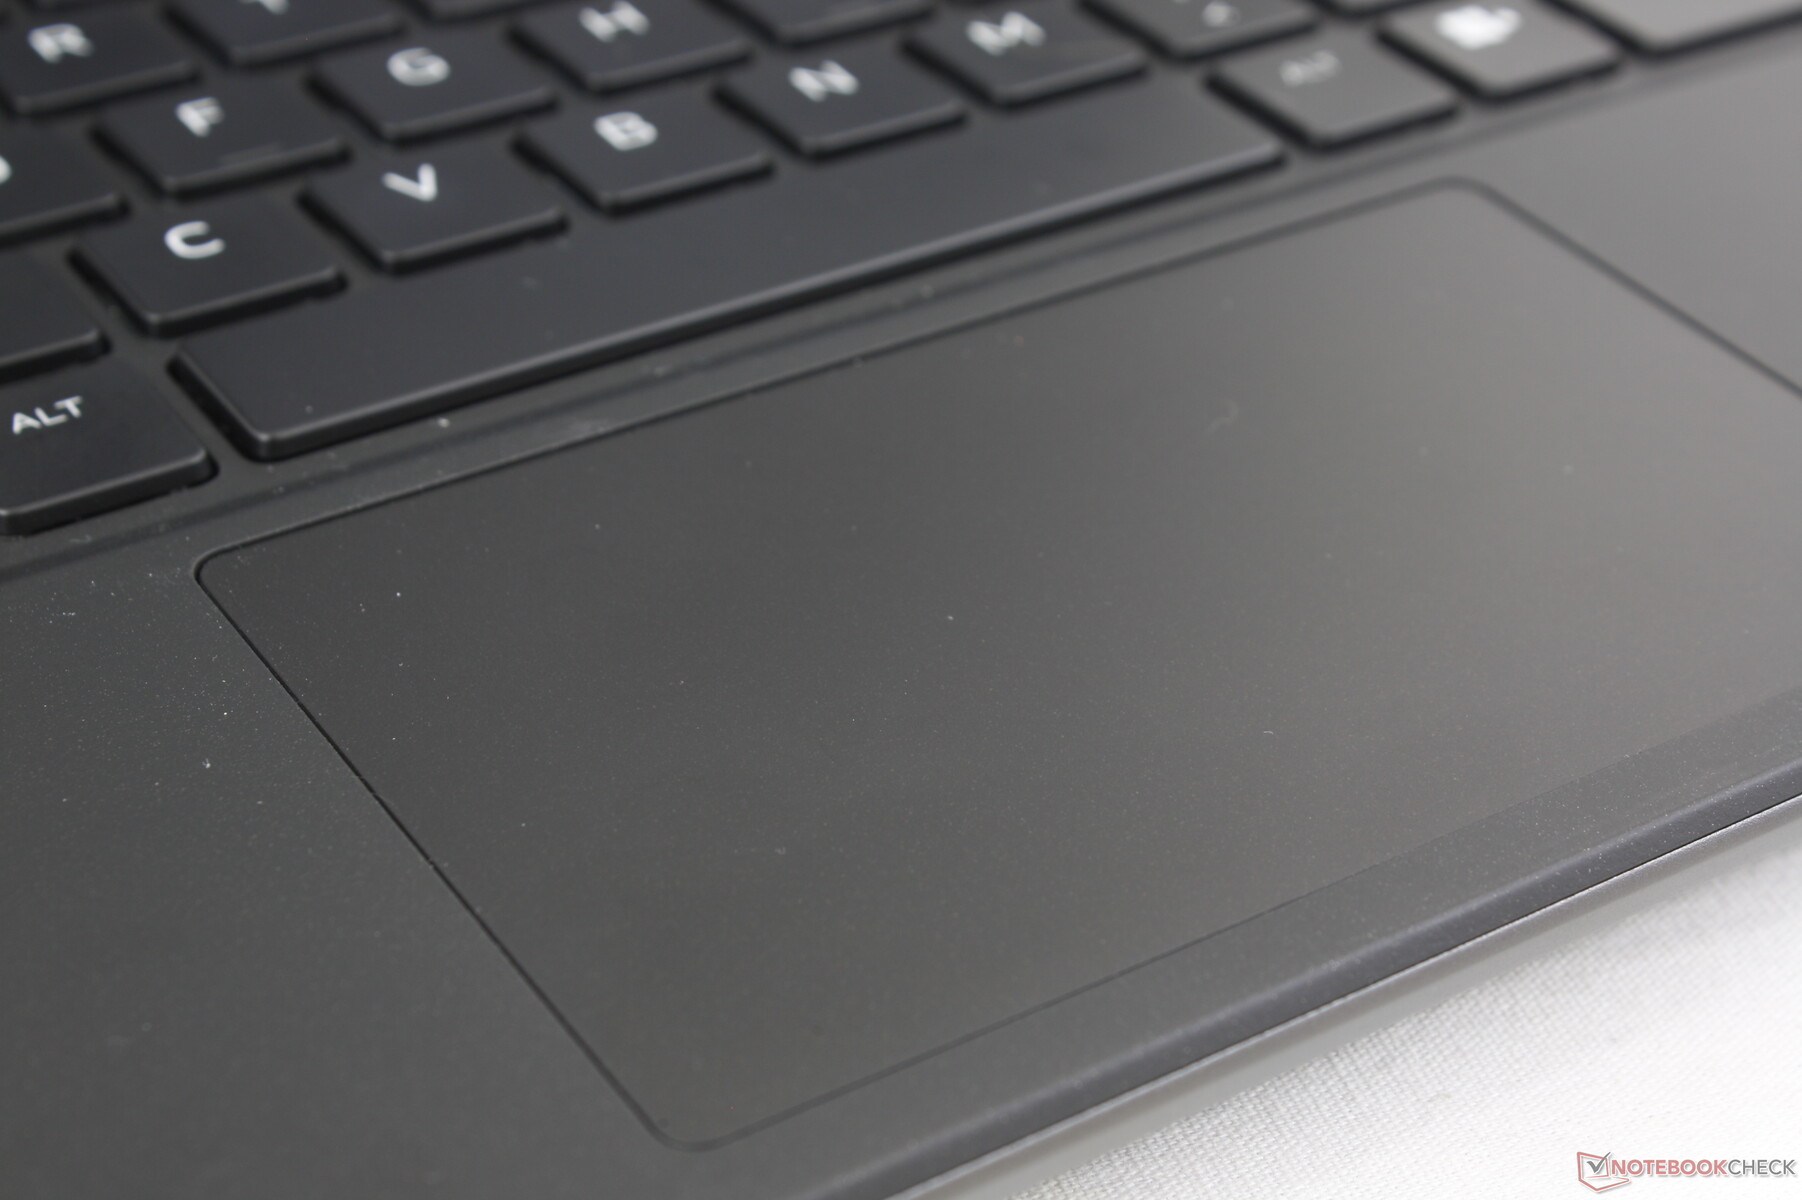
Pekplatta
Klickplattan är relativt liten (11,3 x 6,6 cm) eftersom en stor del av tangentbordsdäcket upptas av de stora ventilationsgallren. Klickplattorna på HP Omen Transcend 16 och Razer Blade 16, till exempel, är rymligare med 12,5 x 8 cm respektive 17 x 9,7 cm. I övrigt är greppet smidigt och återkopplingen vid tryck är fast och klickande trots den begränsade ytan.
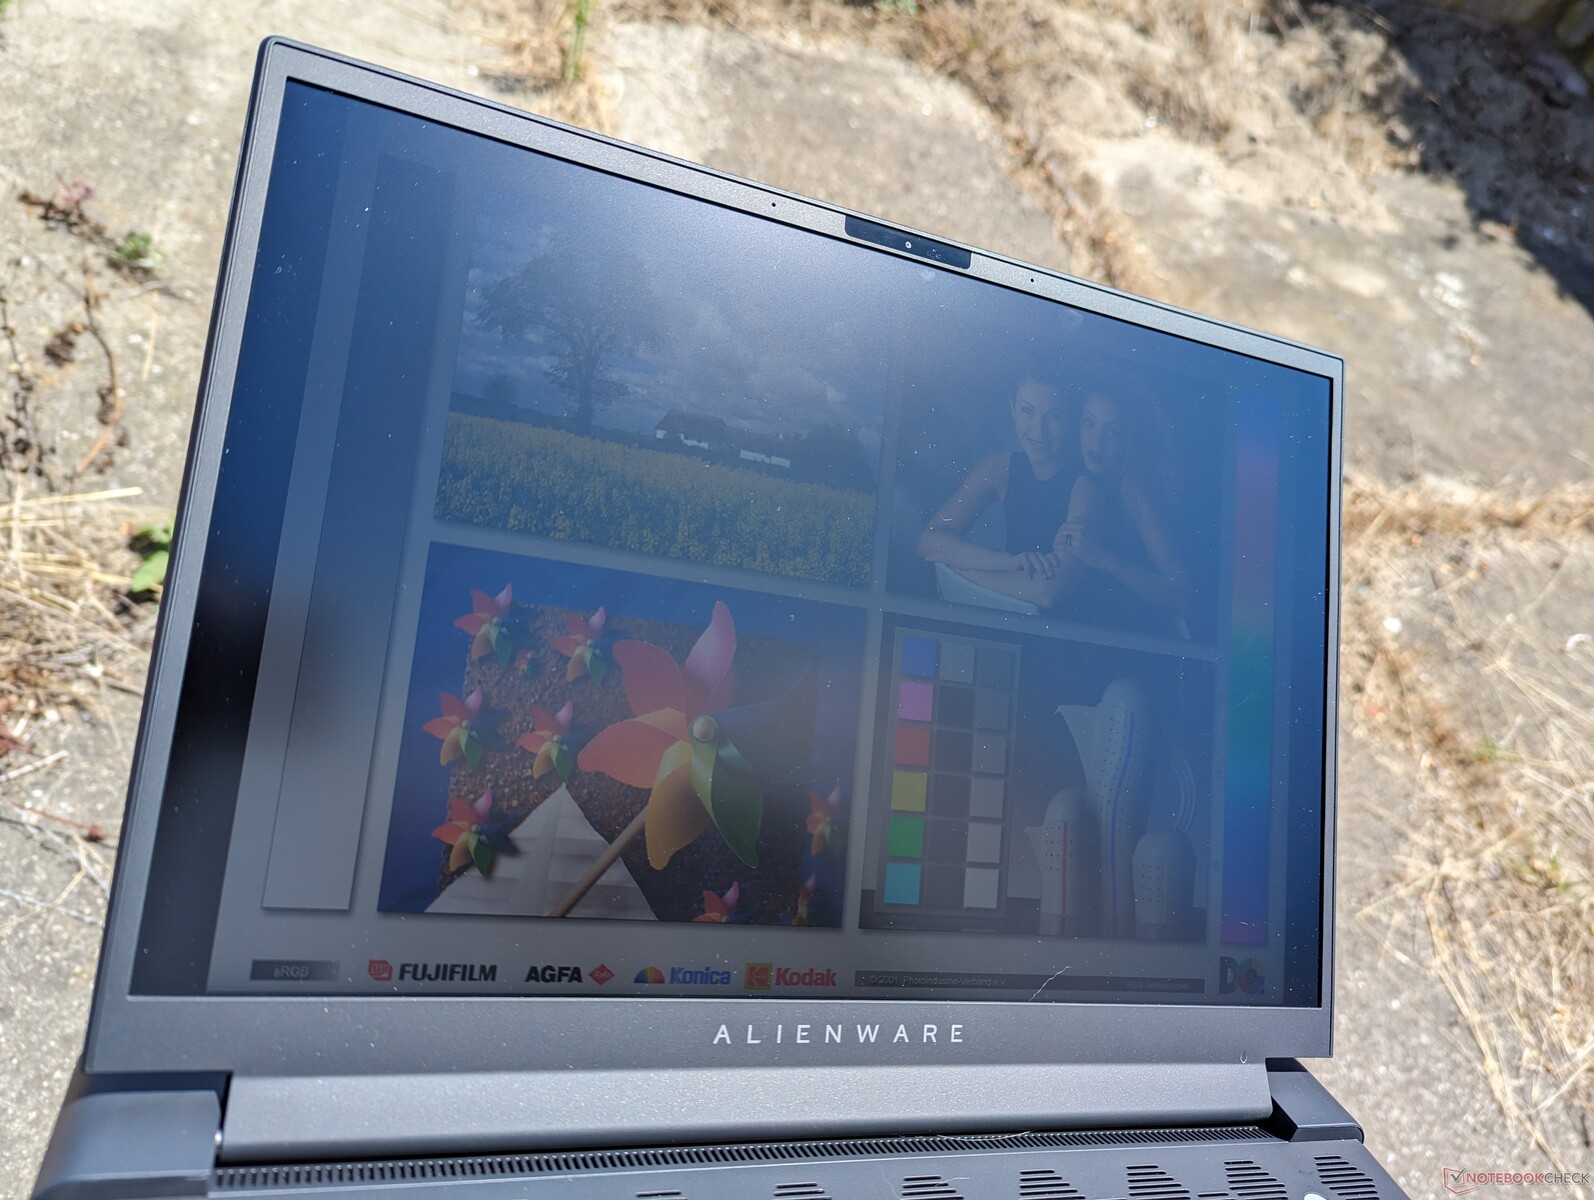
Display
Tre displayalternativ är tillgängliga enligt följande:
- 2560 x 1600, 165 Hz, 3 ms, IPS, 100% sRGB
- 2560 x 1600, 240 Hz, 3 ms, IPS, 100% DCI-P3
- 1920 x 1200, 480 Hz, 3 ms, IPS, 100% DCI-P3
Vår enhet är konfigurerad med det fetmarkerade alternativet ovan, vilket vi anser är det bästa för modellen eftersom den erbjuder fullständiga P3-färger, snabba uppdateringshastigheter och en högupplöst allt-i-ett-modell. 1200p-alternativet erbjuder ännu snabbare uppdateringsfrekvenser, men fördelarna blir alltmer marginella efter 240 Hz.
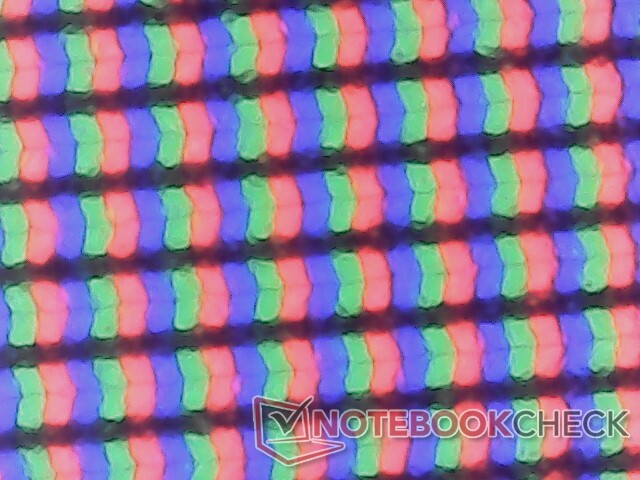
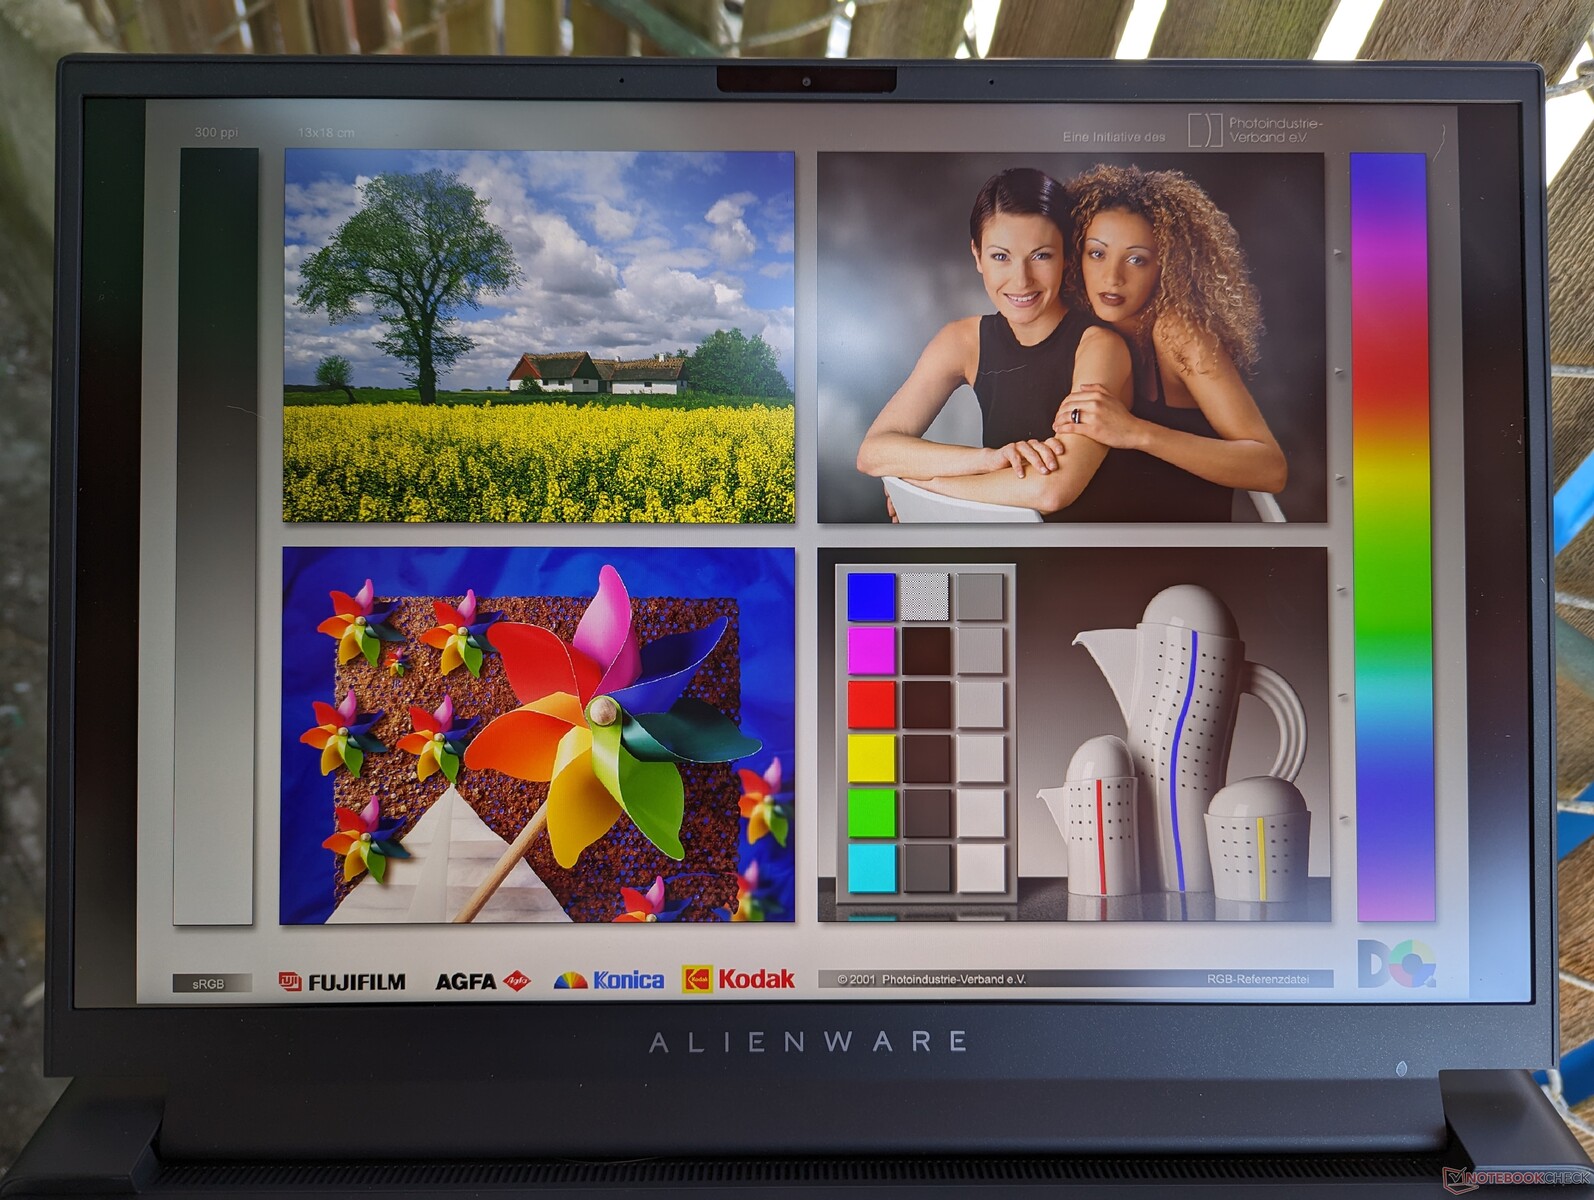
Alienware m16 R1 använder samma BOE NE16NZ4-panel som finns påAlienware x16 R1 och därför är visningsupplevelsen i princip identisk mellan de två modellerna. Denna avancerade panel är lämplig för både spel och innehållsskapande med bredare färger än MNG007DA2-3-panelen på Legion Pro 7. Skärmarna på Razer Blade 16 Early 2023 eller Mini-LED-baserade HP Omen Transcend 16 är märkbart ljusare, vilket kan vara praktiskt för HDR-innehåll.
| |||||||||||||||||||||||||
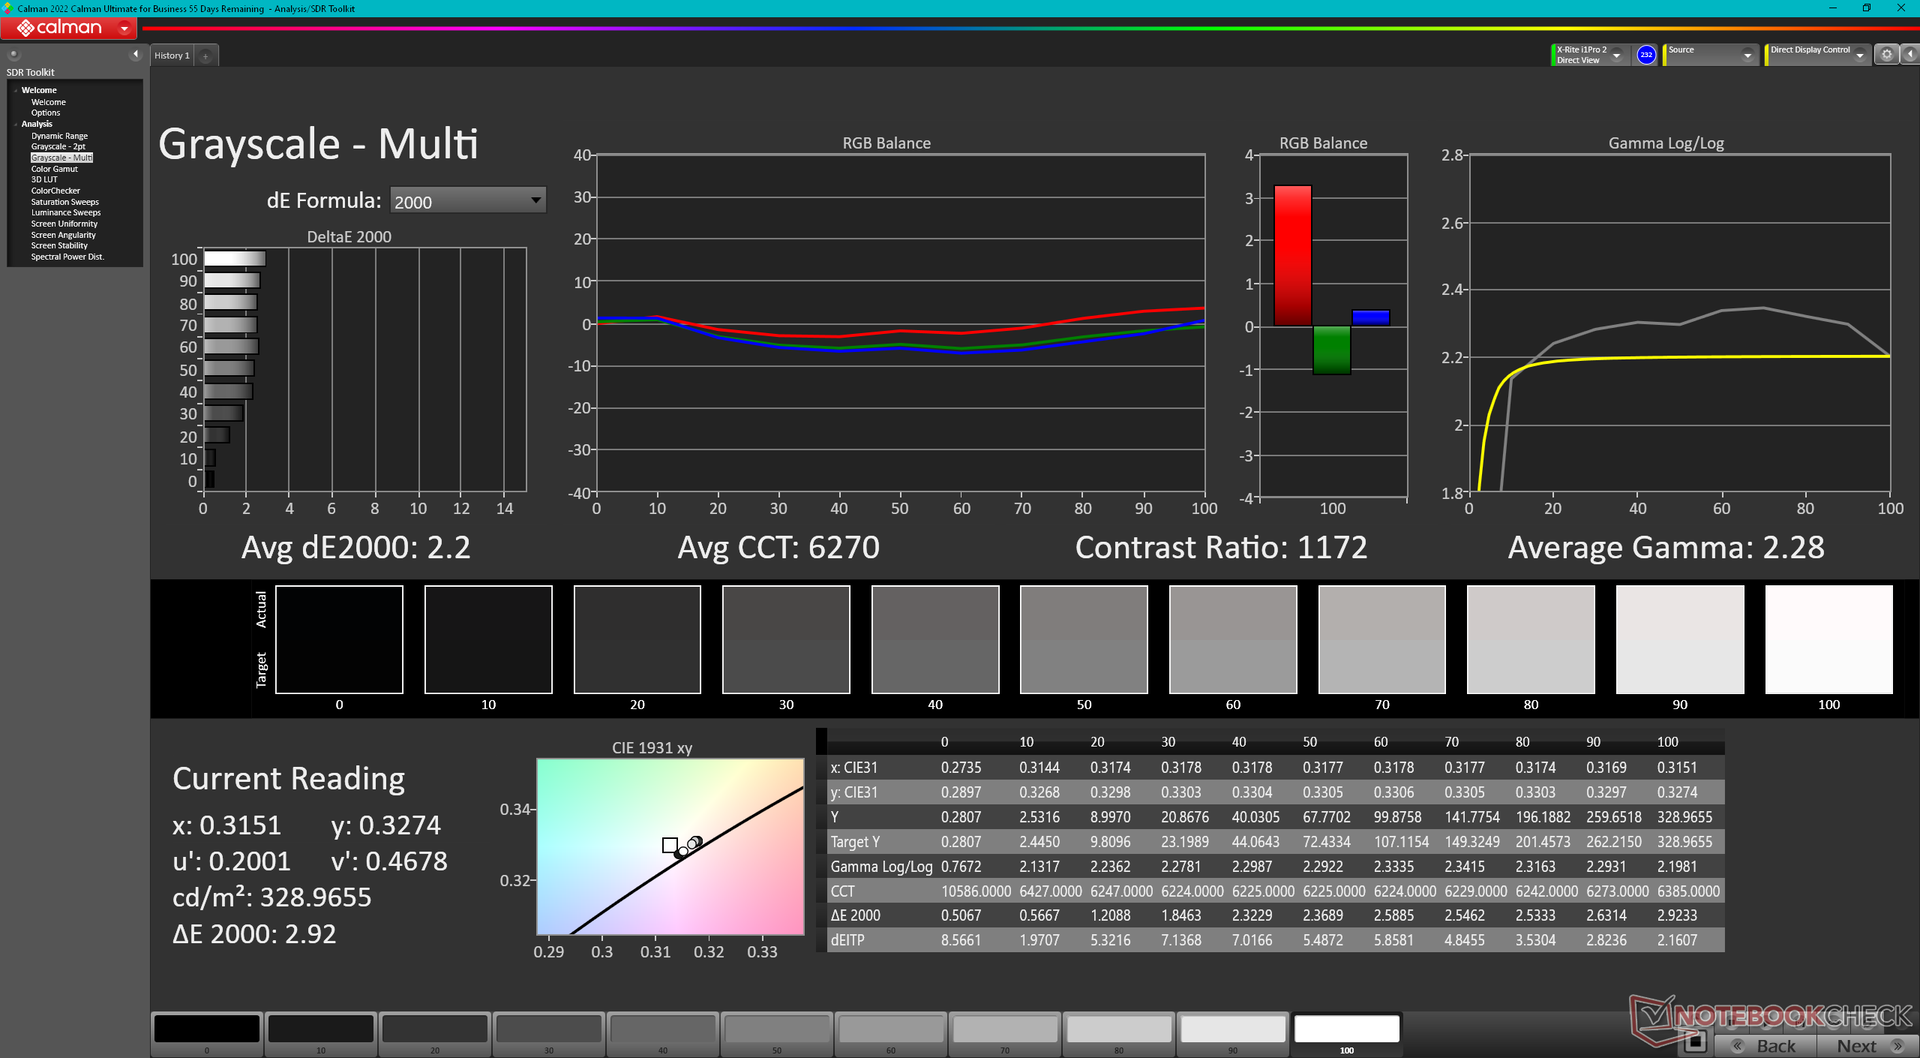
Distribution av ljusstyrkan: 89 %
Mitt på batteriet: 329 cd/m²
Kontrast: 1028:1 (Svärta: 0.32 cd/m²)
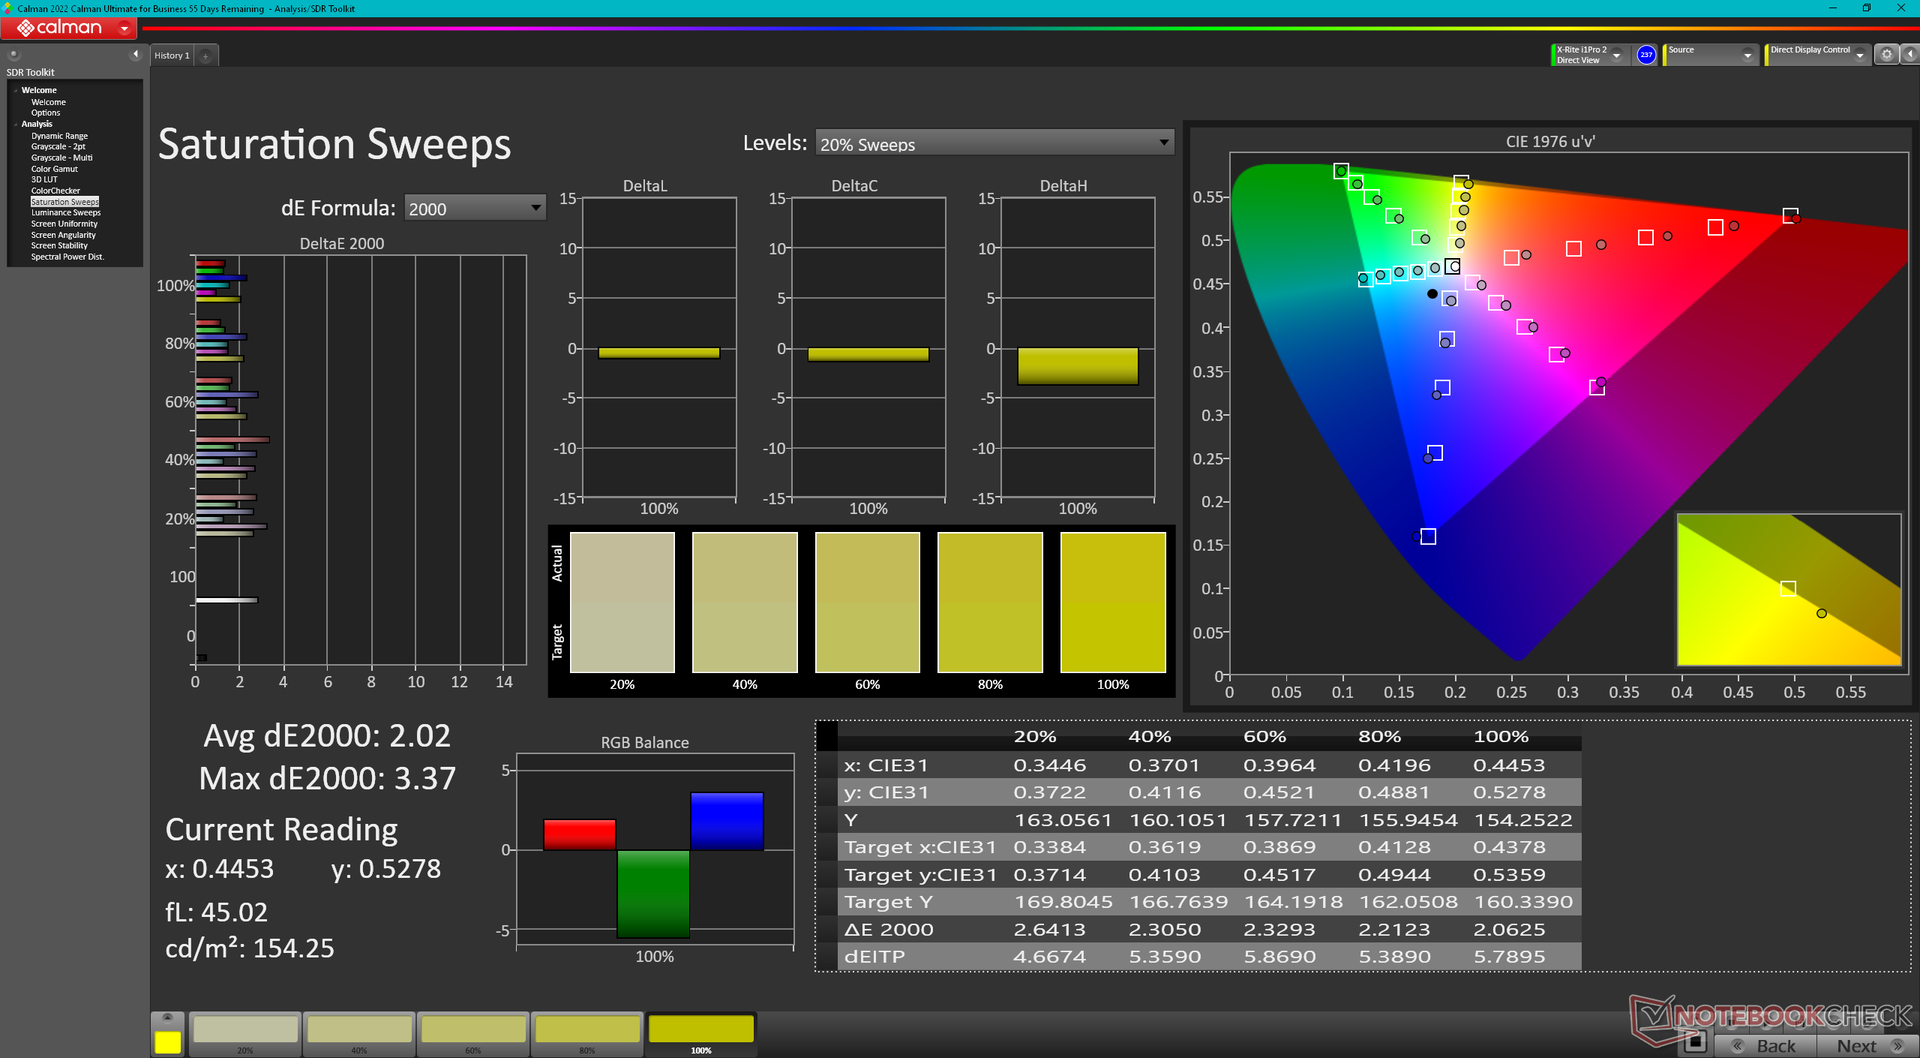
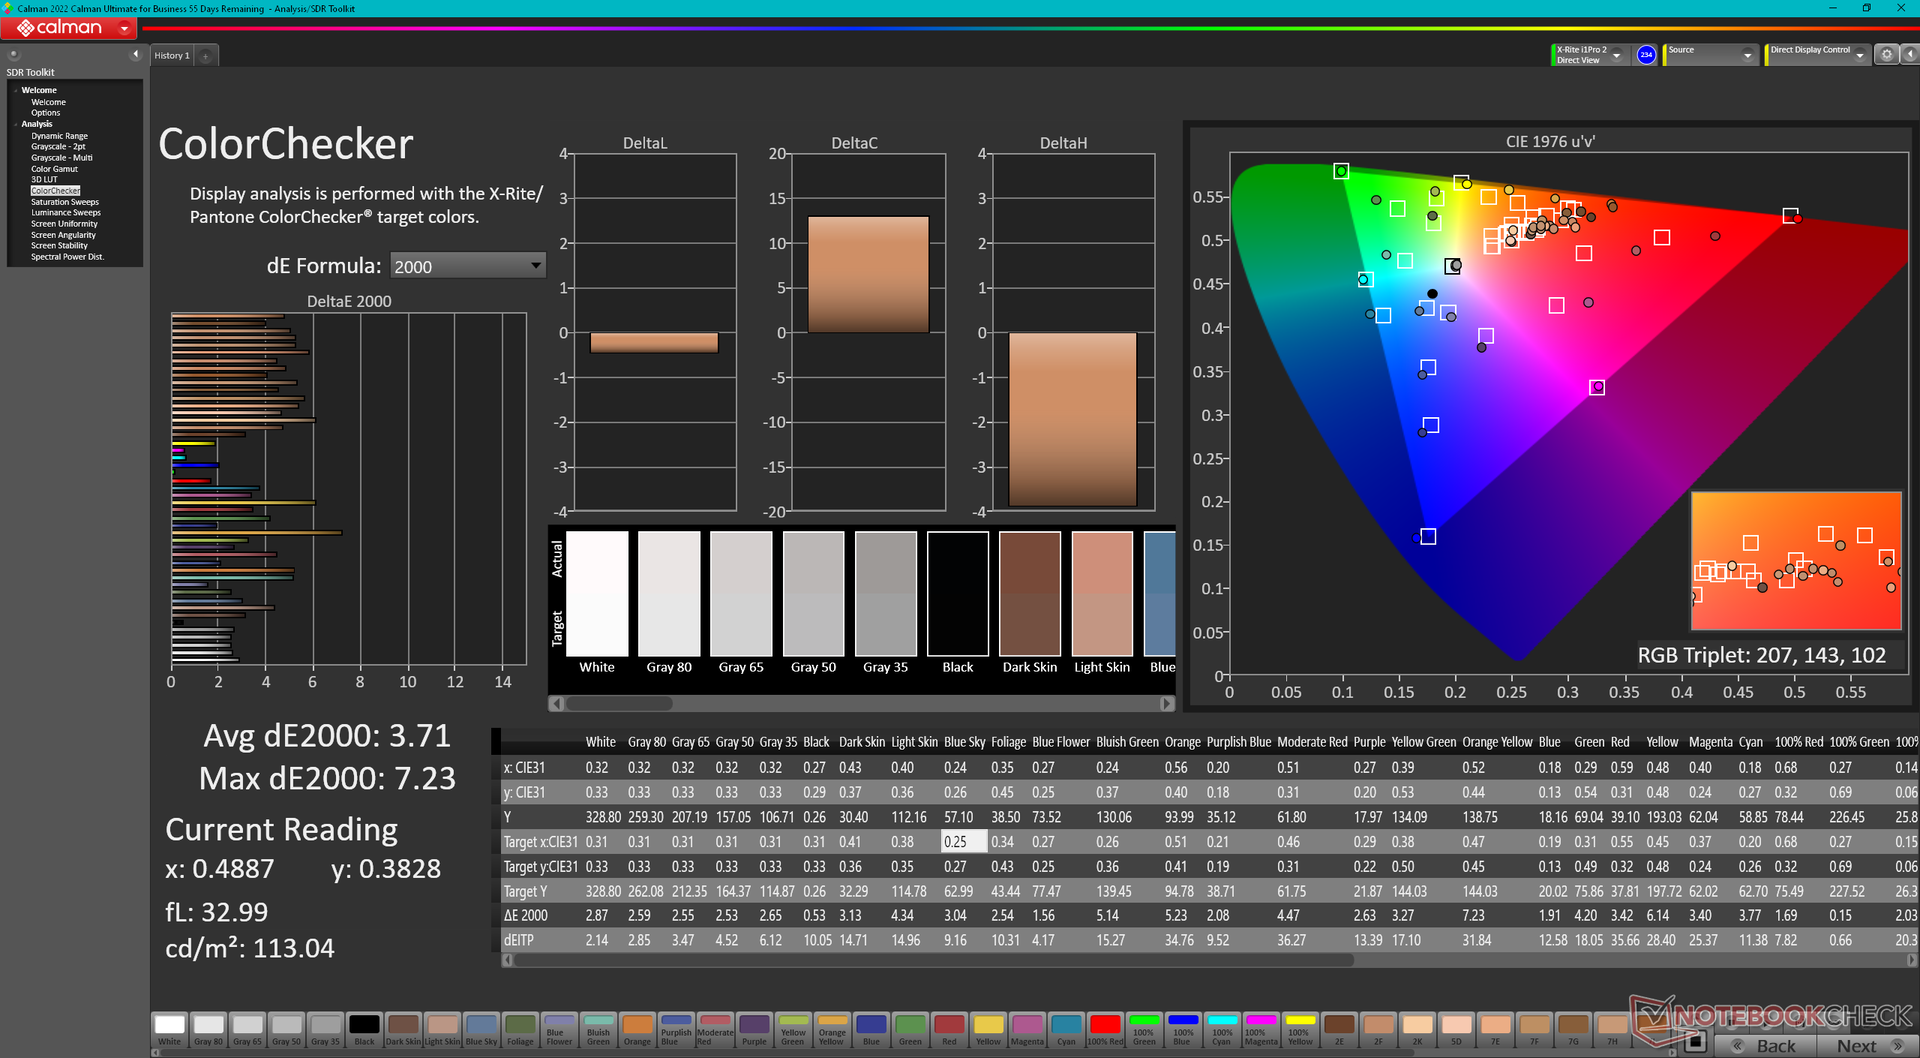
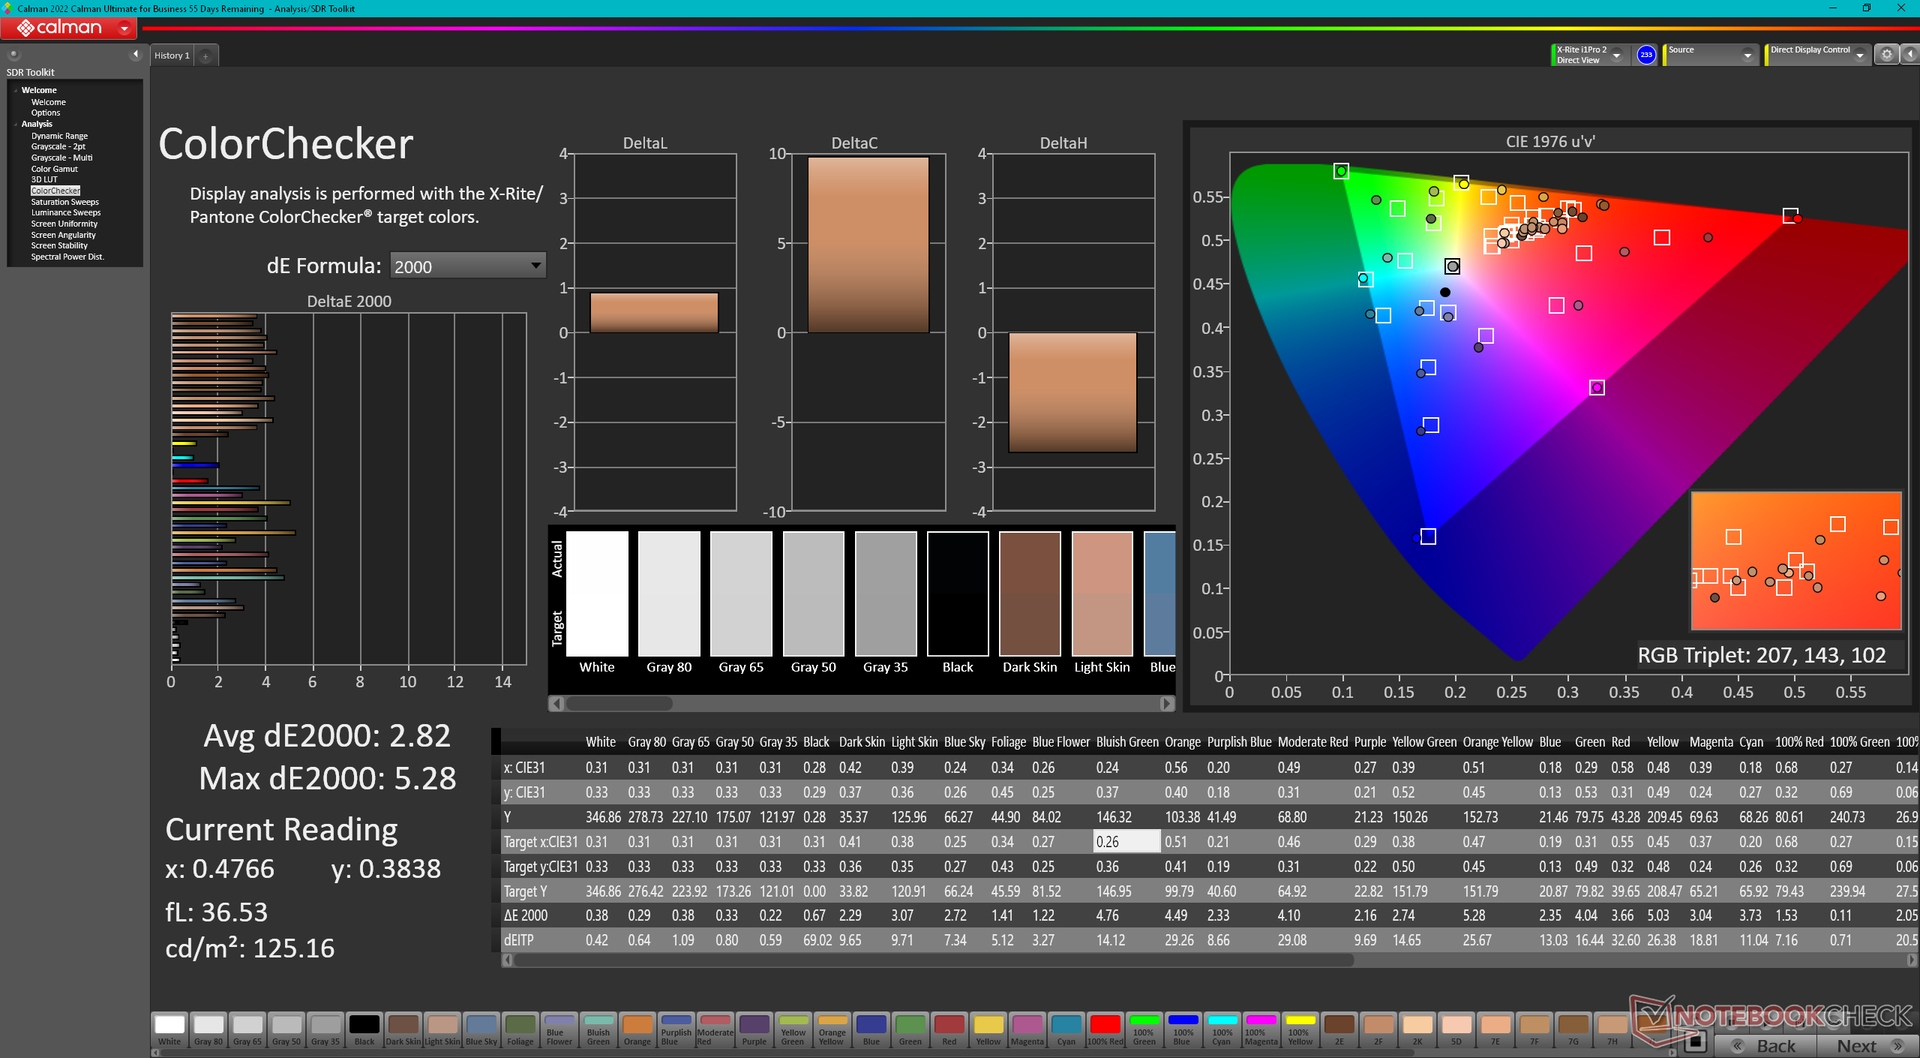
ΔE ColorChecker Calman: 3.71 | ∀{0.5-29.43 Ø4.72}
calibrated: 2.82
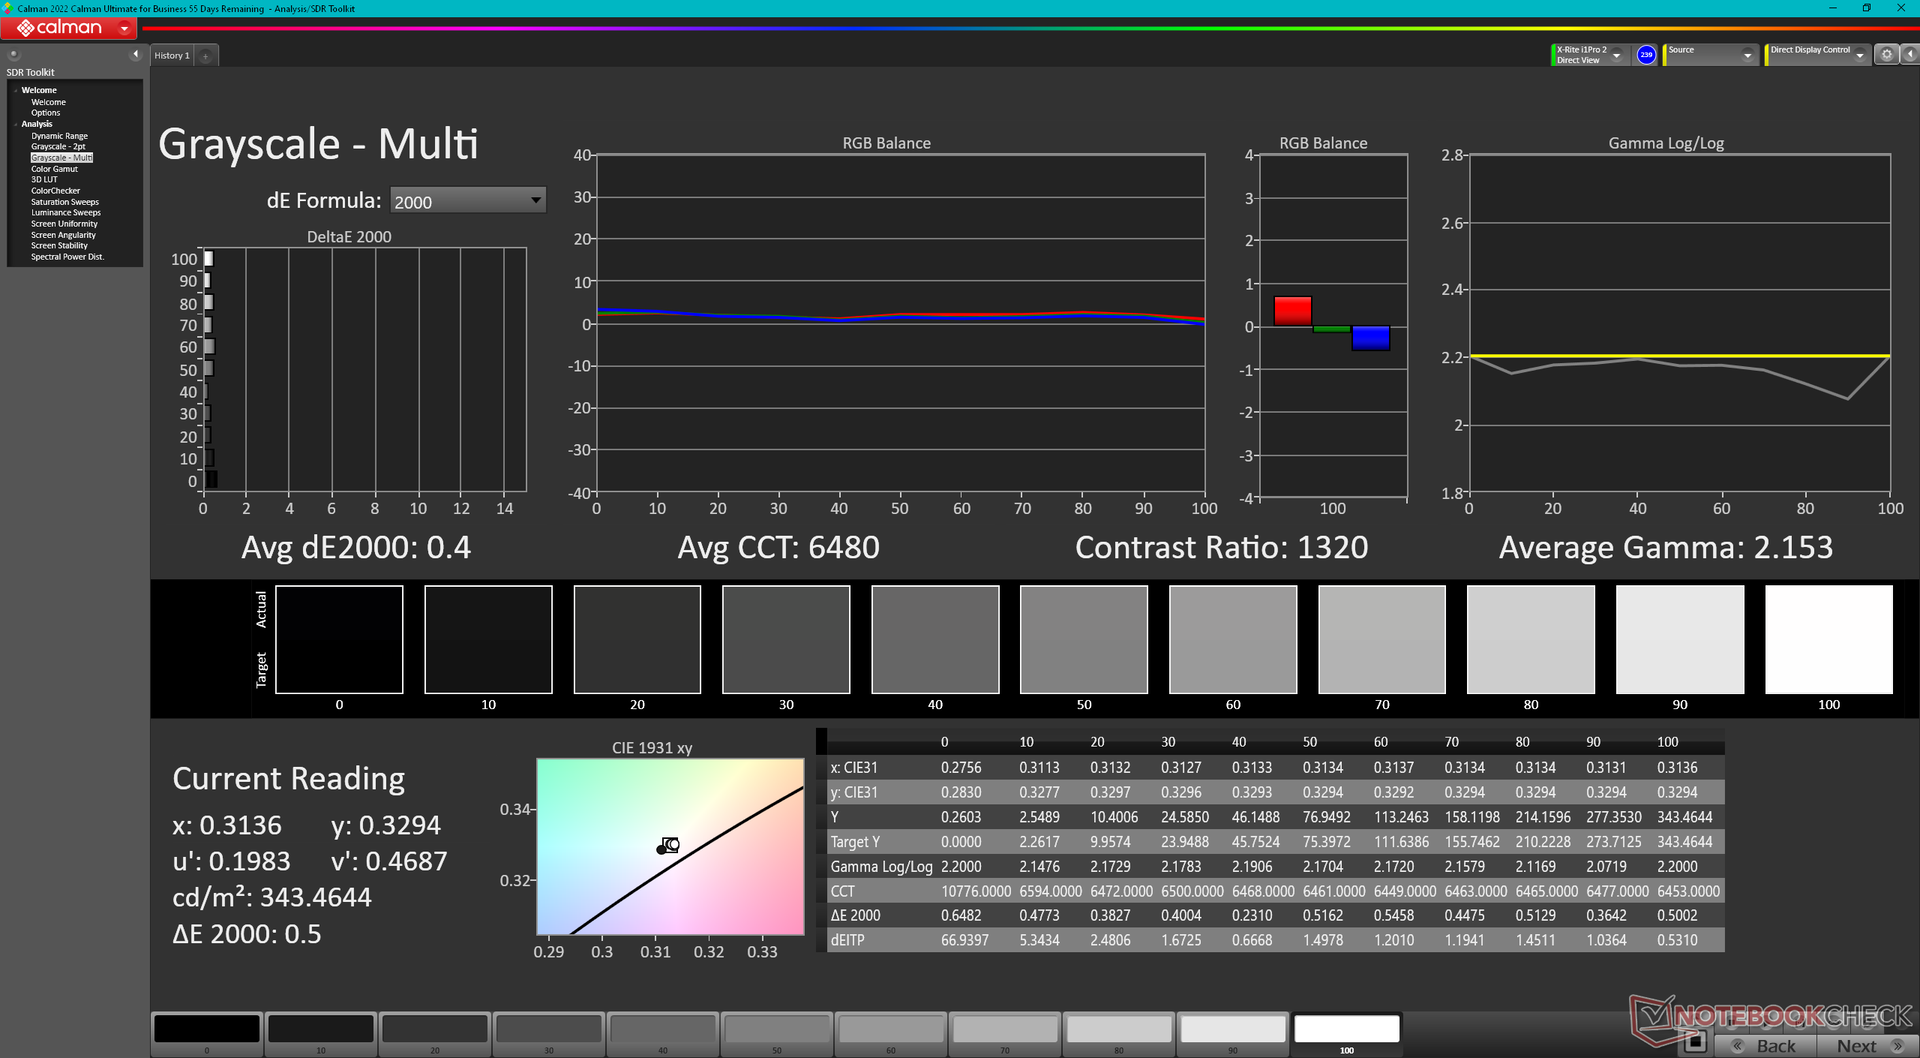
ΔE Greyscale Calman: 2.2 | ∀{0.09-98 Ø4.97}
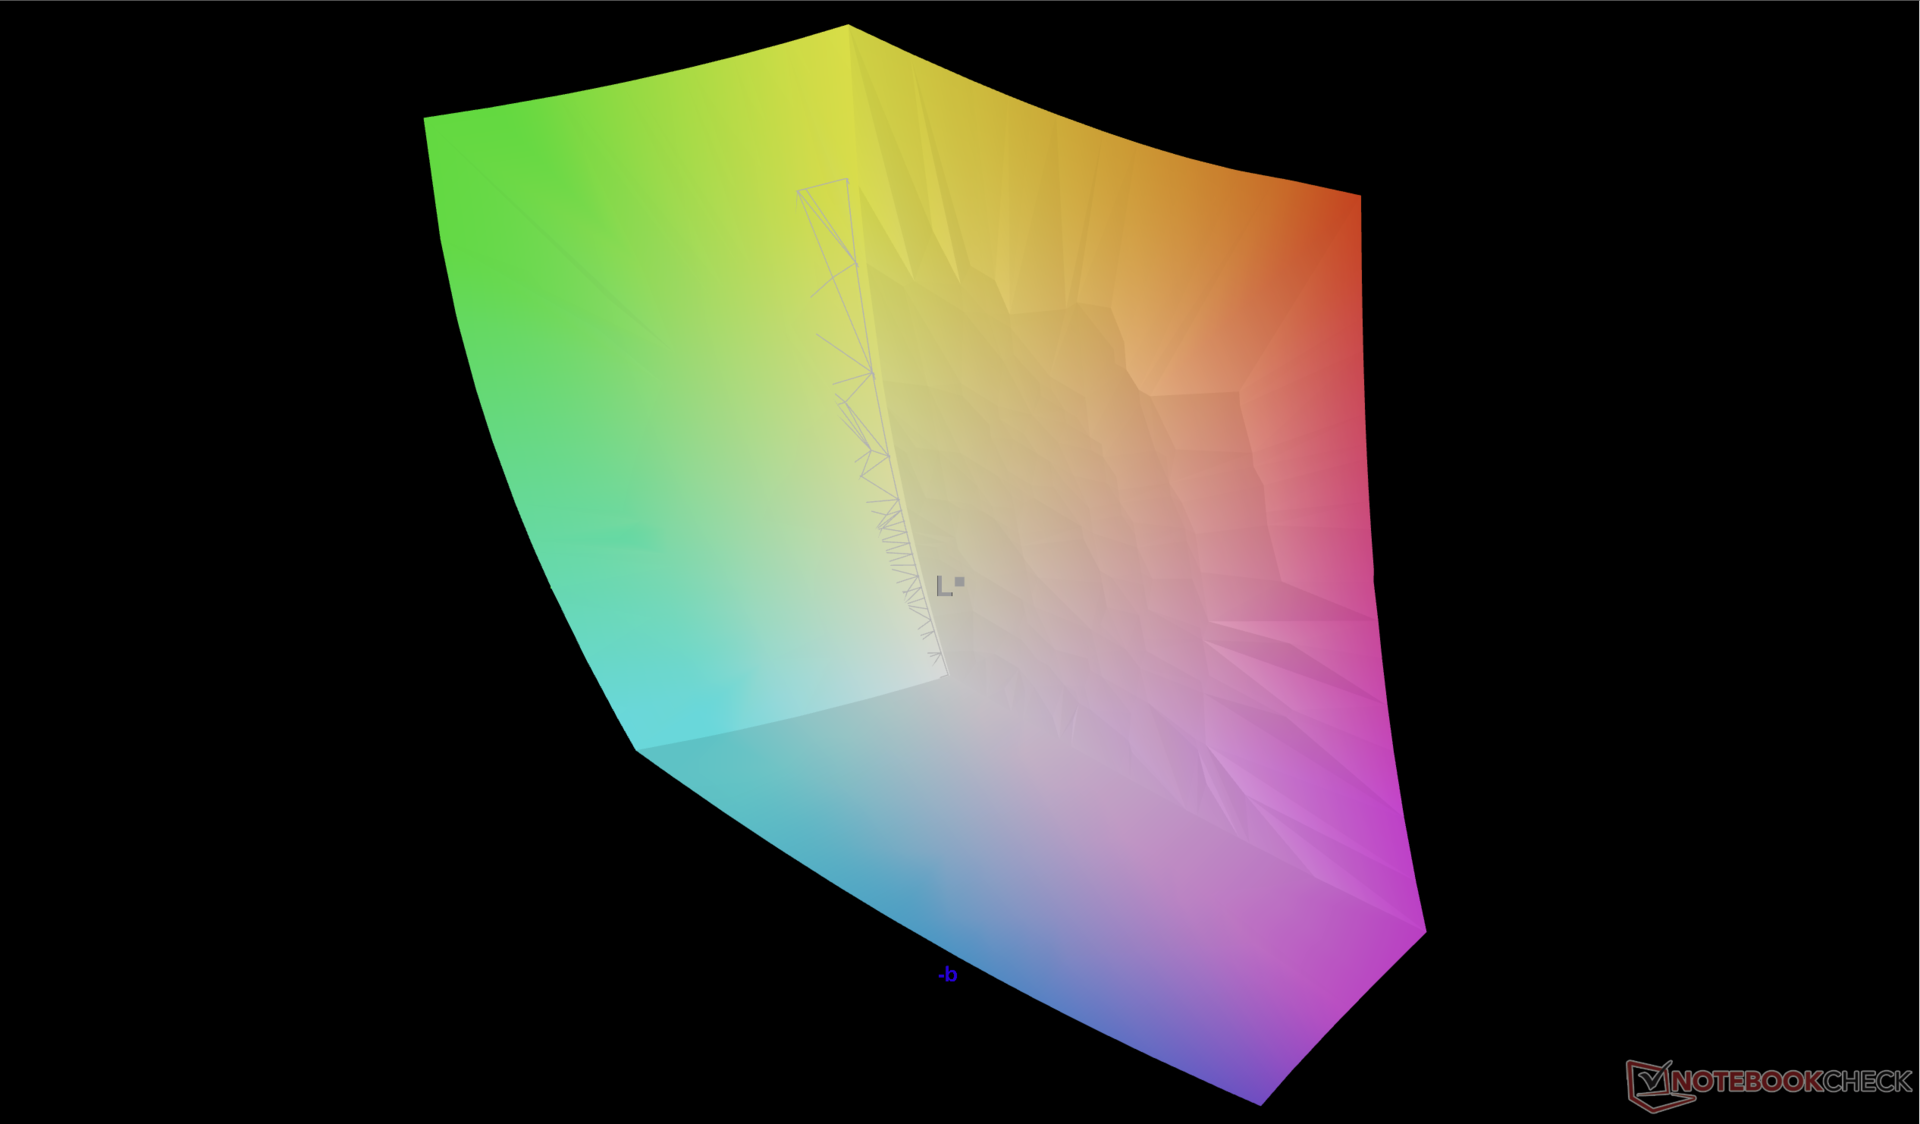
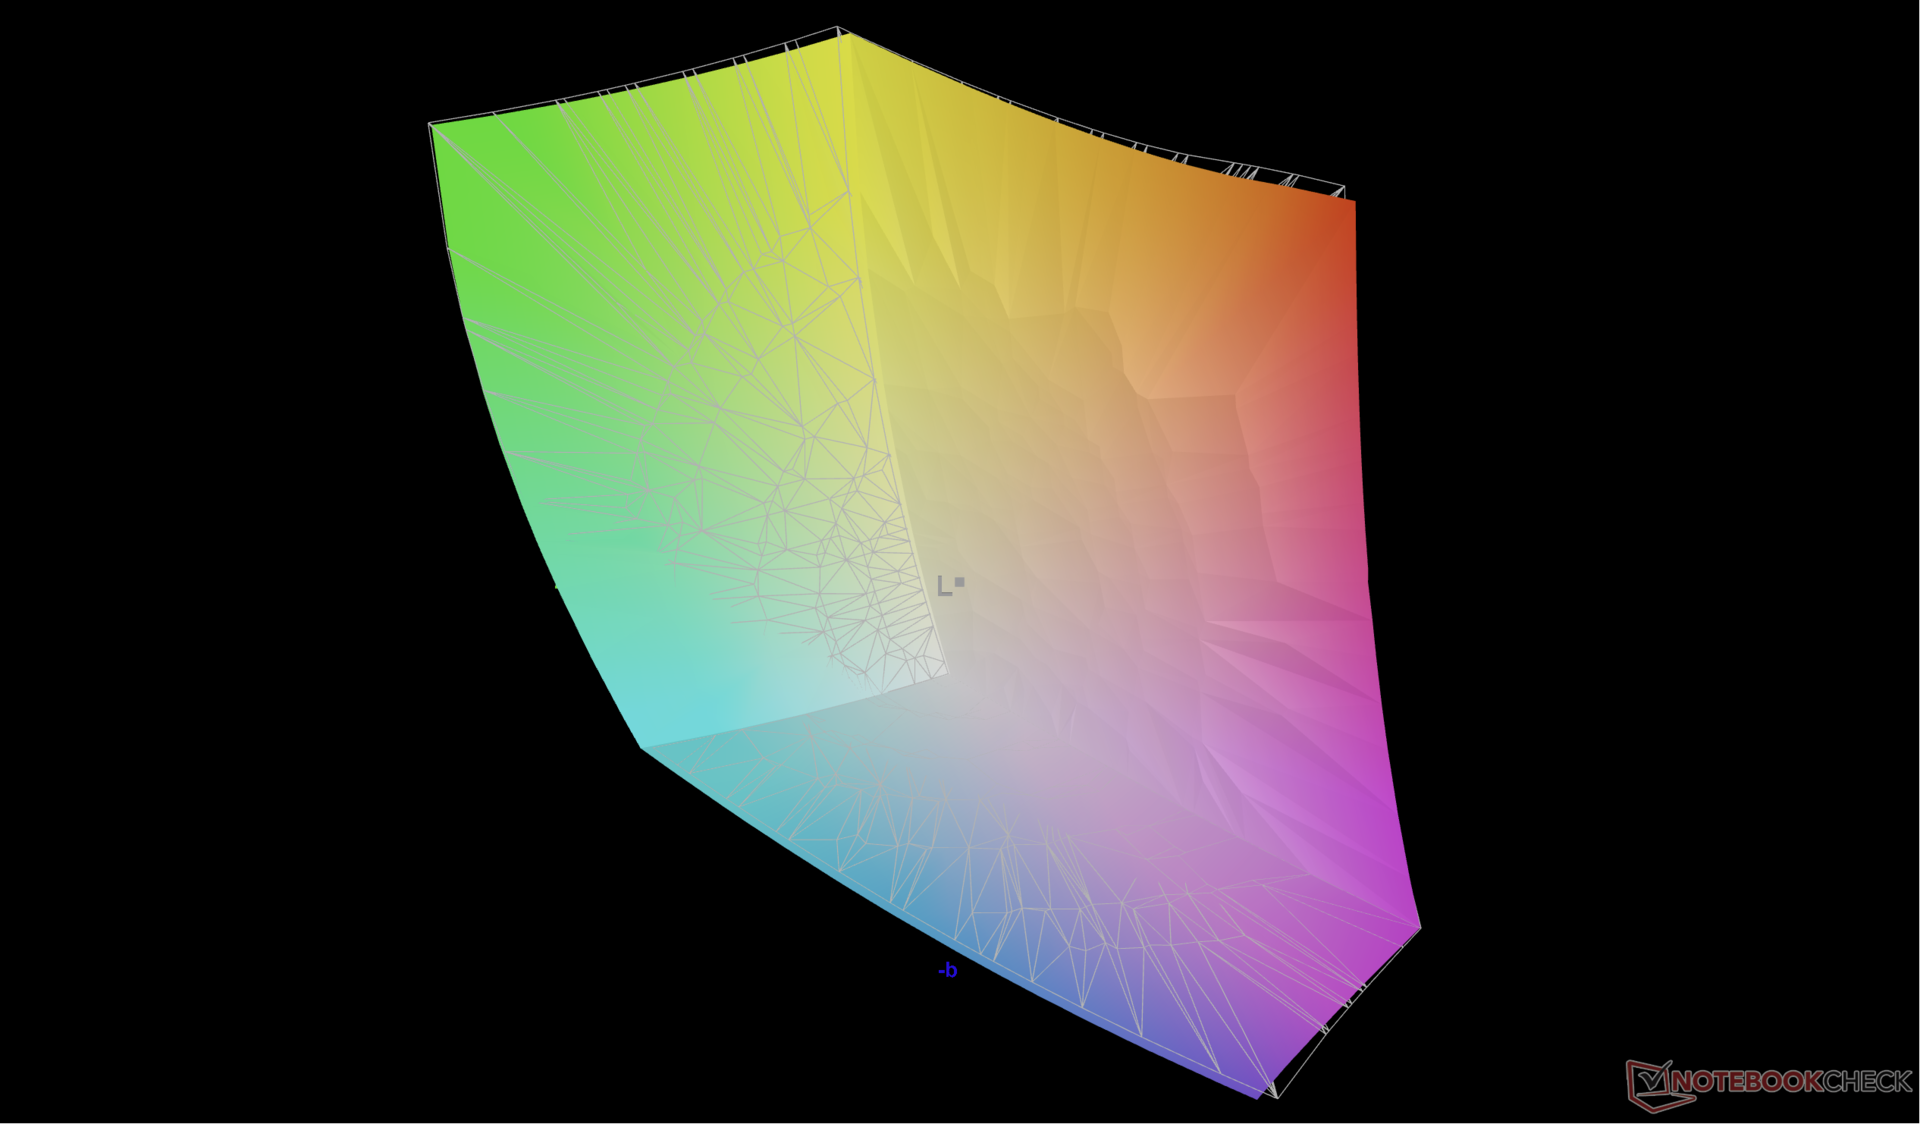
88.9% AdobeRGB 1998 (Argyll 3D)
99.9% sRGB (Argyll 3D)
98.6% Display P3 (Argyll 3D)
Gamma: 2.3
CCT: 6270 K
| Alienware m16 R1 AMD BOE NE16NZ4, IPS, 2560x1600, 16" | Alienware x16 R1 BOE NE16NZ4, IPS, 2560x1600, 16" | HP Omen Transcend 16 AUOA3A6, Mini-LED, 2560x1600, 16" | Lenovo Legion Pro 7 RTX4090 MNG007DA2-3 (CSO1628), IPS, 2560x1600, 16" | Asus ROG Strix G16 G614JZ TL160ADMP03-0, IPS, 2560x1600, 16" | Razer Blade 16 Early 2023 CSOT T3 MNG007DA4-1, IPS, 2560x1600, 16" | |
|---|---|---|---|---|---|---|
| Display | 0% | 0% | -16% | -2% | 0% | |
| Display P3 Coverage (%) | 98.6 | 99.2 1% | 99.2 1% | 69.5 -30% | 97 -2% | 98.5 0% |
| sRGB Coverage (%) | 99.9 | 100 0% | 100 0% | 99.8 0% | 99.9 0% | 100 0% |
| AdobeRGB 1998 Coverage (%) | 88.9 | 88.6 0% | 87.6 -1% | 71.6 -19% | 84.9 -4% | 89.7 1% |
| Response Times | -7% | -316% | -33% | 14% | -31% | |
| Response Time Grey 50% / Grey 80% * (ms) | 5.1 ? | 5.1 ? -0% | 26.4 ? -418% | 10.9 ? -114% | 5.1 ? -0% | 6.6 ? -29% |
| Response Time Black / White * (ms) | 9 ? | 10.3 ? -14% | 28.2 ? -213% | 4.6 ? 49% | 6.6 ? 27% | 12 ? -33% |
| PWM Frequency (Hz) | 3506 ? | |||||
| Screen | 18% | 224% | 23% | 23% | 18% | |
| Brightness middle (cd/m²) | 329 | 302.2 -8% | 791.1 140% | 491 49% | 470 43% | 456.8 39% |
| Brightness (cd/m²) | 317 | 285 -10% | 800 152% | 472 49% | 459 45% | 437 38% |
| Brightness Distribution (%) | 89 | 89 0% | 95 7% | 91 2% | 93 4% | 83 -7% |
| Black Level * (cd/m²) | 0.32 | 0.26 19% | 0.04 87% | 0.4 -25% | 0.42 -31% | 0.35 -9% |
| Contrast (:1) | 1028 | 1162 13% | 19778 1824% | 1228 19% | 1119 9% | 1305 27% |
| Colorchecker dE 2000 * | 3.71 | 1.63 56% | 4.37 -18% | 1.6 57% | 1.86 50% | 3.7 -0% |
| Colorchecker dE 2000 max. * | 7.23 | 4.13 43% | 10.39 -44% | 5.15 29% | 3.87 46% | 6.42 11% |
| Colorchecker dE 2000 calibrated * | 2.82 | 1.17 59% | 1.04 63% | 0.97 66% | 0.93 67% | 0.66 77% |
| Greyscale dE 2000 * | 2.2 | 2.5 -14% | 6.5 -195% | 3 -36% | 2.7 -23% | 2.6 -18% |
| Gamma | 2.3 96% | 2.23 99% | 2.28 96% | 2.211 100% | 2.246 98% | 2.3 96% |
| CCT | 6270 104% | 6590 99% | 6000 108% | 6979 93% | 6711 97% | 6108 106% |
| Totalt genomsnitt (program/inställningar) | 4% /
10% | -31% /
99% | -9% /
7% | 12% /
17% | -4% /
7% |
* ... mindre är bättre
Skärmen är hyfsat kalibrerad mot P3-standarden med genomsnittliga DeltaE-värden för gråskala och färg på endast 2,2 respektive 3,71. Om vi kalibrerar skärmen själva med en X-Rite-kolorimeter skulle gråskalan förbättras ytterligare till ett genomsnittligt deltaE på bara 0,4 för mer exakta färger överlag. Vår kalibrerade ICM-profil finns att ladda ner gratis ovan.
Visa svarstider
| ↔ Svarstid svart till vitt | ||
|---|---|---|
| 9 ms ... stiga ↗ och falla ↘ kombinerat | ↗ 4.8 ms stiga | 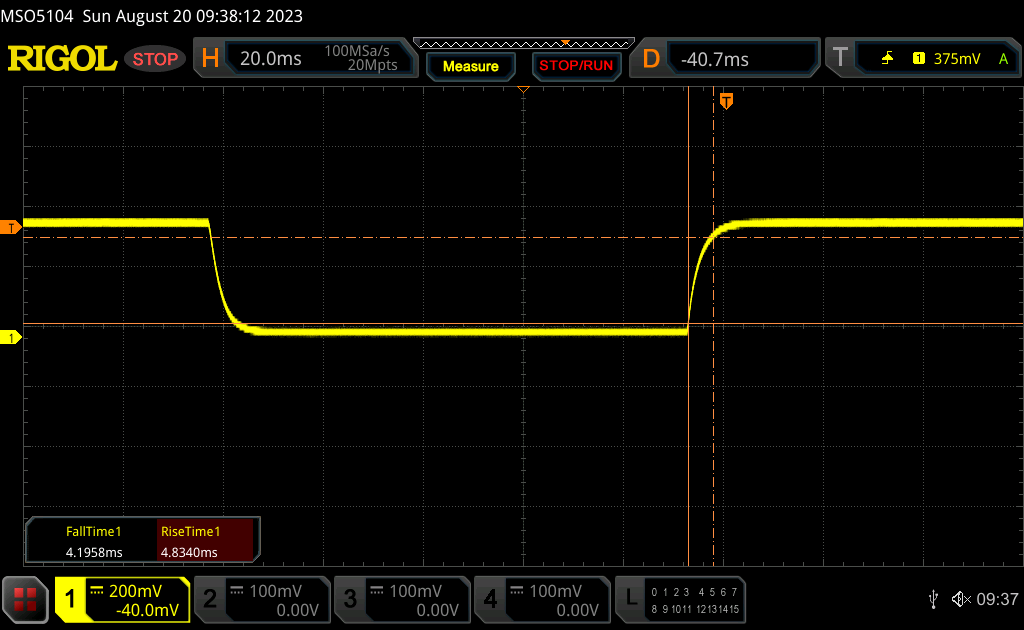 |
| ↘ 4.2 ms hösten | ||
| Skärmen visar snabba svarsfrekvenser i våra tester och bör passa för spel. I jämförelse sträcker sig alla testade enheter från 0.1 (minst) till 240 (maximalt) ms. » 25 % av alla enheter är bättre. Det betyder att den uppmätta svarstiden är bättre än genomsnittet av alla testade enheter (19.9 ms). | ||
| ↔ Svarstid 50 % grått till 80 % grått | ||
| 5.1 ms ... stiga ↗ och falla ↘ kombinerat | ↗ 2.5 ms stiga | 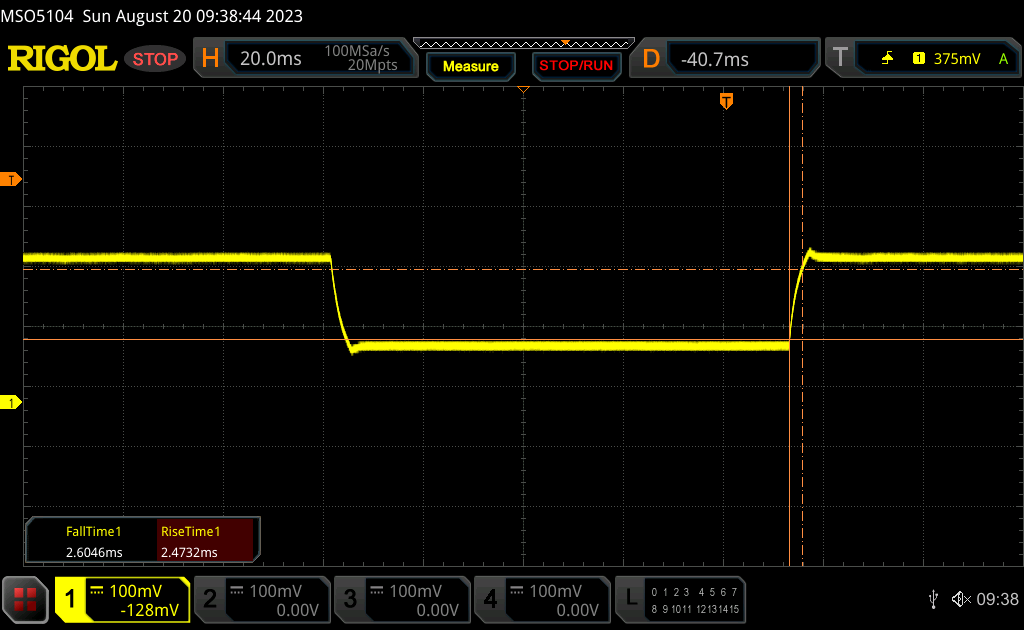 |
| ↘ 2.6 ms hösten | ||
| Skärmen visar väldigt snabba svarsfrekvenser i våra tester och borde vara mycket väl lämpad för fartfyllt spel. I jämförelse sträcker sig alla testade enheter från 0.165 (minst) till 636 (maximalt) ms. » 17 % av alla enheter är bättre. Det betyder att den uppmätta svarstiden är bättre än genomsnittet av alla testade enheter (31.1 ms). | ||
Skärmflimmer / PWM (Puls-Width Modulation)
| Skärmflimmer / PWM upptäcktes inte | 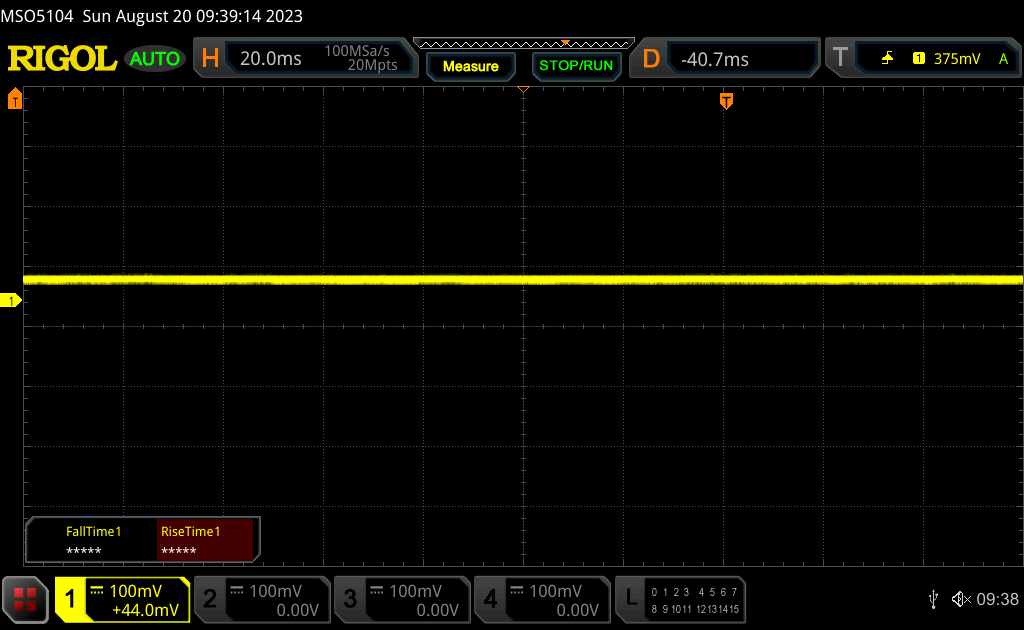 | ||
Som jämförelse: 52 % av alla testade enheter använder inte PWM för att dämpa skärmen. Om PWM upptäcktes mättes ett medelvärde av 7784 (minst: 5 - maximum: 343500) Hz. | |||
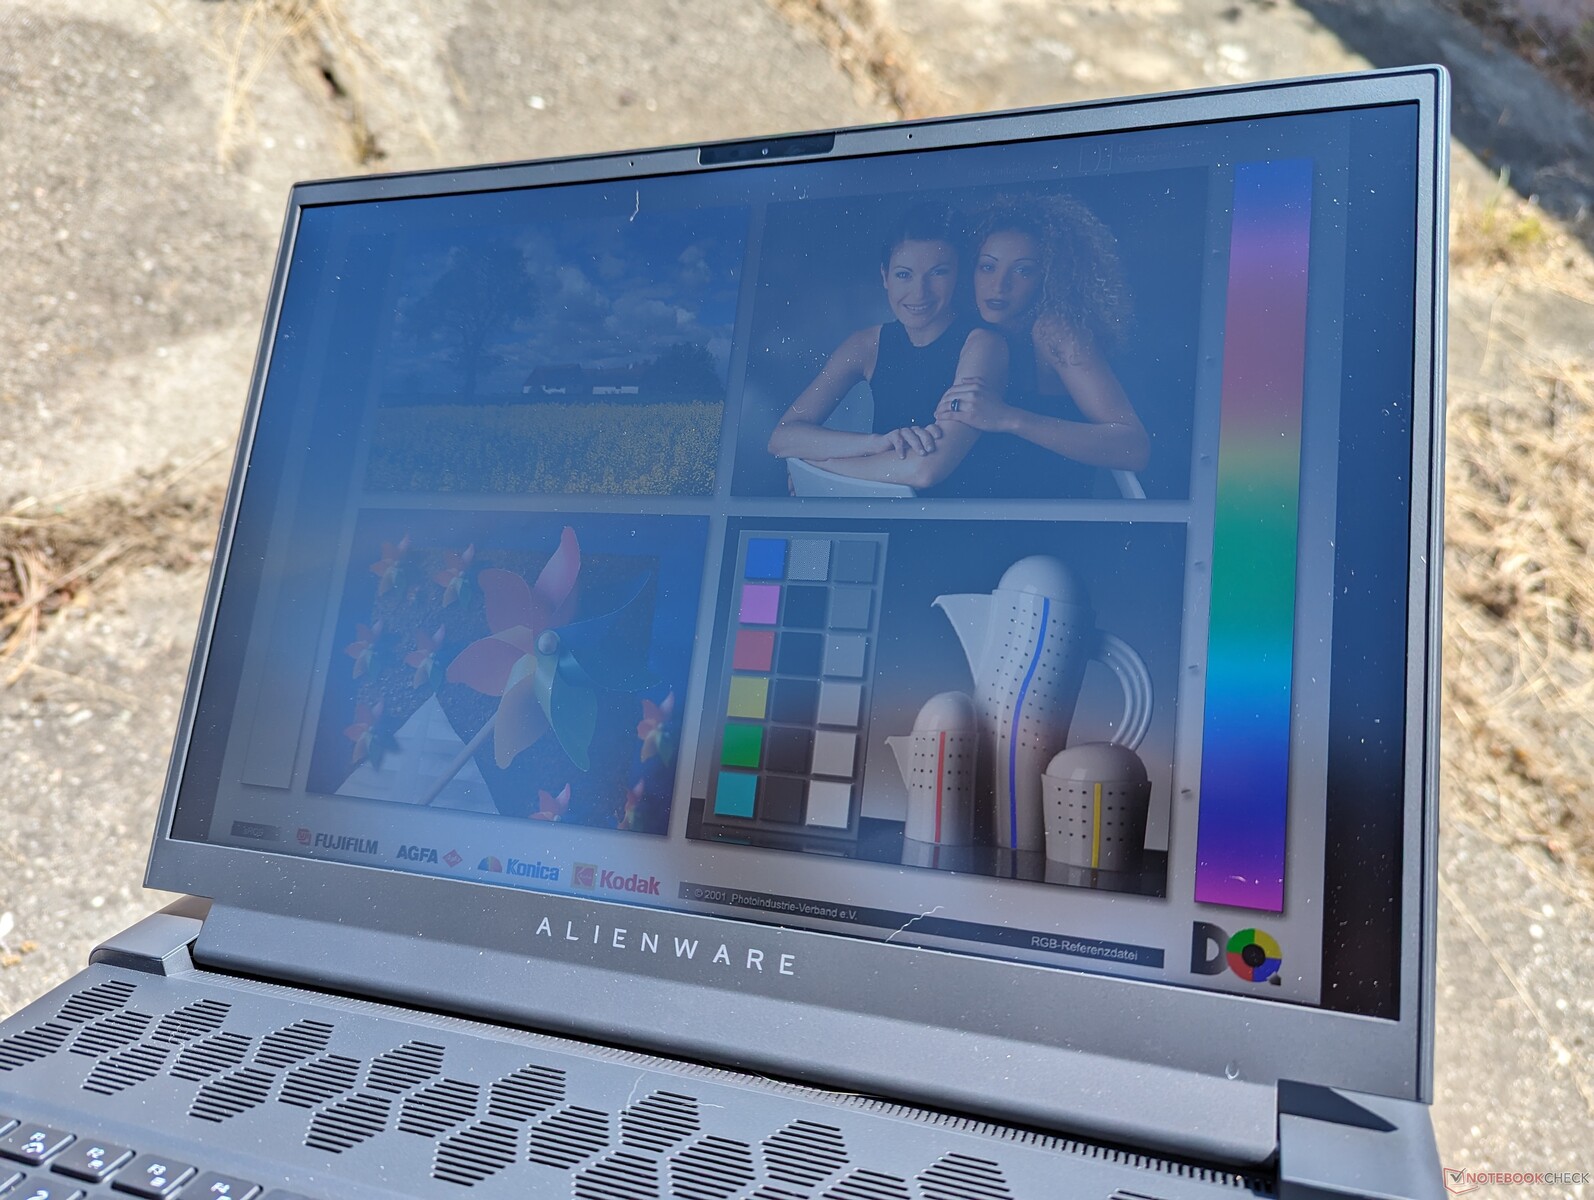
Sikten utomhus är hyfsad endast i skugga. Omen Transcend 16 och dess mini-LED-display är mer än 2x ljusstarkare om utomhussikt är ett problem.
Prestanda - AMD eller Intel?
Villkor för testning
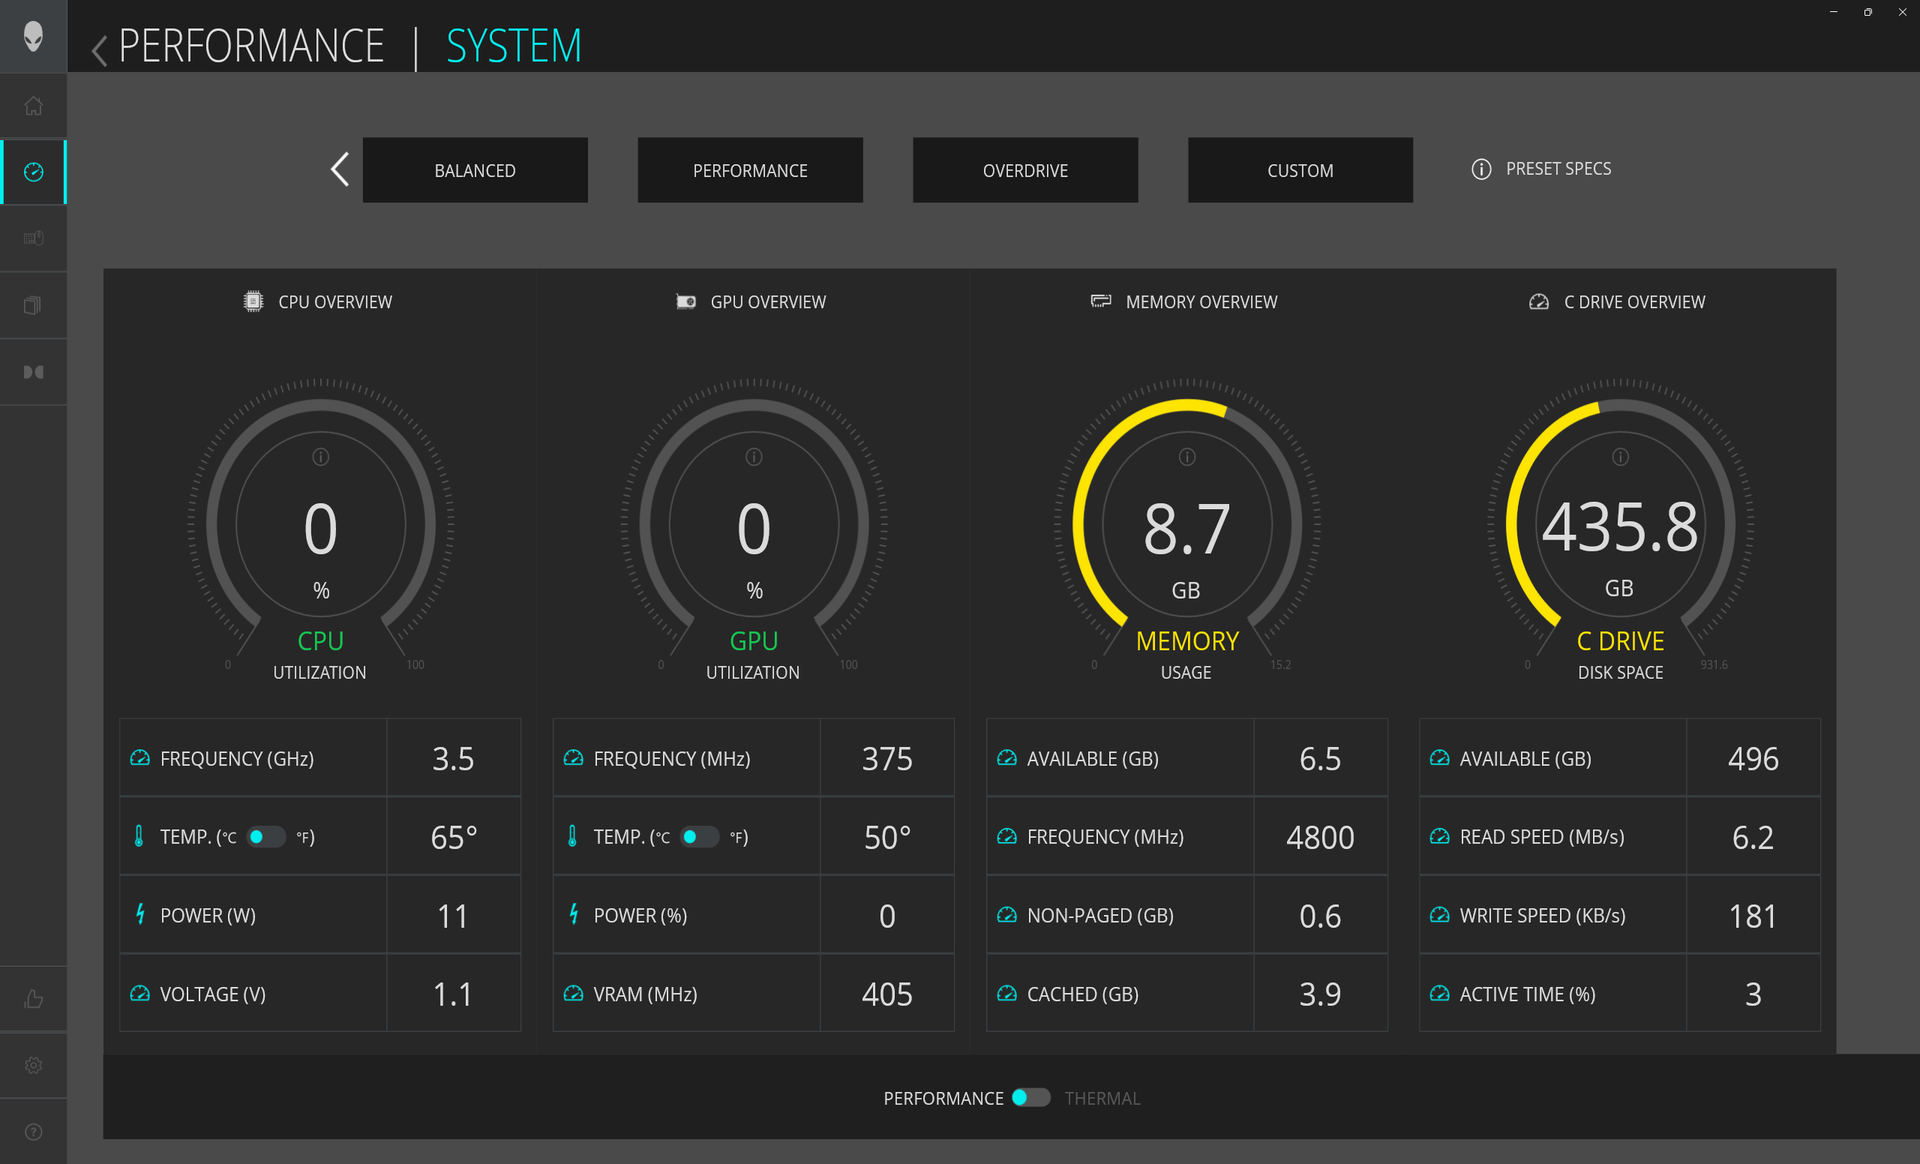
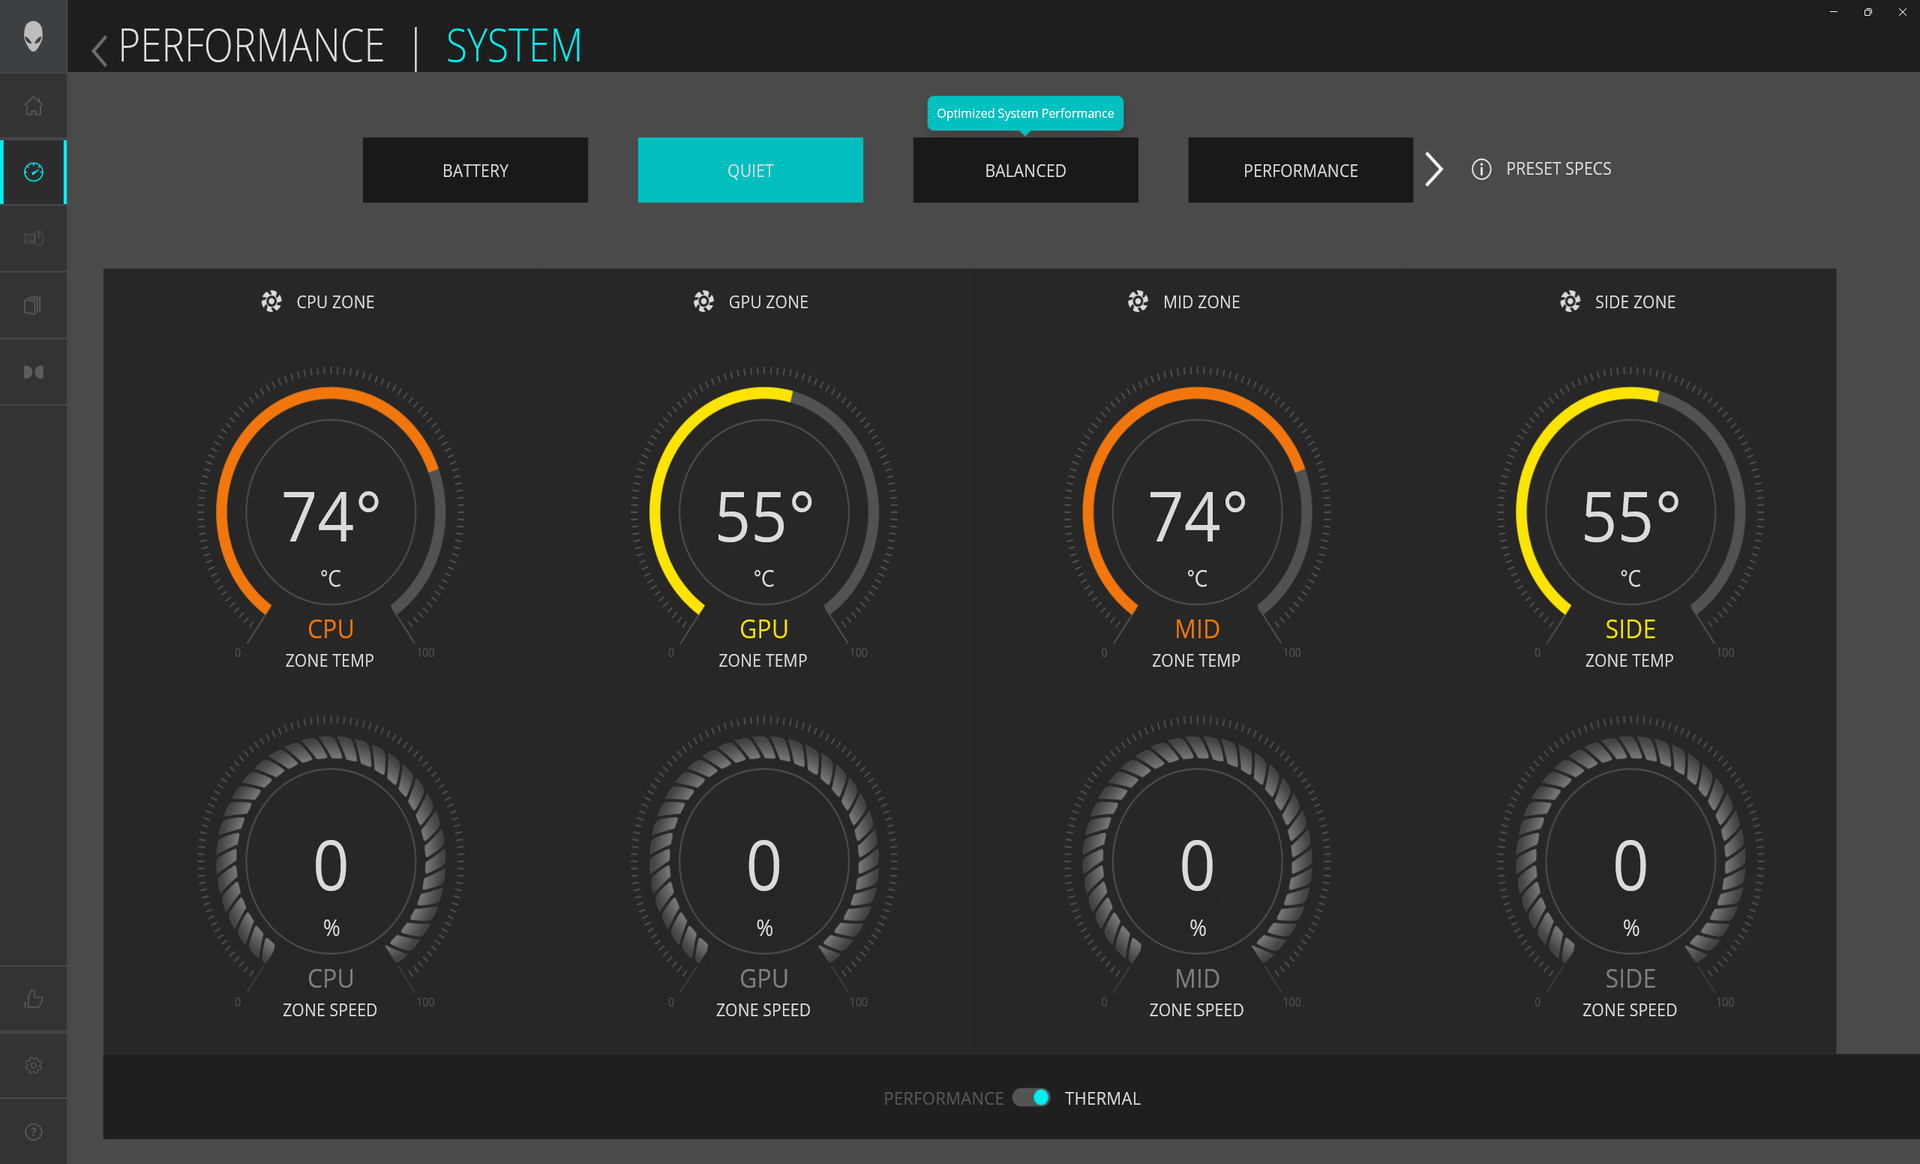
Vi ställde in vår enhet på Overdrive-läge via Alienware Command Center och GPU:n på dGPU-läge innan vi körde riktmärkena nedan. Användare bör bekanta sig med Command Center eftersom det är kontrollhubben för systemfunktioner relaterade till prestanda, vitala funktioner och belysning. Command Center ska inte förväxlas med My Alienware som är programvaran för garanti och support.
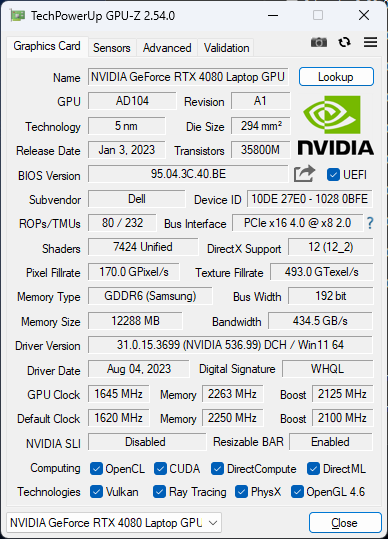
Advanced Optimus eller MUX stöds. G-Sync stöds dock inte på den interna skärmen för AMD-versionerna av Alienware m16 eftersom den funktionen för närvarande är exklusiv för Intel-versionerna. Istället stöds FreeSync i dess ställe.
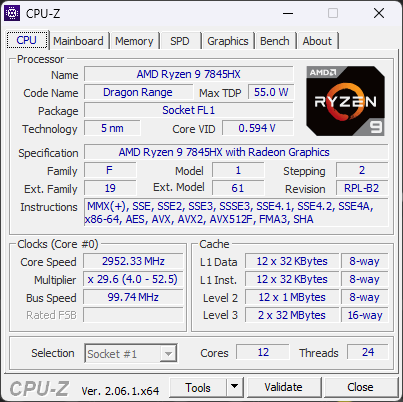
Processor
Ryzen 9 Ryzen 9 7845HX presterar närmare den imponerande Ryzen 9 7945HX än till Ryzen 7 7745HX. Multi-thread prestanda är cirka 20 till 25 procent långsammare än Ryzen 9 7945HX eller ungefär 50 procent bättre än Ryzen 7 7745HX. Processorn är därför bara blyg för den konkurrerande Core i9-13900HX men långt före Core i7-13700HX. Konceptet att nöja sig med långsammare CPU-prestanda genom att välja AMD istället för Intel gäller inte för den här generationen.
Prestandahållbarheten är utmärkt, vilket visas av de stabila Cinebench R15 xT-resultaten nedan.
Cinebench R15 Multi Loop
Cinebench R23: Multi Core | Single Core
Cinebench R20: CPU (Multi Core) | CPU (Single Core)
Cinebench R15: CPU Multi 64Bit | CPU Single 64Bit
Blender: v2.79 BMW27 CPU
7-Zip 18.03: 7z b 4 | 7z b 4 -mmt1
Geekbench 5.5: Multi-Core | Single-Core
HWBOT x265 Benchmark v2.2: 4k Preset
LibreOffice : 20 Documents To PDF
R Benchmark 2.5: Overall mean
* ... mindre är bättre
AIDA64: FP32 Ray-Trace | FPU Julia | CPU SHA3 | CPU Queen | FPU SinJulia | FPU Mandel | CPU AES | CPU ZLib | FP64 Ray-Trace | CPU PhotoWorxx
| Performance rating | |
| Alienware m16 R1 AMD | |
| Genomsnitt AMD Ryzen 9 7845HX | |
| Lenovo Legion Pro 7 RTX4090 | |
| Asus ROG Strix G16 G614JZ | |
| HP Omen Transcend 16 | |
| Razer Blade 16 Early 2023 | |
| Alienware x16 R1 | |
| AIDA64 / FP32 Ray-Trace | |
| Alienware m16 R1 AMD | |
| Genomsnitt AMD Ryzen 9 7845HX (n=1) | |
| Asus ROG Strix G16 G614JZ | |
| Lenovo Legion Pro 7 RTX4090 | |
| Razer Blade 16 Early 2023 | |
| Razer Blade 16 Early 2023 | |
| Razer Blade 16 Early 2023 | |
| HP Omen Transcend 16 | |
| Alienware x16 R1 | |
| AIDA64 / FPU Julia | |
| Alienware m16 R1 AMD | |
| Genomsnitt AMD Ryzen 9 7845HX (n=1) | |
| Lenovo Legion Pro 7 RTX4090 | |
| Asus ROG Strix G16 G614JZ | |
| Razer Blade 16 Early 2023 | |
| Razer Blade 16 Early 2023 | |
| Razer Blade 16 Early 2023 | |
| HP Omen Transcend 16 | |
| Alienware x16 R1 | |
| AIDA64 / CPU SHA3 | |
| Alienware m16 R1 AMD | |
| Genomsnitt AMD Ryzen 9 7845HX (n=1) | |
| Lenovo Legion Pro 7 RTX4090 | |
| Asus ROG Strix G16 G614JZ | |
| Razer Blade 16 Early 2023 | |
| Razer Blade 16 Early 2023 | |
| Razer Blade 16 Early 2023 | |
| HP Omen Transcend 16 | |
| Alienware x16 R1 | |
| AIDA64 / CPU Queen | |
| Alienware m16 R1 AMD | |
| Genomsnitt AMD Ryzen 9 7845HX (n=1) | |
| Asus ROG Strix G16 G614JZ | |
| Lenovo Legion Pro 7 RTX4090 | |
| Razer Blade 16 Early 2023 | |
| Razer Blade 16 Early 2023 | |
| HP Omen Transcend 16 | |
| Alienware x16 R1 | |
| AIDA64 / FPU SinJulia | |
| Alienware m16 R1 AMD | |
| Genomsnitt AMD Ryzen 9 7845HX (n=1) | |
| Asus ROG Strix G16 G614JZ | |
| Razer Blade 16 Early 2023 | |
| Razer Blade 16 Early 2023 | |
| Razer Blade 16 Early 2023 | |
| Lenovo Legion Pro 7 RTX4090 | |
| HP Omen Transcend 16 | |
| Alienware x16 R1 | |
| AIDA64 / FPU Mandel | |
| Alienware m16 R1 AMD | |
| Genomsnitt AMD Ryzen 9 7845HX (n=1) | |
| Lenovo Legion Pro 7 RTX4090 | |
| Asus ROG Strix G16 G614JZ | |
| Razer Blade 16 Early 2023 | |
| Razer Blade 16 Early 2023 | |
| Razer Blade 16 Early 2023 | |
| HP Omen Transcend 16 | |
| Alienware x16 R1 | |
| AIDA64 / CPU AES | |
| Razer Blade 16 Early 2023 | |
| Razer Blade 16 Early 2023 | |
| Razer Blade 16 Early 2023 | |
| Lenovo Legion Pro 7 RTX4090 | |
| Asus ROG Strix G16 G614JZ | |
| HP Omen Transcend 16 | |
| Alienware m16 R1 AMD | |
| Genomsnitt AMD Ryzen 9 7845HX (n=1) | |
| Alienware x16 R1 | |
| AIDA64 / CPU ZLib | |
| Lenovo Legion Pro 7 RTX4090 | |
| Asus ROG Strix G16 G614JZ | |
| Razer Blade 16 Early 2023 | |
| Razer Blade 16 Early 2023 | |
| Razer Blade 16 Early 2023 | |
| Alienware m16 R1 AMD | |
| Genomsnitt AMD Ryzen 9 7845HX (n=1) | |
| HP Omen Transcend 16 | |
| Alienware x16 R1 | |
| AIDA64 / FP64 Ray-Trace | |
| Alienware m16 R1 AMD | |
| Genomsnitt AMD Ryzen 9 7845HX (n=1) | |
| Asus ROG Strix G16 G614JZ | |
| Lenovo Legion Pro 7 RTX4090 | |
| Razer Blade 16 Early 2023 | |
| Razer Blade 16 Early 2023 | |
| Razer Blade 16 Early 2023 | |
| HP Omen Transcend 16 | |
| Alienware x16 R1 | |
| AIDA64 / CPU PhotoWorxx | |
| Razer Blade 16 Early 2023 | |
| Razer Blade 16 Early 2023 | |
| Razer Blade 16 Early 2023 | |
| Lenovo Legion Pro 7 RTX4090 | |
| HP Omen Transcend 16 | |
| Alienware x16 R1 | |
| Asus ROG Strix G16 G614JZ | |
| Alienware m16 R1 AMD | |
| Genomsnitt AMD Ryzen 9 7845HX (n=1) | |
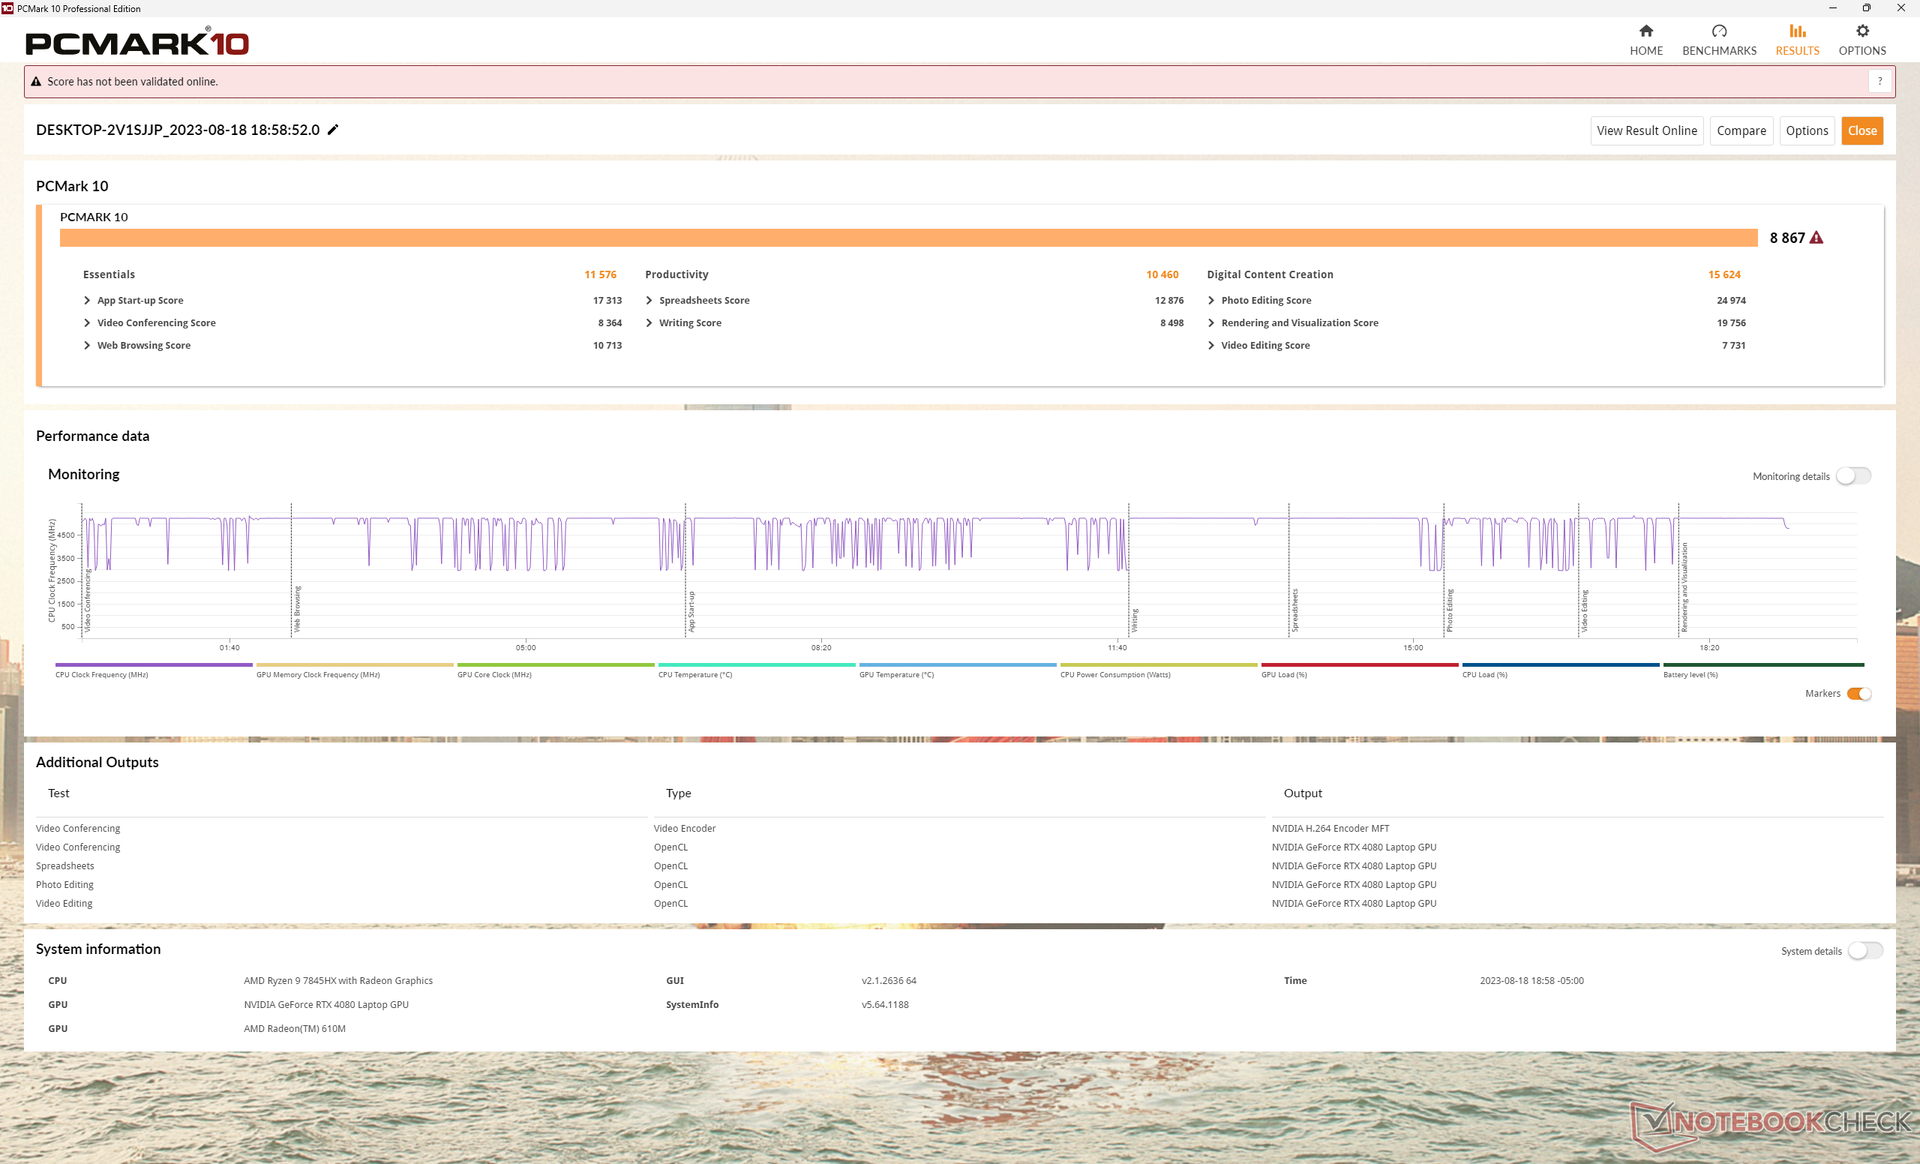
Systemets prestanda
PCMark-resultaten är några av de högsta för en bärbar speldator. Den största marginalen finns i deltestet Productivity som fokuserar på CPU-prestanda.
Tyvärr upplevde vi flera problem med att väcka från viloläge på vår testenhet. Systemet startade ibland om utan anledning när locket öppnades eller visade Blue Screen of Death även efter uppdatering till de senaste drivrutinerna från Dell och Nvidia vid tidpunkten för recensionen.
CrossMark: Overall | Productivity | Creativity | Responsiveness
| PCMark 10 / Score | |
| Alienware m16 R1 AMD | |
| Genomsnitt AMD Ryzen 9 7845HX, NVIDIA GeForce RTX 4080 Laptop GPU (n=1) | |
| Alienware x16 R1 | |
| Lenovo Legion Pro 7 RTX4090 | |
| HP Omen Transcend 16 | |
| Razer Blade 16 Early 2023 | |
| Asus ROG Strix G16 G614JZ | |
| PCMark 10 / Essentials | |
| Asus ROG Strix G16 G614JZ | |
| Alienware m16 R1 AMD | |
| Genomsnitt AMD Ryzen 9 7845HX, NVIDIA GeForce RTX 4080 Laptop GPU (n=1) | |
| HP Omen Transcend 16 | |
| Alienware x16 R1 | |
| Lenovo Legion Pro 7 RTX4090 | |
| Razer Blade 16 Early 2023 | |
| PCMark 10 / Productivity | |
| Alienware m16 R1 AMD | |
| Genomsnitt AMD Ryzen 9 7845HX, NVIDIA GeForce RTX 4080 Laptop GPU (n=1) | |
| Alienware x16 R1 | |
| HP Omen Transcend 16 | |
| Lenovo Legion Pro 7 RTX4090 | |
| Razer Blade 16 Early 2023 | |
| Asus ROG Strix G16 G614JZ | |
| PCMark 10 / Digital Content Creation | |
| Alienware m16 R1 AMD | |
| Genomsnitt AMD Ryzen 9 7845HX, NVIDIA GeForce RTX 4080 Laptop GPU (n=1) | |
| Lenovo Legion Pro 7 RTX4090 | |
| Razer Blade 16 Early 2023 | |
| Alienware x16 R1 | |
| HP Omen Transcend 16 | |
| Asus ROG Strix G16 G614JZ | |
| CrossMark / Overall | |
| Asus ROG Strix G16 G614JZ | |
| Alienware m16 R1 AMD | |
| Genomsnitt AMD Ryzen 9 7845HX, NVIDIA GeForce RTX 4080 Laptop GPU (n=1) | |
| HP Omen Transcend 16 | |
| Alienware x16 R1 | |
| Razer Blade 16 Early 2023 | |
| CrossMark / Productivity | |
| Asus ROG Strix G16 G614JZ | |
| Alienware m16 R1 AMD | |
| Genomsnitt AMD Ryzen 9 7845HX, NVIDIA GeForce RTX 4080 Laptop GPU (n=1) | |
| Alienware x16 R1 | |
| HP Omen Transcend 16 | |
| Razer Blade 16 Early 2023 | |
| CrossMark / Creativity | |
| Asus ROG Strix G16 G614JZ | |
| HP Omen Transcend 16 | |
| Alienware m16 R1 AMD | |
| Genomsnitt AMD Ryzen 9 7845HX, NVIDIA GeForce RTX 4080 Laptop GPU (n=1) | |
| Alienware x16 R1 | |
| Razer Blade 16 Early 2023 | |
| CrossMark / Responsiveness | |
| Asus ROG Strix G16 G614JZ | |
| Alienware x16 R1 | |
| Alienware m16 R1 AMD | |
| Genomsnitt AMD Ryzen 9 7845HX, NVIDIA GeForce RTX 4080 Laptop GPU (n=1) | |
| HP Omen Transcend 16 | |
| Razer Blade 16 Early 2023 | |
| PCMark 10 Score | 8867 poäng | |
Hjälp | ||
| AIDA64 / Memory Copy | |
| Razer Blade 16 Early 2023 | |
| Razer Blade 16 Early 2023 | |
| Razer Blade 16 Early 2023 | |
| Lenovo Legion Pro 7 RTX4090 | |
| HP Omen Transcend 16 | |
| Alienware x16 R1 | |
| Asus ROG Strix G16 G614JZ | |
| Alienware m16 R1 AMD | |
| Genomsnitt AMD Ryzen 9 7845HX (n=1) | |
| AIDA64 / Memory Read | |
| Lenovo Legion Pro 7 RTX4090 | |
| Razer Blade 16 Early 2023 | |
| Razer Blade 16 Early 2023 | |
| Razer Blade 16 Early 2023 | |
| HP Omen Transcend 16 | |
| Asus ROG Strix G16 G614JZ | |
| Alienware x16 R1 | |
| Alienware m16 R1 AMD | |
| Genomsnitt AMD Ryzen 9 7845HX (n=1) | |
| AIDA64 / Memory Write | |
| Alienware x16 R1 | |
| Razer Blade 16 Early 2023 | |
| Razer Blade 16 Early 2023 | |
| Razer Blade 16 Early 2023 | |
| Lenovo Legion Pro 7 RTX4090 | |
| HP Omen Transcend 16 | |
| Asus ROG Strix G16 G614JZ | |
| Alienware m16 R1 AMD | |
| Genomsnitt AMD Ryzen 9 7845HX (n=1) | |
| AIDA64 / Memory Latency | |
| Alienware x16 R1 | |
| Razer Blade 16 Early 2023 | |
| Razer Blade 16 Early 2023 | |
| Razer Blade 16 Early 2023 | |
| Alienware m16 R1 AMD | |
| Genomsnitt AMD Ryzen 9 7845HX (n=1) | |
| HP Omen Transcend 16 | |
| Asus ROG Strix G16 G614JZ | |
| Lenovo Legion Pro 7 RTX4090 | |
* ... mindre är bättre
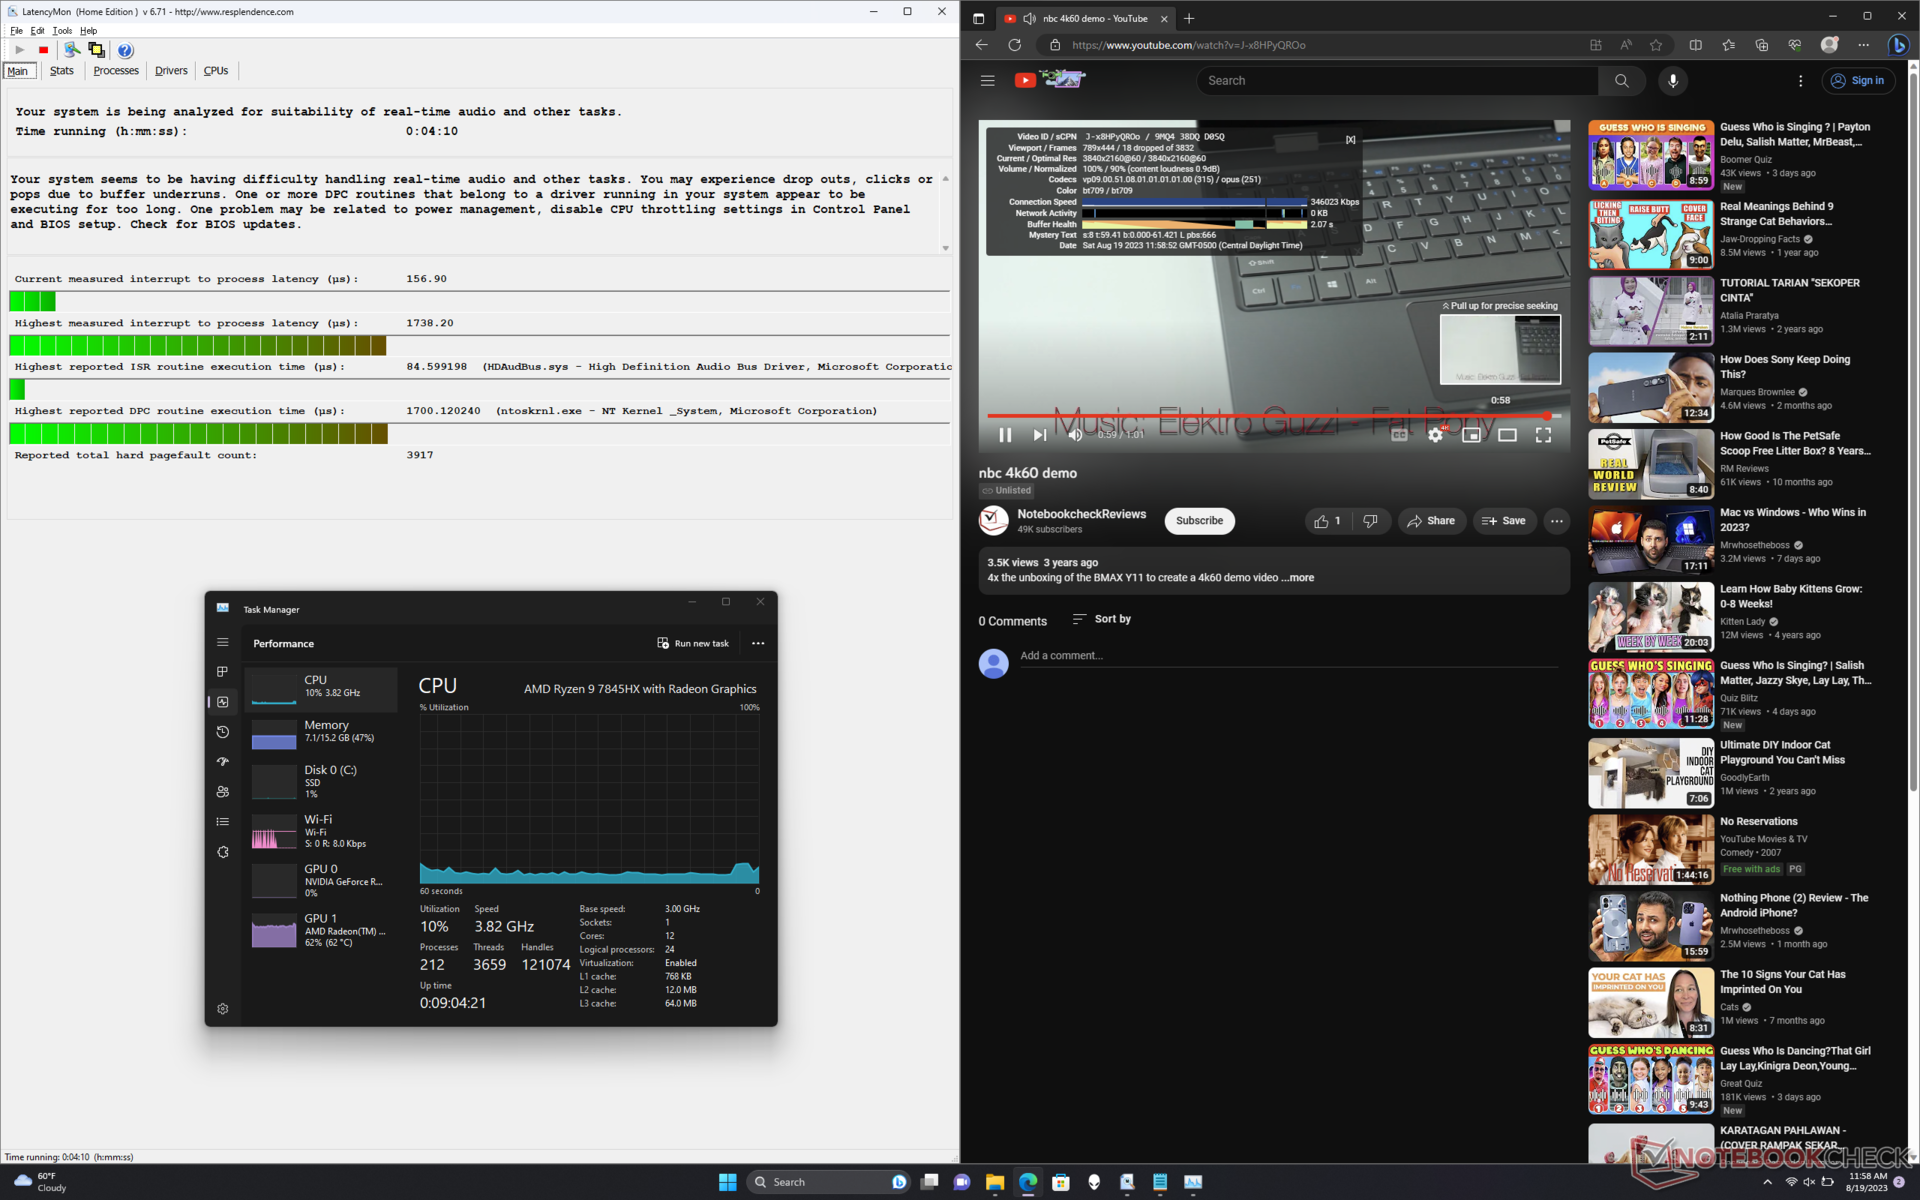
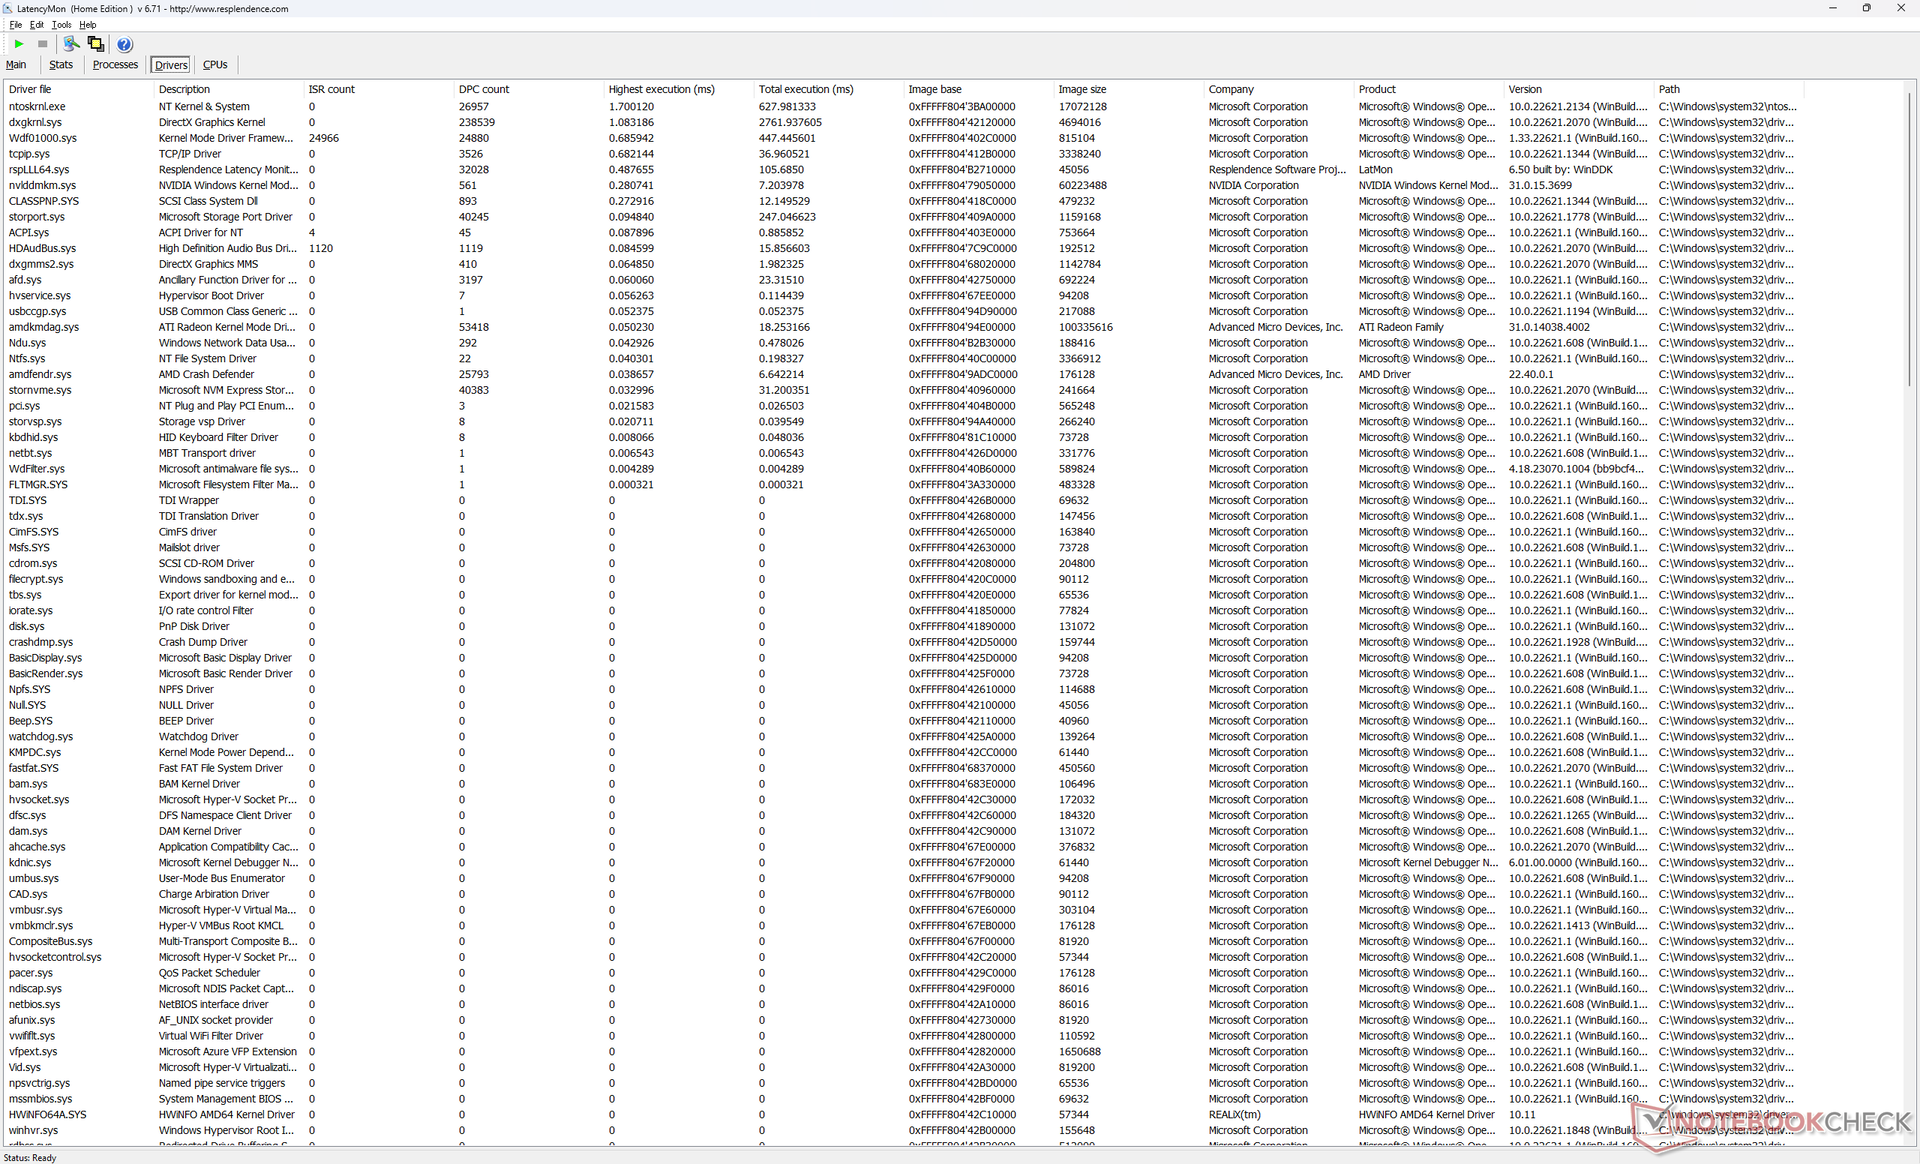
DPC-fördröjning
LatencyMon avslöjar små DPC-problem relaterade till ntoskrnl.exe. Dessutom är 4K-videouppspelning vid 60 FPS ofullständig med 18 tappade bildrutor inspelade under ett videotest på en minut, vilket tyder på ett potentiellt fel i AMD-hårdvaruaccelerationen. Resultaten förbättrades inte ens efter upprepade tester.
| DPC Latencies / LatencyMon - interrupt to process latency (max), Web, Youtube, Prime95 | |
| Lenovo Legion Pro 7 RTX4090 | |
| Asus ROG Strix G16 G614JZ | |
| Razer Blade 16 Early 2023 | |
| Alienware m16 R1 AMD | |
| HP Omen Transcend 16 | |
| Alienware x16 R1 | |
* ... mindre är bättre
Lagringsenheter
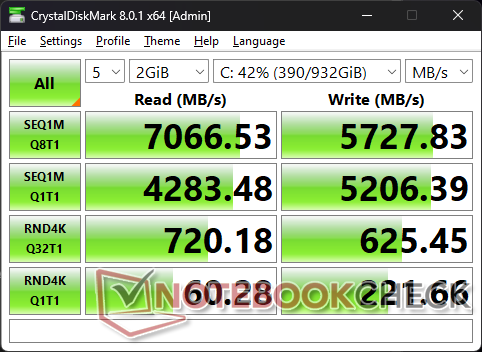
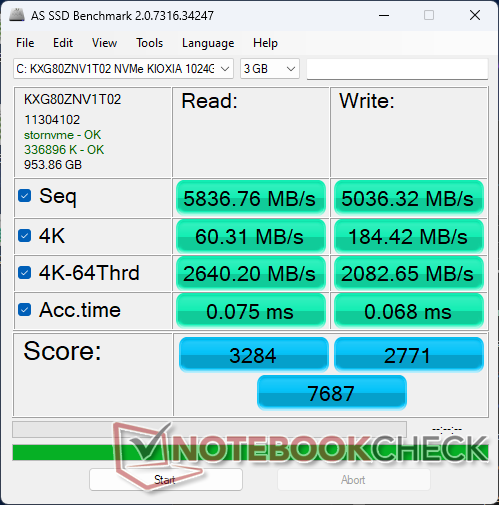
Vår enhet levereras med en avancerad 1 TB Kioxia KXG80ZNV1T02 som erbjuder sekventiella läs- och skrivhastigheter på upp till 7000 MB/s respektive 5600 MB/s, enligt tillverkaren. Enheten kan upprätthålla maximala överföringshastigheter på över 6500 MB/s under längre perioder utan problem med strypning.
Upp till tre M.2 SSD-enheter kan installeras medan Alienware x16 och HP Omen 16 endast kan stödja upp till två vardera. Den tredje enheten måste dock vara 30 mm lång.

| Drive Performance rating - Percent | |
| Alienware x16 R1 | |
| Lenovo Legion Pro 7 RTX4090 | |
| Alienware m16 R1 AMD | |
| Razer Blade 16 Early 2023 | |
| HP Omen Transcend 16 | |
| Asus ROG Strix G16 G614JZ | |
* ... mindre är bättre
Disk Throttling: DiskSpd Read Loop, Queue Depth 8
GPU-prestanda - 175 W TGP Graphics
Grafikprestandan är cirka 5 till 10 procent snabbare än den genomsnittliga bärbara speldatorn i vår databas som är utrustad med samma RTX 4080 GPU eftersom Alienware siktar på en relativt hög 175 W TGP. Faktum är att prestanda bara är cirka 5 procent långsammare änAsus Zephyrus Duo 16 som körs på RTX 4090.
Uppgradering till RTX 4090 SKU förväntas öka prestandan med bara 10 procent jämfört med vår RTX 4080 medan nedgradering till RTX 4070 bör minska prestandan mer markant med upp till 30 till 40 procent baserat på vår tid med HP Omen Transcend 16. Entusiaster bör därför åtminstone överväga SKU:er med RTX 4080.
Intressant nog är det bara små prestandaskillnader mellan lägena Balanserad, Prestanda och Overdrive, vilket framgår av Fire Strike i tabellen nedan. Detta är viktigt att notera eftersom lägena skiljer sig avsevärt när det gäller fläktljud.
| Kraftprofil | Grafisk poäng | Poäng för fysik | Kombinerat resultat |
| Batteriets effekt | 22290 (-50%) | 30178 (-17%) | 9109 (-35%) |
| Balanserat läge | 43406 (-3%) | 35237 (-4%) | 14721 (+5%) |
| Prestationsinriktat läge | 44306 (-1%) | 36106 (-1%) | 13682 (-3%) |
| Överdrivet läge | 44782 | 36557 | 14045 |
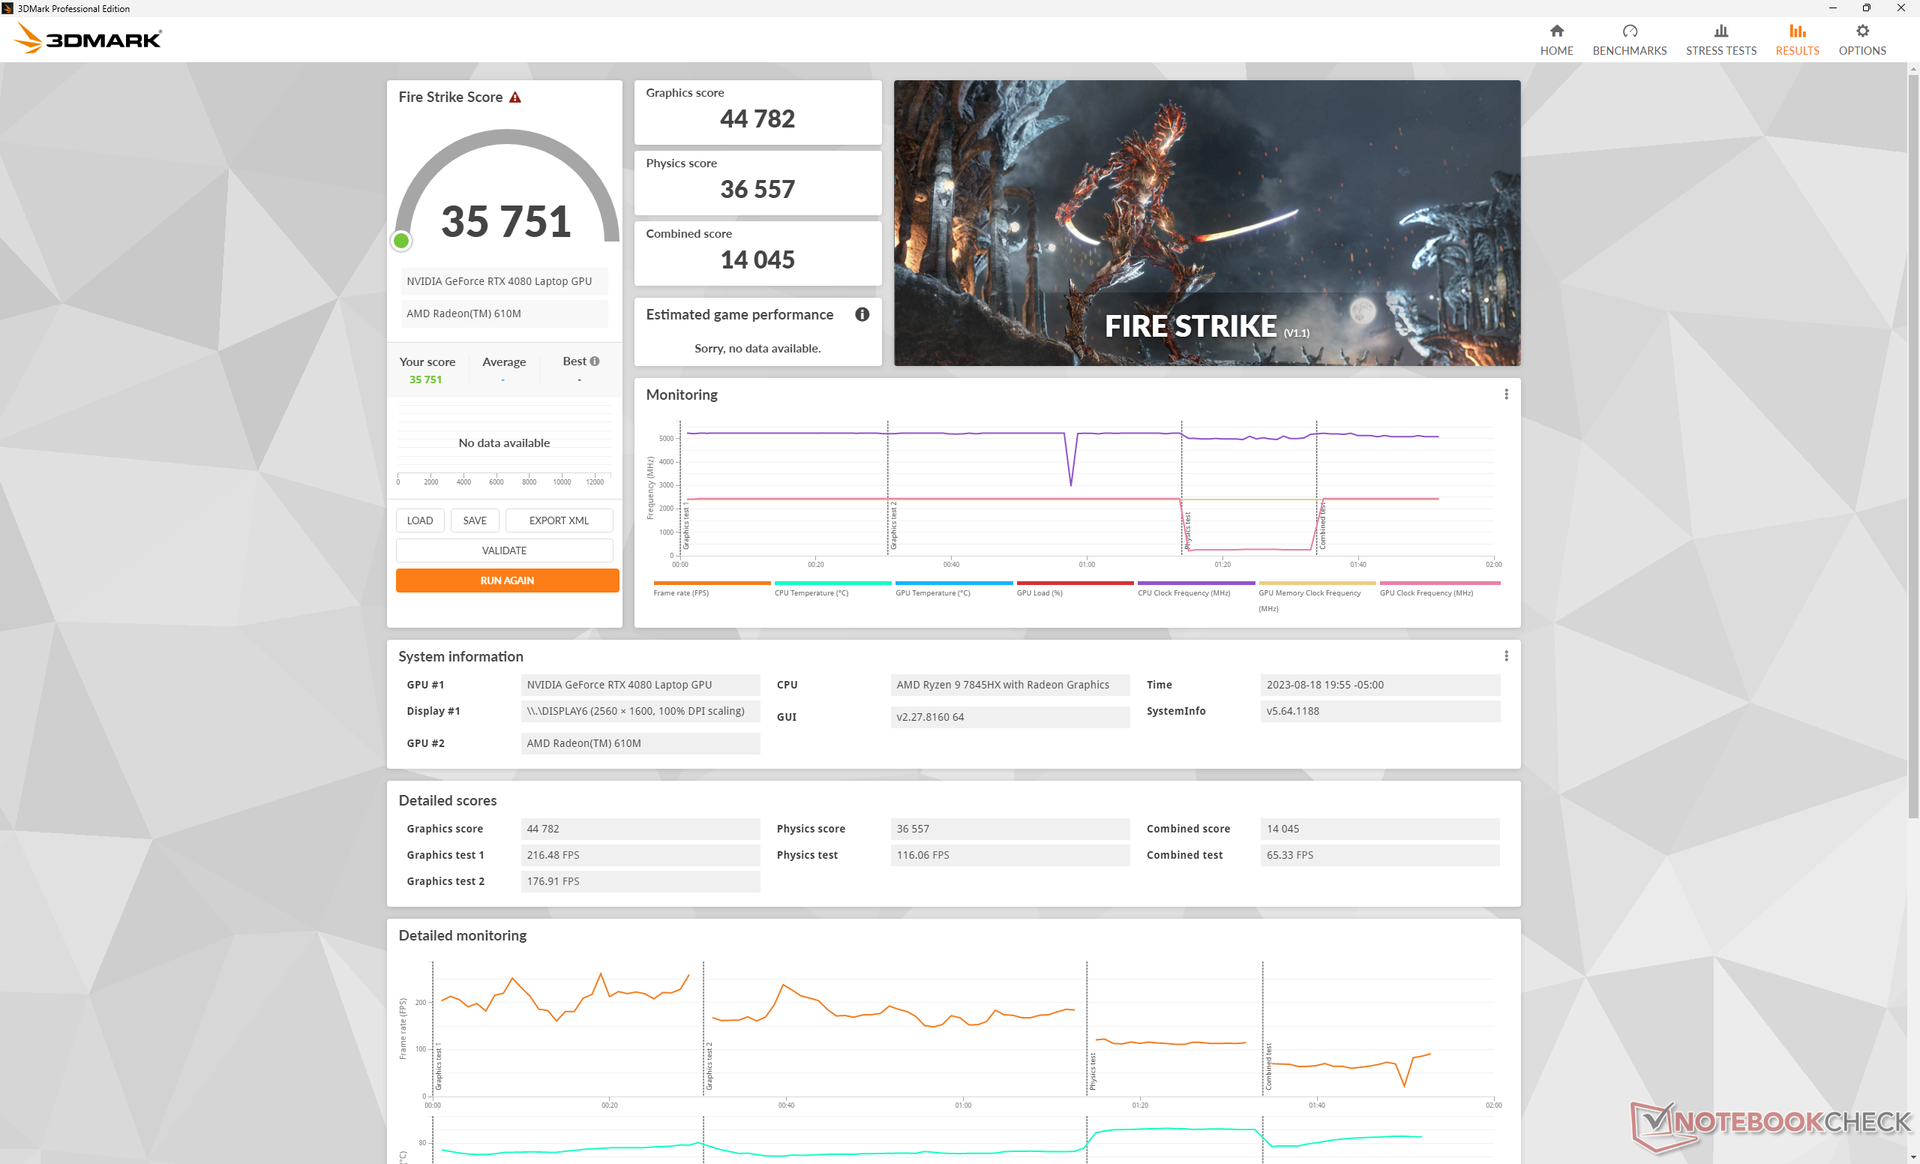

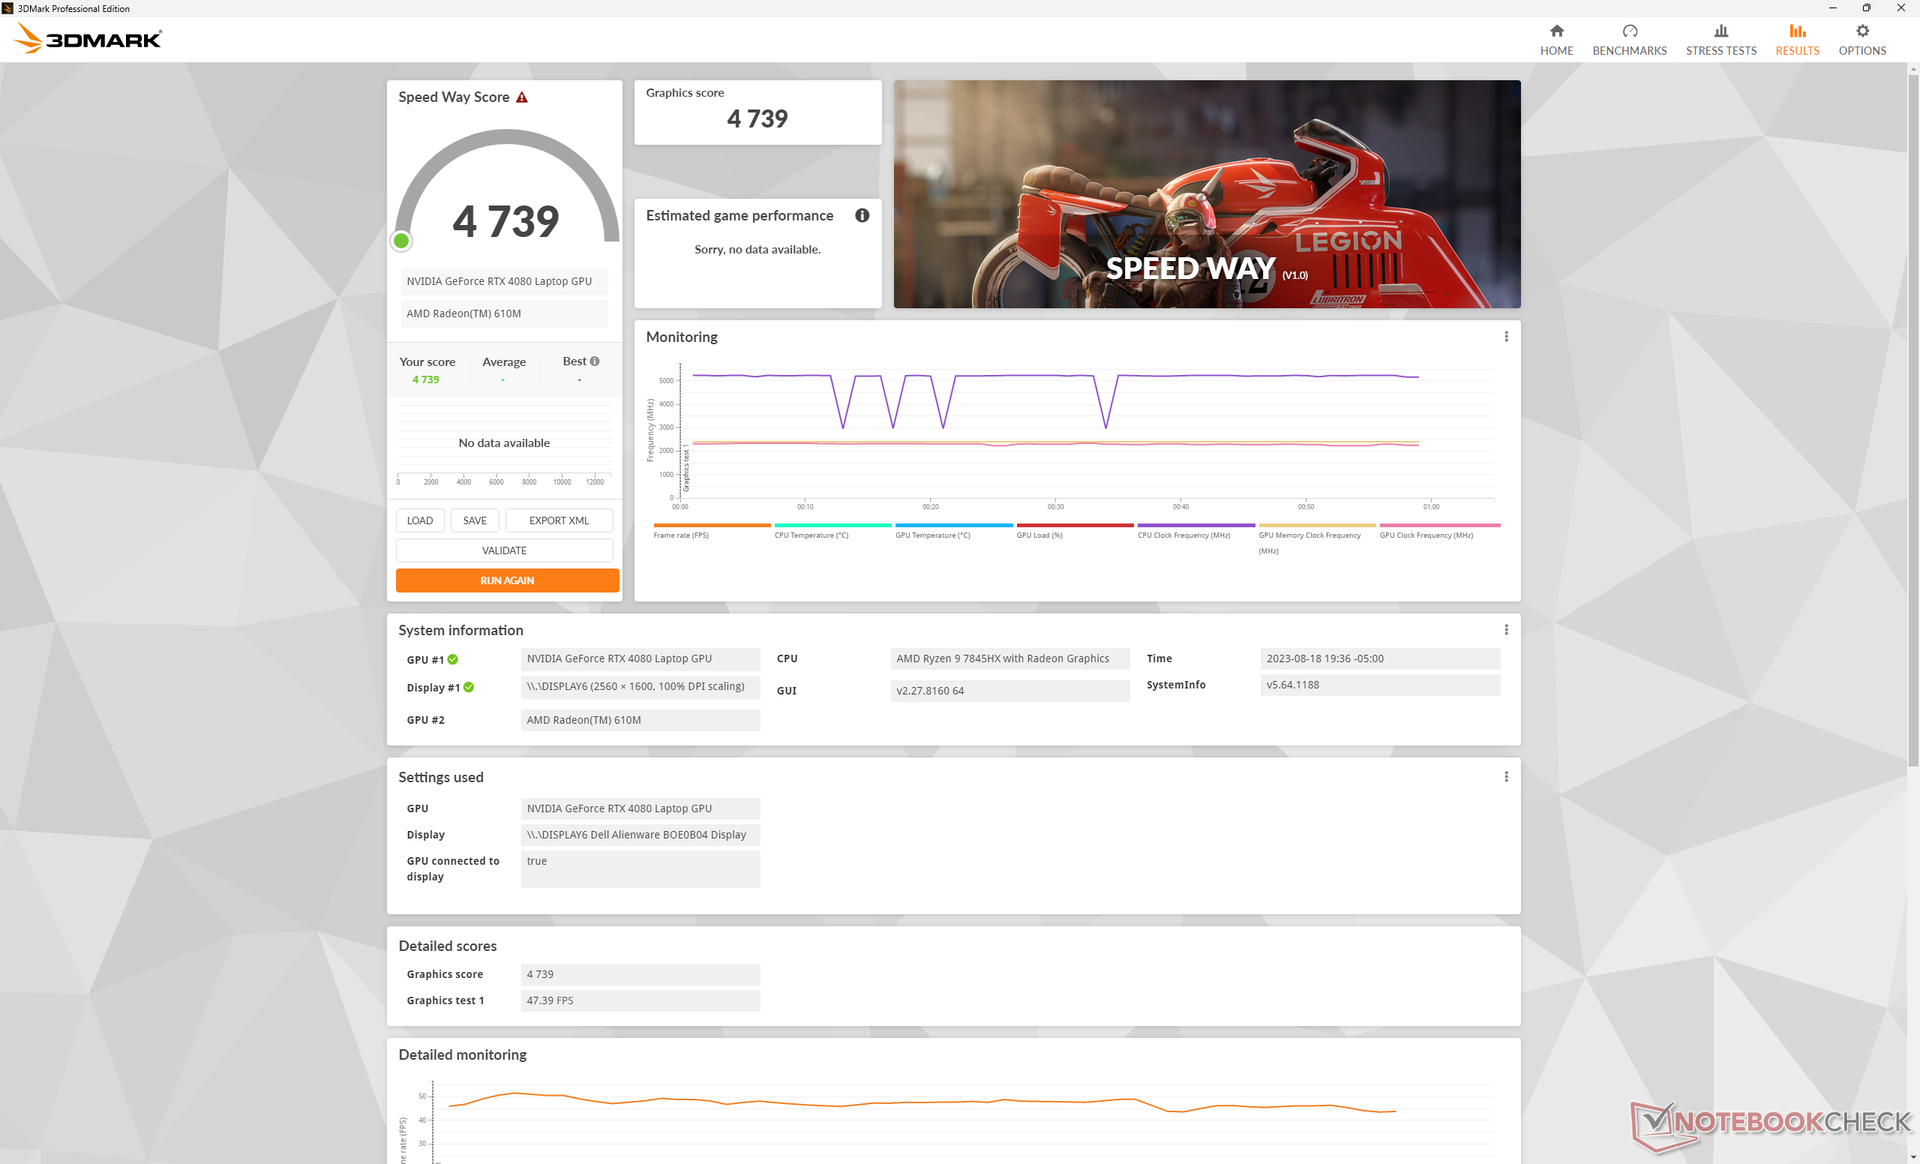
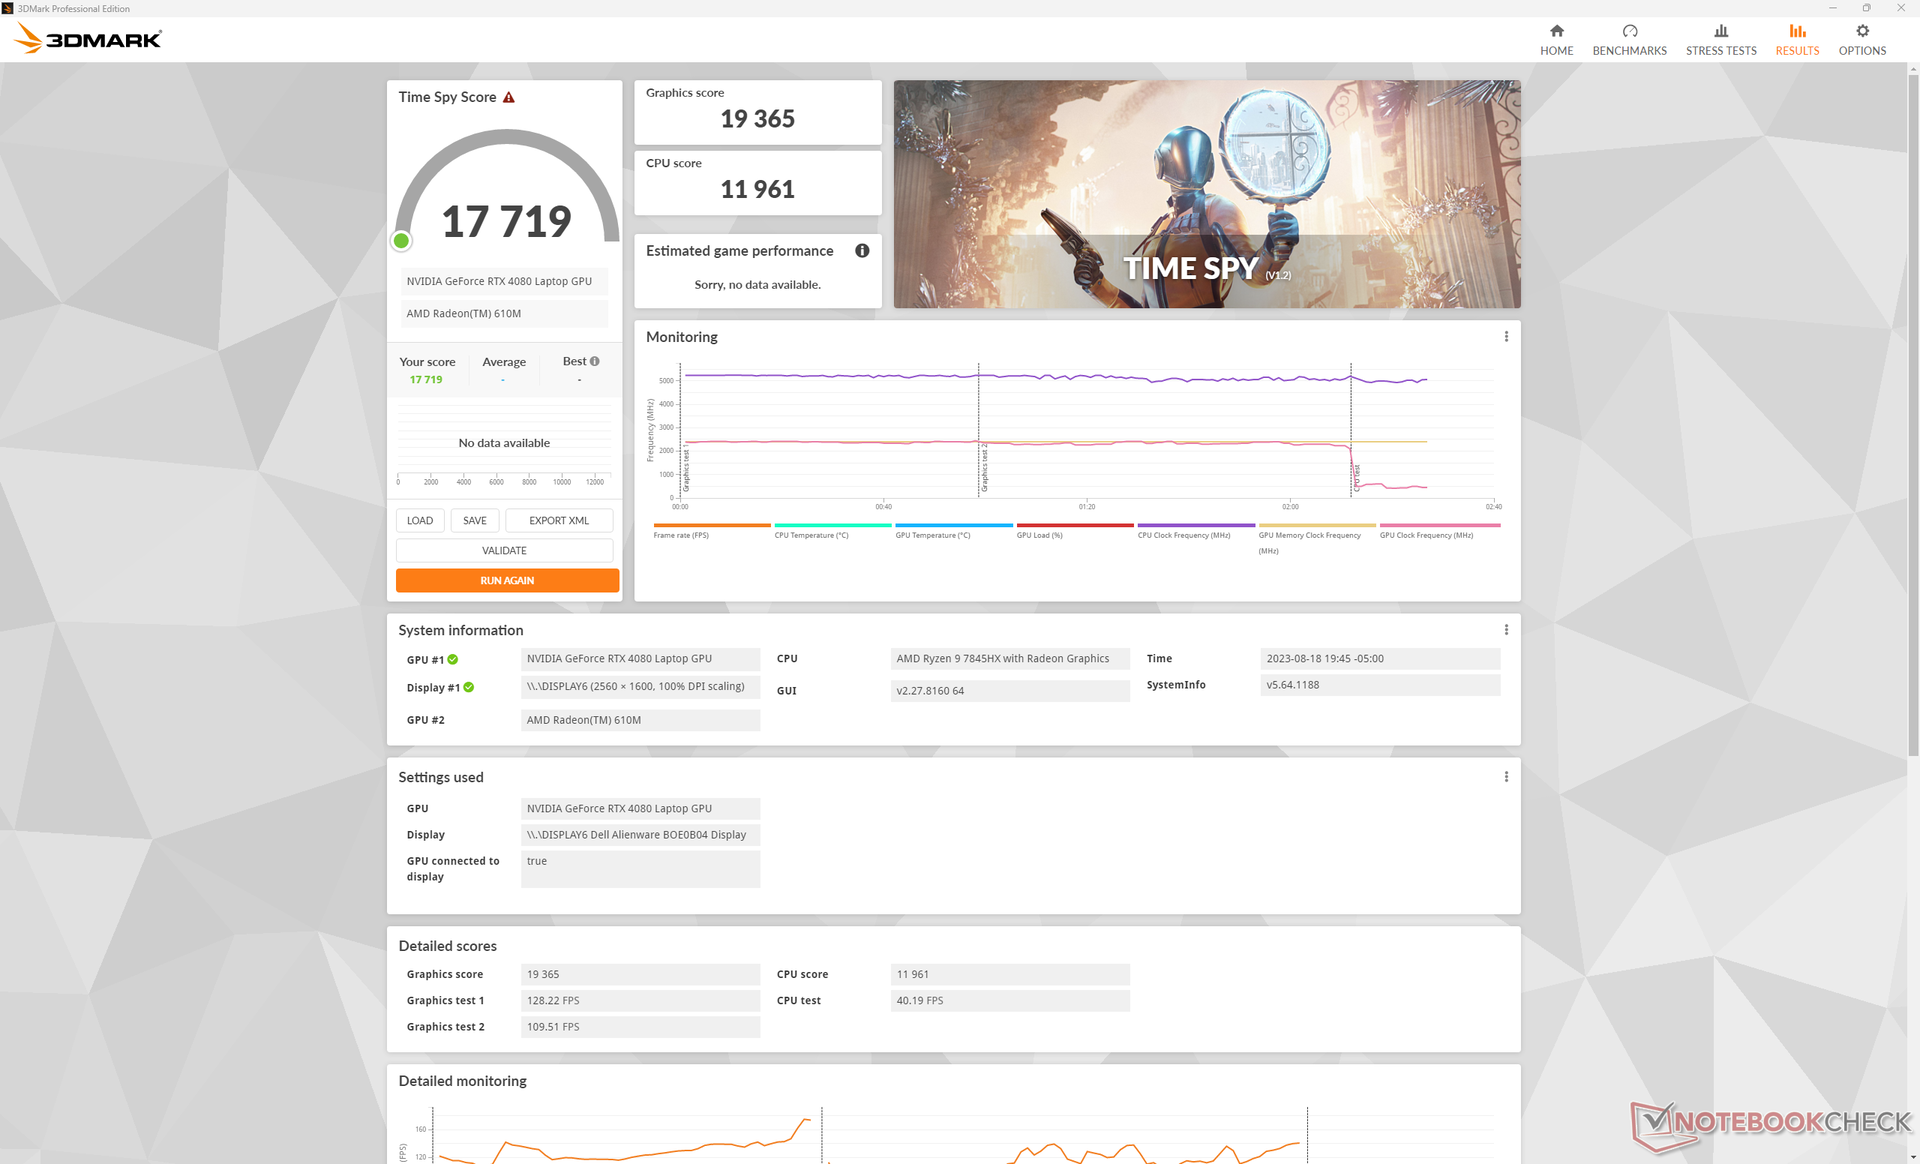
| 3DMark 11 Performance | 40681 poäng | |
| 3DMark Fire Strike Score | 35751 poäng | |
| 3DMark Time Spy Score | 17719 poäng | |
Hjälp | ||
* ... mindre är bättre
Spelprestanda
Prestandan i spel är utmärkt med resultat som är 5 till 10 procent snabbare än andra bärbara datorer med samma RTX 4080 GPU enligt 3DMark. Fördelarna sträcker sig även till lägre grafiska inställningar, vilket kan hjälpa spelare som föredrar att maximera bildfrekvensen framför upplösningen. Den mobila RTX 4080 är tillräckligt kraftfull för att spela alla aktuella titlar i QHD+-upplösning med över 60 FPS, även om den är mycket svagare än en stationär RTX 4080.
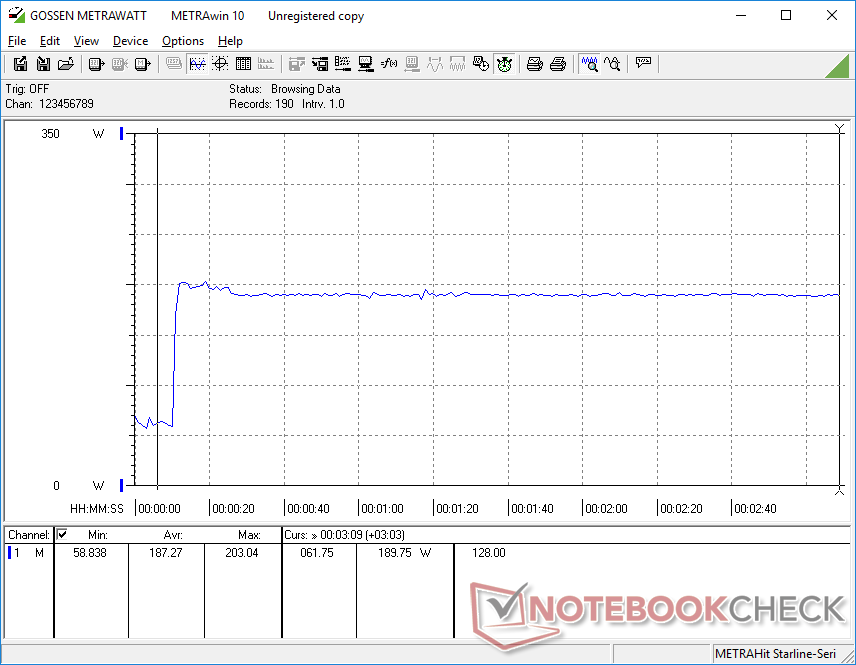
Prestandastabiliteten är tyvärr inte perfekt. På Witcher 3, till exempel, kan bildhastigheten ibland sjunka till 70 FPS innan den studsar tillbaka upp till 150+ FPS, vilket visas i diagrammet nedan. Detta tyder på dålig optimering av bakgrundsresurser som kan störa den applikation som är i fokus.
Witcher 3 FPS Chart
| låg | med. | hög | ultra | QHD | 4K | |
|---|---|---|---|---|---|---|
| The Witcher 3 (2015) | 573.1 | 452.2 | 349.3 | 169.7 | 121.5 | |
| Dota 2 Reborn (2015) | 229 | 191.8 | 180.4 | 164.7 | 161 | |
| Final Fantasy XV Benchmark (2018) | 230 | 218 | 167.6 | 131.6 | 76.1 | |
| X-Plane 11.11 (2018) | 171.1 | 149 | 113.1 | 95 | ||
| Far Cry 5 (2018) | 160 | 145 | 141 | 136 | 131 | 91 |
| Strange Brigade (2018) | 572 | 461 | 400 | 357 | 248 | 123.1 |
| Cyberpunk 2077 1.6 (2022) | 154 | 151.4 | 137.5 | 128.3 | 84.5 | 39.7 |
| Tiny Tina's Wonderlands (2022) | 317.1 | 265.9 | 201.1 | 160.8 | 112.9 | 59 |
| F1 22 (2022) | 323 | 296 | 285 | 124.2 | 78.1 | 39.5 |
| Returnal (2023) | 128 | 122 | 117 | 107 | 80 | 44 |
Utsläpp
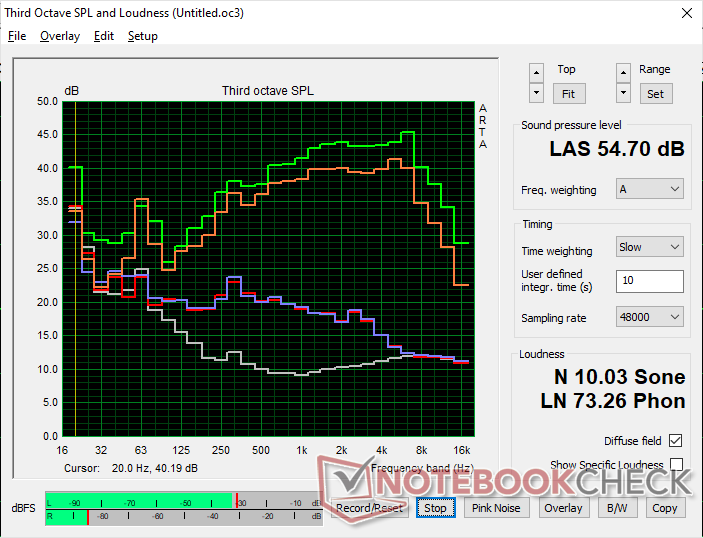
Systemljud - Stora skillnader mellan olika effektprofiler
Fläktarna är nästan alltid aktiva med en ljudnivå på strax under 30 dB(A) mot en tyst bakgrund på 23 dB(A). Även om ljudet är hörbart är det åtminstone stabilt eftersom fläktarna inte pulserar högre när man kör enkla belastningar som webbläsare eller video.
Fläktljudet när du spelar i lägena Balanced, Performance eller Overdrive kan vara så högt som 49,4 dB(A), 51 dB(A) respektive 54,7 dB(A). Eftersom prestandaförlusten i läget Balanced är så minimal som nämnts ovan, kan användare överväga att spela i läget Balanced istället för Performance eller Overdrive för det märkbart tystare fläktljudet. Andra 16-tums bärbara speldatorer som Razer Blade 16 eller Omen Transcend 16 tenderar att stabiliseras i det mer högljudda 50 dB(A)-området när spel körs.
Ljudnivå
| Låg belastning |
| 22.9 / 29.7 / 29.7 dB(A) |
| Hög belastning |
| 29.8 / 54.7 dB(A) |
 | ||
30 dB tyst 40 dB(A) hörbar 50 dB(A) högt ljud |
||
min: | ||
| Alienware m16 R1 AMD GeForce RTX 4080 Laptop GPU, R9 7845HX, Kioxia XG8 KXG80ZNV1T02 | Alienware x16 R1 GeForce RTX 4080 Laptop GPU, i9-13900HK, SK hynix PC801 HFS001TEJ9X101N | HP Omen Transcend 16 GeForce RTX 4070 Laptop GPU, i9-13900HX, SK hynix PC801 HFS002TEJ9X101N | Lenovo Legion Pro 7 RTX4090 GeForce RTX 4090 Laptop GPU, i9-13900HX, Samsung PM9A1 MZVL21T0HCLR | Asus ROG Strix G16 G614JZ GeForce RTX 4080 Laptop GPU, i9-13980HX, WD PC SN560 SDDPNQE-1T00 | Razer Blade 16 Early 2023 GeForce RTX 4080 Laptop GPU, i9-13950HX, SSSTC CA6-8D1024 | |
|---|---|---|---|---|---|---|
| Noise | 0% | -11% | -17% | -9% | 4% | |
| av / miljö * (dB) | 22.9 | 22.7 1% | 22.9 -0% | 25 -9% | 25 -9% | 23 -0% |
| Idle Minimum * (dB) | 22.9 | 23.1 -1% | 29.1 -27% | 28 -22% | 26 -14% | 23 -0% |
| Idle Average * (dB) | 29.7 | 25.8 13% | 29.1 2% | 30 -1% | 28 6% | 23 23% |
| Idle Maximum * (dB) | 29.7 | 25.8 13% | 29.1 2% | 38 -28% | 30 -1% | 23.6 21% |
| Load Average * (dB) | 29.8 | 39.3 -32% | 45.7 -53% | 48 -61% | 48 -61% | 39 -31% |
| Witcher 3 ultra * (dB) | 54.7 | 49.9 9% | 54.3 1% | 53 3% | 49 10% | 51.6 6% |
| Load Maximum * (dB) | 54.7 | 54.8 -0% | 54.3 1% | 55 -1% | 52 5% | 51.3 6% |
* ... mindre är bättre
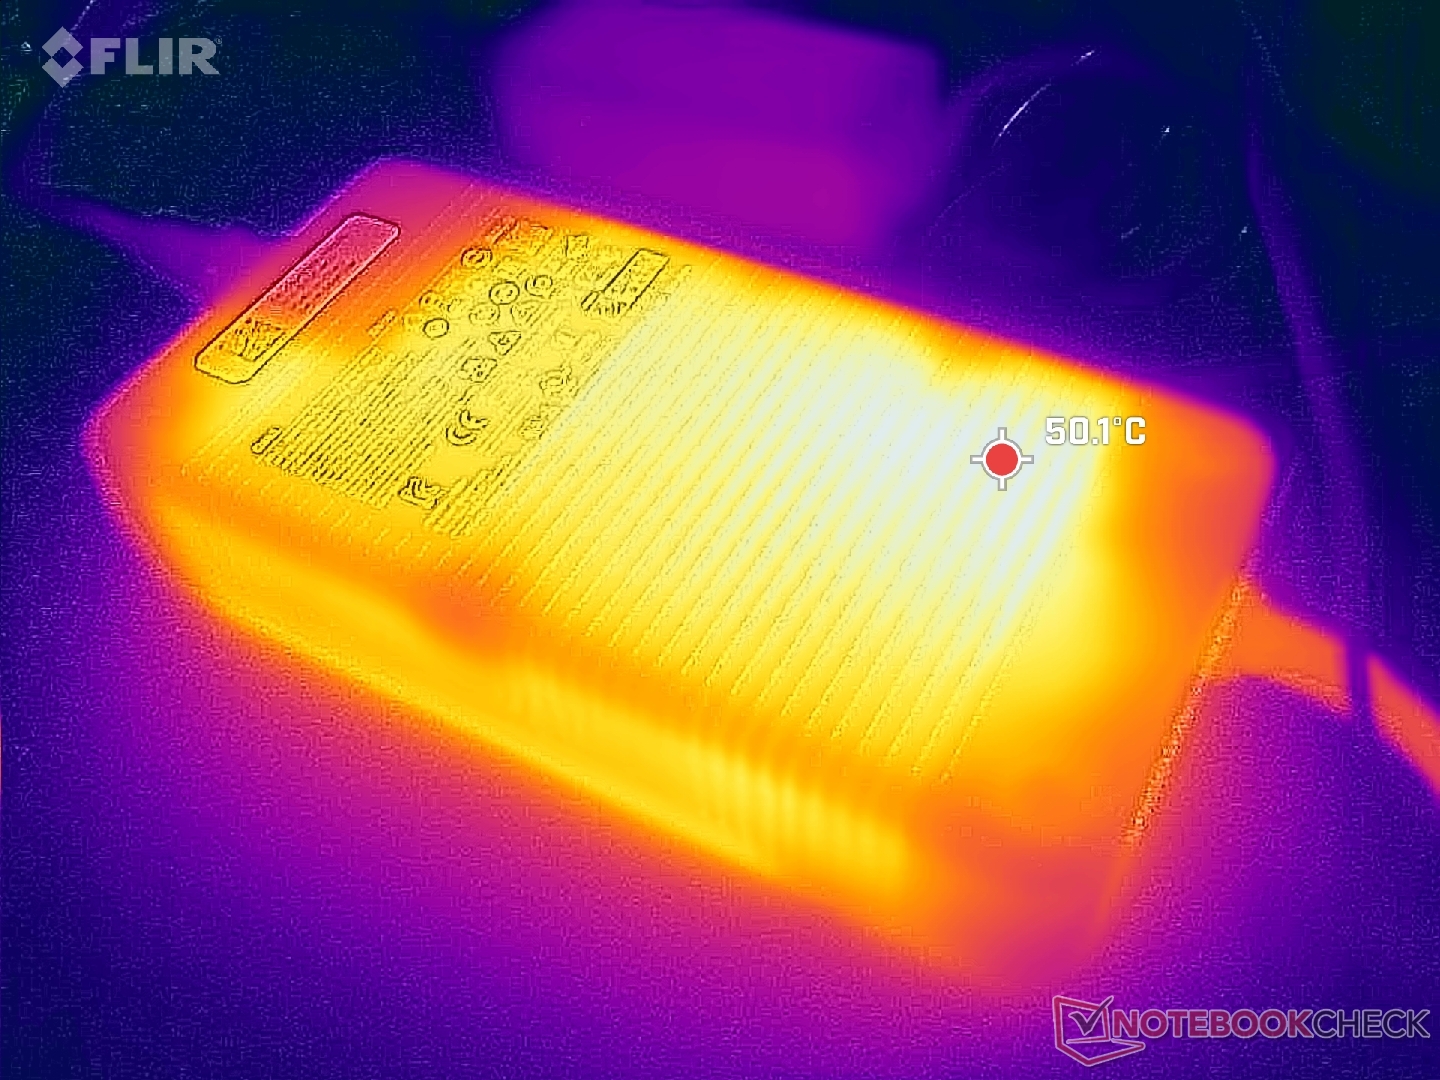
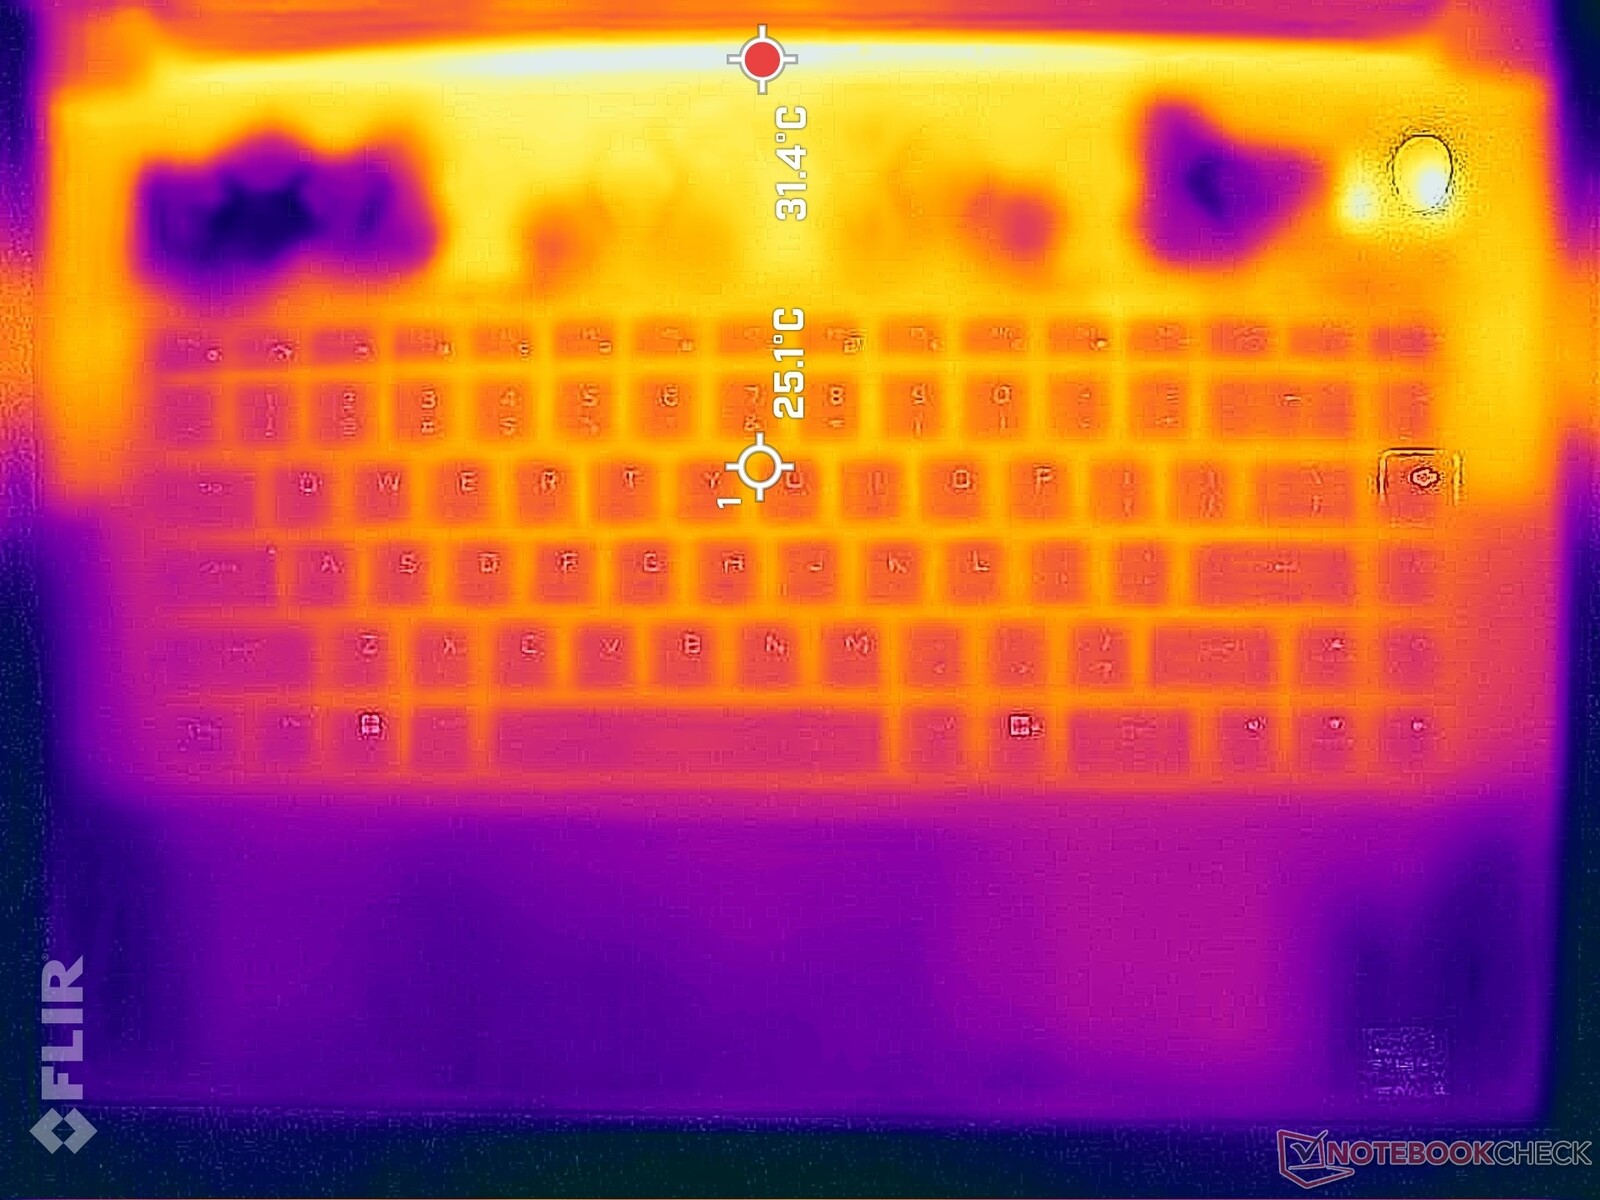
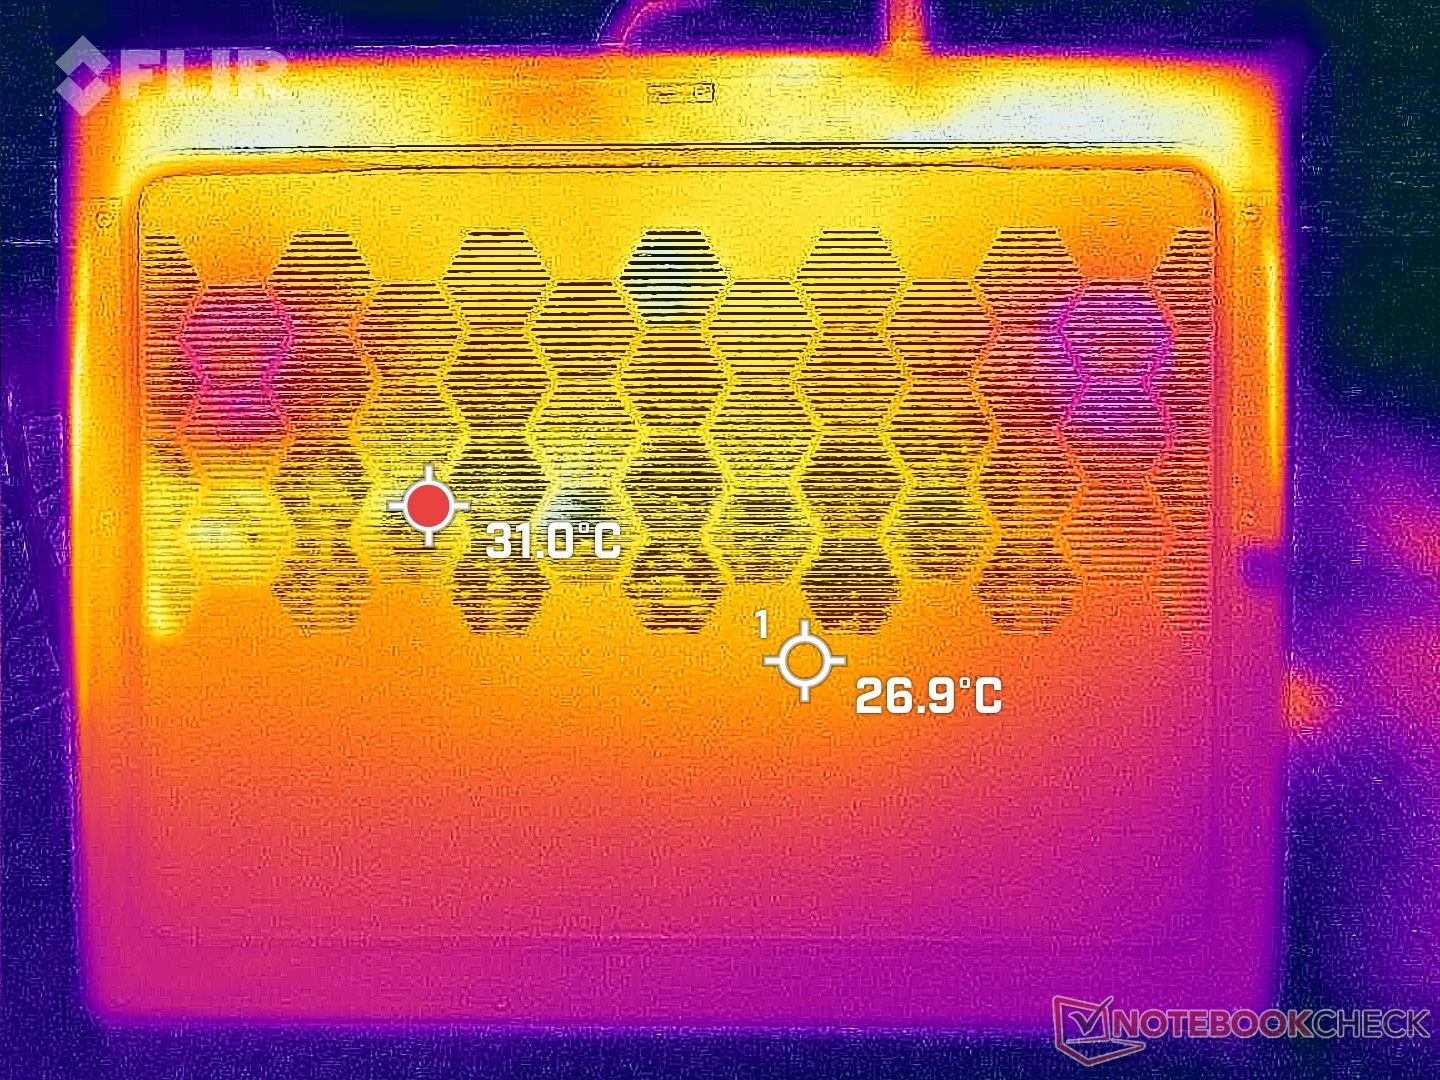
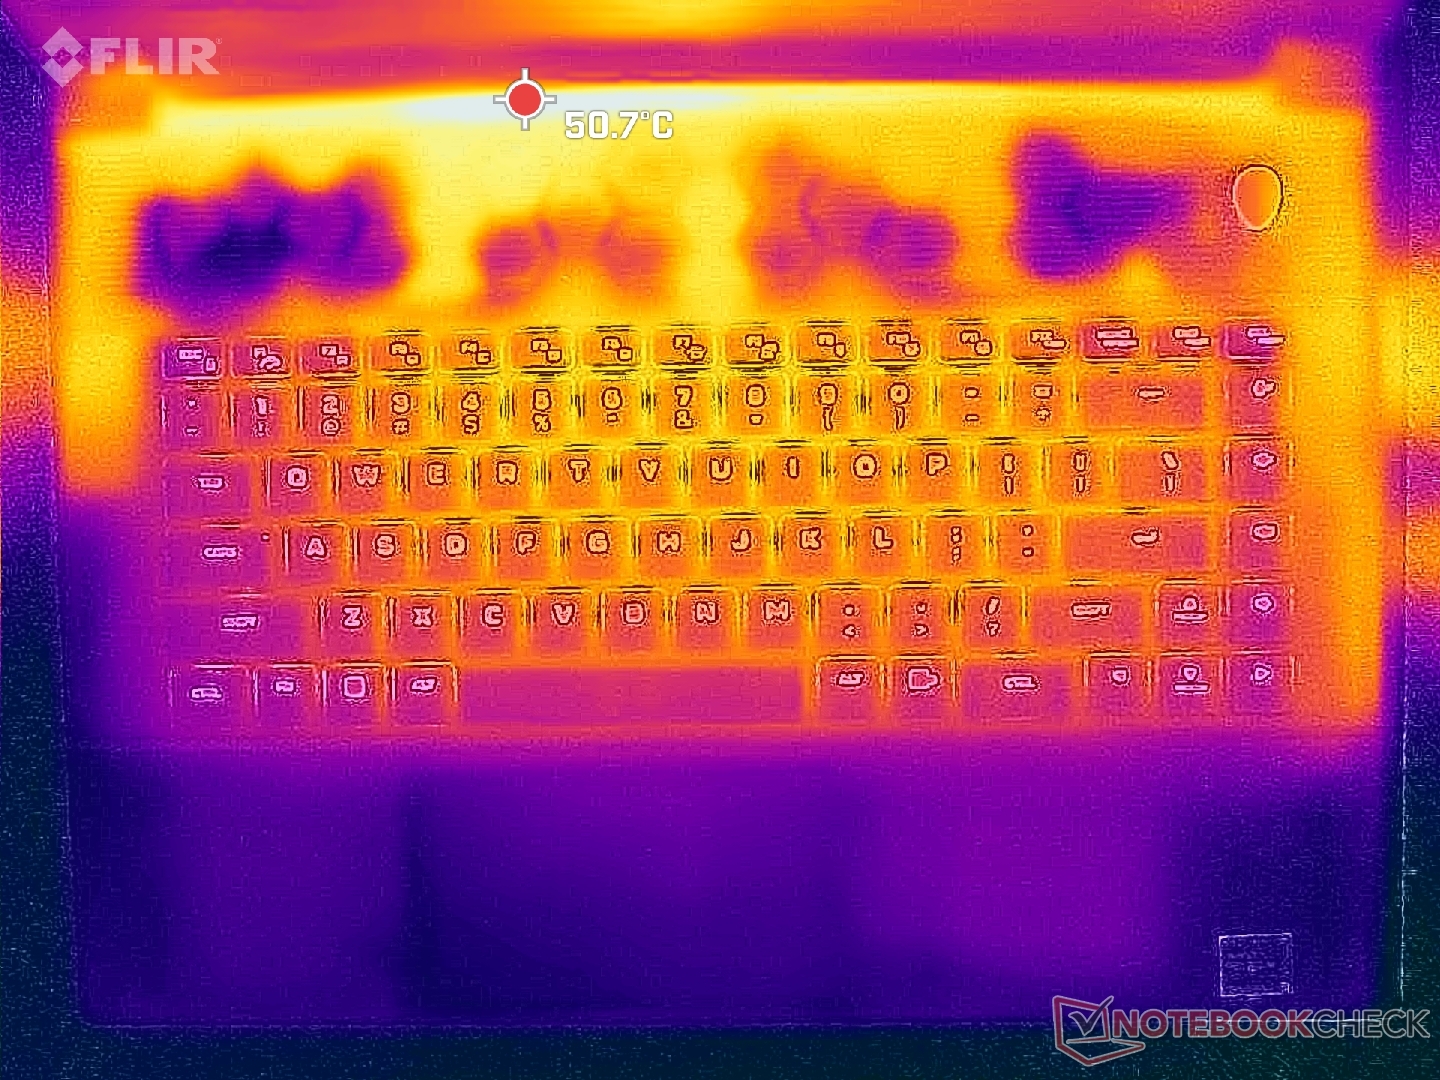
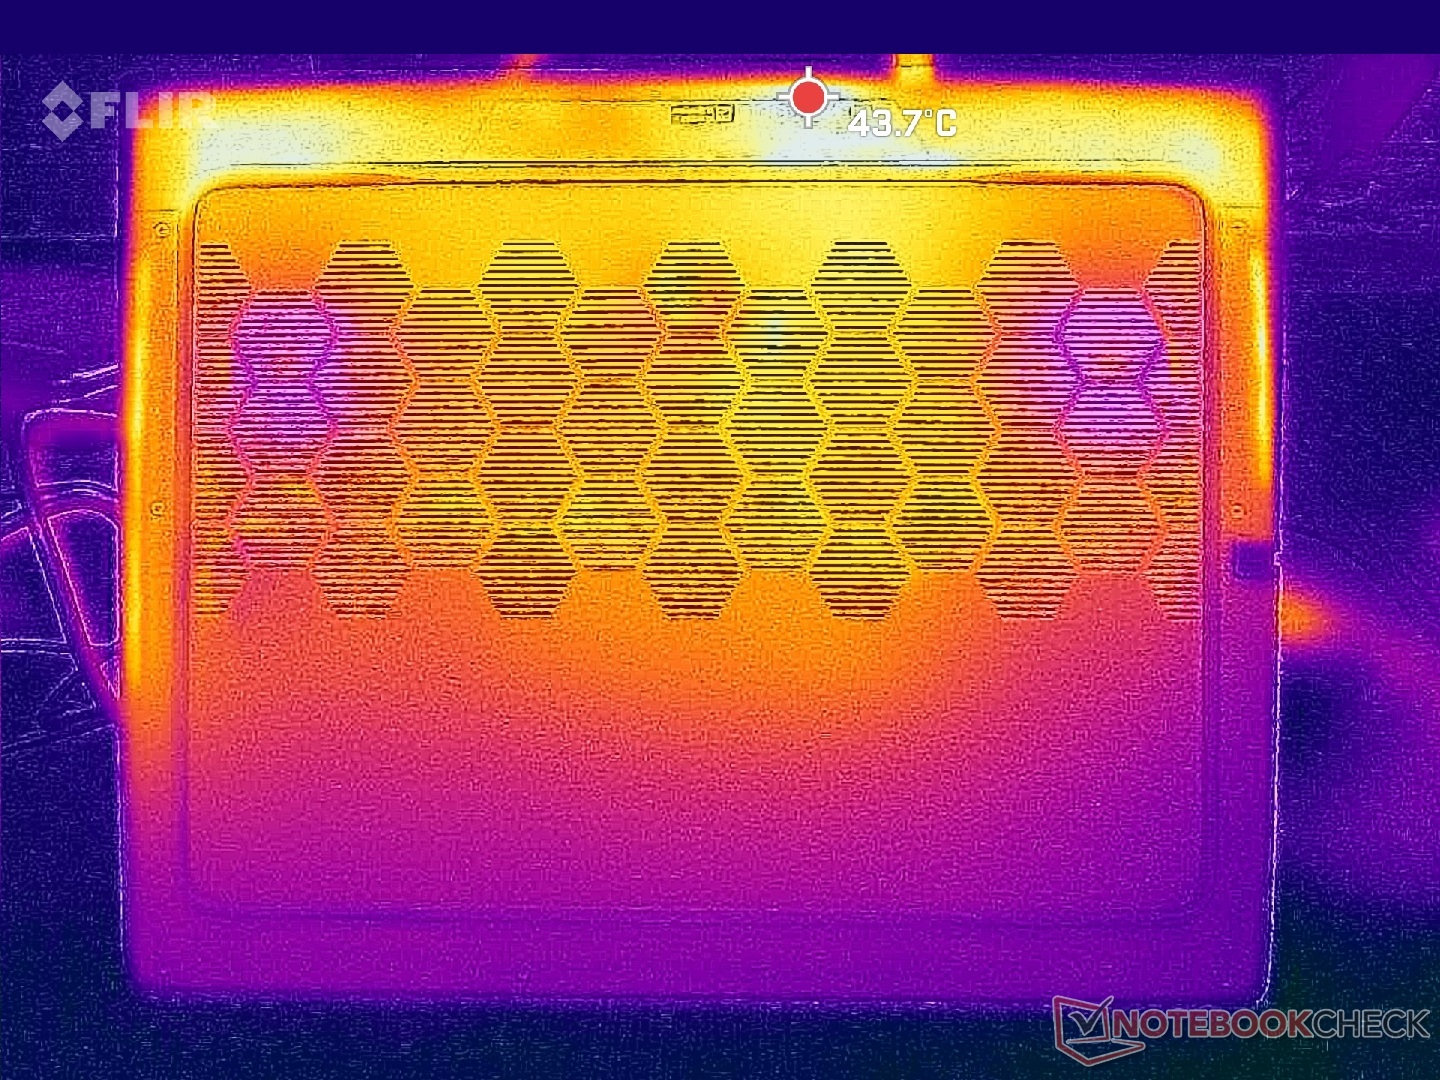
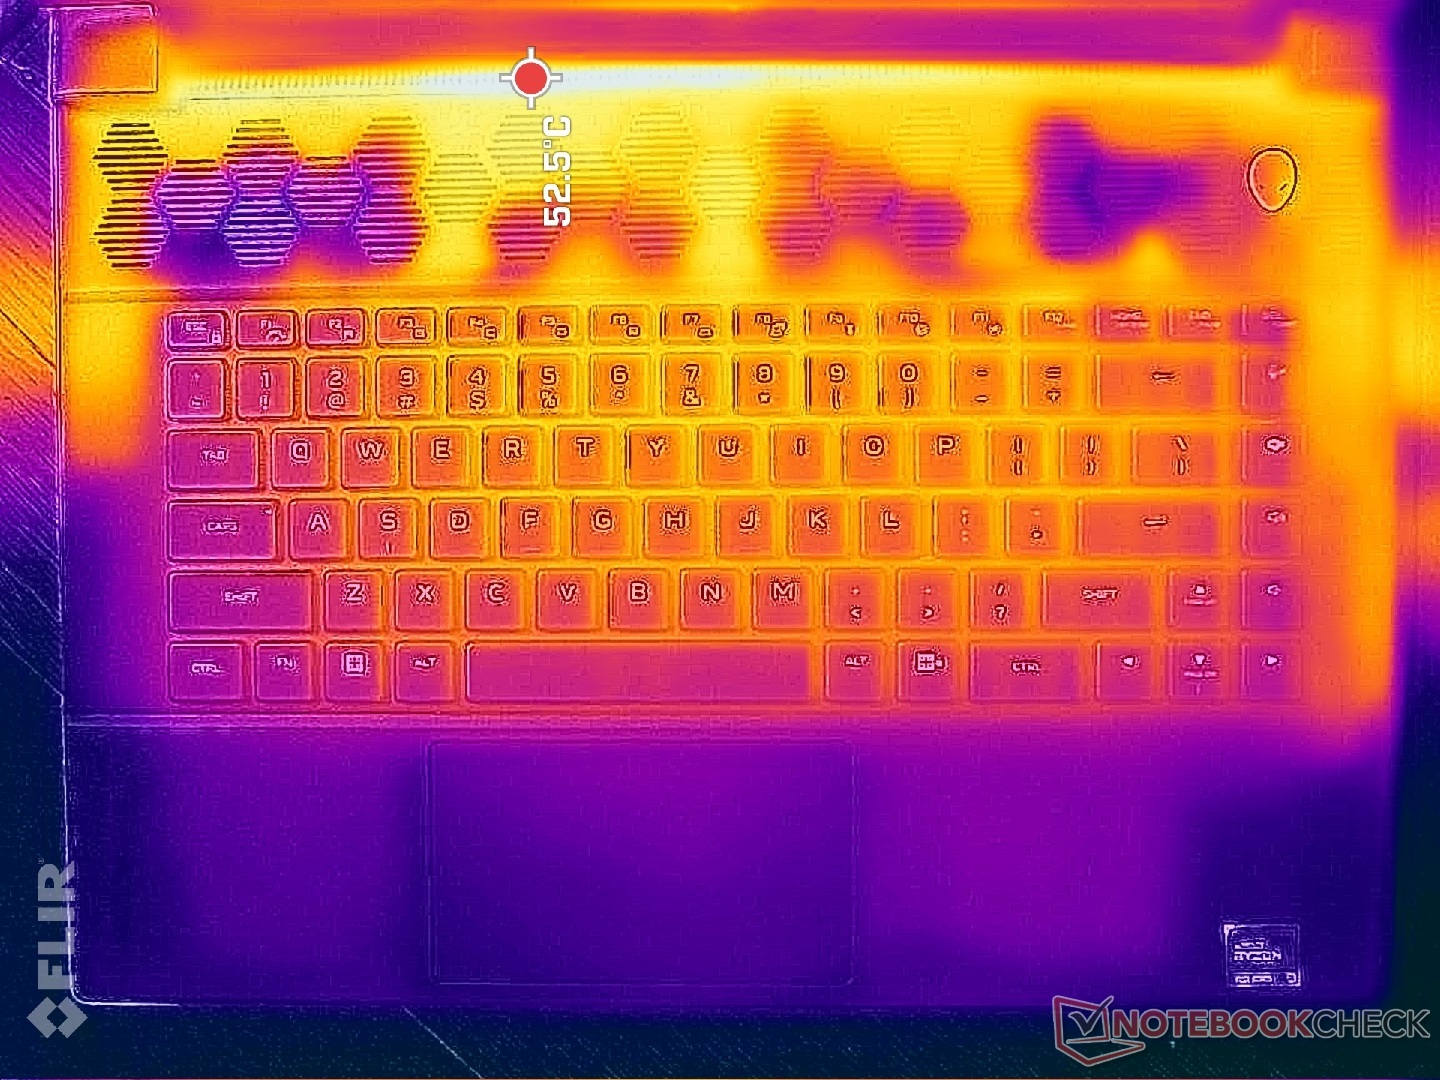
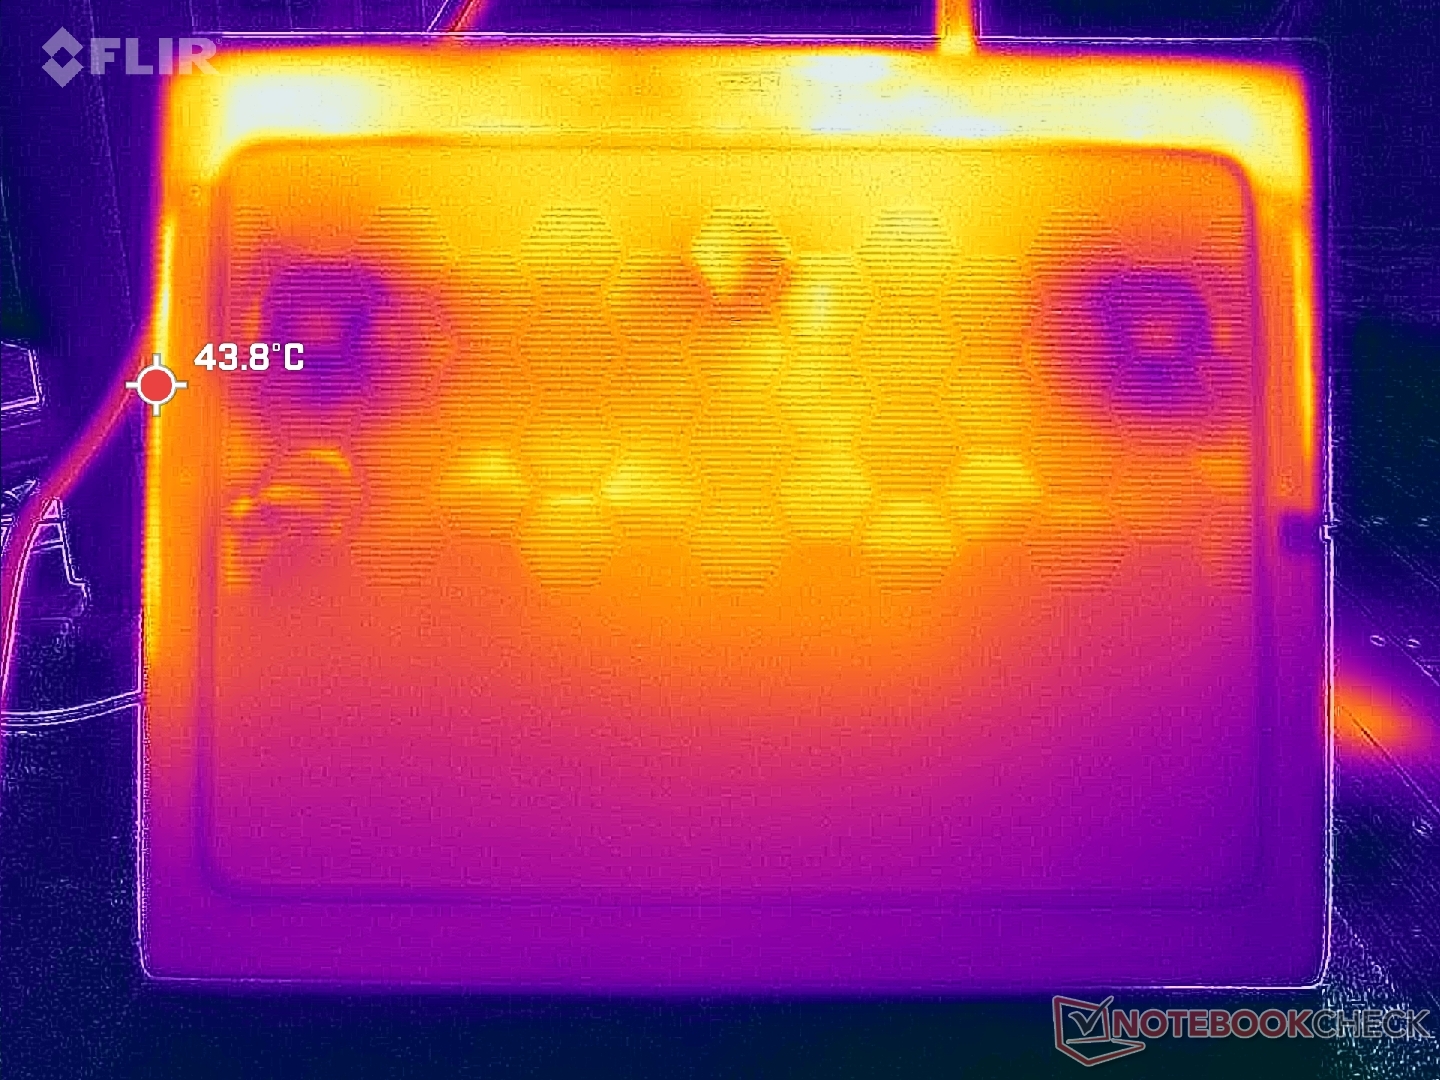
Temperatur
Yttemperaturerna kan vara mycket varma, upp till 50 C längs baksidan. Tack och lov är handflatestöden och tangentbordsregionerna svalare vid beröring för bättre komfort, delvis på grund av de expansiva ventilationsgallren. Tangentbordets mitt når till exempel 42 C vid spel jämfört med 46 C på Lenovo Legion Pro 7 16.
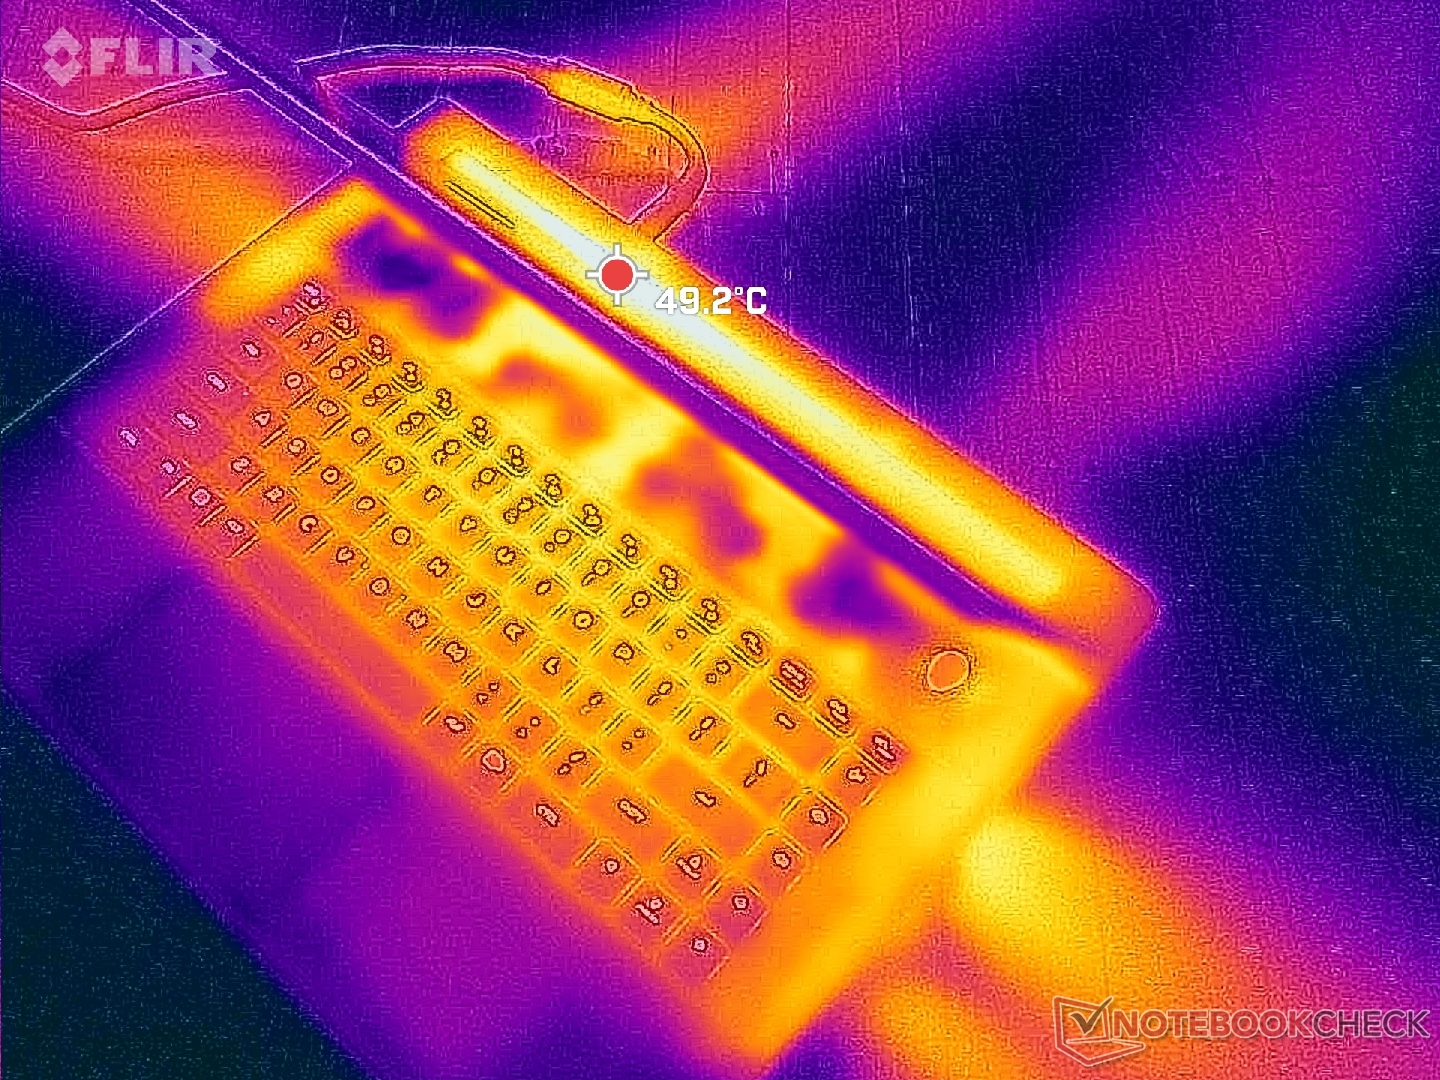
(-) Den maximala temperaturen på ovansidan är 48 °C / 118 F, jämfört med genomsnittet av 40.4 °C / 105 F , allt från 21.2 till 68.8 °C för klassen Gaming.
(+) Botten värms upp till maximalt 39 °C / 102 F, jämfört med genomsnittet av 43.2 °C / 110 F
(±) Vid tomgångsbruk är medeltemperaturen för ovansidan 32.2 °C / 90 F, jämfört med enhetsgenomsnittet på 33.9 °C / ### class_avg_f### F.
(-) När du spelar The Witcher 3 är medeltemperaturen för ovansidan 38.1 °C / 101 F, jämfört med enhetsgenomsnittet på 33.9 °C / ## #class_avg_f### F.
(+) Handledsstöden och pekplattan är kallare än hudtemperaturen med maximalt 30.4 °C / 86.7 F och är därför svala att ta på.
(±) Medeltemperaturen för handledsstödsområdet på liknande enheter var 28.8 °C / 83.8 F (-1.6 °C / -2.9 F).
| Alienware m16 R1 AMD AMD Ryzen 9 7845HX, NVIDIA GeForce RTX 4080 Laptop GPU | Alienware x16 R1 Intel Core i9-13900HK, NVIDIA GeForce RTX 4080 Laptop GPU | HP Omen Transcend 16 Intel Core i9-13900HX, NVIDIA GeForce RTX 4070 Laptop GPU | Lenovo Legion Pro 7 RTX4090 Intel Core i9-13900HX, NVIDIA GeForce RTX 4090 Laptop GPU | Asus ROG Strix G16 G614JZ Intel Core i9-13980HX, NVIDIA GeForce RTX 4080 Laptop GPU | Razer Blade 16 Early 2023 Intel Core i9-13950HX, NVIDIA GeForce RTX 4080 Laptop GPU | |
|---|---|---|---|---|---|---|
| Heat | -5% | 1% | -10% | -6% | 12% | |
| Maximum Upper Side * (°C) | 48 | 47.2 2% | 47.4 1% | 53 -10% | 54 -13% | 40 17% |
| Maximum Bottom * (°C) | 39 | 47.8 -23% | 54.4 -39% | 59 -51% | 55 -41% | 37.6 4% |
| Idle Upper Side * (°C) | 37 | 36.8 1% | 28.4 23% | 34 8% | 29 22% | 32.4 12% |
| Idle Bottom * (°C) | 36.2 | 35.8 1% | 29.2 19% | 32 12% | 33 9% | 31.4 13% |
* ... mindre är bättre
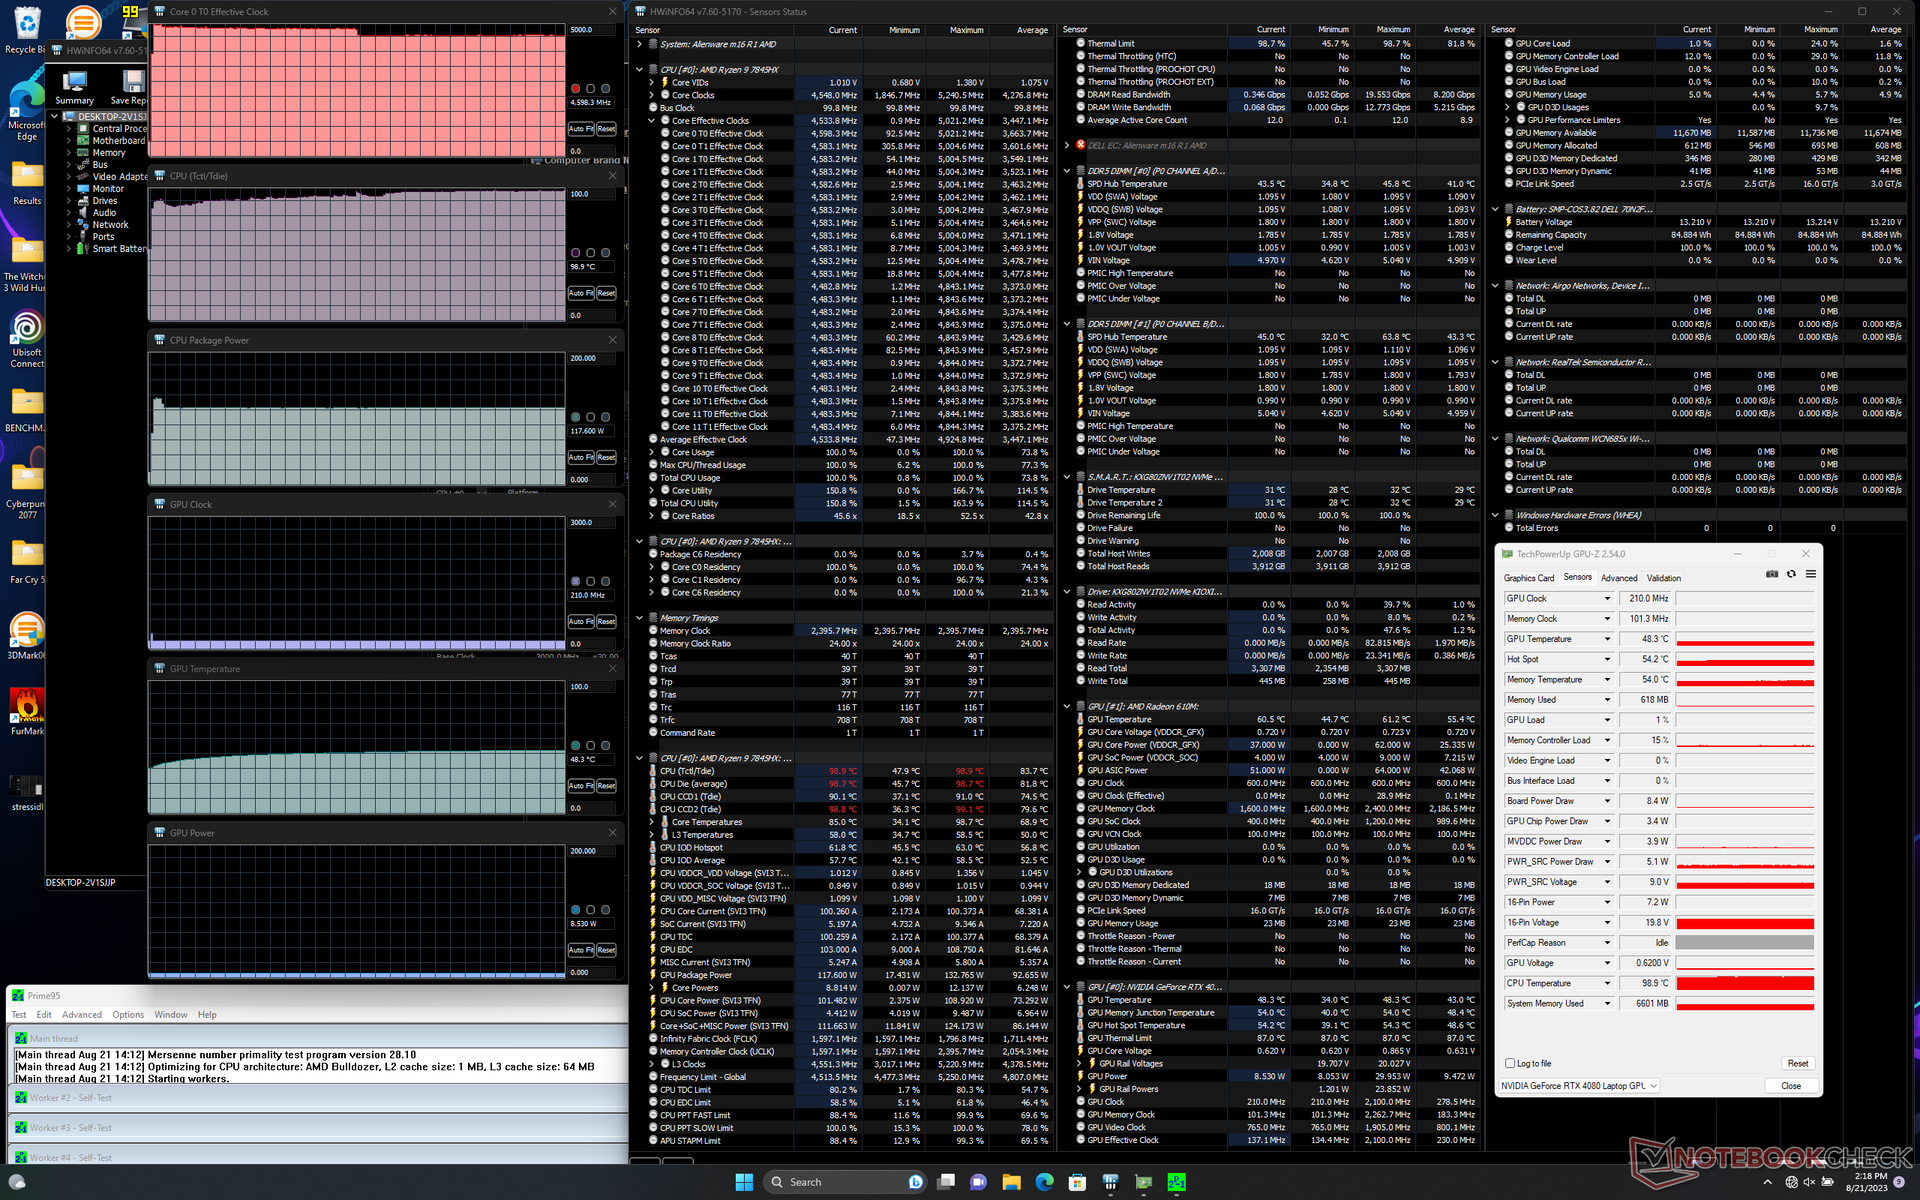
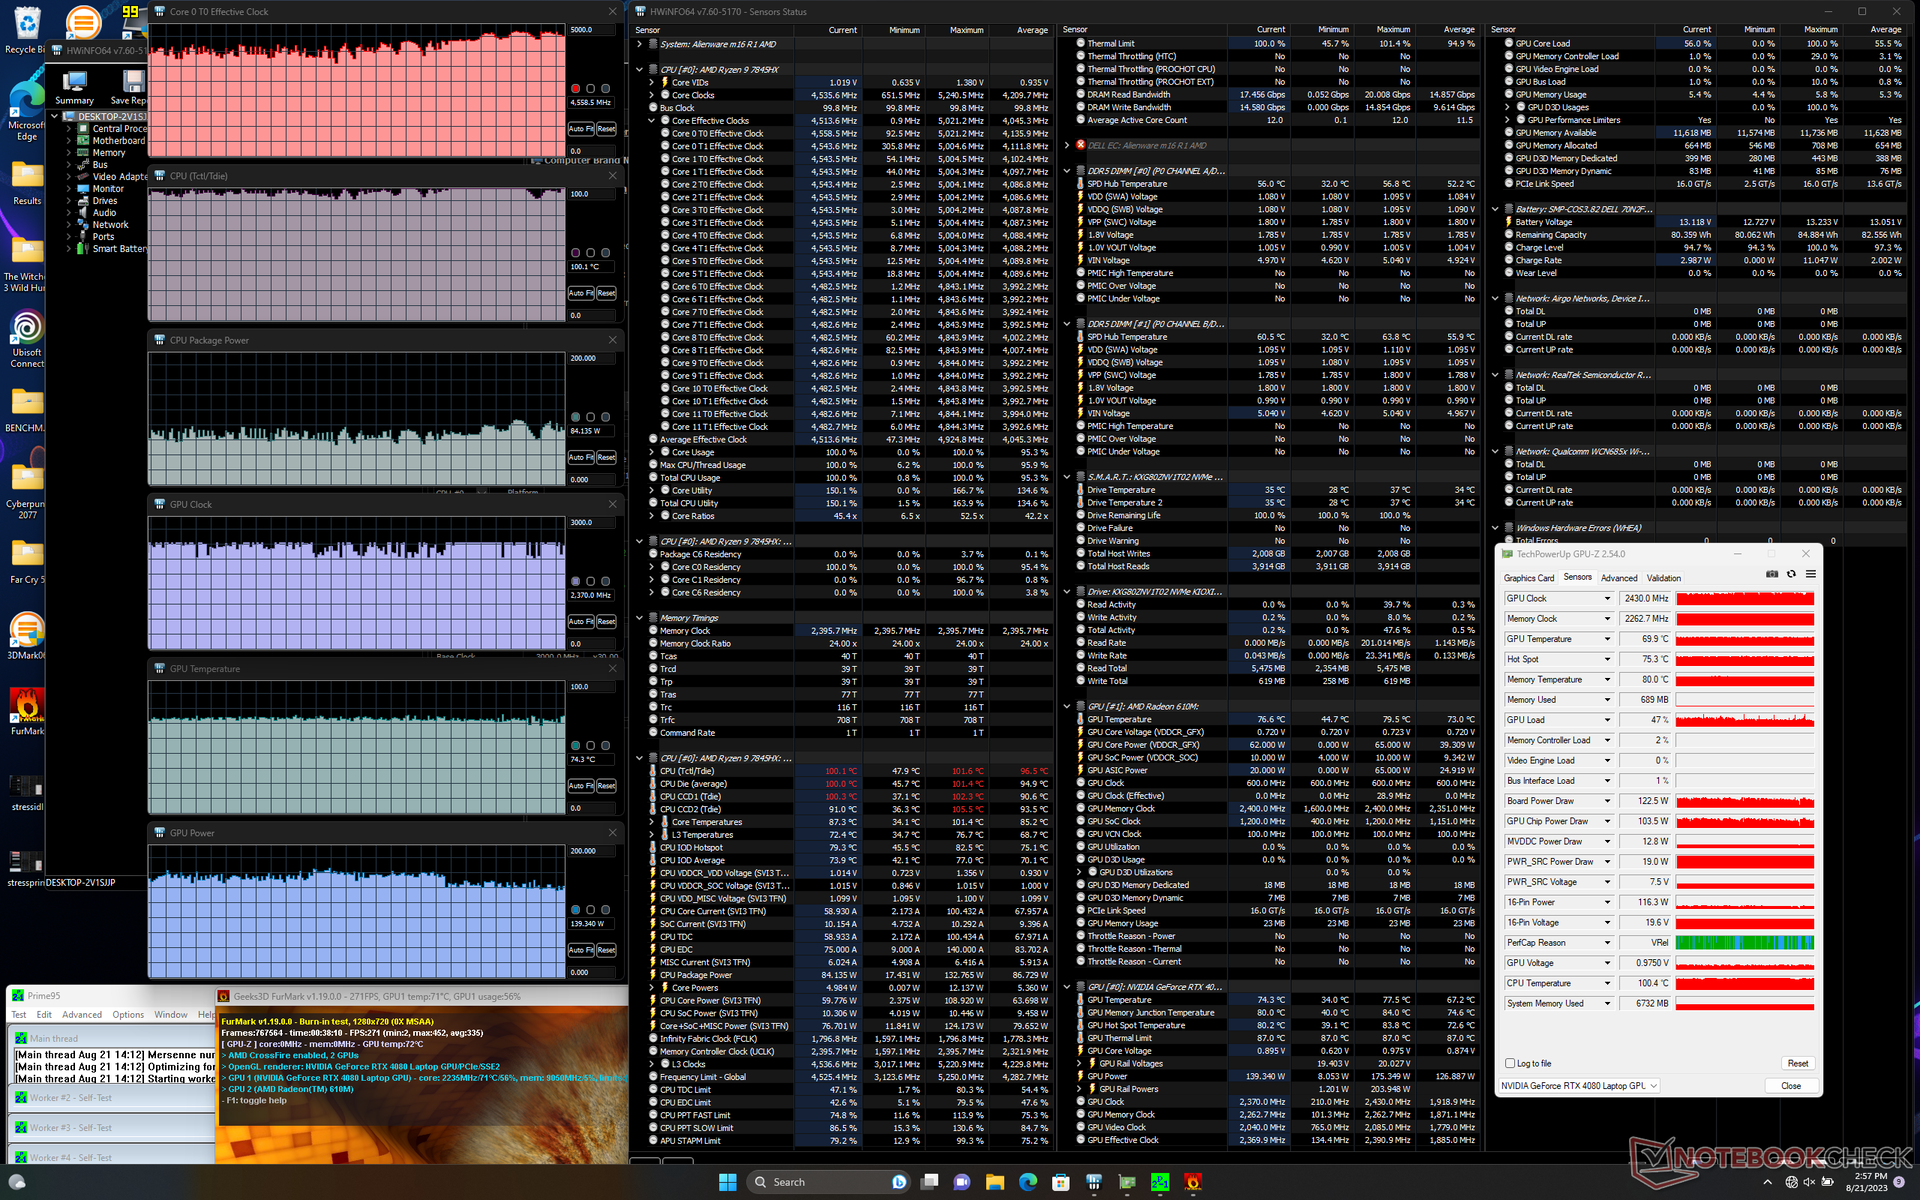
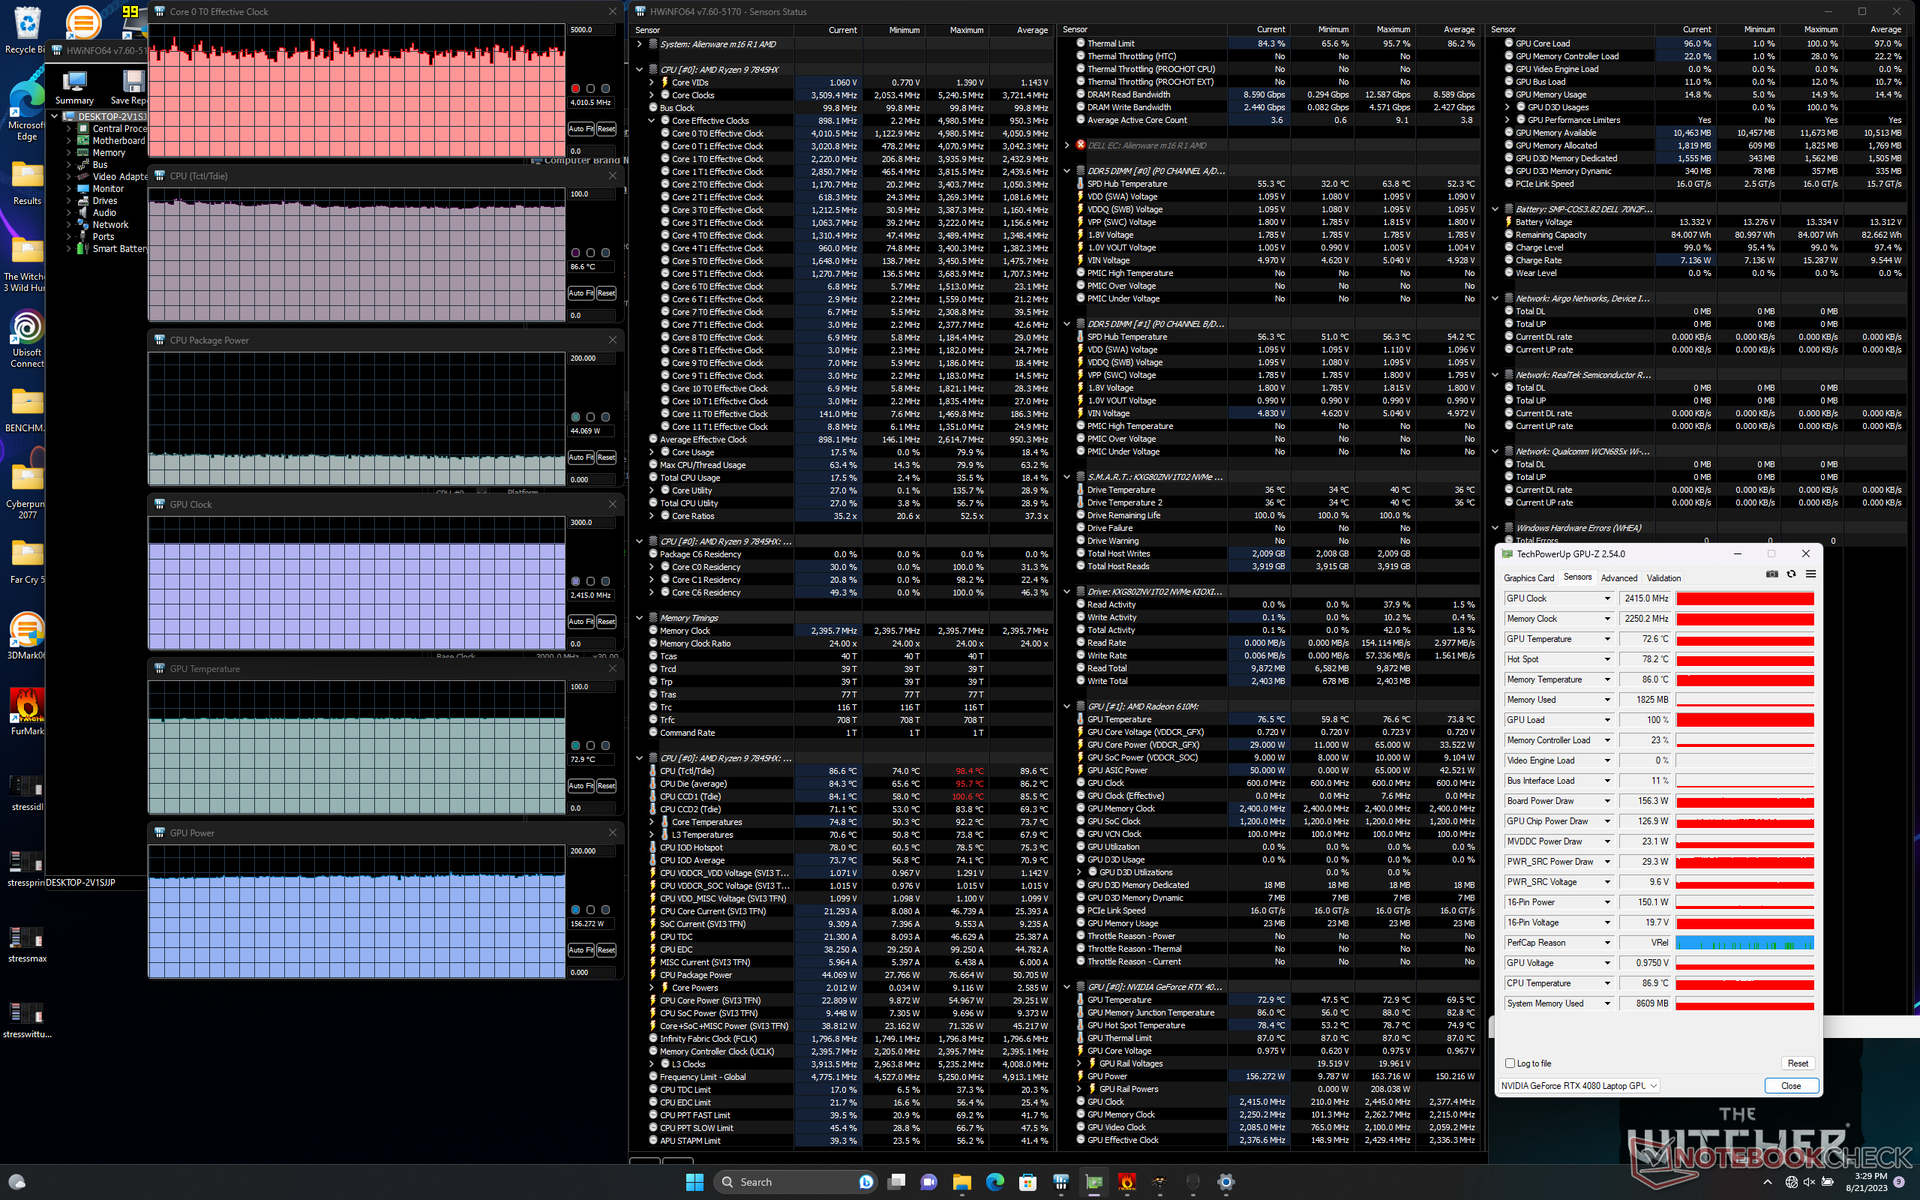
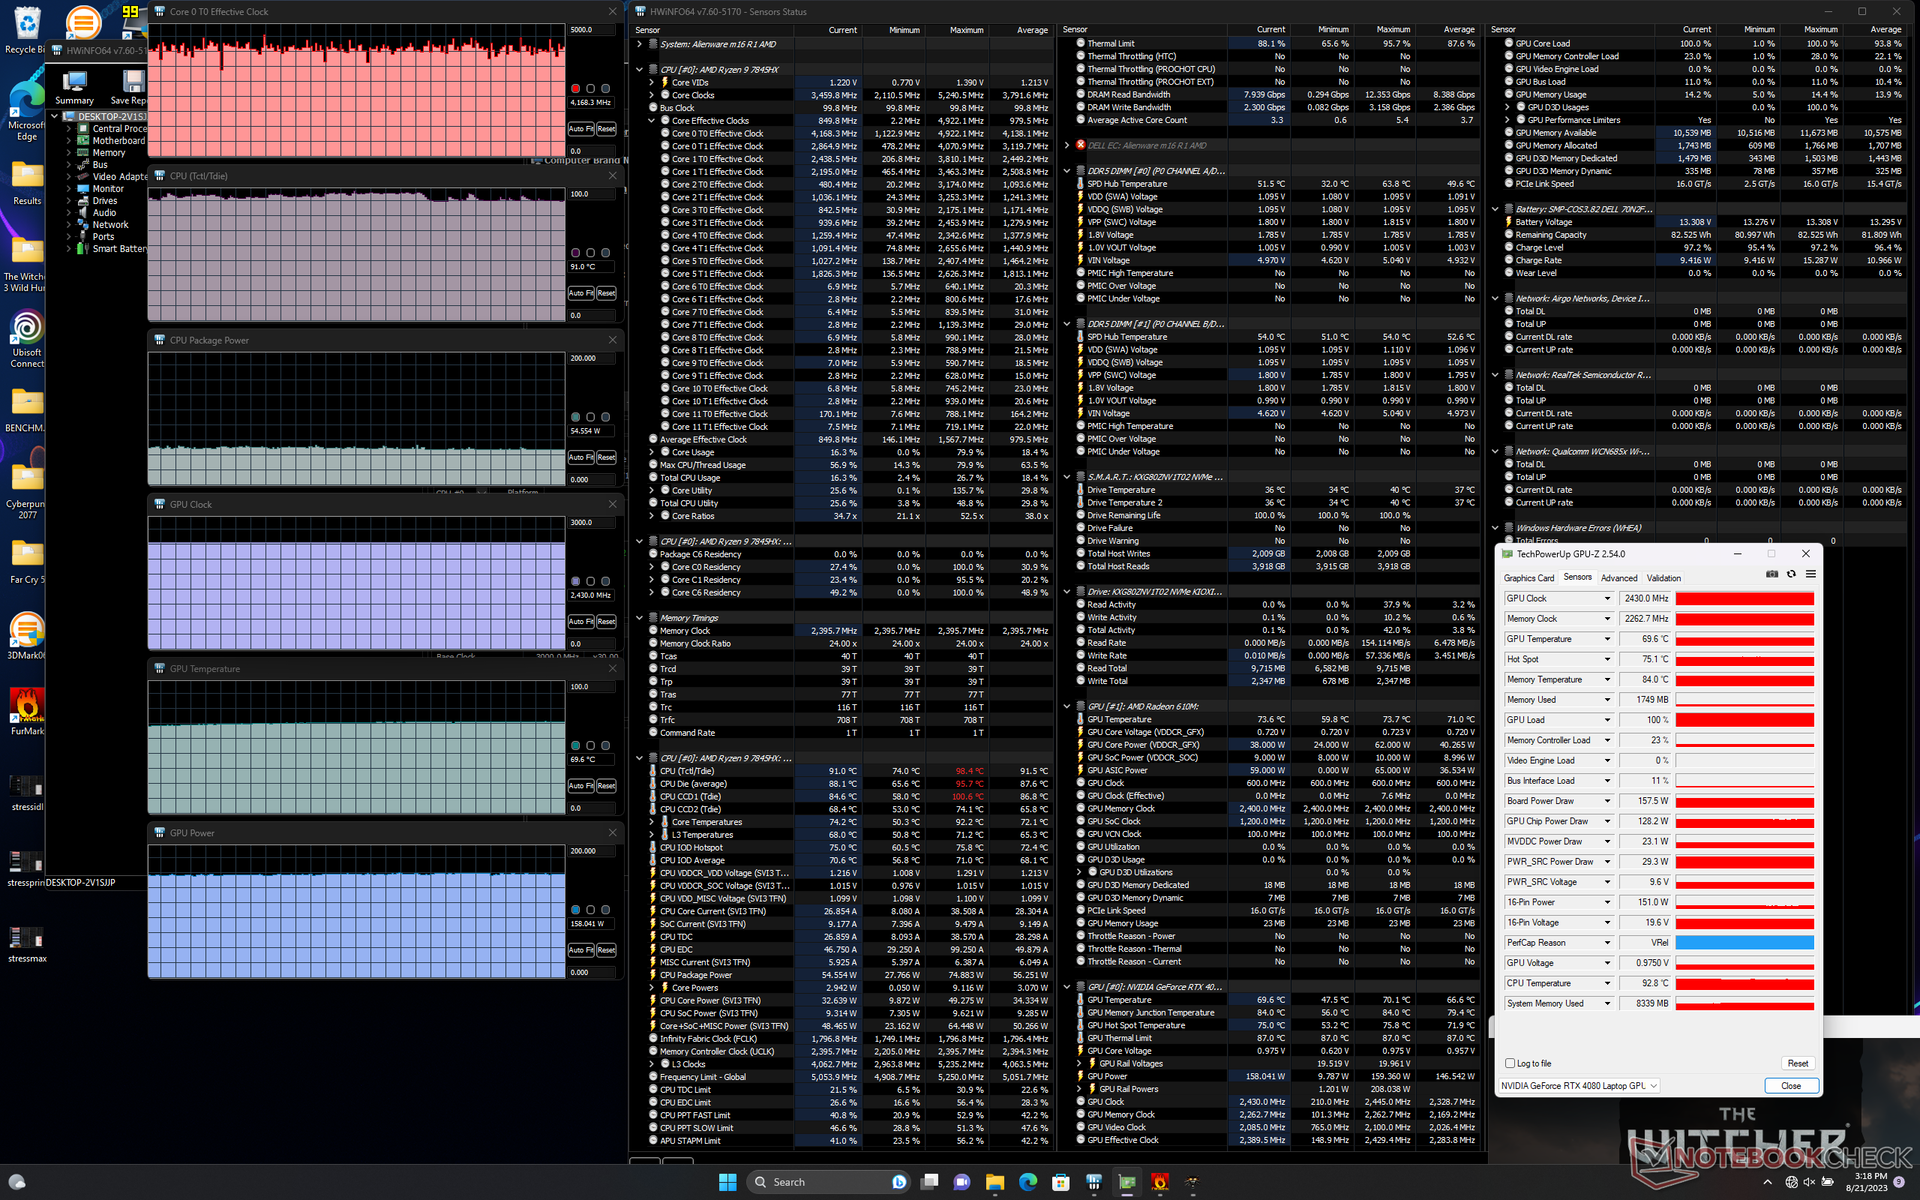
Stresstest
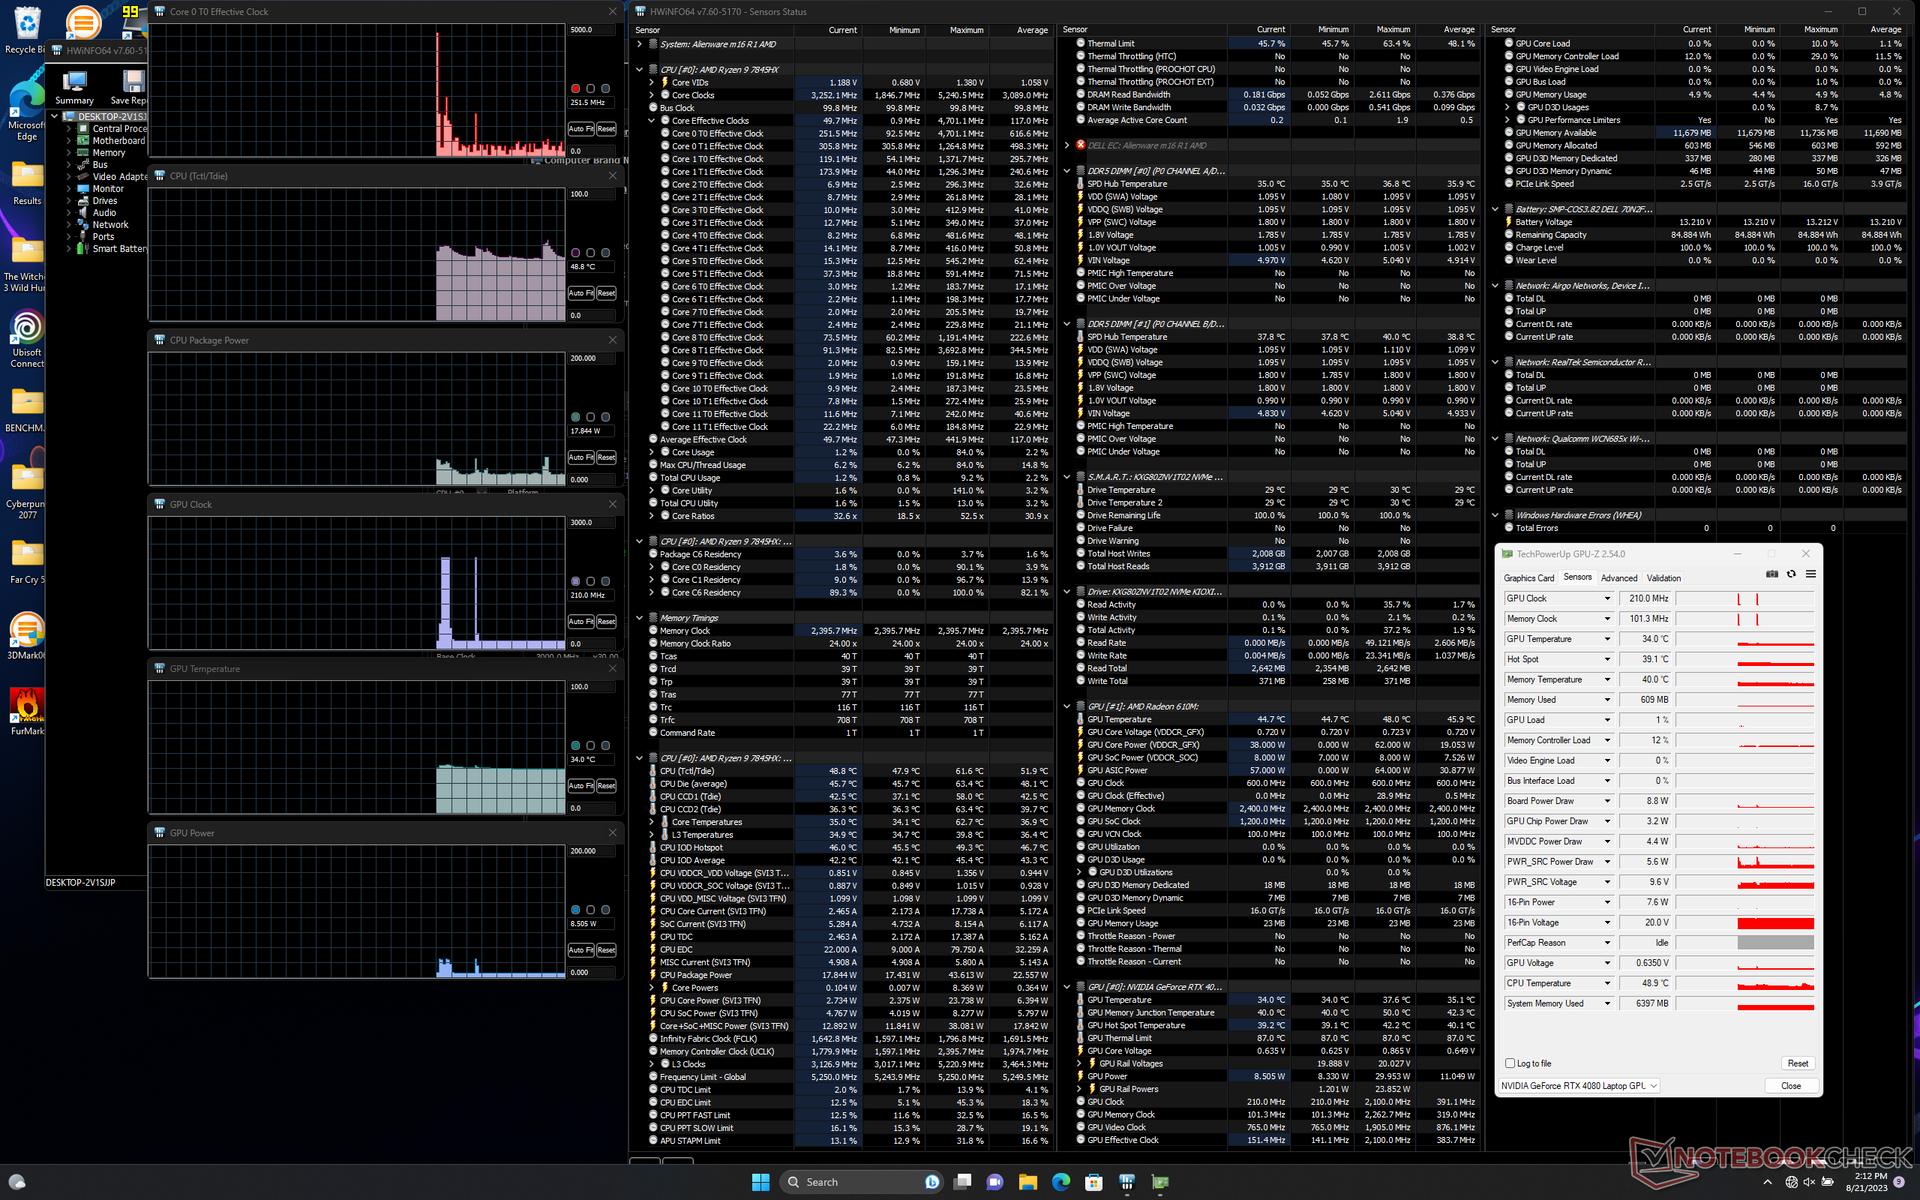
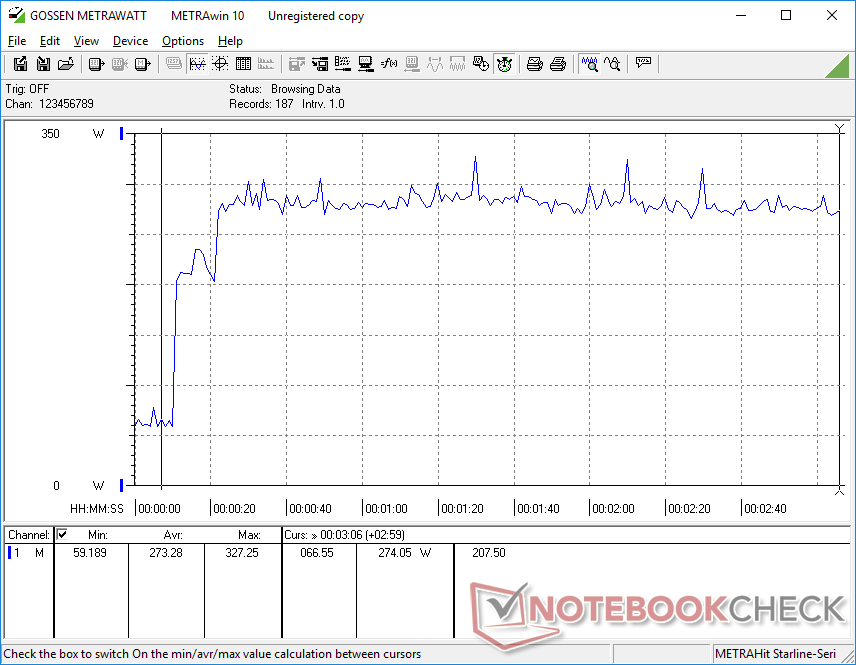
När Prime95 startas ökar processorn till 5 GHz, 132 W och en varm temperatur på 99 C under flera sekunder innan den stabiliseras på 4,6 GHz, 118 W och 85 C.
Om man kör Witcher 3 i Overdrive-läget stabiliseras GPU:n vid 2430 MHz klockfrekvens, 2263 MHz VRAM och 158 W strömförbrukning jämfört med 2415 MHz klockfrekvens, 2250 MHz VRAM och 156 W i Balanced-läget enligt GPU-Z. De mycket små prestandaskillnaderna mellan de två lägena stämmer överens med våra Fire Strike observationer som nämndes ovan. Kärntemperaturen skulle vara några grader varmare i Balanced-läget jämfört med Overdrive-läget eftersom fläktarna är märkbart tystare i Balanced-läget.
Observera att GPU:n är klassad för 175 W TGP, men vi har bara kunnat nå upp till 160 W under verkliga spelförhållanden.
| CPU-klocka (GHz) | GPU-klocka (MHz) | Genomsnittlig CPU-temperatur (°C) | Genomsnittlig GPU-temperatur (°C) | |
| System i viloläge | -- | - | 49 | 34 |
| Prime95 Stress | 4.6 | -- | 85 | 49 |
| Prime95 + FurMark Stress | ~4.0 - 4.6 | ~2430 | 87 | 74 |
| Witcher 3 Stress(balanserat läge) | ~4.1 | 2415 | 75 | 73 |
| Witcher 3 Stress (Overdrive-läge) | ~4.1 | 2430 | 74 | 70 |
Högtalare
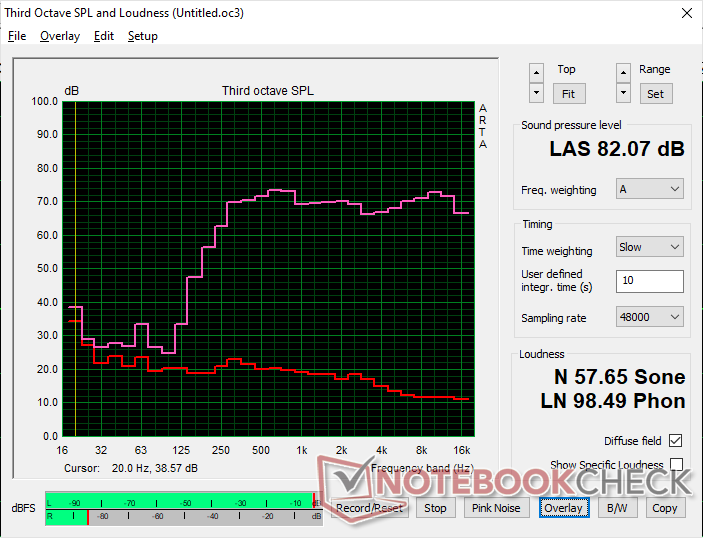
Alienware m16 R1 AMD ljudanalys
(+) | högtalare kan spela relativt högt (82.1 dB)
Bas 100 - 315 Hz
(-) | nästan ingen bas - i genomsnitt 20.6% lägre än medianen
(-) | basen är inte linjär (15.3% delta till föregående frekvens)
Mellan 400 - 2000 Hz
(+) | balanserad mellan - endast 1.4% från medianen
(+) | mids är linjära (2.1% delta till föregående frekvens)
Högsta 2 - 16 kHz
(+) | balanserade toppar - endast 1.9% från medianen
(+) | toppar är linjära (2.9% delta till föregående frekvens)
Totalt 100 - 16 000 Hz
(+) | det totala ljudet är linjärt (13.9% skillnad mot median)
Jämfört med samma klass
» 22% av alla testade enheter i den här klassen var bättre, 7% liknande, 71% sämre
» Den bästa hade ett delta på 6%, genomsnittet var 18%, sämst var 132%
Jämfört med alla testade enheter
» 16% av alla testade enheter var bättre, 4% liknande, 80% sämre
» Den bästa hade ett delta på 4%, genomsnittet var 24%, sämst var 134%
Apple MacBook Pro 16 2021 M1 Pro ljudanalys
(+) | högtalare kan spela relativt högt (84.7 dB)
Bas 100 - 315 Hz
(+) | bra bas - bara 3.8% från medianen
(+) | basen är linjär (5.2% delta till föregående frekvens)
Mellan 400 - 2000 Hz
(+) | balanserad mellan - endast 1.3% från medianen
(+) | mids är linjära (2.1% delta till föregående frekvens)
Högsta 2 - 16 kHz
(+) | balanserade toppar - endast 1.9% från medianen
(+) | toppar är linjära (2.7% delta till föregående frekvens)
Totalt 100 - 16 000 Hz
(+) | det totala ljudet är linjärt (4.6% skillnad mot median)
Jämfört med samma klass
» 0% av alla testade enheter i den här klassen var bättre, 0% liknande, 100% sämre
» Den bästa hade ett delta på 5%, genomsnittet var 17%, sämst var 45%
Jämfört med alla testade enheter
» 0% av alla testade enheter var bättre, 0% liknande, 100% sämre
» Den bästa hade ett delta på 4%, genomsnittet var 24%, sämst var 134%
Energiförvaltning
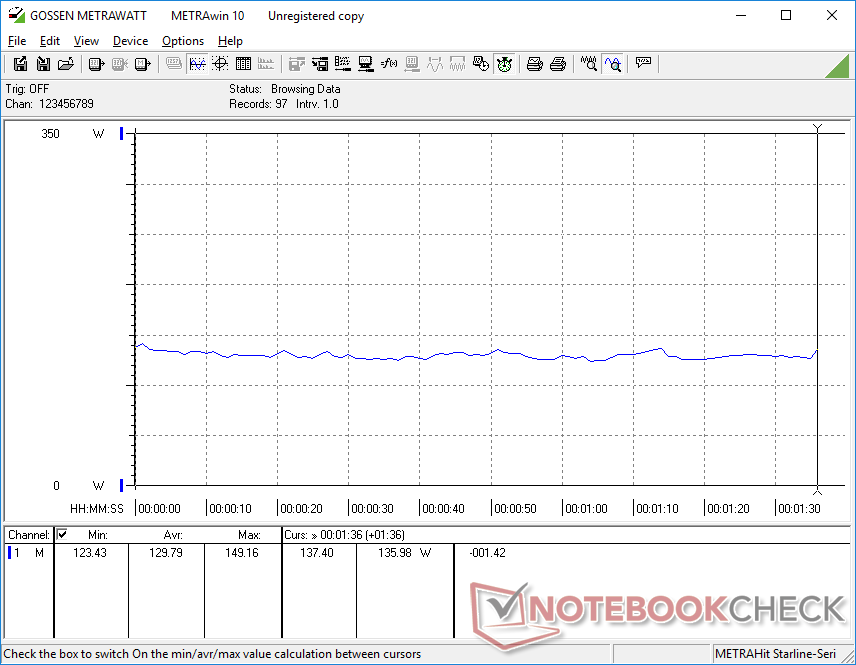
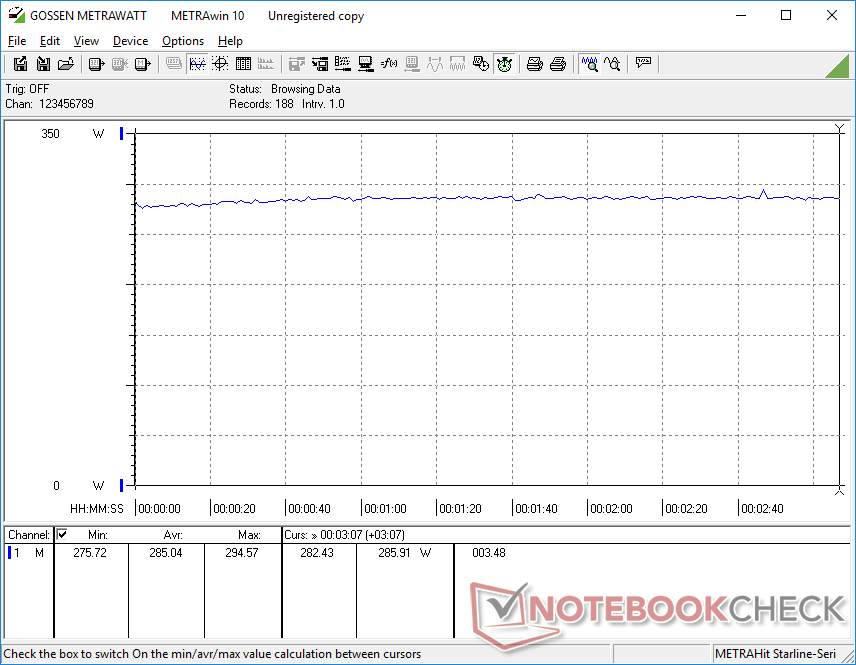
Strömförbrukning
Alienwares bärbara datorer har alltid haft några av de högsta strömförbrukningssiffrorna och vår Alienware m16 R1 är inte annorlunda. Helt enkelt tomgång på skrivbordet skulle dra mellan 39 W och 69 W jämfört med mindre än hälften på Lenovo Legion Pro 7 eller Asus ROG Strix G16. Dessa höga tomgångsnivåer är sannolikt ansvariga för de underväldigande batterilivslängdsresultaten i nästa avsnitt.
Strömförbrukningen vid spel är i genomsnitt 285 W, vilket återigen är mer än de flesta andra bärbara speldatorer, inklusive till och med Dells egen Alienware x16.
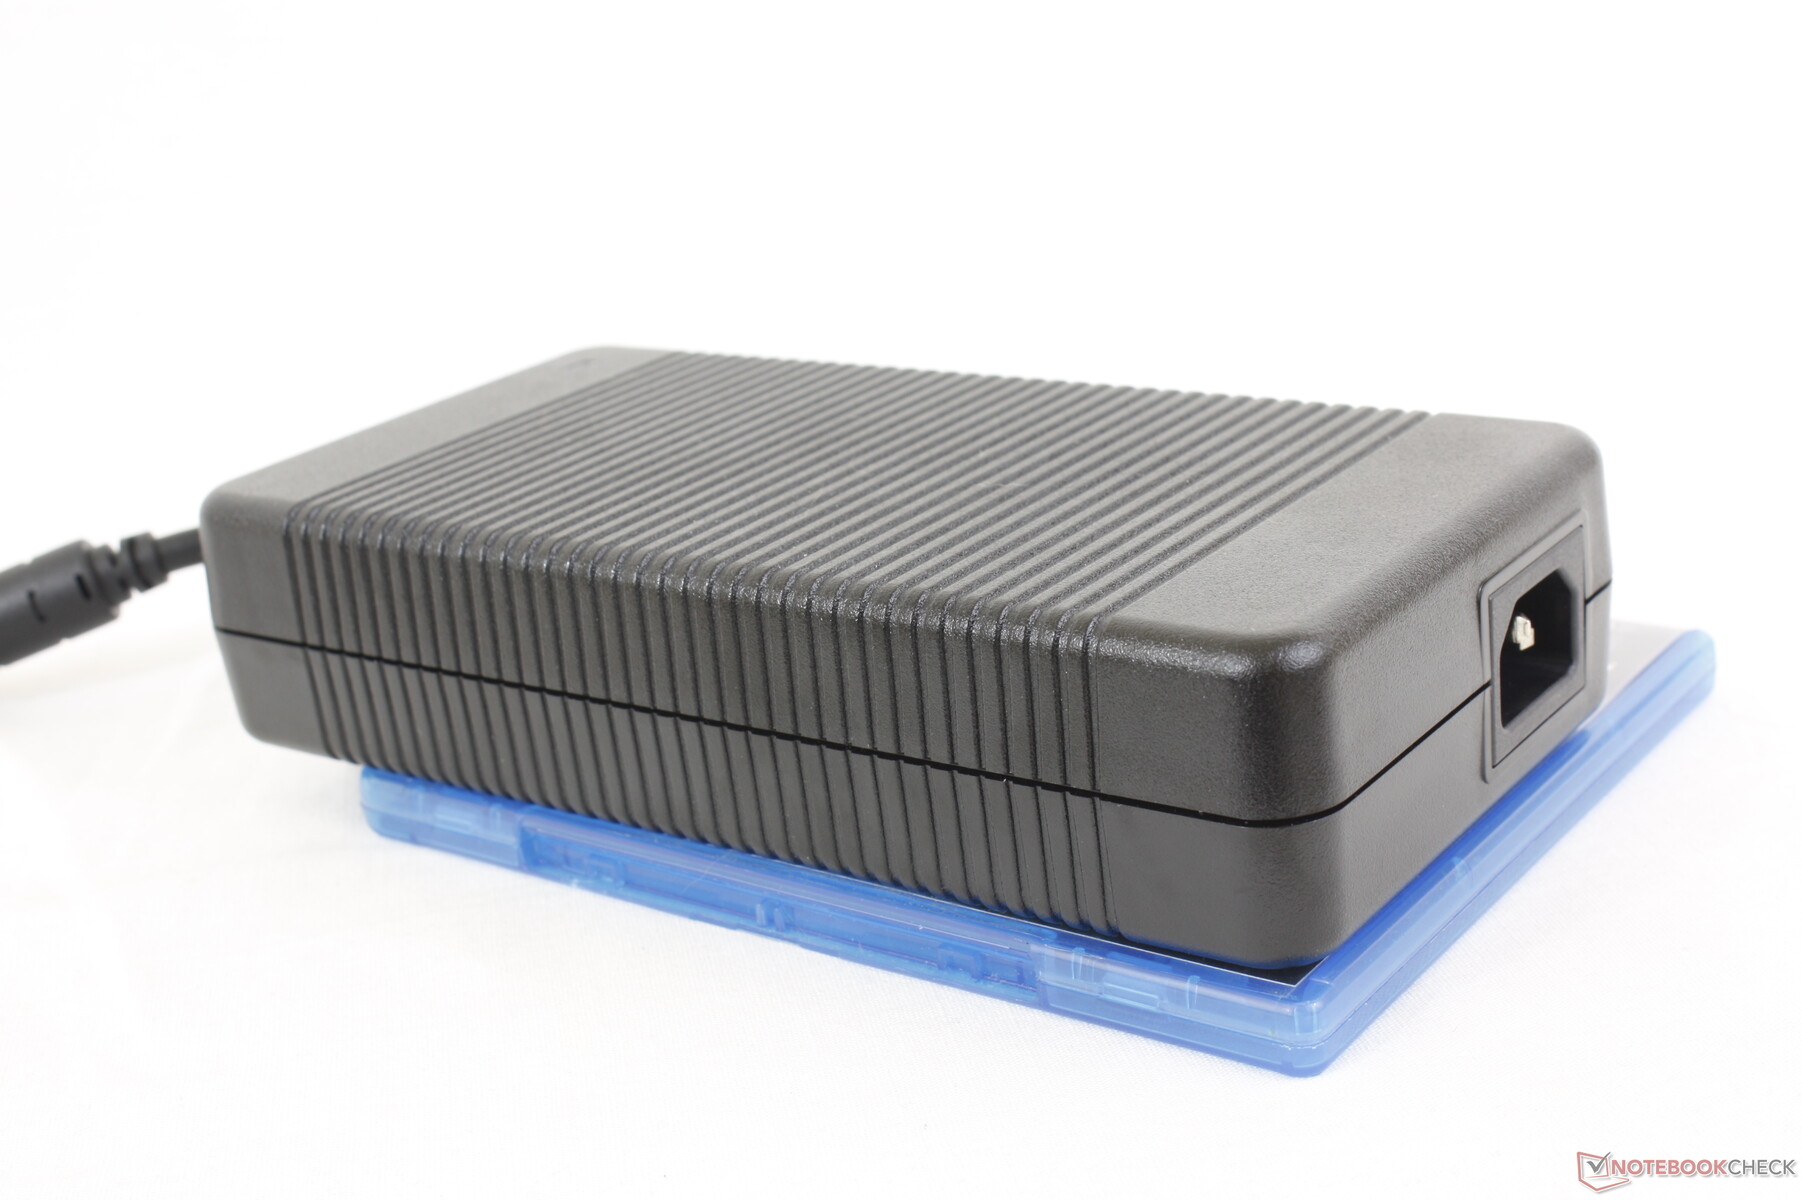
Nätadaptern på 330 W är stor (~20 x 10 x 4,5 cm) och otymplig. I jämförelse är GaN 330 W AC-adaptern som för närvarande levereras med de senaste Razer-bärbara datorerna betydligt mer portabel.
| Av/Standby | |
| Låg belastning | |
| Hög belastning |
|
Förklaring:
min: | |
| Alienware m16 R1 AMD R9 7845HX, GeForce RTX 4080 Laptop GPU, Kioxia XG8 KXG80ZNV1T02, IPS, 2560x1600, 16" | Alienware x16 R1 i9-13900HK, GeForce RTX 4080 Laptop GPU, SK hynix PC801 HFS001TEJ9X101N, IPS, 2560x1600, 16" | HP Omen Transcend 16 i9-13900HX, GeForce RTX 4070 Laptop GPU, SK hynix PC801 HFS002TEJ9X101N, Mini-LED, 2560x1600, 16" | Lenovo Legion Pro 7 RTX4090 i9-13900HX, GeForce RTX 4090 Laptop GPU, Samsung PM9A1 MZVL21T0HCLR, IPS, 2560x1600, 16" | Asus ROG Strix G16 G614JZ i9-13980HX, GeForce RTX 4080 Laptop GPU, WD PC SN560 SDDPNQE-1T00, IPS, 2560x1600, 16" | Razer Blade 16 Early 2023 i9-13950HX, GeForce RTX 4080 Laptop GPU, SSSTC CA6-8D1024, IPS, 2560x1600, 16" | |
|---|---|---|---|---|---|---|
| Power Consumption | 21% | 27% | 23% | 35% | 29% | |
| Idle Minimum * (Watt) | 39 | 25.2 35% | 19.2 51% | 20 49% | 10 74% | 15.2 61% |
| Idle Average * (Watt) | 44.6 | 29.9 33% | 22.7 49% | 25 44% | 16 64% | 22.8 49% |
| Idle Maximum * (Watt) | 68.1 | 49.8 27% | 55.4 19% | 35 49% | 27 60% | 49.8 27% |
| Load Average * (Watt) | 129.8 | 105.4 19% | 128.4 1% | 136 -5% | 129 1% | 121.2 7% |
| Witcher 3 ultra * (Watt) | 285 | 263 8% | 206 28% | 282 1% | 247 13% | 242 15% |
| Load Maximum * (Watt) | 327.3 | 313.8 4% | 292 11% | 320 2% | 342 -4% | 273.7 16% |
* ... mindre är bättre
Power Consumption Witcher 3 / Stresstest
Power Consumption external Monitor
Batteritid
Batteritiden är fortfarande dålig med knappt 4 timmars WLAN-surfning i verkligheten när vi använder den balanserade energiprofilen med iGPU:n aktiv. Vi försökte till och med använda den speciella strömprofilen "Batteri" via Alienware Command Center och våra resultat skulle fortfarande inte förbättras. Konkurrerande modeller som Lenovo Legion Pro 7 eller Asus ROG Strix G16 kan var och en hålla mycket längre.
Laddning från tom till full kapacitet tar lite mer än 2 timmar. Systemet kan också laddas via USB-C om än i långsammare takt.
| Alienware m16 R1 AMD R9 7845HX, GeForce RTX 4080 Laptop GPU, 86 Wh | Alienware x16 R1 i9-13900HK, GeForce RTX 4080 Laptop GPU, 90 Wh | HP Omen Transcend 16 i9-13900HX, GeForce RTX 4070 Laptop GPU, 97 Wh | Lenovo Legion Pro 7 RTX4090 i9-13900HX, GeForce RTX 4090 Laptop GPU, 99.9 Wh | Asus ROG Strix G16 G614JZ i9-13980HX, GeForce RTX 4080 Laptop GPU, 90 Wh | Razer Blade 16 Early 2023 i9-13950HX, GeForce RTX 4080 Laptop GPU, 95.2 Wh | |
|---|---|---|---|---|---|---|
| Batteridrifttid | 13% | 41% | 38% | 100% | 88% | |
| Reader / Idle (h) | 4 | 7.3 83% | 6.3 58% | 8.9 123% | ||
| WiFi v1.3 (h) | 3.7 | 2.5 -32% | 4.2 14% | 5.1 38% | 9.7 162% | 6.1 65% |
| Load (h) | 0.8 | 0.7 -13% | 1.2 50% | 1.1 38% | 1.4 75% |
För
Emot
Omdöme - Snabb och funktionsspäckad i behov av optimeringar
Alienware m16 R1 innehåller en vansinnig mängd kraft och funktioner för en 16-tums bärbar dator. Vi pratar flytande metall, ångkammare, fyra fläktar, 3x SSD-fack, CherryMX mekaniskt tangentbord, 175 W grafik, uppgraderbart RAM-minne och till och med CPU- och GPU-alternativ från både Intel och AMD. Konkurrerande 16-tums gamingmodeller som t.ex HP Omen Transcend 16, Razer Blade 16eller Asus Zephyrus M16 har jämförelsevis mindre uppsättningar funktioner och är i allmänhet också långsammare även när de konfigureras med samma GPU som vår testkonfiguration. Ingenjörerna på Alienware förtjänar en hel del beröm med tanke på hur tätt packad Alienware m16 R1 är.
Å andra sidan kan den långa listan med integrerade funktioner också fungera mot den bärbara datorn eftersom Alienware m16 är både tyngre och större än många alternativ med breda marginaler. I synnerhet batteritiden lider ganska kraftigt oavsett inställning av strömprofil. Om du värdesätter bärbarhet kanske du vill leta någon annanstans. Dessutom saknar modellen fortfarande ett par populära funktioner som OLED och mini-LED.
Alienware m16 R1 är onekligen snabb och funktionsspäckad med resultat över genomsnittet överallt. Prestandafördelarna kommer dock till priset av högre vikt och större storlek.
De buggar vi stötte på under vår granskning förtjänar ett omnämnande. Bildhopp under 4K-videouppspelning, bildhastighetsstopp vid spel och problem med att vakna från viloläge är olyckliga att se med tanke på att Alienware är tänkt att vara ett entusiastmärke. Kanske biter Dell av lite mer än de kan tugga med sina många Intel-Nvidia-, AMD-Nvidia- och AMD-AMD-konfigurationer som kan göra felsökning ganska knepig.
Pris och tillgänglighet
Dell skeppar nu sin Alienware m16-modell i både Intel- och AMD-versioner. AMD-versionen börjar på $1700 USD upp till över $3000 till $4000 om den är fullt konfigurerad.
Alienware m16 R1 AMD
- 08/23/2023 v7 (old)
Allen Ngo
Genomskinlighet
Valet av enheter som ska granskas görs av vår redaktion. Testprovet gavs till författaren som ett lån av tillverkaren eller återförsäljaren för denna recension. Långivaren hade inget inflytande på denna recension och inte heller fick tillverkaren en kopia av denna recension innan publiceringen. Det fanns ingen skyldighet att publicera denna recension. Som ett oberoende medieföretag är Notebookcheck inte föremål för auktoritet från tillverkare, återförsäljare eller förlag.
This is how Notebookcheck is testingEvery year, Notebookcheck independently reviews hundreds of laptops and smartphones using standardized procedures to ensure that all results are comparable. We have continuously developed our test methods for around 20 years and set industry standards in the process. In our test labs, high-quality measuring equipment is utilized by experienced technicians and editors. These tests involve a multi-stage validation process. Our complex rating system is based on hundreds of well-founded measurements and benchmarks, which maintains objectivity.
Price comparison

