Lenovo Legion 5 Pro Gen 7 laptop recension: Ryzen 7 6800H eller Ryzen 9 6900HX?
Legion 5 Pro Gen 7 är en bärbar dator för spel i övre mellanklassen som ligger precis under den ännu dyrare Legion 7 16-serien. Den ansluter sig till den allt vanligare raden av bärbara 16-tums gamingdatorer som t.ex HP Omen 16, Asus ROG Zephyrus M16, Dell G16eller Gigabyte Aero 16 som alla är alternativ till Lenovo-modellen i recensionen.
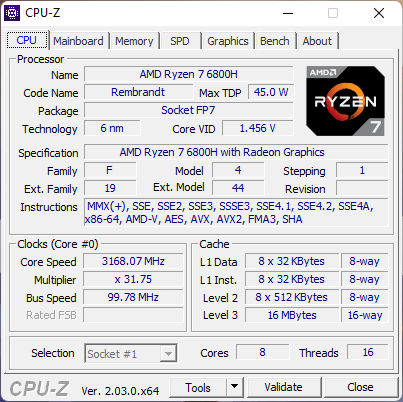
Vår testenhet levereras med AMD Zen 3+ Ryzen 7 6800H CPU med 150 W TGP GeForce RTX 3070 Ti-grafik för cirka 1900 USD. Andra SKU:er finns med Ryzen 9 6900HX, RTX 3070, RTX 3060 eller RTX 3050 Ti, men alla alternativ kommer annars med samma 16:10 2560 x 1600 IPS-skärm med G-Sync-stöd.
2022 Legion 5 Pro Gen 7 har samma chassidesign som på förra årets modell och därför rekommenderar vi att du kollar in vår befintliga recension av 2021 års modell för mer information om enhetens fysiska egenskaper. Den äldre versionen använder sig av långsammare Zen 3 Ryzen 7 5800H och 140 W TGP GeForce RTX 3070-processorer i jämförelse
Fler recensioner av Lenovo:
Potentiella konkurrenter i jämförelse
Gradering | Datum | Modell | Vikt | Höjd | Storlek | Upplösning | Pris |
|---|---|---|---|---|---|---|---|
| 87.7 % v7 (old) | 10/2022 | Lenovo Legion 5 Pro 16ARH7H RTX 3070 Ti R7 6800H, GeForce RTX 3070 Ti Laptop GPU | 2.6 kg | 26.6 mm | 16.00" | 2560x1600 | |
| 86.6 % v7 (old) | 07/2022 | Lenovo Legion 5 Pro 16IAH7H i7-12700H, GeForce RTX 3060 Laptop GPU | 2.6 kg | 27 mm | 16.00" | 2560x1600 | |
| 85.6 % v7 (old) | 07/2021 | Asus ROG Zephyrus M16 GU603H i9-11900H, GeForce RTX 3070 Laptop GPU | 2 kg | 20 mm | 16.00" | 2560x1600 | |
| 90.8 % v7 (old) | 09/2022 | Lenovo Legion 7 16ARHA7 R9 6900HX, Radeon RX 6850M XT | 2.6 kg | 19.4 mm | 16.00" | 2560x1600 | |
| 82.3 % v7 (old) | 05/2022 | HP Victus 16-e0145ng R5 5600H, GeForce RTX 3050 Ti Laptop GPU | 2.4 kg | 23.5 mm | 16.10" | 1920x1080 | |
| 86.1 % v7 (old) | 10/2022 | Dell G16 7620 i7-12700H, GeForce RTX 3060 Laptop GPU | 2.6 kg | 26.9 mm | 16.00" | 2560x1600 |
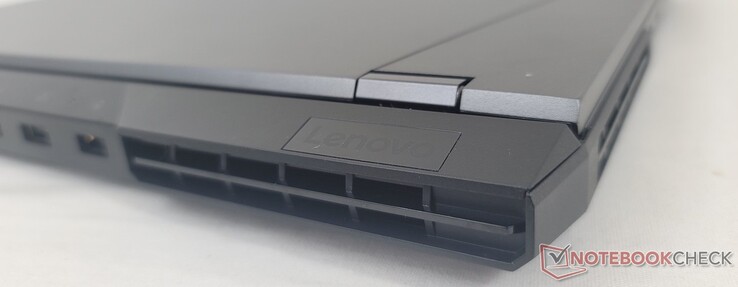
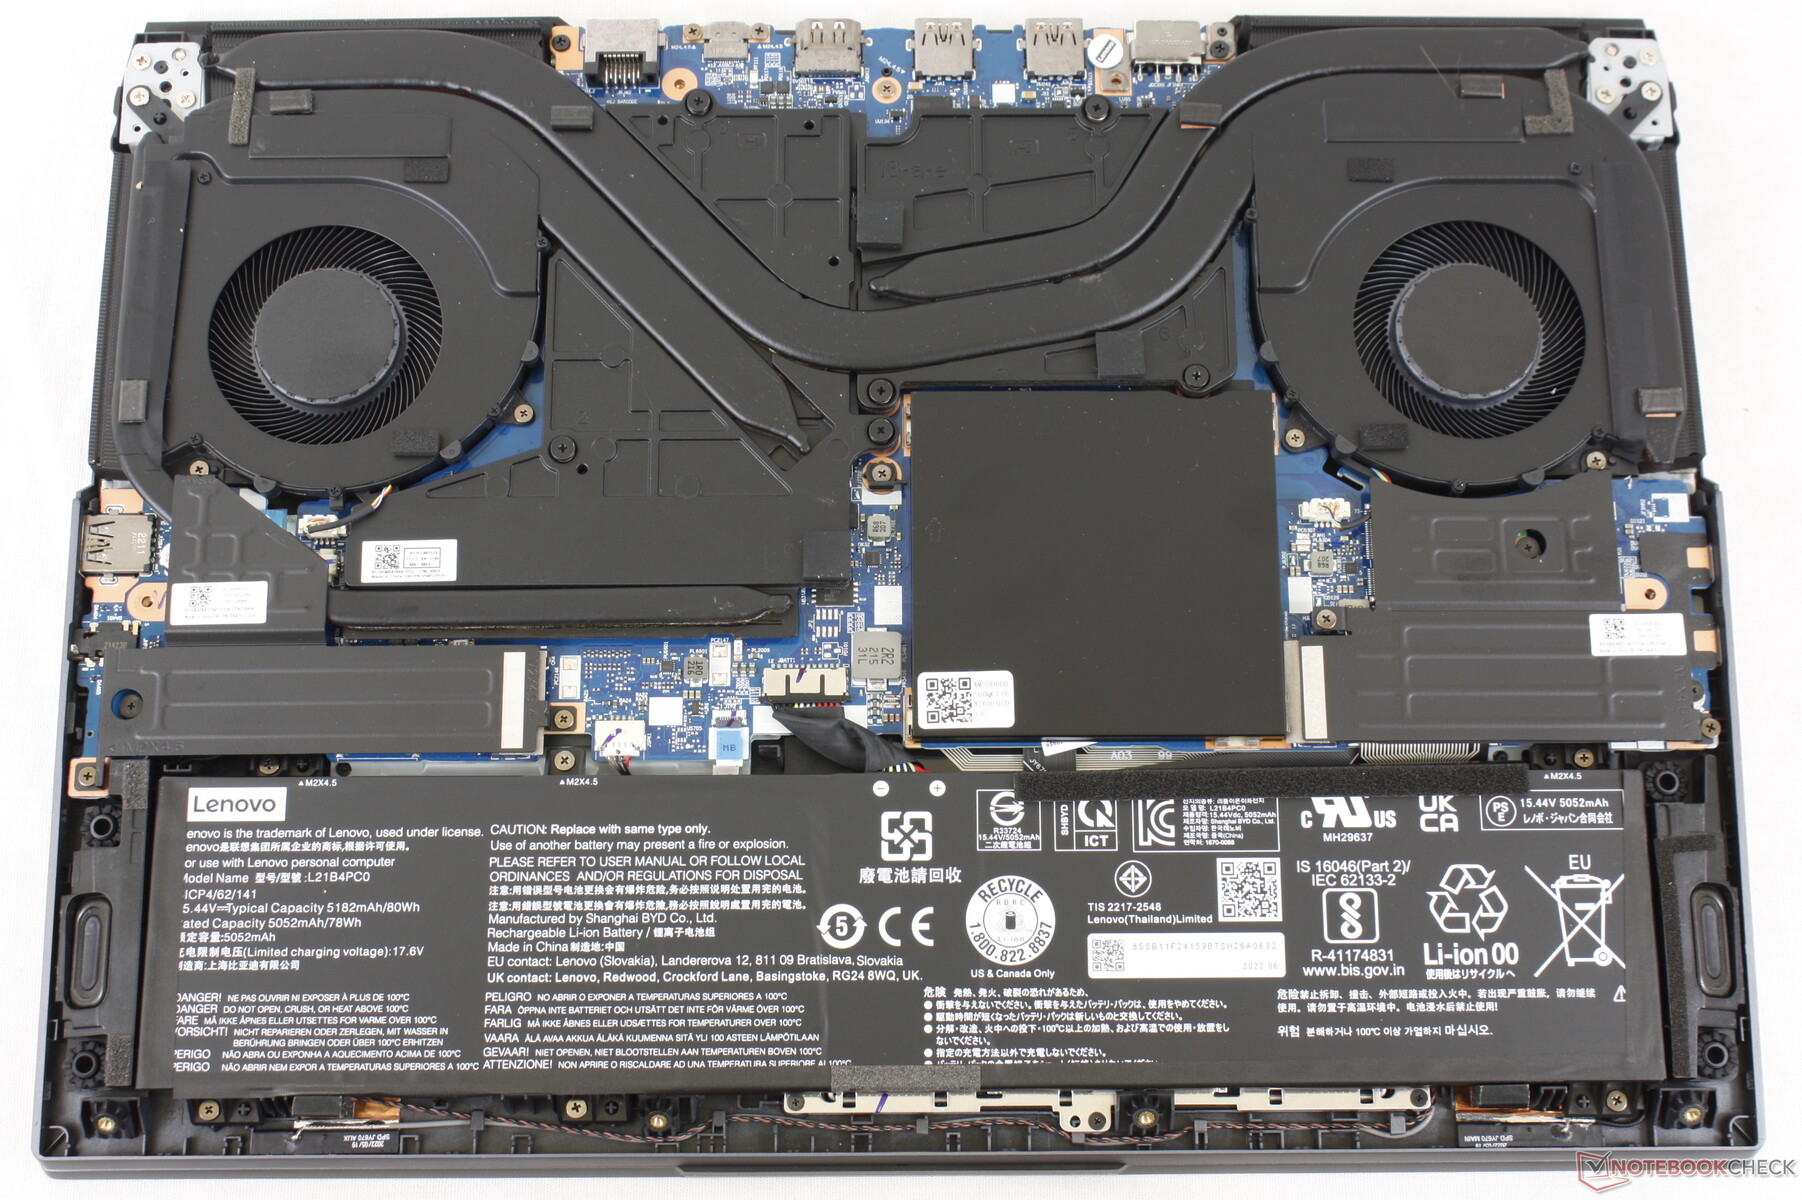
Väska - yttre lock och botten i aluminium
Det finns ett enkelt sätt att skilja 2022 Legion 5 Pro 16 från 2021 Legion 5 Pro 16. 2022-modellen har ytterligare en USB-C-port längs den vänstra kanten, vilket ger tre totalt, medan 2021-modellen bara har två. Samtidigt har antalet USB-A-portar minskat från fyra till tre. De två modellerna är annars visuellt identiska.
Kommunikation
| Networking | |
| iperf3 transmit AX12 | |
| Asus ROG Zephyrus M16 GU603H | |
| iperf3 receive AX12 | |
| Asus ROG Zephyrus M16 GU603H | |
| iperf3 receive AXE11000 6GHz | |
| Lenovo Legion 5 Pro 16ARH7H RTX 3070 Ti | |
| Lenovo Legion 7 16ARHA7 | |
| iperf3 receive AXE11000 | |
| Dell G16 7620 | |
| HP Victus 16-e0145ng | |
| iperf3 transmit AXE11000 6GHz | |
| Lenovo Legion 7 16ARHA7 | |
| Lenovo Legion 5 Pro 16ARH7H RTX 3070 Ti | |
| iperf3 transmit AXE11000 | |
| Dell G16 7620 | |
| HP Victus 16-e0145ng | |
Webbkamera
Webbkameran är fortfarande bara 720p utan IR.


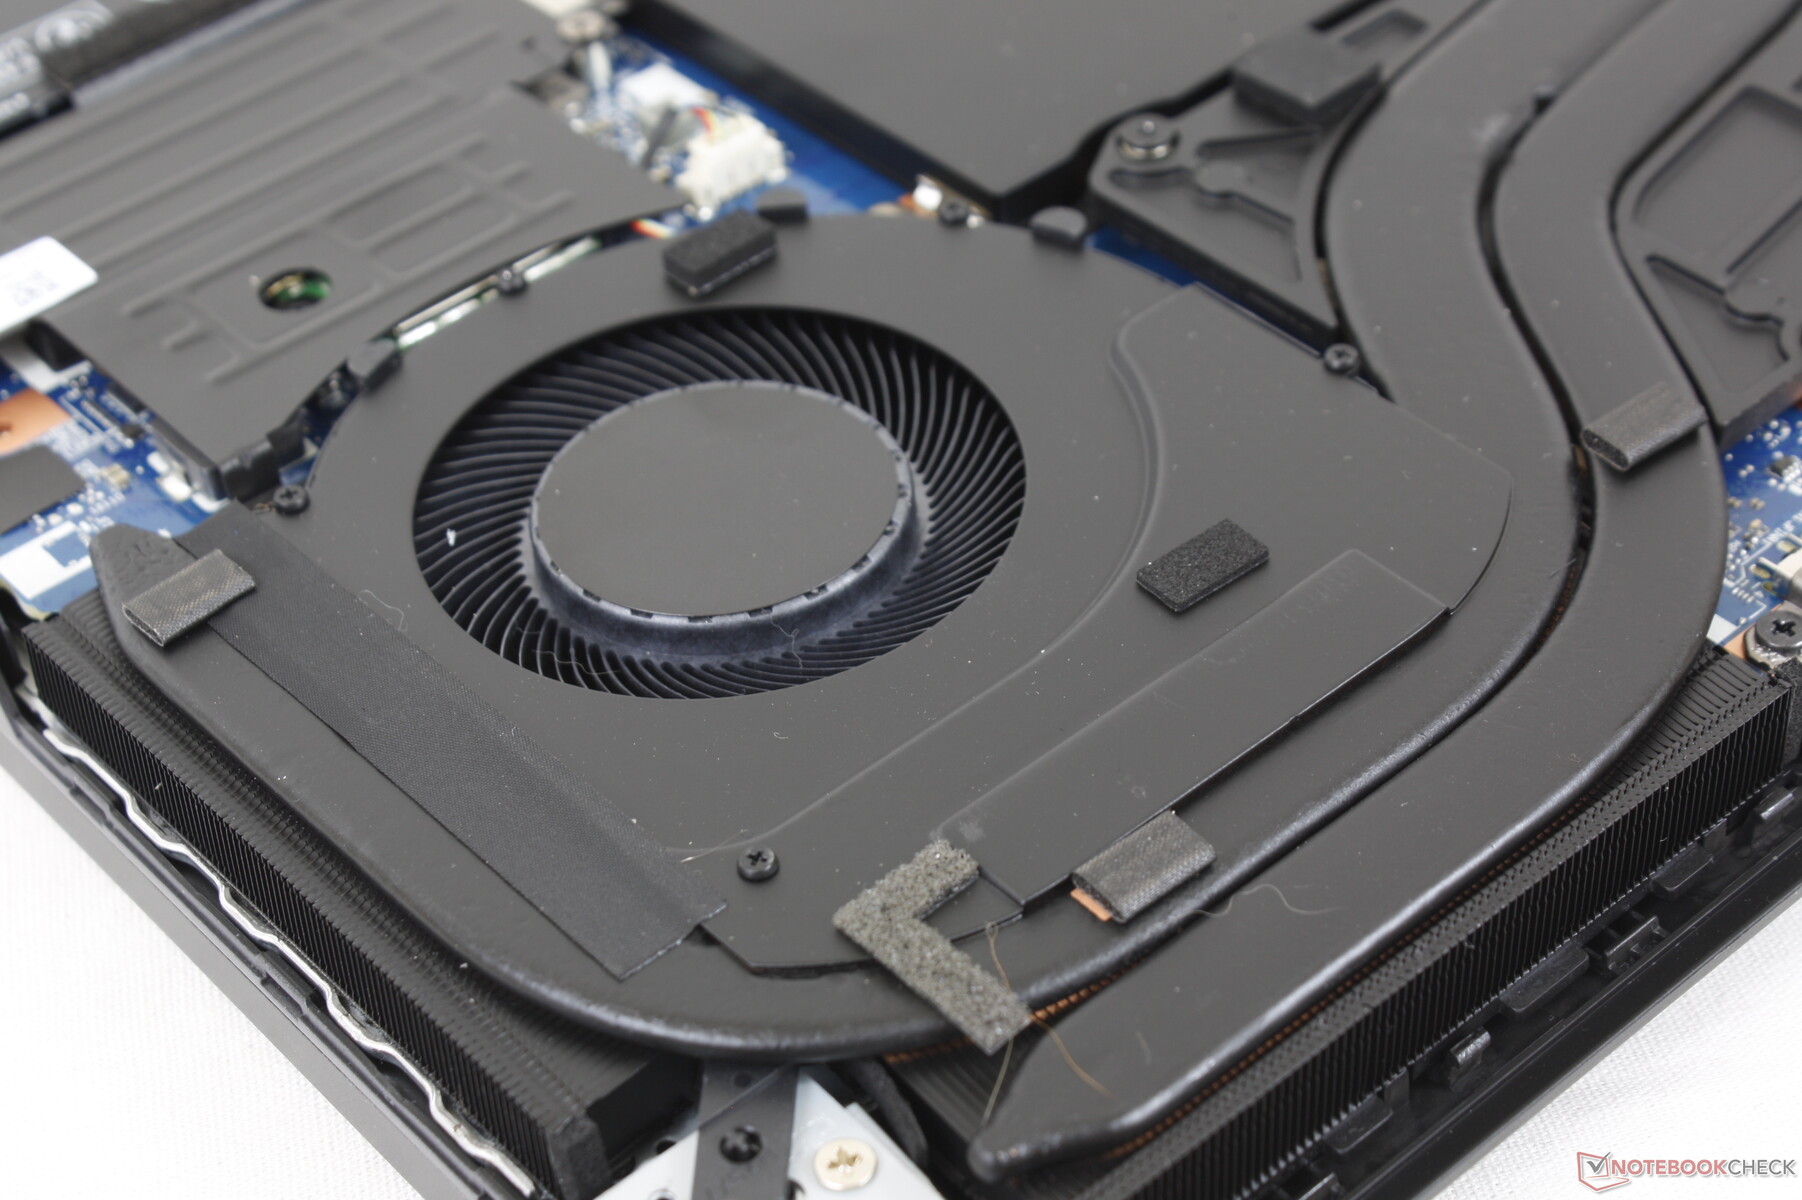
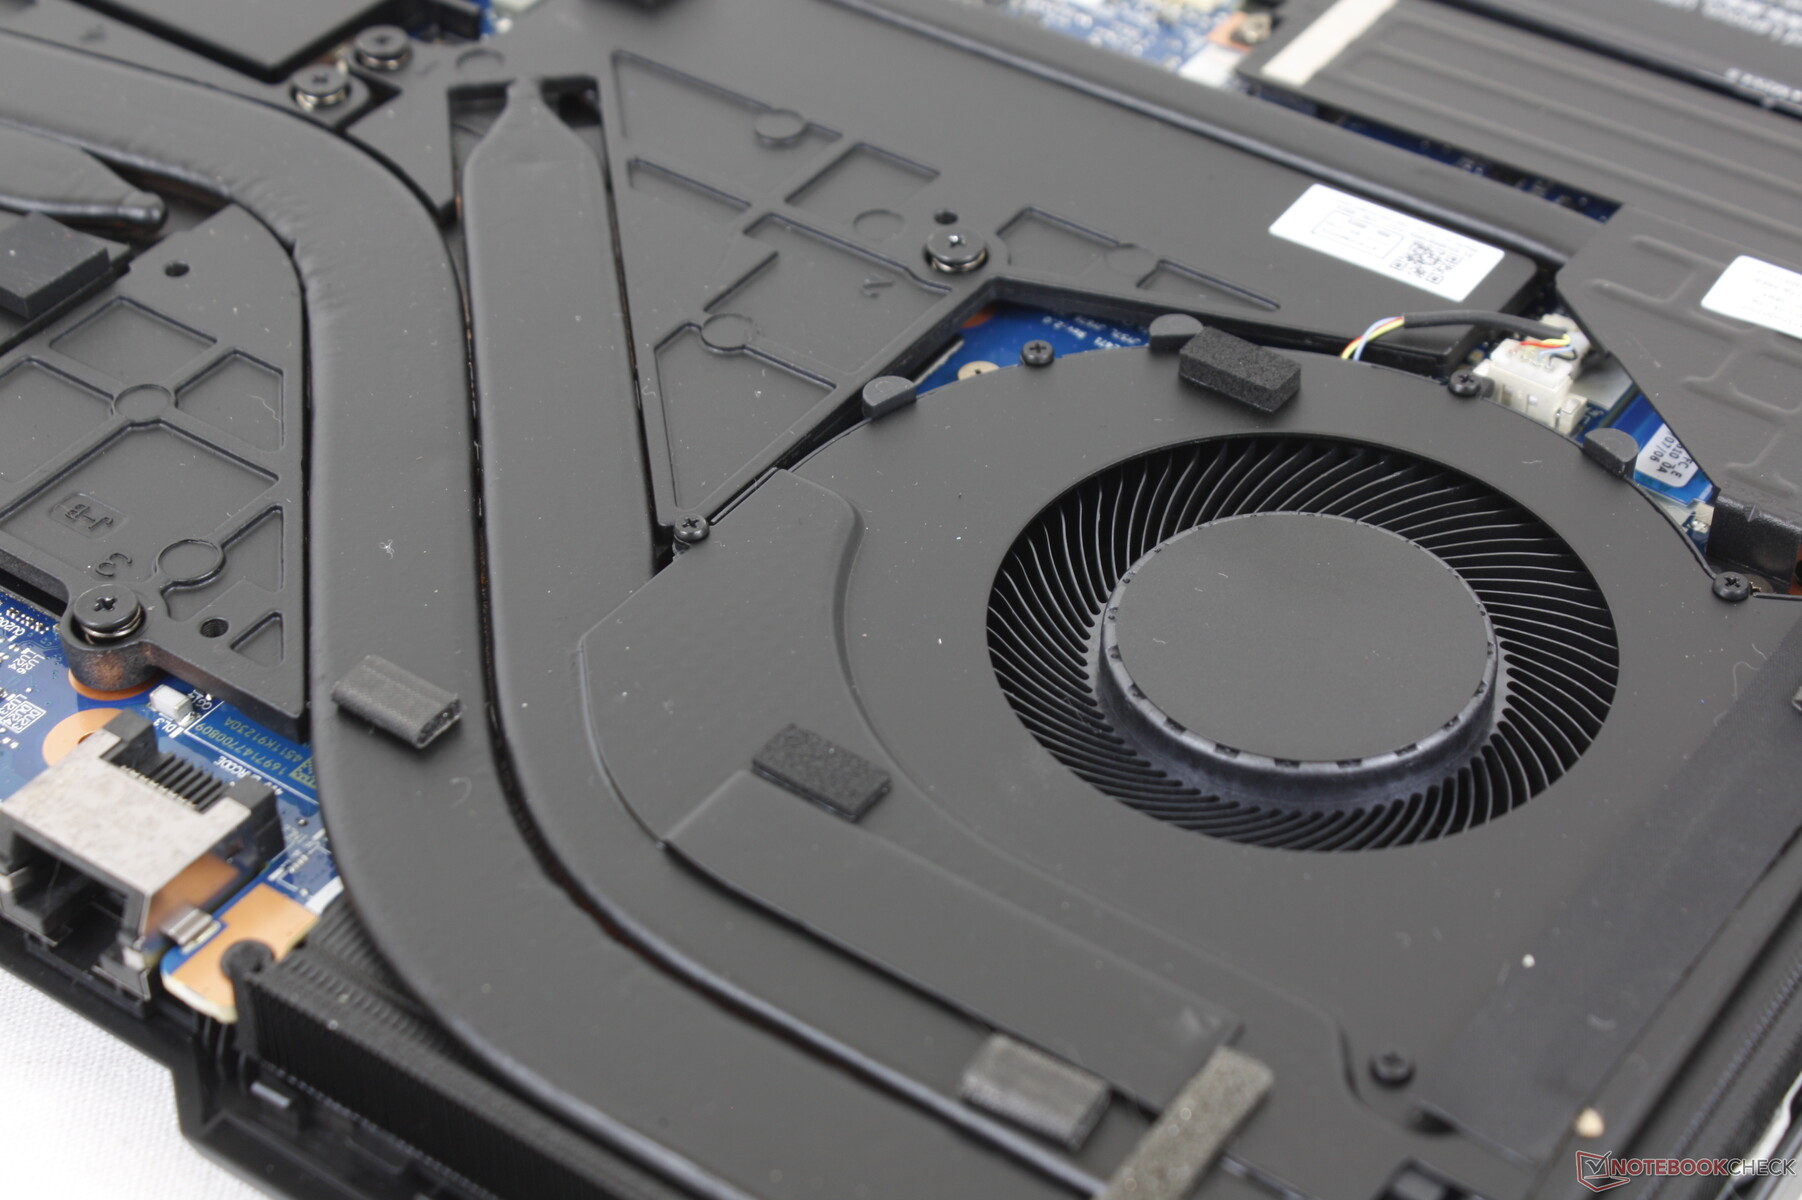
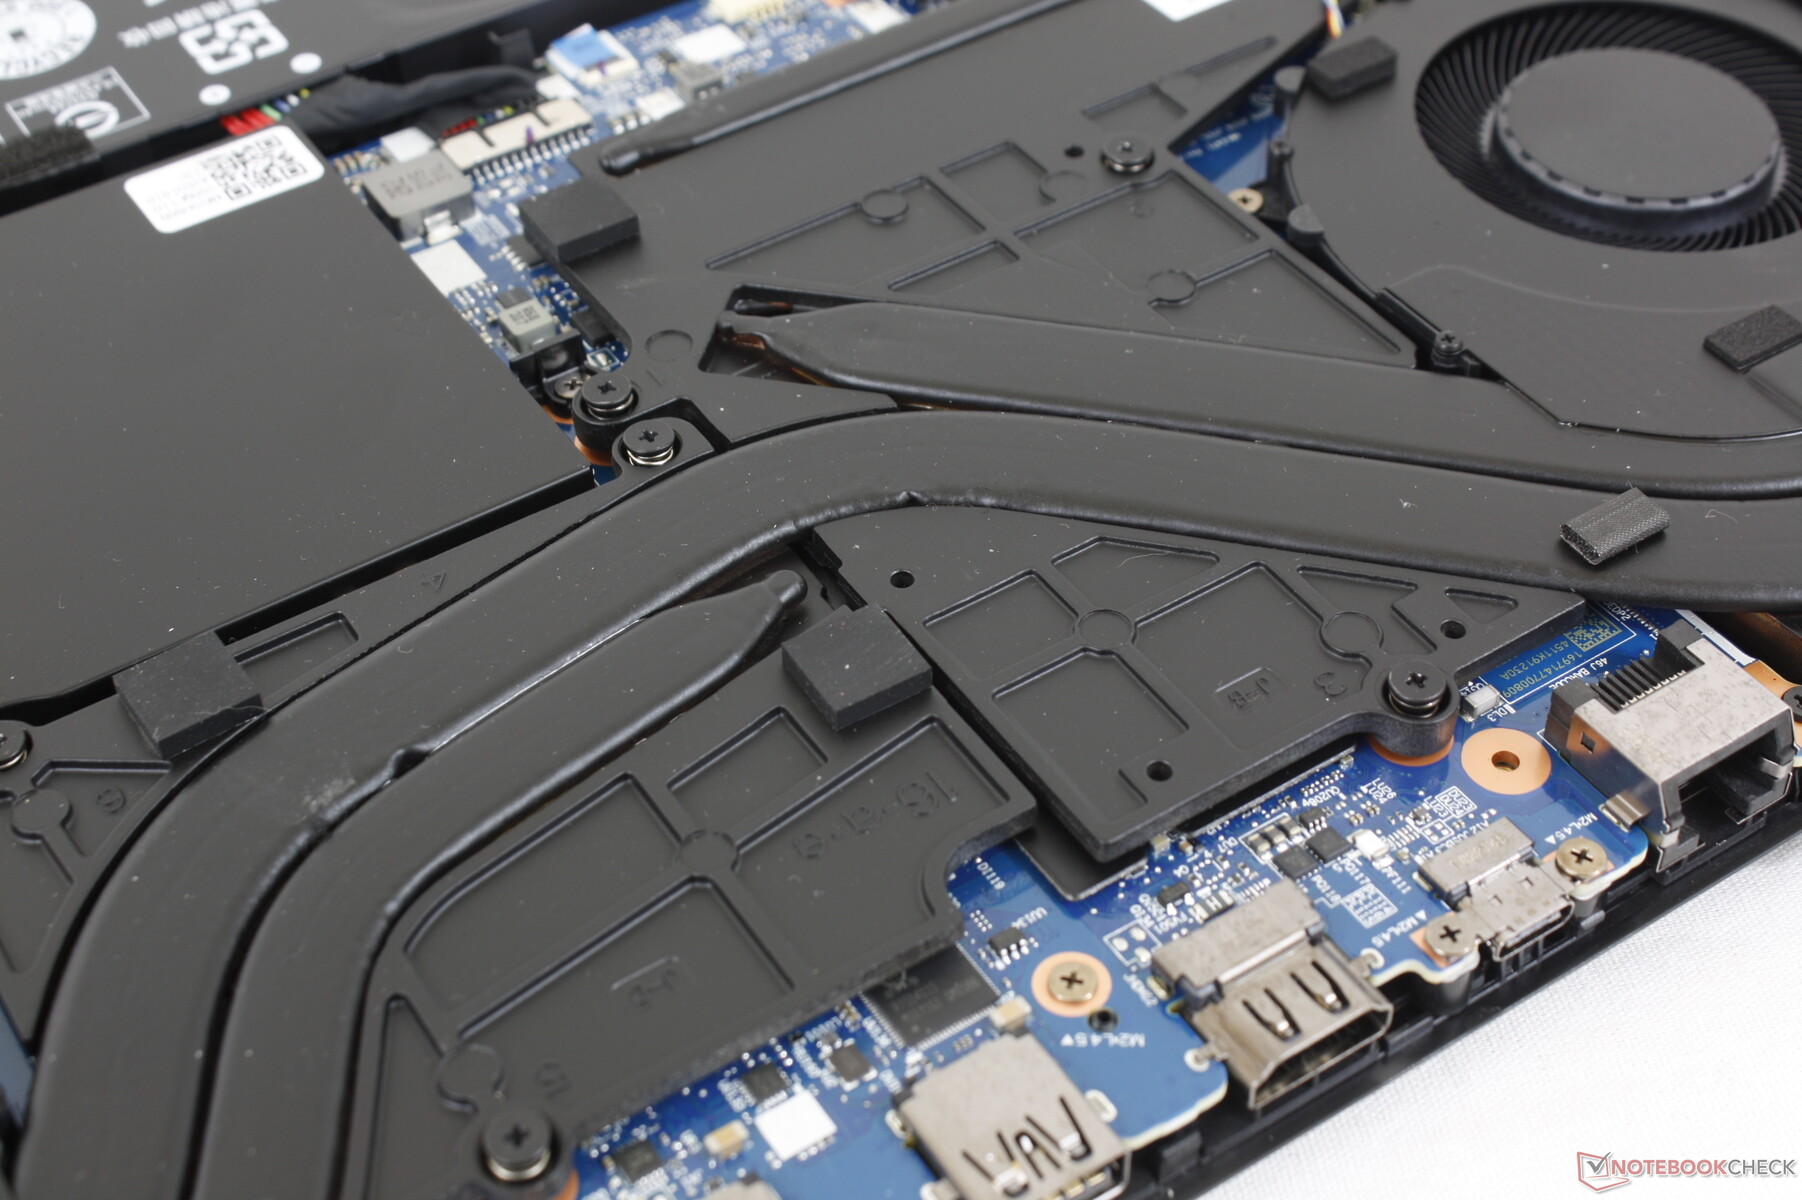
Underhåll
Tillbehör och garanti
Det finns inga extra tillbehör i lådan utöver nätadaptern och pappersarbete. Den vanliga ettåriga begränsade tillverkargarantin gäller om den köps i USA.
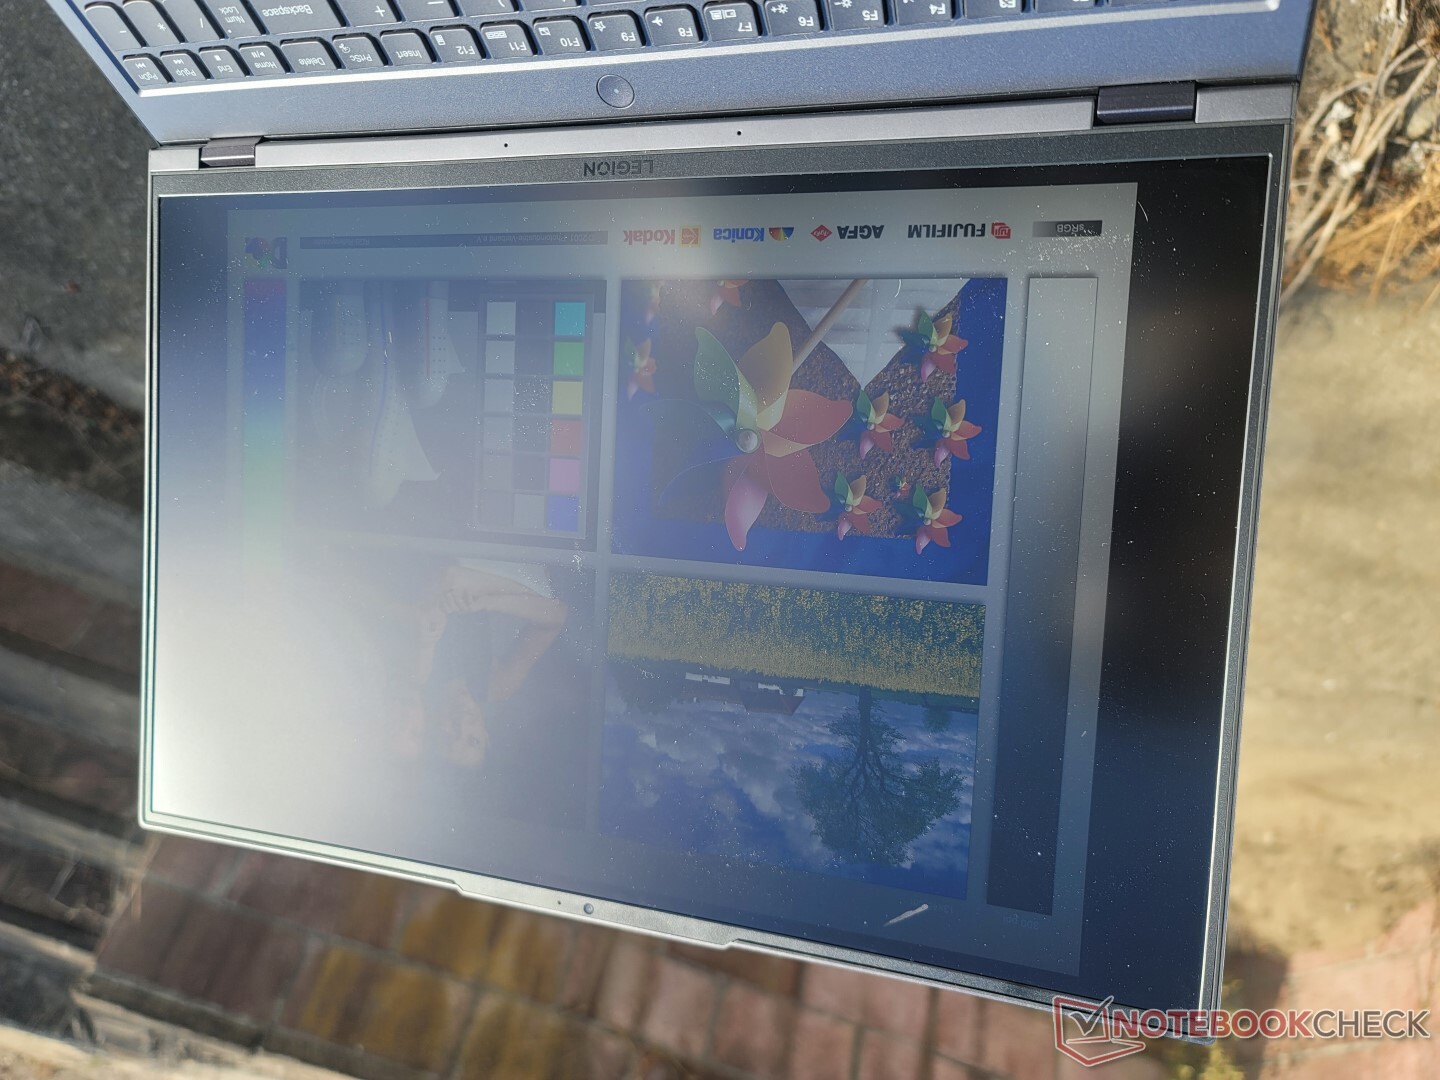
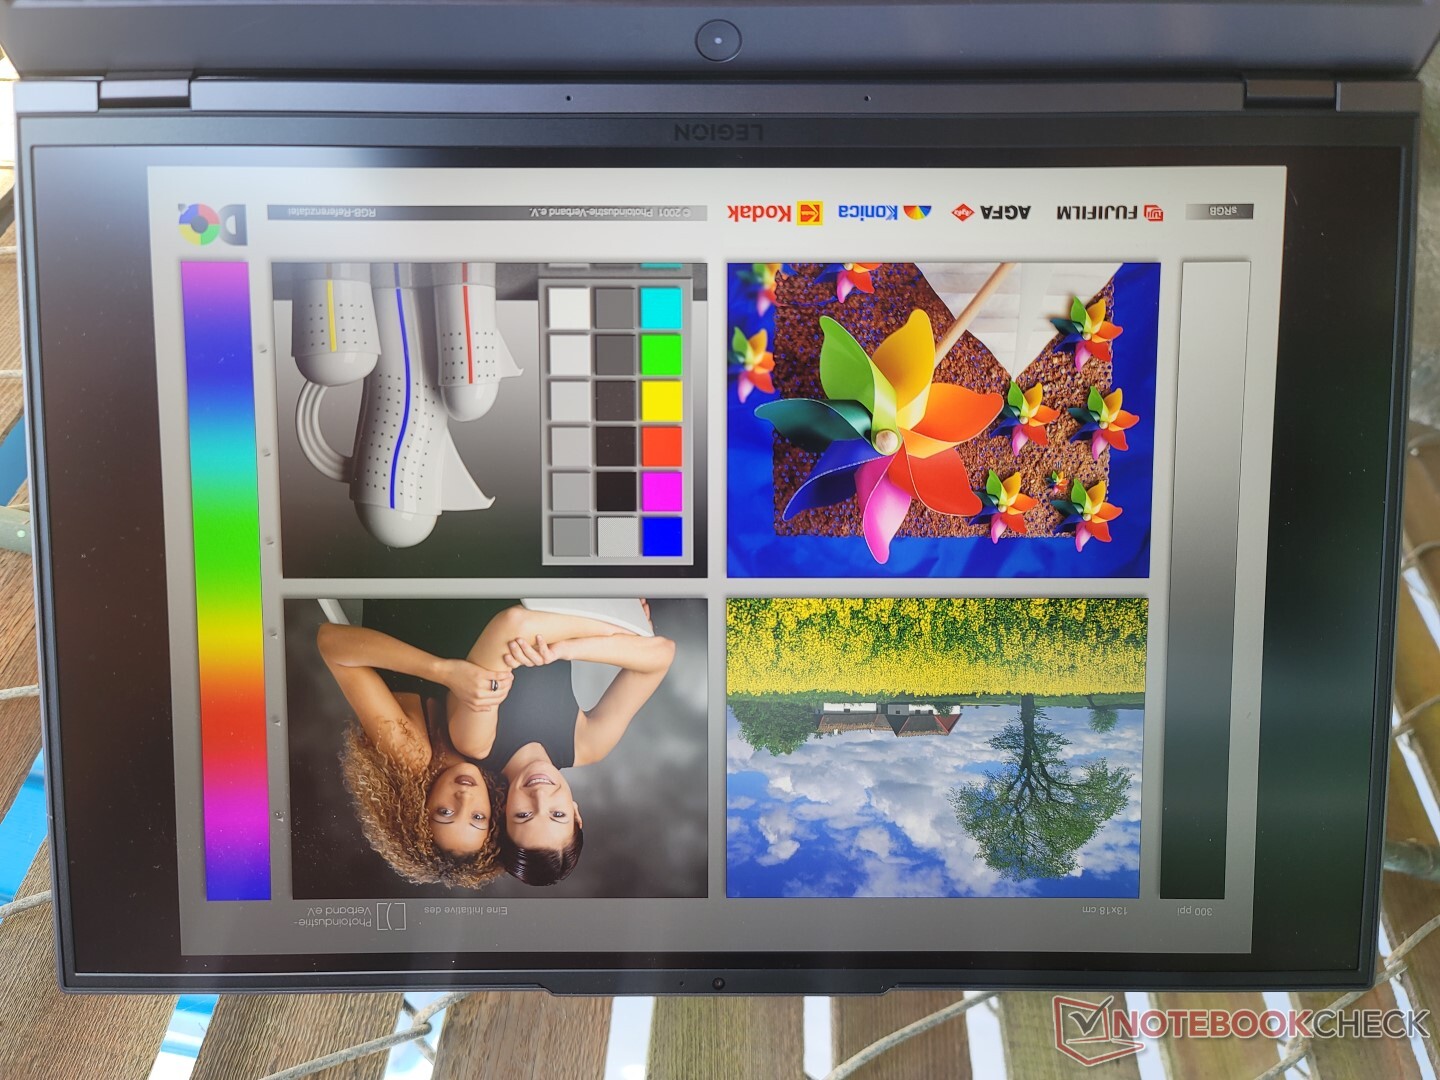
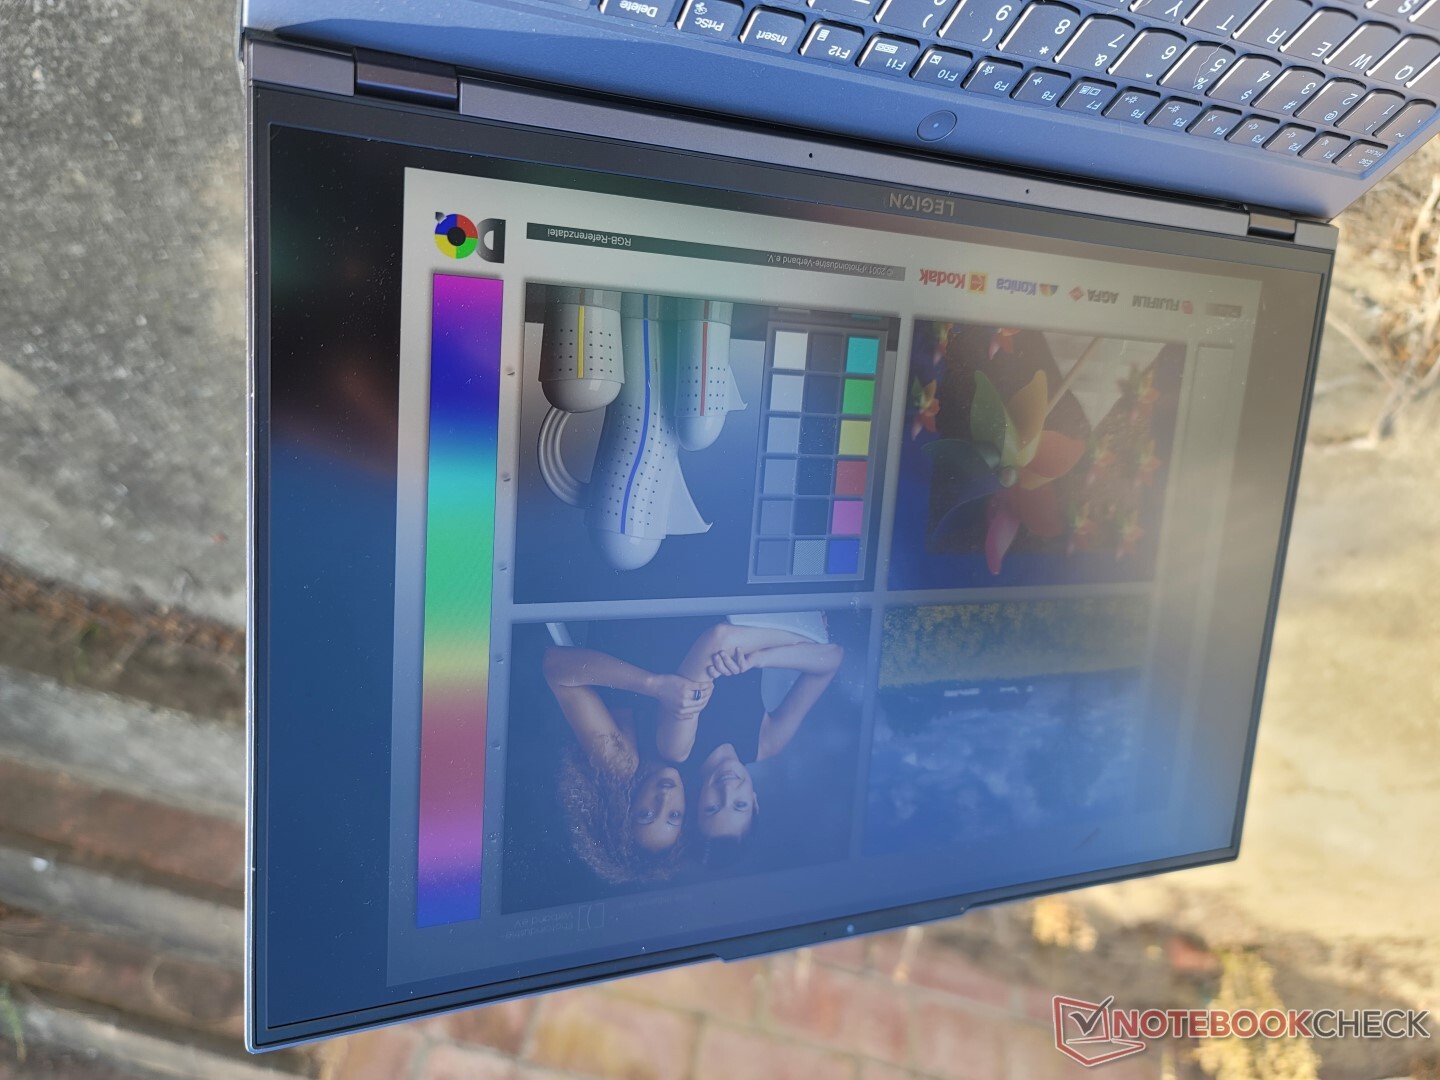
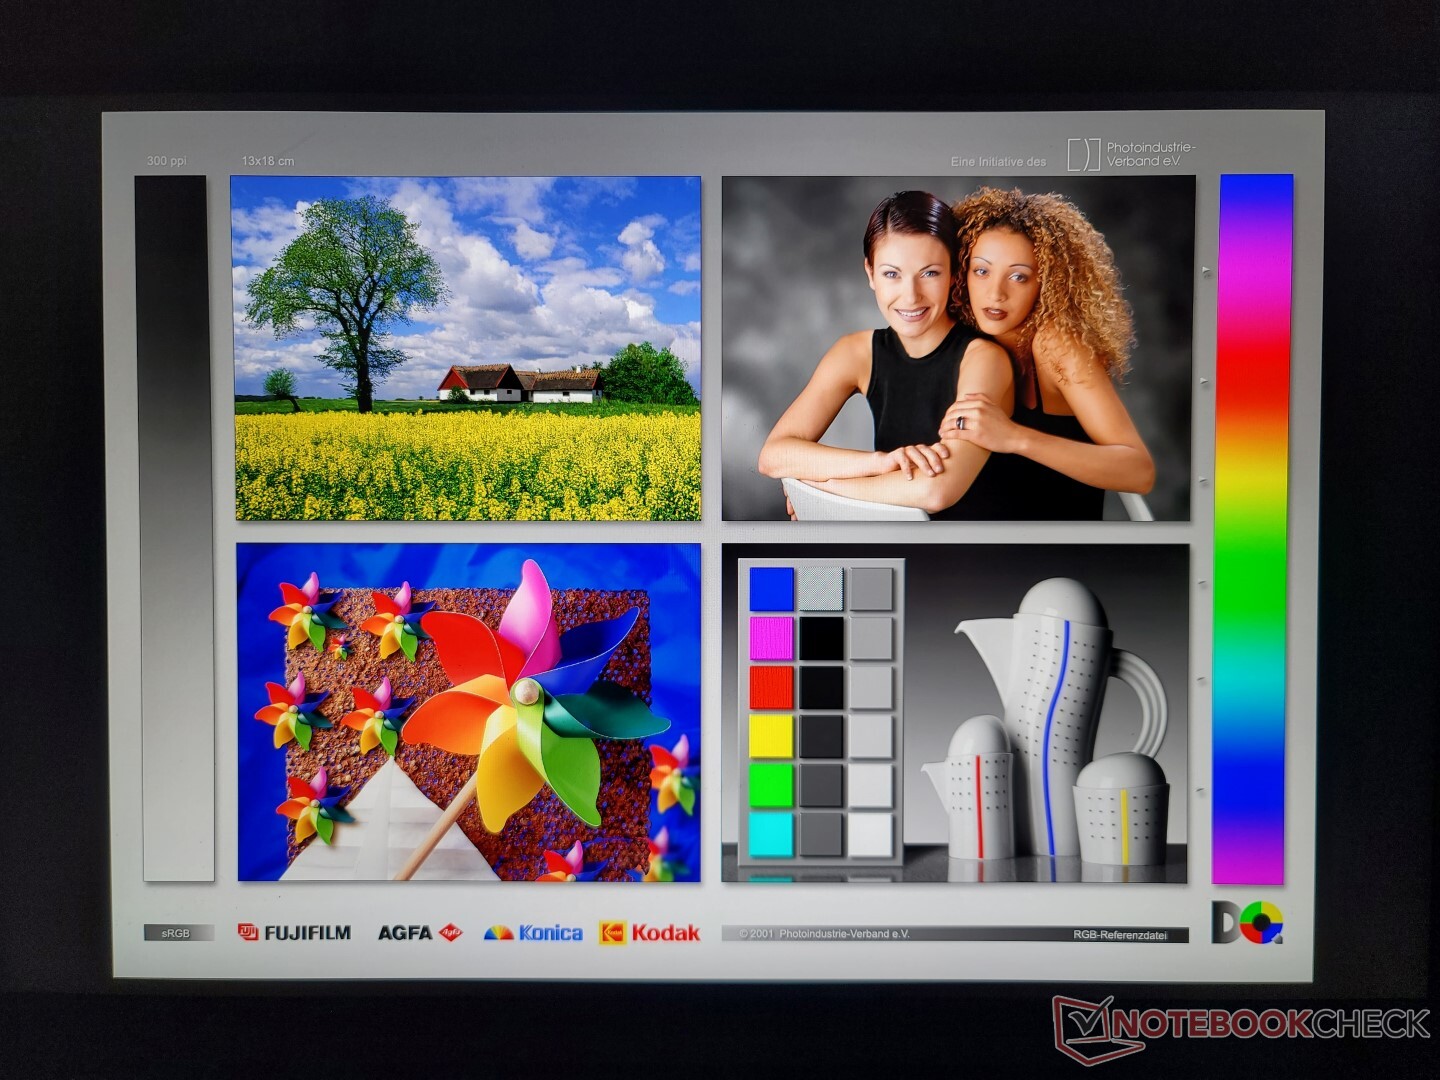
Display - endast ett alternativ
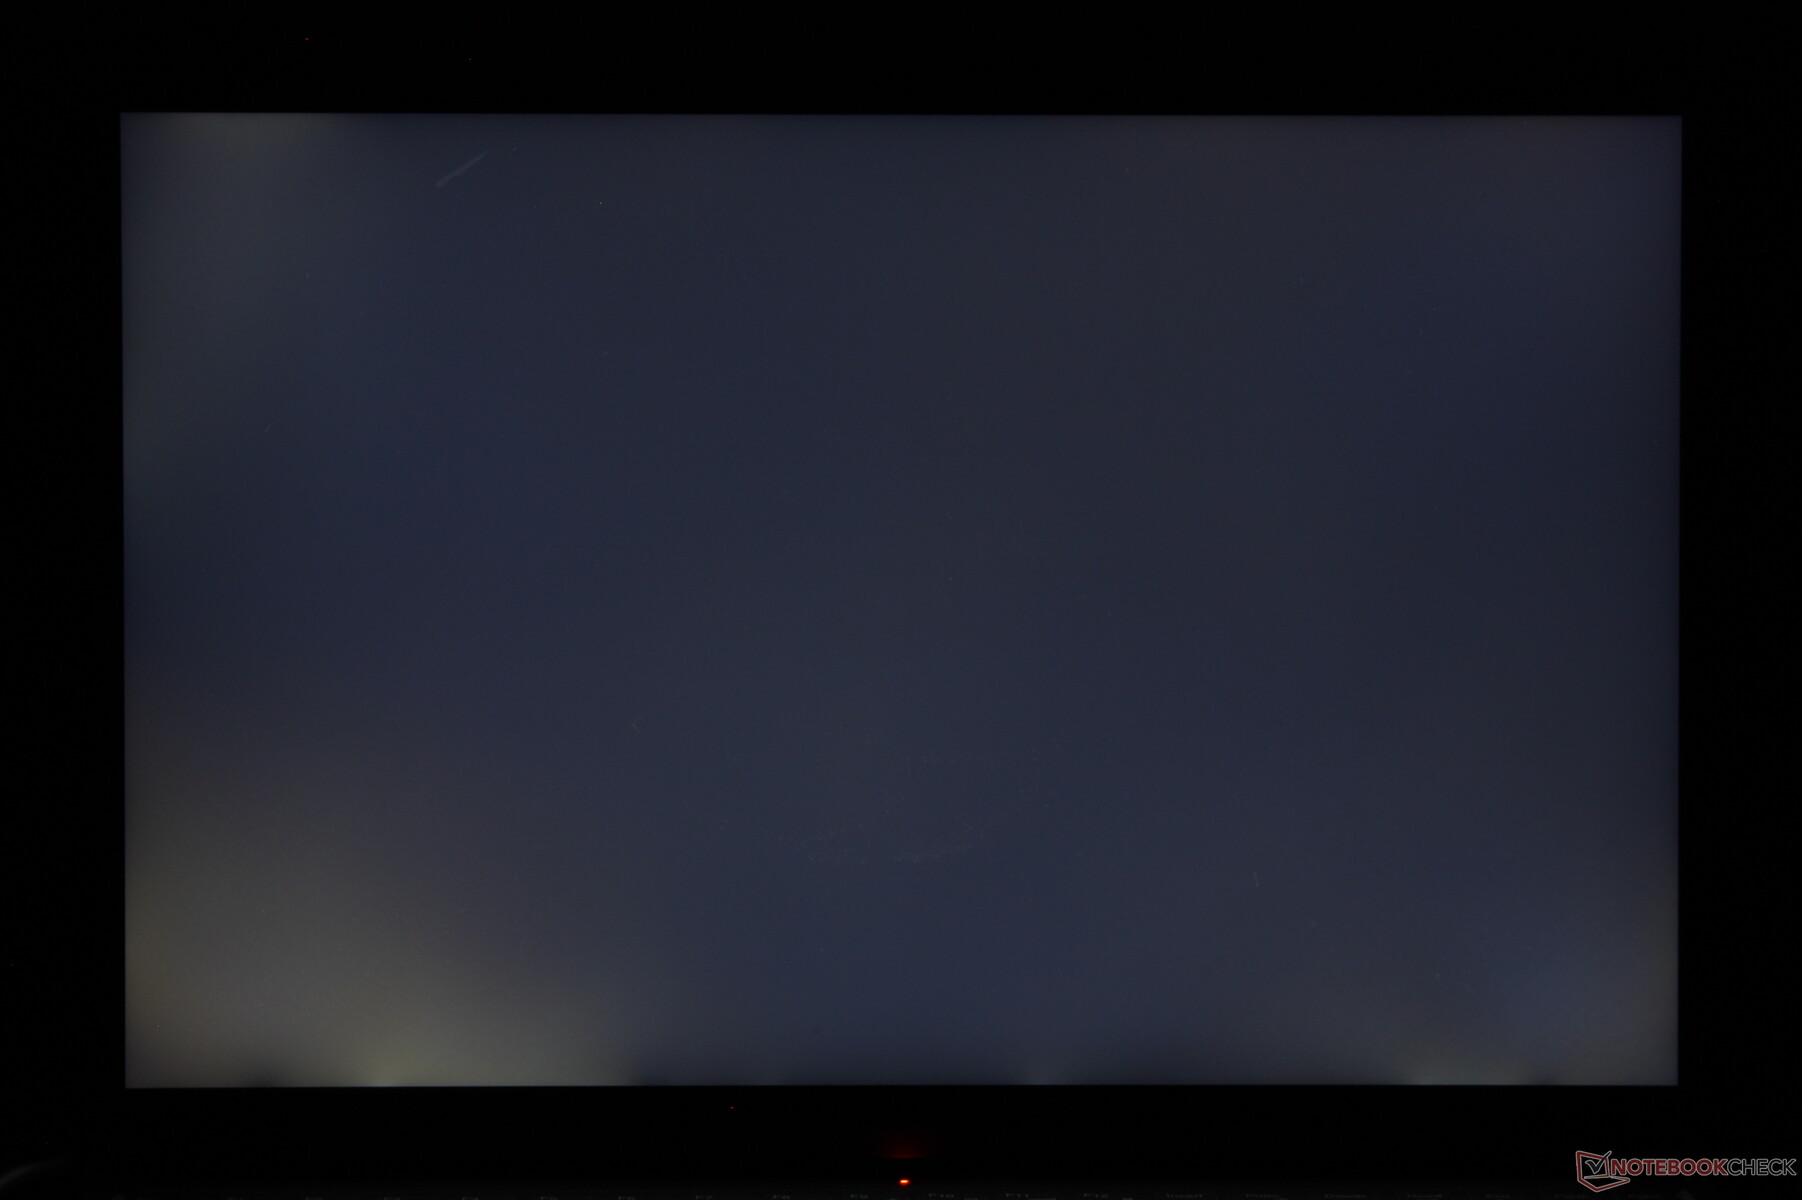
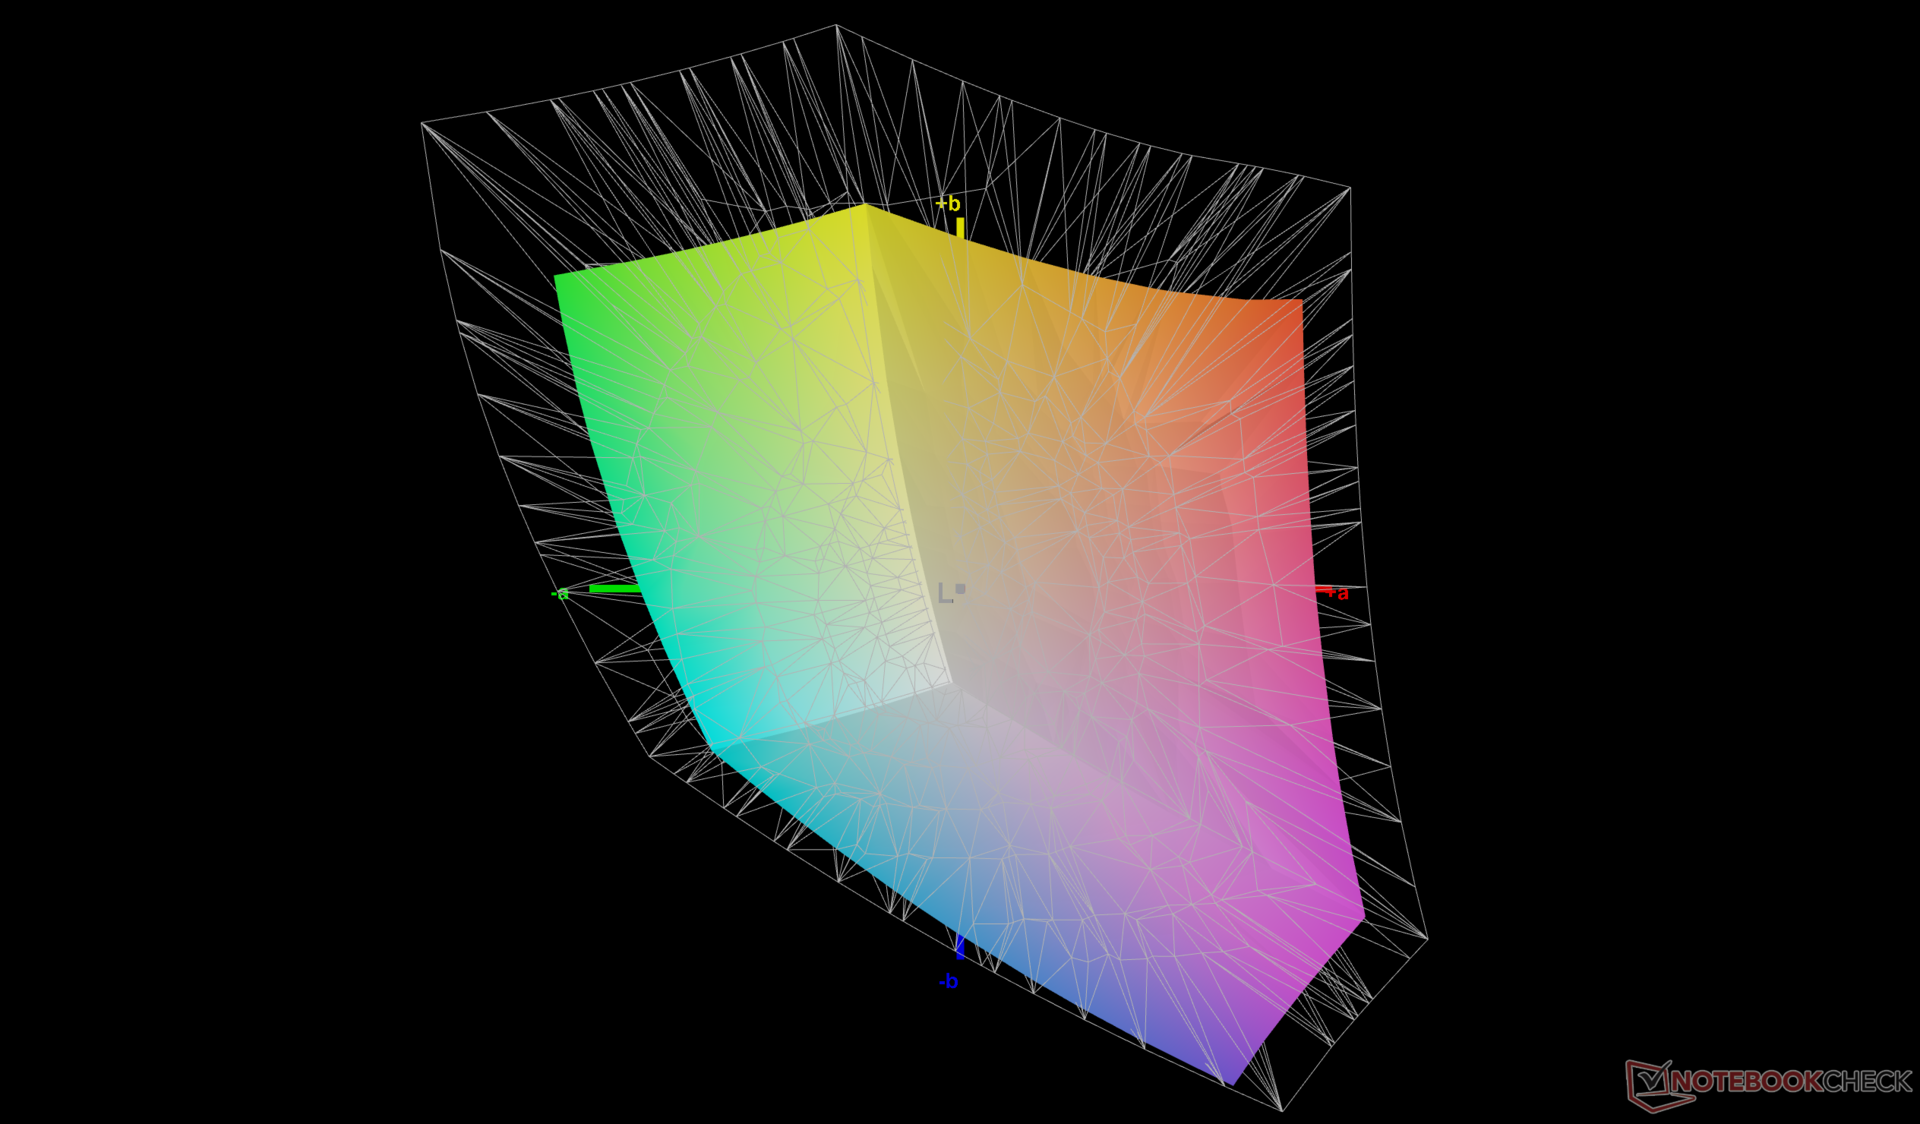
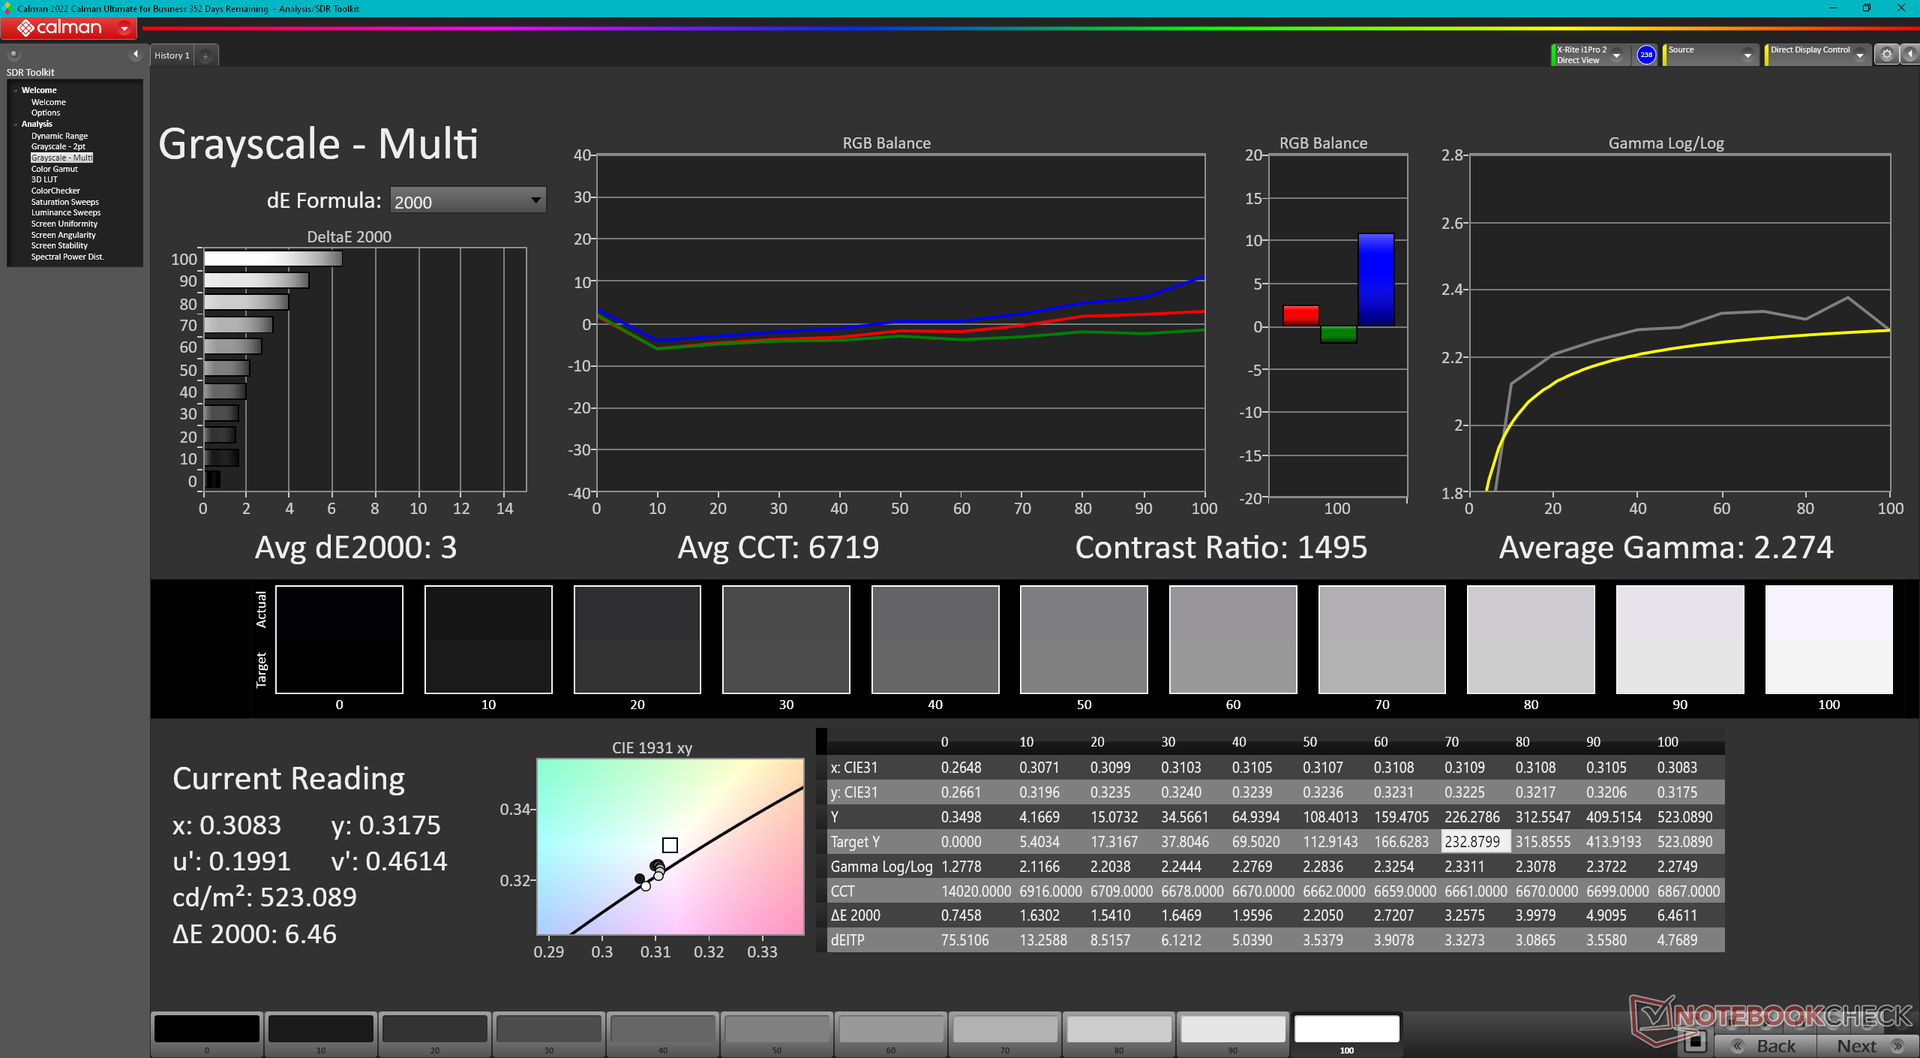
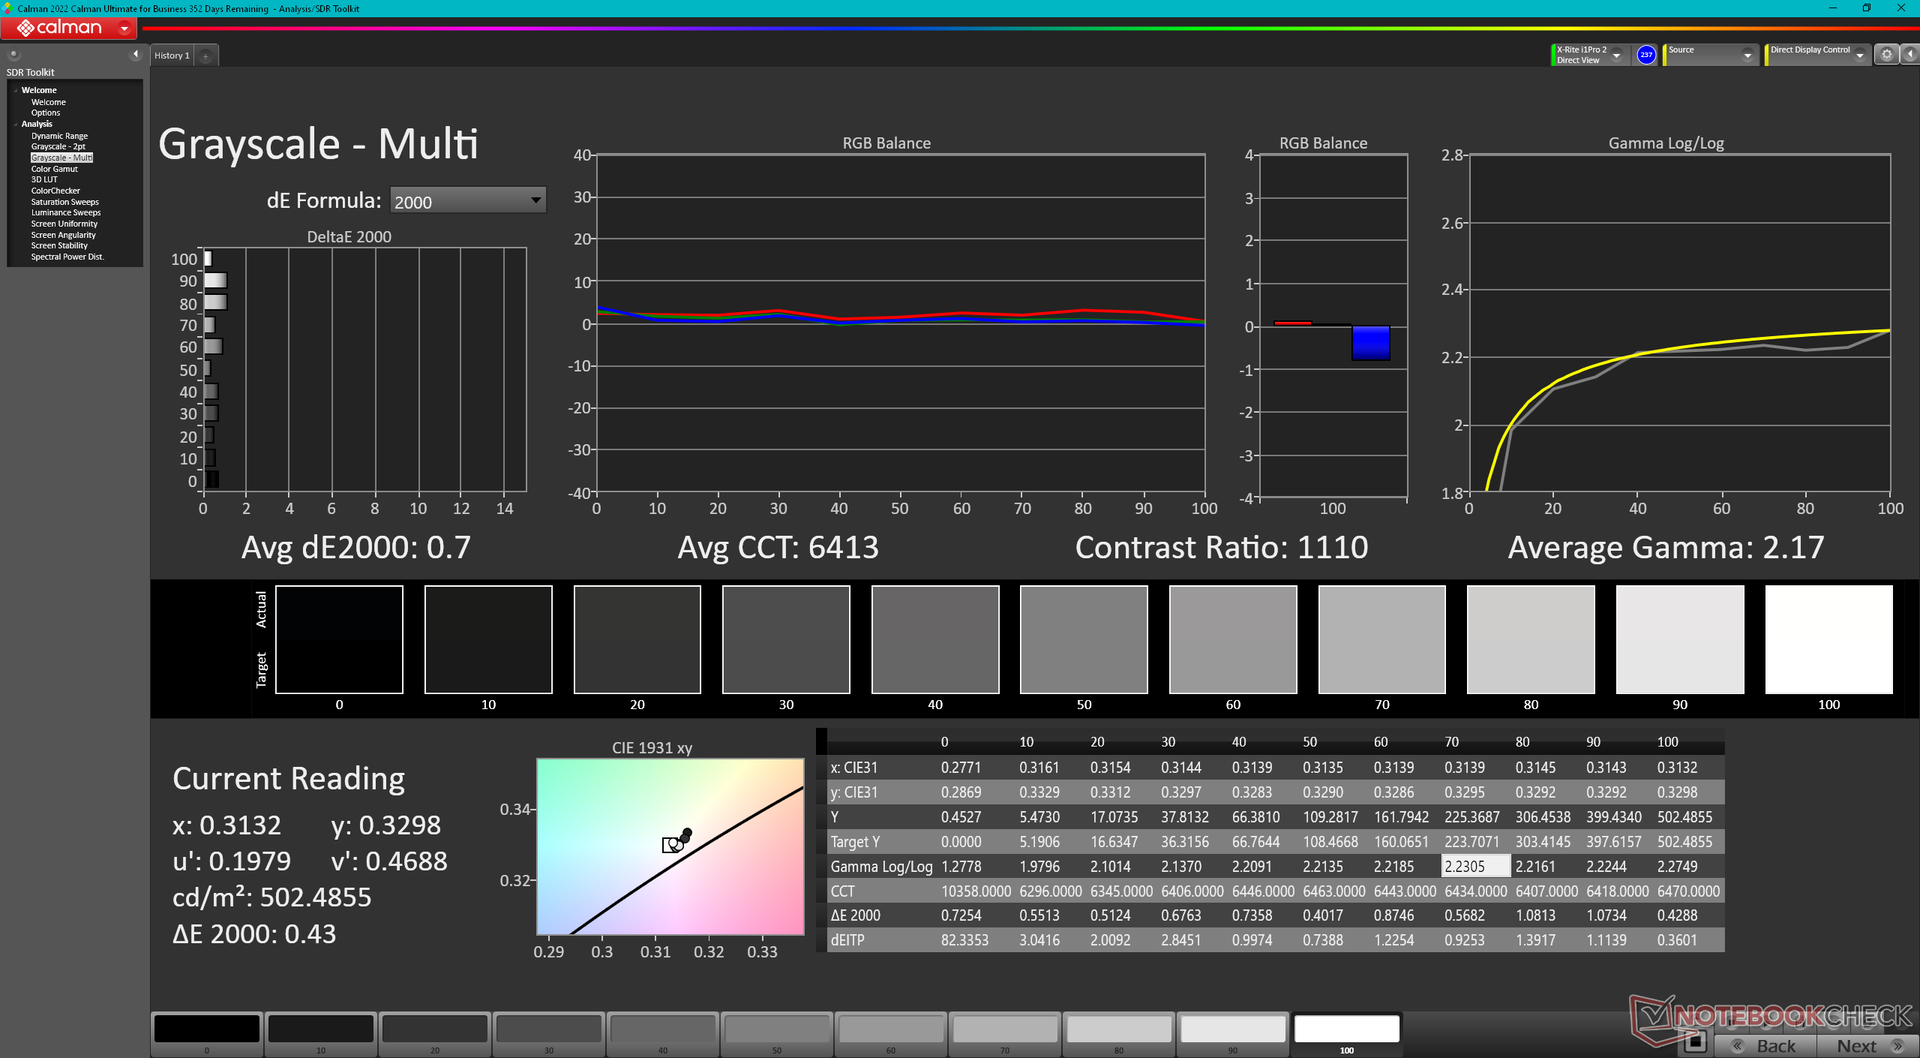
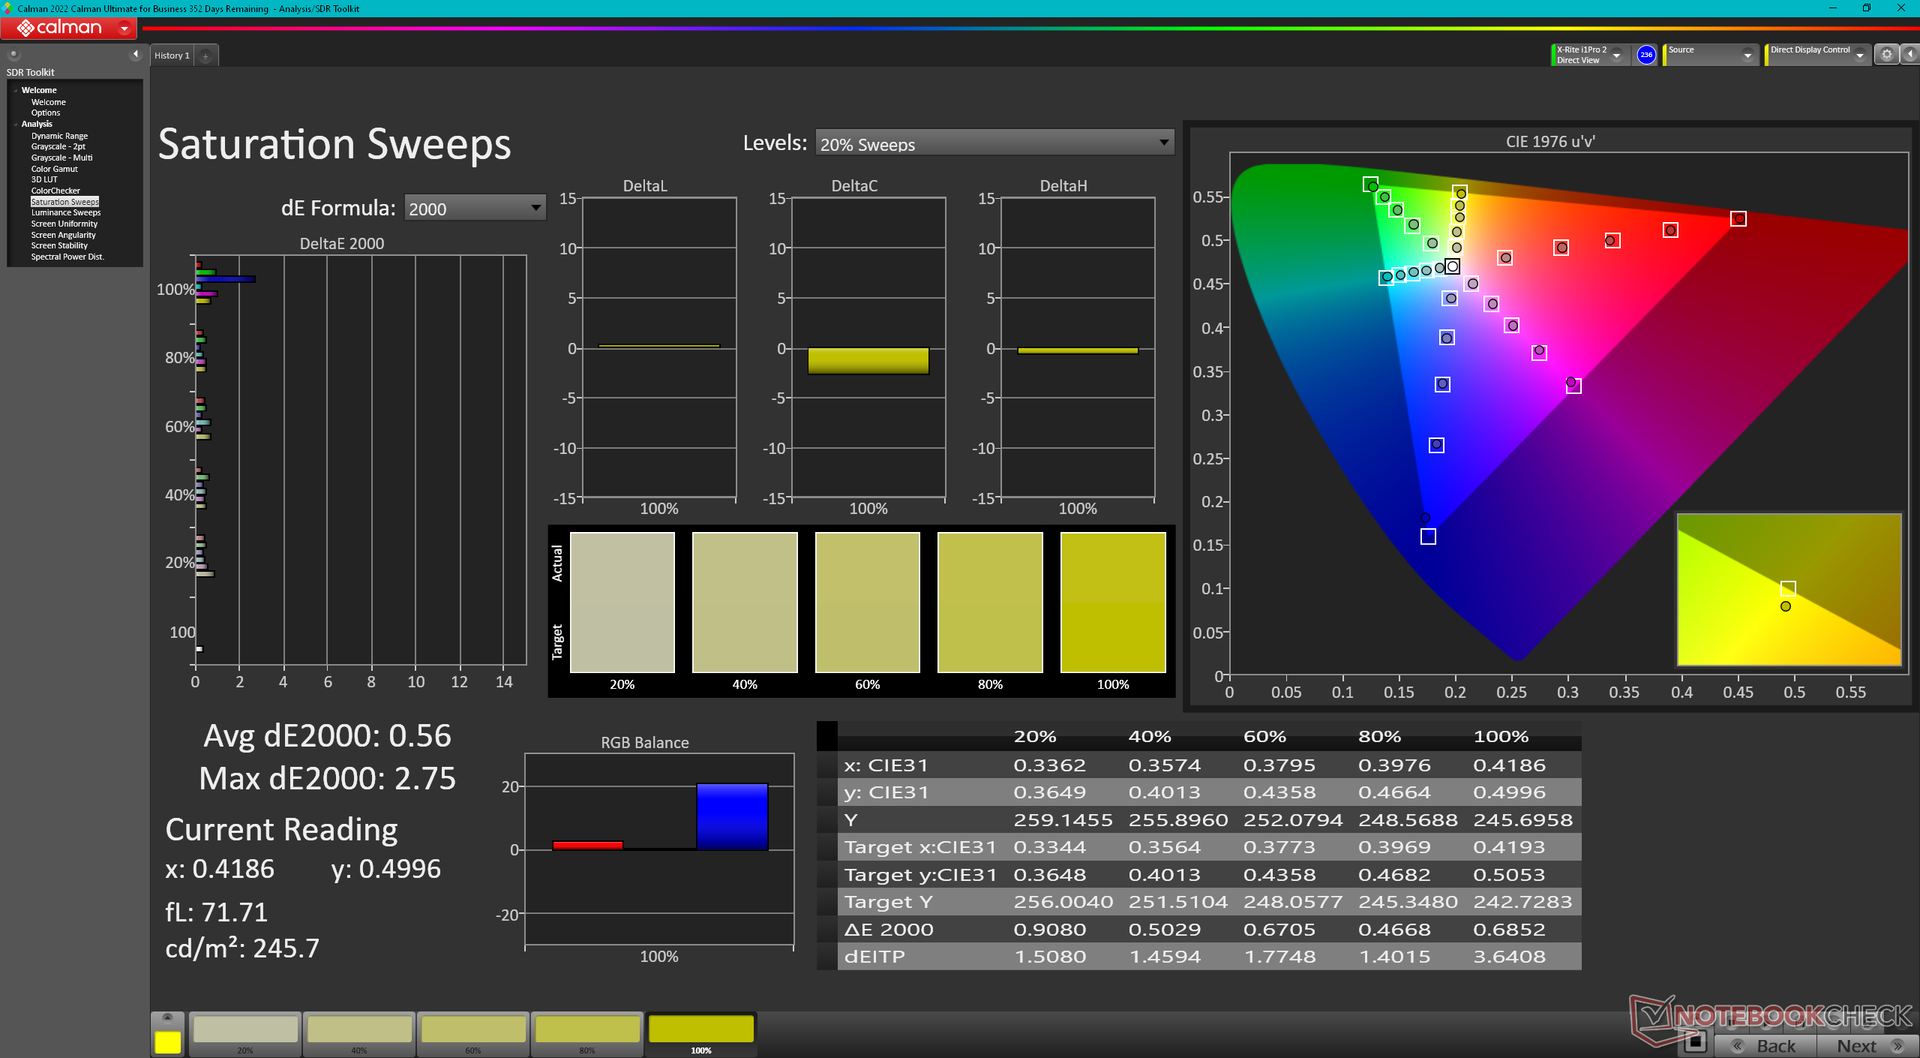
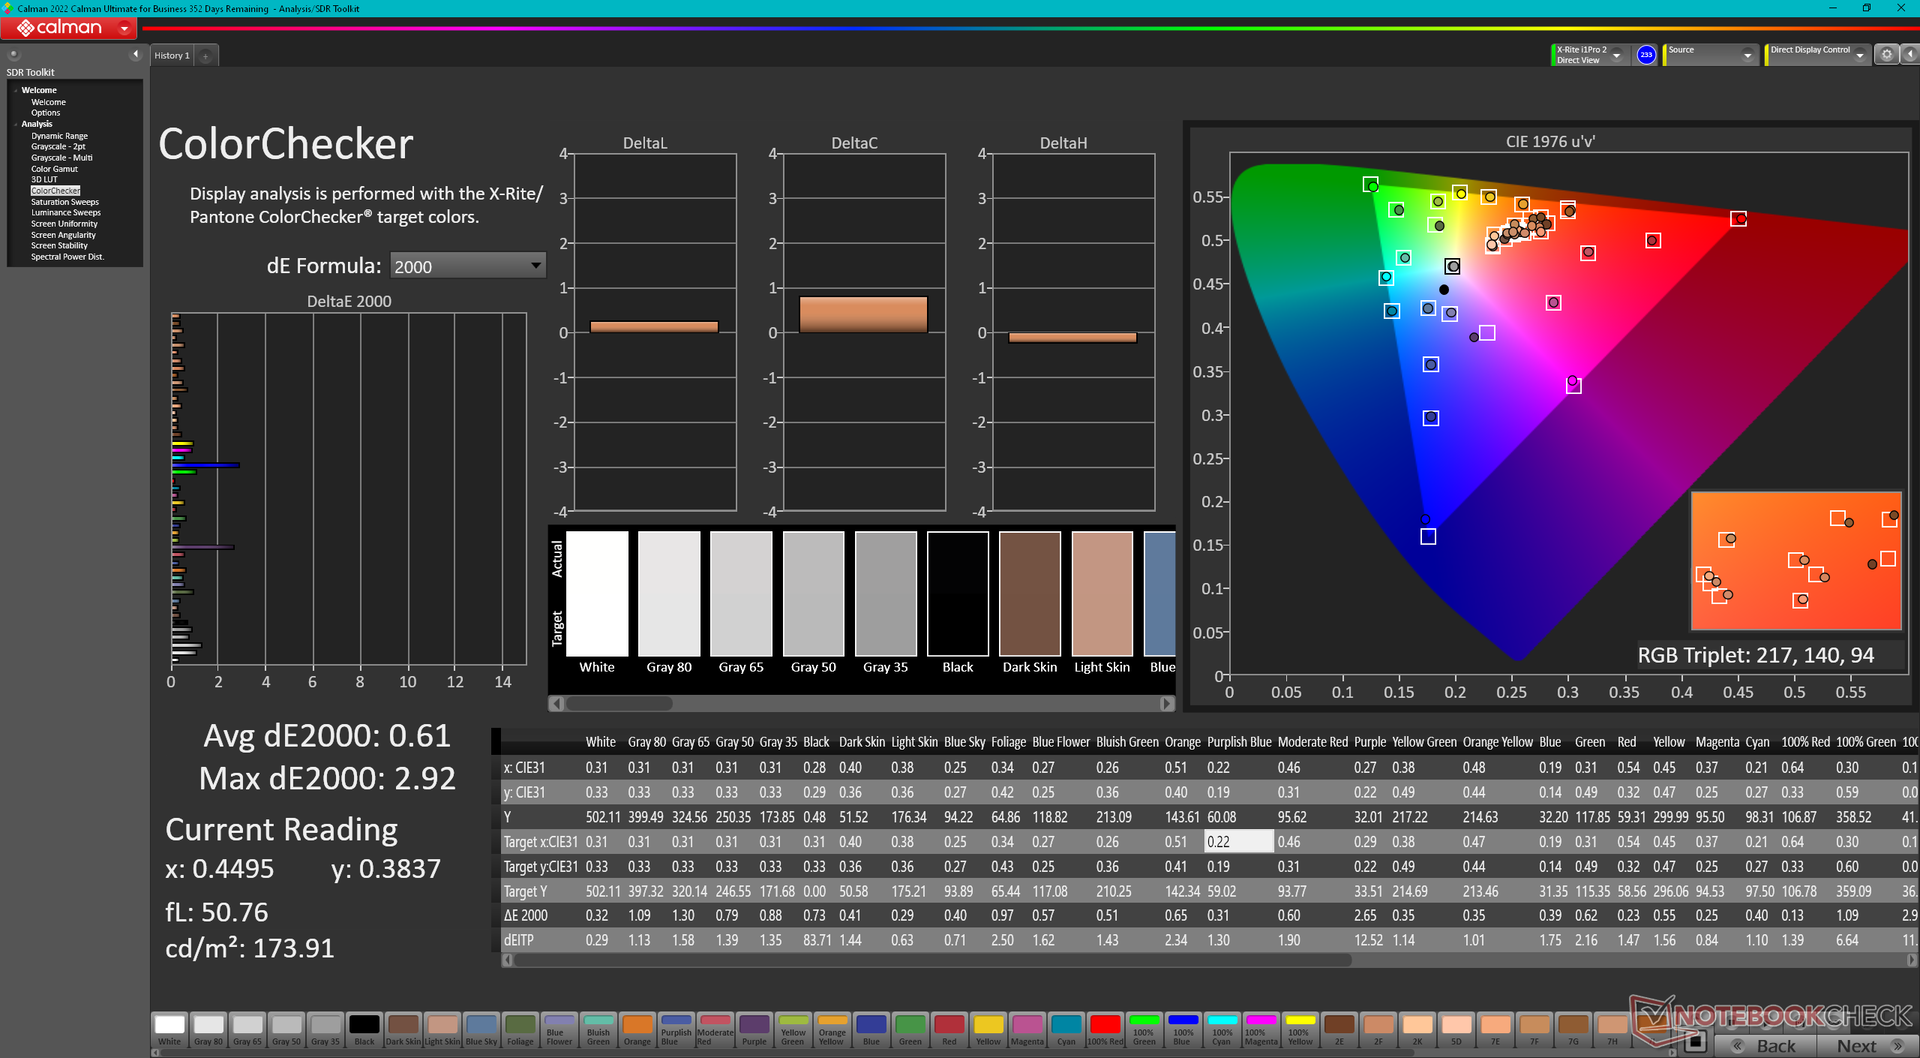
Lenovo har inte ändrat något på BOE CQ NE160QDM-NY1 IPS-panelen från förra årets Legion 5 Pro 16-modell. Våra mätningar nedan visar liknande attribut över hela linjen, inklusive full sRGB-täckning, snabba svarstider för svartvitt, kontrastförhållande på ~1000:1 och en ljusstark bakgrundsbelysning på 500 nit.
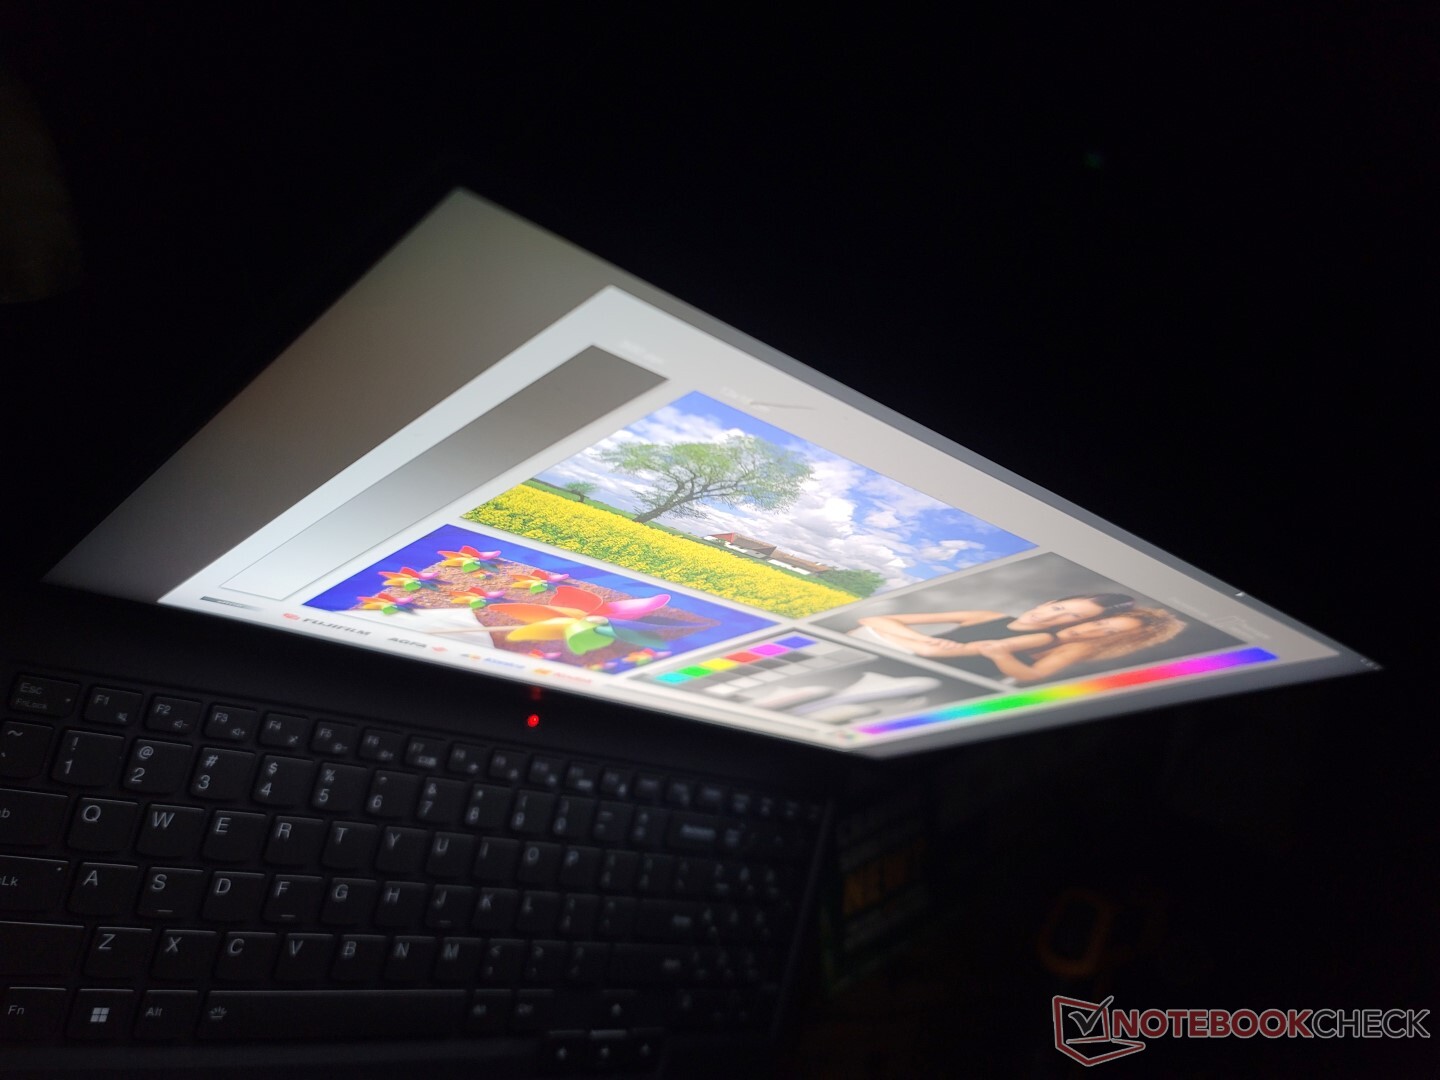
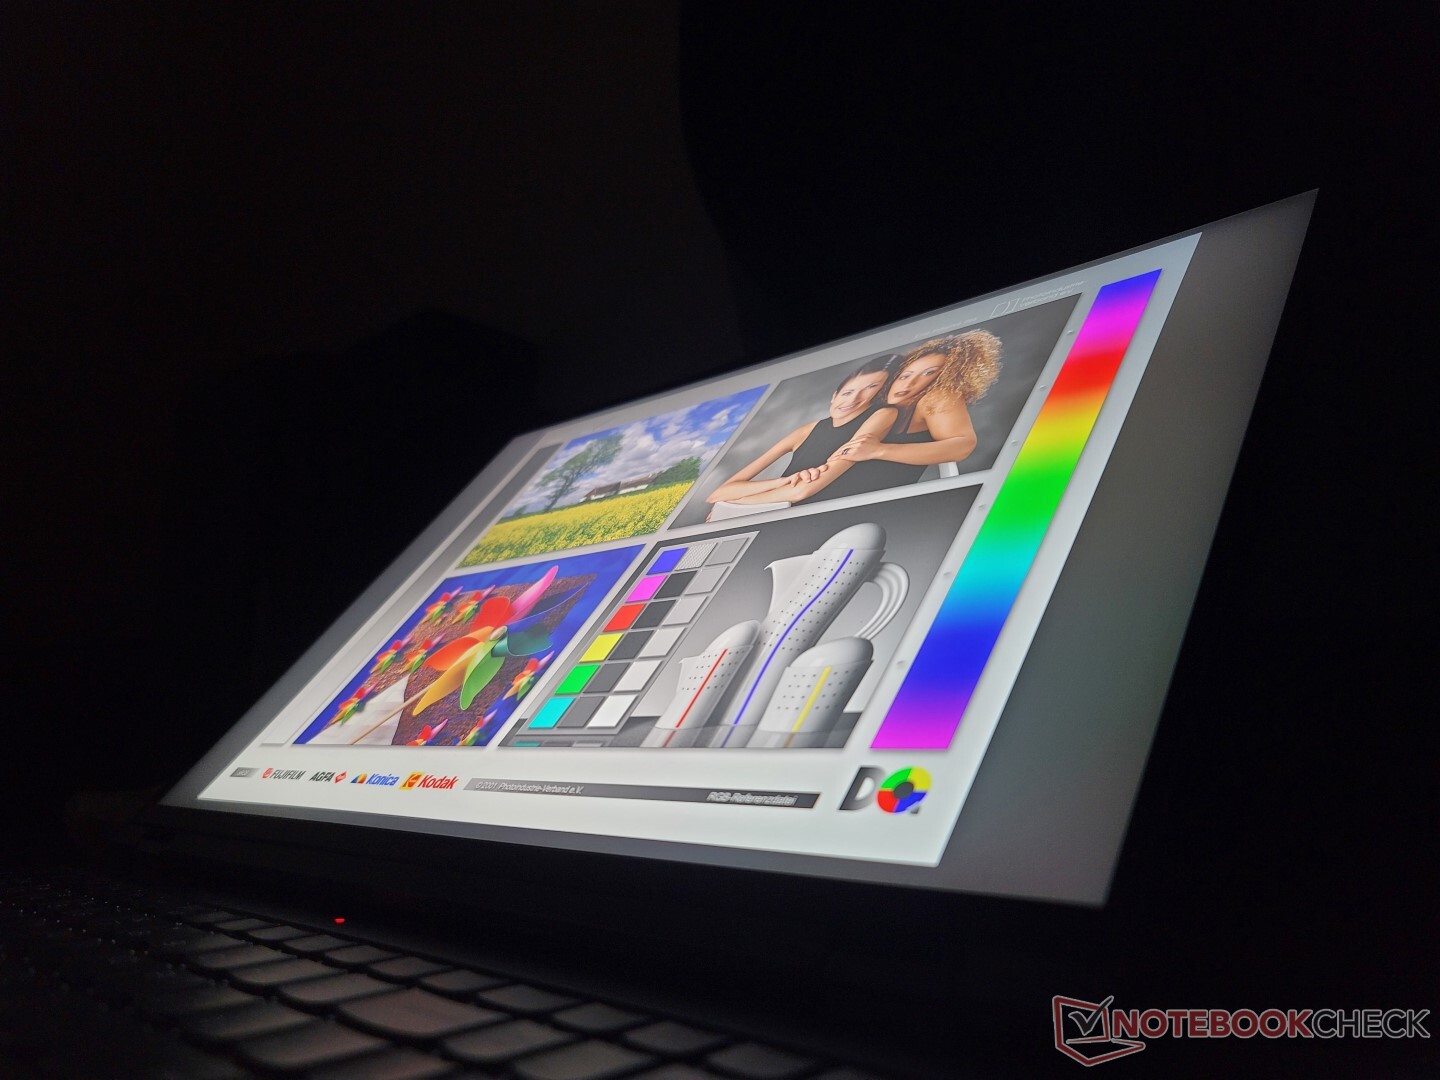
Ändå lider vår specifika enhet av måttligt kraftig bakgrundsbelysningsblödning, vilket visas på vår bild nedan. En viss ojämn ljusblödning är förväntad från de flesta IPS-paneler, men den här intensiteten är särskilt upprörande att se på en spelmaskin i den högre prisklassen som Legion 5 Pro 16.

| |||||||||||||||||||||||||
Distribution av ljusstyrkan: 84 %
Mitt på batteriet: 522.8 cd/m²
Kontrast: 1275:1 (Svärta: 0.41 cd/m²)
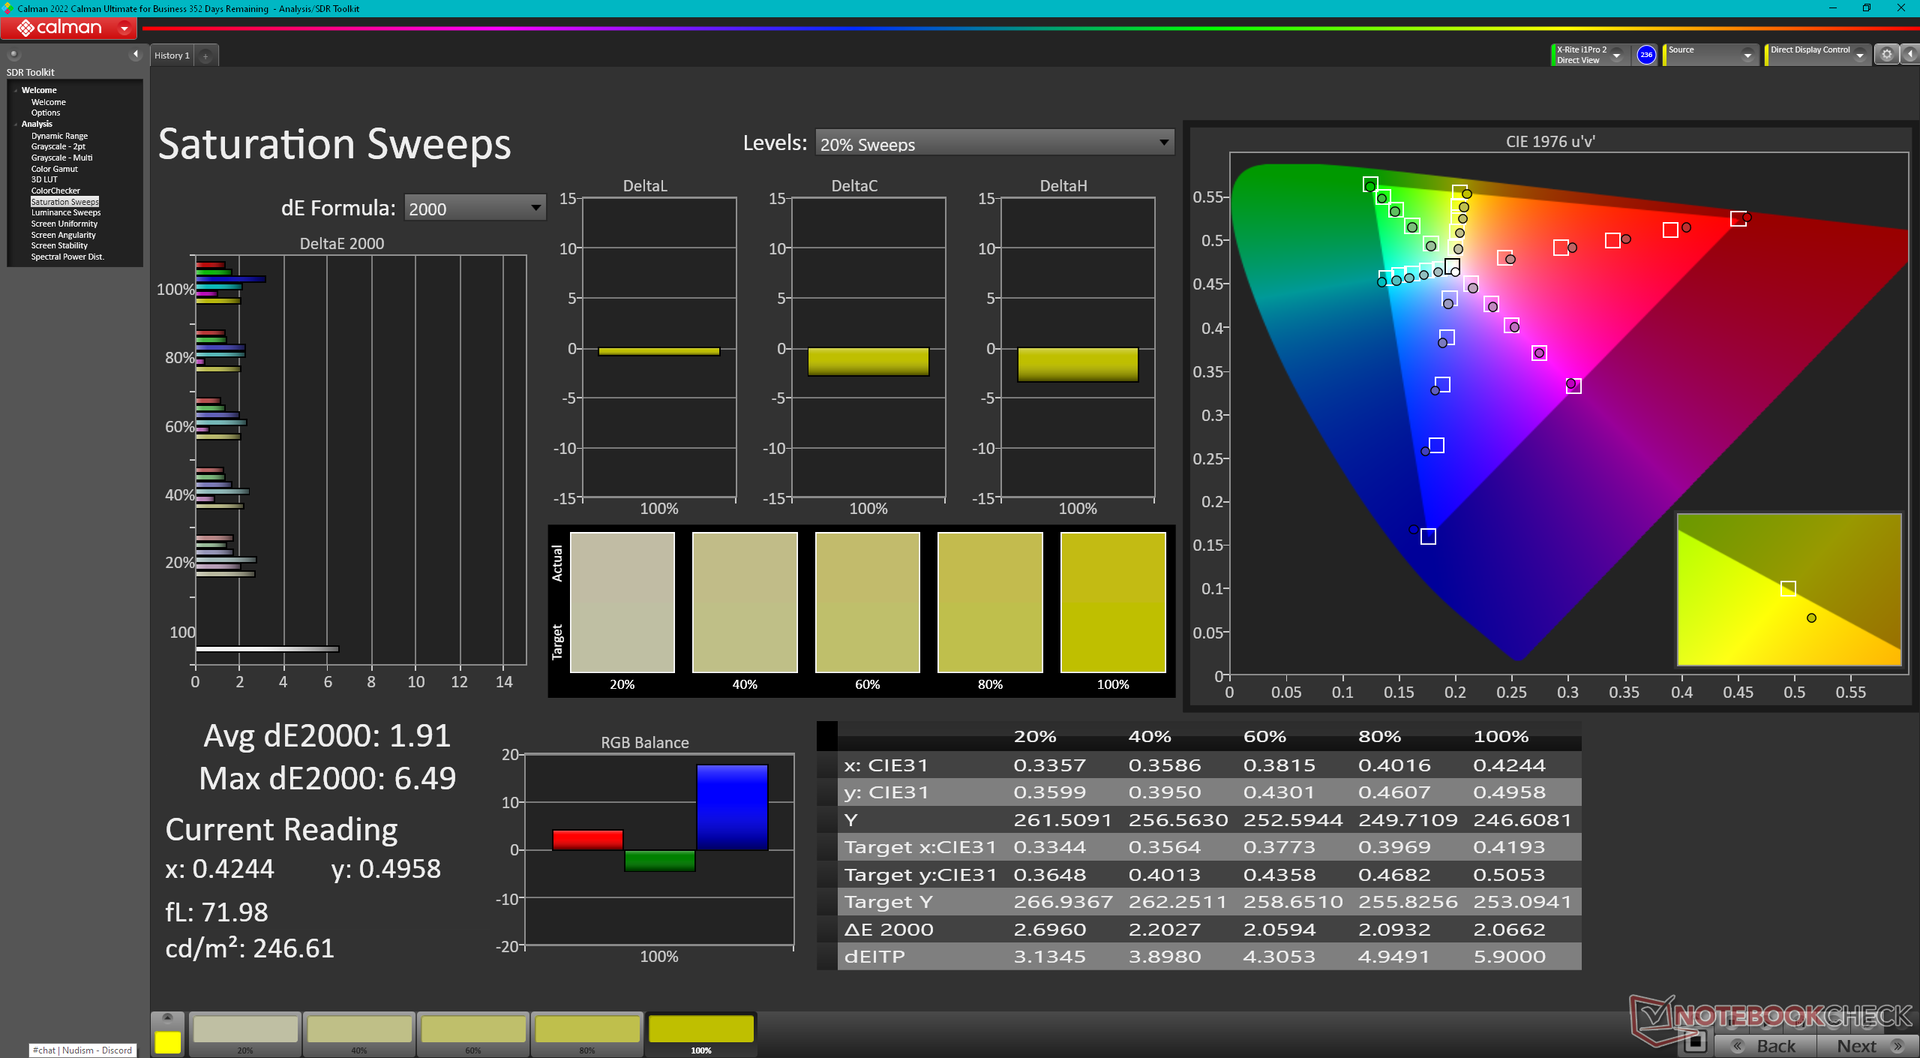
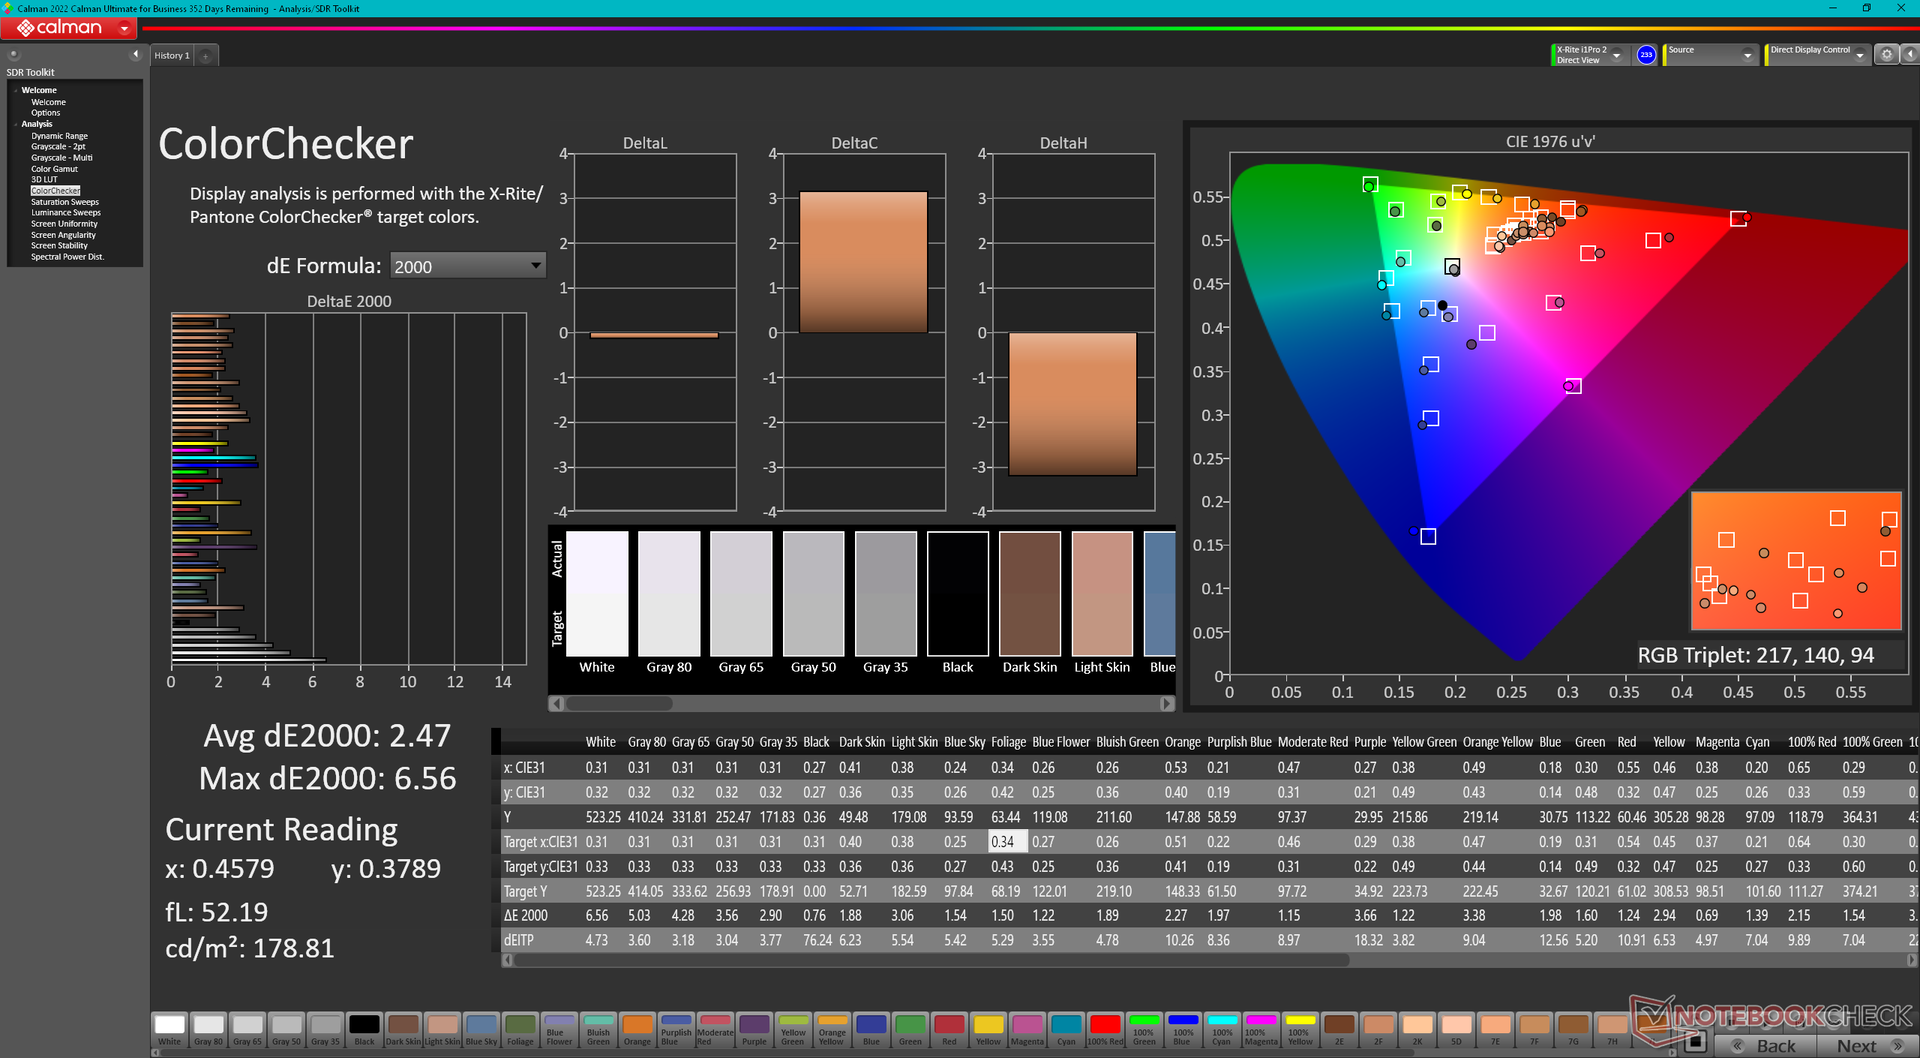
ΔE ColorChecker Calman: 2.47 | ∀{0.5-29.43 Ø4.71}
calibrated: 0.61
ΔE Greyscale Calman: 3 | ∀{0.09-98 Ø4.96}
69.5% AdobeRGB 1998 (Argyll 3D)
96.1% sRGB (Argyll 3D)
67.3% Display P3 (Argyll 3D)
Gamma: 2.27
CCT: 6719 K
| Lenovo Legion 5 Pro 16ARH7H RTX 3070 Ti BOE CQ NE160QDM-NY1, IPS, 2560x1600, 16" | Lenovo Legion 5 Pro 16IAH7H BOE CCQ_NE160QDM_NY1, IPS, 2560x1600, 16" | Asus ROG Zephyrus M16 GU603H AU Optronics AUOC199, IPS, 2560x1600, 16" | Lenovo Legion 7 16ARHA7 BOE CQ NE160QDM-NY1, IPS, 2560x1600, 16" | HP Victus 16-e0145ng CMN1609, IPS, 1920x1080, 16.1" | Dell G16 7620 BOE NE16QDM, IPS, 2560x1600, 16" | |
|---|---|---|---|---|---|---|
| Display | 2% | -4% | -37% | 1% | ||
| Display P3 Coverage (%) | 67.3 | 68.53 2% | 63.7 -5% | 41.6 -38% | 68.3 1% | |
| sRGB Coverage (%) | 96.1 | 98.38 2% | 95.3 -1% | 61.9 -36% | 98 2% | |
| AdobeRGB 1998 Coverage (%) | 69.5 | 70.45 1% | 65.7 -5% | 43 -38% | 70.5 1% | |
| Response Times | 25% | 57% | 25% | -90% | 24% | |
| Response Time Grey 50% / Grey 80% * (ms) | 14.4 ? | 14 ? 3% | 4.8 ? 67% | 9.2 ? 36% | 29.6 ? -106% | 8.6 ? 40% |
| Response Time Black / White * (ms) | 11.2 ? | 6 ? 46% | 6 ? 46% | 9.6 ? 14% | 19.4 ? -73% | 10.4 ? 7% |
| PWM Frequency (Hz) | ||||||
| Screen | -7% | -51% | -19% | -127% | -10% | |
| Brightness middle (cd/m²) | 522.8 | 515 -1% | 448 -14% | 478.8 -8% | 257 -51% | 369.4 -29% |
| Brightness (cd/m²) | 503 | 475 -6% | 446 -11% | 477 -5% | 239 -52% | 348 -31% |
| Brightness Distribution (%) | 84 | 85 1% | 86 2% | 90 7% | 88 5% | 83 -1% |
| Black Level * (cd/m²) | 0.41 | 0.45 -10% | 0.48 -17% | 0.43 -5% | 0.25 39% | 0.32 22% |
| Contrast (:1) | 1275 | 1144 -10% | 933 -27% | 1113 -13% | 1028 -19% | 1154 -9% |
| Colorchecker dE 2000 * | 2.47 | 2.38 4% | 2.76 -12% | 2.24 9% | 6.91 -180% | 1.78 28% |
| Colorchecker dE 2000 max. * | 6.56 | 4.37 33% | 7.09 -8% | 4.49 32% | 22.27 -239% | 4.41 33% |
| Colorchecker dE 2000 calibrated * | 0.61 | 1.1 -80% | 2.86 -369% | 1.89 -210% | 3.61 -492% | 1.22 -100% |
| Greyscale dE 2000 * | 3 | 2.71 10% | 3.1 -3% | 2.3 23% | 7.5 -150% | 3.2 -7% |
| Gamma | 2.27 97% | 2.49 88% | 2.153 102% | 2.25 98% | 2.125 104% | 2.2 100% |
| CCT | 6719 97% | 6117 106% | 6826 95% | 6955 93% | 6025 108% | 6750 96% |
| Color Space (Percent of AdobeRGB 1998) (%) | 87 | |||||
| Color Space (Percent of sRGB) (%) | 100 | |||||
| Totalt genomsnitt (program/inställningar) | 7% /
-0% | 3% /
-31% | 1% /
-9% | -85% /
-102% | 5% /
-3% |
* ... mindre är bättre
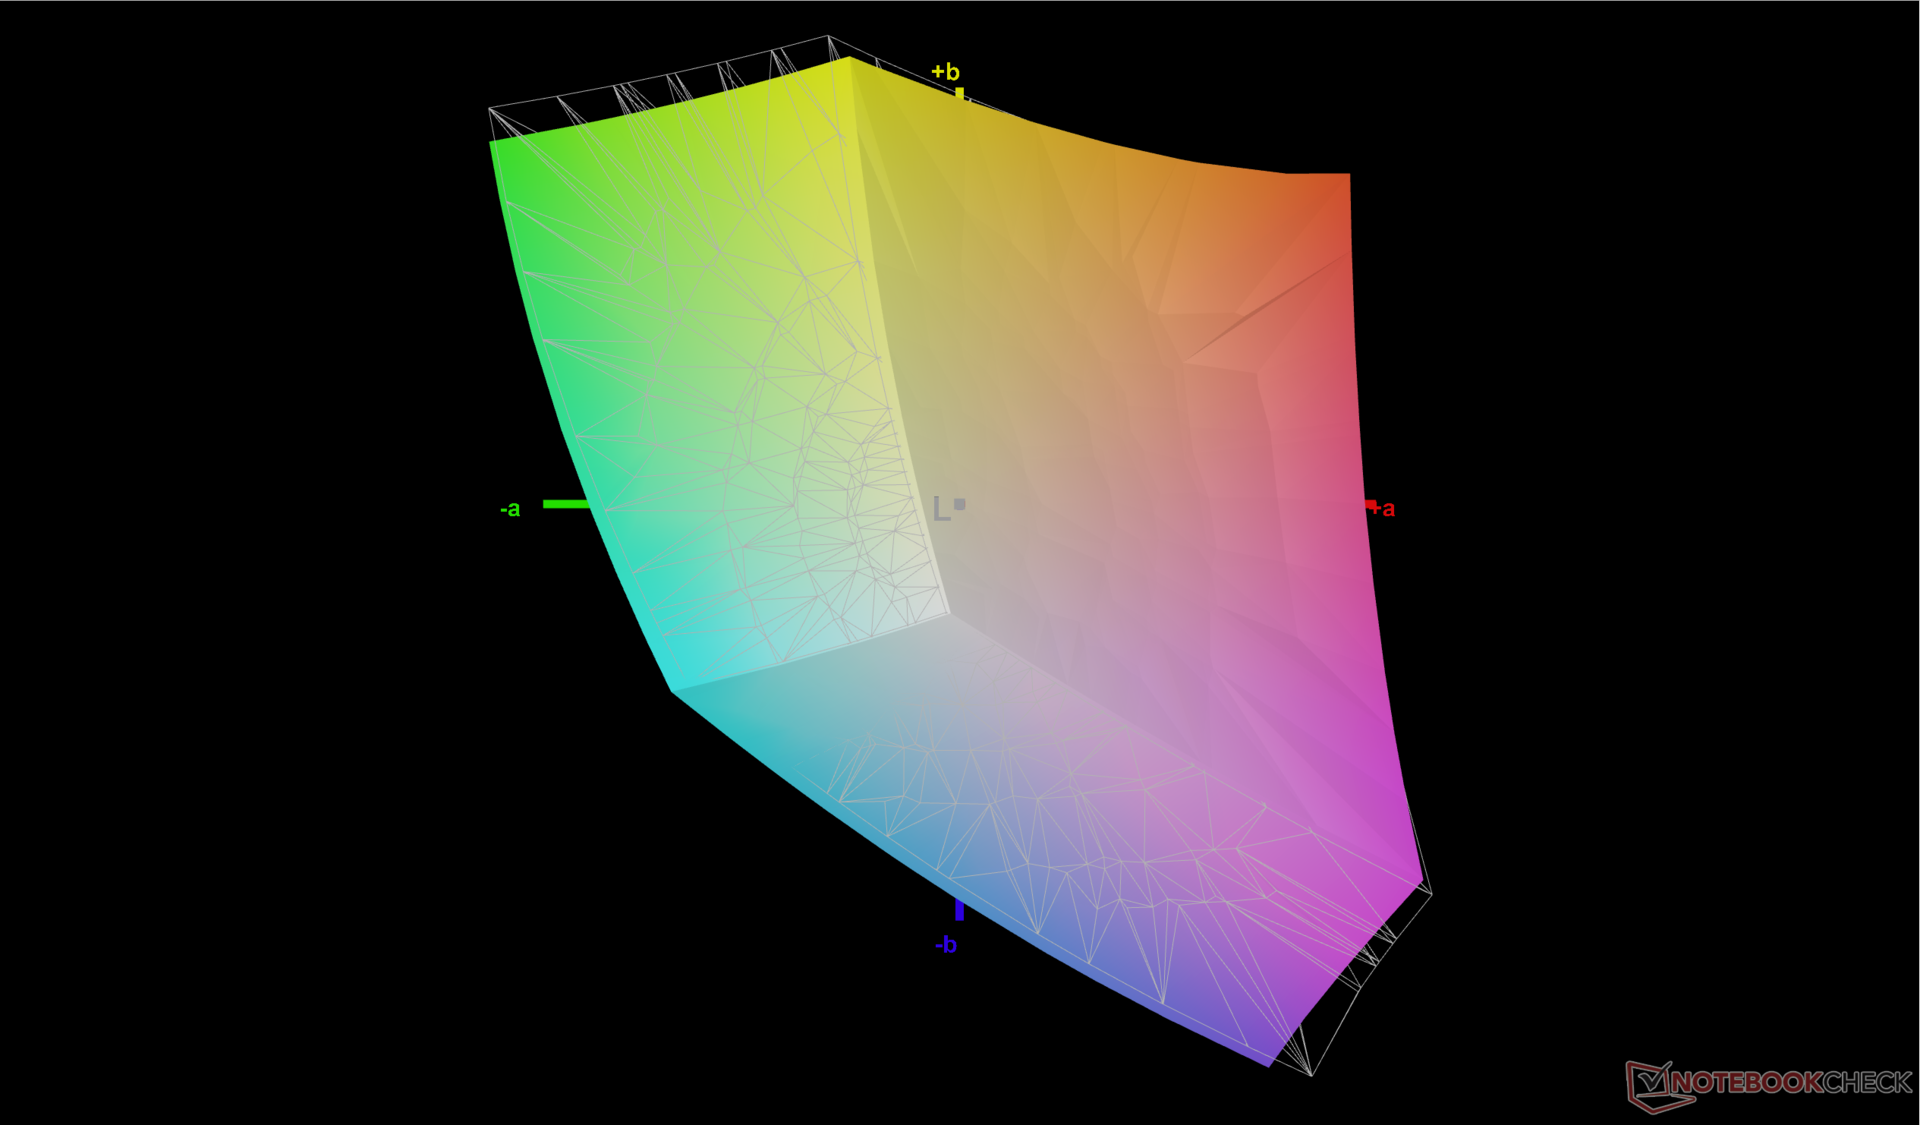
Skärmen levereras förkalibrerad med genomsnittliga deltaE-värden för gråskala och färg på bara 3 respektive 2,47 på vår specifika enhet. Om vi kalibrerar panelen själva med en X-Rite-kolorimeter skulle deltaE-värdena förbättras ytterligare till endast 0,7 och 0,6. Vi rekommenderar att du tillämpar vår kalibrerade ICM-profil ovan för att bättre utnyttja skärmens fulla sRGB-täckning.
Visa svarstider
| ↔ Svarstid svart till vitt | ||
|---|---|---|
| 11.2 ms ... stiga ↗ och falla ↘ kombinerat | ↗ 6 ms stiga | 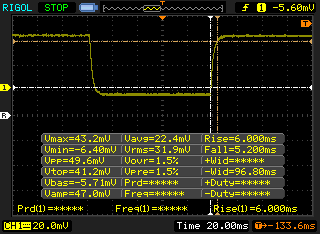 |
| ↘ 5.2 ms hösten | ||
| Skärmen visar bra svarsfrekvens i våra tester, men kan vara för långsam för konkurrenskraftiga spelare. I jämförelse sträcker sig alla testade enheter från 0.1 (minst) till 240 (maximalt) ms. » 30 % av alla enheter är bättre. Det betyder att den uppmätta svarstiden är bättre än genomsnittet av alla testade enheter (19.8 ms). | ||
| ↔ Svarstid 50 % grått till 80 % grått | ||
| 14.4 ms ... stiga ↗ och falla ↘ kombinerat | ↗ 7.6 ms stiga | 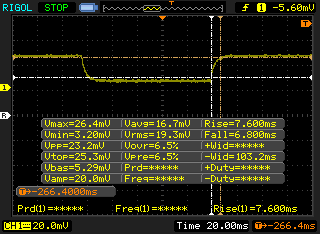 |
| ↘ 6.8 ms hösten | ||
| Skärmen visar bra svarsfrekvens i våra tester, men kan vara för långsam för konkurrenskraftiga spelare. I jämförelse sträcker sig alla testade enheter från 0.165 (minst) till 636 (maximalt) ms. » 29 % av alla enheter är bättre. Det betyder att den uppmätta svarstiden är bättre än genomsnittet av alla testade enheter (30.9 ms). | ||
Skärmflimmer / PWM (Puls-Width Modulation)
| Skärmflimmer / PWM upptäcktes inte | 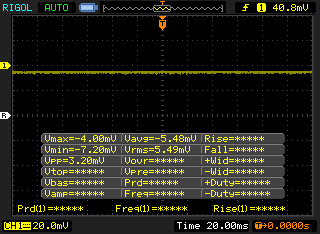 | ||
Som jämförelse: 52 % av alla testade enheter använder inte PWM för att dämpa skärmen. Om PWM upptäcktes mättes ett medelvärde av 7748 (minst: 5 - maximum: 343500) Hz. | |||
Prestanda - Bara lite snabbare
Provningsförhållanden
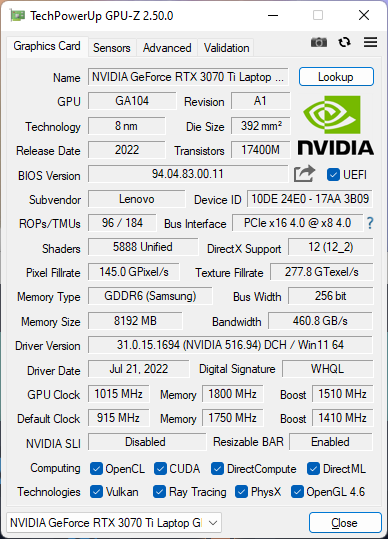
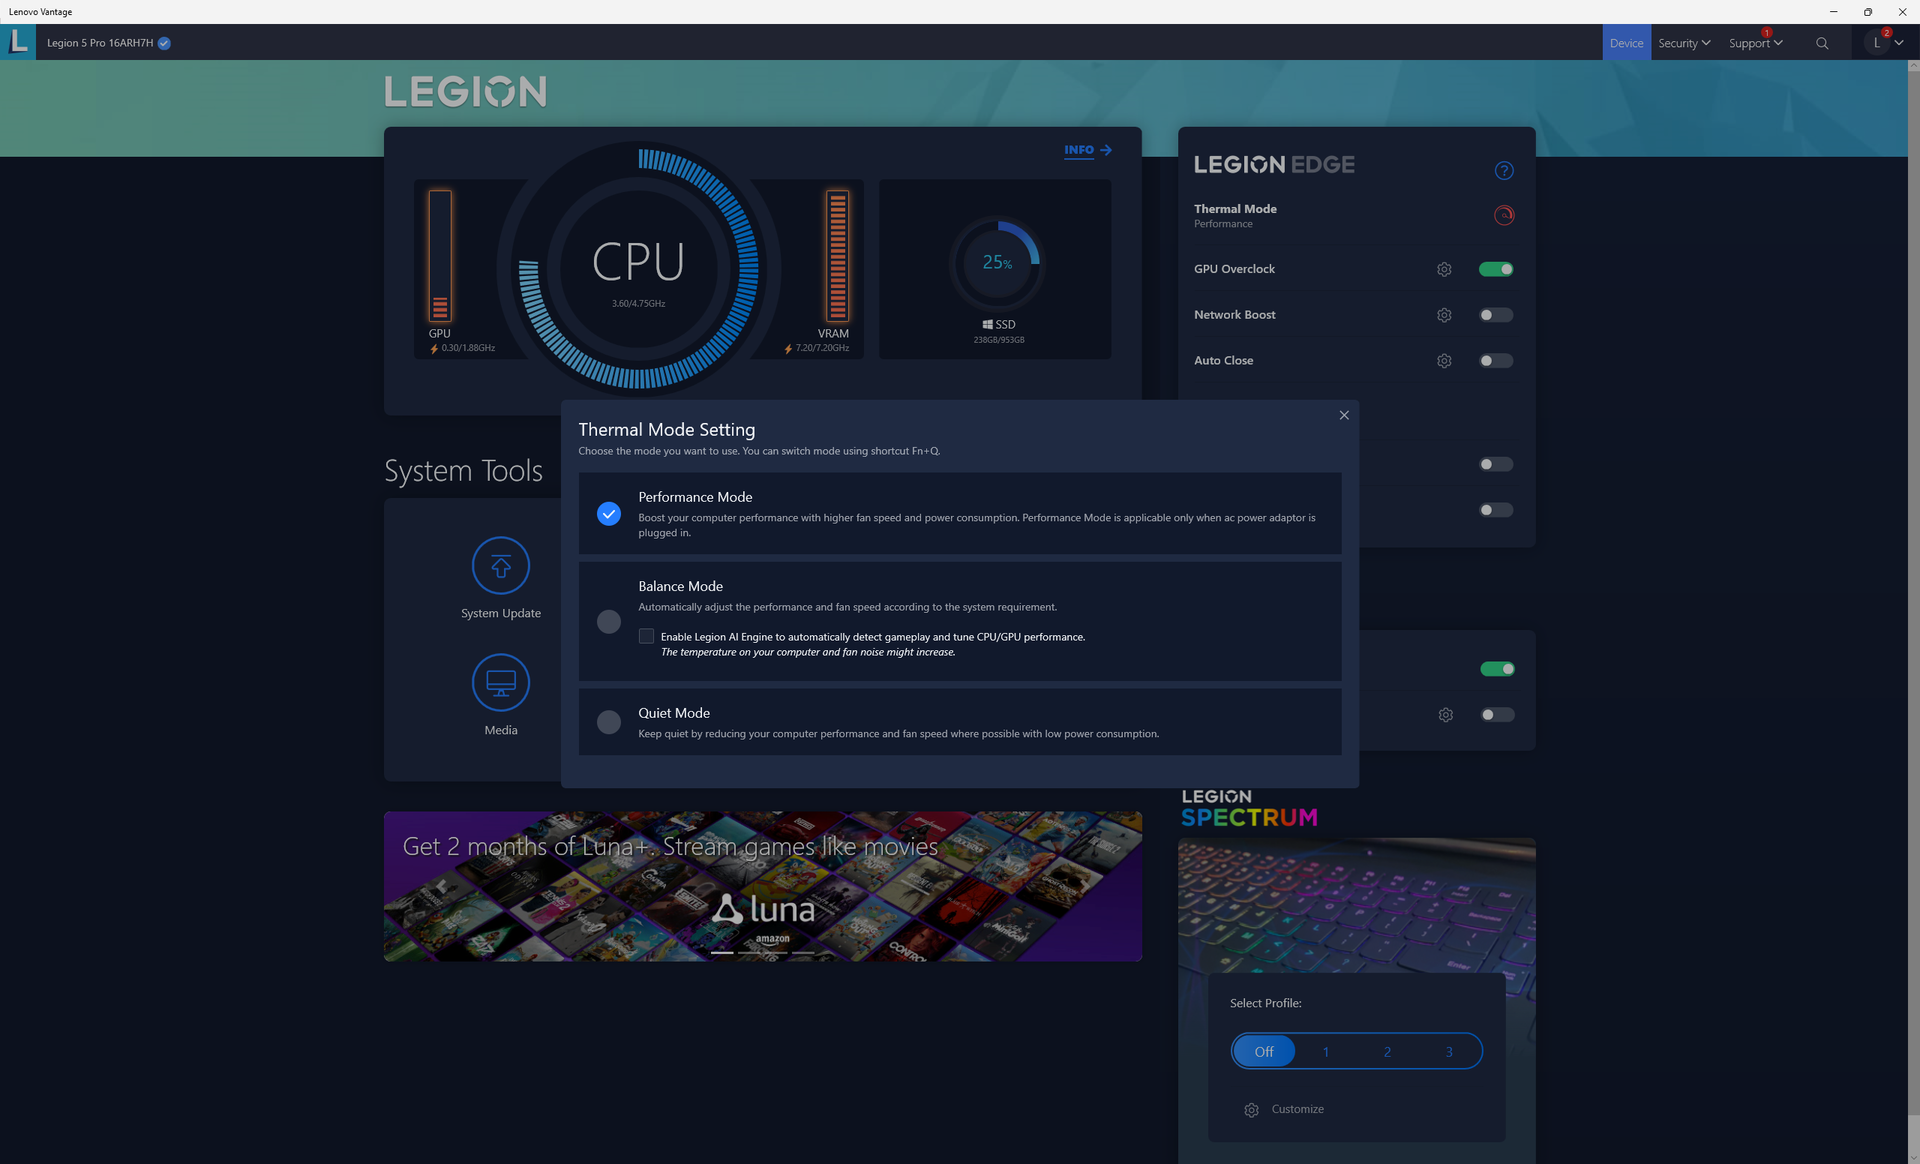
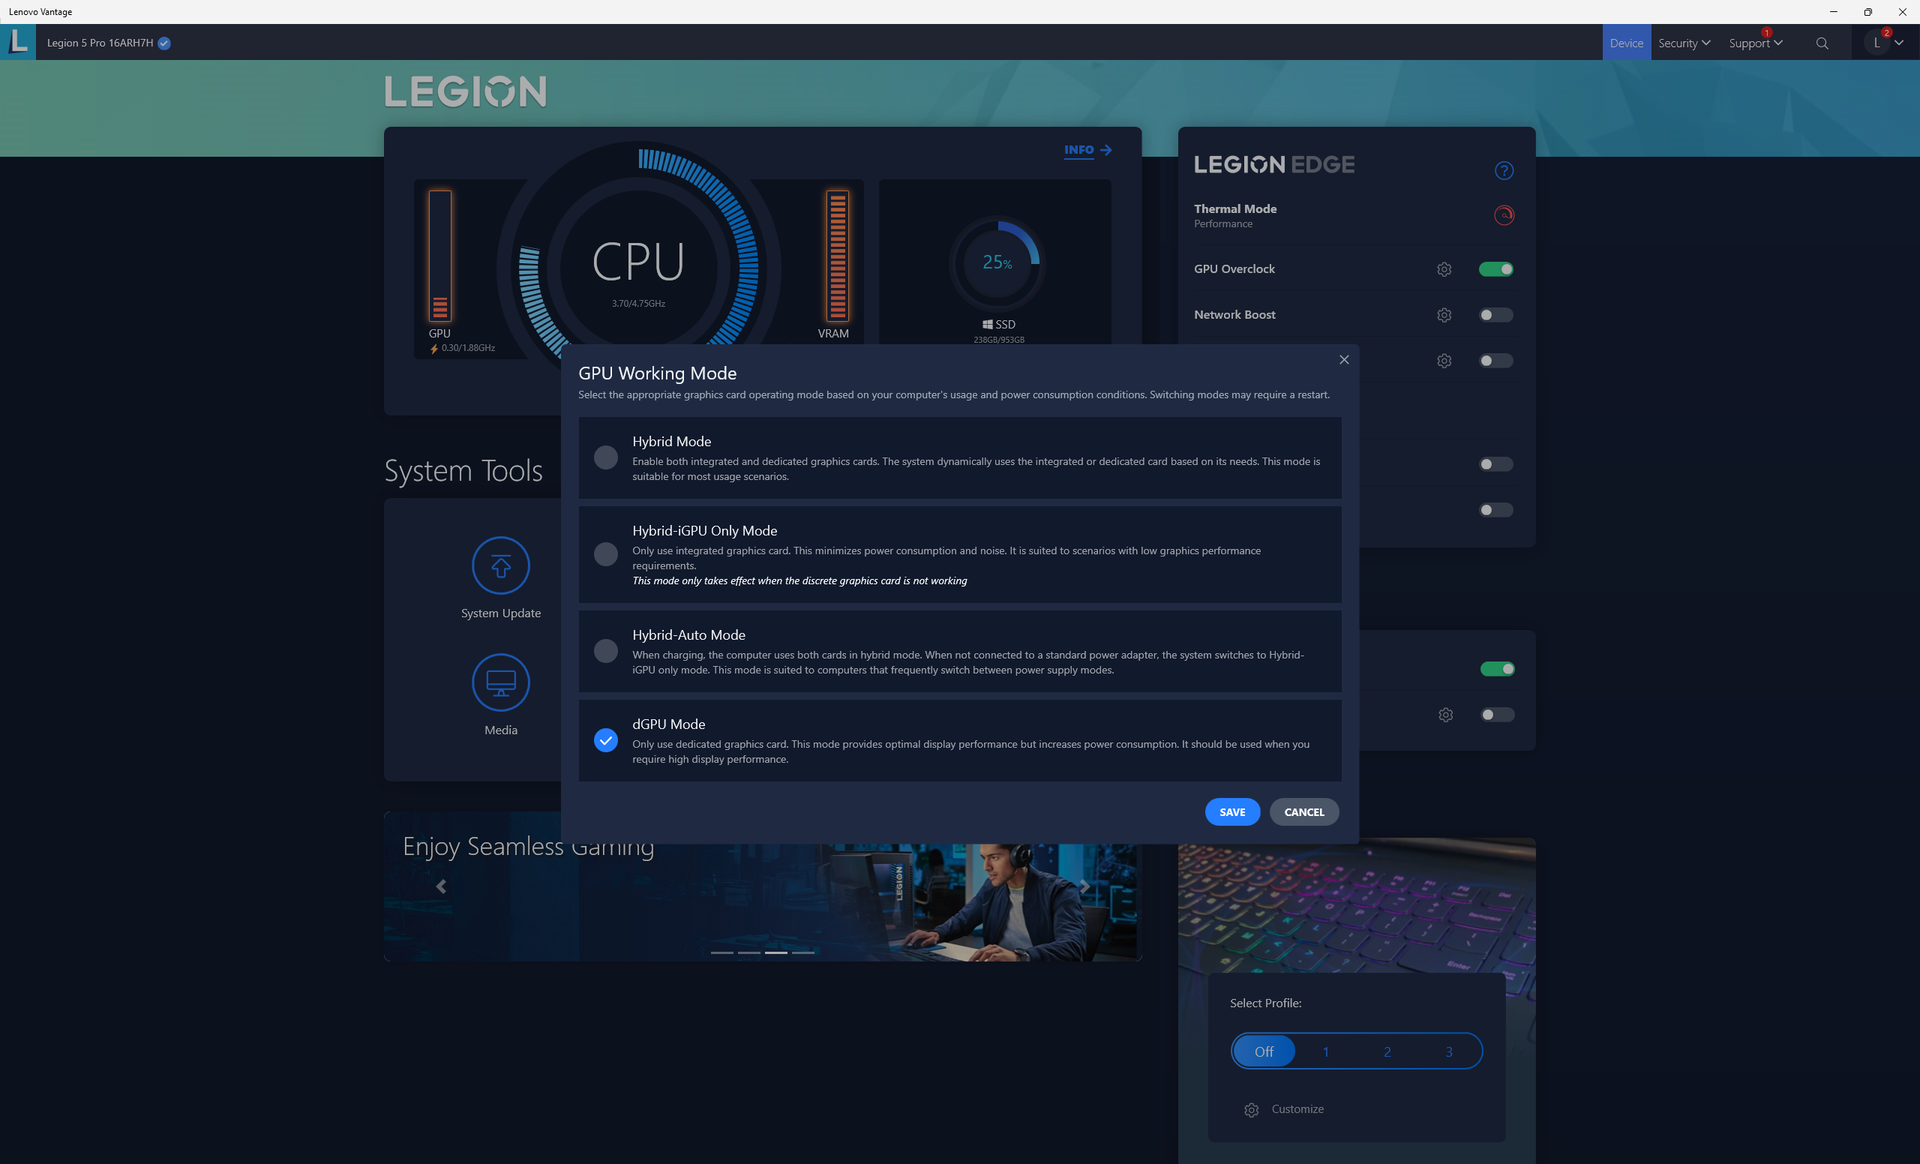
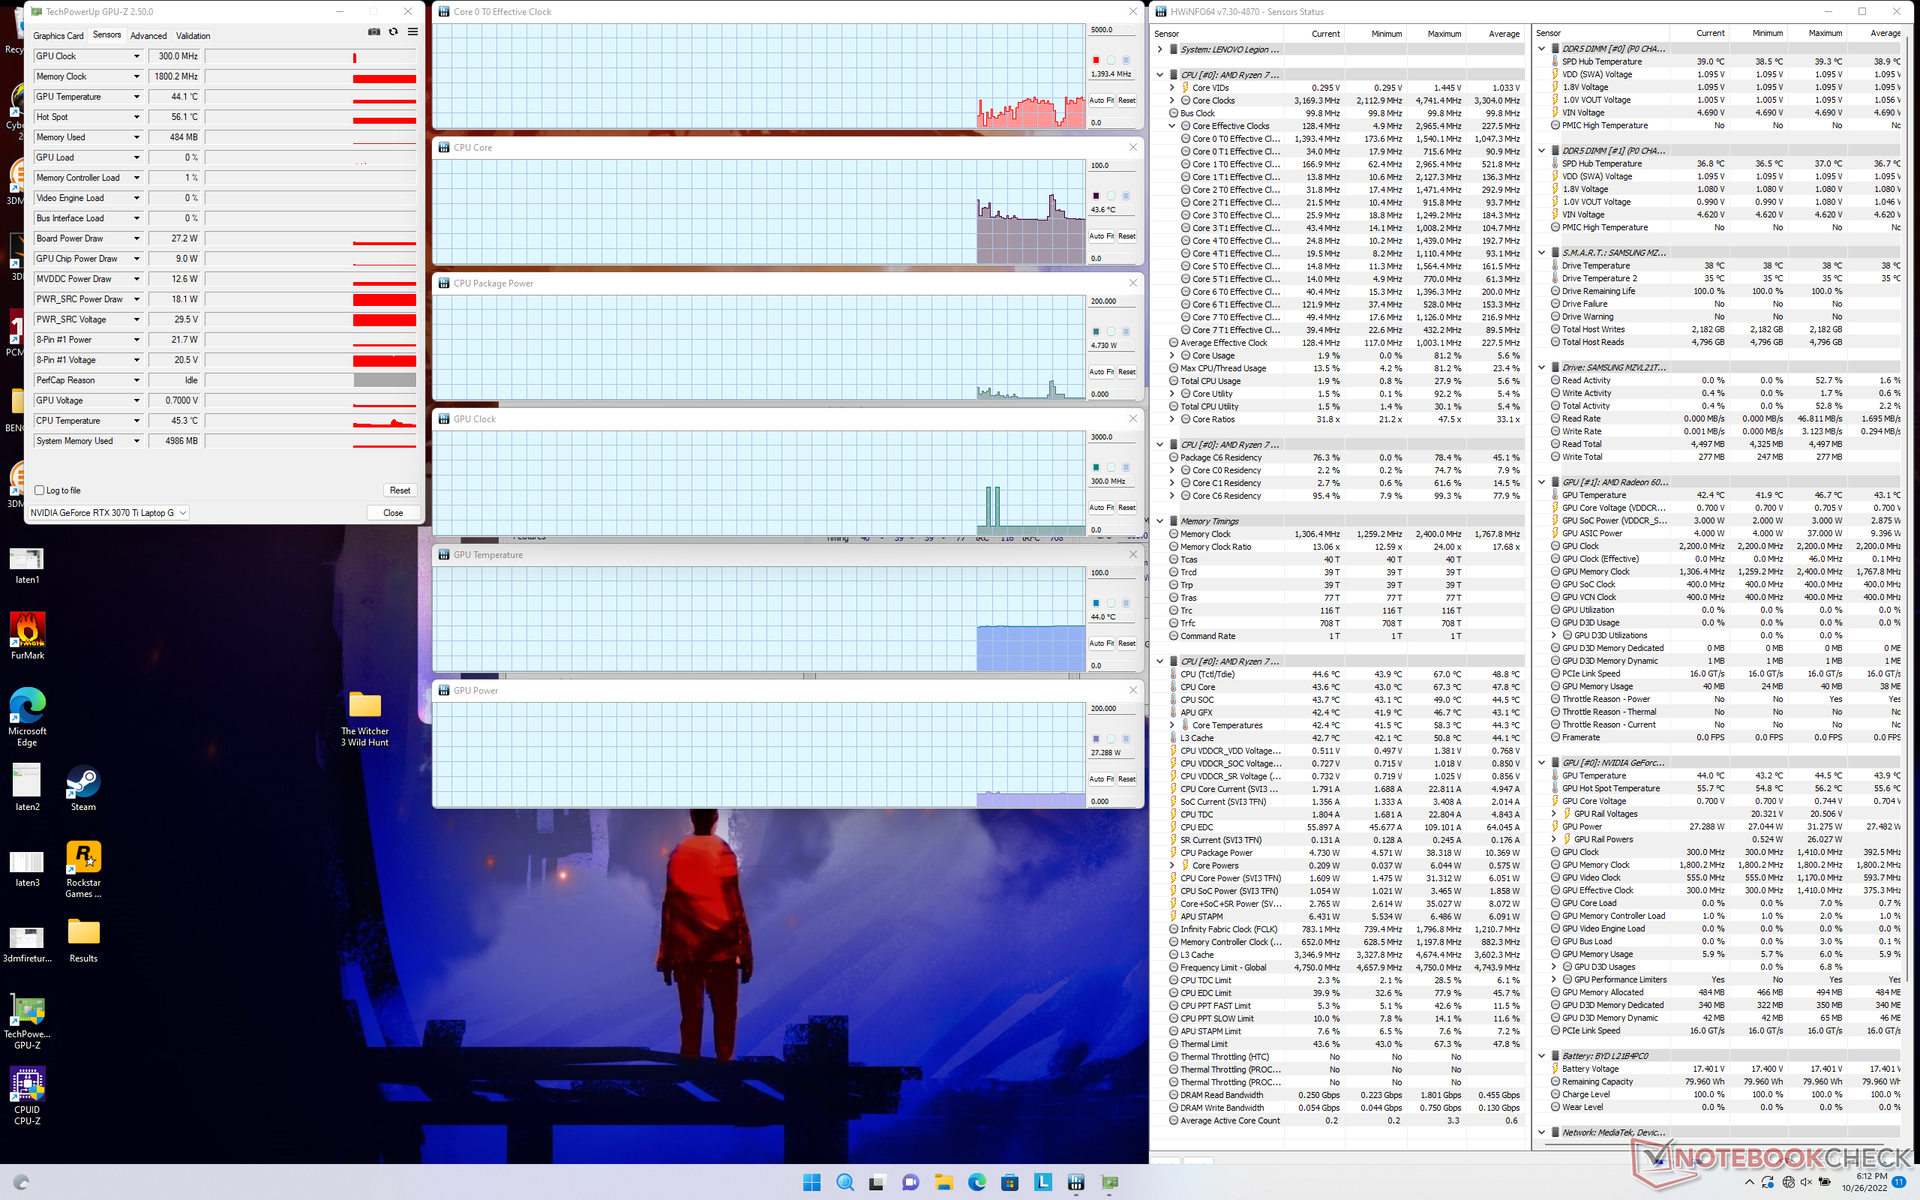
Vi ställde in vår enhet till prestandaläge både via Windows och Lenovo Vantage-programvaran innan vi körde alla benchmarks nedan. Vi såg också till att slå på GPU Overclock och GPU Working Mode till "dGPU only" för maximal prestanda. Ägare bör absolut bekanta sig med Vantage-programvaran och dess olika inställningar, vilket exemplifieras av skärmdumparna nedan.

Processor
Prestandan för en och flera trådar är cirka 10 procent respektive 20 procent snabbare än i den senaste generationen Ryzen 7 5800Hbaserat på vår tid med HP Omen 16 och Lenovo Legion 5 Pro 16 från 2021. Även om det inte är obetydligt är prestandaförstärkningen från år till år inte alls lika stor som hoppet från 11:e till 12:e generationens Intel. Core i7-12700Här till exempel fortfarande ungefär 15-30 procent snabbare än vår Ryzen 7 6800H
Uppgradering till Ryzen 9 6900HX från vår Ryzen 7 6800H väntas i bästa fall ge endast marginella vinster, vilket visas i våra jämförelsediagram nedan. Budgetmedvetna köpare kanske därför vill överväga en billigare Ryzen 7 6800H SKU istället.
Cinebench R15 Multi Loop
Cinebench R23: Multi Core | Single Core
Cinebench R15: CPU Multi 64Bit | CPU Single 64Bit
Blender: v2.79 BMW27 CPU
7-Zip 18.03: 7z b 4 | 7z b 4 -mmt1
Geekbench 5.5: Multi-Core | Single-Core
HWBOT x265 Benchmark v2.2: 4k Preset
LibreOffice : 20 Documents To PDF
R Benchmark 2.5: Overall mean
| Cinebench R20 / CPU (Multi Core) | |
| Lenovo Legion 5 Pro 16IAH7H | |
| Alienware x15 R2 P111F | |
| Dell G16 7620 | |
| Lenovo Legion 5 Pro 16ARH7H RTX 3070 Ti | |
| Lenovo Legion 7 16ARHA7 | |
| Gigabyte A5 X1 | |
| Asus ROG Zephyrus M16 GU603H | |
| Genomsnitt AMD Ryzen 7 6800H (4460 - 5661, n=9) | |
| HP Omen 16-c0077ng | |
| HP Victus 16-e0145ng | |
| Lenovo Legion C7 15IMH05 82EH0030GE | |
| Cinebench R20 / CPU (Single Core) | |
| Alienware x15 R2 P111F | |
| Lenovo Legion 5 Pro 16IAH7H | |
| Dell G16 7620 | |
| Lenovo Legion 7 16ARHA7 | |
| Asus ROG Zephyrus M16 GU603H | |
| Lenovo Legion 5 Pro 16ARH7H RTX 3070 Ti | |
| Genomsnitt AMD Ryzen 7 6800H (580 - 605, n=9) | |
| Gigabyte A5 X1 | |
| HP Omen 16-c0077ng | |
| HP Victus 16-e0145ng | |
| Lenovo Legion C7 15IMH05 82EH0030GE | |
| Cinebench R23 / Multi Core | |
| Lenovo Legion 5 Pro 16IAH7H | |
| Dell G16 7620 | |
| Alienware x15 R2 P111F | |
| Lenovo Legion 5 Pro 16ARH7H RTX 3070 Ti | |
| Lenovo Legion 7 16ARHA7 | |
| Gigabyte A5 X1 | |
| Genomsnitt AMD Ryzen 7 6800H (11481 - 14660, n=11) | |
| HP Omen 16-c0077ng | |
| HP Victus 16-e0145ng | |
| Lenovo Legion C7 15IMH05 82EH0030GE | |
| Cinebench R23 / Single Core | |
| Alienware x15 R2 P111F | |
| Lenovo Legion 5 Pro 16IAH7H | |
| Dell G16 7620 | |
| Lenovo Legion 7 16ARHA7 | |
| Lenovo Legion 5 Pro 16ARH7H RTX 3070 Ti | |
| Genomsnitt AMD Ryzen 7 6800H (1500 - 1552, n=9) | |
| Gigabyte A5 X1 | |
| HP Omen 16-c0077ng | |
| HP Victus 16-e0145ng | |
| Lenovo Legion C7 15IMH05 82EH0030GE | |
| Cinebench R15 / CPU Single 64Bit | |
| Alienware x15 R2 P111F | |
| Lenovo Legion 7 16ARHA7 | |
| Lenovo Legion 5 Pro 16IAH7H | |
| Lenovo Legion 5 Pro 16ARH7H RTX 3070 Ti | |
| Dell G16 7620 | |
| Gigabyte A5 X1 | |
| Asus ROG Zephyrus M16 GU603H | |
| Genomsnitt AMD Ryzen 7 6800H (182.7 - 250, n=10) | |
| HP Omen 16-c0077ng | |
| HP Victus 16-e0145ng | |
| Lenovo Legion C7 15IMH05 82EH0030GE | |
| HWBOT x265 Benchmark v2.2 / 4k Preset | |
| Lenovo Legion 5 Pro 16IAH7H | |
| Alienware x15 R2 P111F | |
| Dell G16 7620 | |
| Lenovo Legion 5 Pro 16ARH7H RTX 3070 Ti | |
| Lenovo Legion 7 16ARHA7 | |
| Gigabyte A5 X1 | |
| Genomsnitt AMD Ryzen 7 6800H (14.9 - 18.5, n=9) | |
| HP Omen 16-c0077ng | |
| Asus ROG Zephyrus M16 GU603H | |
| HP Victus 16-e0145ng | |
| Lenovo Legion C7 15IMH05 82EH0030GE | |
| LibreOffice / 20 Documents To PDF | |
| HP Omen 16-c0077ng | |
| Gigabyte A5 X1 | |
| HP Victus 16-e0145ng | |
| Lenovo Legion C7 15IMH05 82EH0030GE | |
| Genomsnitt AMD Ryzen 7 6800H (48.7 - 79.5, n=8) | |
| Lenovo Legion 7 16ARHA7 | |
| Dell G16 7620 | |
| Lenovo Legion 5 Pro 16ARH7H RTX 3070 Ti | |
| Alienware x15 R2 P111F | |
| Asus ROG Zephyrus M16 GU603H | |
| Lenovo Legion 5 Pro 16IAH7H | |
* ... mindre är bättre
AIDA64: FP32 Ray-Trace | FPU Julia | CPU SHA3 | CPU Queen | FPU SinJulia | FPU Mandel | CPU AES | CPU ZLib | FP64 Ray-Trace | CPU PhotoWorxx
| Performance rating | |
| Lenovo Legion 7 16ARHA7 | |
| Lenovo Legion 5 Pro 16ARH7H RTX 3070 Ti | |
| Genomsnitt AMD Ryzen 7 6800H | |
| Dell G16 7620 | |
| Lenovo Legion 5 Pro 16IAH7H | |
| HP Victus 16-e0145ng | |
| Asus ROG Zephyrus M16 GU603H -9! | |
| AIDA64 / FP32 Ray-Trace | |
| Lenovo Legion 7 16ARHA7 | |
| Lenovo Legion 5 Pro 16ARH7H RTX 3070 Ti | |
| Genomsnitt AMD Ryzen 7 6800H (12876 - 17031, n=8) | |
| Dell G16 7620 | |
| Lenovo Legion 5 Pro 16IAH7H | |
| Lenovo Legion 5 Pro 16IAH7H | |
| HP Victus 16-e0145ng | |
| AIDA64 / FPU Julia | |
| Lenovo Legion 7 16ARHA7 | |
| Lenovo Legion 5 Pro 16ARH7H RTX 3070 Ti | |
| Genomsnitt AMD Ryzen 7 6800H (82673 - 105987, n=8) | |
| Dell G16 7620 | |
| Lenovo Legion 5 Pro 16IAH7H | |
| Lenovo Legion 5 Pro 16IAH7H | |
| HP Victus 16-e0145ng | |
| AIDA64 / CPU SHA3 | |
| Dell G16 7620 | |
| Lenovo Legion 7 16ARHA7 | |
| Lenovo Legion 5 Pro 16ARH7H RTX 3070 Ti | |
| Lenovo Legion 5 Pro 16IAH7H | |
| Lenovo Legion 5 Pro 16IAH7H | |
| Genomsnitt AMD Ryzen 7 6800H (2886 - 3634, n=8) | |
| HP Victus 16-e0145ng | |
| AIDA64 / CPU Queen | |
| Lenovo Legion 5 Pro 16ARH7H RTX 3070 Ti | |
| Lenovo Legion 7 16ARHA7 | |
| Dell G16 7620 | |
| Lenovo Legion 5 Pro 16IAH7H | |
| Genomsnitt AMD Ryzen 7 6800H (75117 - 106322, n=8) | |
| HP Victus 16-e0145ng | |
| AIDA64 / FPU SinJulia | |
| Lenovo Legion 7 16ARHA7 | |
| Lenovo Legion 5 Pro 16ARH7H RTX 3070 Ti | |
| Genomsnitt AMD Ryzen 7 6800H (11771 - 13120, n=8) | |
| Lenovo Legion 5 Pro 16IAH7H | |
| Lenovo Legion 5 Pro 16IAH7H | |
| Dell G16 7620 | |
| HP Victus 16-e0145ng | |
| AIDA64 / FPU Mandel | |
| Lenovo Legion 7 16ARHA7 | |
| Lenovo Legion 5 Pro 16ARH7H RTX 3070 Ti | |
| Genomsnitt AMD Ryzen 7 6800H (45287 - 58327, n=8) | |
| HP Victus 16-e0145ng | |
| Lenovo Legion 5 Pro 16IAH7H | |
| Lenovo Legion 5 Pro 16IAH7H | |
| Dell G16 7620 | |
| AIDA64 / CPU AES | |
| Lenovo Legion 7 16ARHA7 | |
| Lenovo Legion 5 Pro 16ARH7H RTX 3070 Ti | |
| Lenovo Legion 5 Pro 16IAH7H | |
| Lenovo Legion 5 Pro 16IAH7H | |
| Genomsnitt AMD Ryzen 7 6800H (67816 - 137383, n=8) | |
| Dell G16 7620 | |
| HP Victus 16-e0145ng | |
| AIDA64 / CPU ZLib | |
| Lenovo Legion 5 Pro 16IAH7H | |
| Lenovo Legion 5 Pro 16IAH7H | |
| Dell G16 7620 | |
| Lenovo Legion 7 16ARHA7 | |
| Lenovo Legion 5 Pro 16ARH7H RTX 3070 Ti | |
| Genomsnitt AMD Ryzen 7 6800H (732 - 901, n=8) | |
| HP Victus 16-e0145ng | |
| Asus ROG Zephyrus M16 GU603H | |
| AIDA64 / FP64 Ray-Trace | |
| Lenovo Legion 7 16ARHA7 | |
| Lenovo Legion 5 Pro 16ARH7H RTX 3070 Ti | |
| Genomsnitt AMD Ryzen 7 6800H (6917 - 8980, n=8) | |
| Dell G16 7620 | |
| Lenovo Legion 5 Pro 16IAH7H | |
| Lenovo Legion 5 Pro 16IAH7H | |
| HP Victus 16-e0145ng | |
| AIDA64 / CPU PhotoWorxx | |
| Dell G16 7620 | |
| Lenovo Legion 5 Pro 16IAH7H | |
| Lenovo Legion 5 Pro 16IAH7H | |
| Lenovo Legion 7 16ARHA7 | |
| Lenovo Legion 5 Pro 16ARH7H RTX 3070 Ti | |
| Genomsnitt AMD Ryzen 7 6800H (26496 - 30360, n=8) | |
| HP Victus 16-e0145ng | |
Systemets prestanda
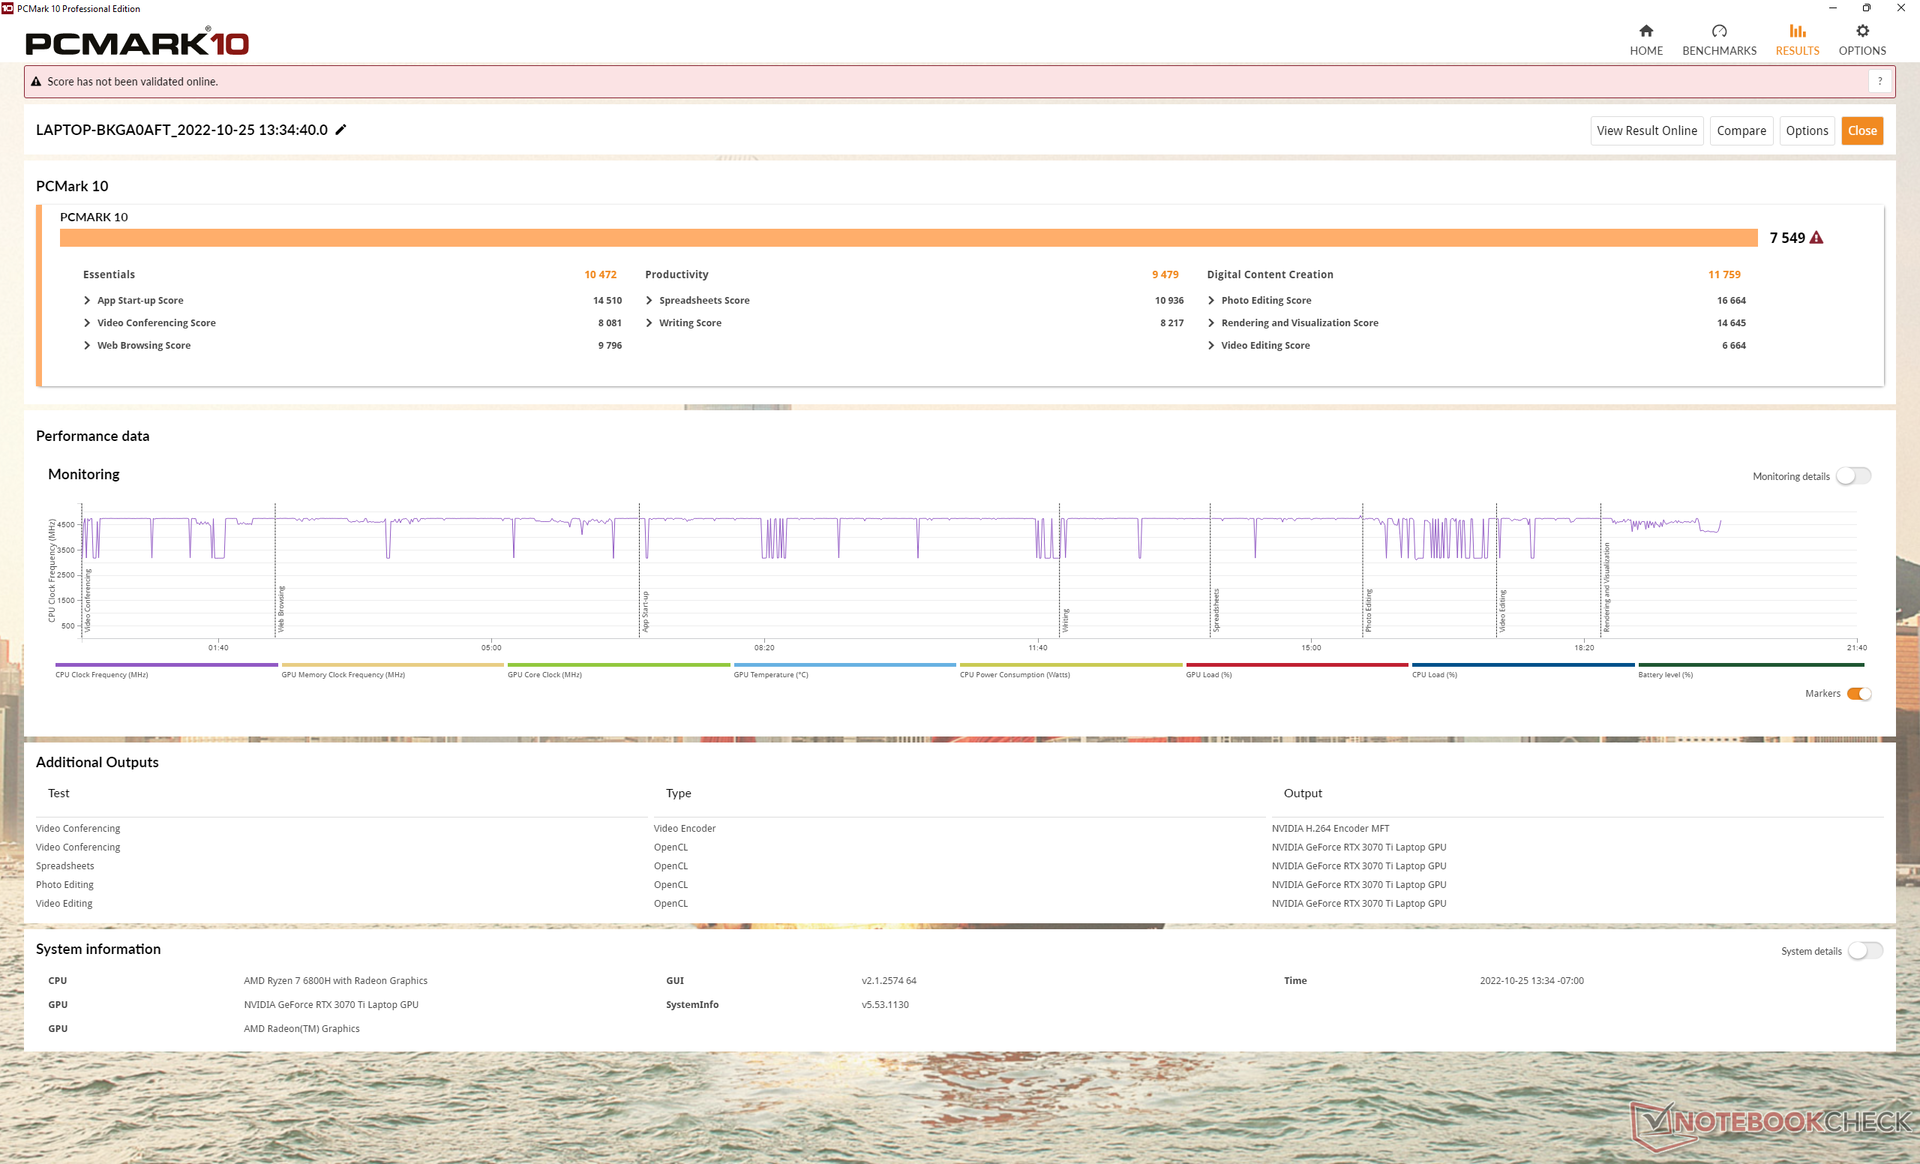
PCMark-resultaten ligger inom ensiffriga procentenheter jämfört med andra högklassiga Intel-baserade bärbara datorer för spel, t.ex.Dell G16 7620 även om Ryzen 7 6800H inte kan hålla jämna steg med de senaste 12:e generationens Core-processorer.
CrossMark: Overall | Productivity | Creativity | Responsiveness
| PCMark 10 / Score | |
| Lenovo Legion 5 Pro 16ARH7H RTX 3070 Ti | |
| Lenovo Legion 5 Pro 16IAH7H | |
| Lenovo Legion 7 16ARHA7 | |
| Dell G16 7620 | |
| Genomsnitt AMD Ryzen 7 6800H, NVIDIA GeForce RTX 3070 Ti Laptop GPU (6783 - 7549, n=2) | |
| Asus ROG Zephyrus M16 GU603H | |
| HP Victus 16-e0145ng | |
| PCMark 10 / Essentials | |
| Lenovo Legion 5 Pro 16IAH7H | |
| Asus ROG Zephyrus M16 GU603H | |
| Lenovo Legion 7 16ARHA7 | |
| Lenovo Legion 5 Pro 16ARH7H RTX 3070 Ti | |
| Genomsnitt AMD Ryzen 7 6800H, NVIDIA GeForce RTX 3070 Ti Laptop GPU (10343 - 10472, n=2) | |
| Dell G16 7620 | |
| HP Victus 16-e0145ng | |
| PCMark 10 / Productivity | |
| Lenovo Legion 5 Pro 16ARH7H RTX 3070 Ti | |
| Lenovo Legion 5 Pro 16IAH7H | |
| Genomsnitt AMD Ryzen 7 6800H, NVIDIA GeForce RTX 3070 Ti Laptop GPU (8991 - 9479, n=2) | |
| Asus ROG Zephyrus M16 GU603H | |
| Lenovo Legion 7 16ARHA7 | |
| Dell G16 7620 | |
| HP Victus 16-e0145ng | |
| PCMark 10 / Digital Content Creation | |
| Lenovo Legion 5 Pro 16ARH7H RTX 3070 Ti | |
| Lenovo Legion 7 16ARHA7 | |
| Lenovo Legion 5 Pro 16IAH7H | |
| Dell G16 7620 | |
| Genomsnitt AMD Ryzen 7 6800H, NVIDIA GeForce RTX 3070 Ti Laptop GPU (9108 - 11759, n=2) | |
| Asus ROG Zephyrus M16 GU603H | |
| HP Victus 16-e0145ng | |
| CrossMark / Overall | |
| Dell G16 7620 | |
| Lenovo Legion 5 Pro 16IAH7H | |
| Lenovo Legion 5 Pro 16ARH7H RTX 3070 Ti | |
| Lenovo Legion 7 16ARHA7 | |
| Genomsnitt AMD Ryzen 7 6800H, NVIDIA GeForce RTX 3070 Ti Laptop GPU (1522 - 1643, n=2) | |
| CrossMark / Productivity | |
| Lenovo Legion 5 Pro 16IAH7H | |
| Dell G16 7620 | |
| Lenovo Legion 5 Pro 16ARH7H RTX 3070 Ti | |
| Genomsnitt AMD Ryzen 7 6800H, NVIDIA GeForce RTX 3070 Ti Laptop GPU (1530 - 1600, n=2) | |
| Lenovo Legion 7 16ARHA7 | |
| CrossMark / Creativity | |
| Dell G16 7620 | |
| Lenovo Legion 5 Pro 16IAH7H | |
| Lenovo Legion 7 16ARHA7 | |
| Lenovo Legion 5 Pro 16ARH7H RTX 3070 Ti | |
| Genomsnitt AMD Ryzen 7 6800H, NVIDIA GeForce RTX 3070 Ti Laptop GPU (1589 - 1746, n=2) | |
| CrossMark / Responsiveness | |
| Lenovo Legion 5 Pro 16IAH7H | |
| Dell G16 7620 | |
| Lenovo Legion 5 Pro 16ARH7H RTX 3070 Ti | |
| Genomsnitt AMD Ryzen 7 6800H, NVIDIA GeForce RTX 3070 Ti Laptop GPU (1316 - 1481, n=2) | |
| Lenovo Legion 7 16ARHA7 | |
| PCMark 10 Score | 7549 poäng | |
Hjälp | ||
| AIDA64 / Memory Copy | |
| Lenovo Legion 5 Pro 16IAH7H | |
| Lenovo Legion 5 Pro 16IAH7H | |
| Dell G16 7620 | |
| Lenovo Legion 5 Pro 16ARH7H RTX 3070 Ti | |
| Lenovo Legion 7 16ARHA7 | |
| Genomsnitt AMD Ryzen 7 6800H (48209 - 51186, n=8) | |
| HP Victus 16-e0145ng | |
| AIDA64 / Memory Read | |
| Dell G16 7620 | |
| Lenovo Legion 5 Pro 16IAH7H | |
| Lenovo Legion 5 Pro 16IAH7H | |
| Lenovo Legion 7 16ARHA7 | |
| Lenovo Legion 5 Pro 16ARH7H RTX 3070 Ti | |
| Genomsnitt AMD Ryzen 7 6800H (43828 - 51778, n=8) | |
| HP Victus 16-e0145ng | |
| AIDA64 / Memory Write | |
| Lenovo Legion 5 Pro 16IAH7H | |
| Lenovo Legion 5 Pro 16IAH7H | |
| Dell G16 7620 | |
| Lenovo Legion 5 Pro 16ARH7H RTX 3070 Ti | |
| Lenovo Legion 7 16ARHA7 | |
| Genomsnitt AMD Ryzen 7 6800H (51116 - 55307, n=8) | |
| HP Victus 16-e0145ng | |
| AIDA64 / Memory Latency | |
| Lenovo Legion 5 Pro 16IAH7H | |
| Lenovo Legion 5 Pro 16IAH7H | |
| Dell G16 7620 | |
| Genomsnitt AMD Ryzen 7 6800H (83.1 - 104.1, n=8) | |
| Lenovo Legion 5 Pro 16ARH7H RTX 3070 Ti | |
| Lenovo Legion 7 16ARHA7 | |
| HP Victus 16-e0145ng | |
| Asus ROG Zephyrus M16 GU603H | |
* ... mindre är bättre
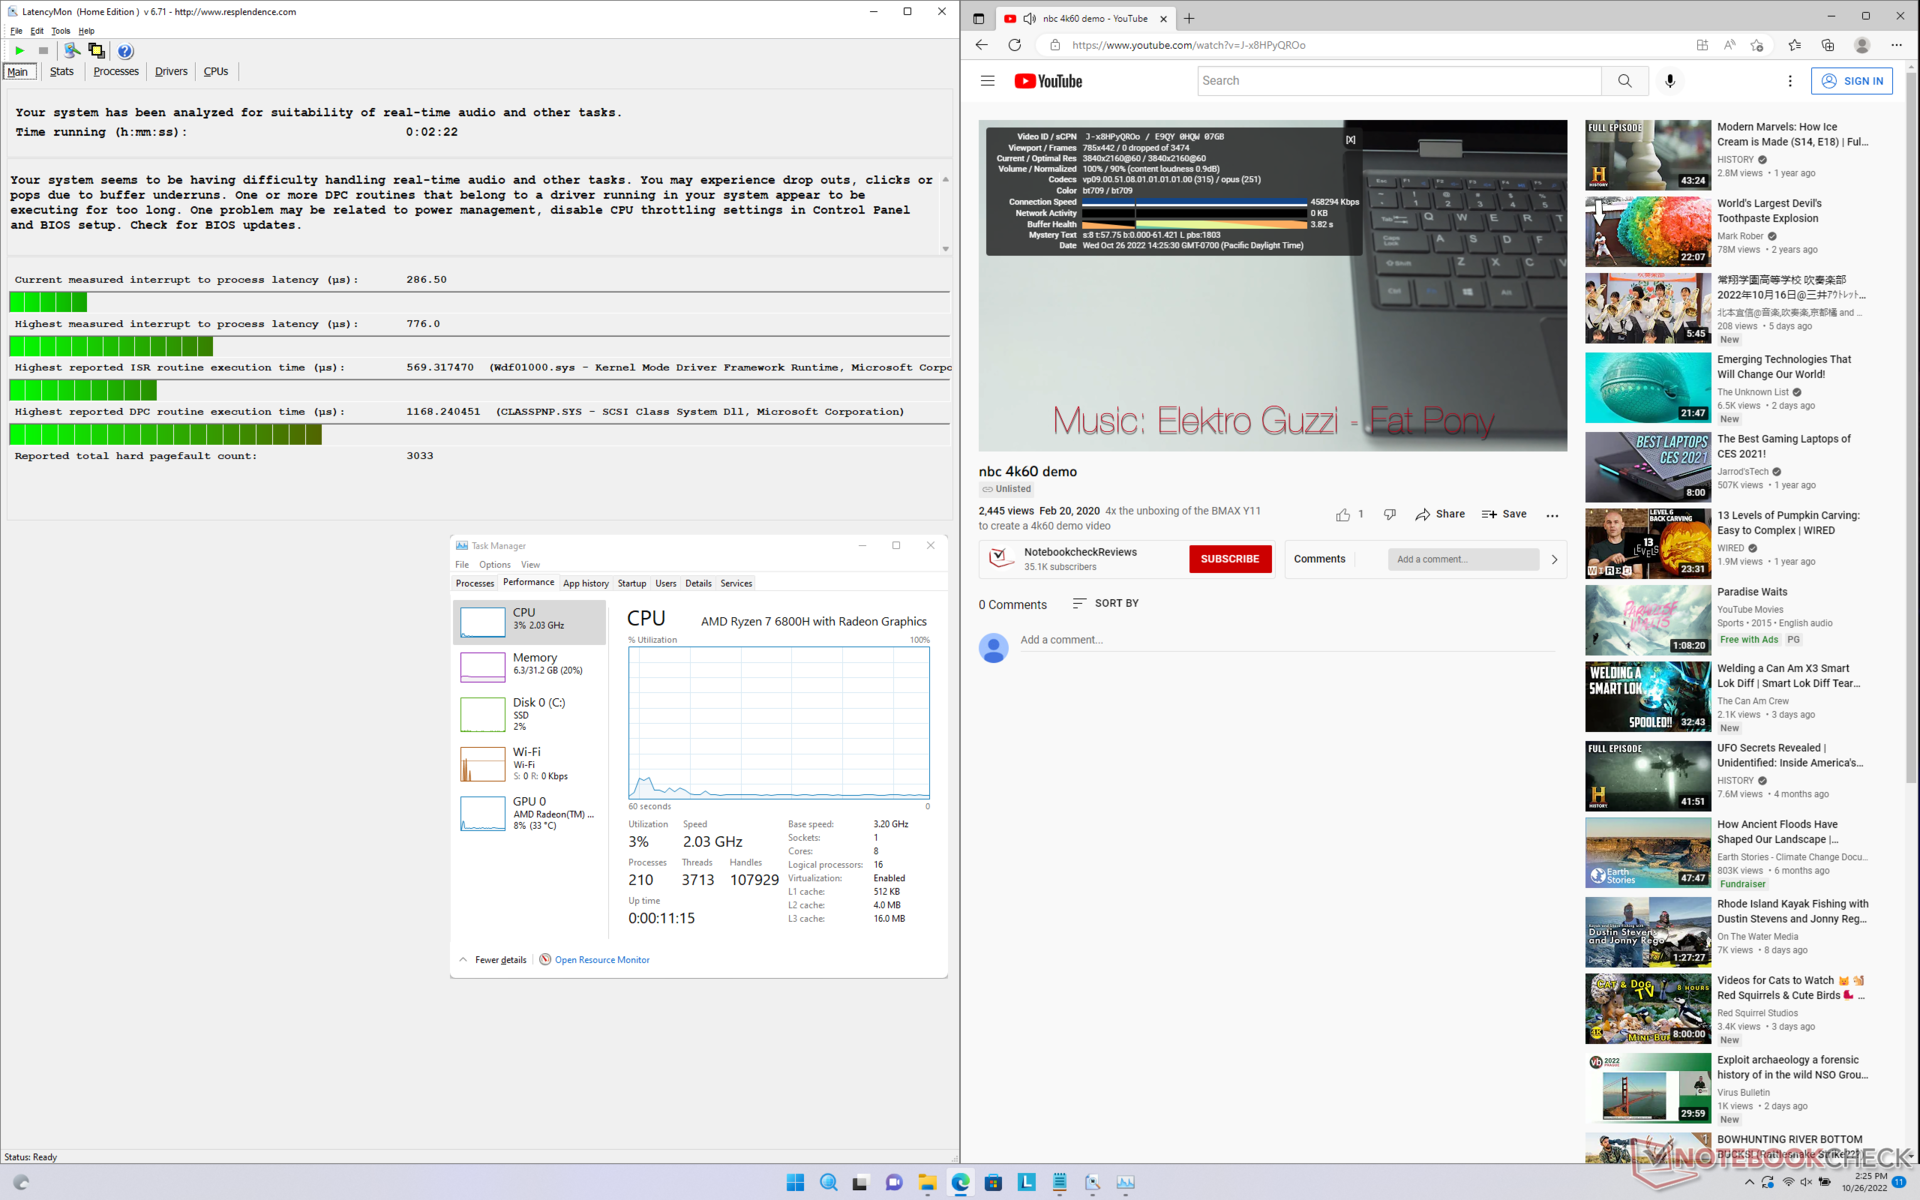
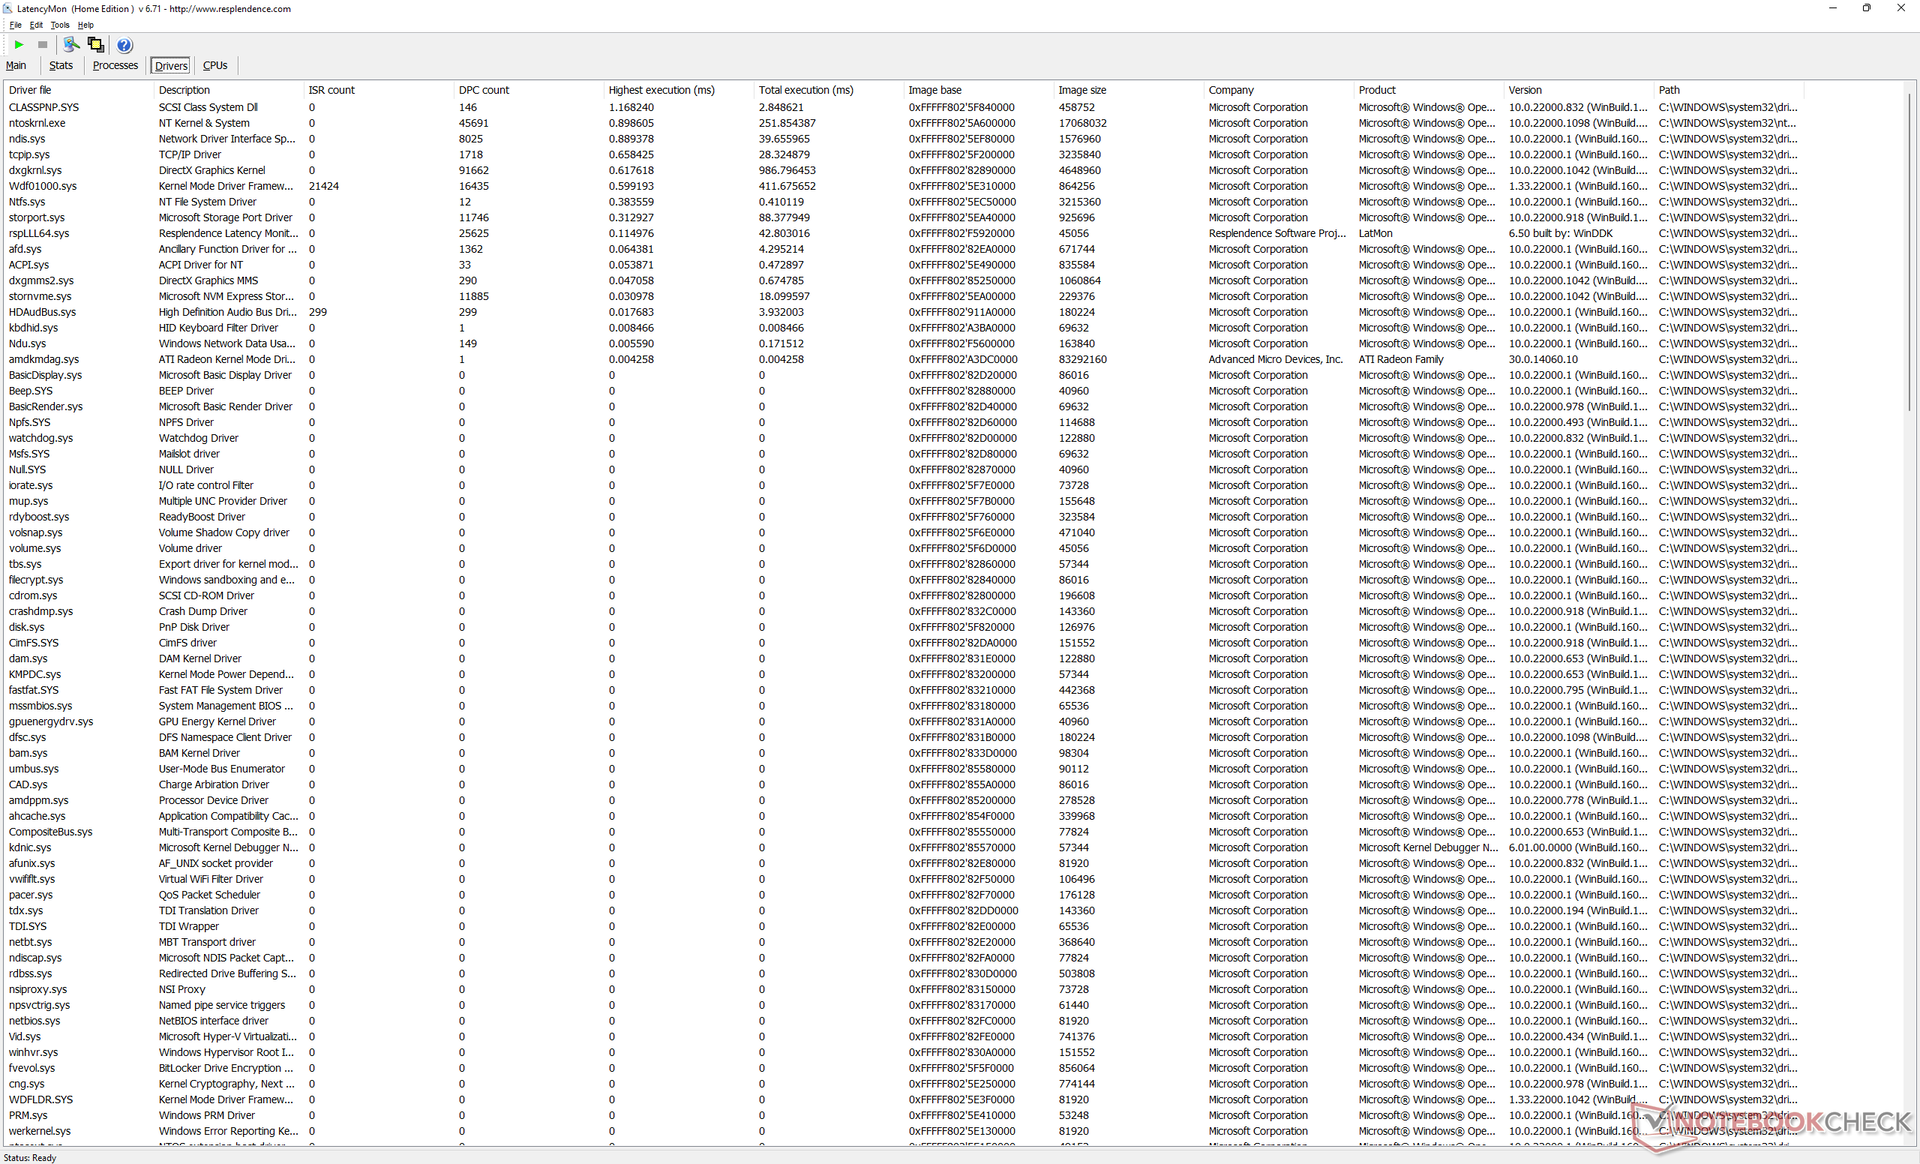
DPC-latenstid
LatencyMon avslöjar mindre DPC-problem när man öppnar flera webbläsarflikar på vår hemsida. uppspelning av 4K-video vid 60 FPS är annars perfekt och inga ramar tappas bort.
| DPC Latencies / LatencyMon - interrupt to process latency (max), Web, Youtube, Prime95 | |
| Lenovo Legion 7 16ARHA7 | |
| Asus ROG Zephyrus M16 GU603H | |
| Dell G16 7620 | |
| HP Victus 16-e0145ng | |
| Lenovo Legion 5 Pro 16ARH7H RTX 3070 Ti | |
| Lenovo Legion 5 Pro 16IAH7H | |
* ... mindre är bättre
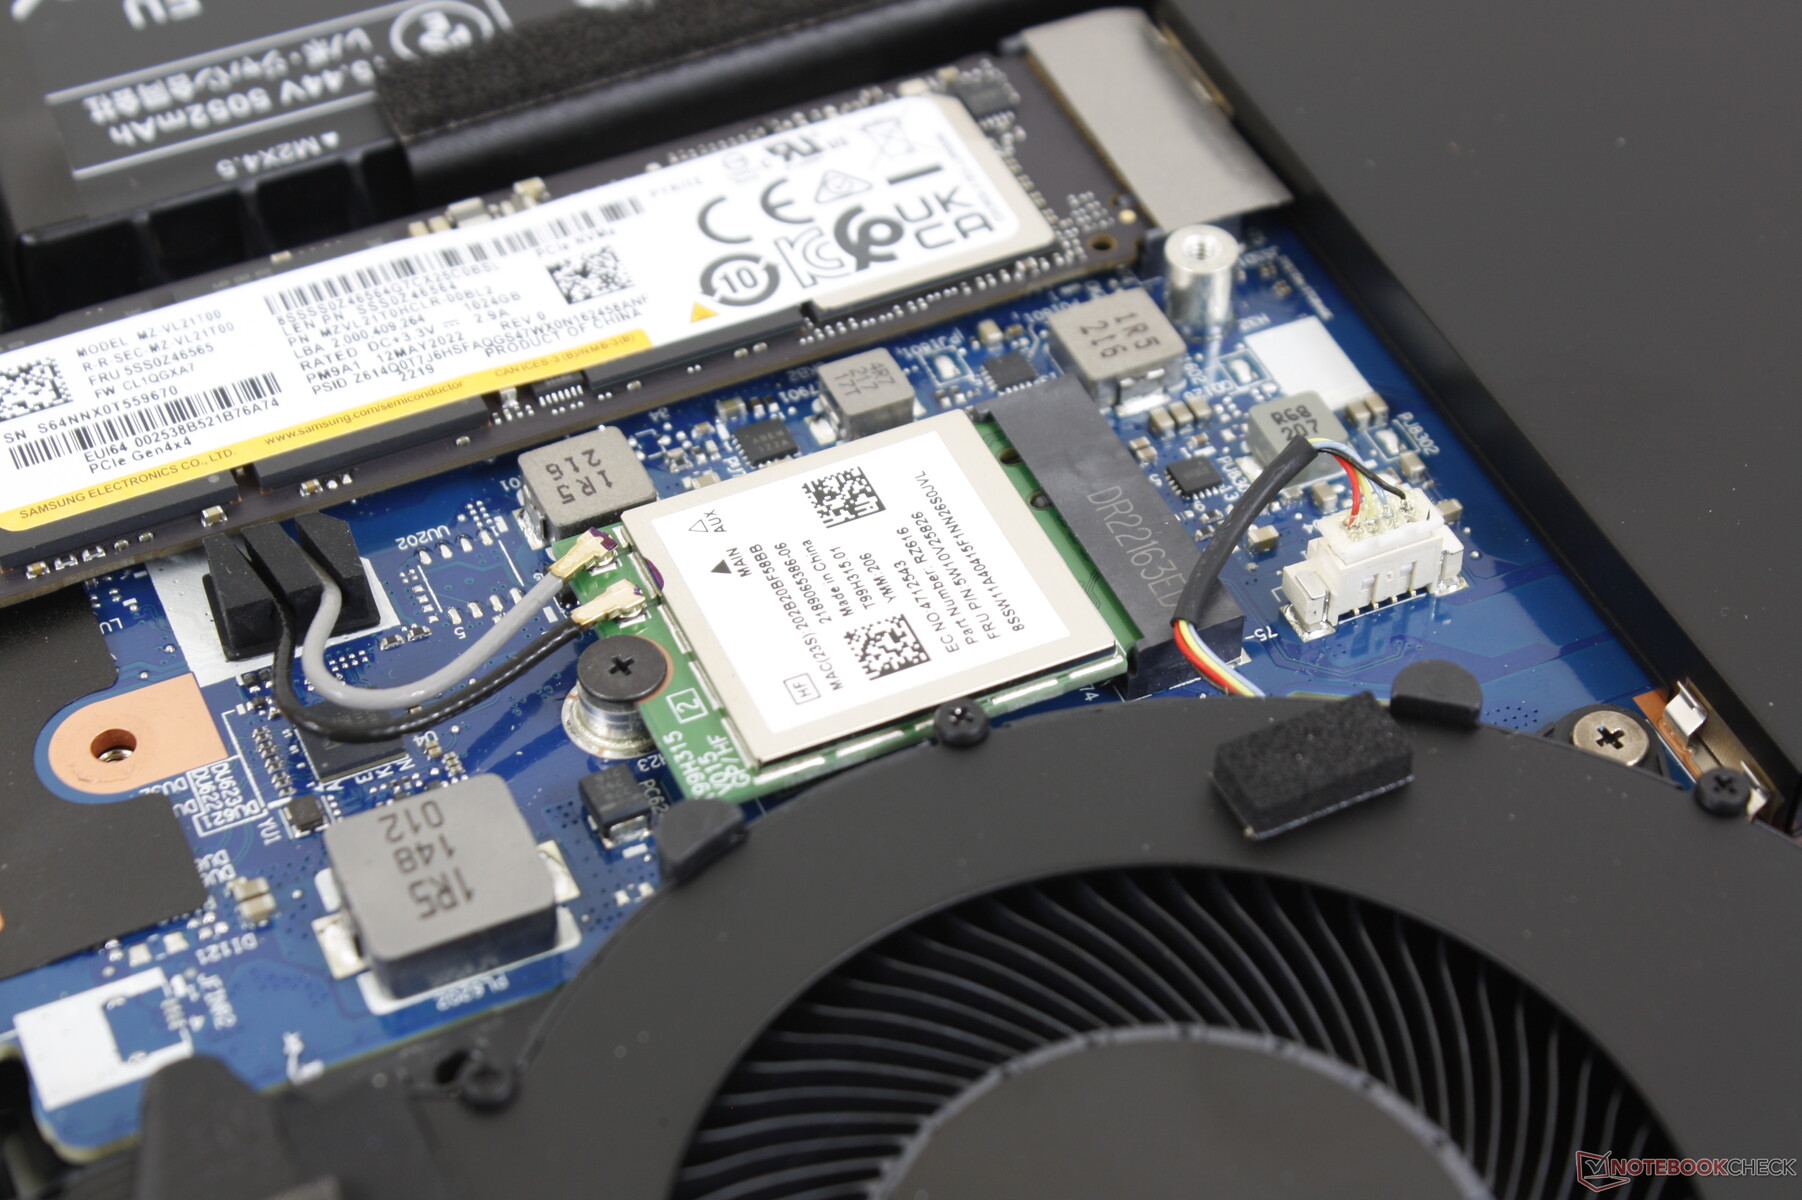
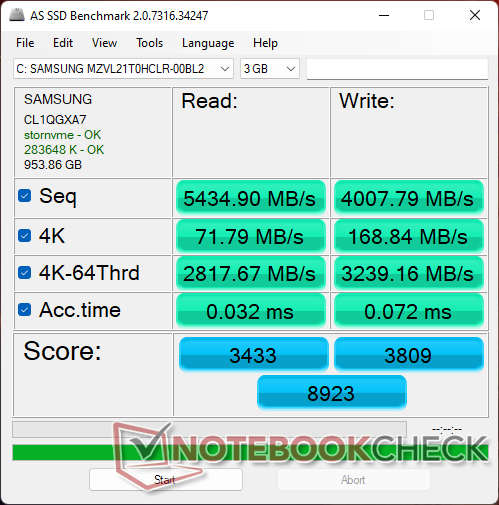
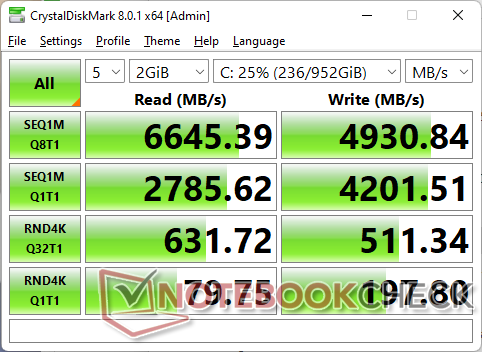
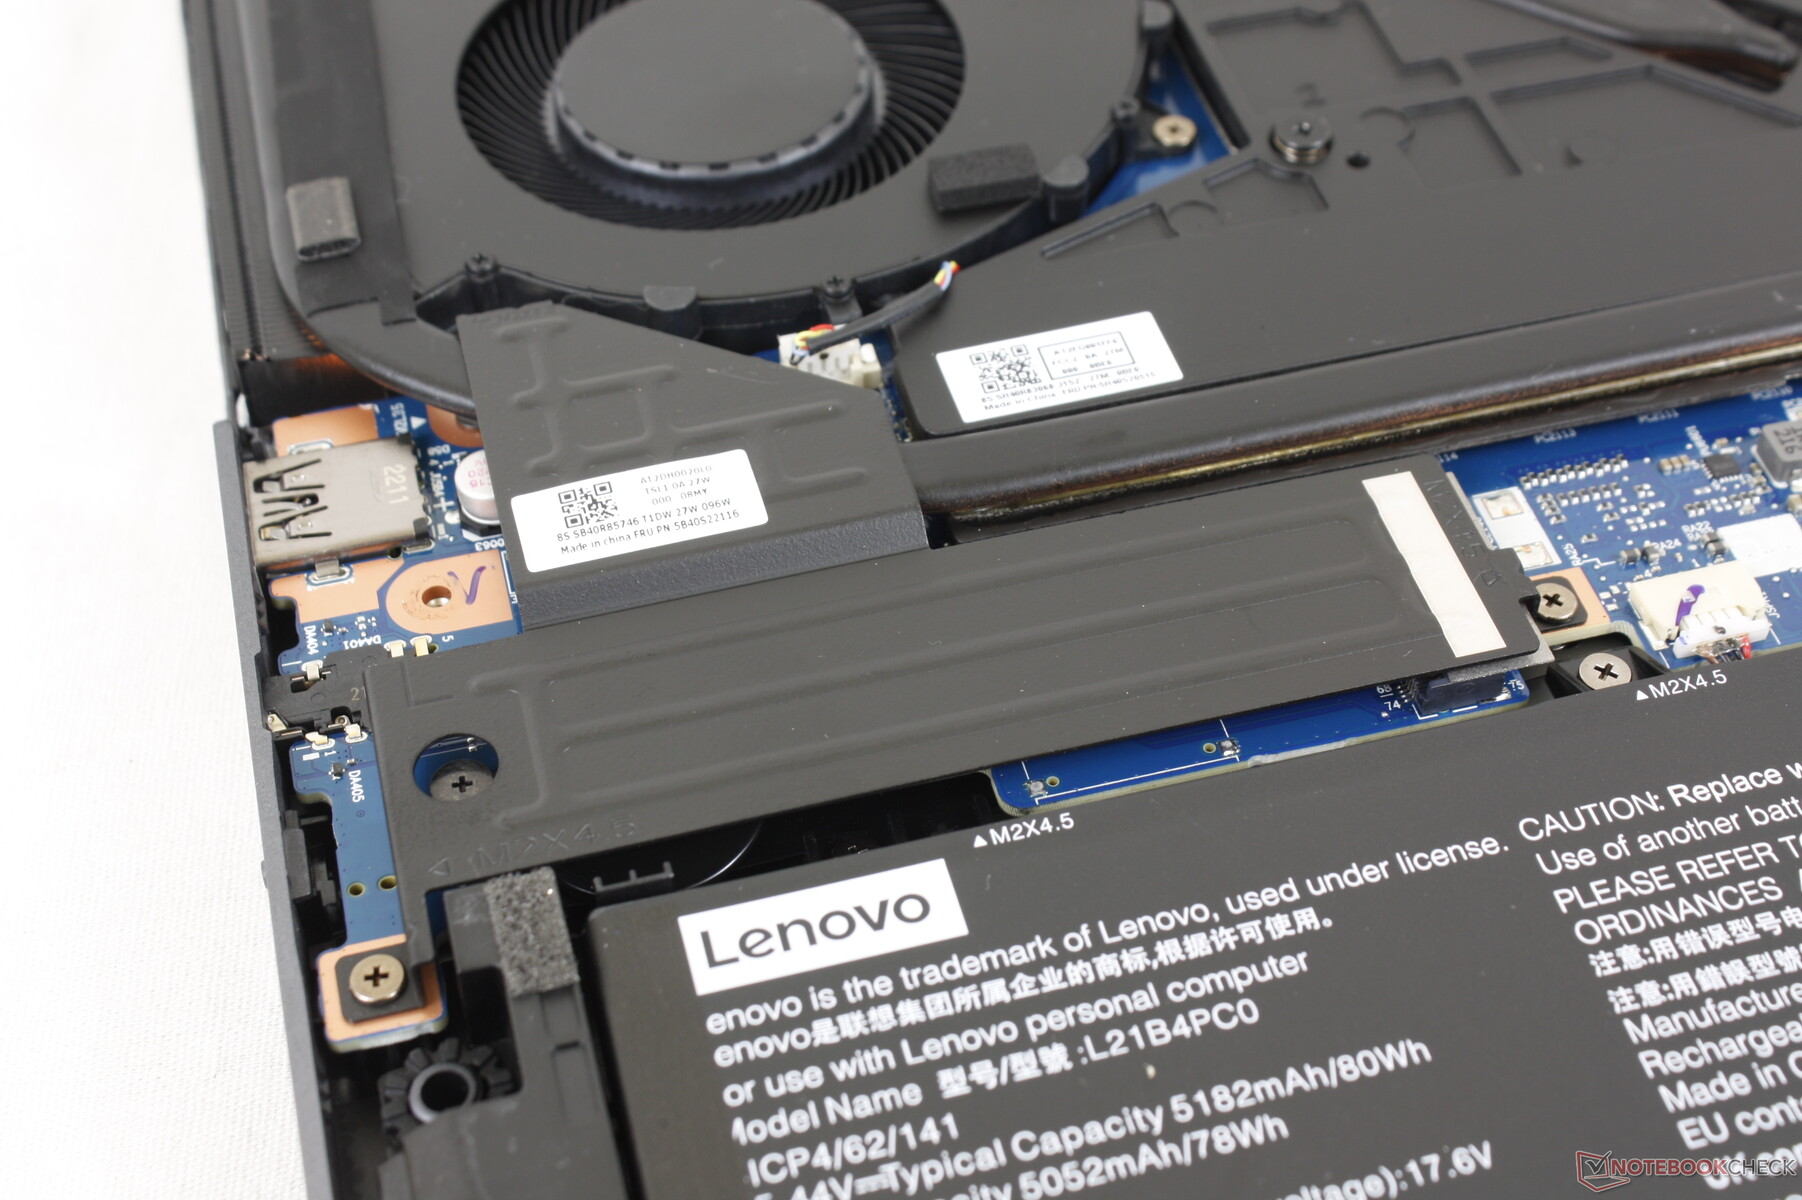
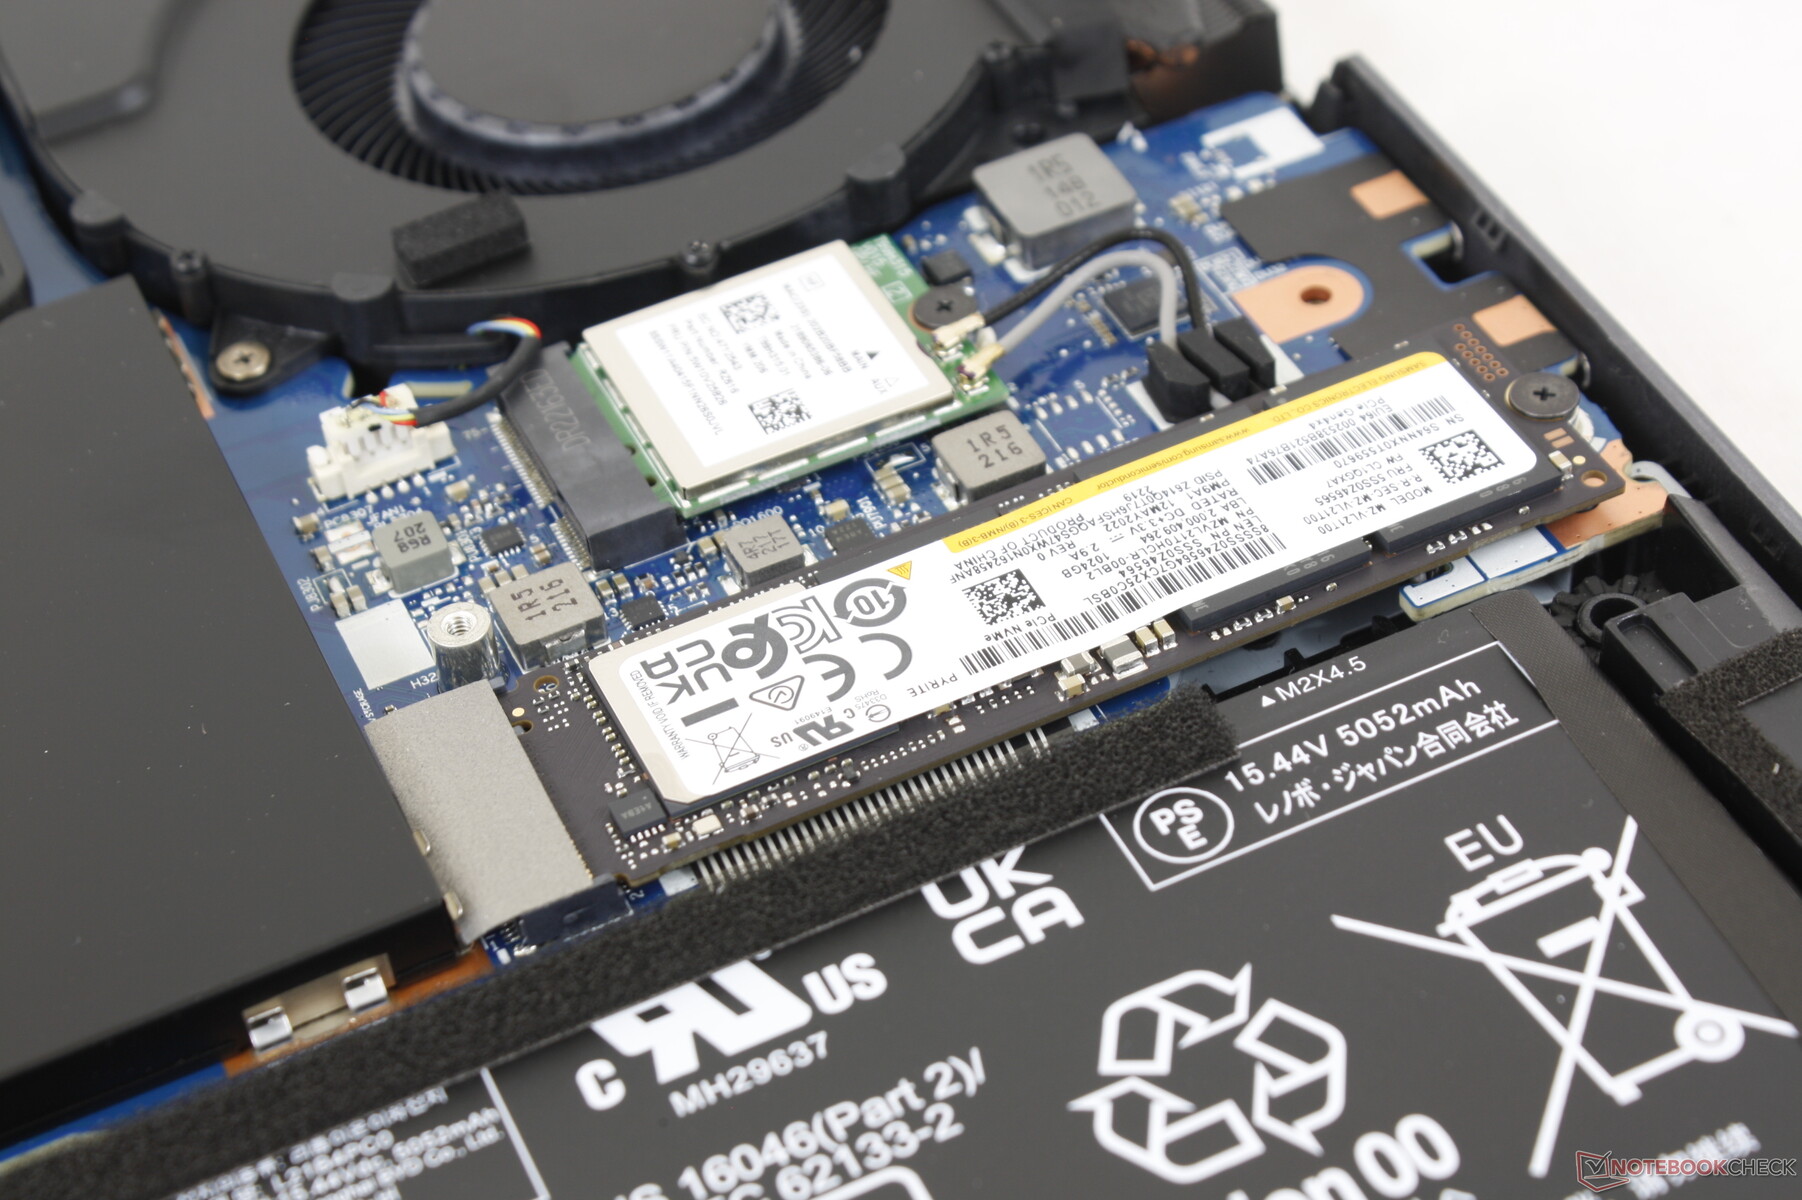
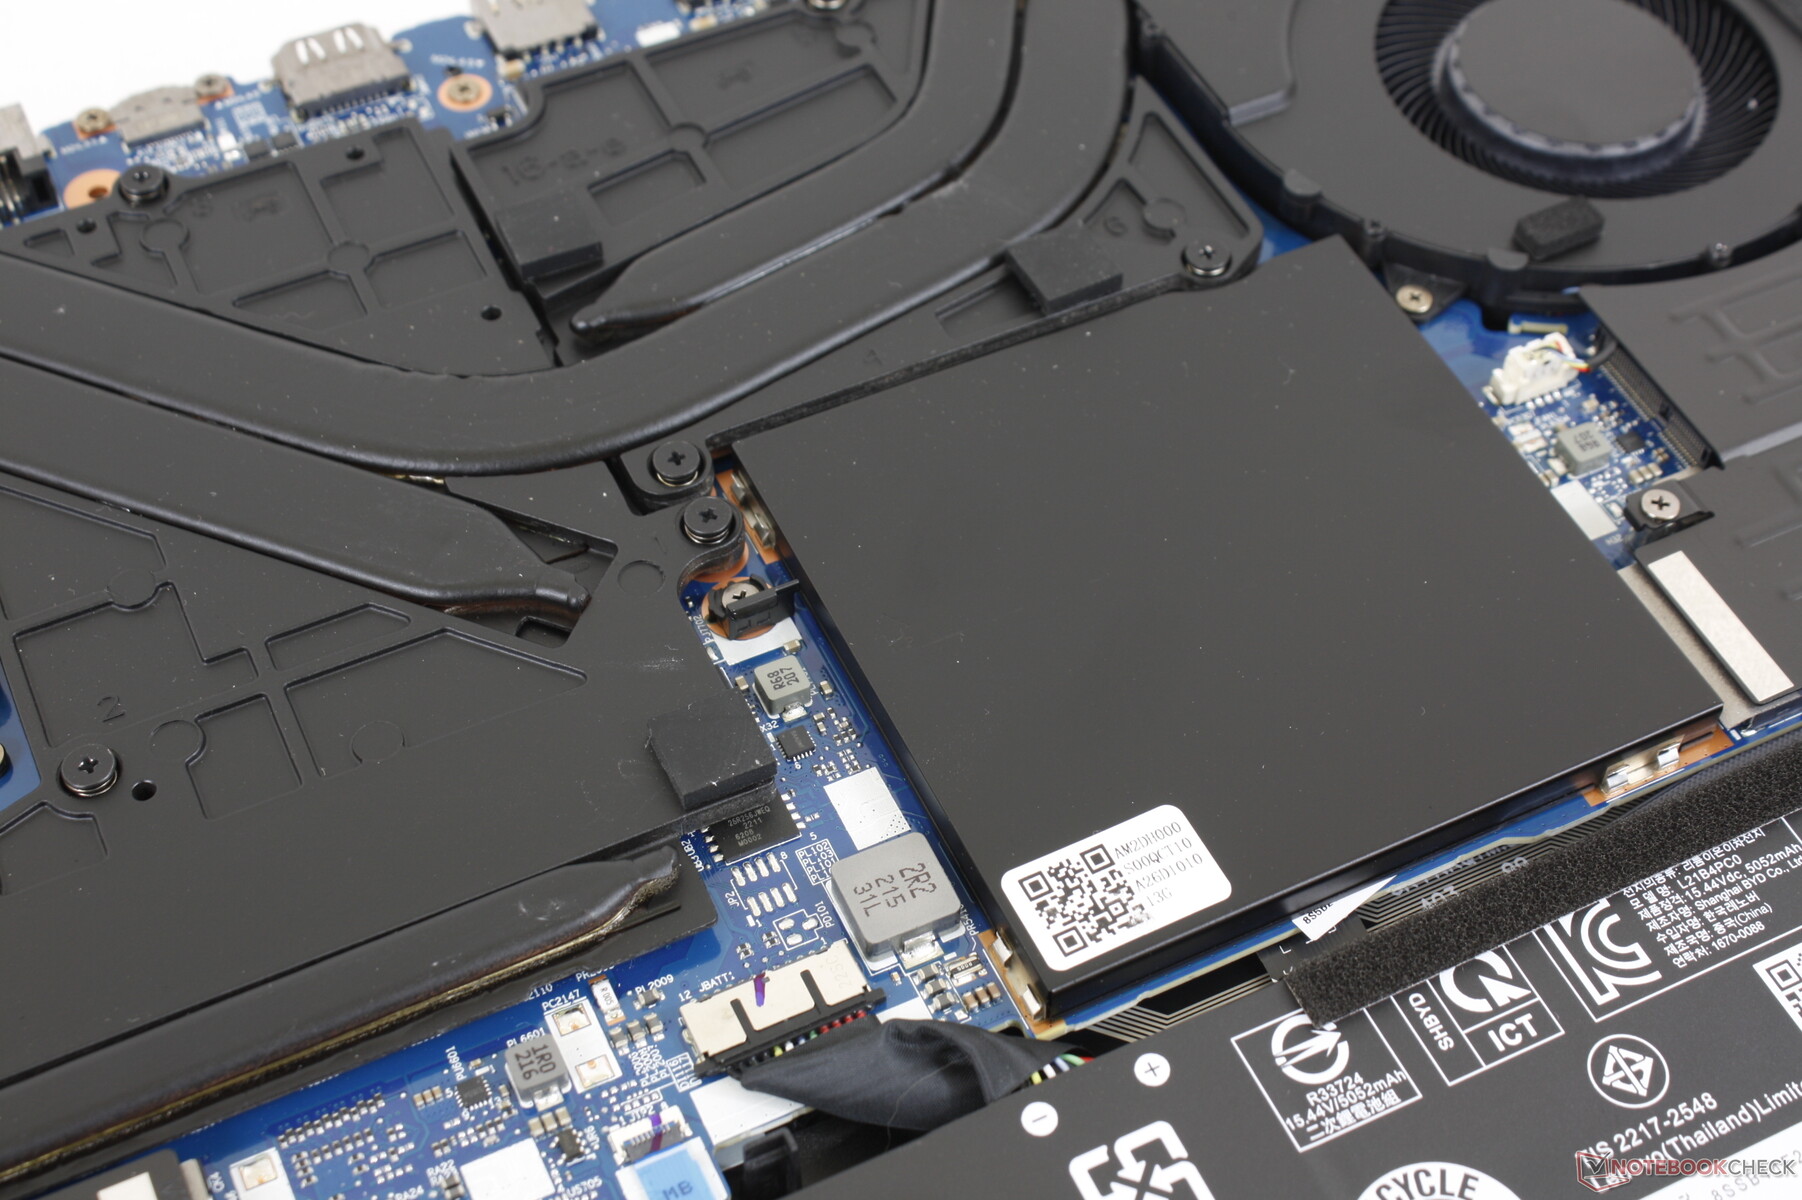
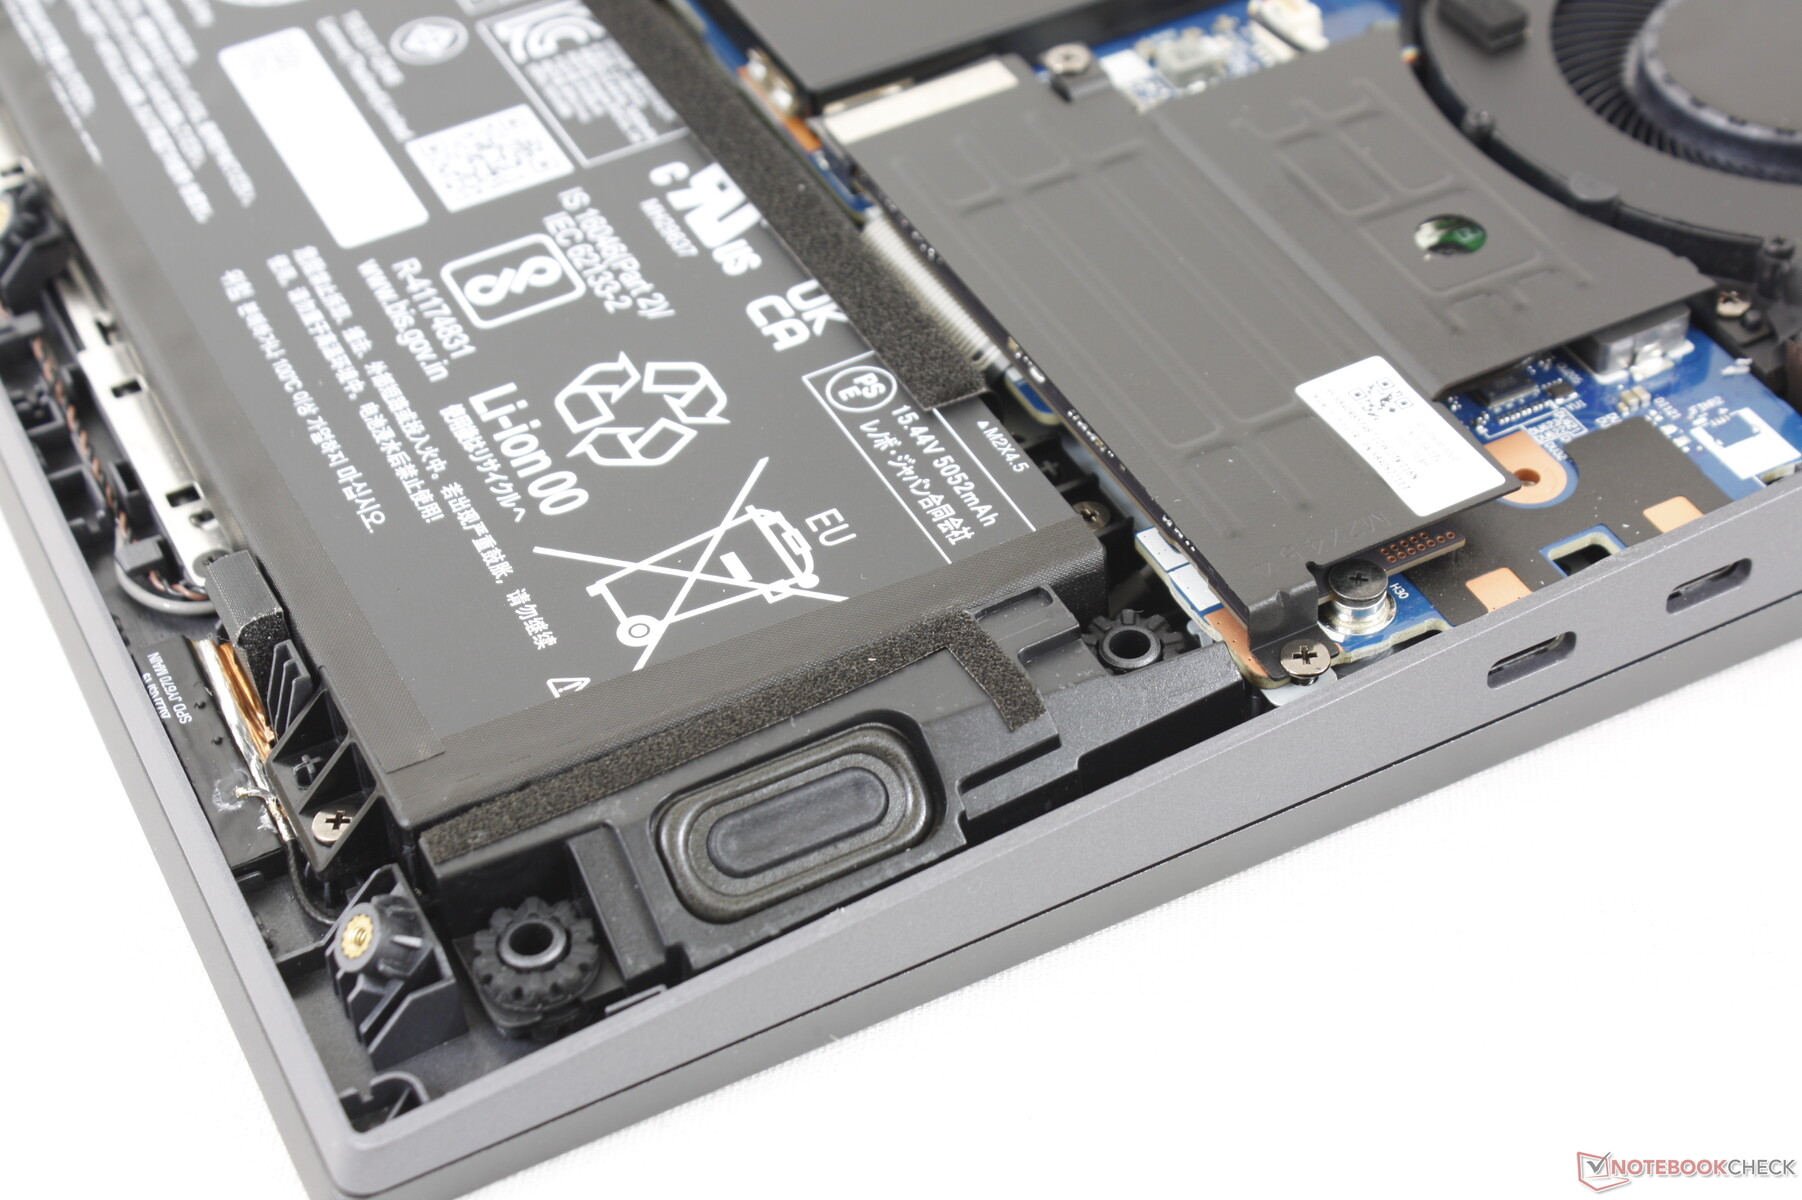
Lagringsenheter - Upp till två PCIe4 NVMe SSD-enheter

| Drive Performance rating - Percent | |
| Lenovo Legion 5 Pro 16IAH7H | |
| Lenovo Legion 5 Pro 16ARH7H RTX 3070 Ti | |
| Asus ROG Zephyrus M16 GU603H | |
| Dell G16 7620 | |
| Lenovo Legion 7 16ARHA7 | |
| HP Victus 16-e0145ng | |
* ... mindre är bättre
Disk Throttling: DiskSpd Read Loop, Queue Depth 8
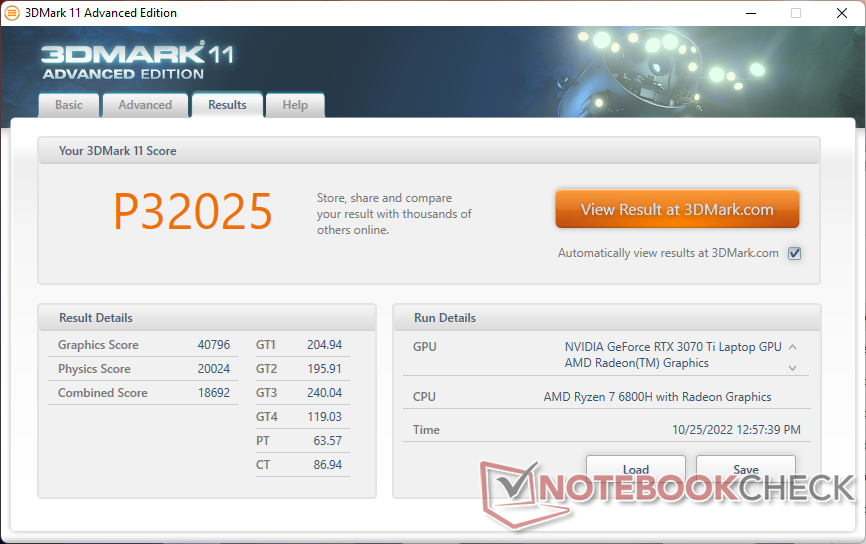
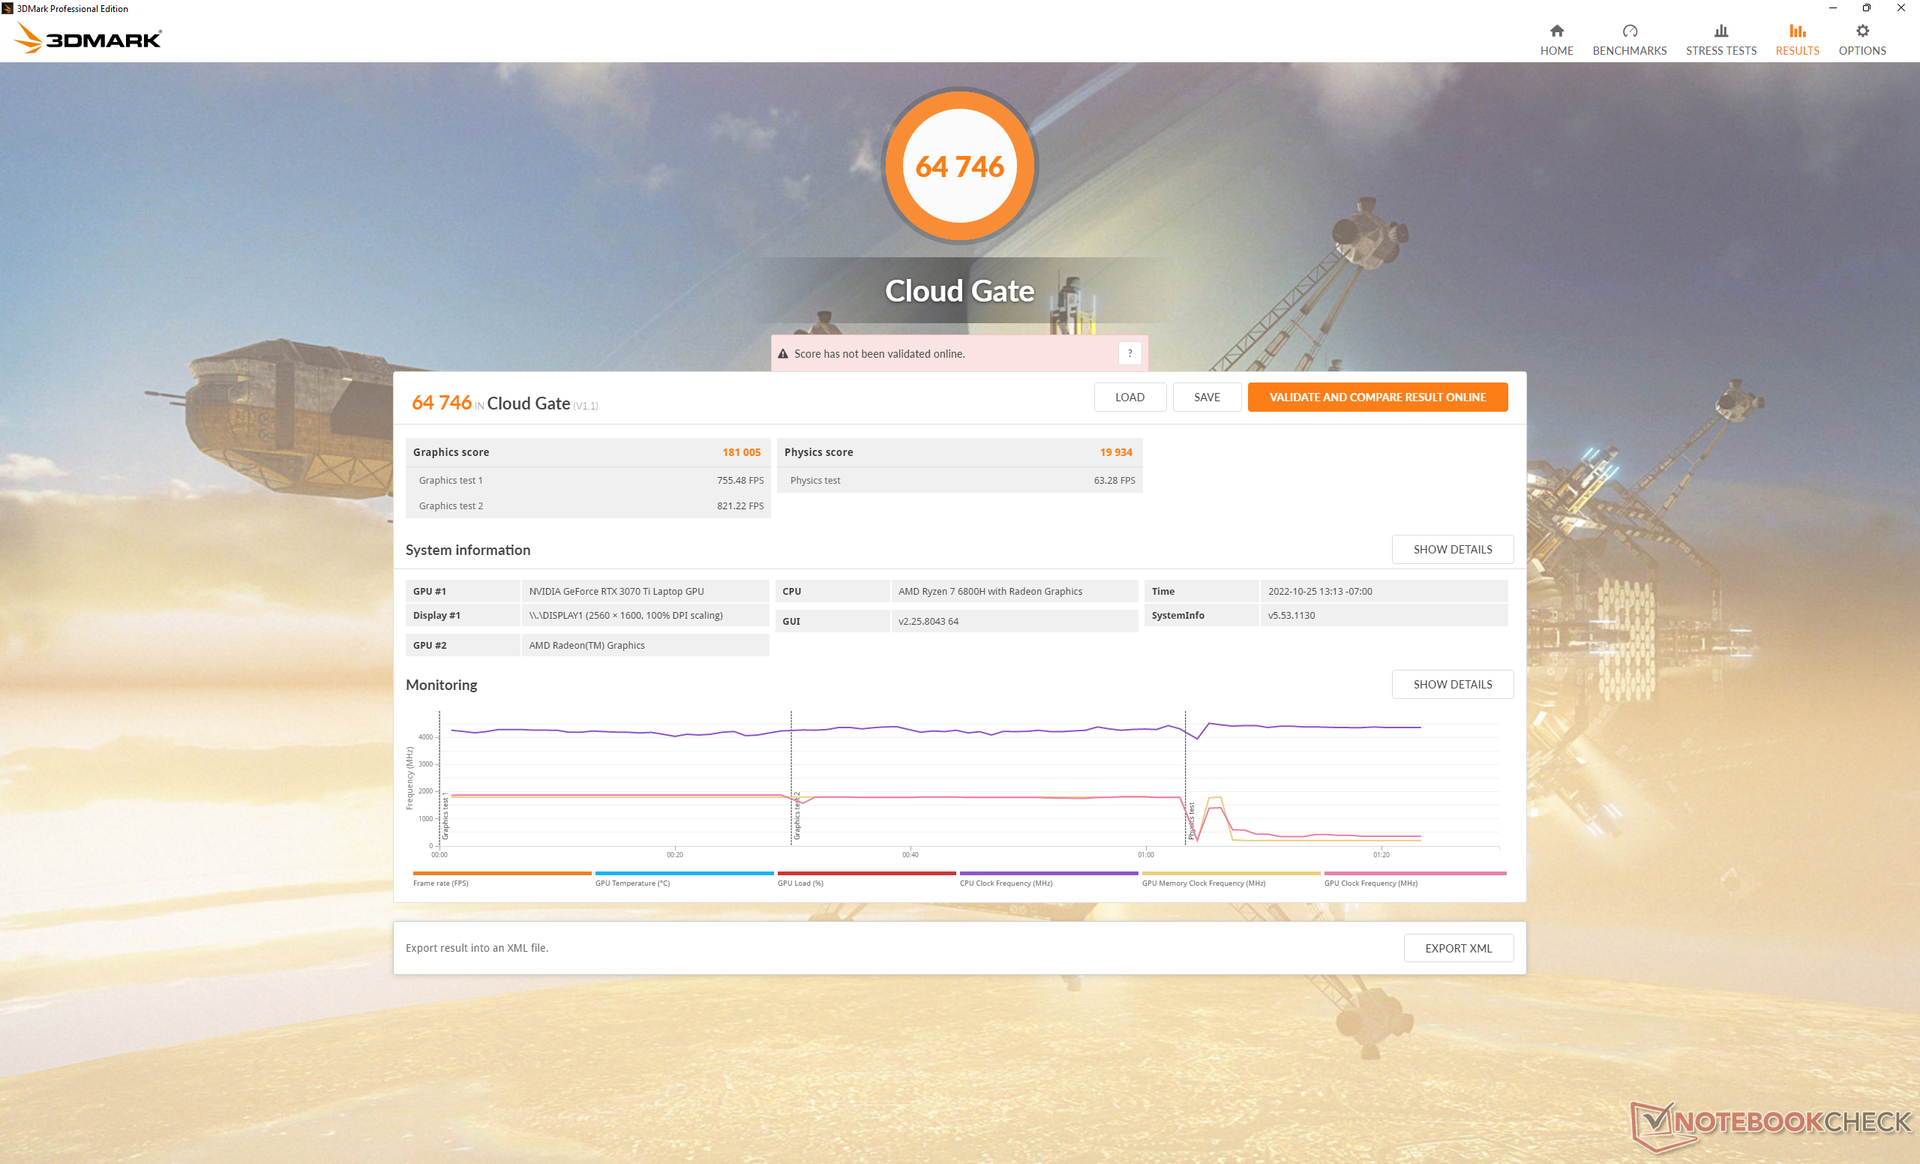
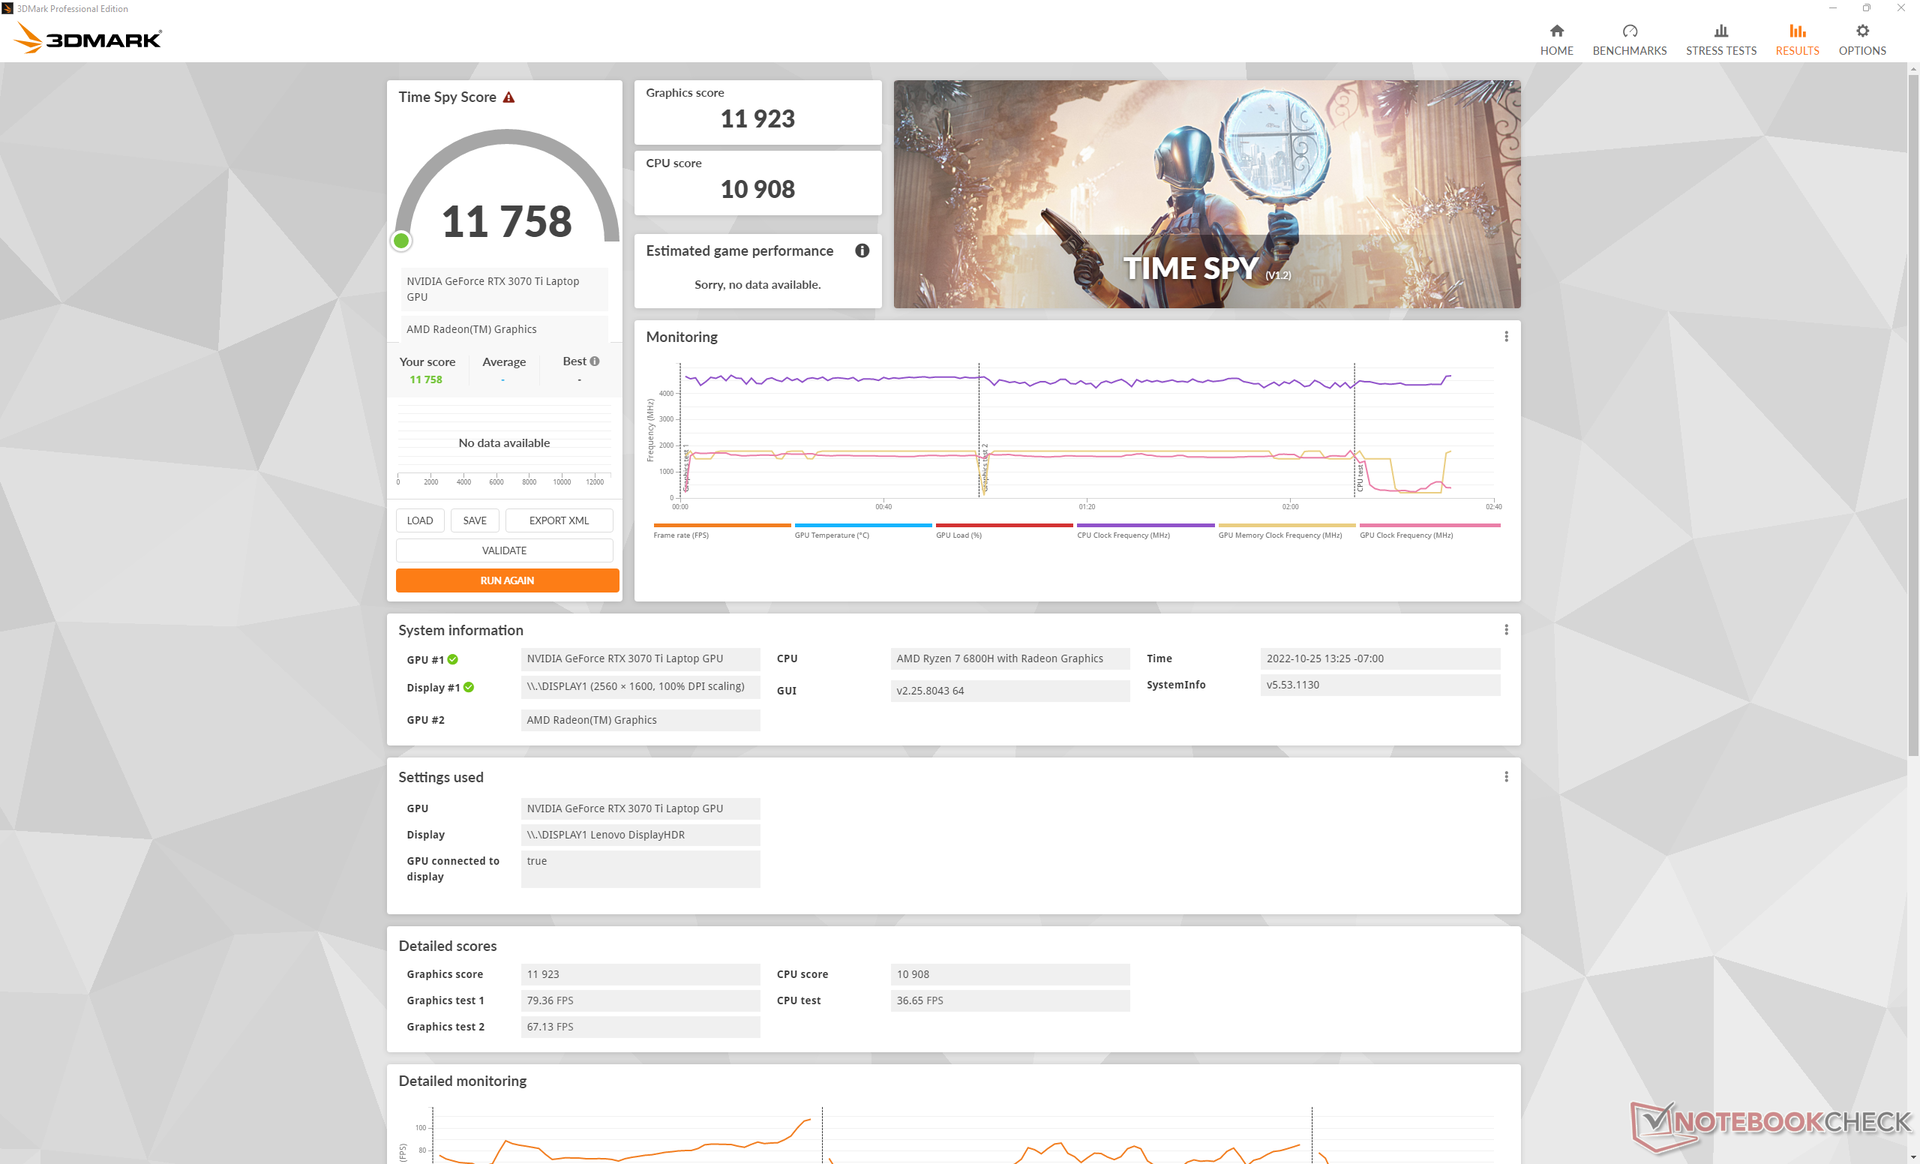
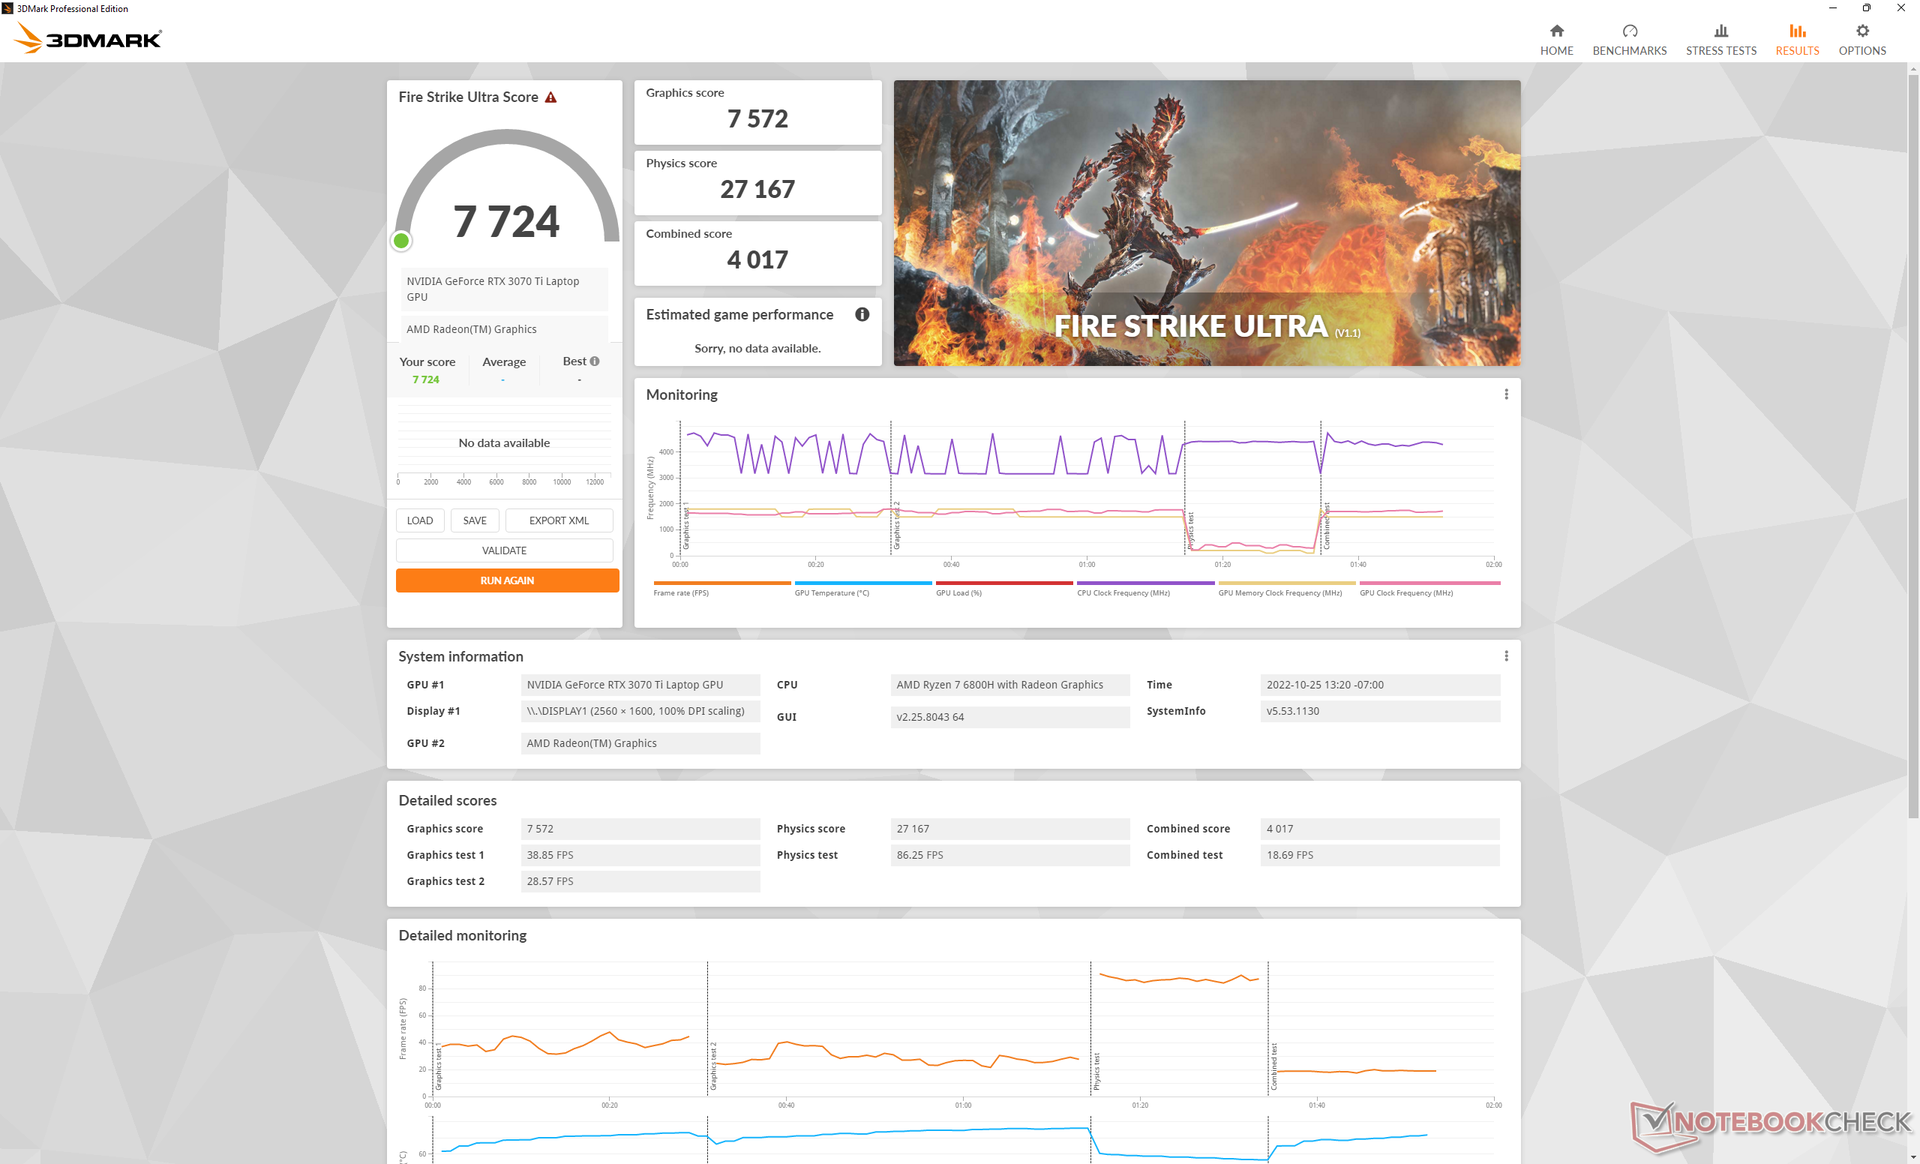
GPU-prestanda - 150 W grafik
Grafikprestandan är utmärkt med 3DMark-resultat som är nästan 15 procent snabbare än den genomsnittliga bärbara datorn i vår databas med samma GeForce RTX 3070 Ti GPU. Faktum är att den till och med överträffar RTX 3080 Ti i Alienware x15 R2.
Prestandan sjunker endast med cirka 5 procent om Turbo-läget är avstängt. Användarna måste alltså komma ihåg att aktivera turboläget via Lenovo Vantage om de vill köra den bärbara datorn som snabbast.
Nedgradering till den lägre versionen RTX 3070 eller RTX 3060 SKU innebär en prestandadämpning på cirka 10 procent respektive 30 procent, baserat på vår erfarenhet av flera bärbara RTX 3070- eller 3060-datorer.
| 3DMark 11 - 1280x720 Performance GPU | |
| Lenovo Legion 7 16ARHA7 | |
| Lenovo Legion 5 Pro 16ARH7H RTX 3070 Ti | |
| Alienware x15 R2 P111F | |
| Genomsnitt NVIDIA GeForce RTX 3070 Ti Laptop GPU (13799 - 42569, n=36) | |
| Gigabyte A5 X1 | |
| HP Omen 16-c0077ng | |
| Lenovo Legion 5 Pro 16IAH7H | |
| Lenovo Legion C7 15IMH05 82EH0030GE | |
| Acer Predator Triton 300 PT315-52-79LP | |
| HP Victus 16-e0145ng | |
| 3DMark 11 Performance | 32025 poäng | |
| 3DMark Cloud Gate Standard Score | 64746 poäng | |
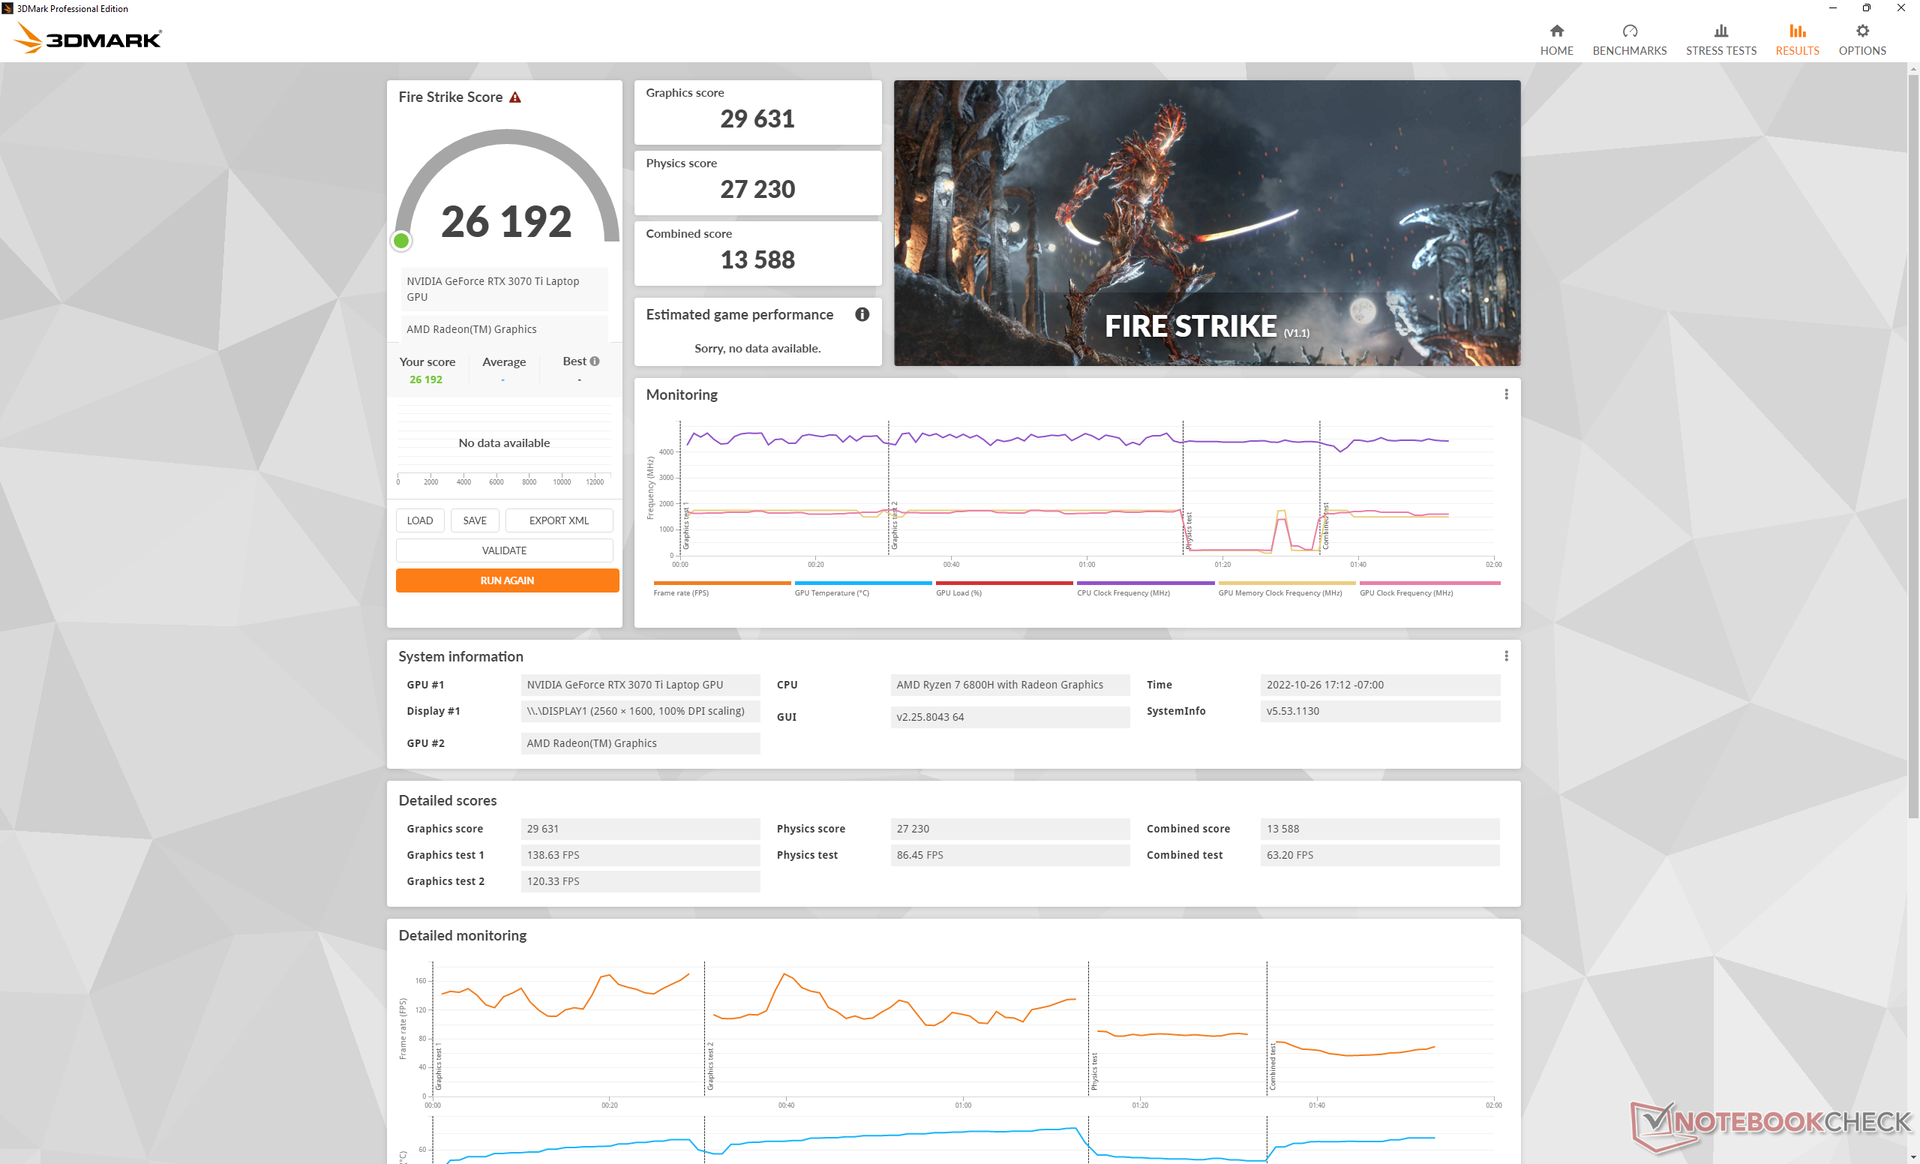
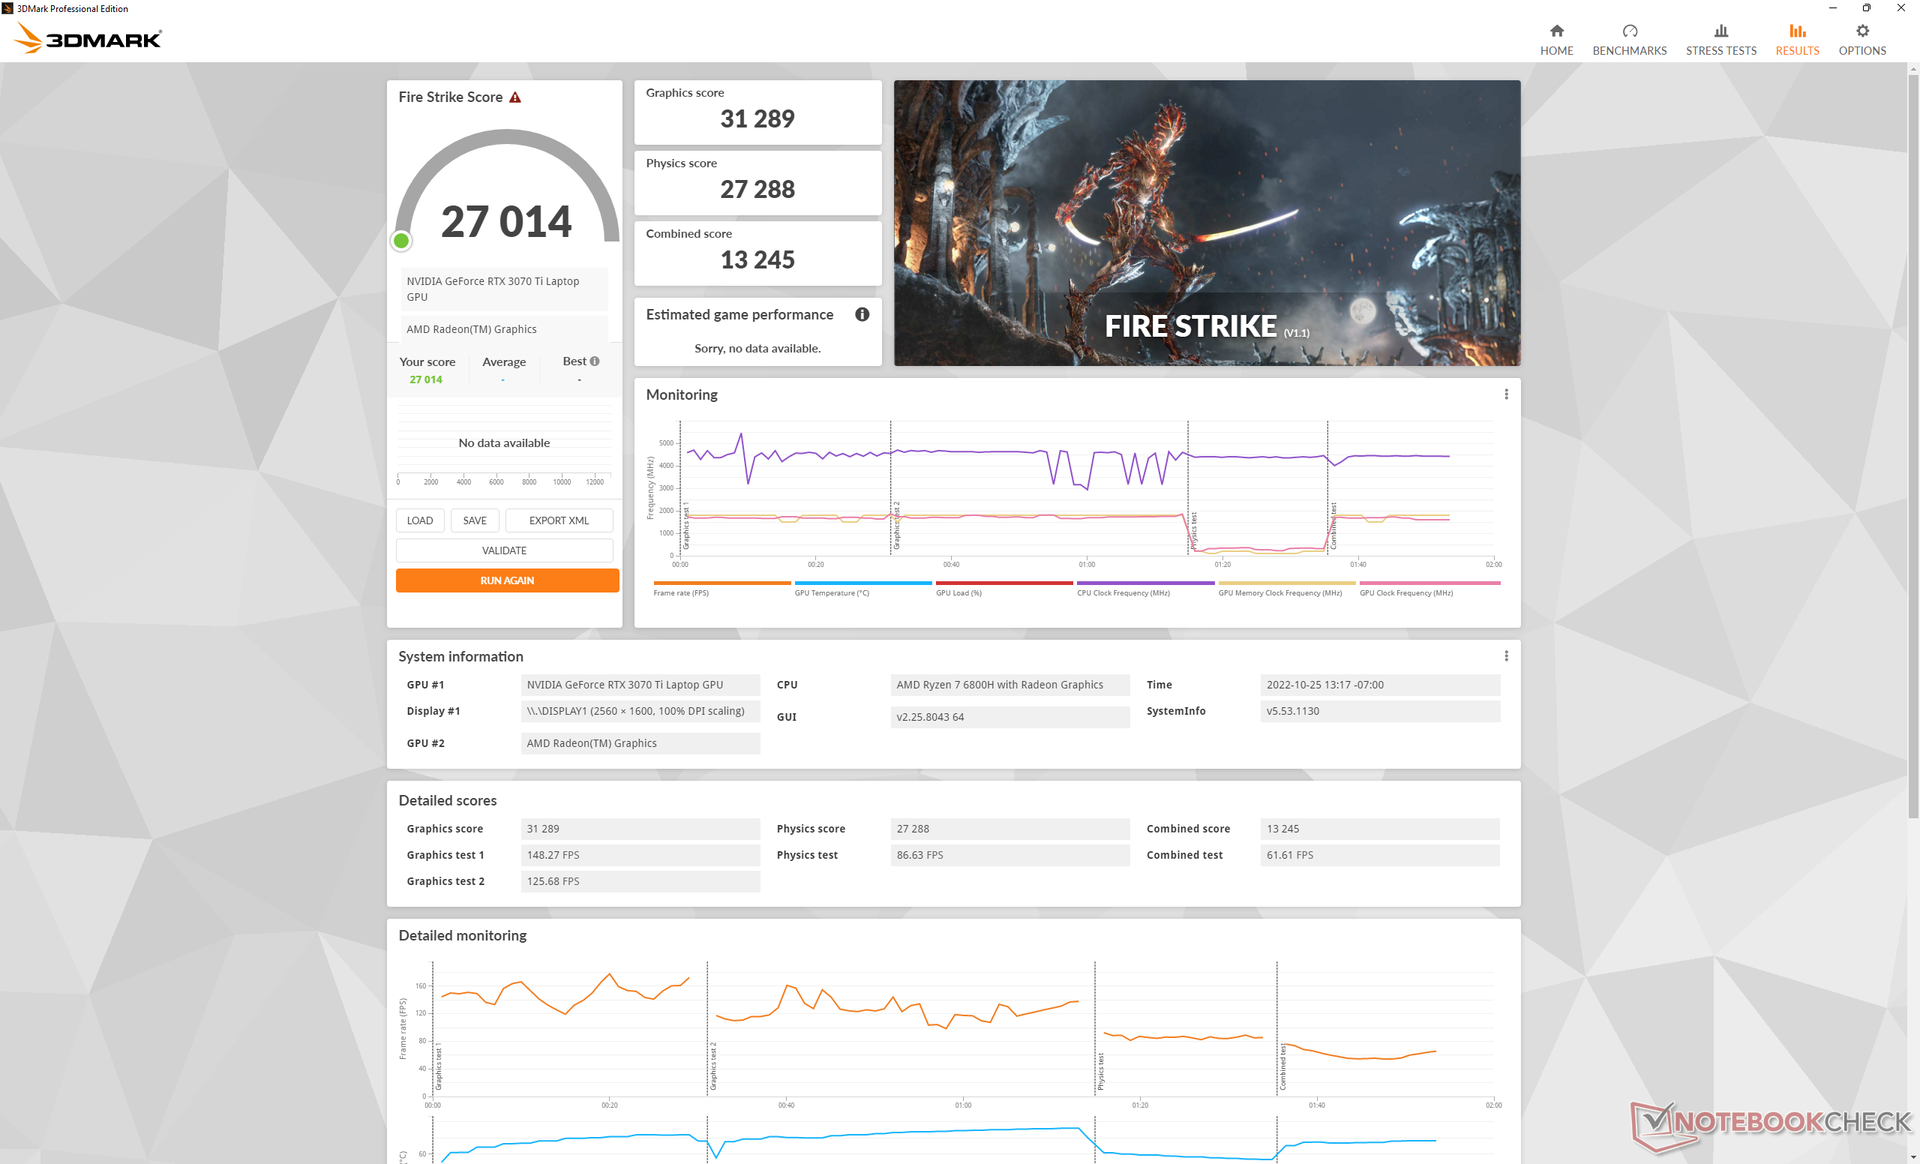
| 3DMark Fire Strike Score | 27014 poäng | |
| 3DMark Time Spy Score | 11758 poäng | |
Hjälp | ||
* ... mindre är bättre
| X-Plane 11.11 | |
| 1280x720 low (fps_test=1) | |
| Lenovo Legion 5 Pro 16IAH7H | |
| Alienware x15 R2 P111F | |
| Genomsnitt NVIDIA GeForce RTX 3070 Ti Laptop GPU (68.8 - 166.8, n=36) | |
| Lenovo Legion 5 Pro 16ARH7H RTX 3070 Ti | |
| Lenovo Legion C7 15IMH05 82EH0030GE | |
| Acer Predator Triton 300 PT315-52-79LP | |
| Gigabyte A5 X1 | |
| HP Victus 16-e0145ng | |
| Lenovo Legion 7 16ARHA7 | |
| 1920x1080 med (fps_test=2) | |
| Lenovo Legion 5 Pro 16IAH7H | |
| Alienware x15 R2 P111F | |
| Genomsnitt NVIDIA GeForce RTX 3070 Ti Laptop GPU (57.3 - 145.7, n=36) | |
| Lenovo Legion 5 Pro 16ARH7H RTX 3070 Ti | |
| Lenovo Legion C7 15IMH05 82EH0030GE | |
| HP Victus 16-e0145ng | |
| Gigabyte A5 X1 | |
| Acer Predator Triton 300 PT315-52-79LP | |
| Lenovo Legion 7 16ARHA7 | |
| 1920x1080 high (fps_test=3) | |
| Lenovo Legion 5 Pro 16IAH7H | |
| Alienware x15 R2 P111F | |
| Genomsnitt NVIDIA GeForce RTX 3070 Ti Laptop GPU (51.6 - 116.9, n=37) | |
| Lenovo Legion C7 15IMH05 82EH0030GE | |
| Lenovo Legion 5 Pro 16ARH7H RTX 3070 Ti | |
| Acer Predator Triton 300 PT315-52-79LP | |
| Gigabyte A5 X1 | |
| HP Victus 16-e0145ng | |
| HP Omen 16-c0077ng | |
| Lenovo Legion 7 16ARHA7 | |
Witcher 3 FPS Chart
| låg | med. | hög | ultra | QHD | |
|---|---|---|---|---|---|
| GTA V (2015) | 181.5 | 176.5 | 167.6 | 104 | 98.8 |
| The Witcher 3 (2015) | 370.5 | 308.8 | 226 | 117 | |
| Dota 2 Reborn (2015) | 150.4 | 138 | 132.2 | 126.6 | |
| Final Fantasy XV Benchmark (2018) | 187.2 | 156 | 115.6 | 90.4 | |
| X-Plane 11.11 (2018) | 119.6 | 103.6 | 83.9 | ||
| Strange Brigade (2018) | 383 | 298 | 248 | 217 | 160.5 |
| Cyberpunk 2077 1.6 (2022) | 148.9 | 130.2 | 102.1 | 86 | 54.4 |
Utsläpp - ganska högljudda
Systembrus
Fläktljudet är kopplat till inställningen för strömprofilen. I energisparläge med den diskreta GPU:n inaktiverad skulle systemet till exempel vara tyst med 23,7 dB(A) mot en tyst bakgrund på 23,5 dB(A). Tyvärr räcker det med lätt multitasking eller videostreaming för att öka ljudet till mer hörbara 32 dB(A) ungefär som vi observerade på förra årets modell
Spelande ger upphov till ett fläktljud på nästan 55 dB(A) även om Turbo-läget är avaktiverat. Du kan alltså lika gärna aktivera Turbo-läget när du spelar eftersom det inte verkar göra systemet varken högre eller tystare. Mittfåran på 50 dB(A) är högre än vad vi noterade på HP Victus 16 eller Dell G16 under liknande förhållanden.
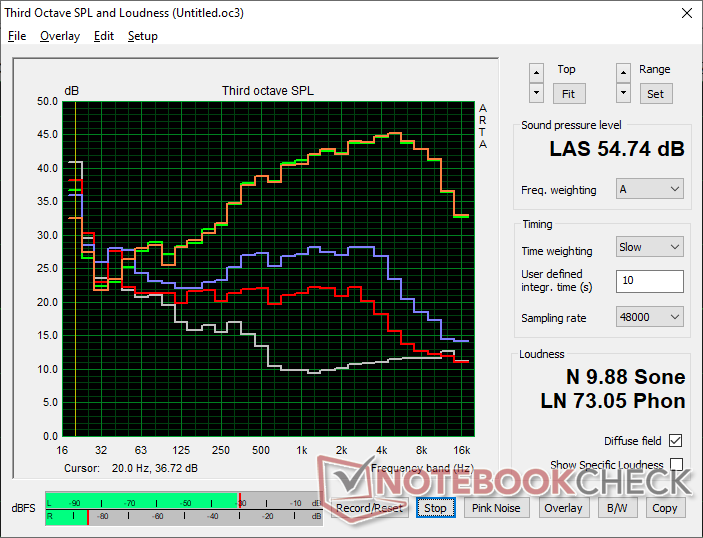
Ljudnivå
| Låg belastning |
| 23.7 / 31.1 / 32.2 dB(A) |
| Hög belastning |
| 38.4 / 54.8 dB(A) |
 | ||
30 dB tyst 40 dB(A) hörbar 50 dB(A) högt ljud |
||
min: | ||
| Lenovo Legion 5 Pro 16ARH7H RTX 3070 Ti GeForce RTX 3070 Ti Laptop GPU, R7 6800H, Samsung PM9A1 MZVL21T0HCLR | Lenovo Legion 5 Pro 16IAH7H GeForce RTX 3060 Laptop GPU, i7-12700H, 2x Samsung PM9A1 MZVL21T0HCLR (RAID 0) | Asus ROG Zephyrus M16 GU603H GeForce RTX 3070 Laptop GPU, i9-11900H, Samsung PM9A1 MZVL22T0HBLB | Lenovo Legion 7 16ARHA7 Radeon RX 6850M XT, R9 6900HX, Samsung PM9A1 MZVL22T0HBLB | HP Victus 16-e0145ng GeForce RTX 3050 Ti Laptop GPU, R5 5600H, Samsung SSD PM981a MZVLB512HBJQ | Dell G16 7620 GeForce RTX 3060 Laptop GPU, i7-12700H, WDC PC SN810 512GB | |
|---|---|---|---|---|---|---|
| Noise | -8% | -9% | 13% | -2% | 6% | |
| av / miljö * (dB) | 23.5 | 24.6 -5% | 25 -6% | 22.8 3% | 26 -11% | 23.2 1% |
| Idle Minimum * (dB) | 23.7 | 28.7 -21% | 25 -5% | 23 3% | 26 -10% | 28.3 -19% |
| Idle Average * (dB) | 31.1 | 32 -3% | 31 -0% | 23 26% | 28 10% | 28.8 7% |
| Idle Maximum * (dB) | 32.2 | 32 1% | 42 -30% | 23 29% | 34 -6% | 28.9 10% |
| Load Average * (dB) | 38.4 | 45.2 -18% | 48 -25% | 26.8 30% | 44 -15% | 32.4 16% |
| Witcher 3 ultra * (dB) | 54.8 | 52 5% | 54.3 1% | 48 12% | 48.3 12% | |
| Load Maximum * (dB) | 54.8 | 54.4 1% | 56 -2% | 54.2 1% | 53 3% | 48.1 12% |
* ... mindre är bättre
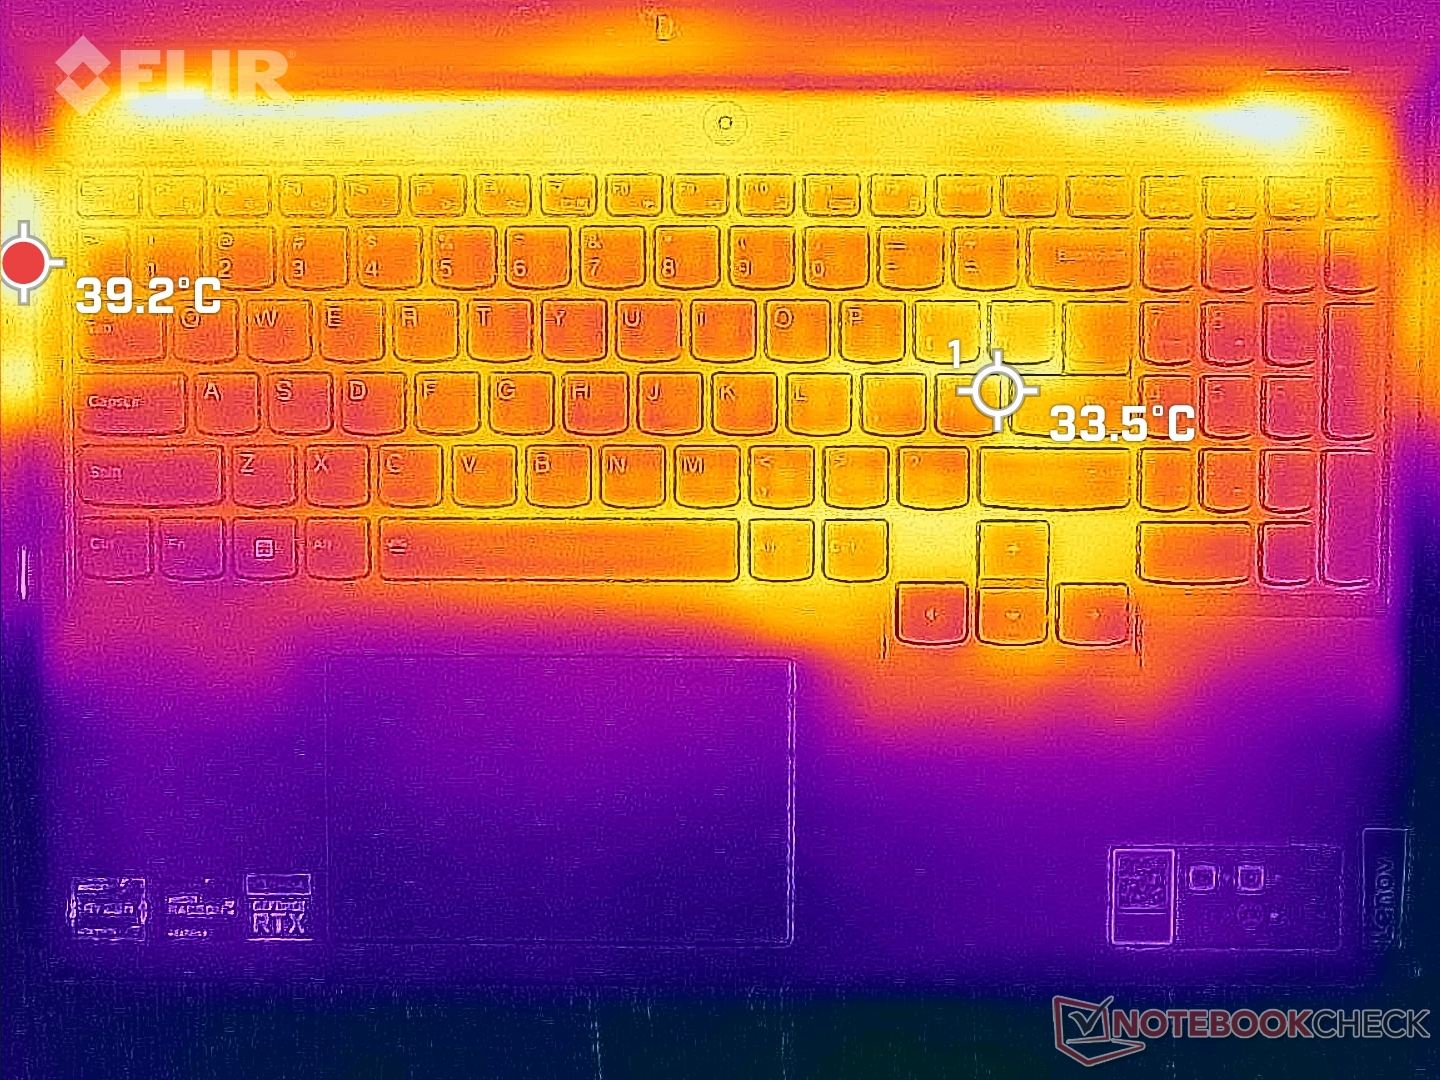
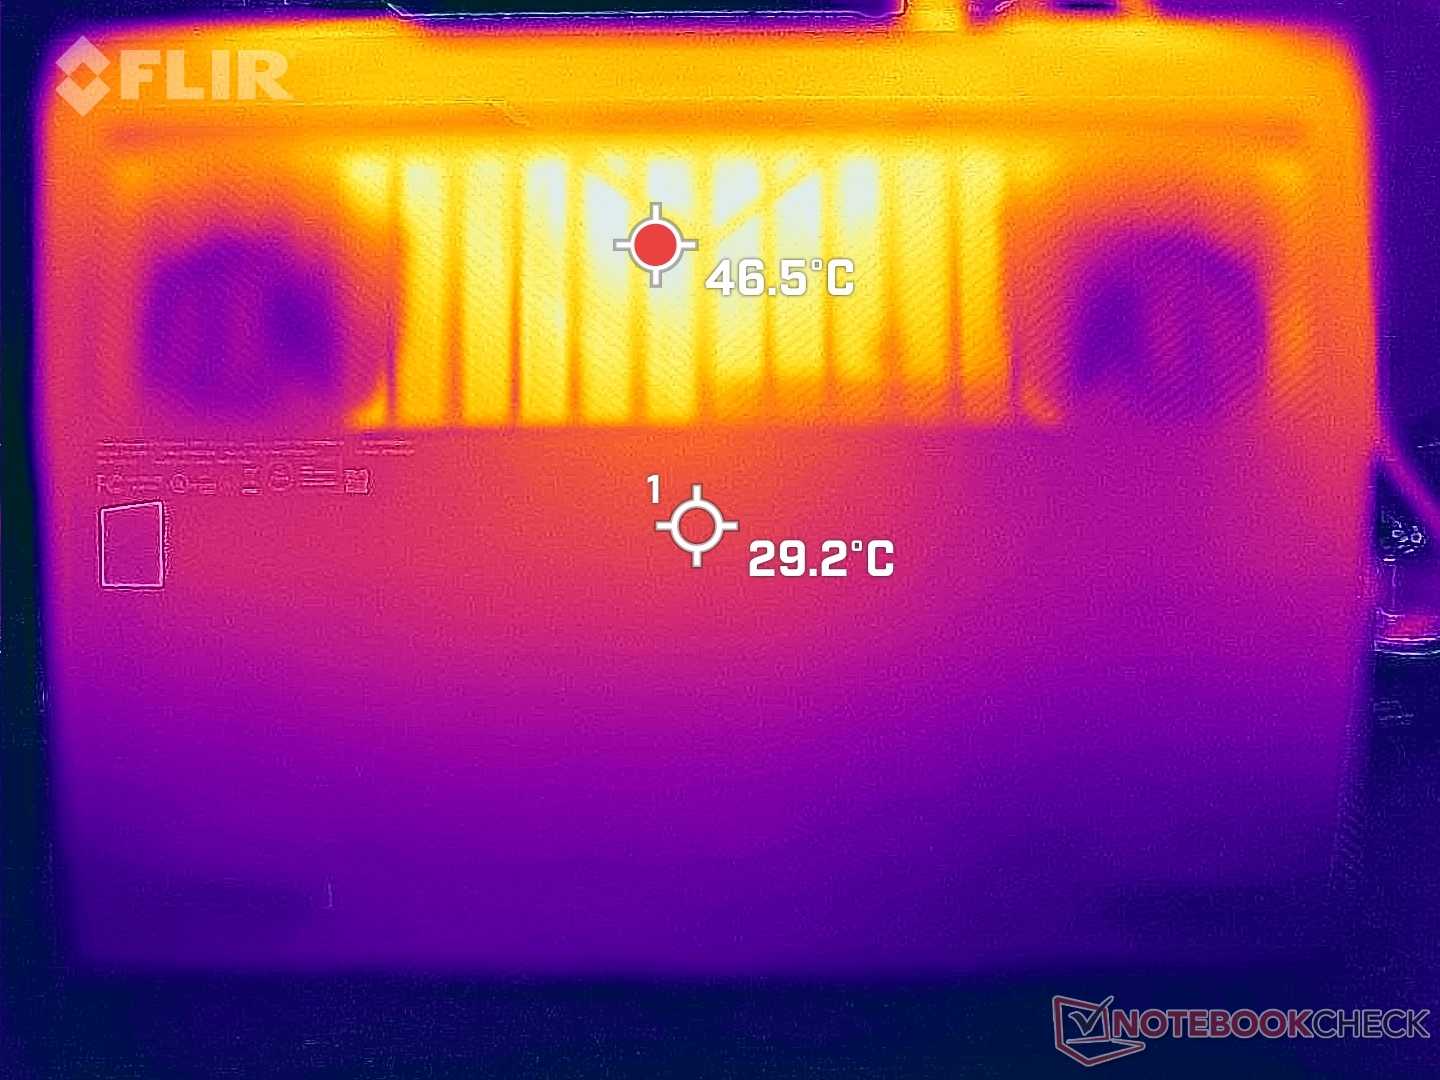
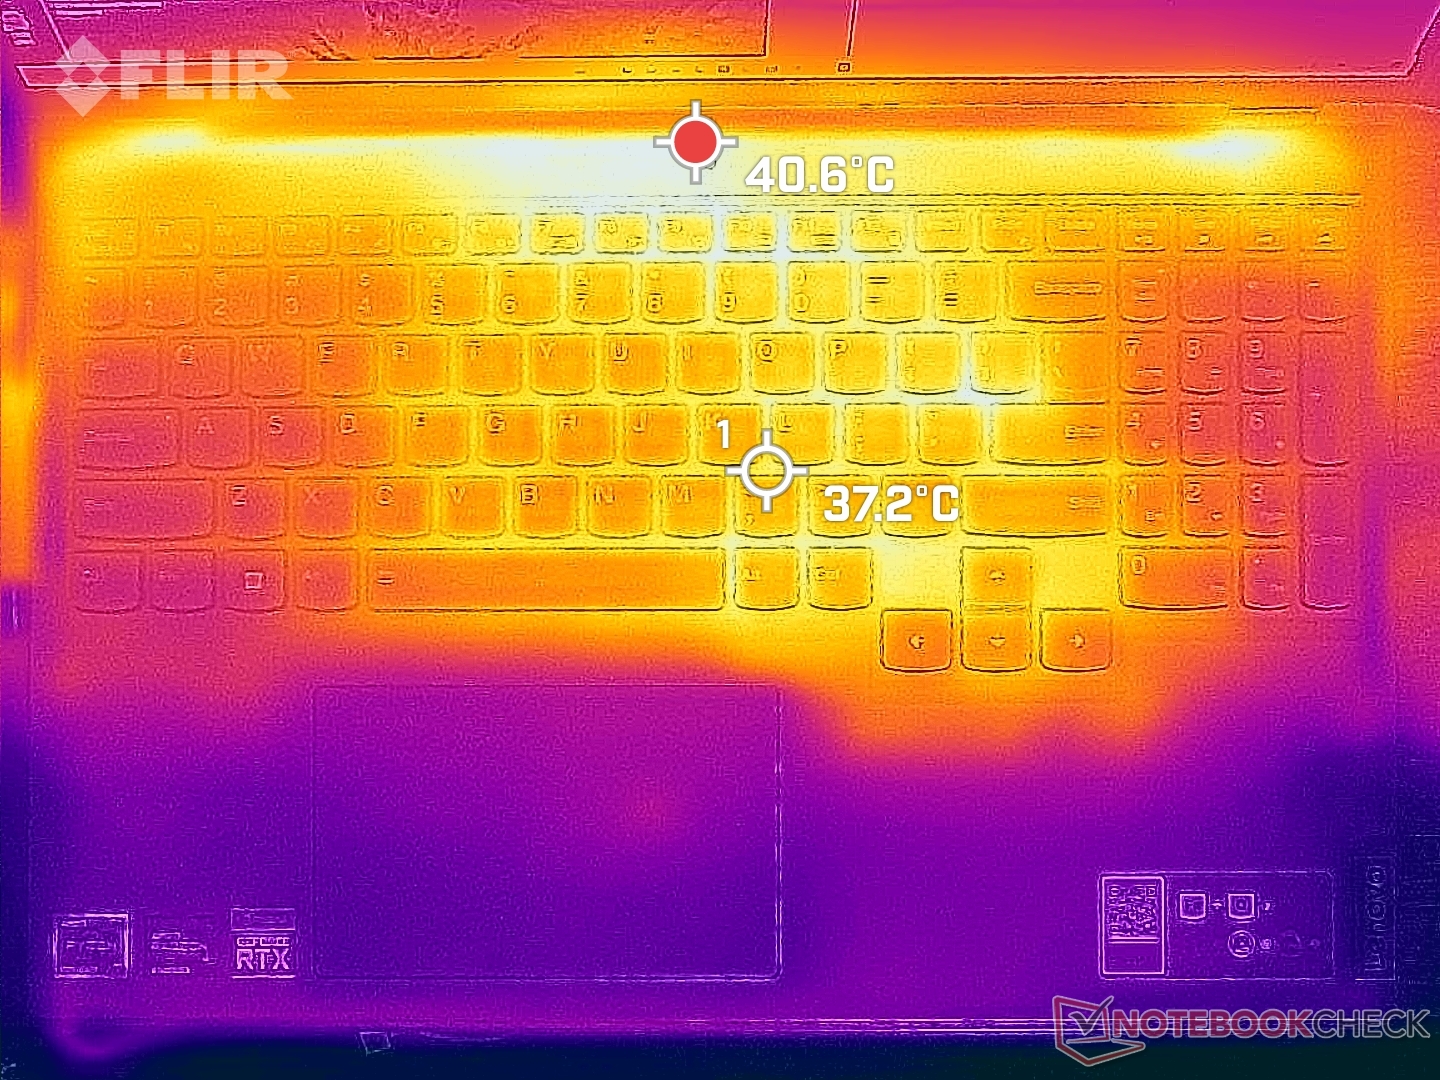
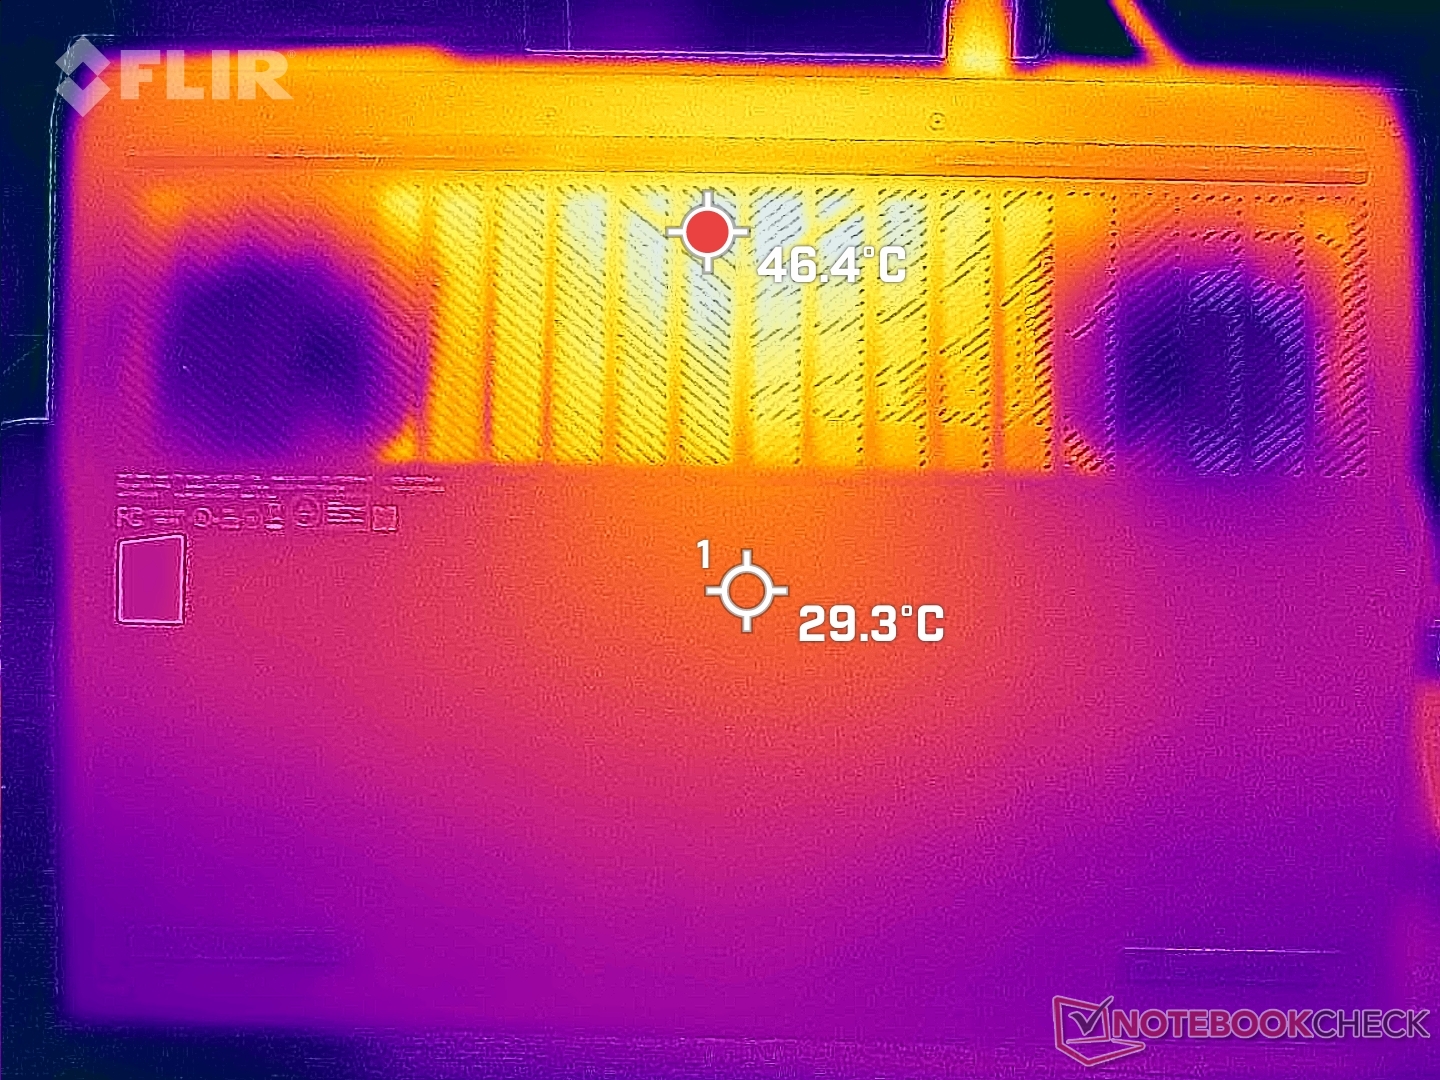
Temperatur
Den genomsnittliga yttemperaturen är mycket svalare än på Asus ROG Zephyrus M16, även om deras hot spots är likartade. Till exempel kan de hetaste platserna på Lenovo och Asus nå upp till 53 C vardera, men handflatorna och tangentbordsytorna på Lenovo är märkbart svalare och därmed bekvämare att spela på.
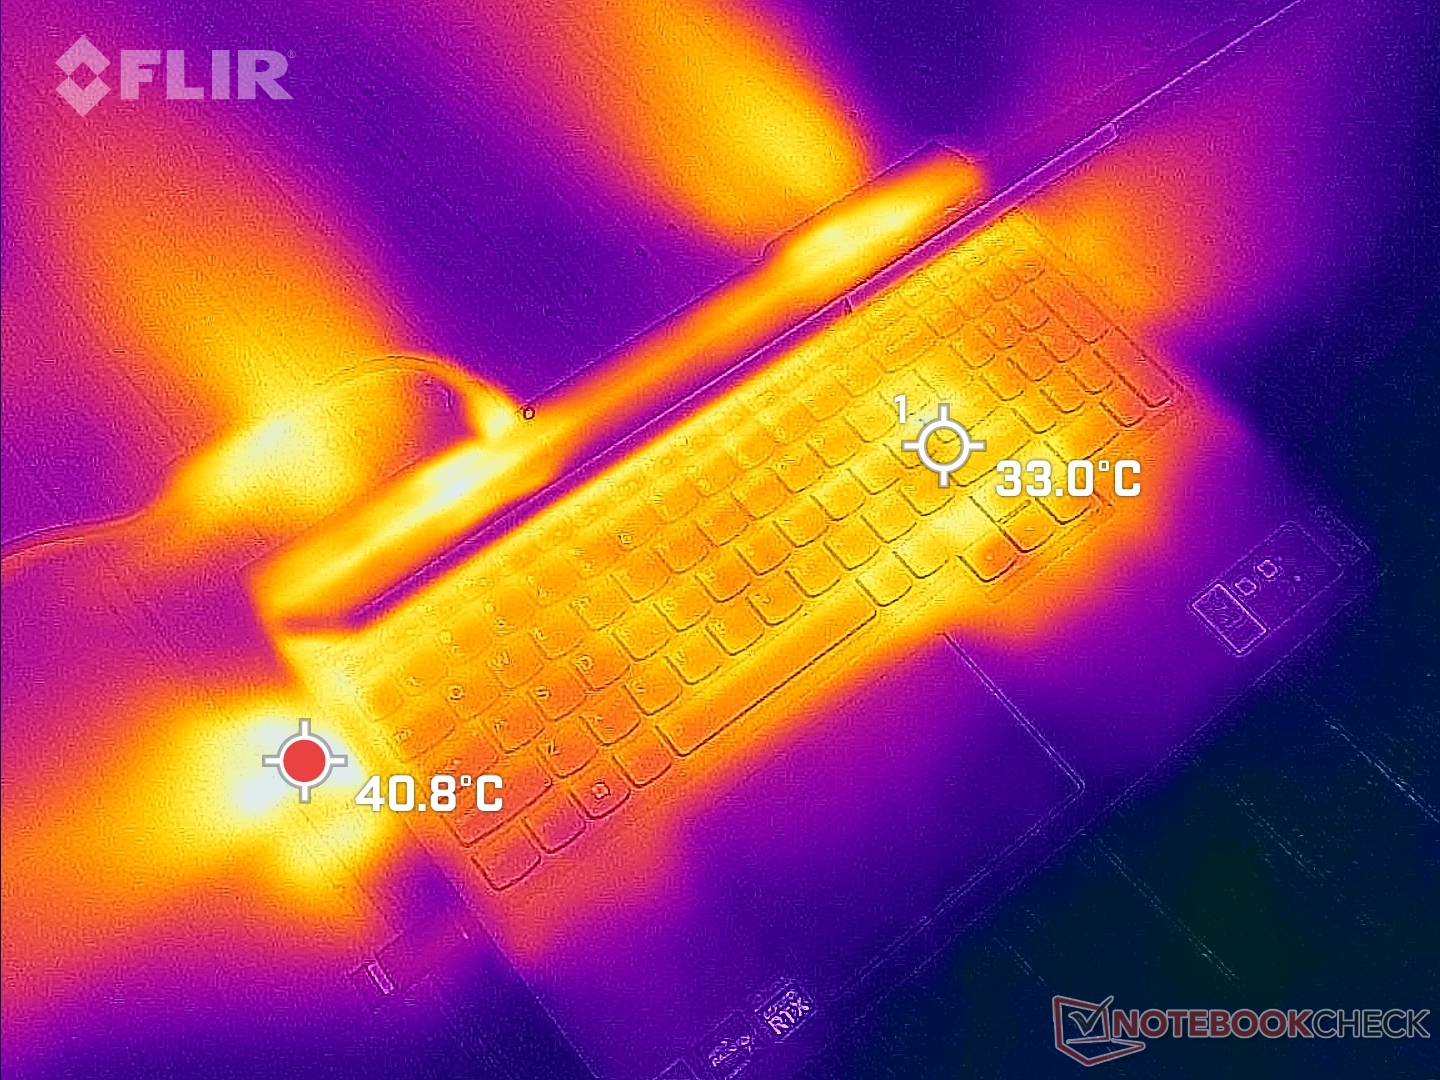
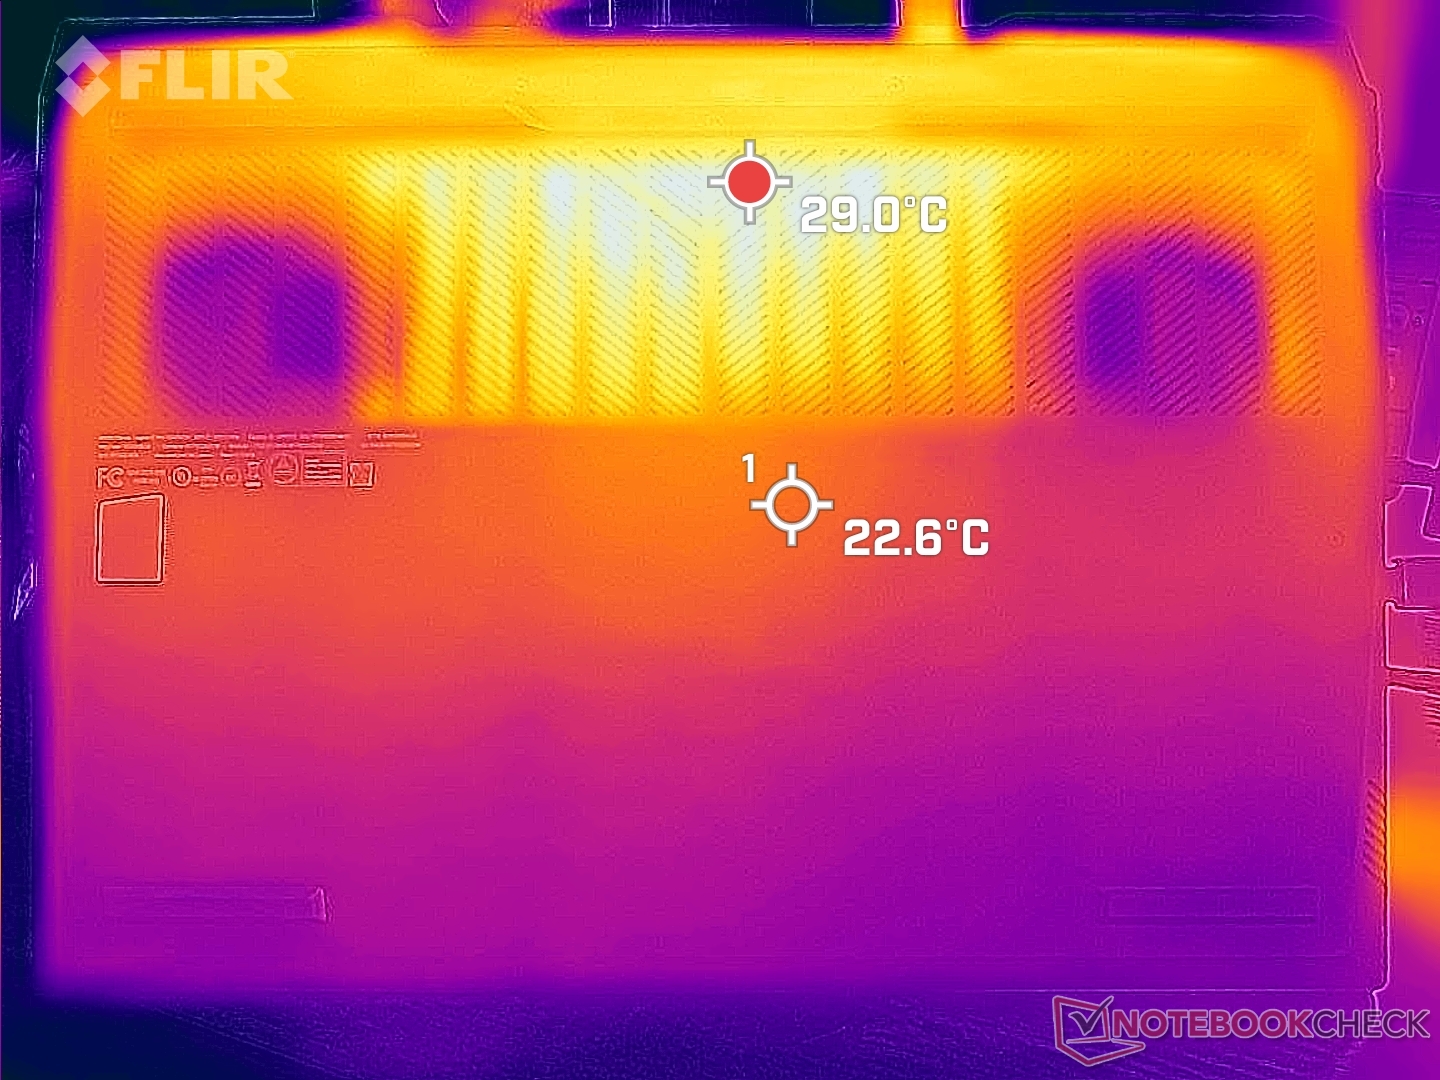
(±) Den maximala temperaturen på ovansidan är 43.8 °C / 111 F, jämfört med genomsnittet av 40.4 °C / 105 F , allt från 21.2 till 68.8 °C för klassen Gaming.
(-) Botten värms upp till maximalt 53 °C / 127 F, jämfört med genomsnittet av 43.2 °C / 110 F
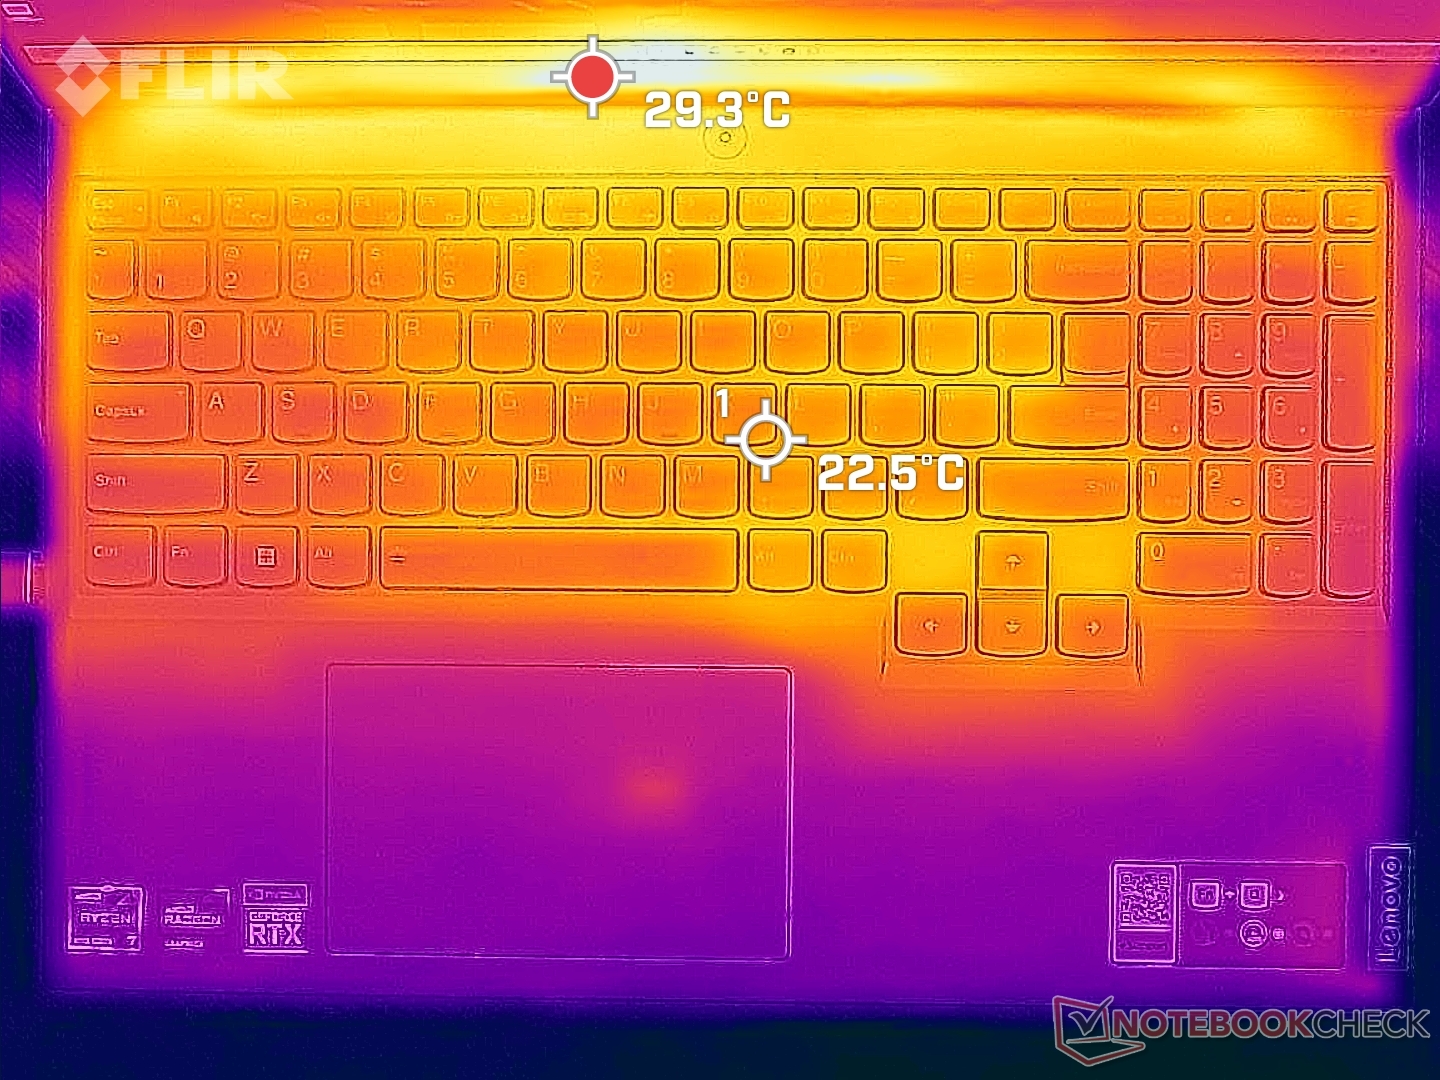
(+) Vid tomgångsbruk är medeltemperaturen för ovansidan 27.4 °C / 81 F, jämfört med enhetsgenomsnittet på 33.9 °C / ### class_avg_f### F.
(±) När du spelar The Witcher 3 är medeltemperaturen för ovansidan 33.5 °C / 92 F, jämfört med enhetsgenomsnittet på 33.9 °C / ## #class_avg_f### F.
(+) Handledsstöden och pekplattan är kallare än hudtemperaturen med maximalt 29.4 °C / 84.9 F och är därför svala att ta på.
(±) Medeltemperaturen för handledsstödsområdet på liknande enheter var 28.8 °C / 83.8 F (-0.6 °C / -1.1 F).
| Lenovo Legion 5 Pro 16ARH7H RTX 3070 Ti AMD Ryzen 7 6800H, NVIDIA GeForce RTX 3070 Ti Laptop GPU | Lenovo Legion 5 Pro 16IAH7H Intel Core i7-12700H, NVIDIA GeForce RTX 3060 Laptop GPU | Asus ROG Zephyrus M16 GU603H Intel Core i9-11900H, NVIDIA GeForce RTX 3070 Laptop GPU | Lenovo Legion 7 16ARHA7 AMD Ryzen 9 6900HX, AMD Radeon RX 6850M XT | HP Victus 16-e0145ng AMD Ryzen 5 5600H, NVIDIA GeForce RTX 3050 Ti Laptop GPU | Dell G16 7620 Intel Core i7-12700H, NVIDIA GeForce RTX 3060 Laptop GPU | |
|---|---|---|---|---|---|---|
| Heat | -7% | -19% | 5% | -12% | 9% | |
| Maximum Upper Side * (°C) | 43.8 | 45.8 -5% | 52 -19% | 37.2 15% | 54 -23% | 47.6 -9% |
| Maximum Bottom * (°C) | 53 | 66.3 -25% | 53 -0% | 43 19% | 47 11% | 54 -2% |
| Idle Upper Side * (°C) | 30 | 30.4 -1% | 38 -27% | 34 -13% | 41 -37% | 23 23% |
| Idle Bottom * (°C) | 31.8 | 30.4 4% | 41 -29% | 32.8 -3% | 31 3% | 24.6 23% |
* ... mindre är bättre
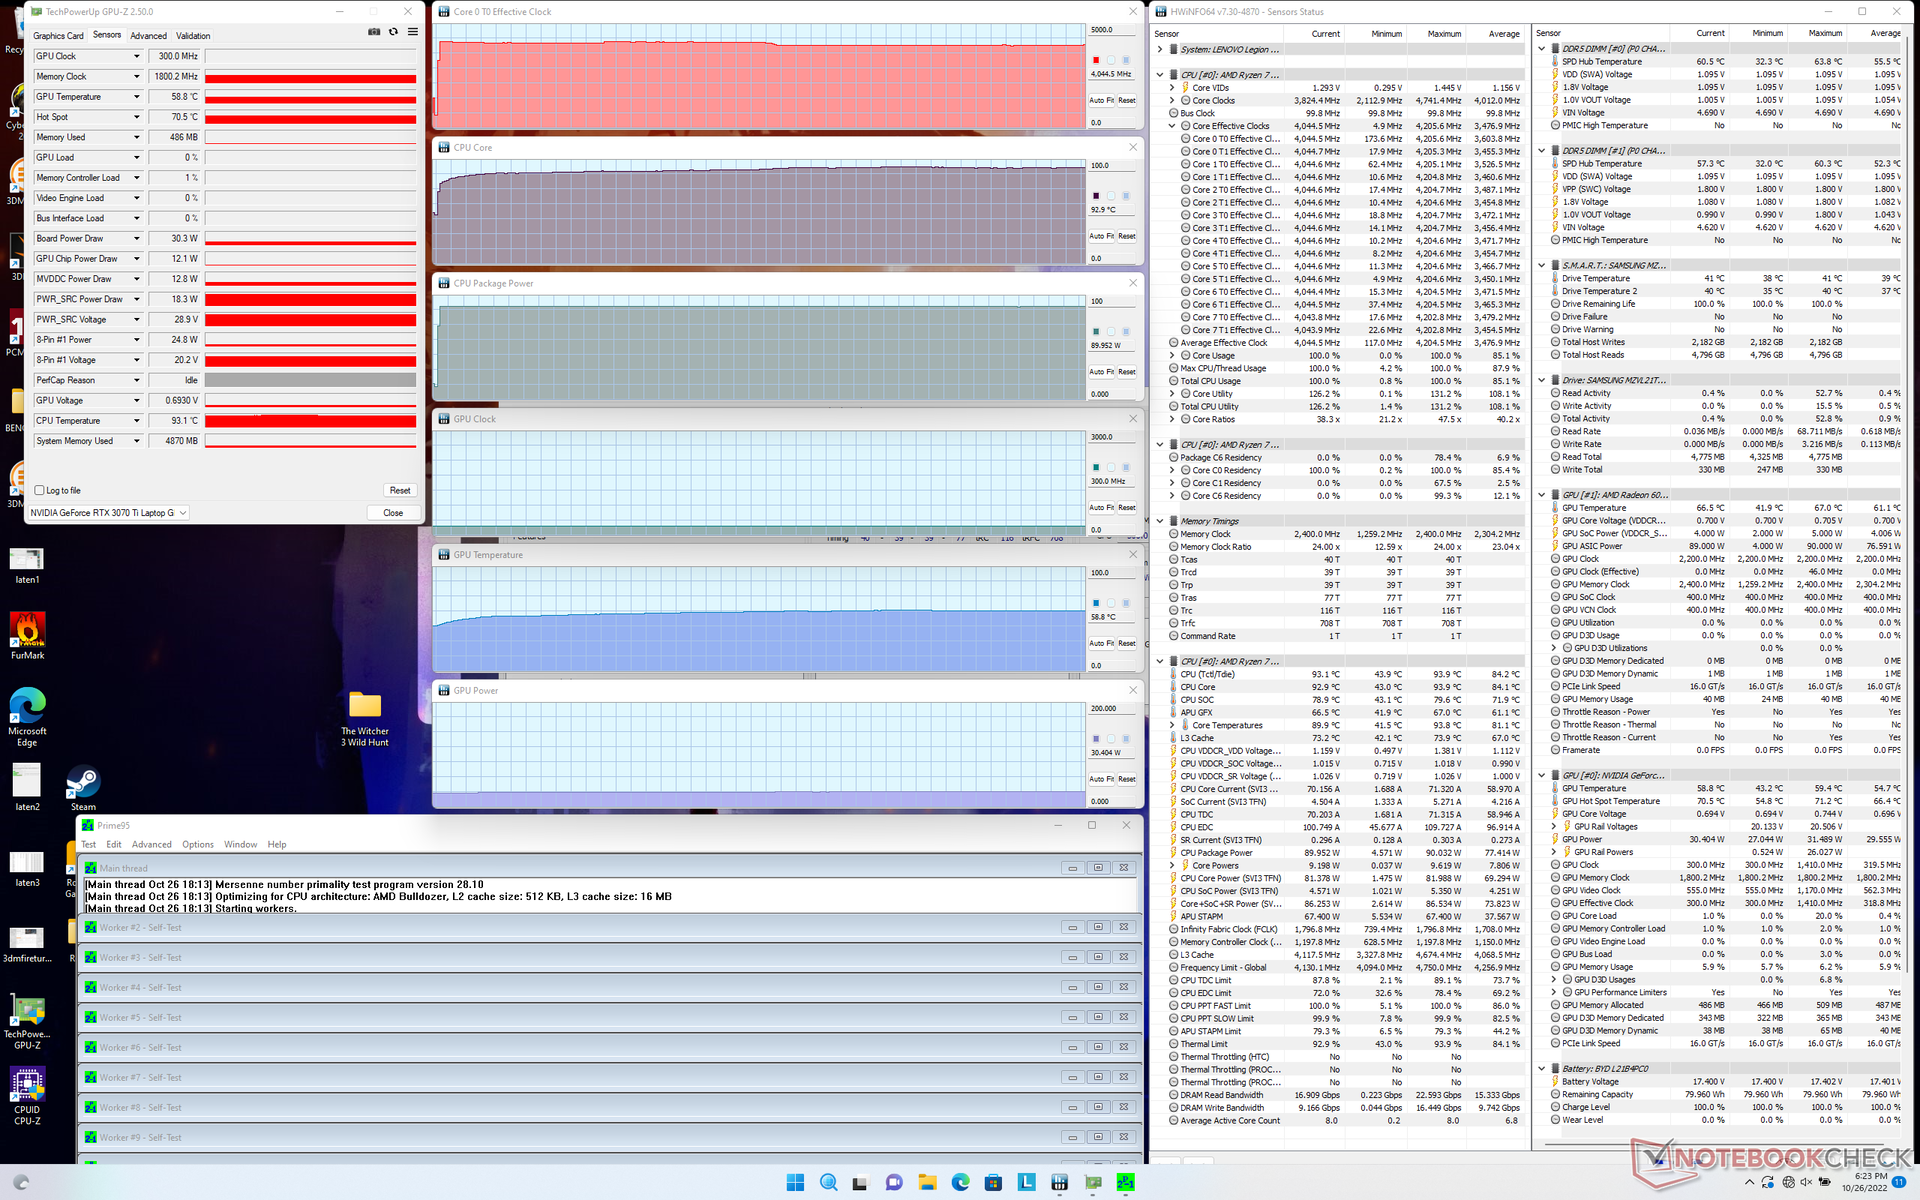
Stresstest
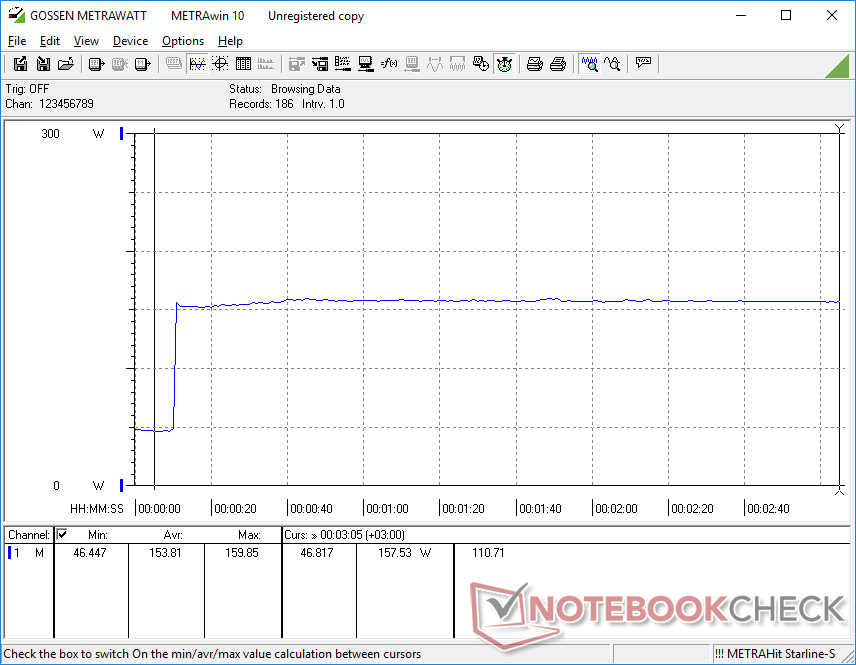
Under Prime95-stress ökade processorn till 4,2 GHz och 90 W i all oändlighet utan att behöva strypas. Tyvärr blir kärntemperaturen mycket varm vid strax under 95 C, vilket är varmare än på de flesta andra bärbara speldatorer.
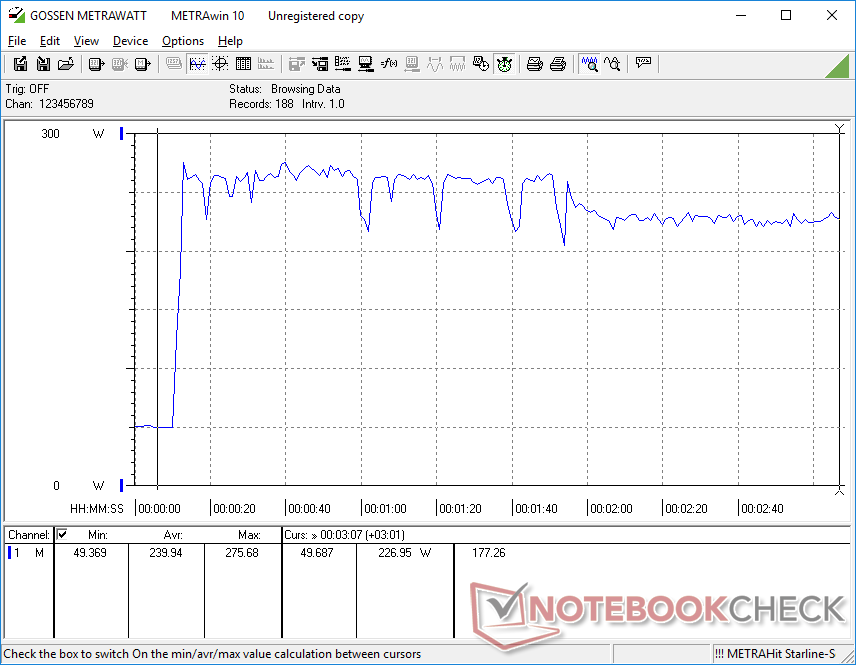
När du kör Witcher 3 med Turbo-läget aktivt skulle Nvidias GPU stabiliseras vid 1620 MHz kärnfrekvens, 1800 MHz minnesfrekvens och 136 W strömförbrukning. Intressant nog skulle en upprepning av det här testet med Turbo-läget inaktiverat resultera i långsammare kärn- och minnesklockor på 1605 MHz respektive 1750 MHz, men en högre strömförbrukning på 149 W. Du bör aktivera Turbo-läget i alla fall eftersom grafikprestandan fortfarande är något snabbare än med Turbo-läget inaktiverat.
Att köra på batteri begränsar prestandan. Ett Fire Strike -test på batterier skulle ge fysik- och grafikpoäng på 20957 respektive 13153 poäng, jämfört med 27288 och 31289 poäng när den är på strömförsörjning.
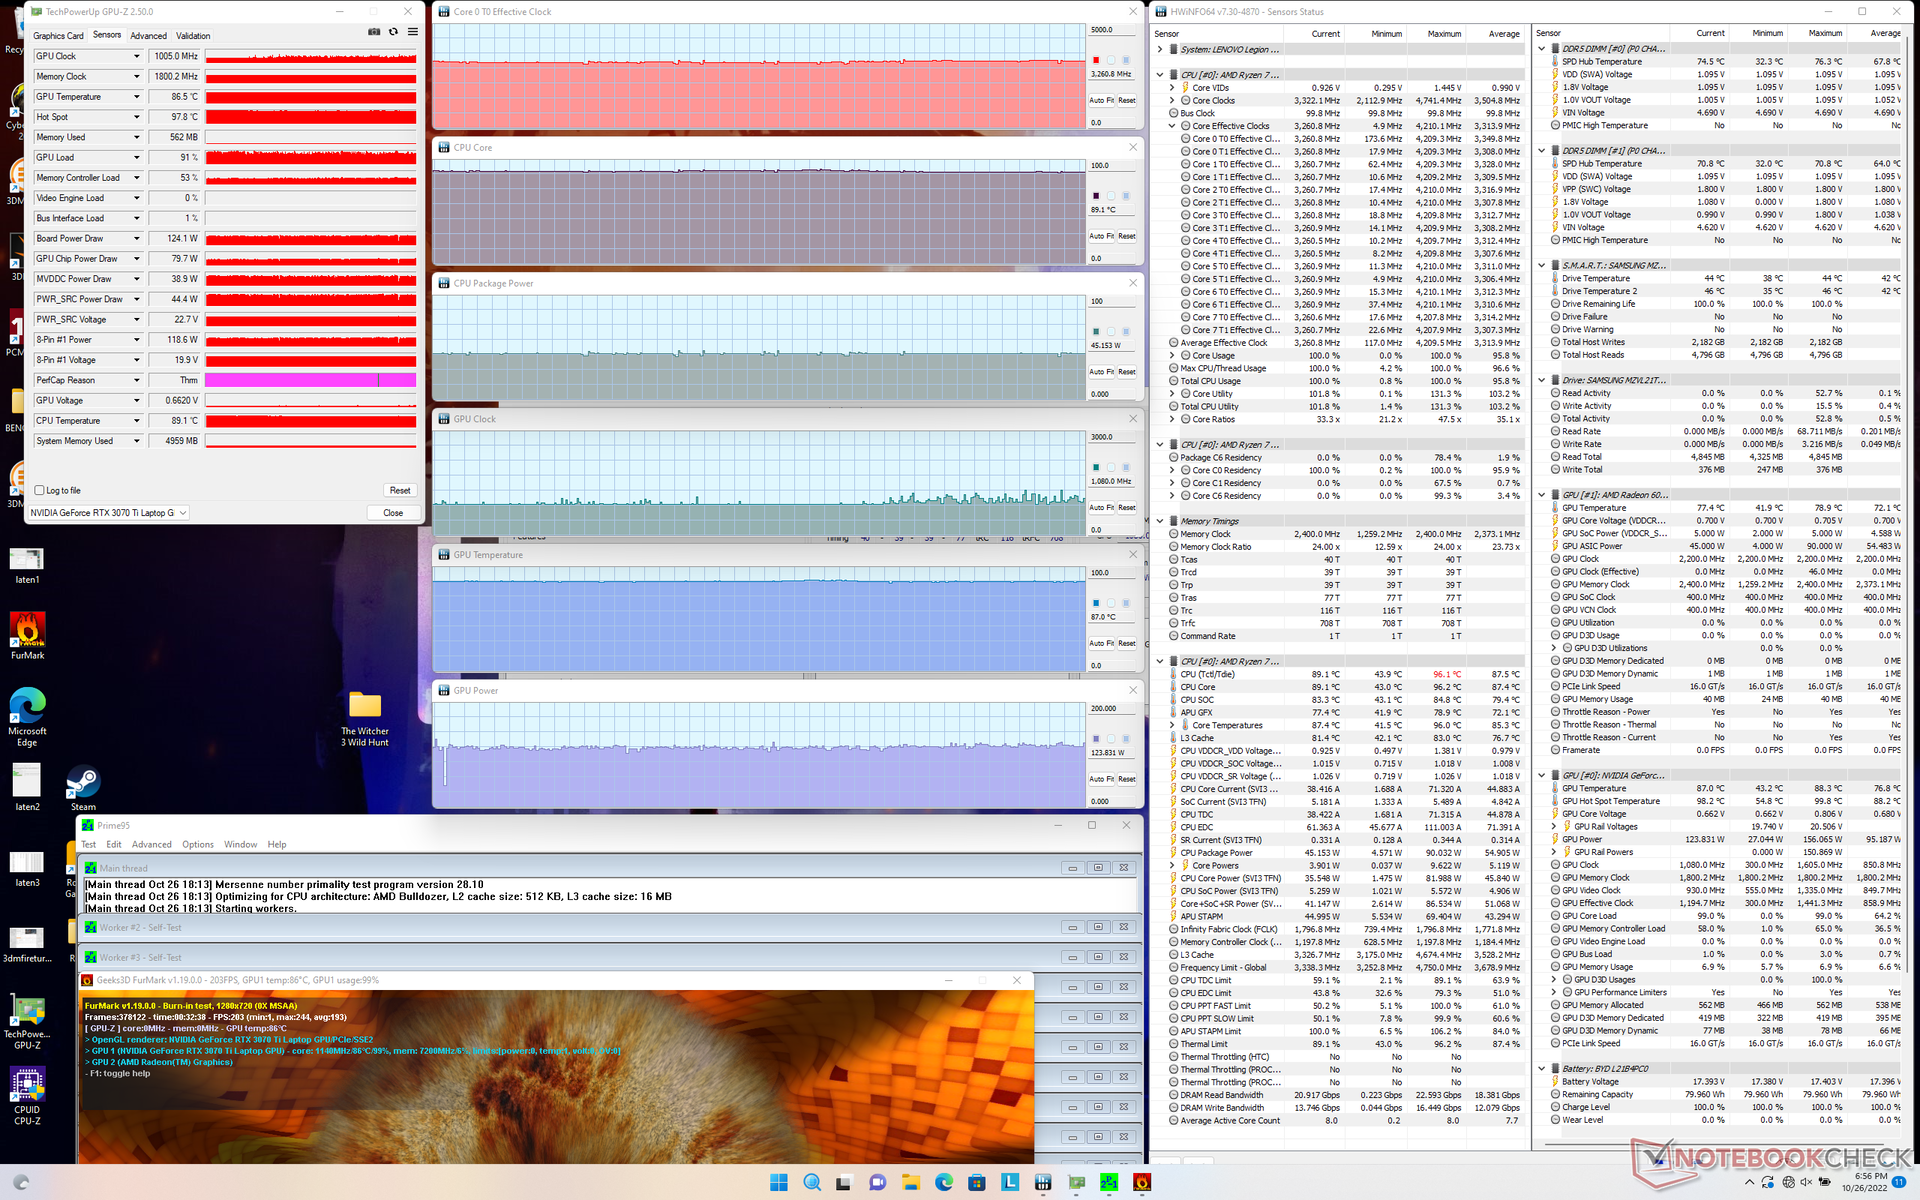
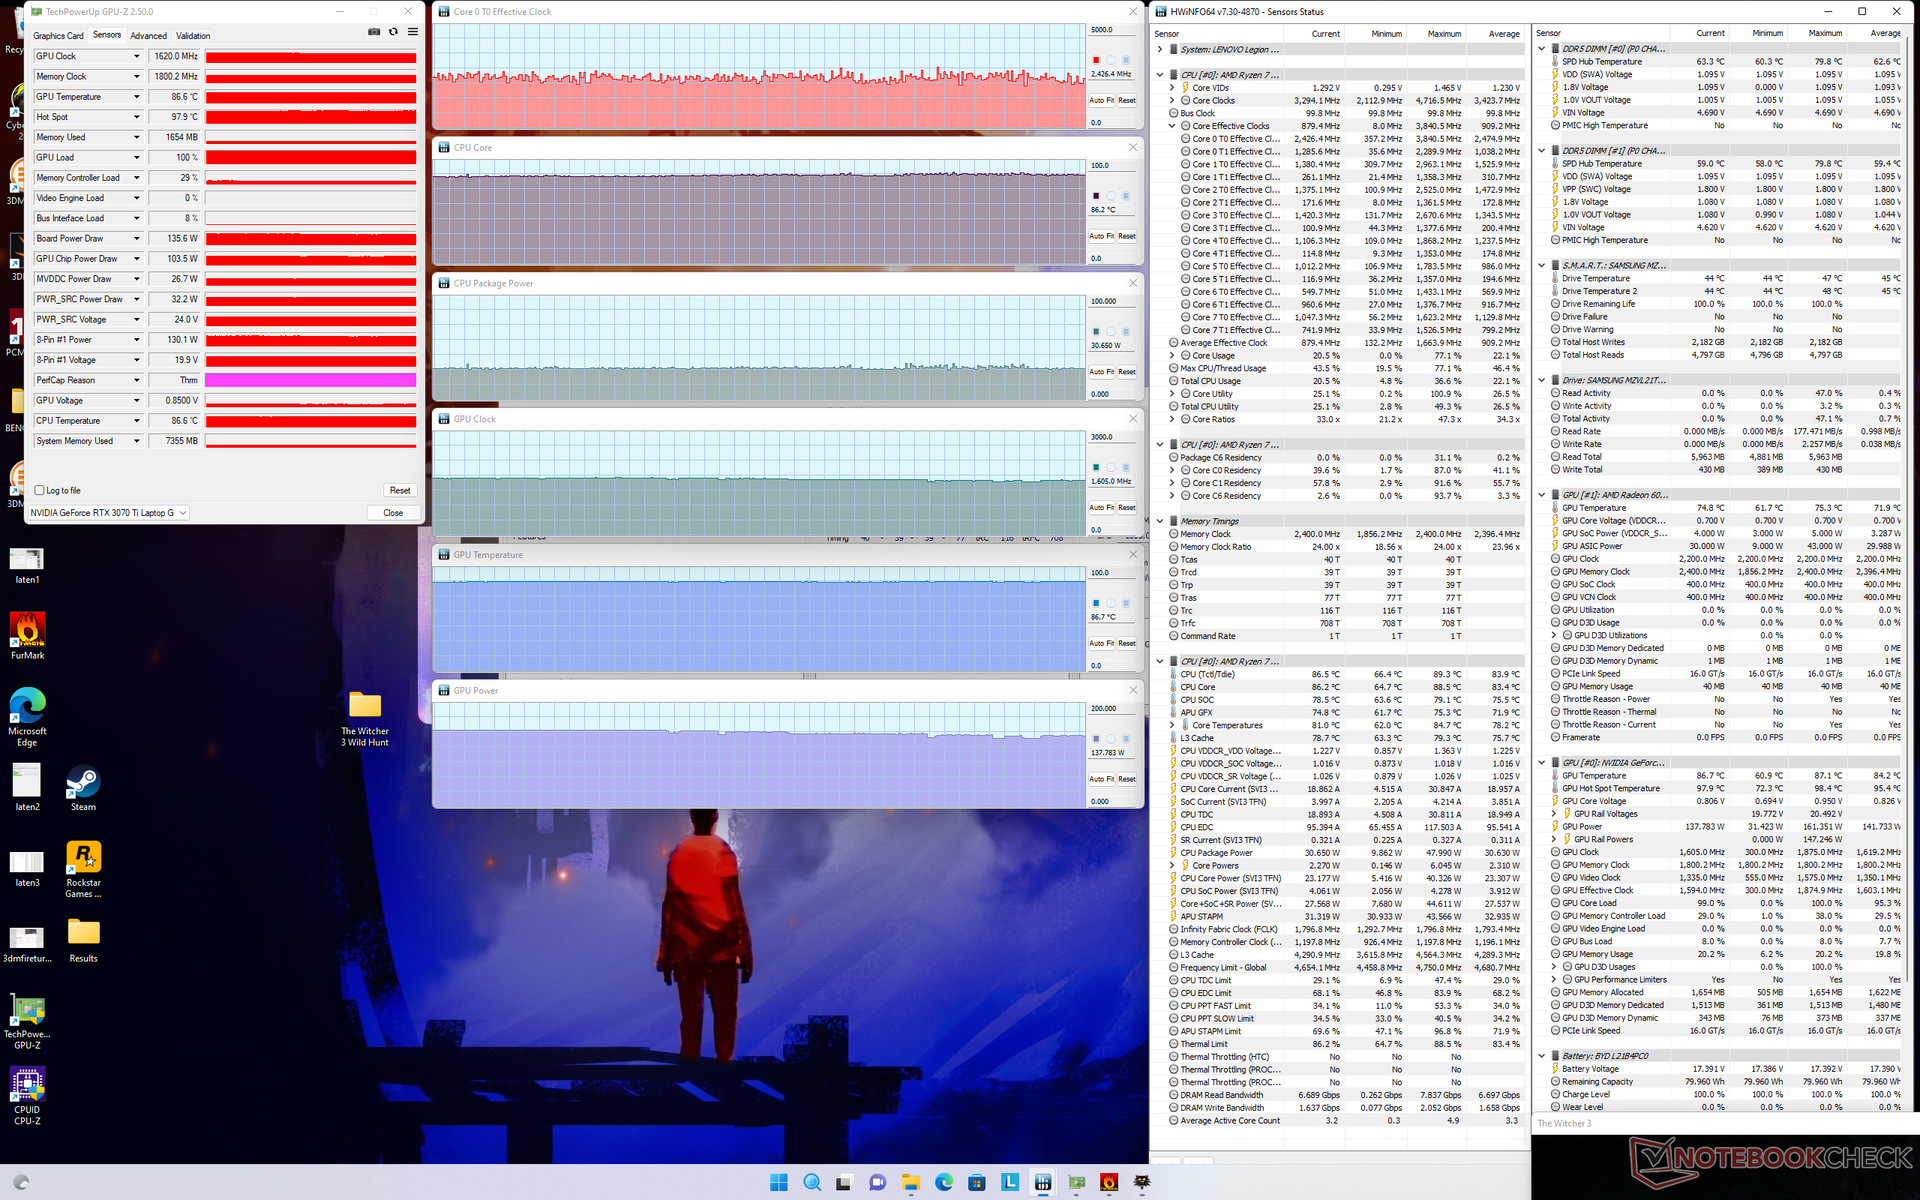
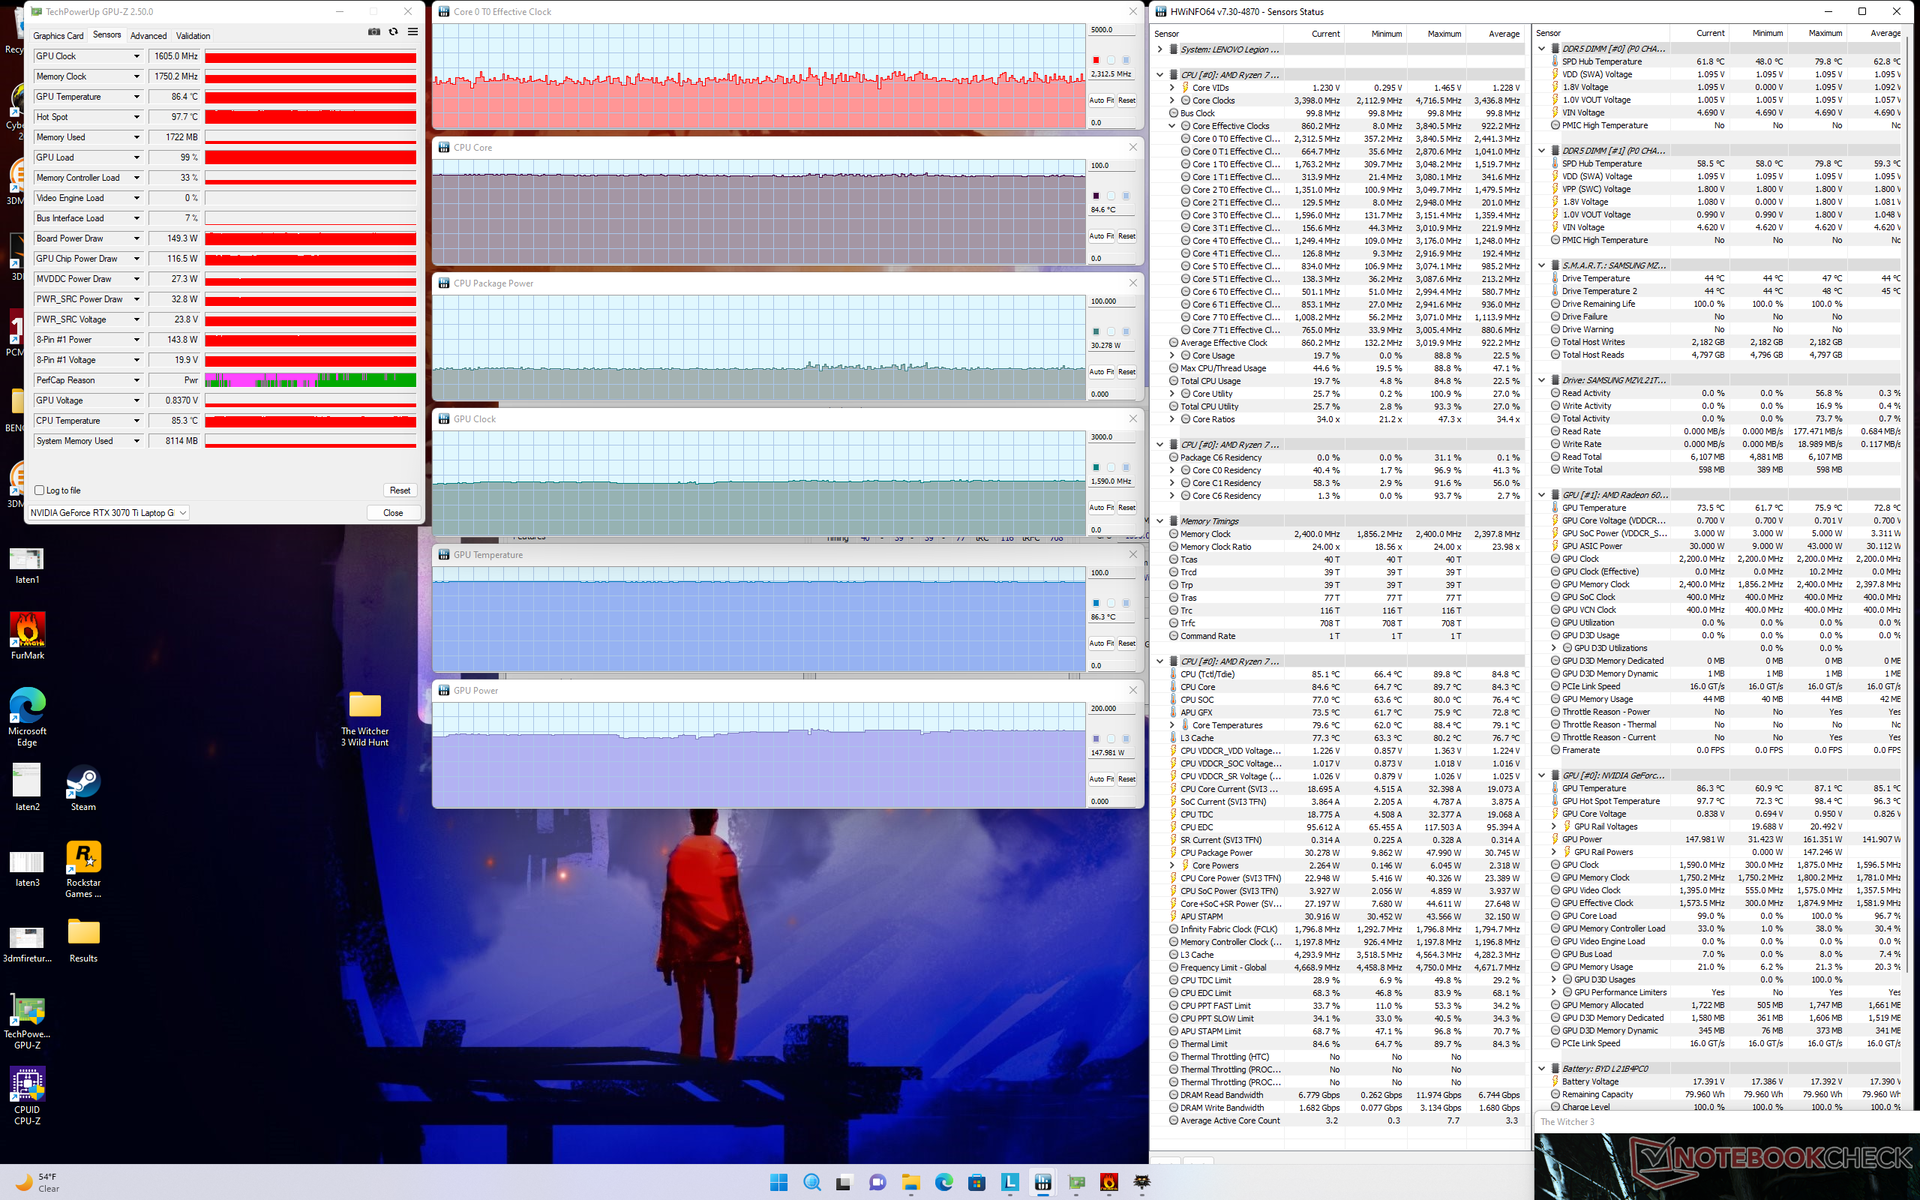
| CPU-klocka (GHz) | GPU-klocka (MHz) | Genomsnittlig CPU-temperatur (°C) | Genomsnittlig GPU-temperatur (°C) | |
| System Idle | -- | -- | 44 | 44 |
| Prime95 Stress | 4.1 | -- | 93 | 59 |
| Prime95 + FurMark Stress | 3.3 | 1005 | 89 | 87 |
| Witcher 3 Stress (Turbo on) | ~2.3 | 1620 | 86 | 87 |
| Witcher 3 Stress (Turbo off) | ~2,3 | 1605 | 85 | 86 |
Högtalare
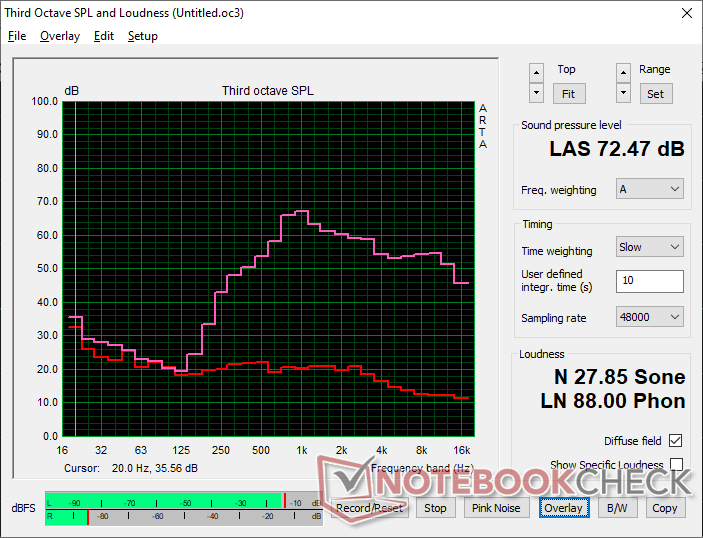
Lenovo Legion 5 Pro 16ARH7H RTX 3070 Ti ljudanalys
(±) | högtalarljudstyrkan är genomsnittlig men bra (72.5 dB)
Bas 100 - 315 Hz
(-) | nästan ingen bas - i genomsnitt 22.3% lägre än medianen
(-) | basen är inte linjär (15.4% delta till föregående frekvens)
Mellan 400 - 2000 Hz
(±) | högre mellan - i genomsnitt 7.1% högre än median
(±) | linjäriteten för mids är genomsnittlig (9.5% delta till föregående frekvens)
Högsta 2 - 16 kHz
(+) | balanserade toppar - endast 1.9% från medianen
(+) | toppar är linjära (3.6% delta till föregående frekvens)
Totalt 100 - 16 000 Hz
(-) | det totala ljudet är inte linjärt (30.3% skillnad mot median)
Jämfört med samma klass
» 96% av alla testade enheter i den här klassen var bättre, 2% liknande, 3% sämre
» Den bästa hade ett delta på 6%, genomsnittet var 18%, sämst var 132%
Jämfört med alla testade enheter
» 89% av alla testade enheter var bättre, 3% liknande, 9% sämre
» Den bästa hade ett delta på 4%, genomsnittet var 23%, sämst var 134%
Asus ROG Zephyrus M16 GU603H ljudanalys
(±) | högtalarljudstyrkan är genomsnittlig men bra (80 dB)
Bas 100 - 315 Hz
(±) | reducerad bas - i genomsnitt 7.4% lägre än medianen
(±) | linjäriteten för basen är genomsnittlig (9.2% delta till föregående frekvens)
Mellan 400 - 2000 Hz
(±) | högre mellan - i genomsnitt 5.6% högre än median
(+) | mids är linjära (4% delta till föregående frekvens)
Högsta 2 - 16 kHz
(+) | balanserade toppar - endast 2.6% från medianen
(+) | toppar är linjära (6.7% delta till föregående frekvens)
Totalt 100 - 16 000 Hz
(+) | det totala ljudet är linjärt (12.1% skillnad mot median)
Jämfört med samma klass
» 12% av alla testade enheter i den här klassen var bättre, 4% liknande, 84% sämre
» Den bästa hade ett delta på 6%, genomsnittet var 18%, sämst var 132%
Jämfört med alla testade enheter
» 10% av alla testade enheter var bättre, 2% liknande, 88% sämre
» Den bästa hade ett delta på 4%, genomsnittet var 23%, sämst var 134%
Energihantering - krävande maskin
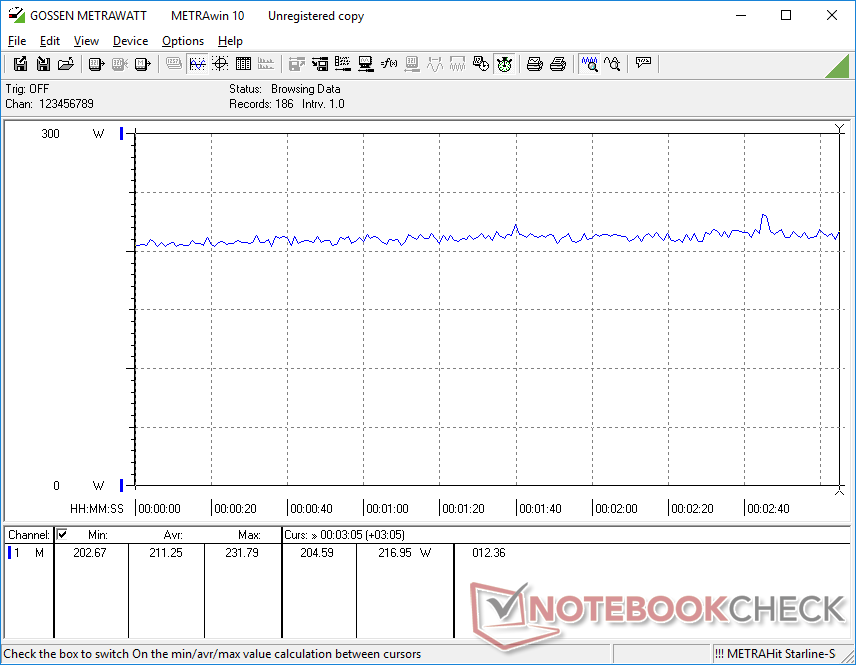
Effektförbrukning
Även om Ryzen 7 6800H är cirka 25 procent långsammare än Core i7-12700H är den inte nödvändigtvis 25 procent mer energieffektiv. Faktum är att strömförbrukningen mellan AMD- och Intel-versionerna av Legion 5 Pro 16 är cirka 160 W på varje system när Prime95 körs. Strömförbrukningen är också ganska likartad mellan dem när man kör Witcher 3
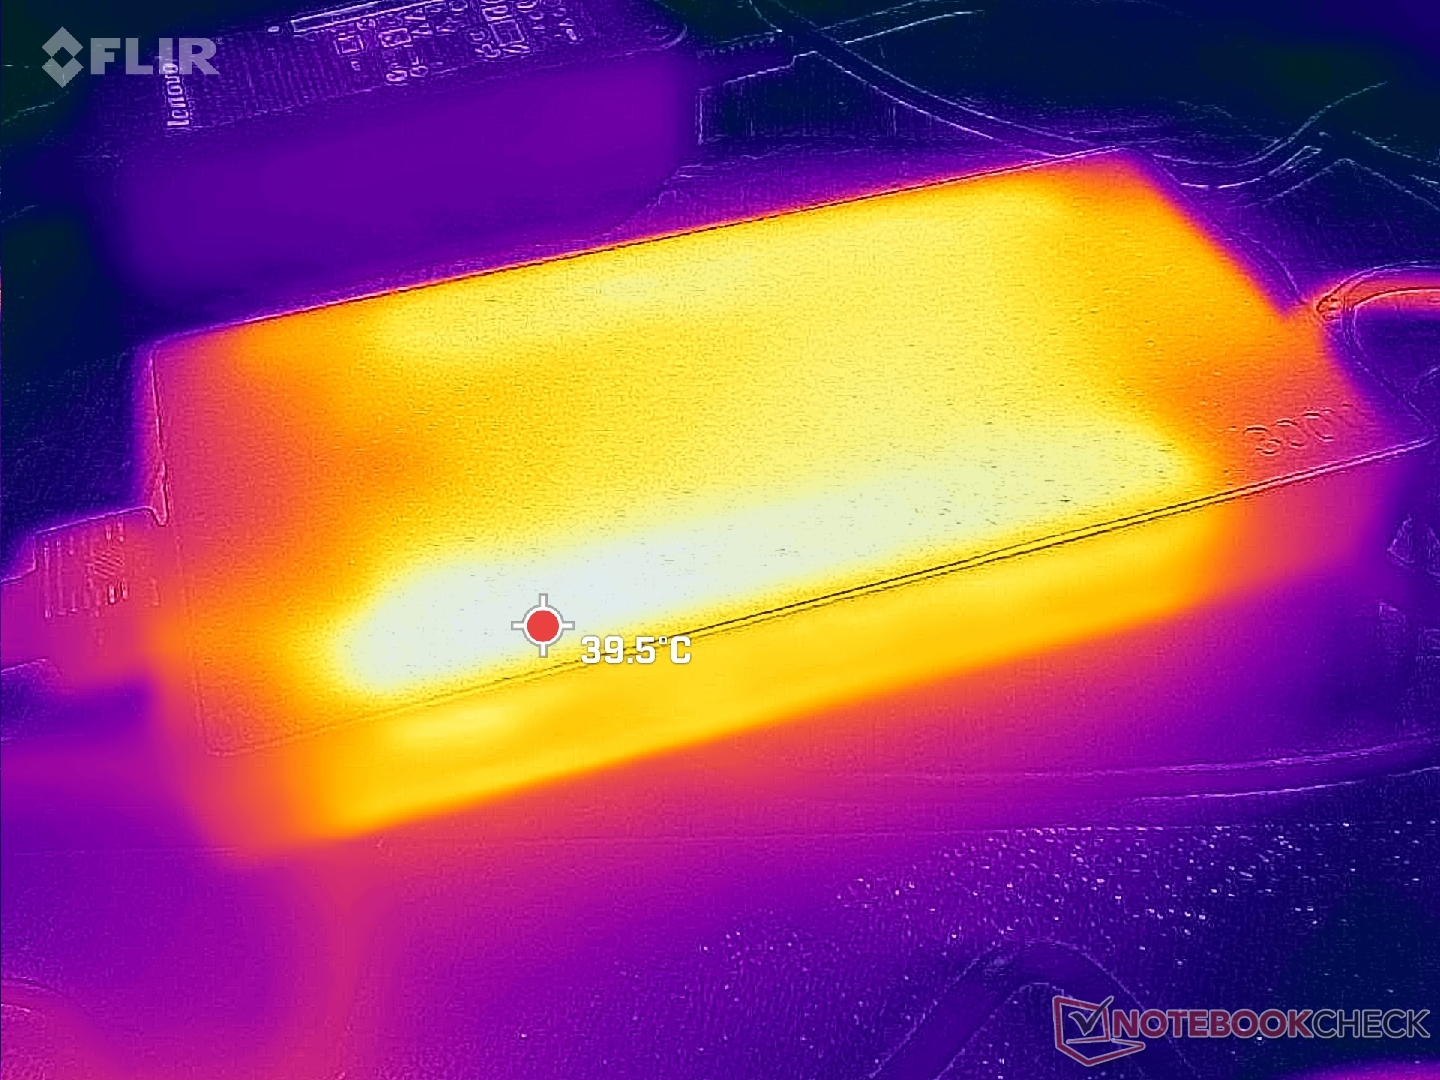
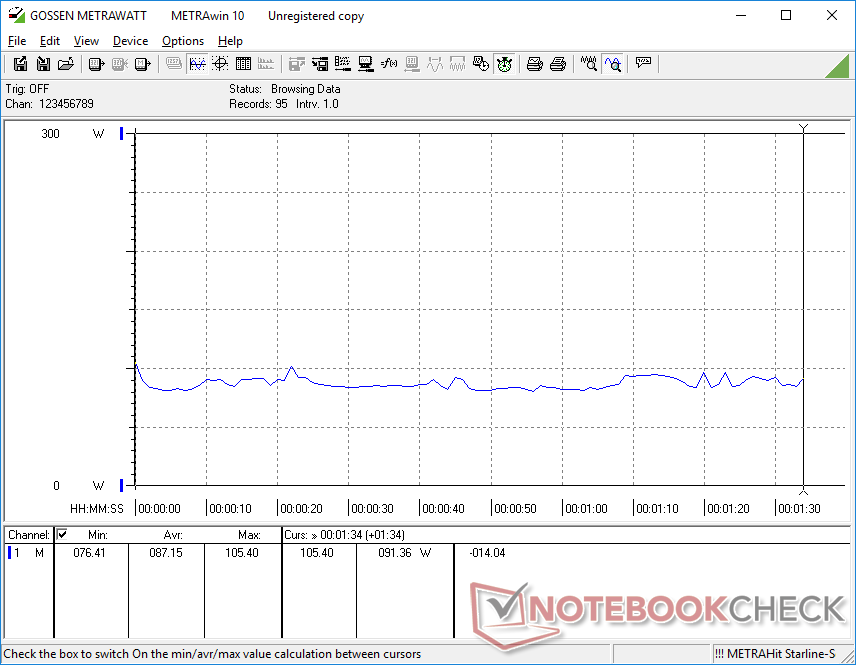
Vi kan registrera ett tillfälligt maximalt uttag på 275 W från den stora (~19,9 x 9,8 x 2,6 cm) 300 W AC-adaptern när både CPU och GPU är 100 procent utnyttjade. Systemet kan ladda i en rimlig takt och köra krävande belastningar samtidigt.
| Av/Standby | |
| Låg belastning | |
| Hög belastning |
|
Förklaring:
min: | |
| Lenovo Legion 5 Pro 16ARH7H RTX 3070 Ti R7 6800H, GeForce RTX 3070 Ti Laptop GPU, Samsung PM9A1 MZVL21T0HCLR, IPS, 2560x1600, 16" | Lenovo Legion 5 Pro 16IAH7H i7-12700H, GeForce RTX 3060 Laptop GPU, 2x Samsung PM9A1 MZVL21T0HCLR (RAID 0), IPS, 2560x1600, 16" | Asus ROG Zephyrus M16 GU603H i9-11900H, GeForce RTX 3070 Laptop GPU, Samsung PM9A1 MZVL22T0HBLB, IPS, 2560x1600, 16" | Lenovo Legion 7 16ARHA7 R9 6900HX, Radeon RX 6850M XT, Samsung PM9A1 MZVL22T0HBLB, IPS, 2560x1600, 16" | HP Victus 16-e0145ng R5 5600H, GeForce RTX 3050 Ti Laptop GPU, Samsung SSD PM981a MZVLB512HBJQ, IPS, 1920x1080, 16.1" | Dell G16 7620 i7-12700H, GeForce RTX 3060 Laptop GPU, WDC PC SN810 512GB, IPS, 2560x1600, 16" | |
|---|---|---|---|---|---|---|
| Power Consumption | -50% | 2% | -5% | 33% | -4% | |
| Idle Minimum * (Watt) | 9.7 | 22.8 -135% | 11 -13% | 9.9 -2% | 7 28% | 14.4 -48% |
| Idle Average * (Watt) | 14.8 | 26.5 -79% | 20 -35% | 22 -49% | 9 39% | 17.8 -20% |
| Idle Maximum * (Watt) | 45.8 | 41 10% | 30 34% | 23.1 50% | 15 67% | 31.5 31% |
| Load Average * (Watt) | 87.2 | 191 -119% | 111 -27% | 94.4 -8% | 93 -7% | 101.2 -16% |
| Witcher 3 ultra * (Watt) | 209 | 194.7 7% | 156 25% | 249 -19% | 134.5 36% | 176.9 15% |
| Load Maximum * (Watt) | 275.3 | 238 14% | 197 28% | 276 -0% | 185 33% | 242.9 12% |
* ... mindre är bättre
Power Consumption Witcher 3 / Stresstest
Power Consumption external Monitor
Batteritid - inte alltför dåligt
WLAN-drifttiden är nästan en timme längre än på Intel-versionen av Legion 5 Pro 16 när den är inställd på Balanced power-profilen med iGPU-aktivitet. Den förbättrade batteritiden beror troligen på den effektivare AMD CPU:n när den körs mindre belastningar, vilket framgår av vårt avsnitt om strömförbrukning ovan. Trots detta är det fortfarande relativt kort med knappt 4,5 timmar jämfört med nästan 8 timmar på Asus ROG Zephyrus M16.
Laddning från tom till full kapacitet tar strax under en timme när funktionen för snabbladdning är aktiverad. De flesta andra bärbara datorer tar mellan 1,5 och 2 timmar.
| Lenovo Legion 5 Pro 16ARH7H RTX 3070 Ti R7 6800H, GeForce RTX 3070 Ti Laptop GPU, 80 Wh | Lenovo Legion 5 Pro 16IAH7H i7-12700H, GeForce RTX 3060 Laptop GPU, 80 Wh | Asus ROG Zephyrus M16 GU603H i9-11900H, GeForce RTX 3070 Laptop GPU, 90 Wh | Lenovo Legion 7 16ARHA7 R9 6900HX, Radeon RX 6850M XT, 99 Wh | HP Victus 16-e0145ng R5 5600H, GeForce RTX 3050 Ti Laptop GPU, 70 Wh | Dell G16 7620 i7-12700H, GeForce RTX 3060 Laptop GPU, 84 Wh | |
|---|---|---|---|---|---|---|
| Batteridrifttid | -18% | 75% | 66% | 61% | 14% | |
| WiFi v1.3 (h) | 4.4 | 3.6 -18% | 7.7 75% | 7.3 66% | 7.1 61% | 5 14% |
| H.264 (h) | 4.1 | |||||
| Witcher 3 ultra (h) | 2.1 | |||||
| Load (h) | 0.6 | 1.6 | 1.8 | 0.7 | ||
| Reader / Idle (h) | 13.3 | 4.9 | 7.1 |
För
Emot
Bedömning - Bara en aning snabbare
Ryzen 7 6800H och 150 W GeForce RTX 3070 Ti är vardera cirka 10 procent snabbare än Ryzen 7 5800H och 140 W GeForce RTX 3070 på förra årets Legion 5 Pro. Uppdateringen 2022 är därför bara en mindre uppgradering jämfört med 2021 års modell utan några större yttre eller inre förändringar.
Om du redan äger Lenovo Legion 5 Pro 16 från 2021 går du inte miste om särskilt mycket genom att hoppa över 2022 års version. Lenovo kommer troligen att uppdatera serien helt och hållet under de närmaste ett till två åren för fler större förbättringar.
De närmaste alternativen till Legion 5 Pro 16 är för närvarande följande Dell G16 och Asus ROG Zephyrus M16 båda med liknande 165 Hz uppdateringsfrekvens och CPU-alternativ i H-serien. Asus-modellen är betydligt mindre och lättare, men den går ännu varmare och är lika högljudd. Samtidigt går Dell-modellen tystare, men dess storlek och kärntemperaturer är något varmare och tyngre än den redan varma och tunga Lenovo-modellen.
För framtida revideringar skulle vi gärna se svalare kärntemperaturer och en mer okomplicerad mjukvara för att kontrollera prestandan. I den nuvarande versionen av Vantage måste användarna aktivera fyra separata inställningar individuellt (MUX, GPU Overclock, Vantage Performance och Windows Performance modes) för att fullt ut utnyttja den bärbara datorns kraft, vilket kan bli irriterande när man växlar mellan olika kraftlägen.
Pris och tillgänglighet
Lenovo Legion 5 Pro 16ARH7H RTX 3070 Ti
- 10/29/2022 v7 (old)
Allen Ngo
Price comparison

