Ryzen 7 7745HX prestandadebut: Lenovo Legion Pro 5 16 Gen 8 laptop översyn

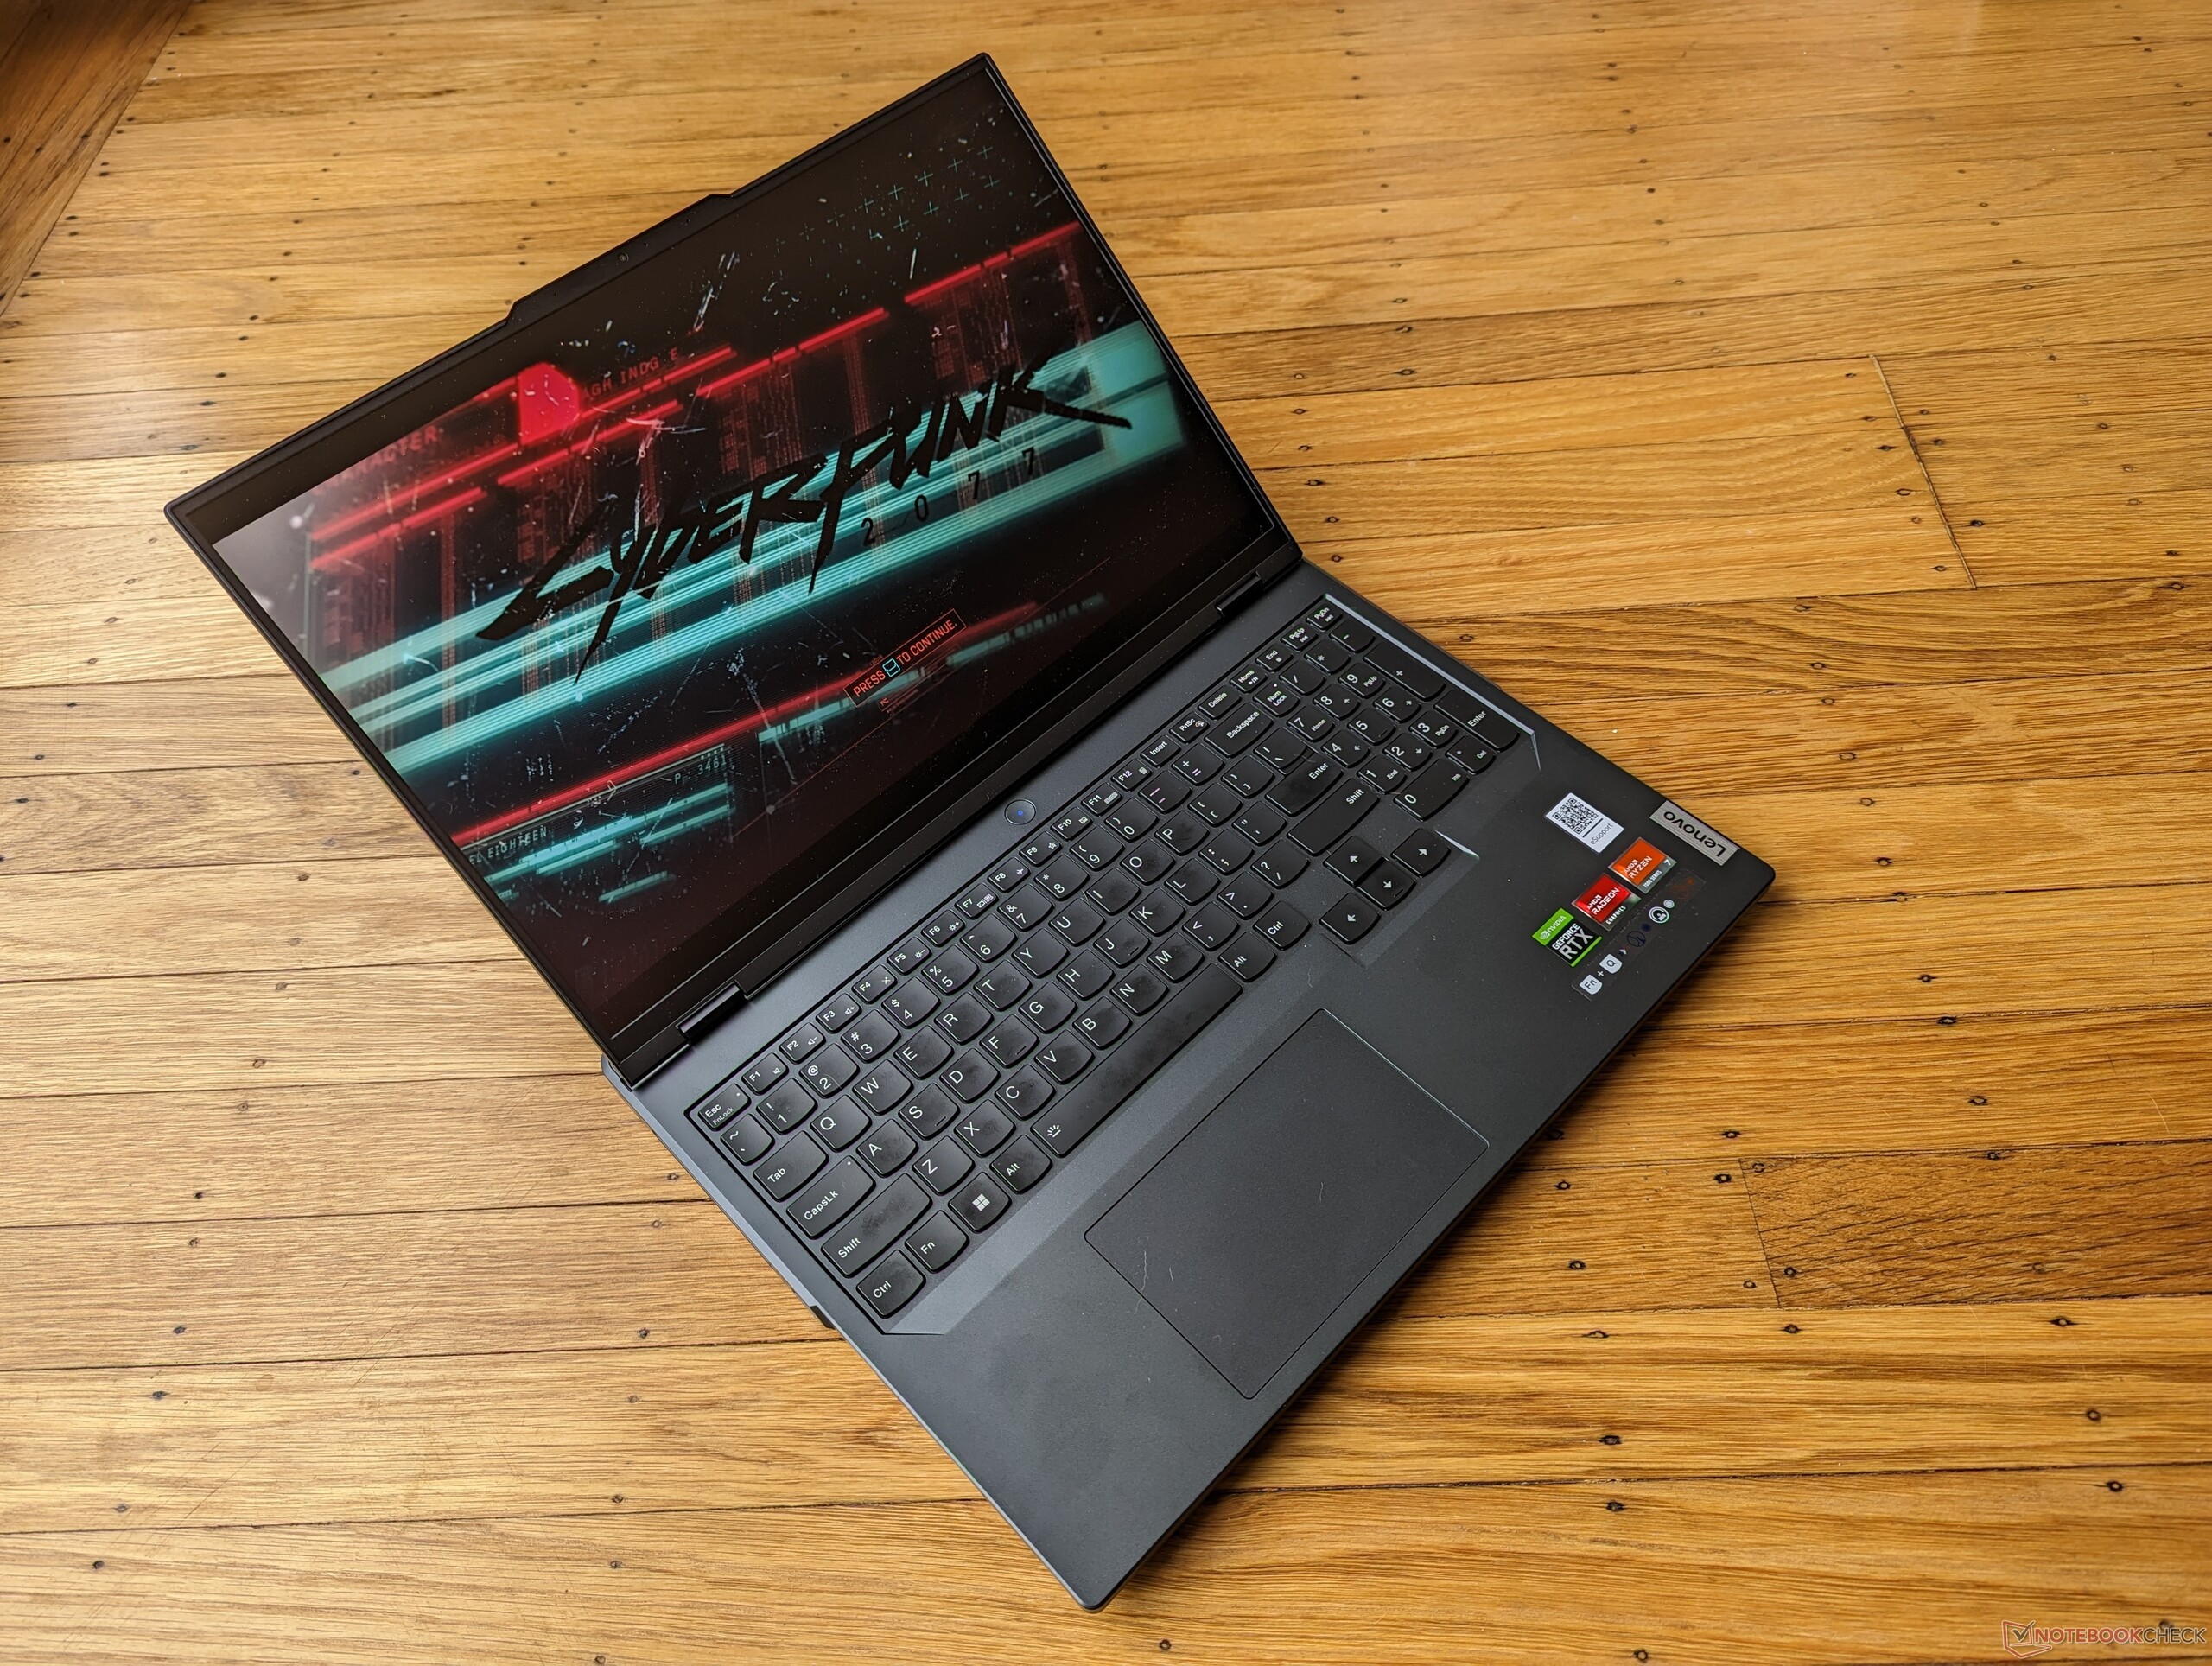
Lenovo Legion Pro 5 16ARX8 är AMD-versionen av Intel Legion Pro 5 16IRX8. Båda modellerna använder samma Legion Pro 5 16 Gen 8-chassi och är i övrigt visuellt identiska. Vi rekommenderar att du kollar in vår befintliga granskning av Legion Pro 5 16IRX8 för att lära dig mer om modellens fysiska egenskaper eftersom många av våra kommentarer fortfarande gäller för Legion Pro 5 16ARX8.
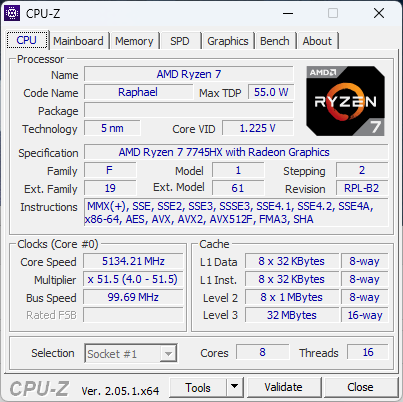
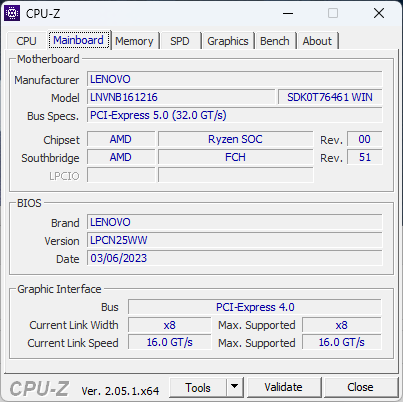
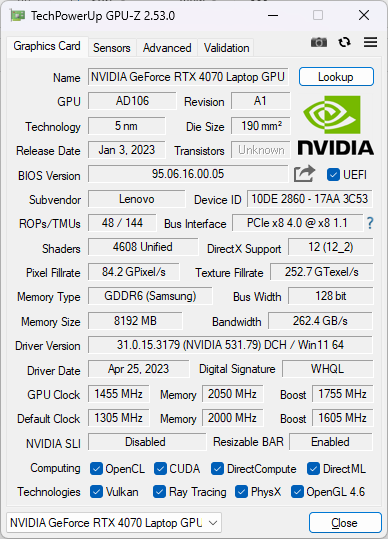
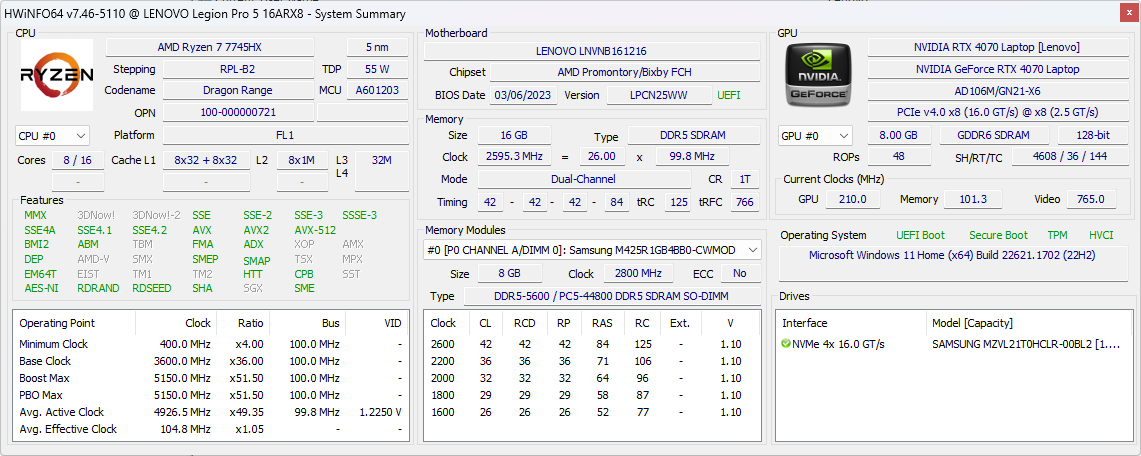
Vår testenhet är en konfiguration i den högre prisklassen med Zen 4 Ryzen 7 7745HX CPU, 140 W GeForce RTX 4070 GPU och 165 Hz 1600p IPS-skärm som säljs för cirka 1 600 USD. Andra SKU:er kan innehålla Ryzen 5 7645HX, GeForce RTX 4050 eller 240 Hz IPS-skärm. Just den här modellen är en av de första som levereras med mellanklassmodellen Ryzen 7 7745HX, medan tidigare Zen 4 bärbara datorer endast fanns tillgängliga med den dyrare Ryzen 9 7945HX.
Bland konkurrenterna i detta område finns andra bärbara datorer för spel i mellanklass till högklassiga modeller som t.ex Asus ROG Strix G16, Razer Blade 16, Uniwill GM6PX7Xeller MSI Pulse GL76. Legion 7-serien ligger ett steg över vår Legion Pro 5 med mycket snabbare CPU- och GPU-alternativ att välja mellan.
Fler Lenovo-recensioner:
Potentiella konkurrenter i jämförelse
Gradering | Datum | Modell | Vikt | Höjd | Storlek | Upplösning | Pris |
|---|---|---|---|---|---|---|---|
| 88.4 % v7 (old) | 05/2023 | Lenovo Legion Pro 5 16ARX8 R7 7745HX, GeForce RTX 4070 Laptop GPU | 2.5 kg | 26.8 mm | 16.00" | 2560x1600 | |
| 87.9 % v7 (old) | 05/2023 | Lenovo Legion Pro 5 16IRX8 i7-13700HX, GeForce RTX 4060 Laptop GPU | 2.5 kg | 26.8 mm | 16.00" | 2560x1600 | |
| 88.2 % v7 (old) | 03/2023 | Uniwill GM6PX7X RTX 4070 i7-13700HX, GeForce RTX 4070 Laptop GPU | 2.2 kg | 22 mm | 16.00" | 2560x1600 | |
| 87.7 % v7 (old) | 04/2023 | Schenker XMG Neo 16 E23 i9-13900HX, GeForce RTX 4090 Laptop GPU | 2.5 kg | 29.9 mm | 16.00" | 2560x1600 | |
| 88.4 % v7 (old) | 03/2023 | Asus ROG Strix G16 G614JZ i9-13980HX, GeForce RTX 4080 Laptop GPU | 2.4 kg | 30.4 mm | 16.00" | 2560x1600 | |
| 88 % v7 (old) | 04/2023 | Asus Zephyrus Duo 16 GX650PY-NM006W R9 7945HX, GeForce RTX 4090 Laptop GPU | 2.7 kg | 29.7 mm | 16.00" | 2560x1600 |
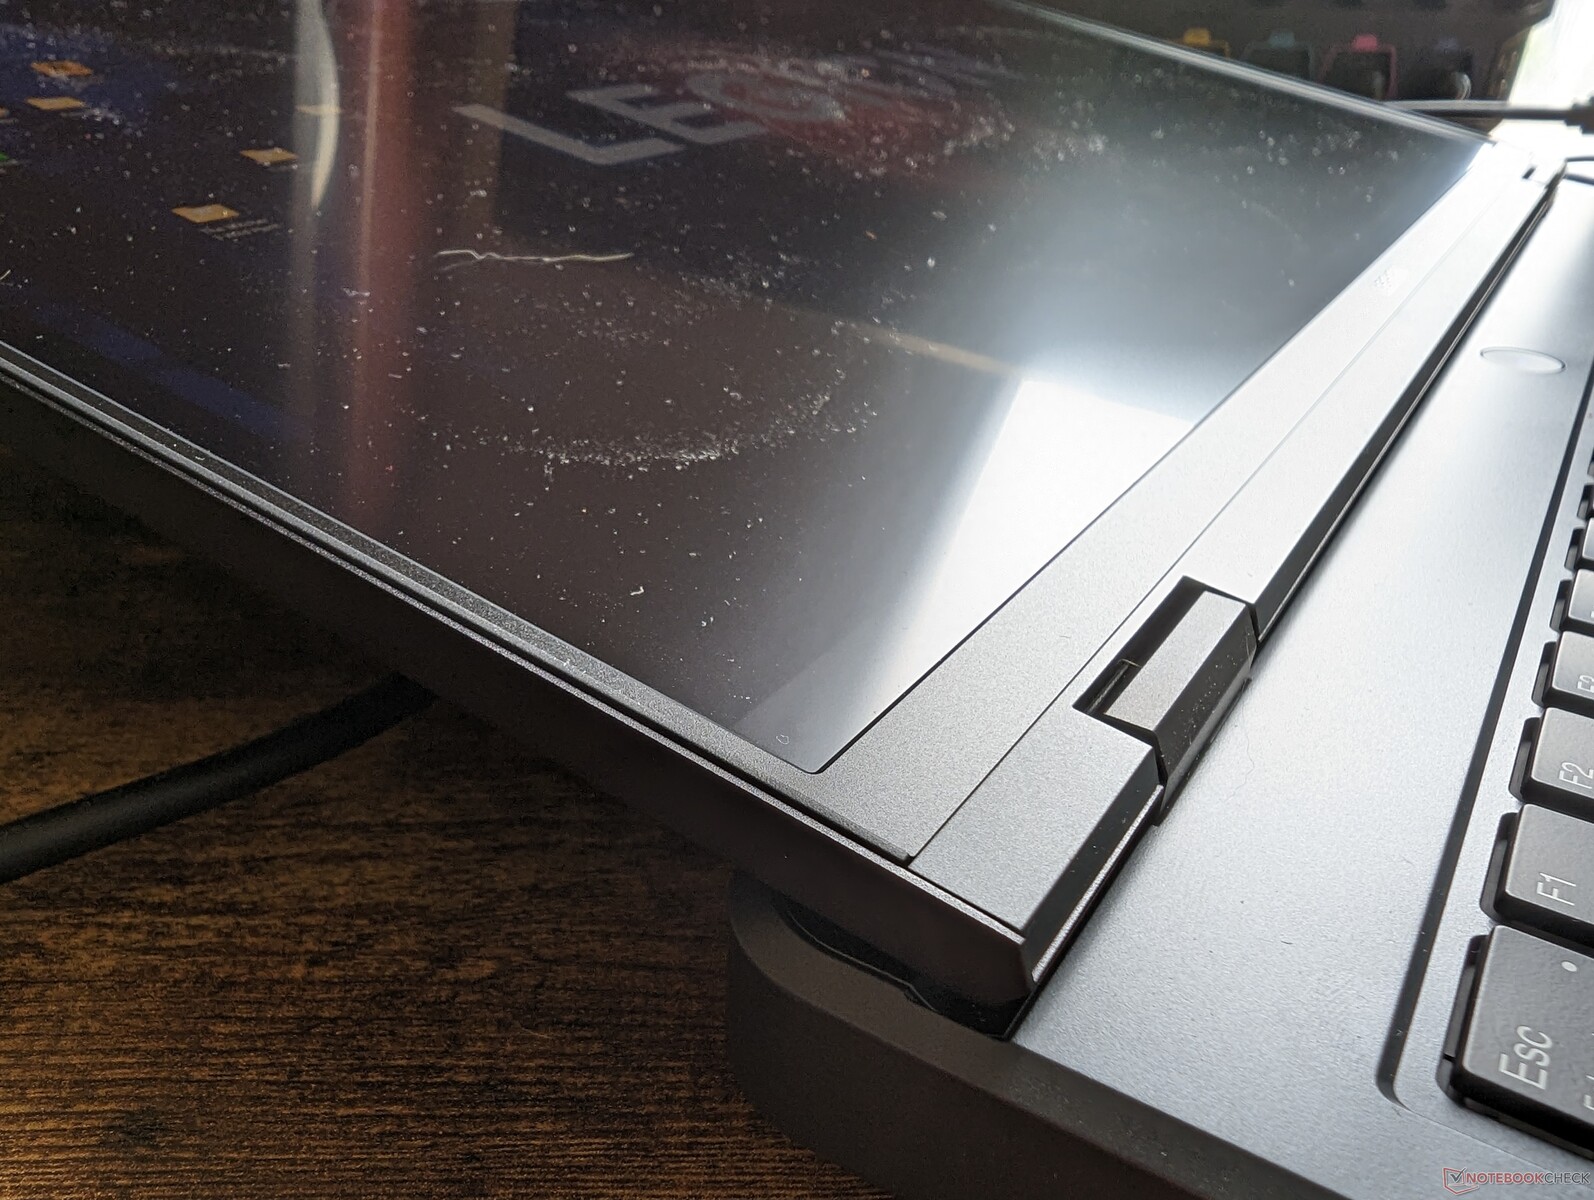
Fall - Samma utseende med identiska portar
AMD Legion Pro 5 16ARX8 har samma chassi som Intel Legion Pro 5 16IRX8. Medan det vanligtvis finns några portskillnader mellan de flesta AMD- och Intel-varianter finns det faktiskt inga mellan dessa två modeller eftersom Lenovo har valt att utesluta både USB 4- och Thunderbolt-stöd på alla Legion 5 Pro SKU:er oavsett CPU-alternativ. Detta kan ses som ett sätt att tvinga användare att istället överväga den dyrare Legion 7-serien som innehåller Thunderbolt-stöd som standard.
Kommunikation
AMD-modellen byter ut den vanliga Intel AX211 mot den mindre vanliga MediaTek MT7922. Prestandan är annars stabil och pålitlig när den är kopplad till vårt 6 GHz-nätverk.
| Networking | |
| iperf3 transmit AXE11000 | |
| Schenker XMG Neo 16 E23 | |
| Asus ROG Strix G16 G614JZ | |
| Lenovo Legion Pro 5 16ARX8 | |
| Uniwill GM6PX7X RTX 4070 | |
| Lenovo Legion Pro 5 16IRX8 | |
| iperf3 receive AXE11000 | |
| Schenker XMG Neo 16 E23 | |
| Asus ROG Strix G16 G614JZ | |
| Lenovo Legion Pro 5 16ARX8 | |
| Uniwill GM6PX7X RTX 4070 | |
| Lenovo Legion Pro 5 16IRX8 | |
| iperf3 transmit AXE11000 6GHz | |
| Asus Zephyrus Duo 16 GX650PY-NM006W | |
| Lenovo Legion Pro 5 16ARX8 | |
| Lenovo Legion Pro 5 16IRX8 | |
| iperf3 receive AXE11000 6GHz | |
| Asus Zephyrus Duo 16 GX650PY-NM006W | |
| Lenovo Legion Pro 5 16ARX8 | |
| Lenovo Legion Pro 5 16IRX8 | |
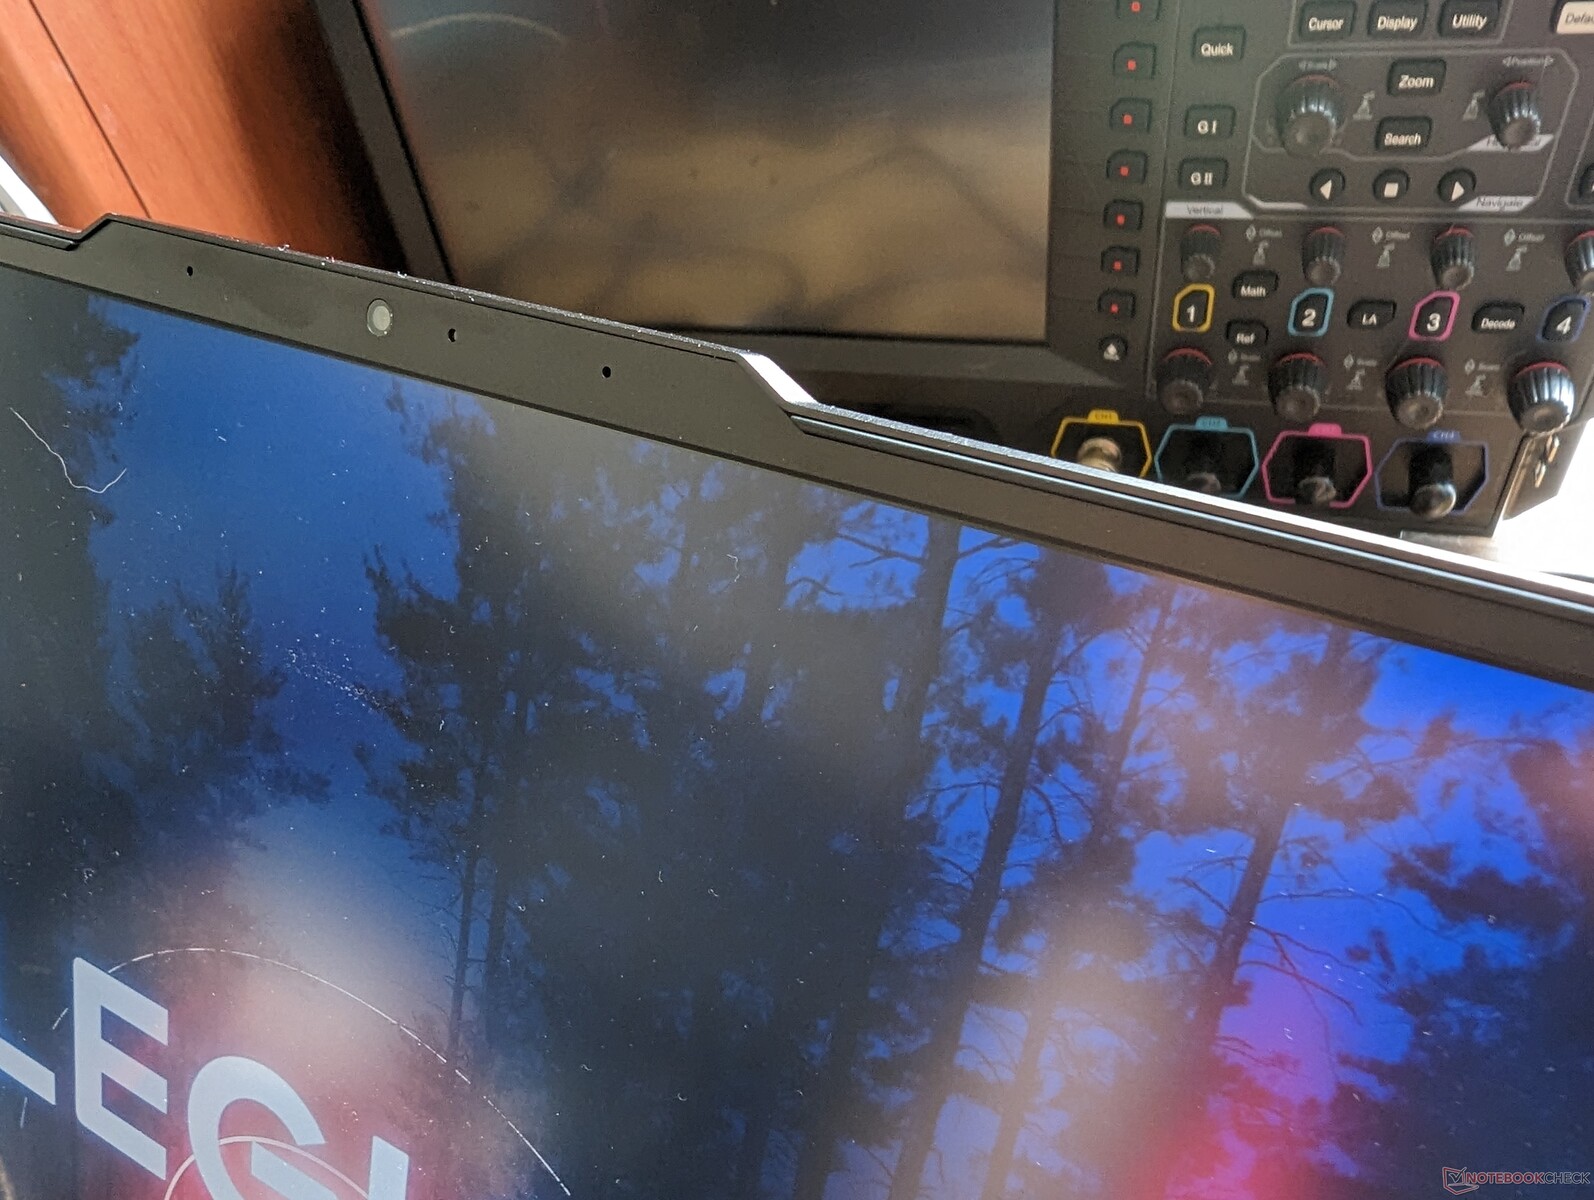
Webbkamera


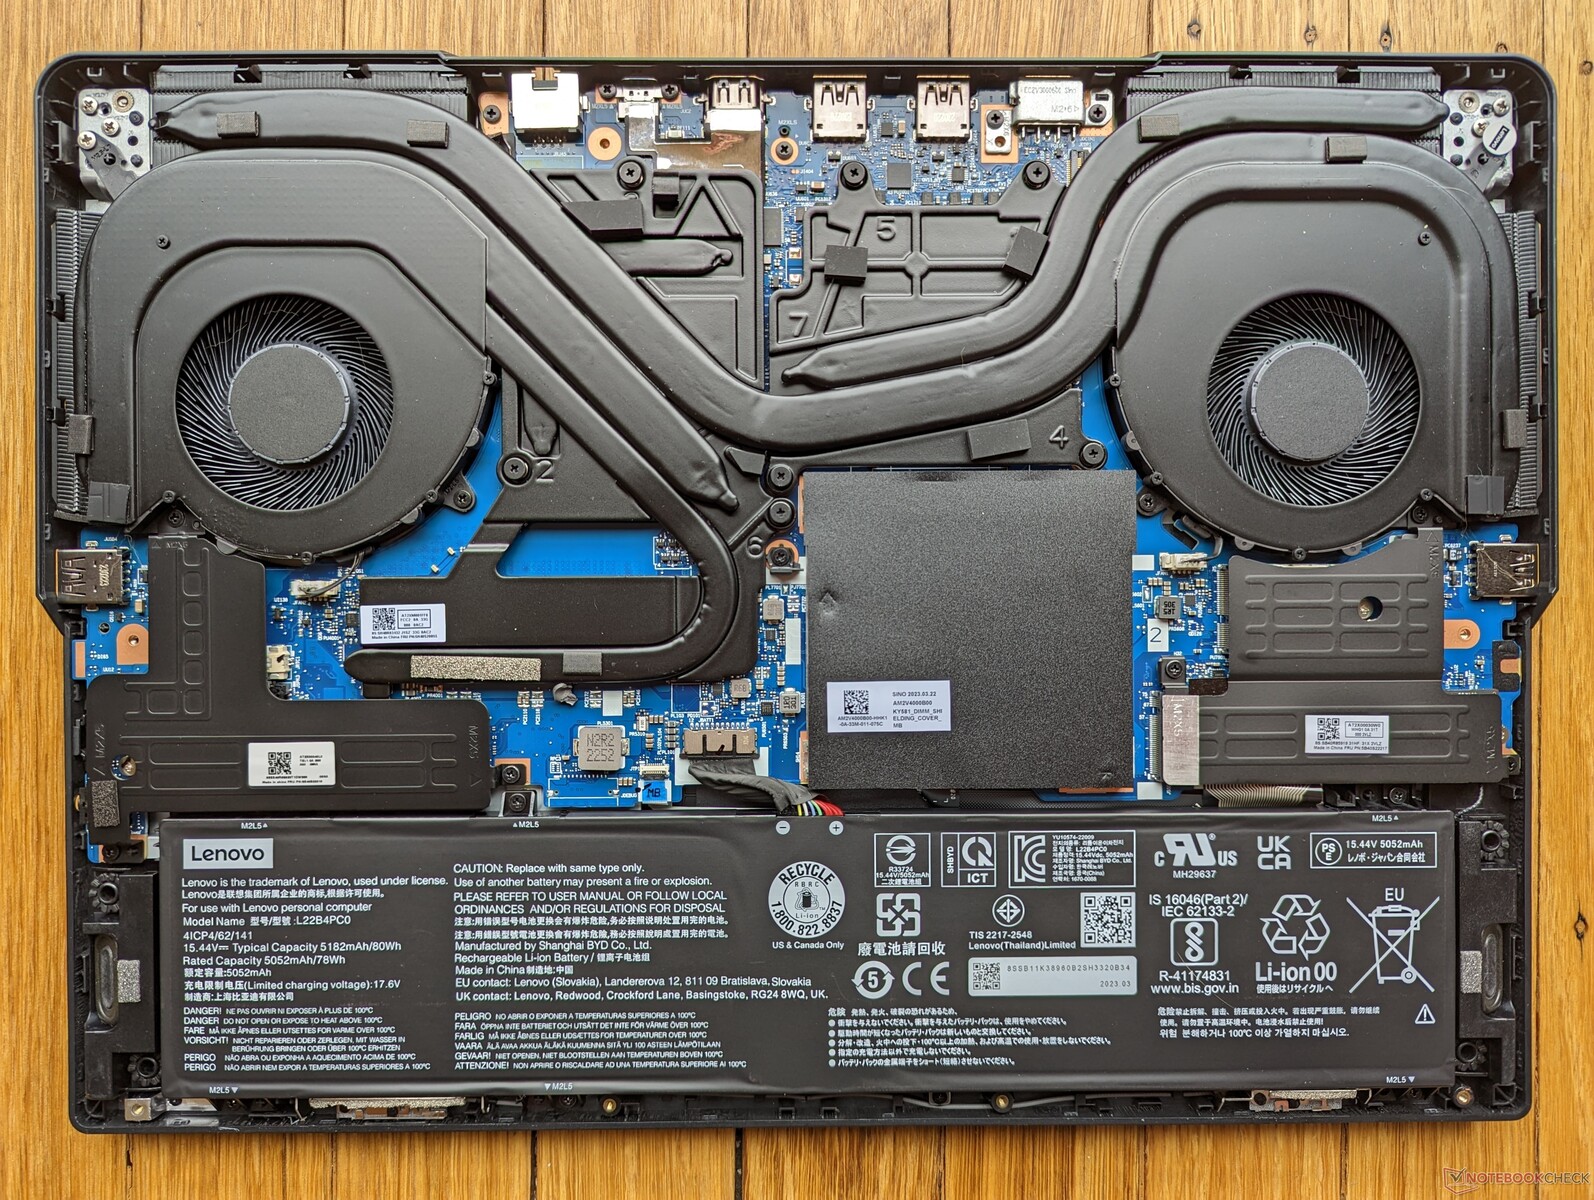
Underhåll
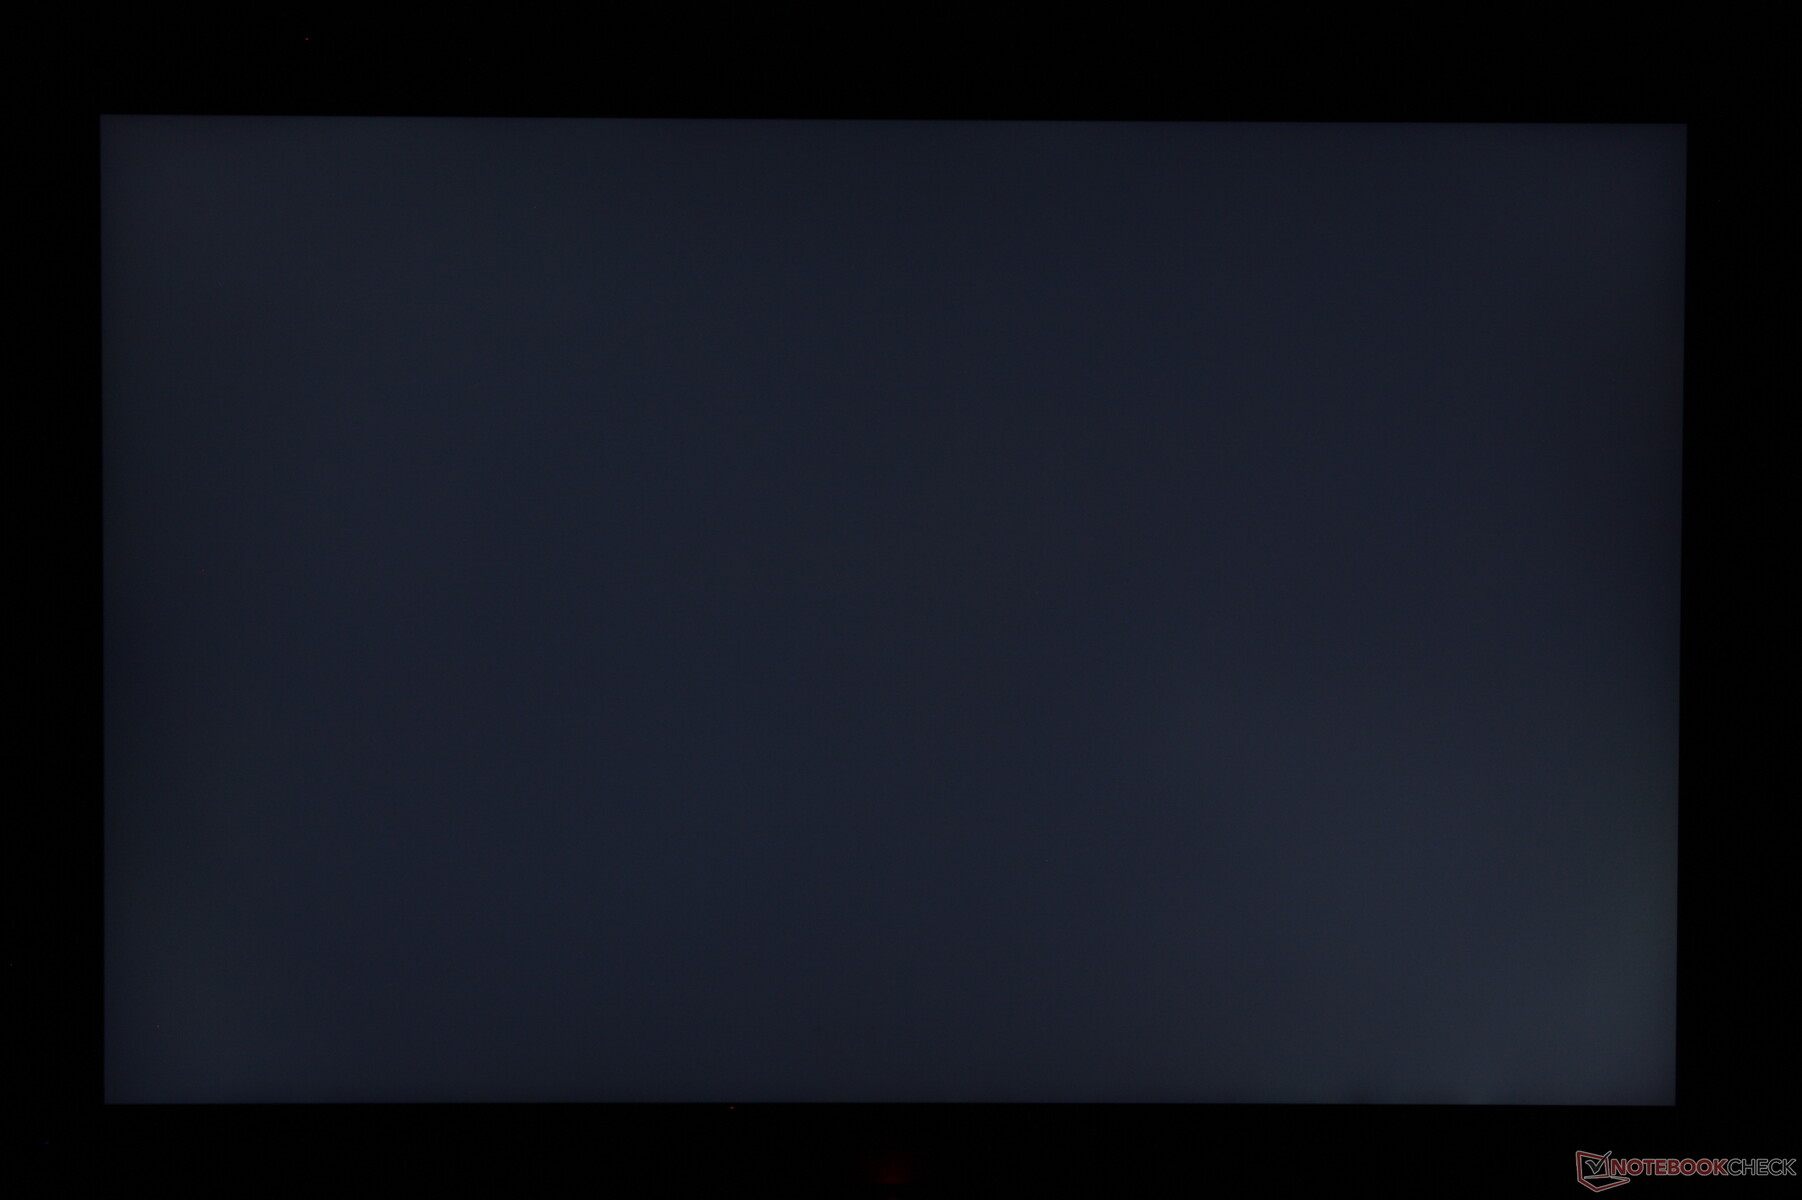
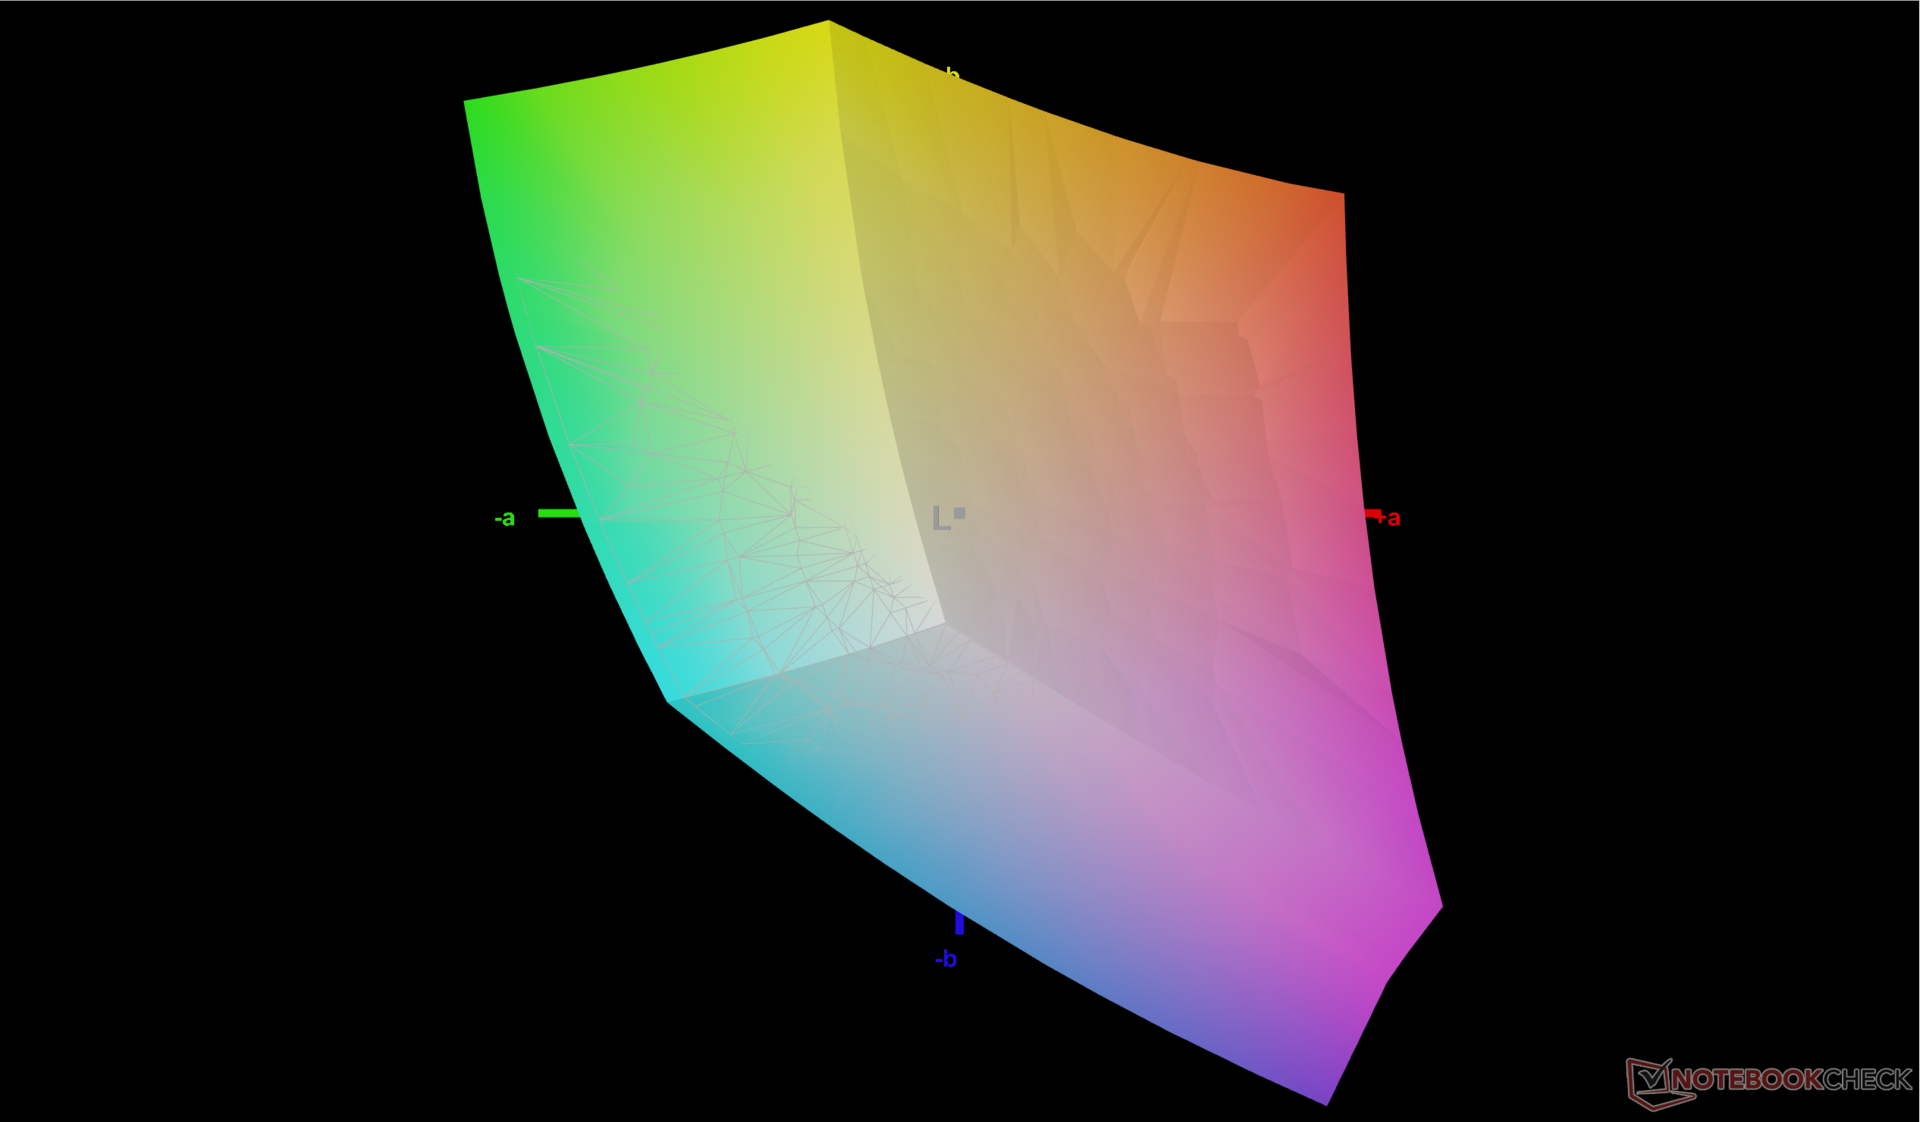
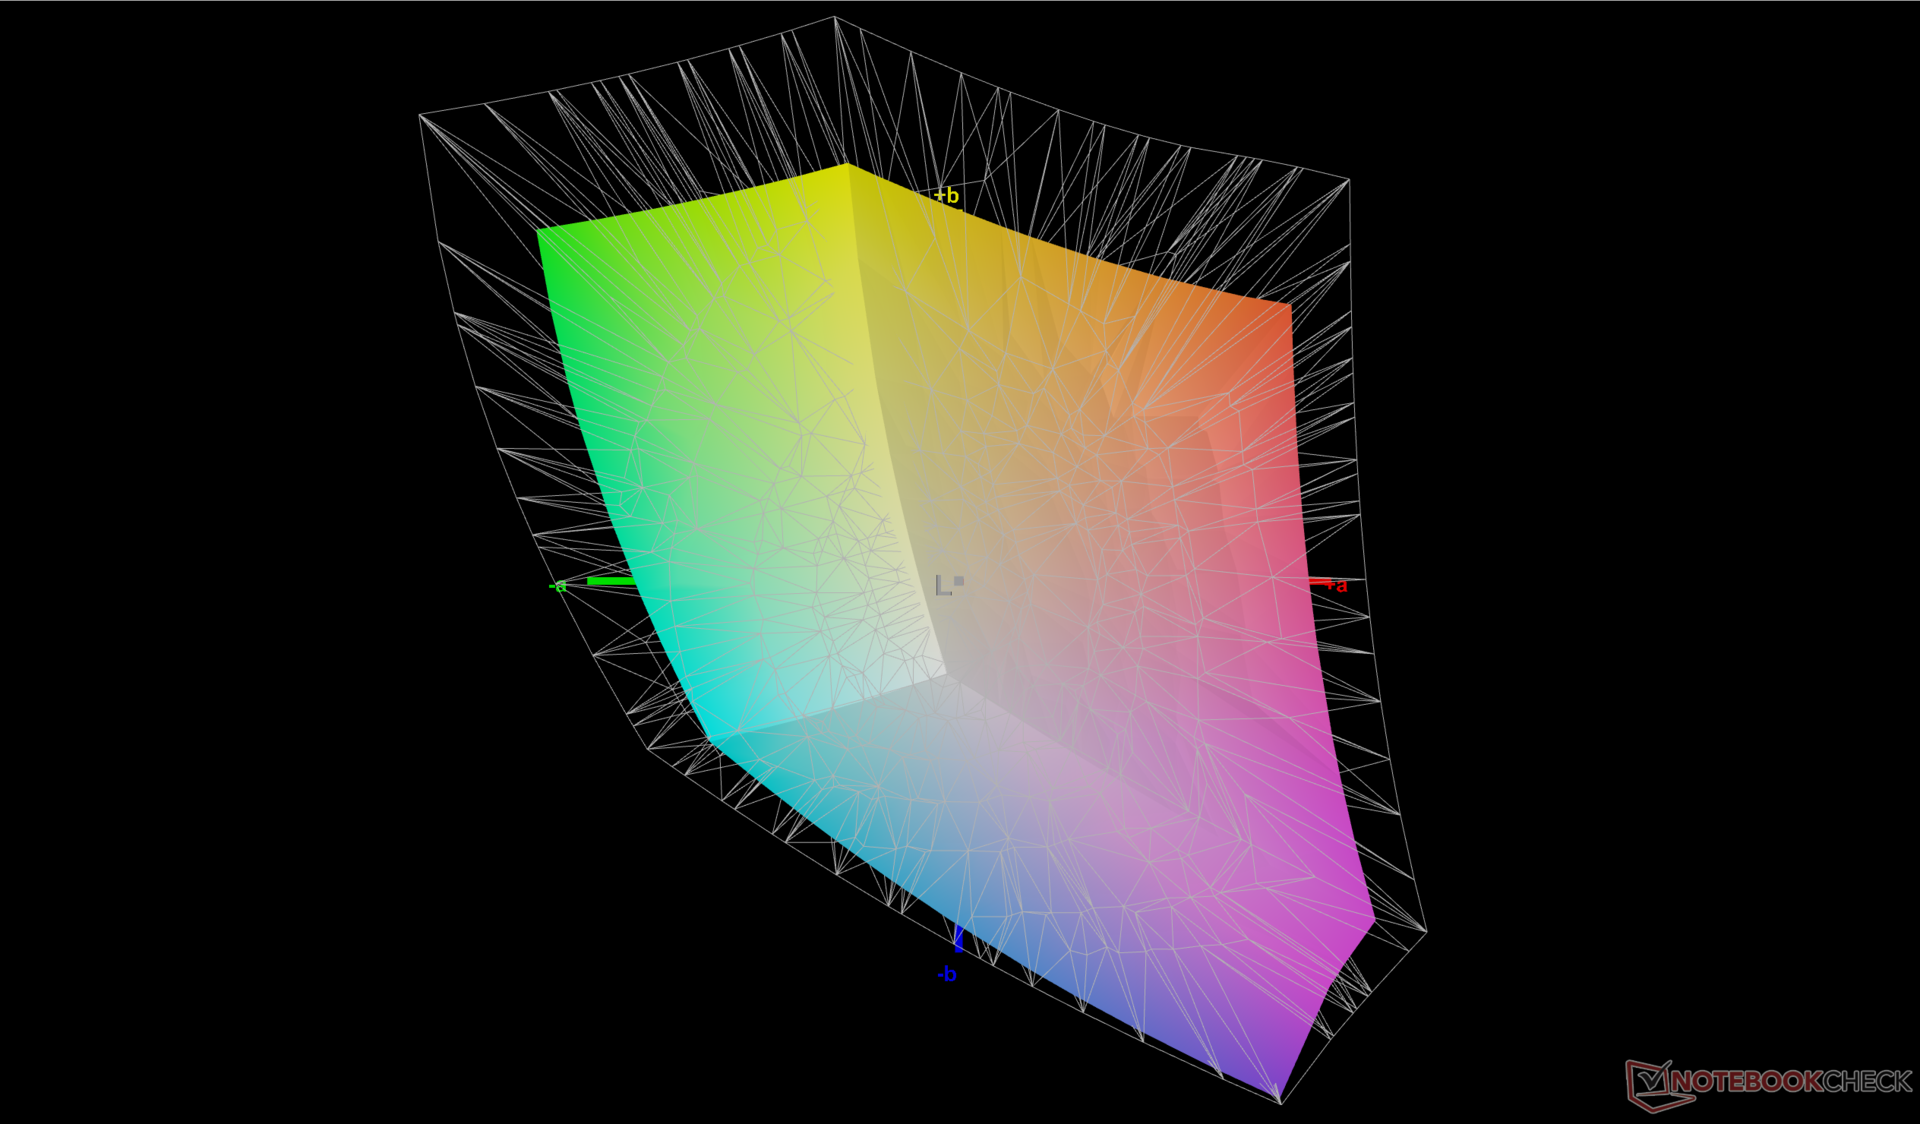
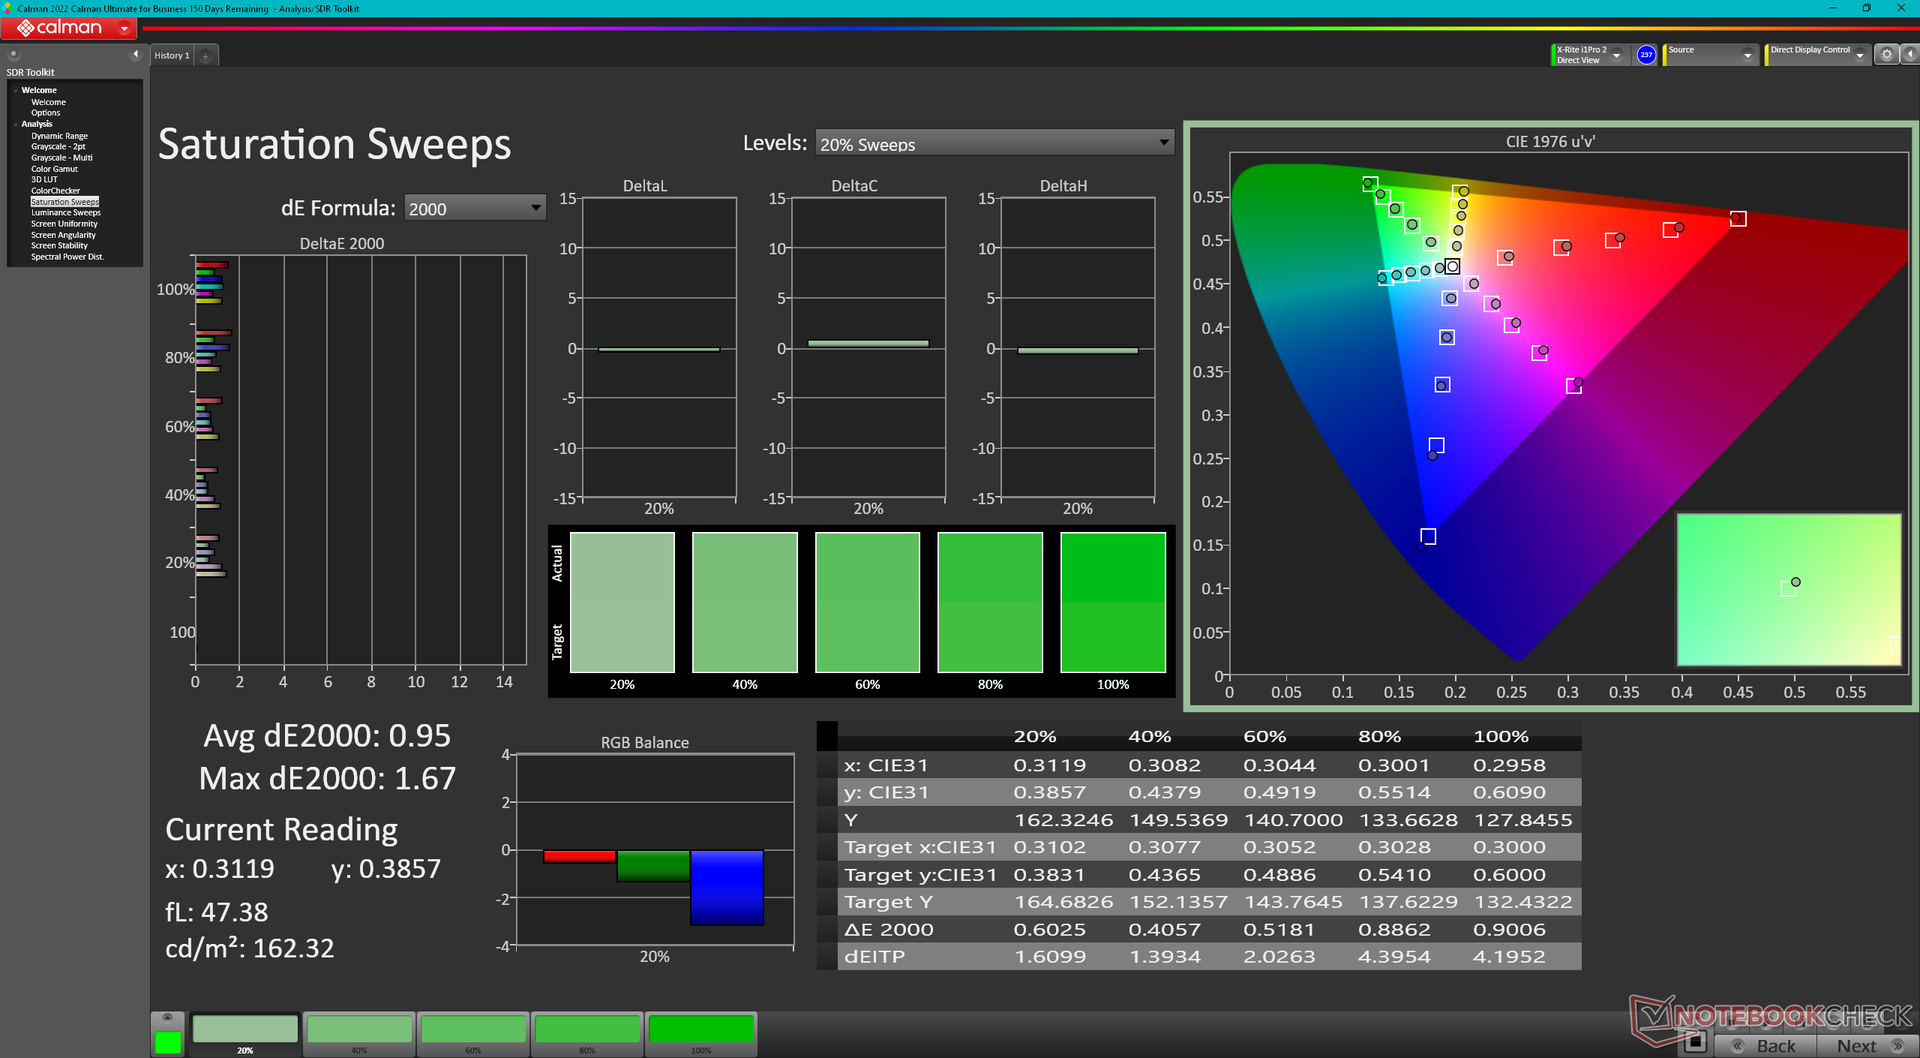
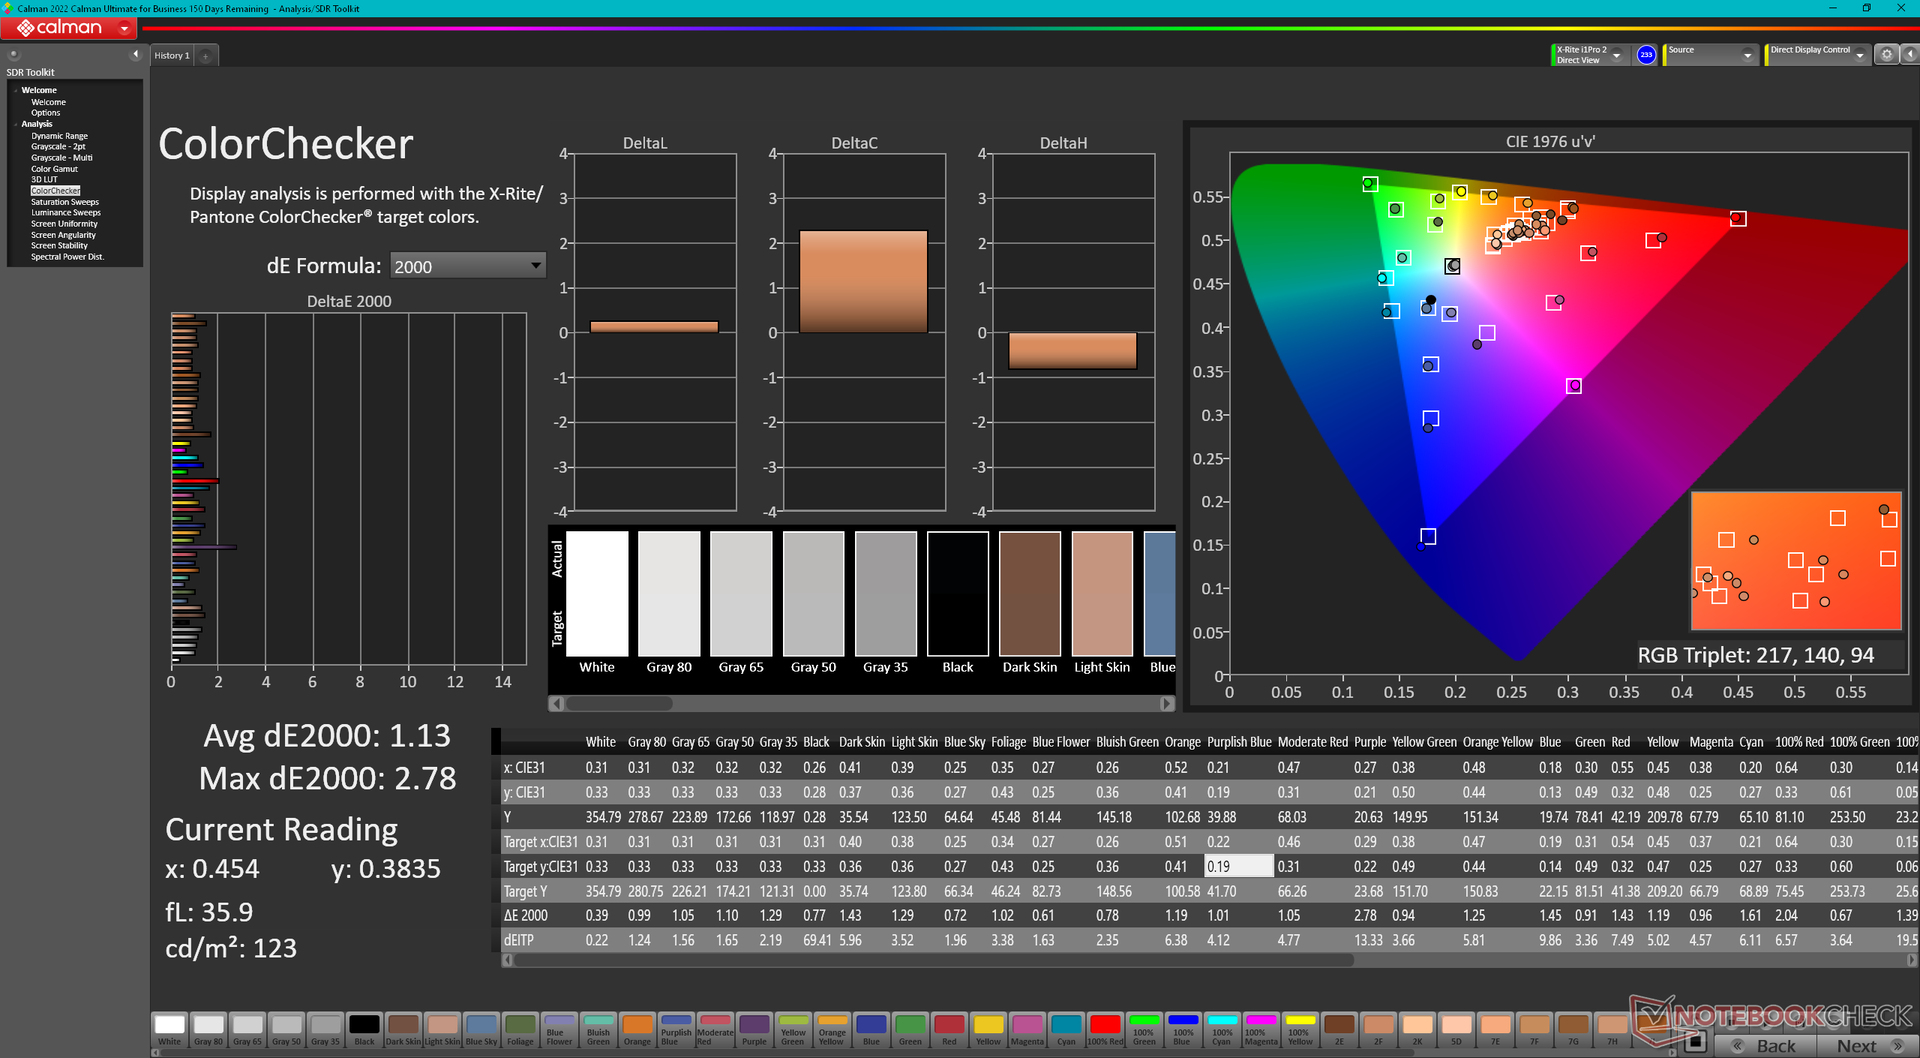
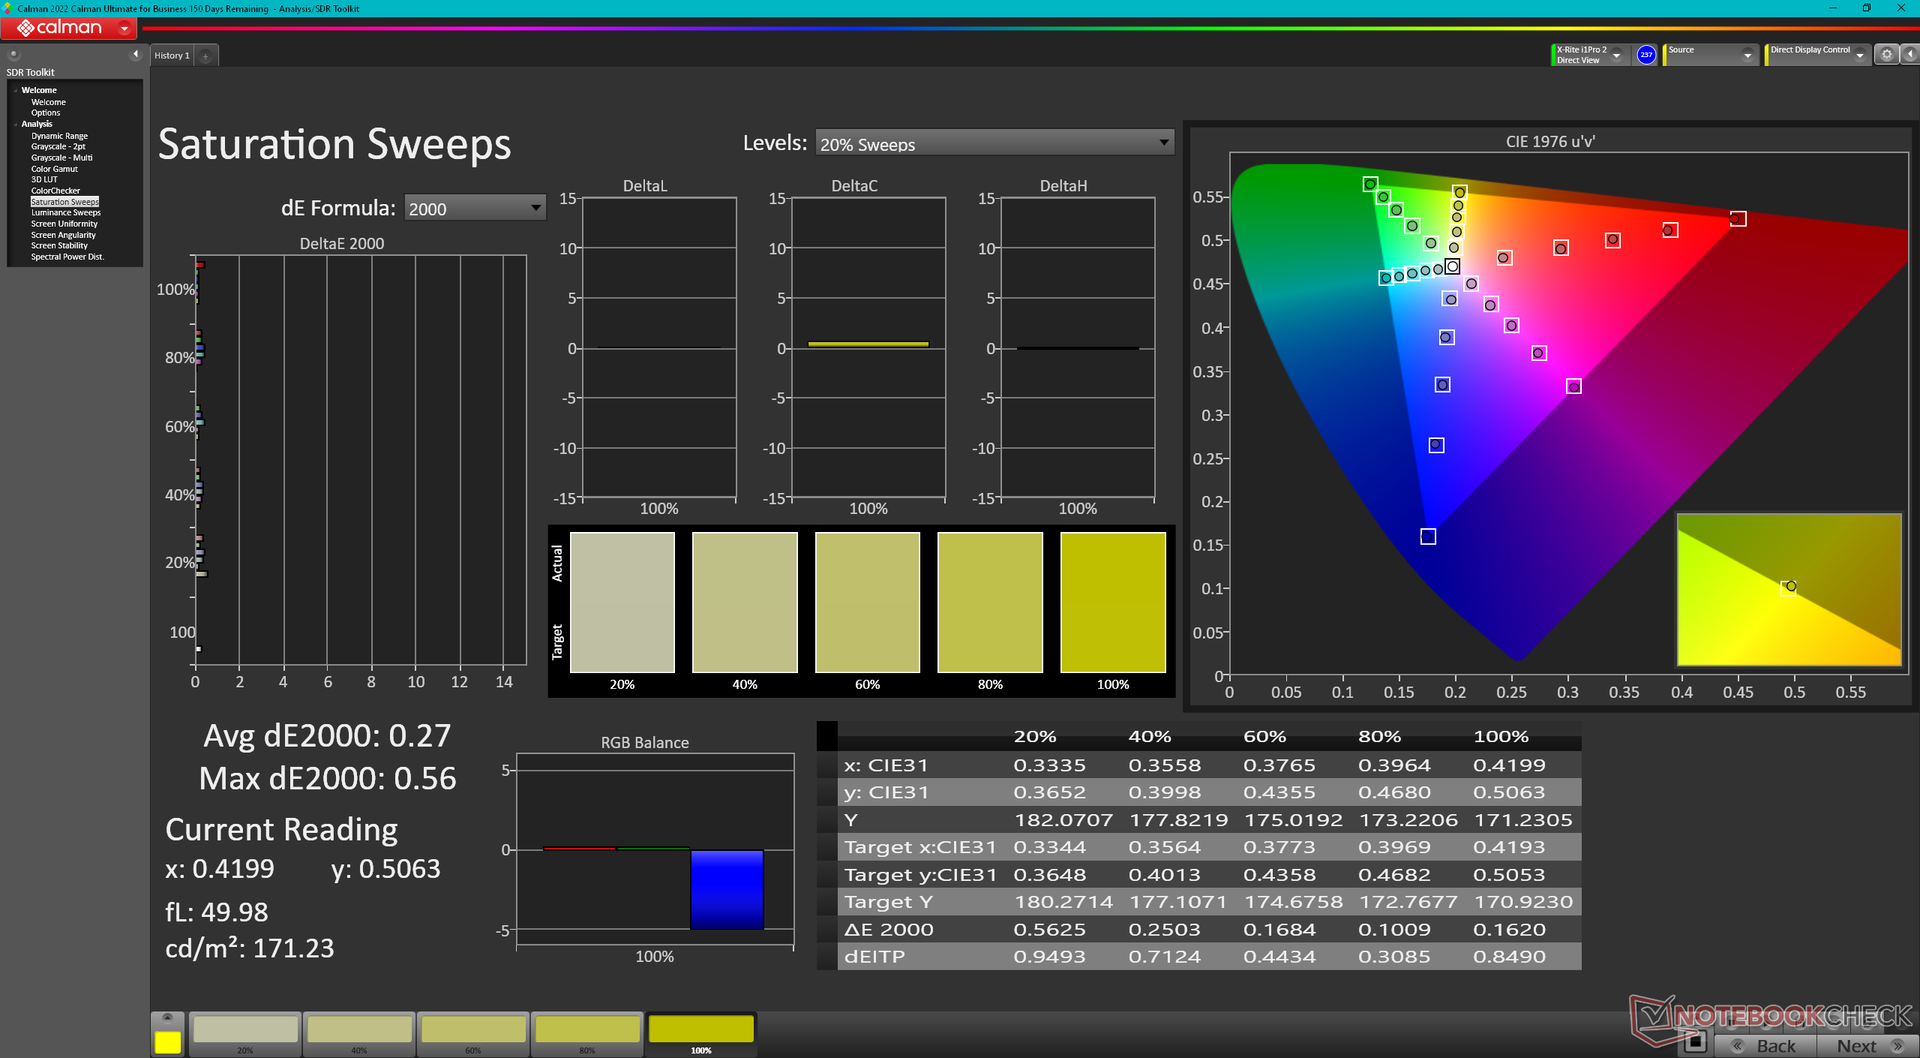
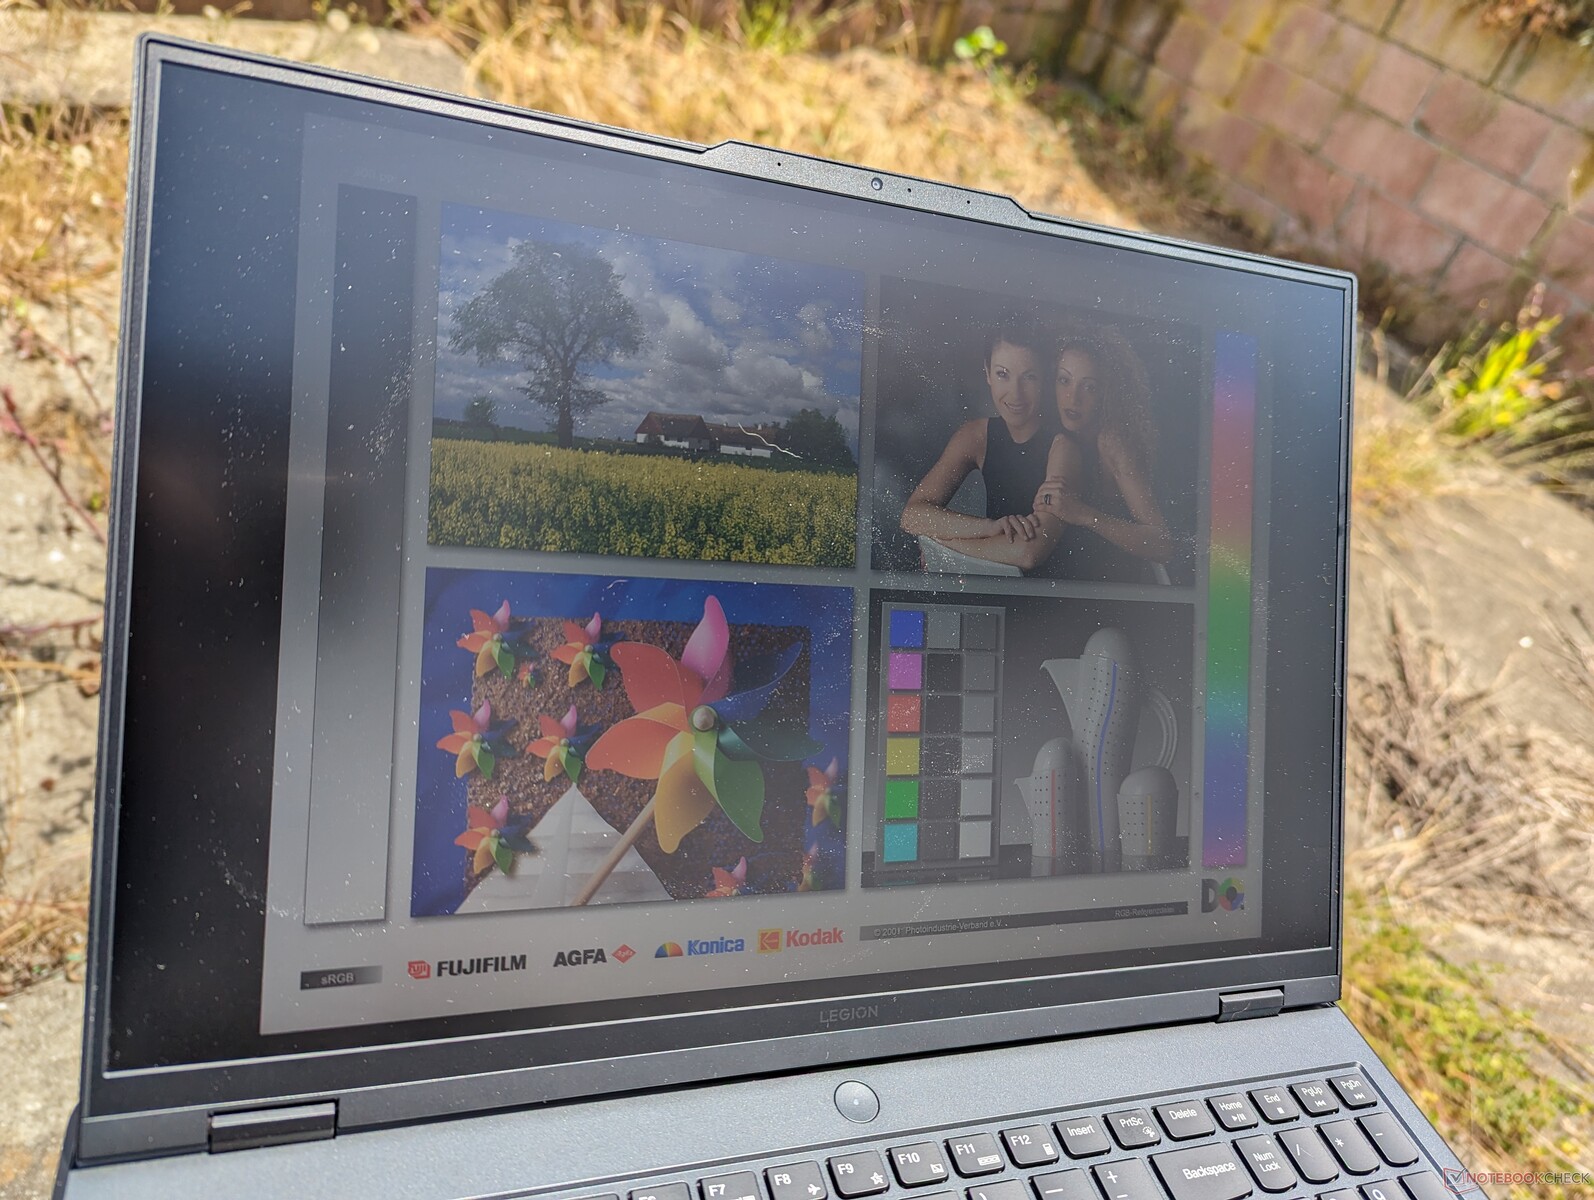
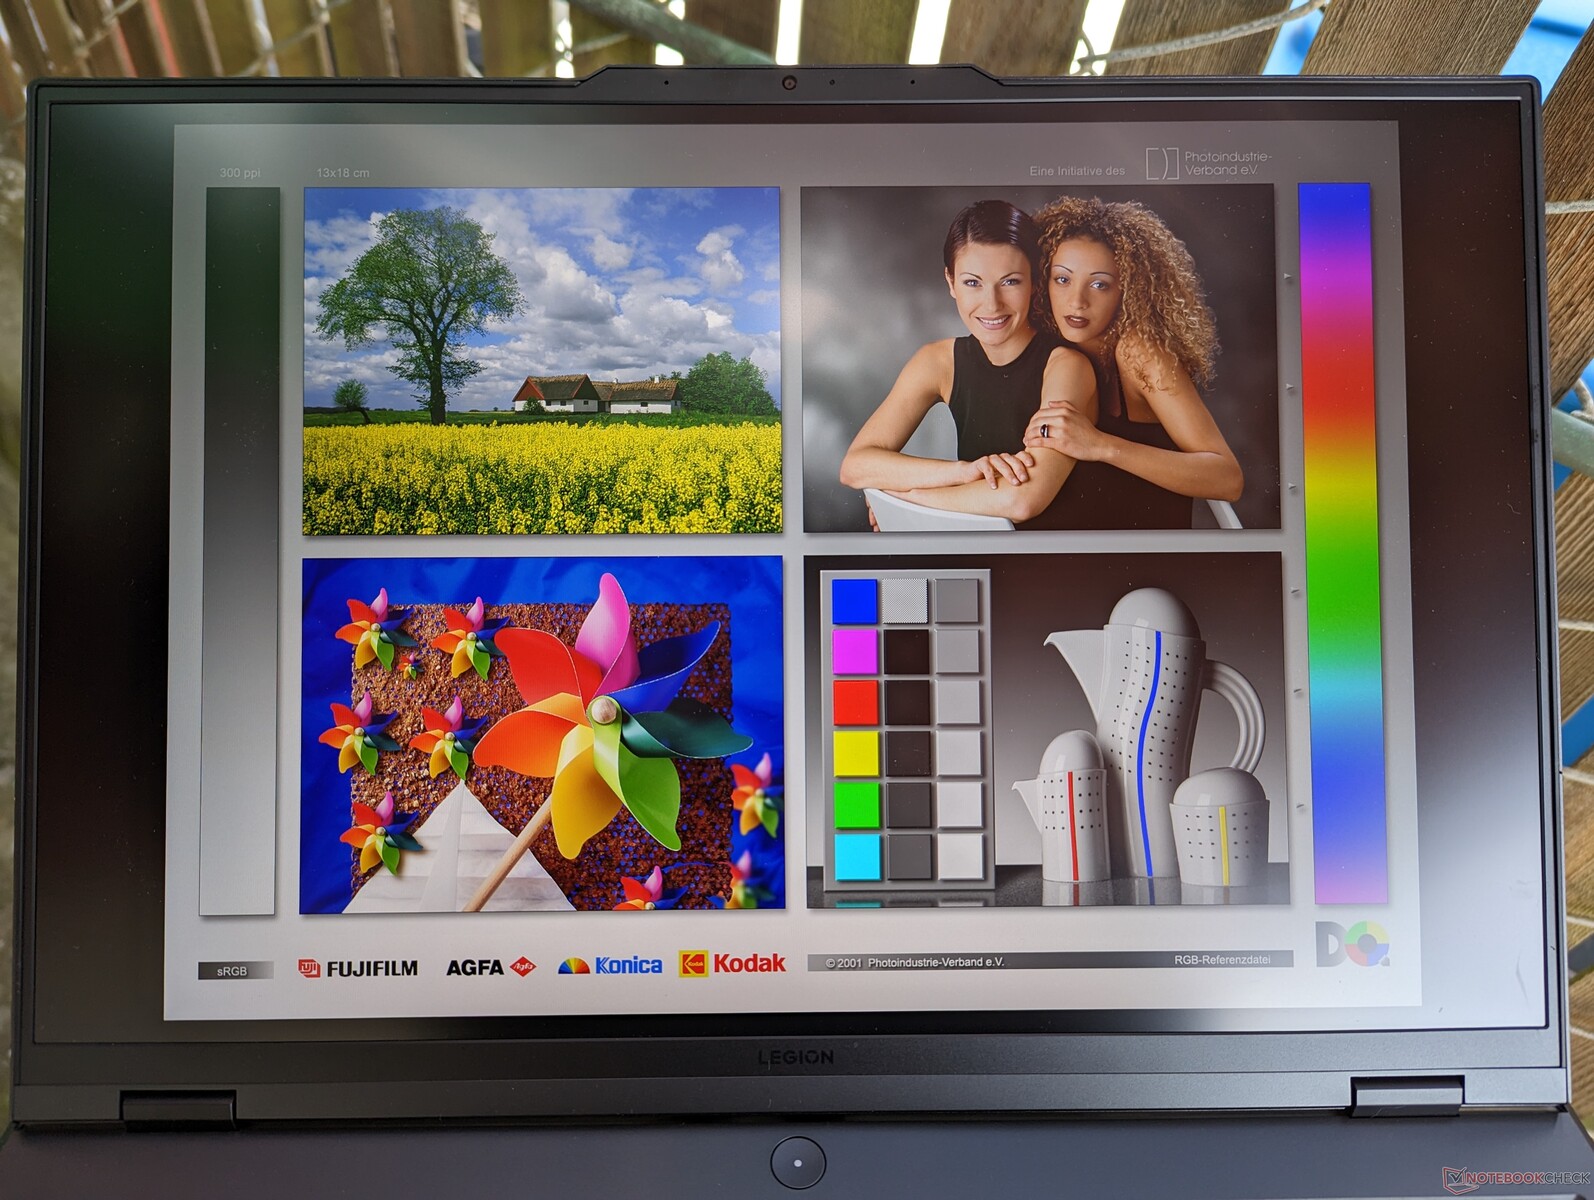
Skärm - 165 Hz, 1600p och full sRGB
Intressant nog använder vår AMD-drivna Legion Pro 5 16ARX8 en annan IPS-panel än den Intel-drivna Legion Pro 5 16IRX8 (CSOT MNG007DA1-Q vs AU Optronics B160QAN03.1), även om båda panelerna har en liknande uppdateringsfrekvens på 165 Hz, en 1600p-upplösning, ett kontrastförhållande på ~1000:1 och en fullständig sRGB-täckning på 100 %. CSOT-panelen har något snabbare svarstider för svartvitt och grått, men skillnaderna är i bästa fall marginella för en i stort sett identisk tittarupplevelse.
En andra panel finns tillgänglig som lovar en ännu ljusare 500-nit-bakgrundsbelysning och snabbare 240 Hz uppdateringsfrekvens. Våra mätningar nedan återspeglar endast baspanelen med 165 Hz.

| |||||||||||||||||||||||||
Distribution av ljusstyrkan: 91 %
Mitt på batteriet: 355.3 cd/m²
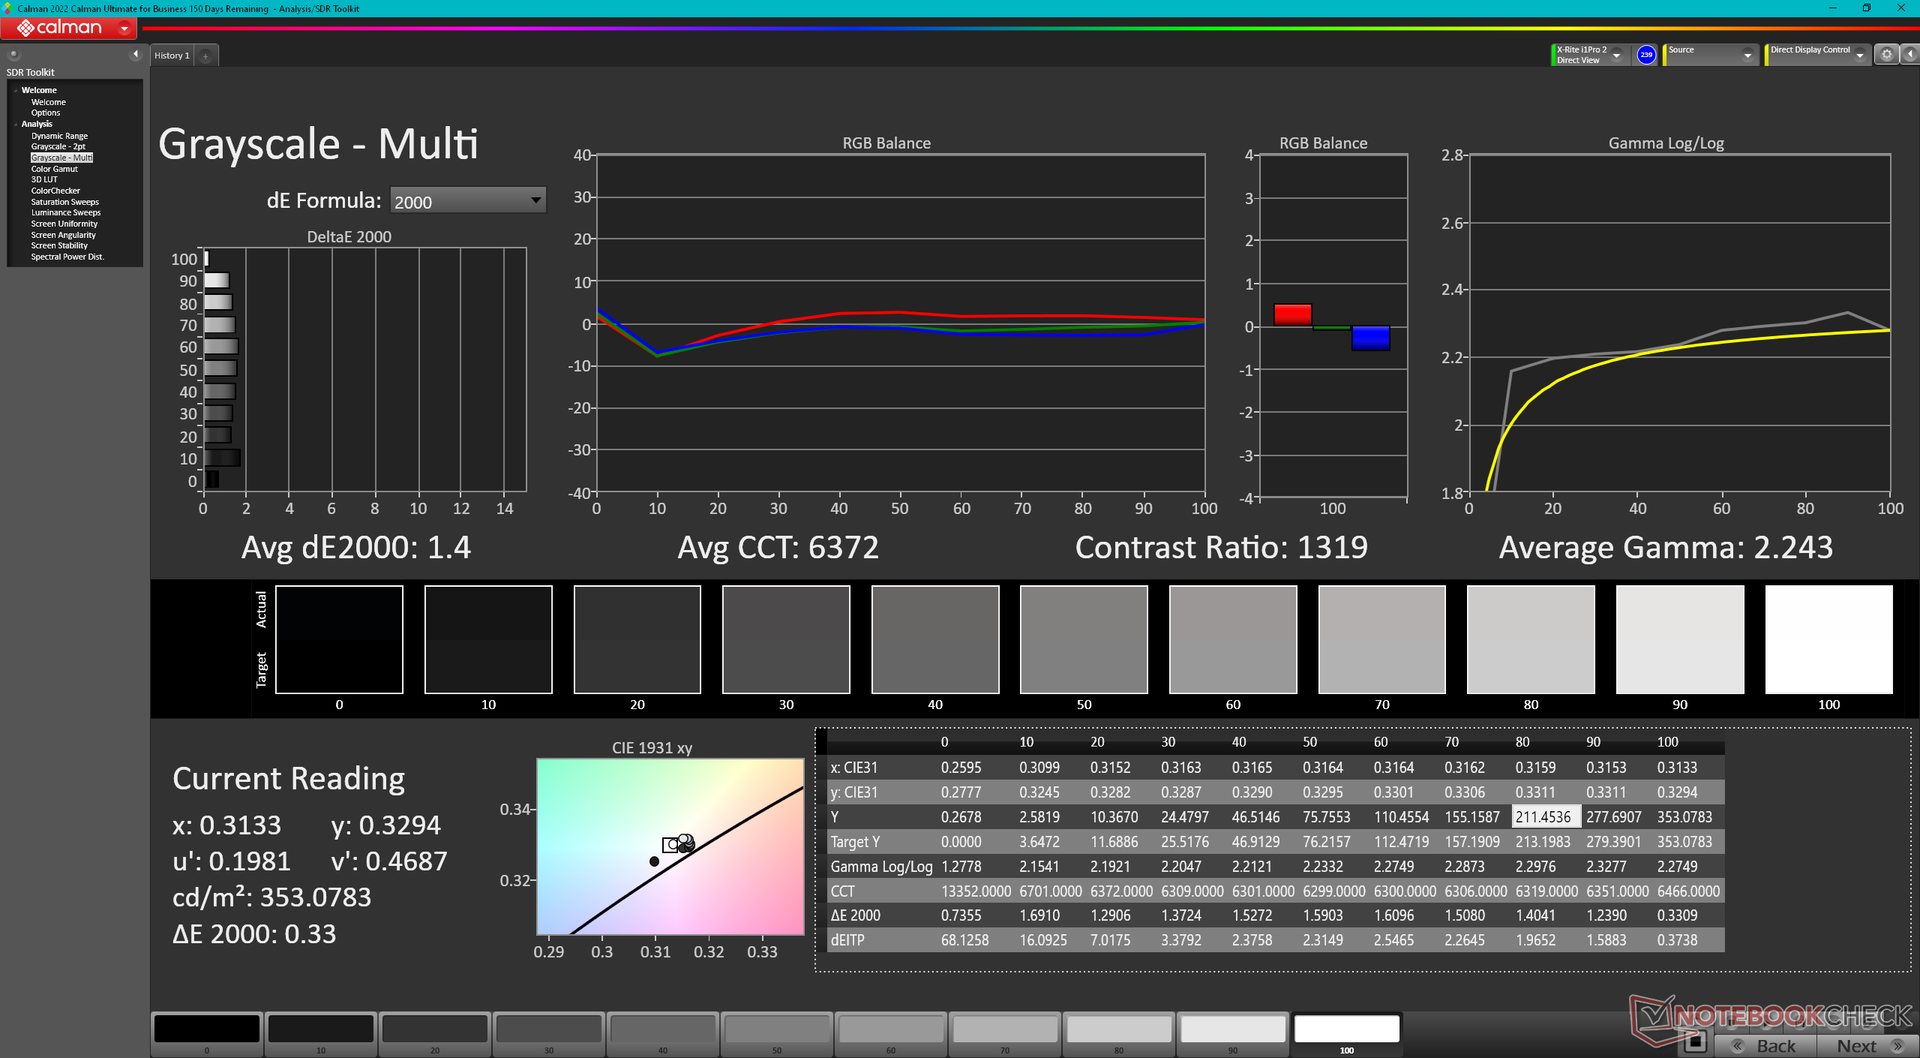
Kontrast: 1110:1 (Svärta: 0.32 cd/m²)
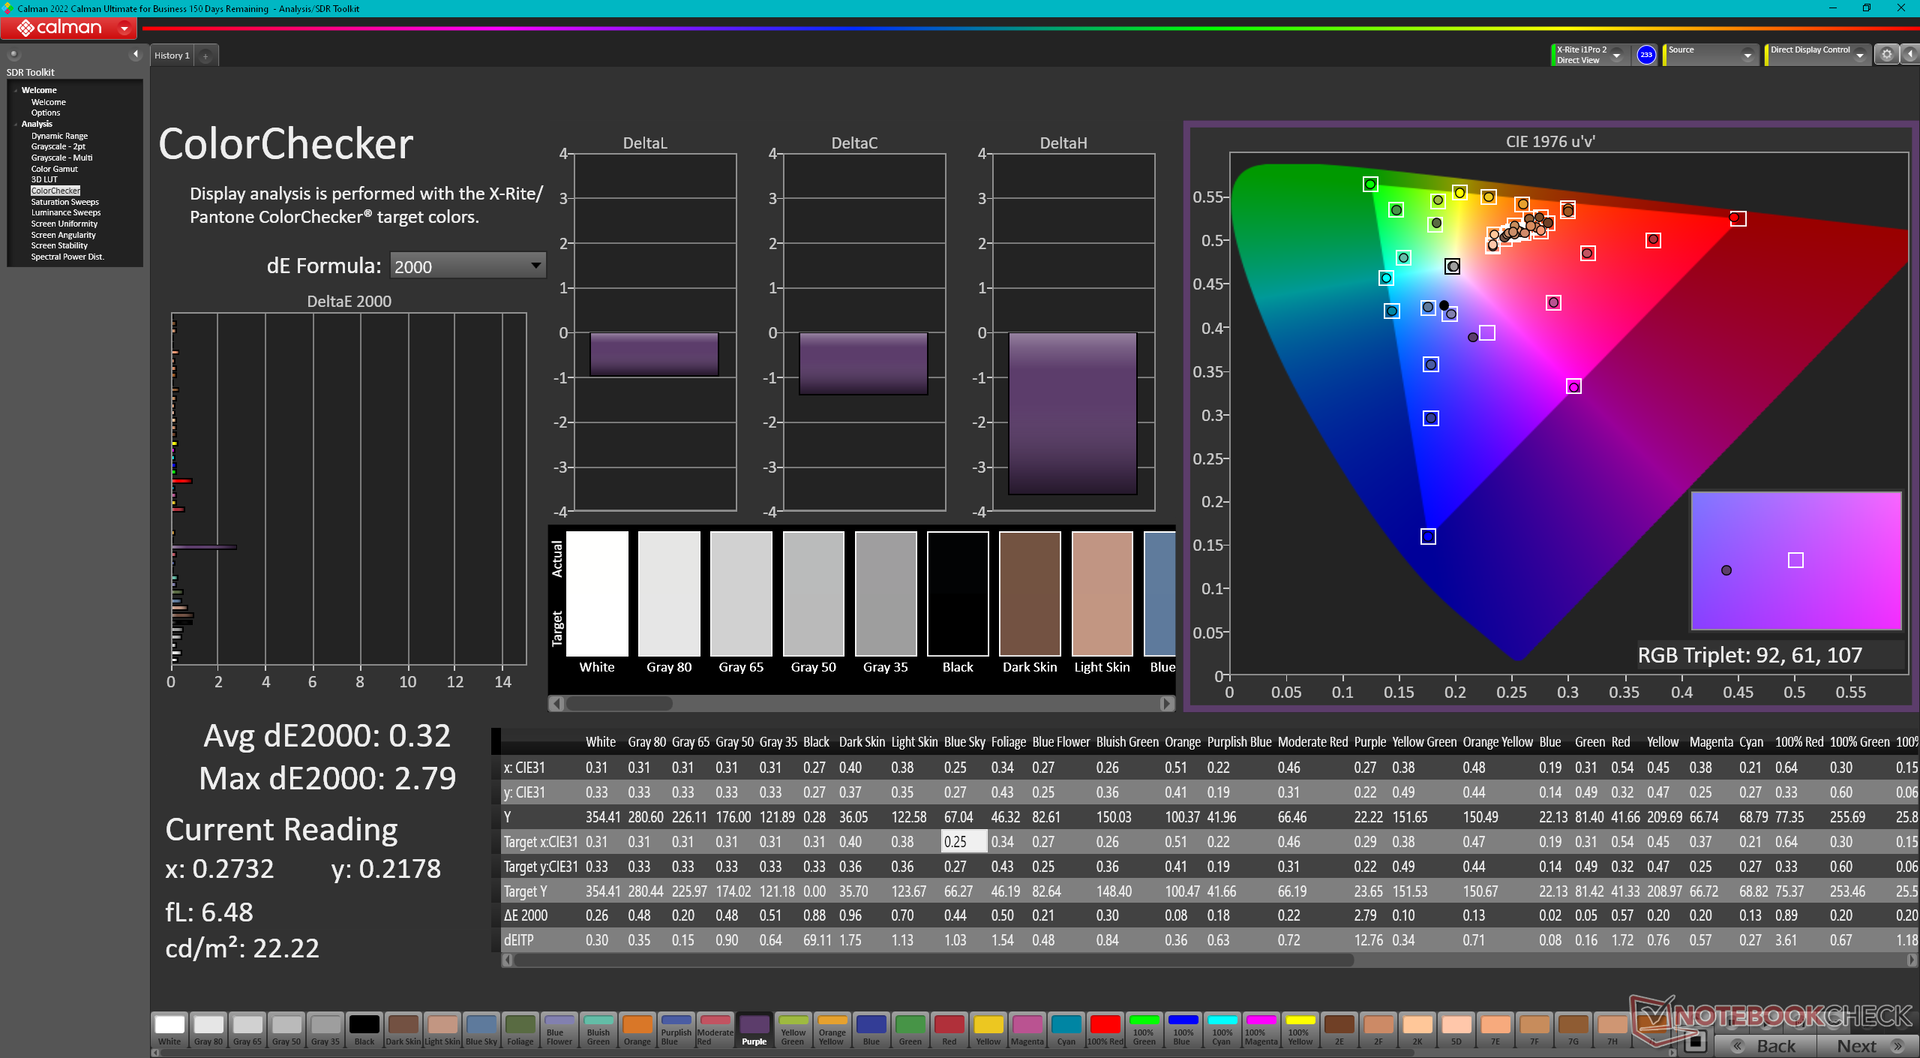
ΔE ColorChecker Calman: 1.13 | ∀{0.5-29.43 Ø4.73}
calibrated: 0.32
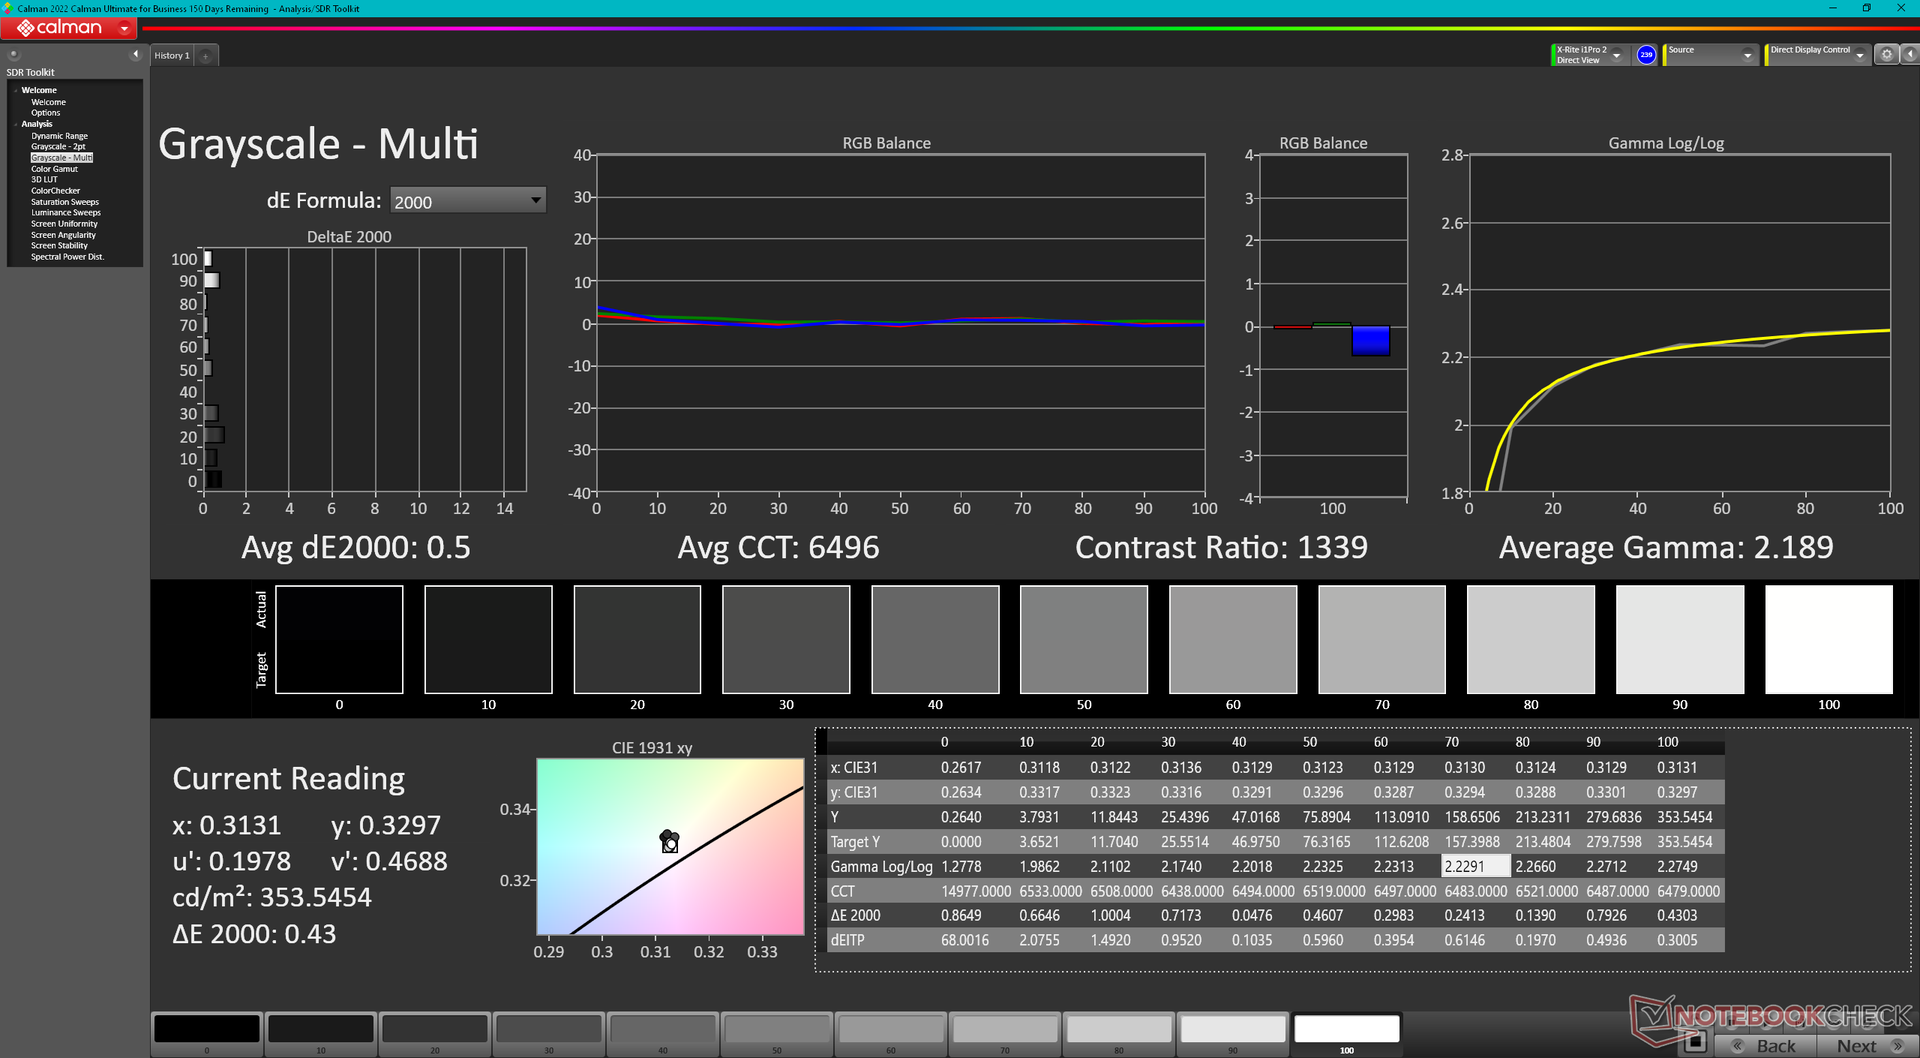
ΔE Greyscale Calman: 1.4 | ∀{0.09-98 Ø4.97}
72.6% AdobeRGB 1998 (Argyll 3D)
99.6% sRGB (Argyll 3D)
70.4% Display P3 (Argyll 3D)
Gamma: 2.24
CCT: 6372 K
| Lenovo Legion Pro 5 16ARX8 CSOT T3 MNG007DA1-Q, IPS, 2560x1600, 16" | Lenovo Legion Pro 5 16IRX8 AU Optronics B160QAN03.1, IPS, 2560x1600, 16" | Uniwill GM6PX7X RTX 4070 BOE CQ NE160QDM-NZ1, IPS, 2560x1600, 16" | Schenker XMG Neo 16 E23 BOE0AF0 NE160QDM-NZ1, IPS, 2560x1600, 16" | Asus ROG Strix G16 G614JZ TL160ADMP03-0, IPS, 2560x1600, 16" | Asus Zephyrus Duo 16 GX650PY-NM006W NE160QDM-NM4, MiniLED, 2560x1600, 16" | |
|---|---|---|---|---|---|---|
| Display | 0% | -4% | -4% | 18% | 22% | |
| Display P3 Coverage (%) | 70.4 | 71.2 1% | 67.5 -4% | 67.3 -4% | 97 38% | 99.4 41% |
| sRGB Coverage (%) | 99.6 | 98.8 -1% | 96.4 -3% | 96.7 -3% | 99.9 0% | 100 0% |
| AdobeRGB 1998 Coverage (%) | 72.6 | 73.3 1% | 68.6 -6% | 68.9 -5% | 84.9 17% | 90.8 25% |
| Response Times | -61% | -44% | -51% | 27% | -113% | |
| Response Time Grey 50% / Grey 80% * (ms) | 7 ? | 14.5 ? -107% | 12.6 ? -80% | 14.5 ? -107% | 5.1 ? 27% | 15.2 ? -117% |
| Response Time Black / White * (ms) | 9.1 ? | 10.4 ? -14% | 9.8 ? -8% | 8.6 ? 5% | 6.6 ? 27% | 19 ? -109% |
| PWM Frequency (Hz) | 12000 ? | |||||
| Screen | -17% | -69% | -54% | -39% | 71% | |
| Brightness middle (cd/m²) | 355.3 | 405.7 14% | 338.6 -5% | 372 5% | 470 32% | 712 100% |
| Brightness (cd/m²) | 340 | 368 8% | 328 -4% | 349 3% | 459 35% | 703 107% |
| Brightness Distribution (%) | 91 | 87 -4% | 89 -2% | 88 -3% | 93 2% | 95 4% |
| Black Level * (cd/m²) | 0.32 | 0.38 -19% | 0.32 -0% | 0.32 -0% | 0.42 -31% | 0.07 78% |
| Contrast (:1) | 1110 | 1068 -4% | 1058 -5% | 1163 5% | 1119 1% | 10171 816% |
| Colorchecker dE 2000 * | 1.13 | 1.65 -46% | 2.18 -93% | 2.06 -82% | 1.86 -65% | 1.7 -50% |
| Colorchecker dE 2000 max. * | 2.78 | 4.2 -51% | 7.14 -157% | 3 -8% | 3.87 -39% | 4 -44% |
| Colorchecker dE 2000 calibrated * | 0.32 | 0.53 -66% | 0.93 -191% | 1.5 -369% | 0.93 -191% | 1.2 -275% |
| Greyscale dE 2000 * | 1.4 | 1.2 14% | 3.7 -164% | 1.9 -36% | 2.7 -93% | 2.8 -100% |
| Gamma | 2.24 98% | 2.3 96% | 2.18 101% | 2.312 95% | 2.246 98% | 2.21 100% |
| CCT | 6372 102% | 6453 101% | 7245 90% | 6747 96% | 6711 97% | 6978 93% |
| Totalt genomsnitt (program/inställningar) | -26% /
-20% | -39% /
-52% | -36% /
-43% | 2% /
-17% | -7% /
34% |
* ... mindre är bättre
Skärmen levereras förkalibrerad från förpackningen med utmärkta genomsnittliga DeltaE-värden för gråskala och färg på bara 1,4 respektive 1,13. Att försöka kalibrera skärmen ytterligare med vår X-Rite-kolorimeter skulle faktiskt förbättra gråskala- och färgdeltaE-värdena till endast <0,5 vardera. Trots detta är en kalibrering för slutanvändare i allmänhet inte nödvändig om deltaE-värdena redan är <2.
Visa svarstider
| ↔ Svarstid svart till vitt | ||
|---|---|---|
| 9.1 ms ... stiga ↗ och falla ↘ kombinerat | ↗ 4.9 ms stiga | 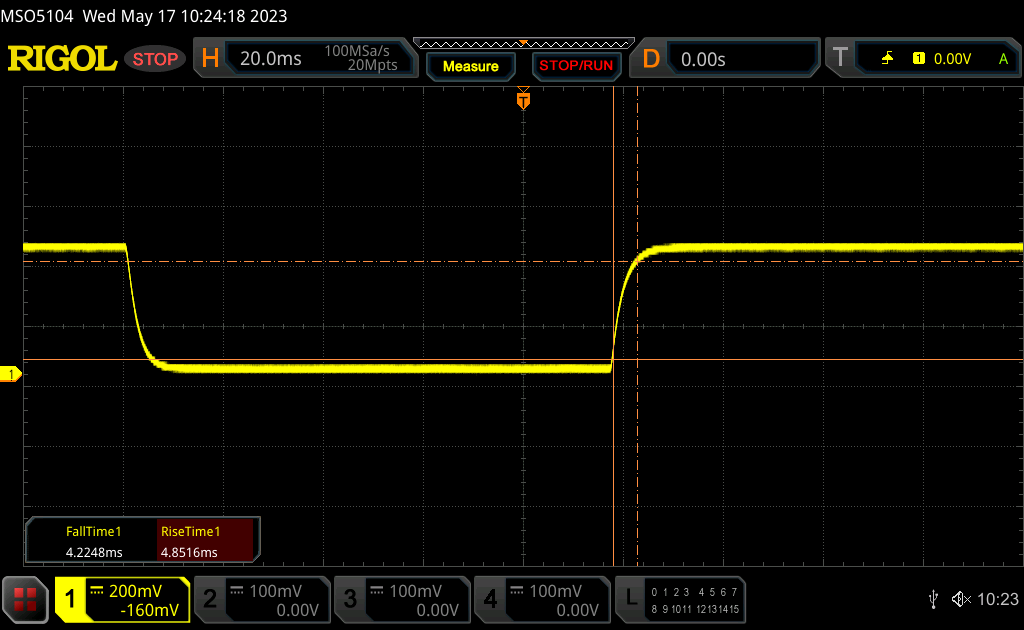 |
| ↘ 4.2 ms hösten | ||
| Skärmen visar snabba svarsfrekvenser i våra tester och bör passa för spel. I jämförelse sträcker sig alla testade enheter från 0.1 (minst) till 240 (maximalt) ms. » 25 % av alla enheter är bättre. Det betyder att den uppmätta svarstiden är bättre än genomsnittet av alla testade enheter (19.9 ms). | ||
| ↔ Svarstid 50 % grått till 80 % grått | ||
| 7 ms ... stiga ↗ och falla ↘ kombinerat | ↗ 3.2 ms stiga | 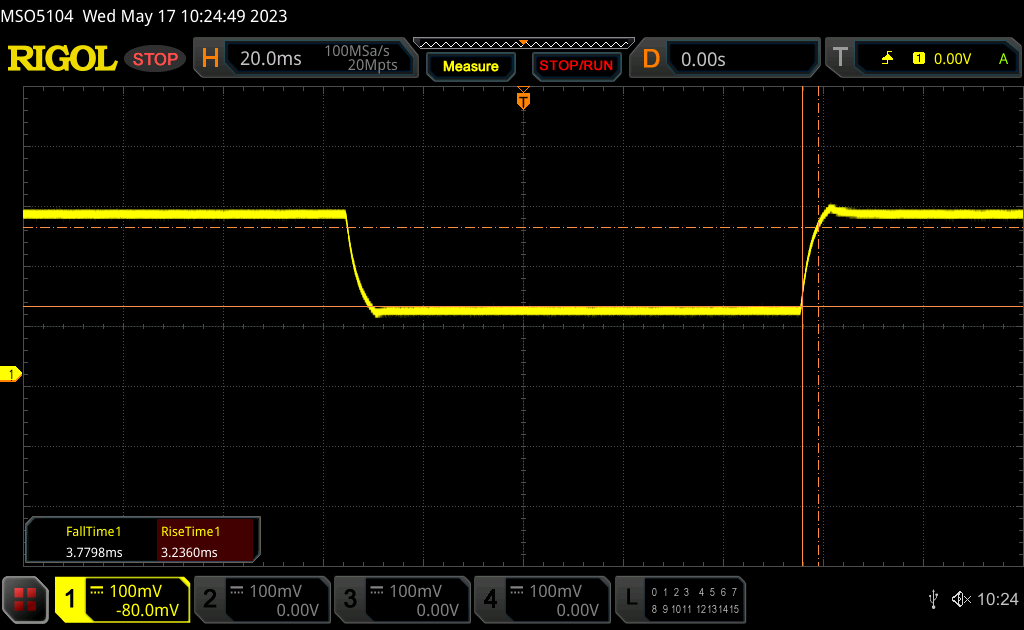 |
| ↘ 3.8 ms hösten | ||
| Skärmen visar väldigt snabba svarsfrekvenser i våra tester och borde vara mycket väl lämpad för fartfyllt spel. I jämförelse sträcker sig alla testade enheter från 0.165 (minst) till 636 (maximalt) ms. » 20 % av alla enheter är bättre. Det betyder att den uppmätta svarstiden är bättre än genomsnittet av alla testade enheter (31.1 ms). | ||
Skärmflimmer / PWM (Puls-Width Modulation)
| Skärmflimmer / PWM upptäcktes inte | 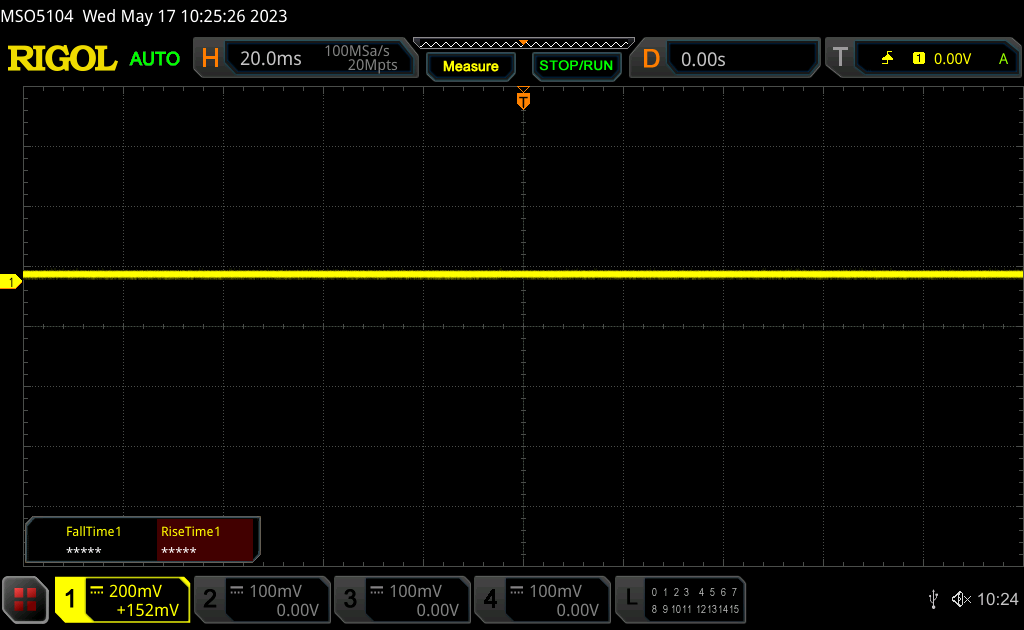 | ||
Som jämförelse: 52 % av alla testade enheter använder inte PWM för att dämpa skärmen. Om PWM upptäcktes mättes ett medelvärde av 7784 (minst: 5 - maximum: 343500) Hz. | |||
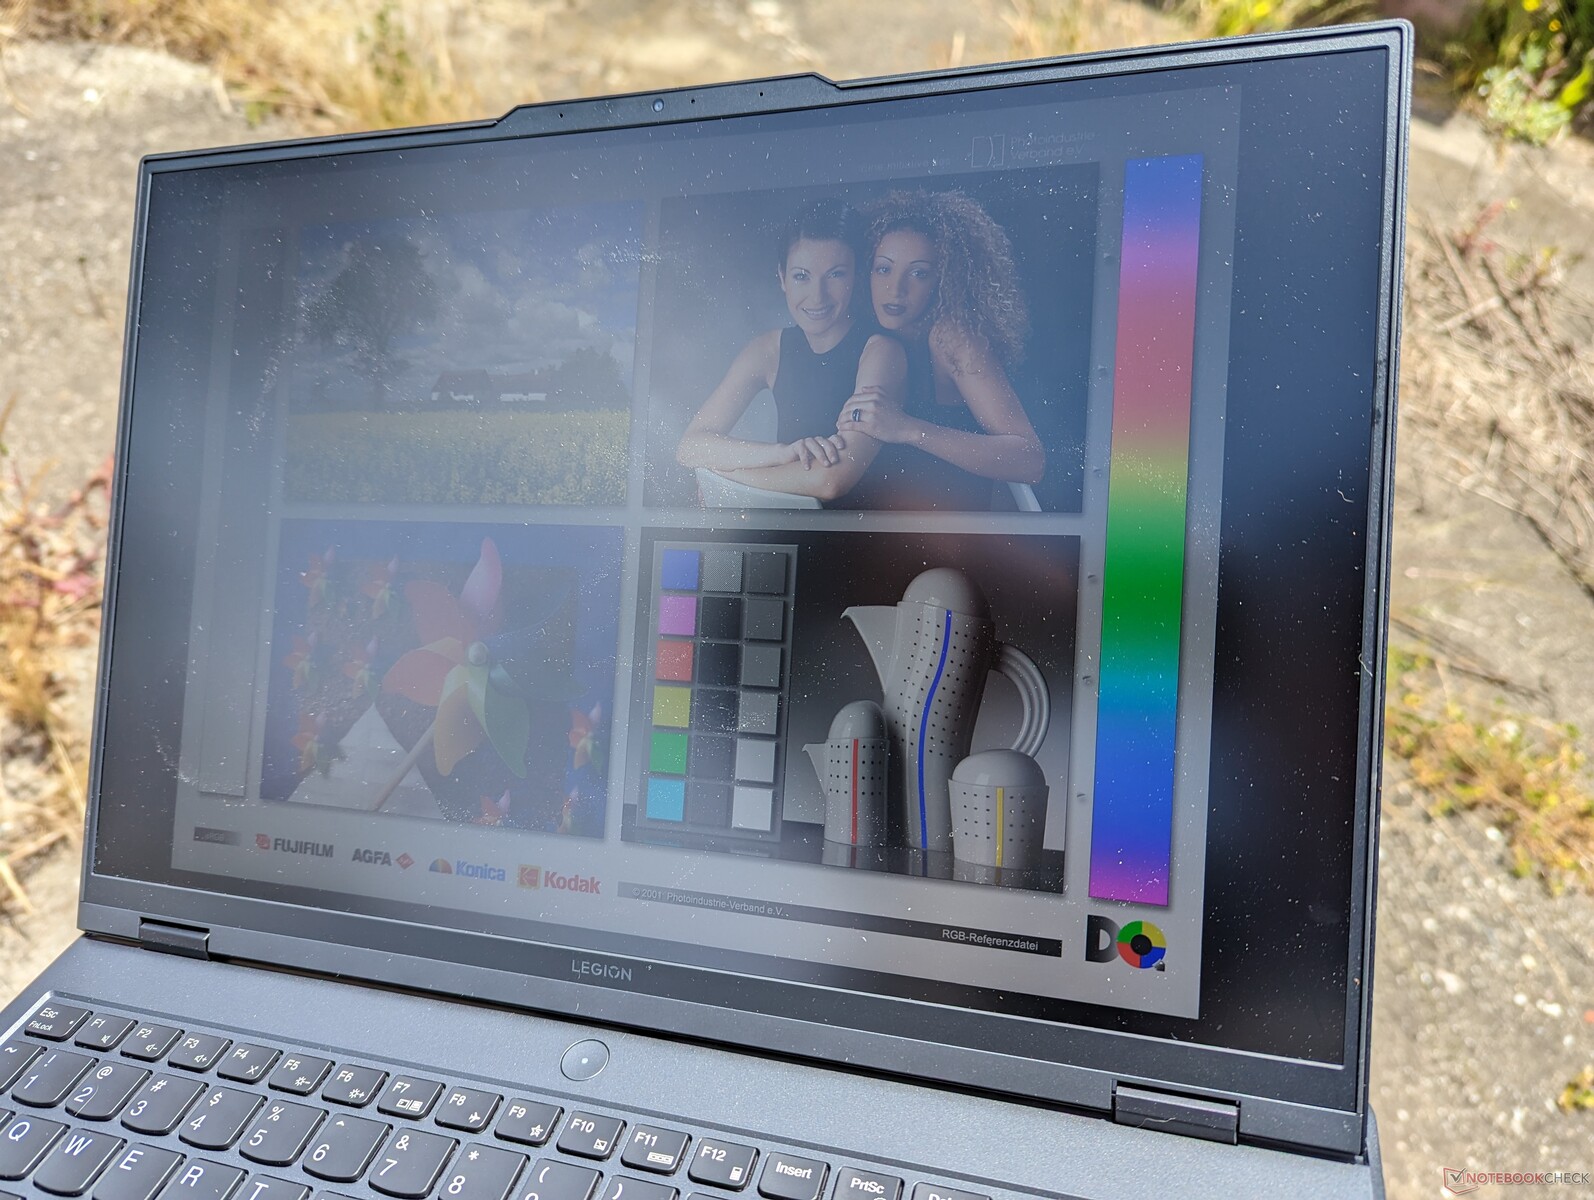
Synligheten utomhus är genomsnittlig för kategorin eftersom skärmarna på de flesta bärbara speldatorer vanligtvis ligger mellan 300 och 400 nits. Alternativet med 240 Hz-panel lovar att vara 500 nits eller cirka 200 nits ljusare än vår 165 Hz-panel, vilket borde förbättra synligheten utomhus om det är ett problem. Oavsett detta vill du arbeta i skugga när det är möjligt för att minimera bländning och bevara färgerna.

Prestanda - Medelklass Zen 4 Ryzen 7
Provningsförhållanden
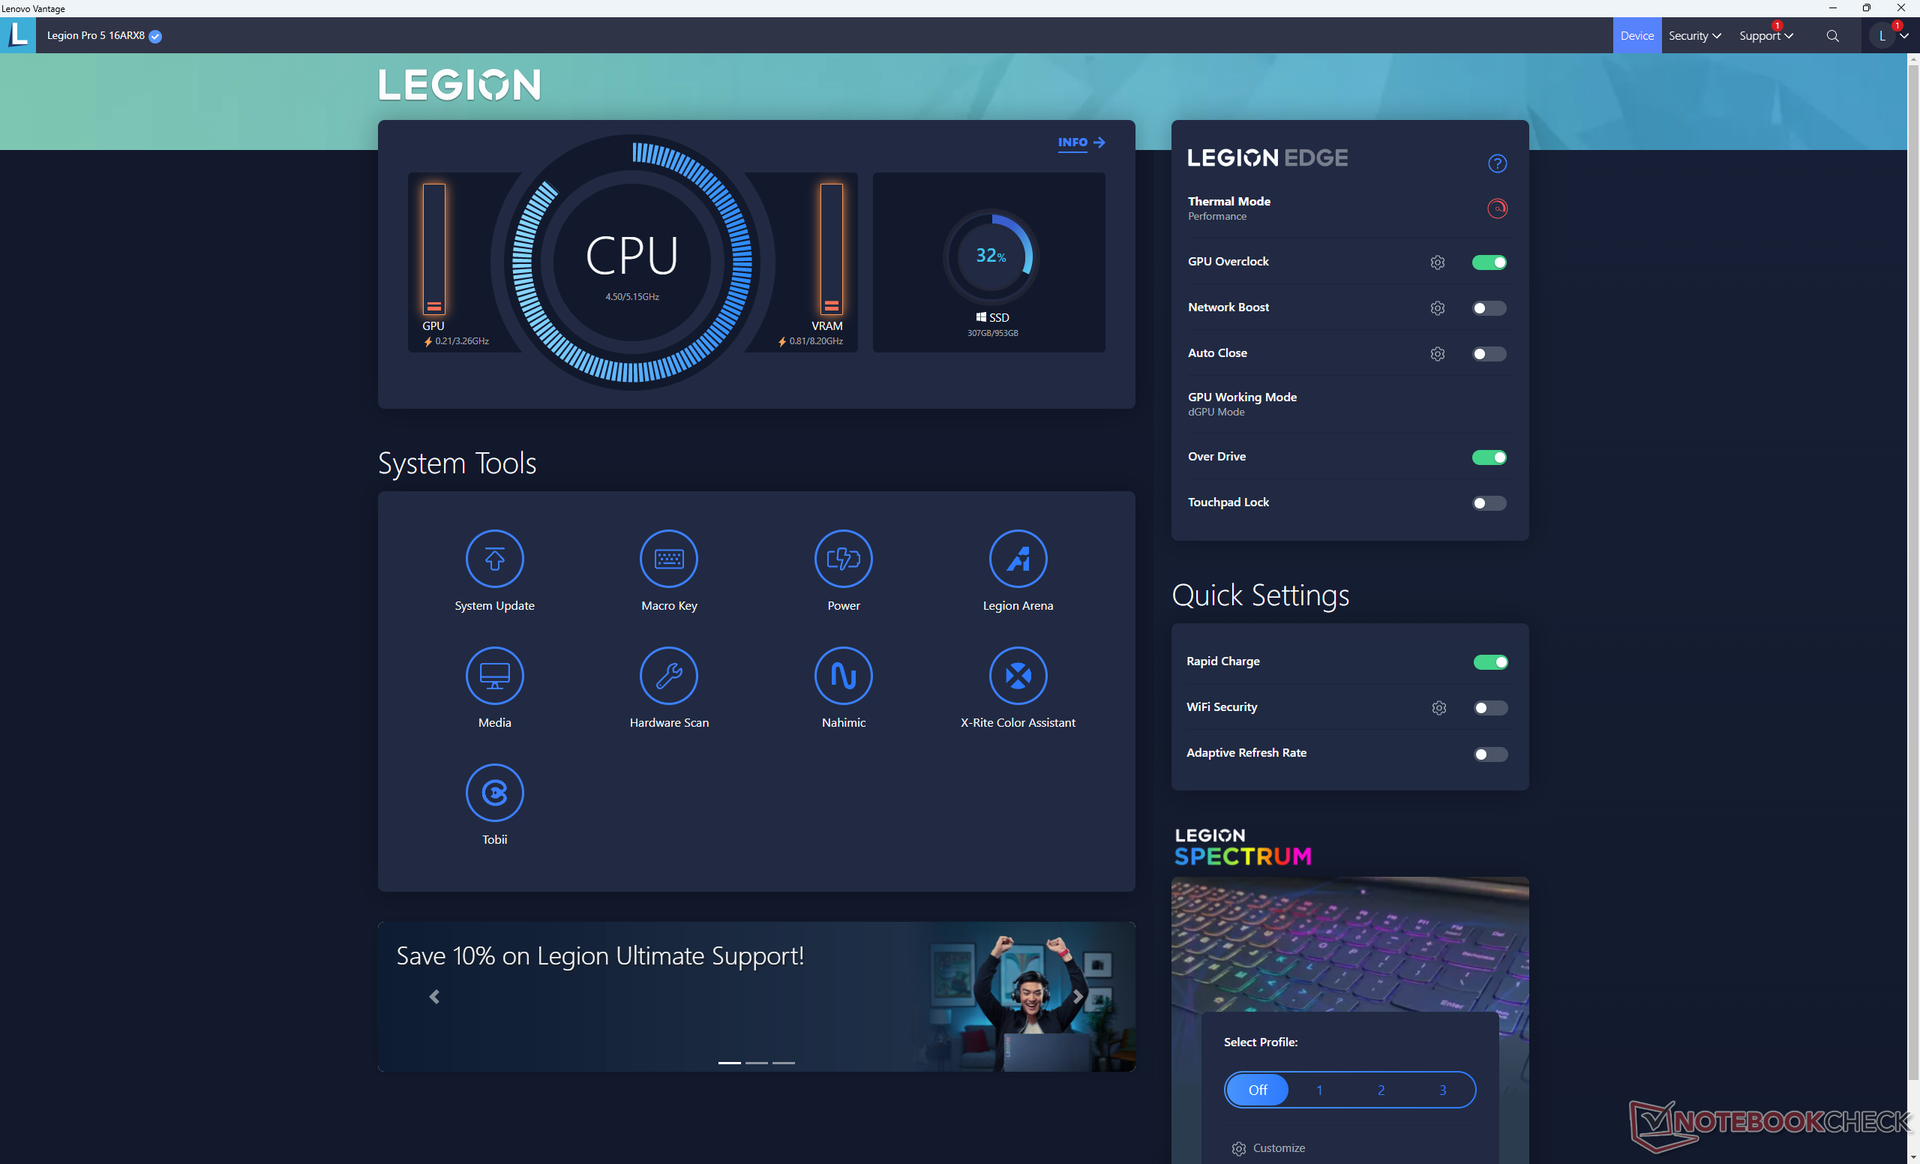
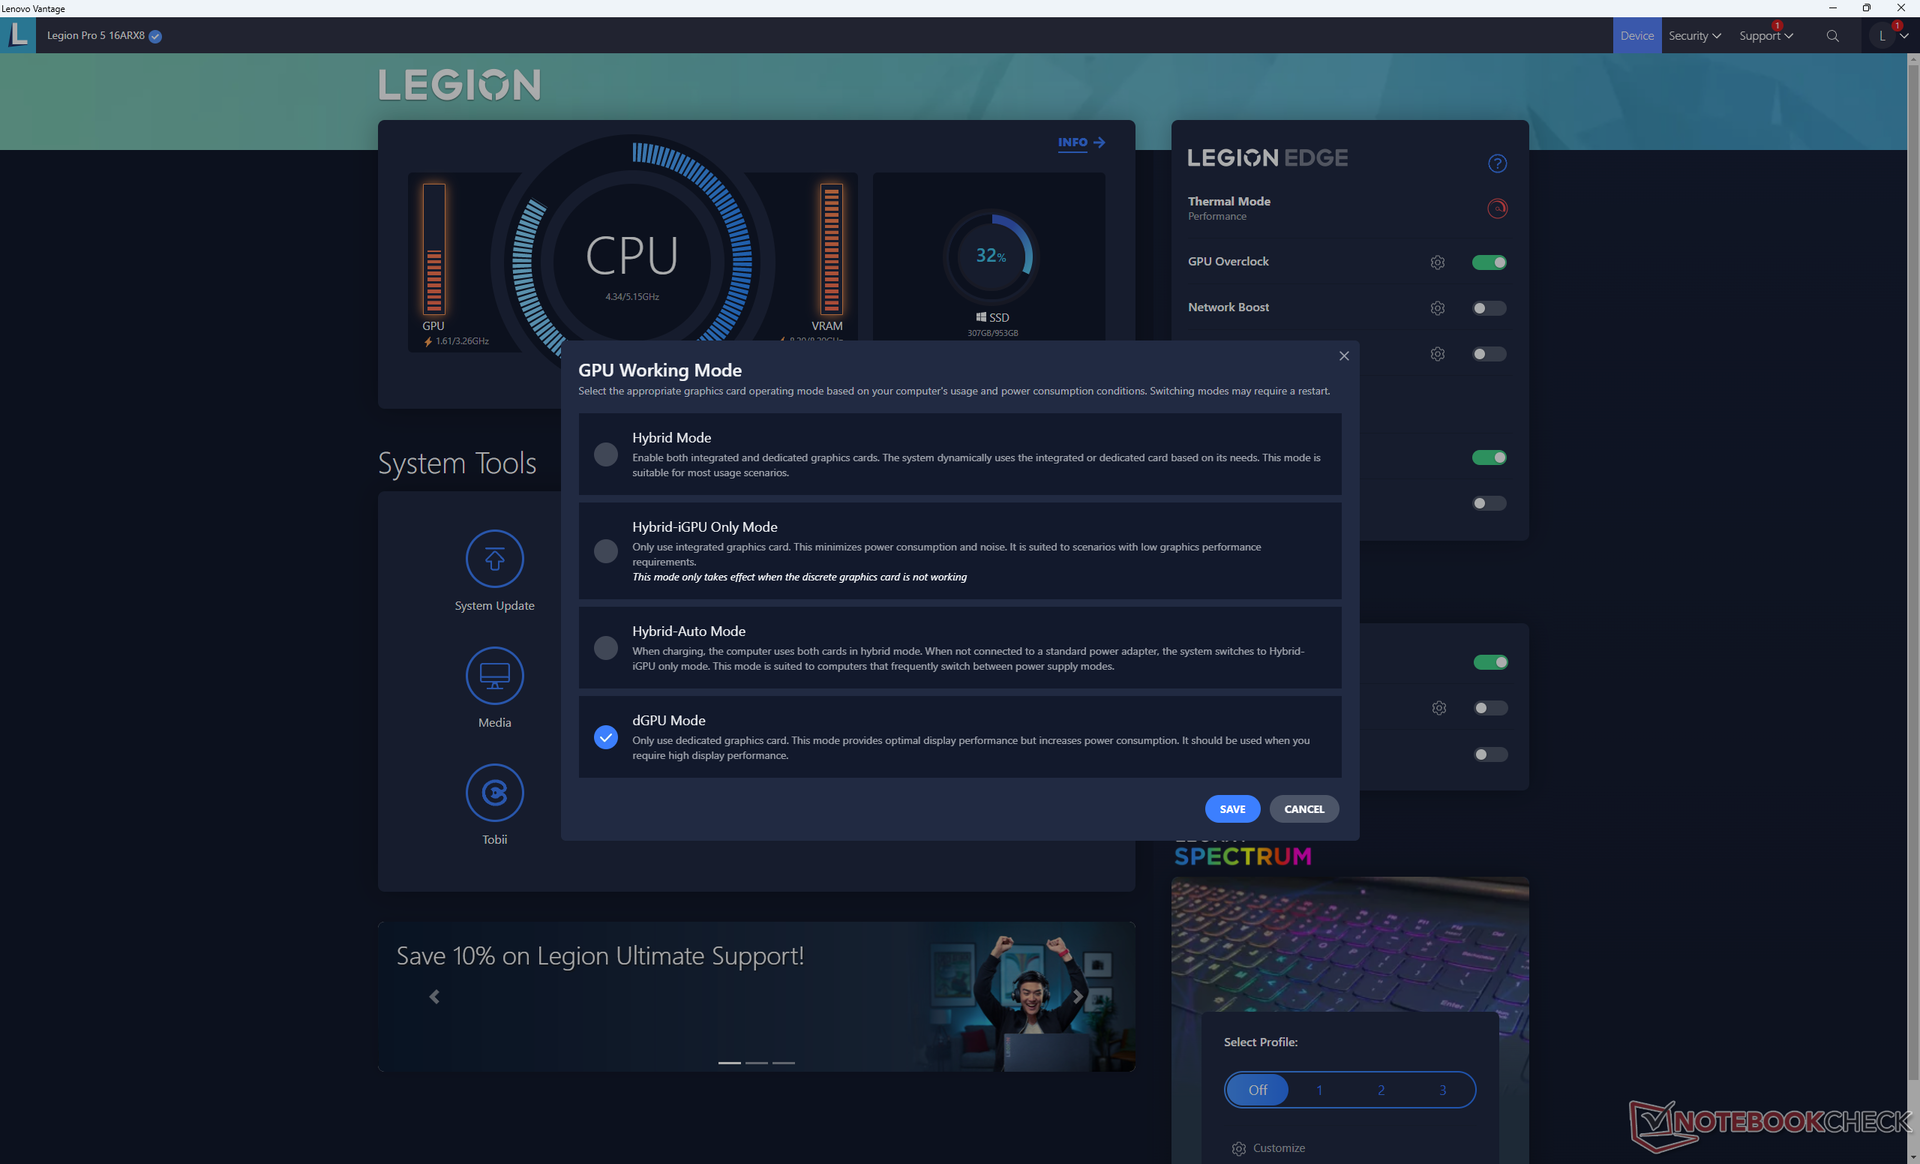
Vi ställde in vår enhet till prestandaläge via både Windows och Lenovo Vantage-programvaran innan vi körde alla benchmarks nedan. Vi såg också till att ställa in grafiken i dGPU-läge med den förinställda GPU-överklockningsfunktionen aktiv. Det rekommenderas att du bekantar dig med Vantage eftersom det är det huvudsakliga gränssnittet för att styra funktioner för tangentbordsbelysning, Lenovo-specifika uppdateringar, GPU-beteende med mera.
MUX stöds för att växla mellan Optimus (iGPU + dGPU) eller endast dGPU. G-Sync stöds på den interna skärmen endast i dGPU-läge. Det krävs en omstart när du växlar mellan Optimus- och dGPU-lägena eftersom Advanced Optimus inte stöds. Irriterande nog skulle omstartsprocessen vid byte mellan grafiklägen vara mycket längre än en vanlig omstart.
Processor
Efter att ha upplevt den otroliga Zen 4Ryzen 9 7945HX och sedan svikits av den undermåliga Zen 3Ryzen 7 7735HSvar vi inte säkra på vad vi kunde förvänta oss av Zen 4Ryzen 7 7745HX. Tack och lov är resultaten utmärkta för en CPU i mellanklassen med resultat för prestanda för en och flera trådar som är 15 procent respektive 30 procent högre än Ryzen 7 7735HS. Ryzen 7 7745HX är därför inom räckhåll för de konkurrerande Core i7-13700HX med endast 5 till 15 procent i de flesta benchmarks, inklusive LibreOffice och HWBOT x265 4K. Det är definitivt en rimlig uppgradering från förra åretsRyzen 7 6800H eller Ryzen 9 6900HX jämfört med Ryzen 7 7735HX.
Lenovo erbjuder ett långsammare Ryzen 5 7645HX-alternativ med färre kärnor än Ryzen 7 7745HX (6 mot 8). Vi har dock ännu inte personligen testat Ryzen 5 7645HX i skrivande stund och därför är prestandaskillnaderna mellan de två alternativen okända för tillfället.
Cinebench R15 Multi Loop
Cinebench R23: Multi Core | Single Core
Cinebench R20: CPU (Multi Core) | CPU (Single Core)
Cinebench R15: CPU Multi 64Bit | CPU Single 64Bit
Blender: v2.79 BMW27 CPU
7-Zip 18.03: 7z b 4 | 7z b 4 -mmt1
Geekbench 5.5: Multi-Core | Single-Core
HWBOT x265 Benchmark v2.2: 4k Preset
LibreOffice : 20 Documents To PDF
R Benchmark 2.5: Overall mean
| CPU Performance rating | |
| Schenker XMG SECTOR, i9 13900K, RTX 4090 | |
| Alienware m18 R1 | |
| Schenker XMG Neo 16 E23 | |
| Genomsnitt AMD Ryzen 7 7745HX | |
| Lenovo Legion Pro 5 16ARX8 | |
| MSI GE67 HX 12UGS | |
| Lenovo Legion Pro 5 16IRX8 | |
| MSI Pulse GL76 12UGK | |
| Asus TUF Gaming A16 FA617 | |
| Schenker XMG Core 15 (M22) | |
| Asus ROG Strix G15 G513RW | |
| MSI Alpha 15 B5EEK-008 | |
| Cinebench R23 / Multi Core | |
| Schenker XMG SECTOR, i9 13900K, RTX 4090 | |
| Alienware m18 R1 | |
| Schenker XMG Neo 16 E23 | |
| MSI GE67 HX 12UGS | |
| Lenovo Legion Pro 5 16IRX8 | |
| Genomsnitt AMD Ryzen 7 7745HX (18060 - 18845, n=2) | |
| Lenovo Legion Pro 5 16ARX8 | |
| MSI Pulse GL76 12UGK | |
| Schenker XMG Core 15 (M22) | |
| Asus TUF Gaming A16 FA617 | |
| Asus ROG Strix G15 G513RW | |
| MSI Alpha 15 B5EEK-008 | |
| Cinebench R23 / Single Core | |
| Schenker XMG SECTOR, i9 13900K, RTX 4090 | |
| Alienware m18 R1 | |
| Schenker XMG Neo 16 E23 | |
| Genomsnitt AMD Ryzen 7 7745HX (1846 - 1854, n=2) | |
| Lenovo Legion Pro 5 16ARX8 | |
| MSI GE67 HX 12UGS | |
| MSI Pulse GL76 12UGK | |
| Lenovo Legion Pro 5 16IRX8 | |
| Asus TUF Gaming A16 FA617 | |
| Schenker XMG Core 15 (M22) | |
| Asus ROG Strix G15 G513RW | |
| MSI Alpha 15 B5EEK-008 | |
| Cinebench R20 / CPU (Multi Core) | |
| Schenker XMG SECTOR, i9 13900K, RTX 4090 | |
| Alienware m18 R1 | |
| Schenker XMG Neo 16 E23 | |
| MSI GE67 HX 12UGS | |
| Genomsnitt AMD Ryzen 7 7745HX (7072 - 7399, n=2) | |
| Lenovo Legion Pro 5 16ARX8 | |
| Lenovo Legion Pro 5 16IRX8 | |
| MSI Pulse GL76 12UGK | |
| Schenker XMG Core 15 (M22) | |
| Asus TUF Gaming A16 FA617 | |
| Asus ROG Strix G15 G513RW | |
| MSI Alpha 15 B5EEK-008 | |
| Cinebench R20 / CPU (Single Core) | |
| Schenker XMG SECTOR, i9 13900K, RTX 4090 | |
| Alienware m18 R1 | |
| Schenker XMG Neo 16 E23 | |
| Genomsnitt AMD Ryzen 7 7745HX (717 - 719, n=2) | |
| Lenovo Legion Pro 5 16ARX8 | |
| MSI GE67 HX 12UGS | |
| MSI Pulse GL76 12UGK | |
| Lenovo Legion Pro 5 16IRX8 | |
| Asus TUF Gaming A16 FA617 | |
| Schenker XMG Core 15 (M22) | |
| Asus ROG Strix G15 G513RW | |
| MSI Alpha 15 B5EEK-008 | |
| Cinebench R15 / CPU Multi 64Bit | |
| Schenker XMG SECTOR, i9 13900K, RTX 4090 | |
| Alienware m18 R1 | |
| Schenker XMG Neo 16 E23 | |
| MSI GE67 HX 12UGS | |
| Lenovo Legion Pro 5 16IRX8 | |
| Genomsnitt AMD Ryzen 7 7745HX (2978 - 2994, n=2) | |
| Lenovo Legion Pro 5 16ARX8 | |
| MSI Pulse GL76 12UGK | |
| Schenker XMG Core 15 (M22) | |
| Asus TUF Gaming A16 FA617 | |
| Asus ROG Strix G15 G513RW | |
| MSI Alpha 15 B5EEK-008 | |
| Cinebench R15 / CPU Single 64Bit | |
| Schenker XMG SECTOR, i9 13900K, RTX 4090 | |
| Alienware m18 R1 | |
| Schenker XMG Neo 16 E23 | |
| Genomsnitt AMD Ryzen 7 7745HX (294 - 295, n=2) | |
| Lenovo Legion Pro 5 16ARX8 | |
| Lenovo Legion Pro 5 16IRX8 | |
| MSI GE67 HX 12UGS | |
| MSI Pulse GL76 12UGK | |
| Schenker XMG Core 15 (M22) | |
| Asus TUF Gaming A16 FA617 | |
| Asus ROG Strix G15 G513RW | |
| MSI Alpha 15 B5EEK-008 | |
| Blender / v2.79 BMW27 CPU | |
| MSI Alpha 15 B5EEK-008 | |
| Asus ROG Strix G15 G513RW | |
| Asus TUF Gaming A16 FA617 | |
| Schenker XMG Core 15 (M22) | |
| MSI Pulse GL76 12UGK | |
| Lenovo Legion Pro 5 16ARX8 | |
| Genomsnitt AMD Ryzen 7 7745HX (169 - 174, n=2) | |
| MSI GE67 HX 12UGS | |
| Lenovo Legion Pro 5 16IRX8 | |
| Schenker XMG Neo 16 E23 | |
| Alienware m18 R1 | |
| Schenker XMG SECTOR, i9 13900K, RTX 4090 | |
| 7-Zip 18.03 / 7z b 4 | |
| Schenker XMG SECTOR, i9 13900K, RTX 4090 | |
| Alienware m18 R1 | |
| Schenker XMG Neo 16 E23 | |
| Genomsnitt AMD Ryzen 7 7745HX (75557 - 83268, n=2) | |
| Lenovo Legion Pro 5 16IRX8 | |
| MSI GE67 HX 12UGS | |
| Lenovo Legion Pro 5 16ARX8 | |
| MSI Pulse GL76 12UGK | |
| Schenker XMG Core 15 (M22) | |
| Asus TUF Gaming A16 FA617 | |
| Asus ROG Strix G15 G513RW | |
| MSI Alpha 15 B5EEK-008 | |
| 7-Zip 18.03 / 7z b 4 -mmt1 | |
| Genomsnitt AMD Ryzen 7 7745HX (7244 - 7275, n=2) | |
| Lenovo Legion Pro 5 16ARX8 | |
| Schenker XMG SECTOR, i9 13900K, RTX 4090 | |
| Schenker XMG Neo 16 E23 | |
| Alienware m18 R1 | |
| Asus ROG Strix G15 G513RW | |
| Schenker XMG Core 15 (M22) | |
| Asus TUF Gaming A16 FA617 | |
| Lenovo Legion Pro 5 16IRX8 | |
| MSI Pulse GL76 12UGK | |
| MSI GE67 HX 12UGS | |
| MSI Alpha 15 B5EEK-008 | |
| Geekbench 5.5 / Multi-Core | |
| Schenker XMG SECTOR, i9 13900K, RTX 4090 | |
| Alienware m18 R1 | |
| Schenker XMG Neo 16 E23 | |
| MSI GE67 HX 12UGS | |
| Lenovo Legion Pro 5 16IRX8 | |
| Genomsnitt AMD Ryzen 7 7745HX (12378 - 13462, n=2) | |
| Lenovo Legion Pro 5 16ARX8 | |
| MSI Pulse GL76 12UGK | |
| Schenker XMG Core 15 (M22) | |
| Asus TUF Gaming A16 FA617 | |
| Asus ROG Strix G15 G513RW | |
| MSI Alpha 15 B5EEK-008 | |
| Geekbench 5.5 / Single-Core | |
| Schenker XMG SECTOR, i9 13900K, RTX 4090 | |
| Alienware m18 R1 | |
| Genomsnitt AMD Ryzen 7 7745HX (2040 - 2067, n=2) | |
| Schenker XMG Neo 16 E23 | |
| Lenovo Legion Pro 5 16ARX8 | |
| Lenovo Legion Pro 5 16IRX8 | |
| MSI GE67 HX 12UGS | |
| MSI Pulse GL76 12UGK | |
| Asus ROG Strix G15 G513RW | |
| Asus TUF Gaming A16 FA617 | |
| Schenker XMG Core 15 (M22) | |
| MSI Alpha 15 B5EEK-008 | |
| HWBOT x265 Benchmark v2.2 / 4k Preset | |
| Schenker XMG SECTOR, i9 13900K, RTX 4090 | |
| Alienware m18 R1 | |
| Schenker XMG Neo 16 E23 | |
| MSI GE67 HX 12UGS | |
| Lenovo Legion Pro 5 16IRX8 | |
| Genomsnitt AMD Ryzen 7 7745HX (23.2 - 24.1, n=2) | |
| Lenovo Legion Pro 5 16ARX8 | |
| MSI Pulse GL76 12UGK | |
| Schenker XMG Core 15 (M22) | |
| Asus TUF Gaming A16 FA617 | |
| Asus ROG Strix G15 G513RW | |
| MSI Alpha 15 B5EEK-008 | |
| LibreOffice / 20 Documents To PDF | |
| Schenker XMG Core 15 (M22) | |
| Asus ROG Strix G15 G513RW | |
| Asus TUF Gaming A16 FA617 | |
| MSI Alpha 15 B5EEK-008 | |
| Alienware m18 R1 | |
| MSI Pulse GL76 12UGK | |
| MSI GE67 HX 12UGS | |
| Genomsnitt AMD Ryzen 7 7745HX (37.9 - 41.4, n=2) | |
| Lenovo Legion Pro 5 16ARX8 | |
| Schenker XMG Neo 16 E23 | |
| Schenker XMG SECTOR, i9 13900K, RTX 4090 | |
| Lenovo Legion Pro 5 16IRX8 | |
| R Benchmark 2.5 / Overall mean | |
| MSI Alpha 15 B5EEK-008 | |
| Asus TUF Gaming A16 FA617 | |
| Asus ROG Strix G15 G513RW | |
| Schenker XMG Core 15 (M22) | |
| Lenovo Legion Pro 5 16IRX8 | |
| MSI Pulse GL76 12UGK | |
| MSI GE67 HX 12UGS | |
| Lenovo Legion Pro 5 16ARX8 | |
| Genomsnitt AMD Ryzen 7 7745HX (0.4141 - 0.421, n=2) | |
| Alienware m18 R1 | |
| Schenker XMG Neo 16 E23 | |
| Schenker XMG SECTOR, i9 13900K, RTX 4090 | |
* ... mindre är bättre
AIDA64: FP32 Ray-Trace | FPU Julia | CPU SHA3 | CPU Queen | FPU SinJulia | FPU Mandel | CPU AES | CPU ZLib | FP64 Ray-Trace | CPU PhotoWorxx
| Performance rating | |
| Asus ROG Strix G16 G614JZ | |
| Schenker XMG Neo 16 E23 | |
| Genomsnitt AMD Ryzen 7 7745HX | |
| Lenovo Legion Pro 5 16ARX8 | |
| Uniwill GM6PX7X RTX 4070 | |
| Lenovo Legion Pro 5 16IRX8 | |
| AIDA64 / FP32 Ray-Trace | |
| Lenovo Legion Pro 5 16ARX8 | |
| Genomsnitt AMD Ryzen 7 7745HX (29066 - 29656, n=2) | |
| Asus ROG Strix G16 G614JZ | |
| Schenker XMG Neo 16 E23 | |
| Uniwill GM6PX7X RTX 4070 | |
| Lenovo Legion Pro 5 16IRX8 | |
| AIDA64 / FPU Julia | |
| Asus ROG Strix G16 G614JZ | |
| Genomsnitt AMD Ryzen 7 7745HX (120974 - 123689, n=2) | |
| Lenovo Legion Pro 5 16ARX8 | |
| Schenker XMG Neo 16 E23 | |
| Uniwill GM6PX7X RTX 4070 | |
| Lenovo Legion Pro 5 16IRX8 | |
| AIDA64 / CPU SHA3 | |
| Asus ROG Strix G16 G614JZ | |
| Schenker XMG Neo 16 E23 | |
| Genomsnitt AMD Ryzen 7 7745HX (4974 - 5204, n=2) | |
| Lenovo Legion Pro 5 16ARX8 | |
| Uniwill GM6PX7X RTX 4070 | |
| Lenovo Legion Pro 5 16IRX8 | |
| AIDA64 / CPU Queen | |
| Asus ROG Strix G16 G614JZ | |
| Schenker XMG Neo 16 E23 | |
| Genomsnitt AMD Ryzen 7 7745HX (126954 - 128143, n=2) | |
| Lenovo Legion Pro 5 16ARX8 | |
| Lenovo Legion Pro 5 16IRX8 | |
| Uniwill GM6PX7X RTX 4070 | |
| AIDA64 / FPU SinJulia | |
| Asus ROG Strix G16 G614JZ | |
| Genomsnitt AMD Ryzen 7 7745HX (15887 - 16221, n=2) | |
| Lenovo Legion Pro 5 16ARX8 | |
| Schenker XMG Neo 16 E23 | |
| Lenovo Legion Pro 5 16IRX8 | |
| Uniwill GM6PX7X RTX 4070 | |
| AIDA64 / FPU Mandel | |
| Asus ROG Strix G16 G614JZ | |
| Genomsnitt AMD Ryzen 7 7745HX (64255 - 64969, n=2) | |
| Lenovo Legion Pro 5 16ARX8 | |
| Schenker XMG Neo 16 E23 | |
| Uniwill GM6PX7X RTX 4070 | |
| Lenovo Legion Pro 5 16IRX8 | |
| AIDA64 / CPU AES | |
| Schenker XMG Neo 16 E23 | |
| Uniwill GM6PX7X RTX 4070 | |
| Asus ROG Strix G16 G614JZ | |
| Lenovo Legion Pro 5 16IRX8 | |
| Genomsnitt AMD Ryzen 7 7745HX (71191 - 95481, n=2) | |
| Lenovo Legion Pro 5 16ARX8 | |
| AIDA64 / CPU ZLib | |
| Asus ROG Strix G16 G614JZ | |
| Schenker XMG Neo 16 E23 | |
| Uniwill GM6PX7X RTX 4070 | |
| Lenovo Legion Pro 5 16IRX8 | |
| Genomsnitt AMD Ryzen 7 7745HX (1147 - 1176, n=2) | |
| Lenovo Legion Pro 5 16ARX8 | |
| AIDA64 / FP64 Ray-Trace | |
| Genomsnitt AMD Ryzen 7 7745HX (15975 - 16358, n=2) | |
| Lenovo Legion Pro 5 16ARX8 | |
| Asus ROG Strix G16 G614JZ | |
| Schenker XMG Neo 16 E23 | |
| Lenovo Legion Pro 5 16IRX8 | |
| Uniwill GM6PX7X RTX 4070 | |
| AIDA64 / CPU PhotoWorxx | |
| Schenker XMG Neo 16 E23 | |
| Uniwill GM6PX7X RTX 4070 | |
| Asus ROG Strix G16 G614JZ | |
| Lenovo Legion Pro 5 16IRX8 | |
| Genomsnitt AMD Ryzen 7 7745HX (28499 - 33304, n=2) | |
| Lenovo Legion Pro 5 16ARX8 | |
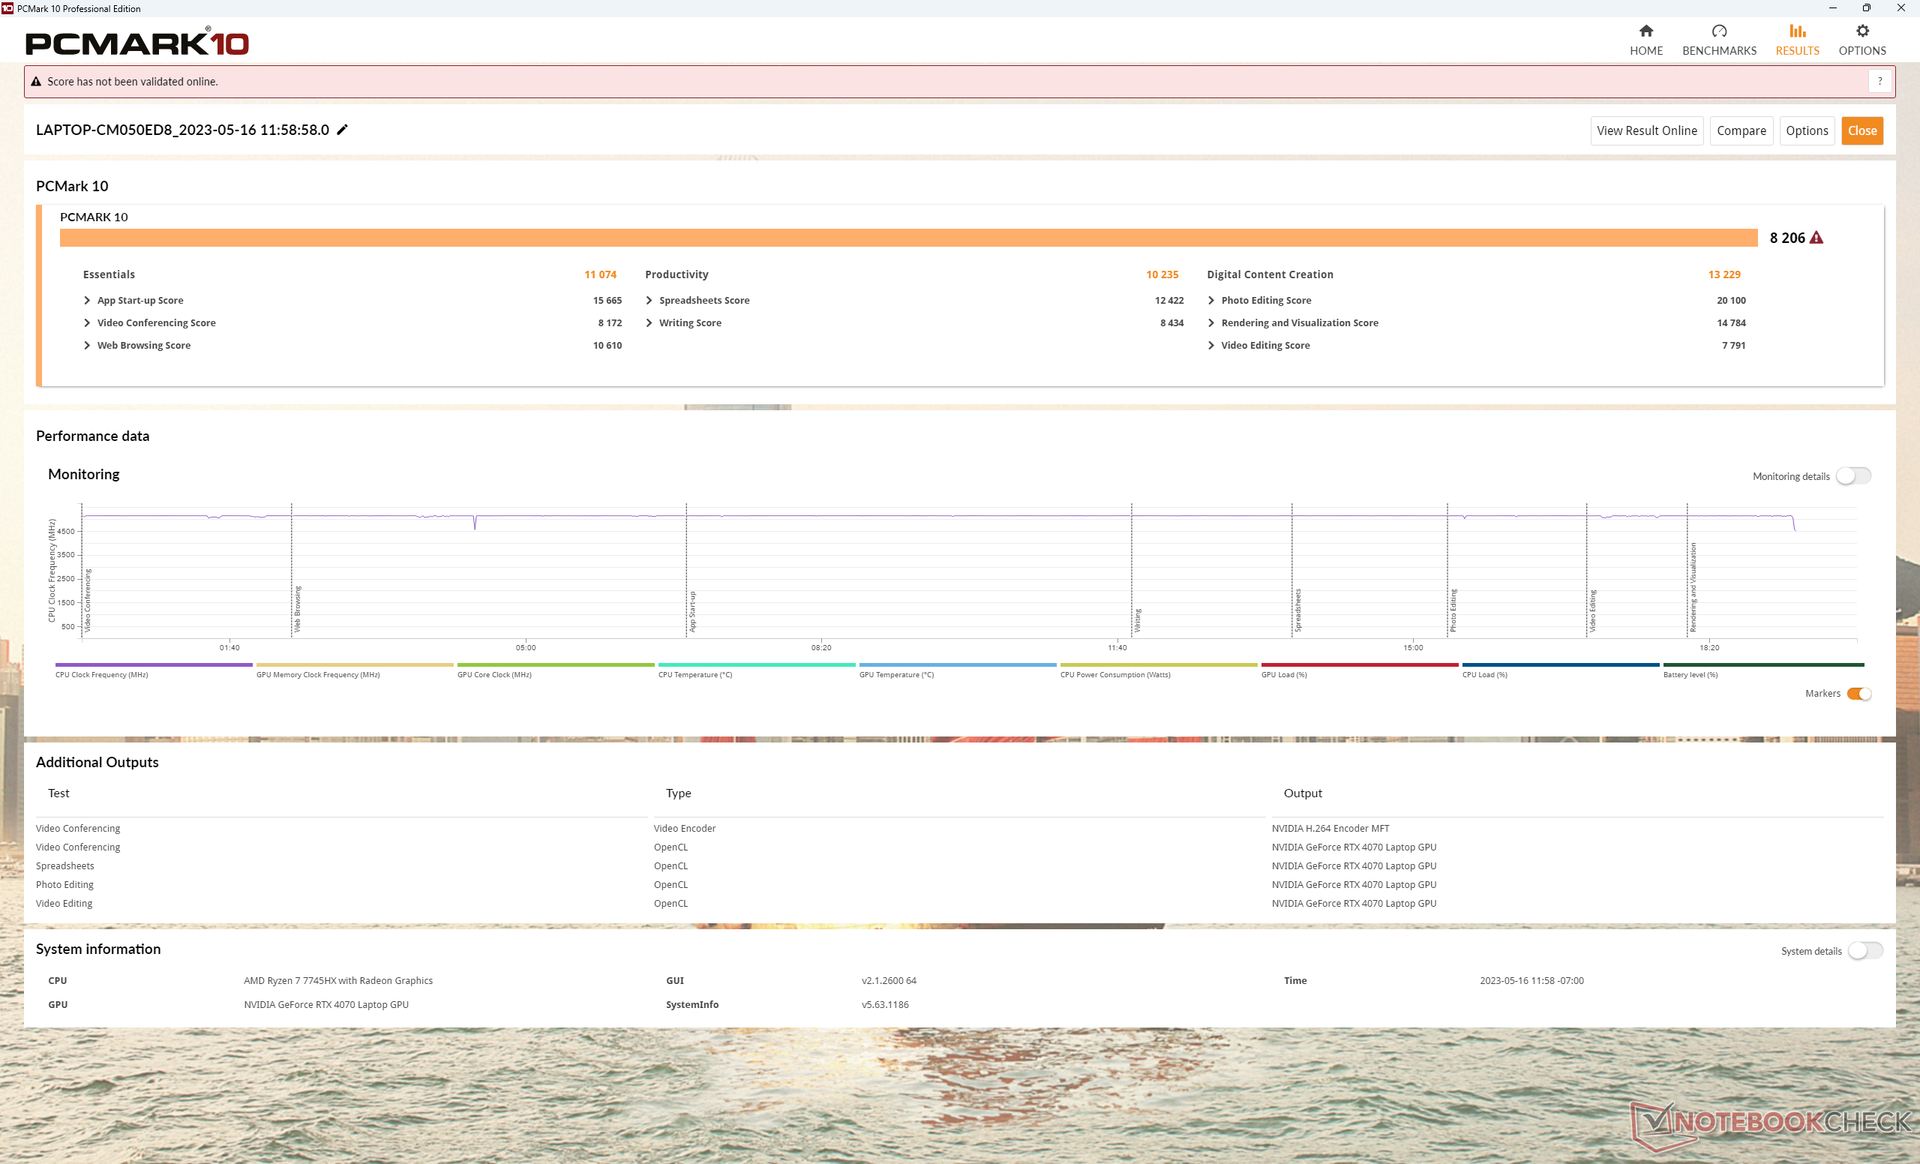
Systemets prestanda
CrossMark: Overall | Productivity | Creativity | Responsiveness
| PCMark 10 / Score | |
| Asus Zephyrus Duo 16 GX650PY-NM006W | |
| Uniwill GM6PX7X RTX 4070 | |
| Schenker XMG Neo 16 E23 | |
| Lenovo Legion Pro 5 16ARX8 | |
| Lenovo Legion Pro 5 16IRX8 | |
| Asus ROG Strix G16 G614JZ | |
| PCMark 10 / Essentials | |
| Asus Zephyrus Duo 16 GX650PY-NM006W | |
| Asus ROG Strix G16 G614JZ | |
| Uniwill GM6PX7X RTX 4070 | |
| Lenovo Legion Pro 5 16ARX8 | |
| Schenker XMG Neo 16 E23 | |
| Lenovo Legion Pro 5 16IRX8 | |
| PCMark 10 / Productivity | |
| Asus Zephyrus Duo 16 GX650PY-NM006W | |
| Uniwill GM6PX7X RTX 4070 | |
| Lenovo Legion Pro 5 16ARX8 | |
| Schenker XMG Neo 16 E23 | |
| Lenovo Legion Pro 5 16IRX8 | |
| Asus ROG Strix G16 G614JZ | |
| PCMark 10 / Digital Content Creation | |
| Schenker XMG Neo 16 E23 | |
| Asus Zephyrus Duo 16 GX650PY-NM006W | |
| Uniwill GM6PX7X RTX 4070 | |
| Lenovo Legion Pro 5 16ARX8 | |
| Lenovo Legion Pro 5 16IRX8 | |
| Asus ROG Strix G16 G614JZ | |
| CrossMark / Overall | |
| Asus ROG Strix G16 G614JZ | |
| Schenker XMG Neo 16 E23 | |
| Asus Zephyrus Duo 16 GX650PY-NM006W | |
| Lenovo Legion Pro 5 16ARX8 | |
| Uniwill GM6PX7X RTX 4070 | |
| Lenovo Legion Pro 5 16IRX8 | |
| CrossMark / Productivity | |
| Asus ROG Strix G16 G614JZ | |
| Schenker XMG Neo 16 E23 | |
| Asus Zephyrus Duo 16 GX650PY-NM006W | |
| Lenovo Legion Pro 5 16ARX8 | |
| Uniwill GM6PX7X RTX 4070 | |
| Lenovo Legion Pro 5 16IRX8 | |
| CrossMark / Creativity | |
| Schenker XMG Neo 16 E23 | |
| Asus ROG Strix G16 G614JZ | |
| Asus Zephyrus Duo 16 GX650PY-NM006W | |
| Lenovo Legion Pro 5 16ARX8 | |
| Uniwill GM6PX7X RTX 4070 | |
| Lenovo Legion Pro 5 16IRX8 | |
| CrossMark / Responsiveness | |
| Asus ROG Strix G16 G614JZ | |
| Lenovo Legion Pro 5 16ARX8 | |
| Uniwill GM6PX7X RTX 4070 | |
| Schenker XMG Neo 16 E23 | |
| Asus Zephyrus Duo 16 GX650PY-NM006W | |
| Lenovo Legion Pro 5 16IRX8 | |
| PCMark 10 Score | 8206 poäng | |
Hjälp | ||
| AIDA64 / Memory Copy | |
| Schenker XMG Neo 16 E23 | |
| Uniwill GM6PX7X RTX 4070 | |
| Asus ROG Strix G16 G614JZ | |
| Lenovo Legion Pro 5 16IRX8 | |
| Genomsnitt AMD Ryzen 7 7745HX (50007 - 53867, n=2) | |
| Lenovo Legion Pro 5 16ARX8 | |
| AIDA64 / Memory Read | |
| Schenker XMG Neo 16 E23 | |
| Asus ROG Strix G16 G614JZ | |
| Uniwill GM6PX7X RTX 4070 | |
| Lenovo Legion Pro 5 16IRX8 | |
| Genomsnitt AMD Ryzen 7 7745HX (50703 - 54278, n=2) | |
| Lenovo Legion Pro 5 16ARX8 | |
| AIDA64 / Memory Write | |
| Schenker XMG Neo 16 E23 | |
| Lenovo Legion Pro 5 16IRX8 | |
| Uniwill GM6PX7X RTX 4070 | |
| Genomsnitt AMD Ryzen 7 7745HX (54587 - 70803, n=2) | |
| Asus ROG Strix G16 G614JZ | |
| Lenovo Legion Pro 5 16ARX8 | |
| AIDA64 / Memory Latency | |
| Asus ROG Strix G16 G614JZ | |
| Uniwill GM6PX7X RTX 4070 | |
| Lenovo Legion Pro 5 16ARX8 | |
| Schenker XMG Neo 16 E23 | |
| Genomsnitt AMD Ryzen 7 7745HX (80.7 - 86.5, n=2) | |
| Lenovo Legion Pro 5 16IRX8 | |
* ... mindre är bättre
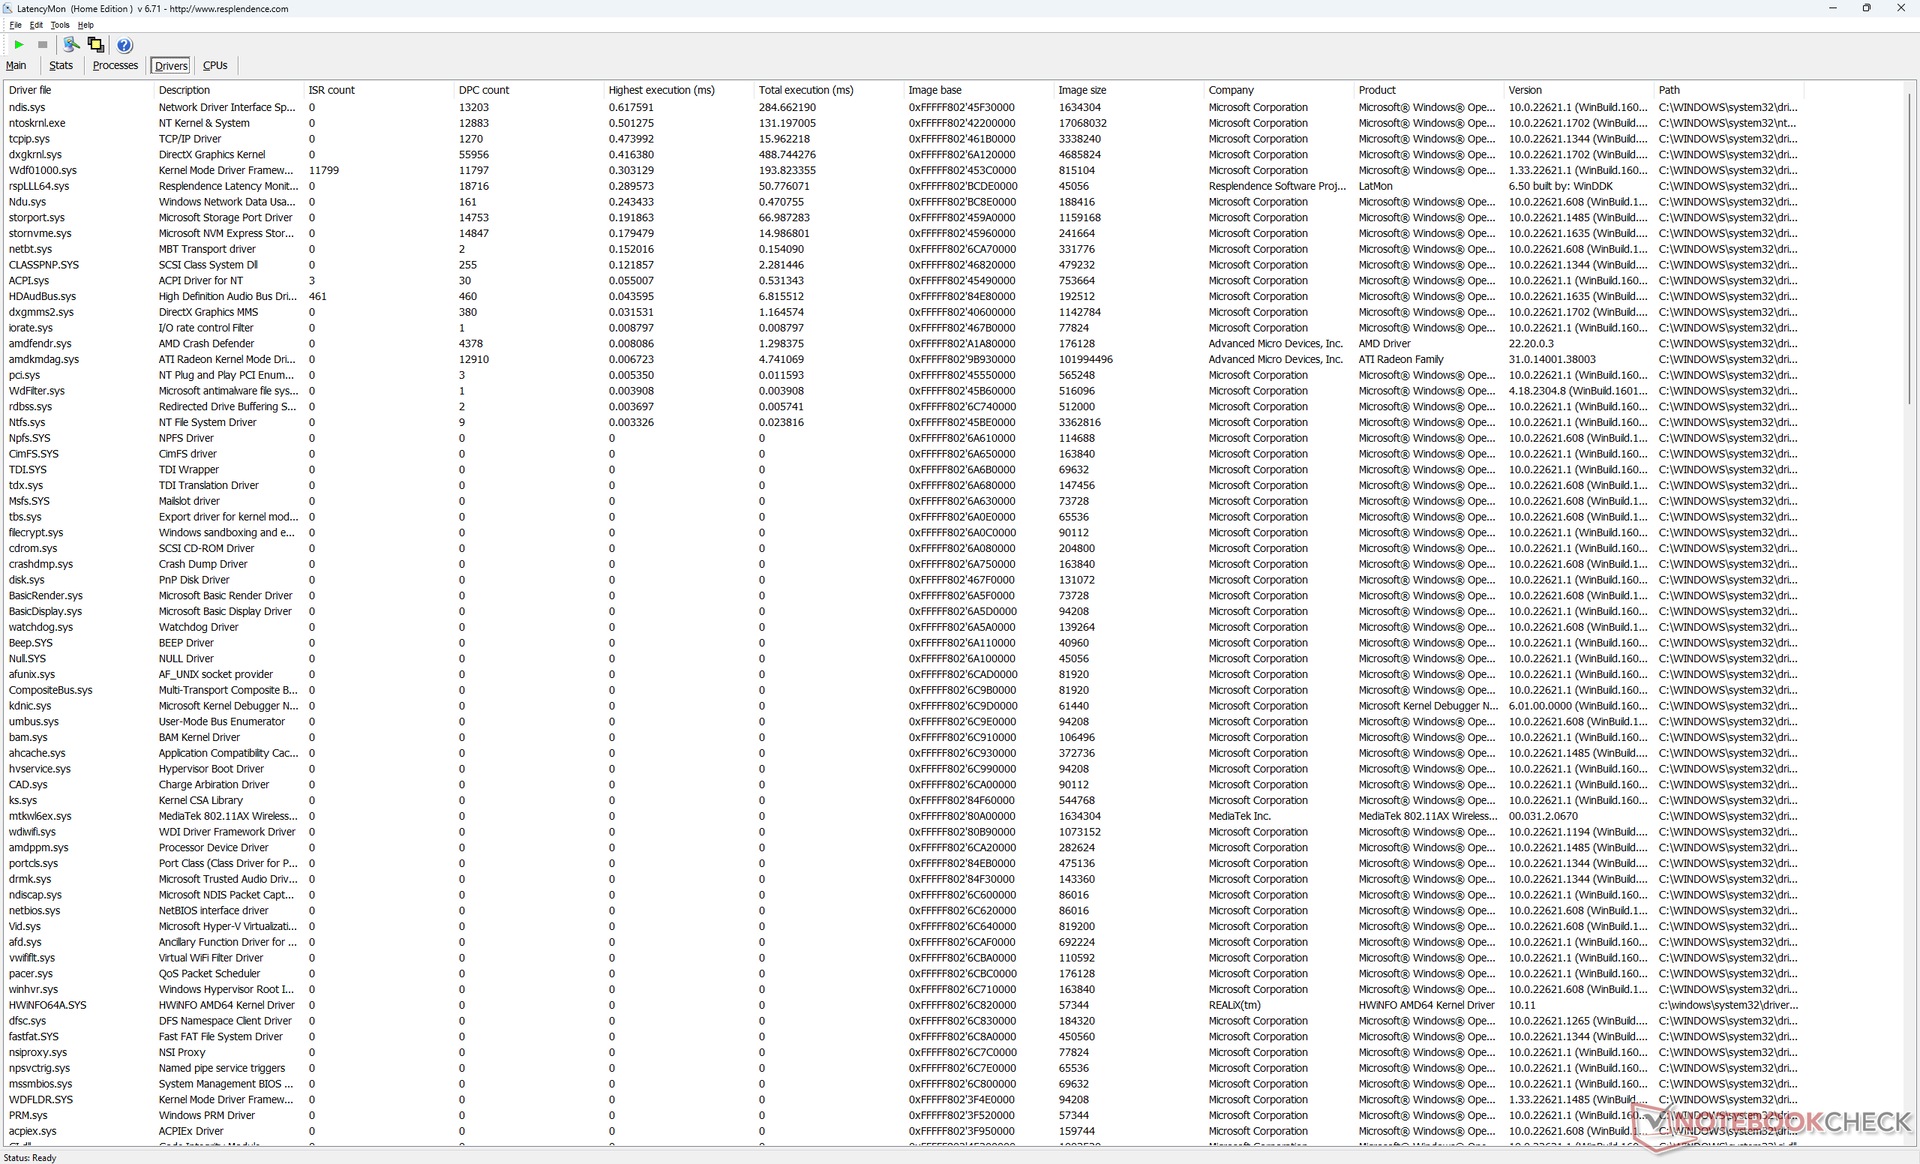
DPC-latenstid
LatencyMon visar inga större DPC-problem när vi öppnar flera webbläsarflikar på vår hemsida eller när vi kör Prime95 stress. uppspelning av 4K-video vid 60 FPS är utmärkt .med bara en tappad bild under vår testvideo.
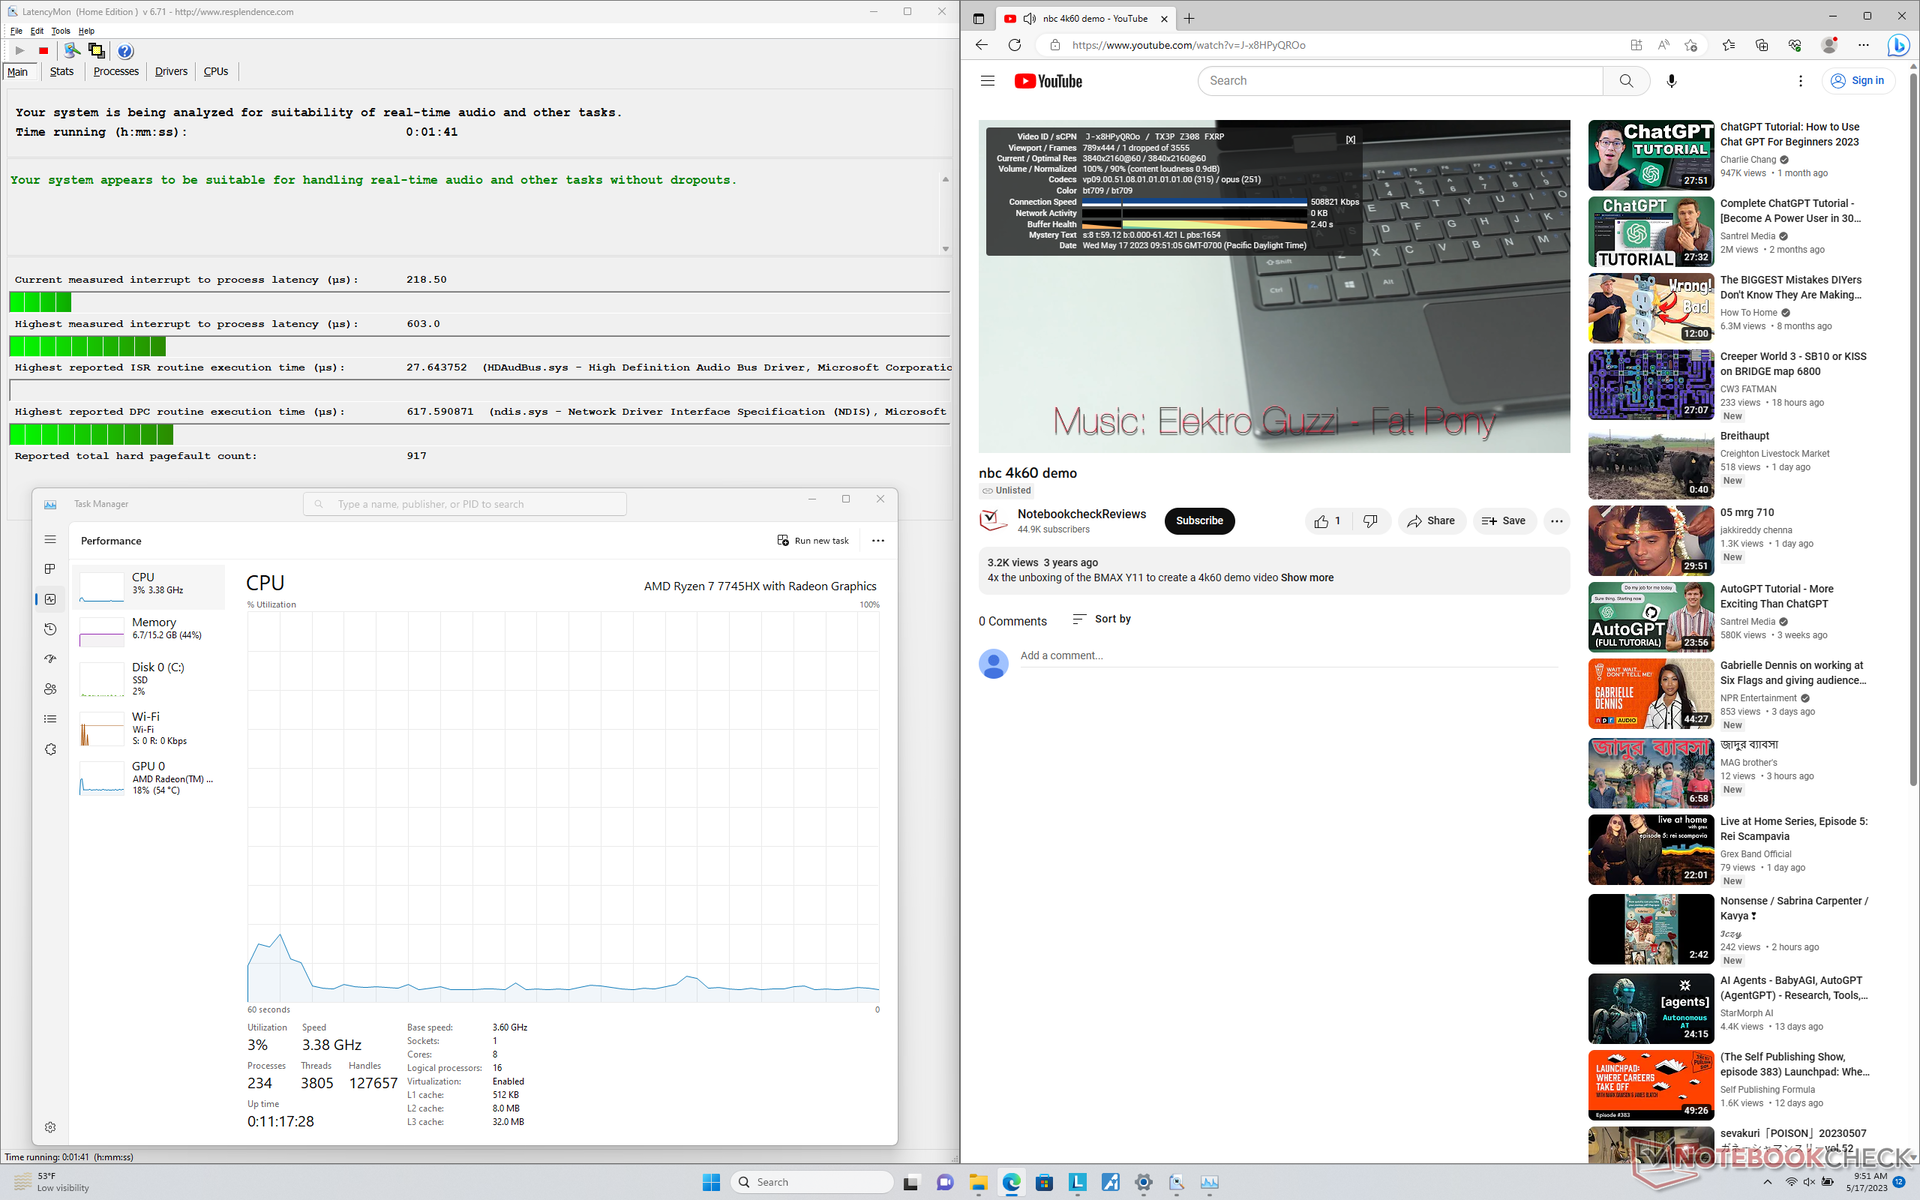
| DPC Latencies / LatencyMon - interrupt to process latency (max), Web, Youtube, Prime95 | |
| Asus Zephyrus Duo 16 GX650PY-NM006W | |
| Schenker XMG Neo 16 E23 | |
| Asus ROG Strix G16 G614JZ | |
| Uniwill GM6PX7X RTX 4070 | |
| Lenovo Legion Pro 5 16IRX8 | |
| Lenovo Legion Pro 5 16ARX8 | |
* ... mindre är bättre
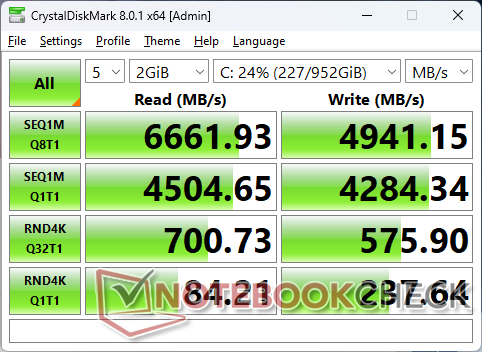
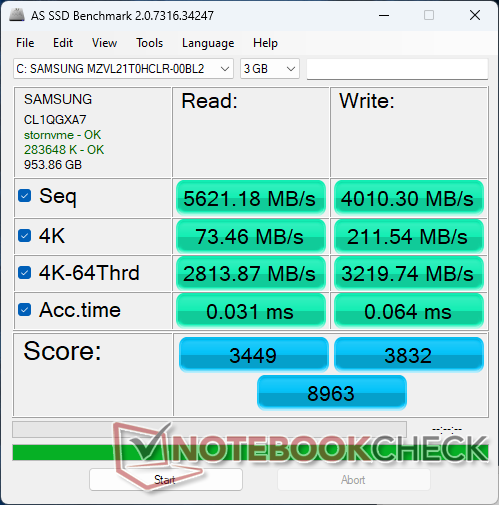
Lagringsenheter - upp till två PCIe4 x4-enheter
Vår enhet levereras med en 1 TB Samsung PM9A1 NVMe SSD som är en av de snabbaste PCIe4 x4 SSD:erna som finns tillgängliga. Överföringshastigheterna toppar vid cirka 6600 MB/s, men prestandan skulle strypas till så lågt som 3300 MB/s efter bara några minuter i vårt stresstest, vilket framgår av grafen nedan. Resultaten tyder på att SSD-enheten i Lenovo inte kyls ordentligt, eftersom samma SSD-enhet i andra bärbara datorer som t.ex Uniwill GM6PX7X kan hålla högre överföringshastigheter under mycket längre perioder.

| Drive Performance rating - Percent | |
| Lenovo Legion Pro 5 16ARX8 | |
| Lenovo Legion Pro 5 16IRX8 | |
| Uniwill GM6PX7X RTX 4070 | |
| Asus Zephyrus Duo 16 GX650PY-NM006W | |
| Asus ROG Strix G16 G614JZ | |
| Schenker XMG Neo 16 E23 | |
* ... mindre är bättre
Disk Throttling: DiskSpd Read Loop, Queue Depth 8
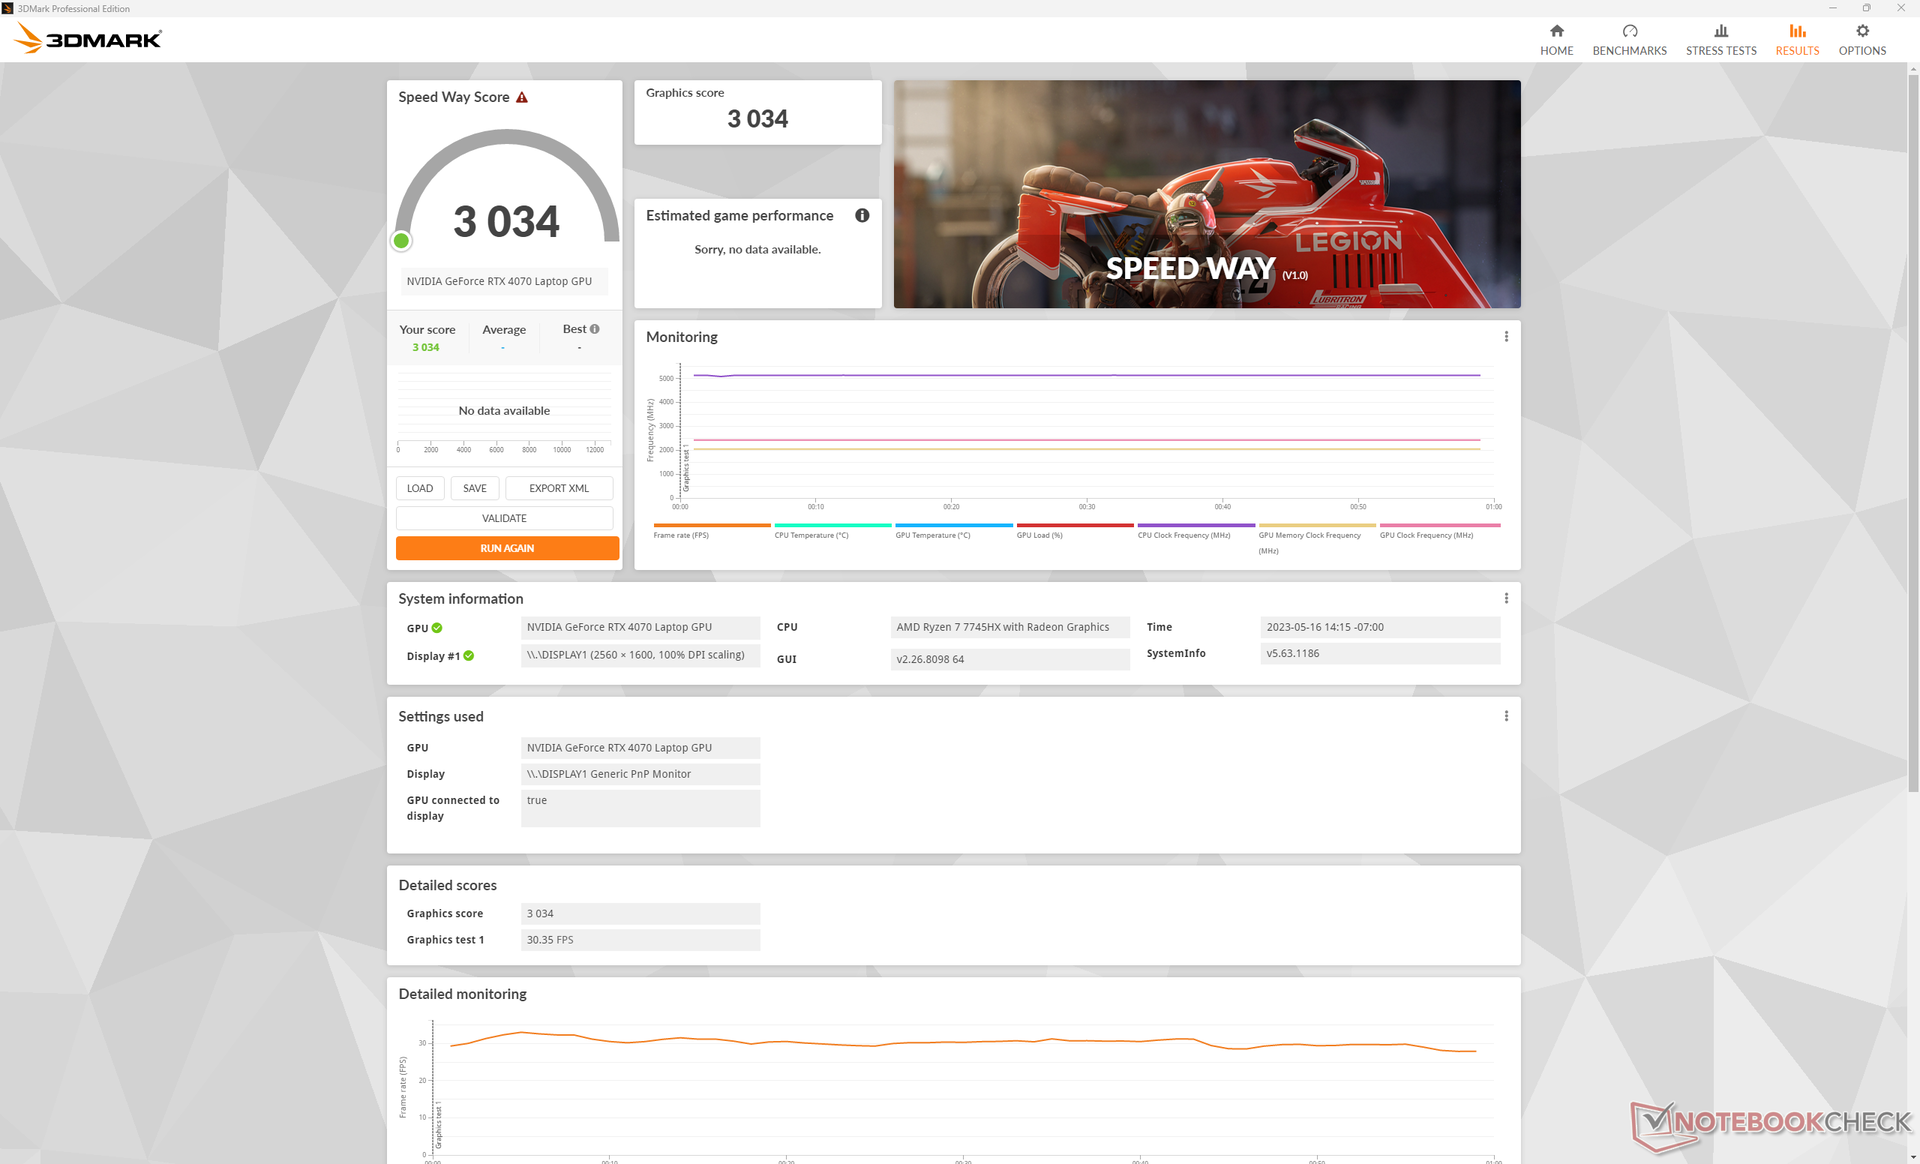
GPU-prestanda - Ett grafikkort i övre mellanklassen
Den råa grafikprestandan är jämförbar med fjolårets mobila eForce RTX 3070 Ti. Målet på 140 W TGP gör att det mobila RTX 4070 i Lenovo kan prestera marginellt bättre än de flesta andra bärbara datorer med samma grafikprocessor.
Nedgradering till mobila RTX 4060 eller mobila RTX 4050 SKU:er förväntas minska prestandan med 15 procent respektive 20 procent. Det finns tyvärr ingen mobilt RTX 4080 vilket skulle ha ökat prestandan avsevärt med 40-50 procent jämfört med vårt mobila RTX 4070. Istället är sådana avancerade GPU-alternativ reserverade för Lenovos toppmodell Legion 7-serien.
Att köra dGPU på den balanserade strömprofilen utan överklockning skulle minska grafikprestandan med cirka 13 procent enligt 3DMark Time Spy.
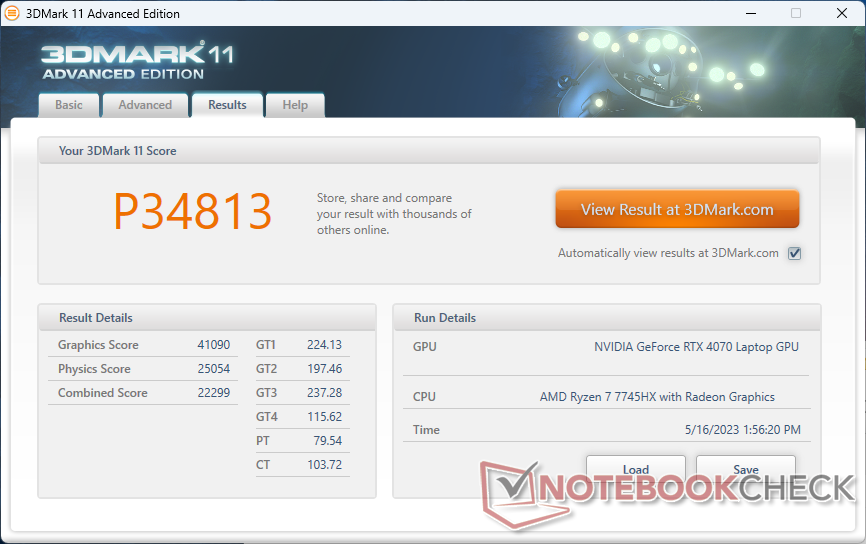
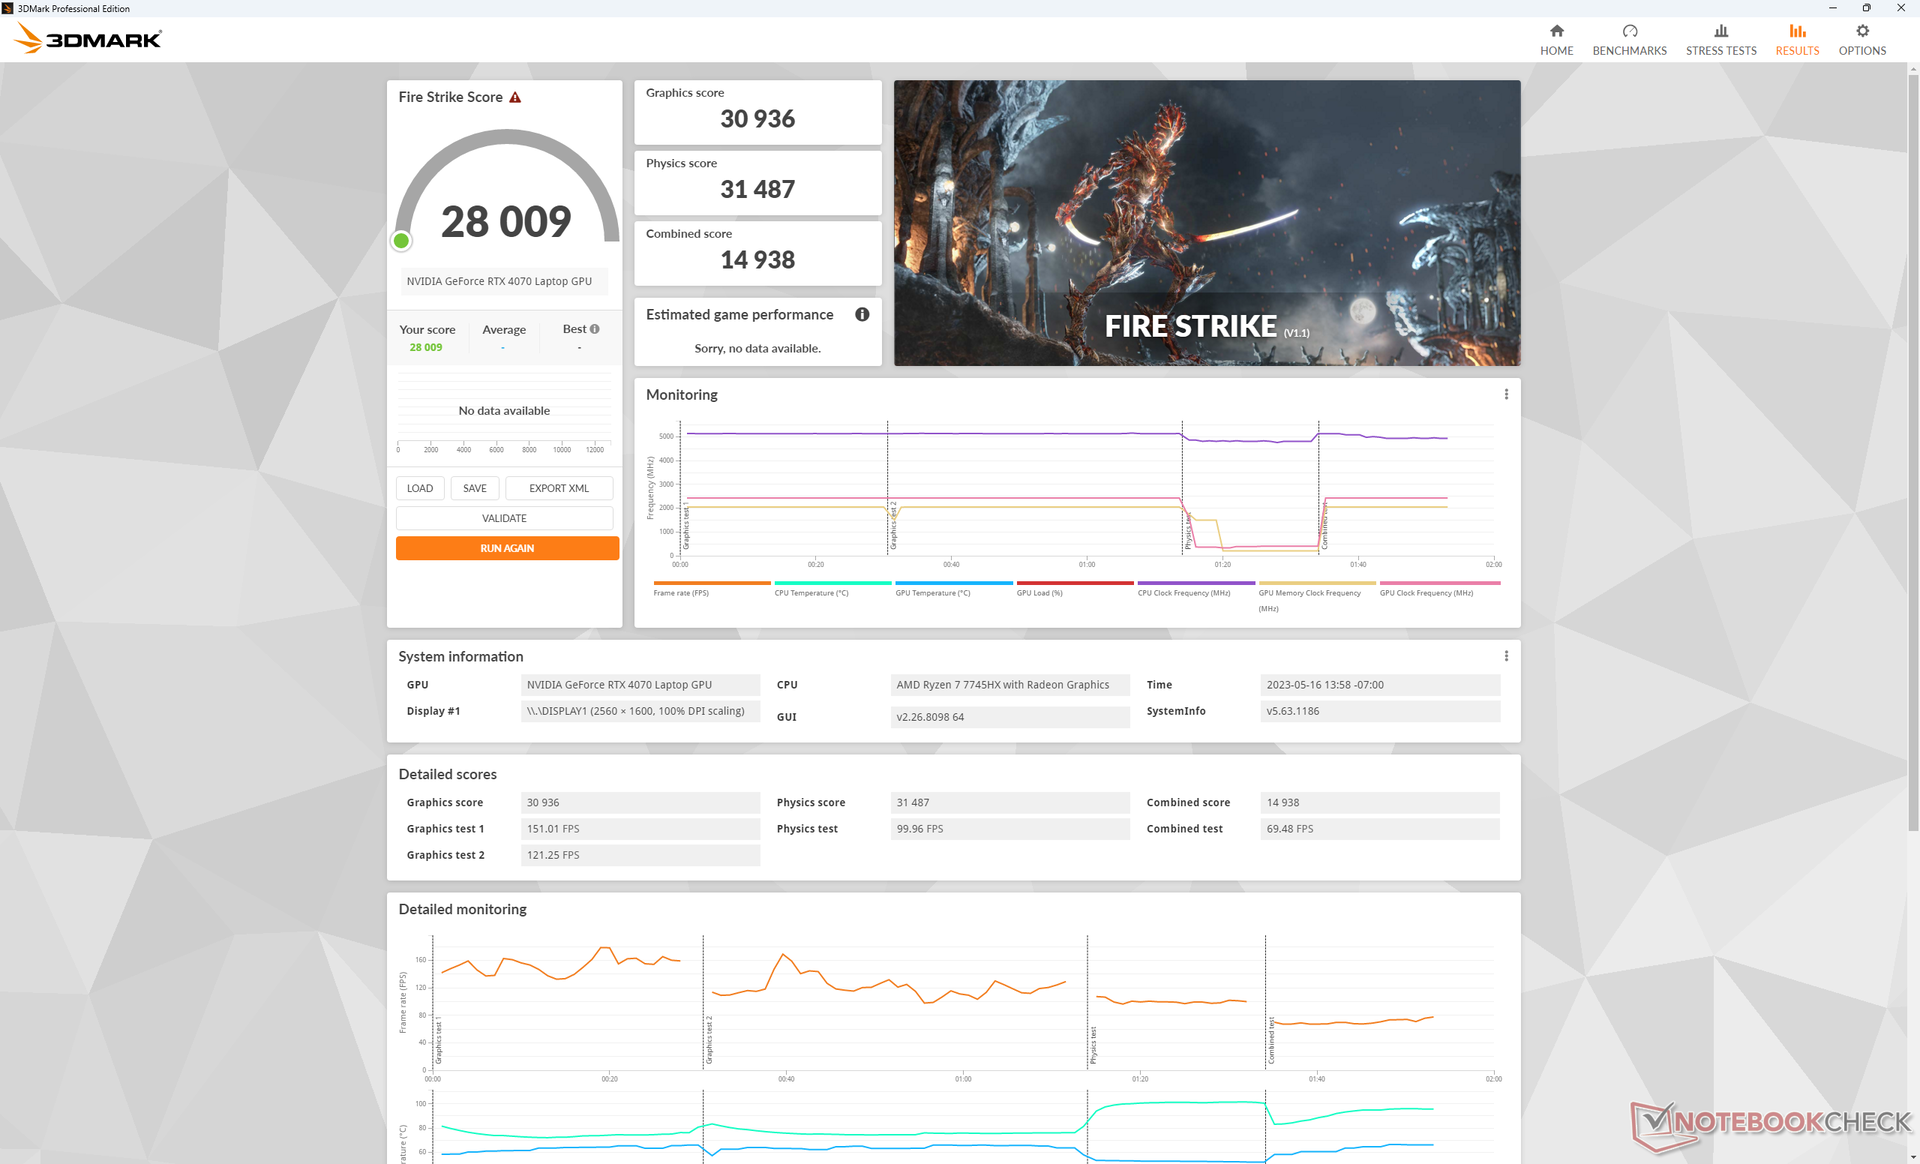
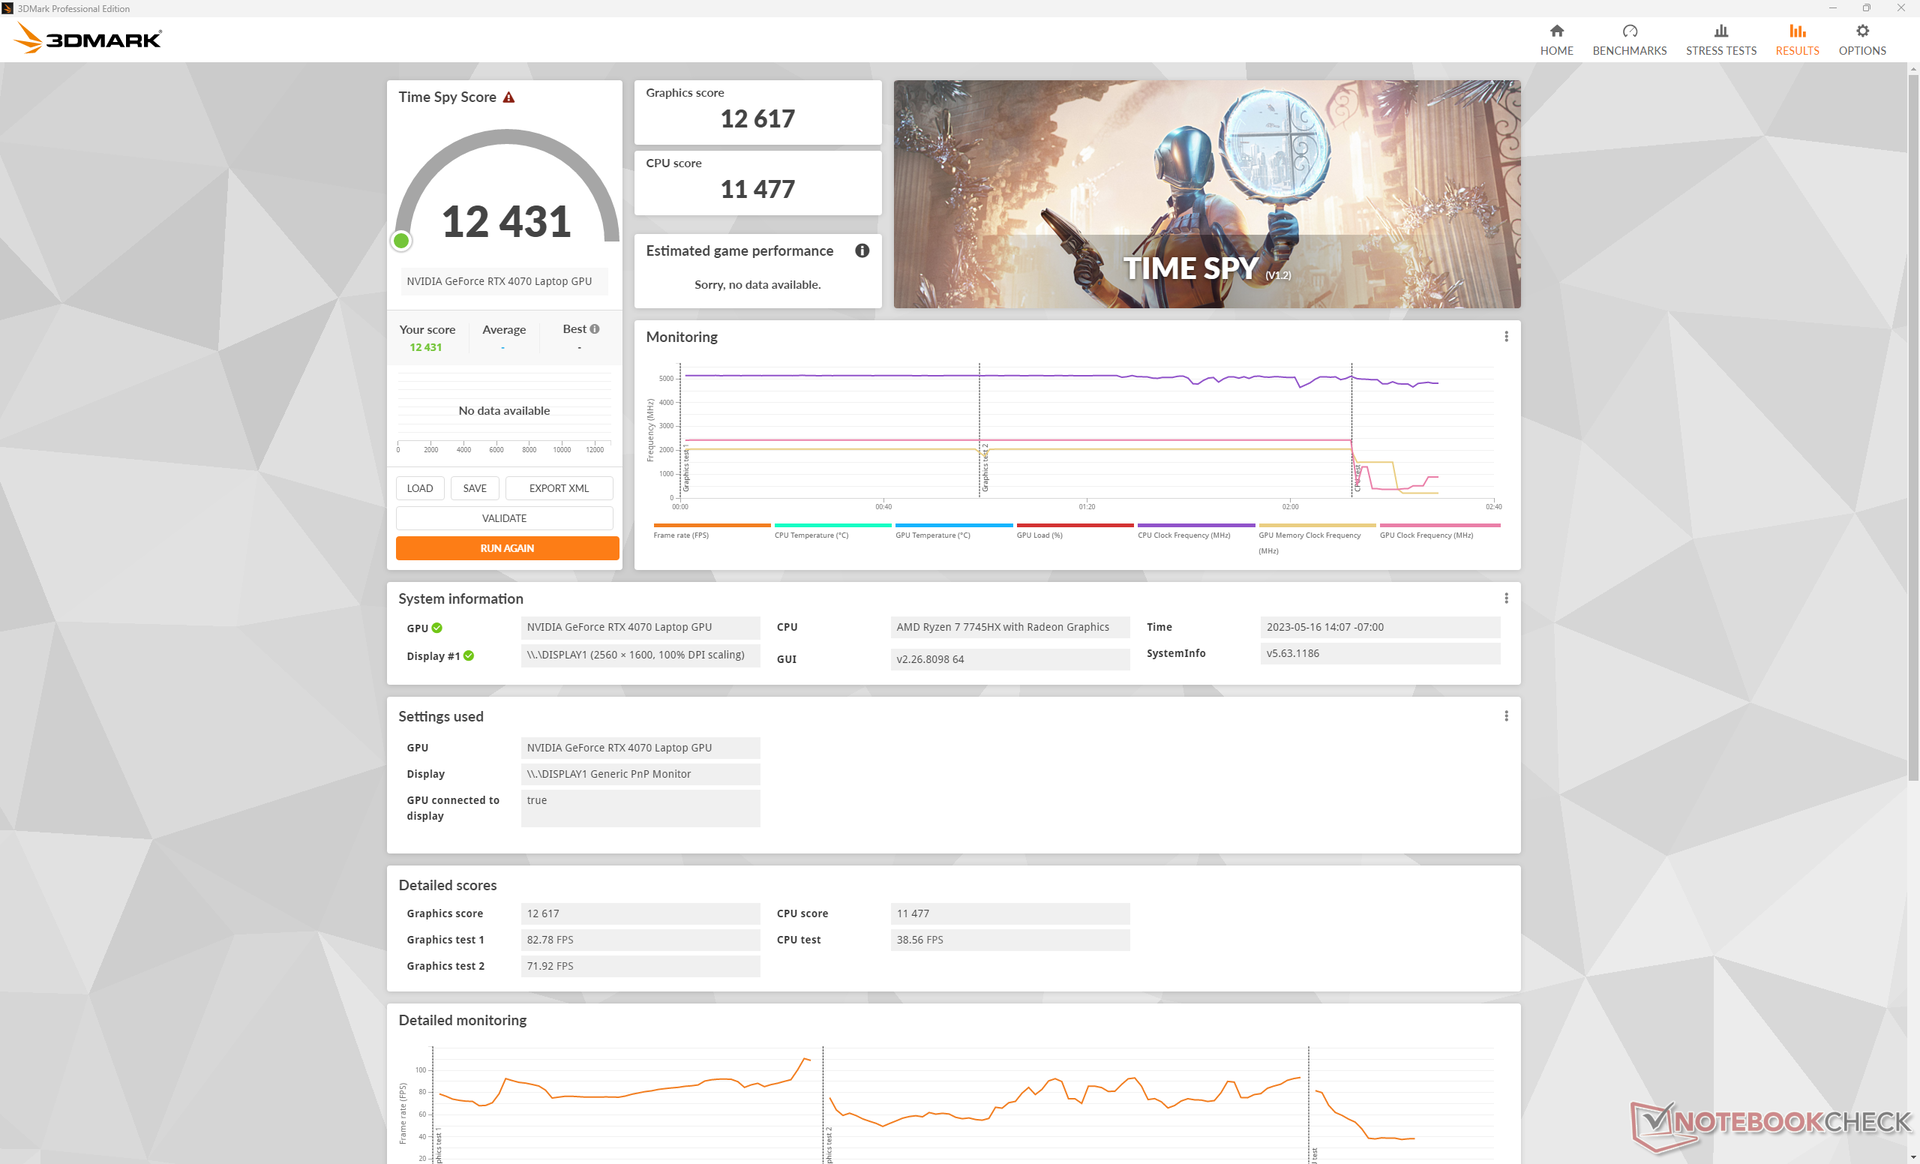
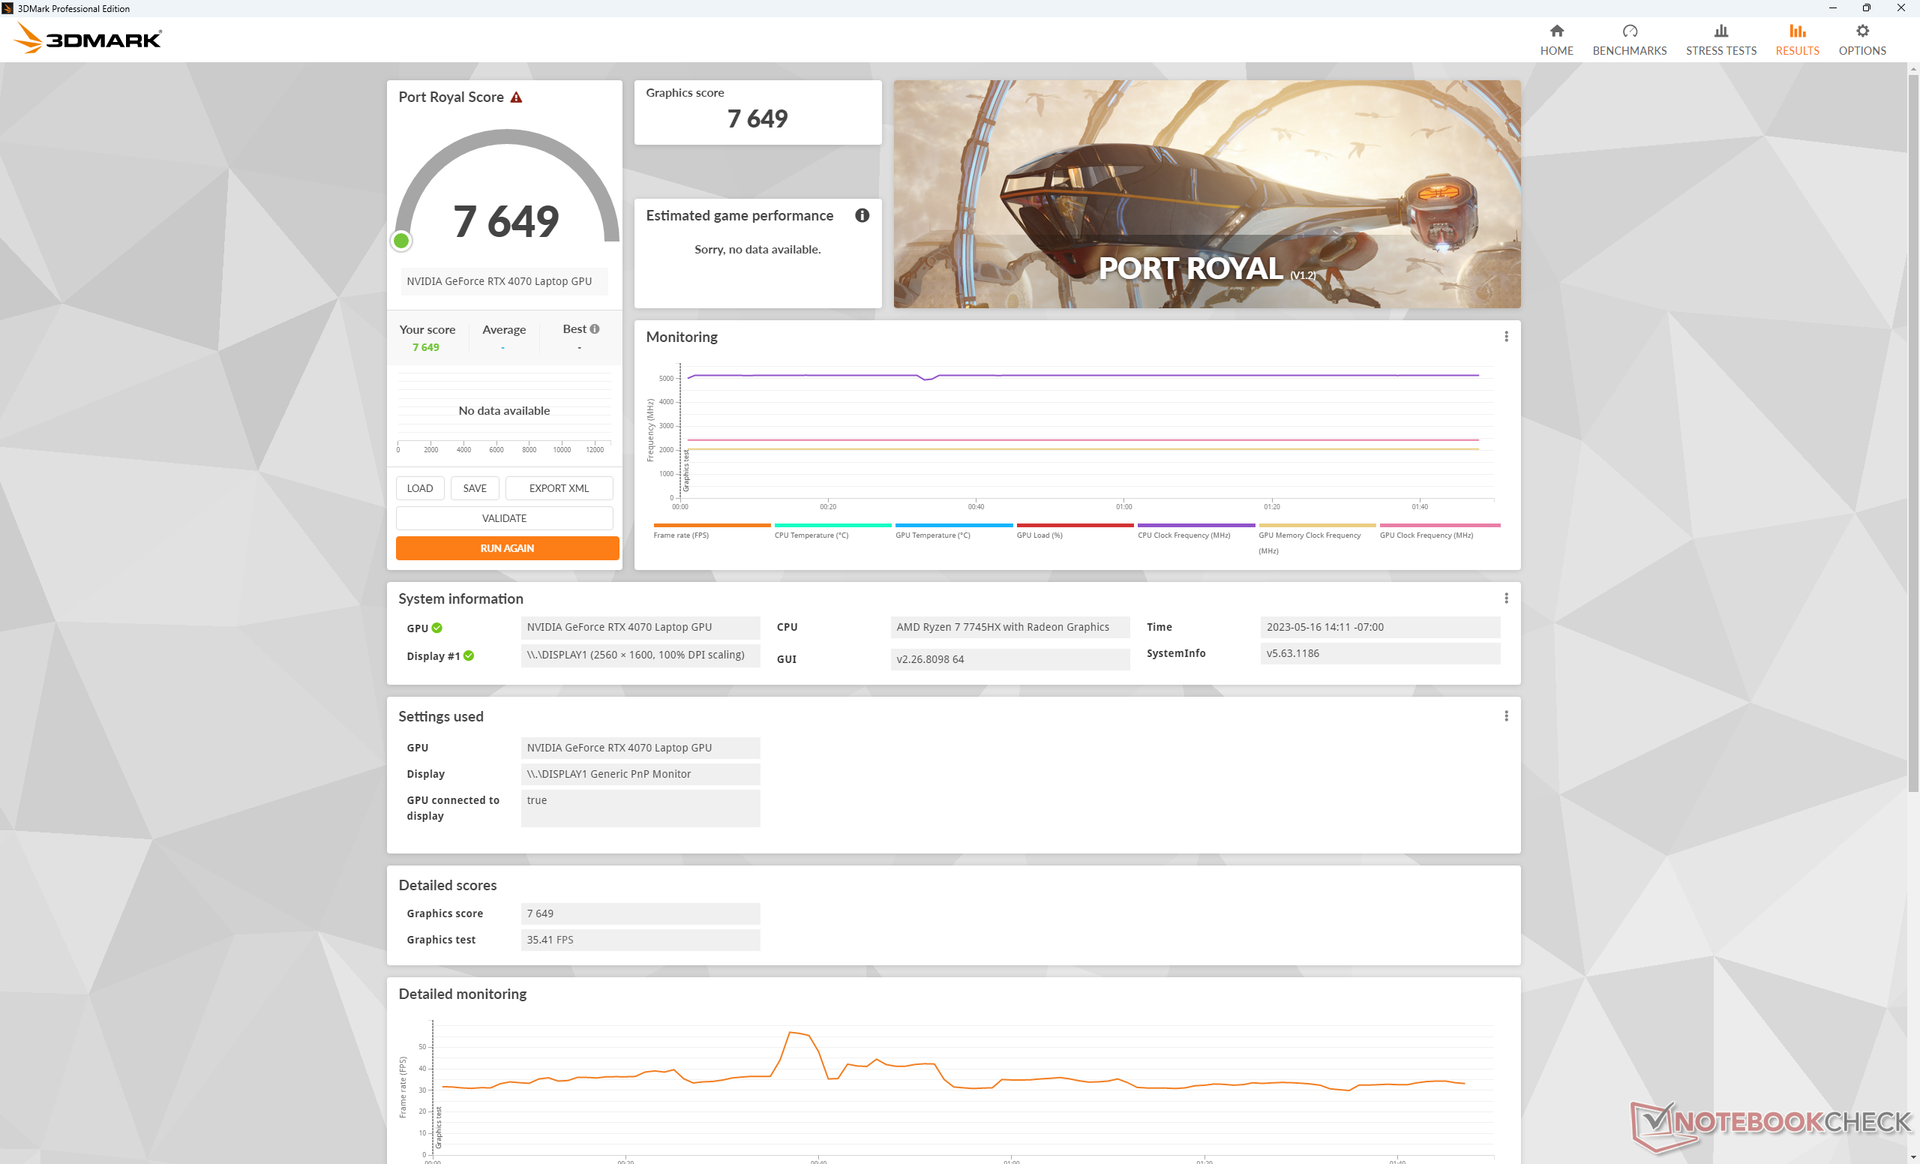
| 3DMark 11 Performance | 34813 poäng | |
| 3DMark Fire Strike Score | 28009 poäng | |
| 3DMark Time Spy Score | 12431 poäng | |
Hjälp | ||
* ... mindre är bättre
Spelprestanda
Vår AMD-drivna RTX 4070-modell skulle i värsta fall prestera ungefär lika bra som den Intel-drivna RTX 4060-modellen och i bästa fall upp till 20 procent snabbare. Som väntat tenderar prestandaklyftan mellan de två grafikprocessorerna att öka när man spelar mer krävande titlar i högre upplösningar och inställningar. Till exempel körs F1 22 och Returnal cirka 15 till 20 procent snabbare på vår AMD Legion -modell medan äldre titlar som GTA V skulle visa mindre ramfrekvensfördelar på bara 5 till 10 procent. Du kommer därför att vilja spela fler nyare titlar för att bättre utnyttja det mobila RTX 4070.
Generellt sett passar det mobila RTX 4070 bra ihop med den ursprungliga skärmen med upplösningen 2560 x 1600, särskilt eftersom G-Sync stöds. Även om den mobila versionen är mycket svagare än den skrivbordsversionen med cirka 30 procent, är den fortfarande tillräckligt kraftfull för att köra de senaste spelen i 1600p och 60+ FPS på höga inställningar. Spelare som inte störs av nackdelarna med bildgenerering kan aktivera DLSS3 på titlar som stöds för ännu högre bildfrekvenser.
Witcher 3 FPS Chart
| låg | med. | hög | ultra | QHD | 4K | |
|---|---|---|---|---|---|---|
| GTA V (2015) | 185.8 | 185.1 | 178.6 | 119.9 | 93.2 | 93.7 |
| The Witcher 3 (2015) | 597 | 415.1 | 257.3 | 119.8 | 76.2 | |
| Dota 2 Reborn (2015) | 238 | 203 | 191.8 | 182 | 151.5 | |
| Final Fantasy XV Benchmark (2018) | 229 | 172.5 | 119.9 | 119.9 | 49.2 | |
| X-Plane 11.11 (2018) | 186.3 | 155.2 | 117.8 | 99.5 | ||
| Strange Brigade (2018) | 636 | 334 | 260 | 223 | 146.4 | 76.8 |
| Shadow of the Tomb Raider (2018) | 168 | 110 | 53 | |||
| Far Cry 6 (2021) | 110 | 88 | 43 | |||
| Cyberpunk 2077 1.6 (2022) | 185.8 | 157.6 | 121.3 | 98.9 | 58.1 | 24.7 |
| Tiny Tina's Wonderlands (2022) | 263.6 | 217.3 | 144.5 | 112.1 | 76.9 | 39.7 |
| F1 22 (2022) | 311 | 300 | 235 | 84.1 | 54.8 | 26.4 |
| Call of Duty Modern Warfare 2 2022 (2022) | 108 | 77 | 44 | |||
| Returnal (2023) | 93 | 90 | 85 | 77 | 55 | 29 |
| Star Wars Jedi Survivor (2023) | 77.9 | 50.4 | 24.2 |
Utsläpp
Systemljud - cirka 50 dB(A) när du spelar
Fläktljudet vid spel är ungefär lika högt mellan AMD- och Intel-modellerna, omkring 48 dB(A). Om processorn belastas betydligt mer kan fläktljudet dock nå upp till 54 dB(A). Det låga 50 dB(A) intervallet är typiskt för de flesta bärbara datorer för spel, inklusiveAsus ROG Strix G16 ellerRazer Blade 16.
Intressant nog är fläktljudet lite tystare och med mindre frekventa pulserande när man kör kravlösa belastningar som kontorsarbete eller videouppspelning. AMD CPU drar mindre ström än Intel CPU vid boosting vilket kan bidra till det jämnare fläktljudet.
Ljudnivå
| Låg belastning |
| 23.2 / 23.2 / 26.2 dB(A) |
| Hög belastning |
| 31.4 / 53.8 dB(A) |
 | ||
30 dB tyst 40 dB(A) hörbar 50 dB(A) högt ljud |
||
min: | ||
| Lenovo Legion Pro 5 16ARX8 GeForce RTX 4070 Laptop GPU, R7 7745HX, Samsung PM9A1 MZVL21T0HCLR | Lenovo Legion Pro 5 16IRX8 GeForce RTX 4060 Laptop GPU, i7-13700HX, SK hynix PC801 HFS512GEJ9X115N | Uniwill GM6PX7X RTX 4070 GeForce RTX 4070 Laptop GPU, i7-13700HX, Samsung PM9A1 MZVL2512HCJQ | Schenker XMG Neo 16 E23 GeForce RTX 4090 Laptop GPU, i9-13900HX, Crucial P5 Plus 1TB CT1000P5PSSD8 | Asus ROG Strix G16 G614JZ GeForce RTX 4080 Laptop GPU, i9-13980HX, WD PC SN560 SDDPNQE-1T00 | Asus Zephyrus Duo 16 GX650PY-NM006W GeForce RTX 4090 Laptop GPU, R9 7945HX, SK hynix PC801 HFS002TEJ9X101N | |
|---|---|---|---|---|---|---|
| Noise | -2% | -9% | -37% | -15% | -19% | |
| av / miljö * (dB) | 23.2 | 23 1% | 22.4 3% | 25 -8% | 25 -8% | 23.9 -3% |
| Idle Minimum * (dB) | 23.2 | 23.1 -0% | 22.9 1% | 31 -34% | 26 -12% | 23.9 -3% |
| Idle Average * (dB) | 23.2 | 23.1 -0% | 29 -25% | 33 -42% | 28 -21% | 32.9 -42% |
| Idle Maximum * (dB) | 26.2 | 26.6 -2% | 29 -11% | 42 -60% | 30 -15% | 36.5 -39% |
| Load Average * (dB) | 31.4 | 34.7 -11% | 40.2 -28% | 58 -85% | 48 -53% | 42.9 -37% |
| Witcher 3 ultra * (dB) | 48.4 | 47.6 2% | 48.7 -1% | 57 -18% | 49 -1% | 51.2 -6% |
| Load Maximum * (dB) | 53.8 | 54.8 -2% | 55 -2% | 59 -10% | 52 3% | 56 -4% |
* ... mindre är bättre
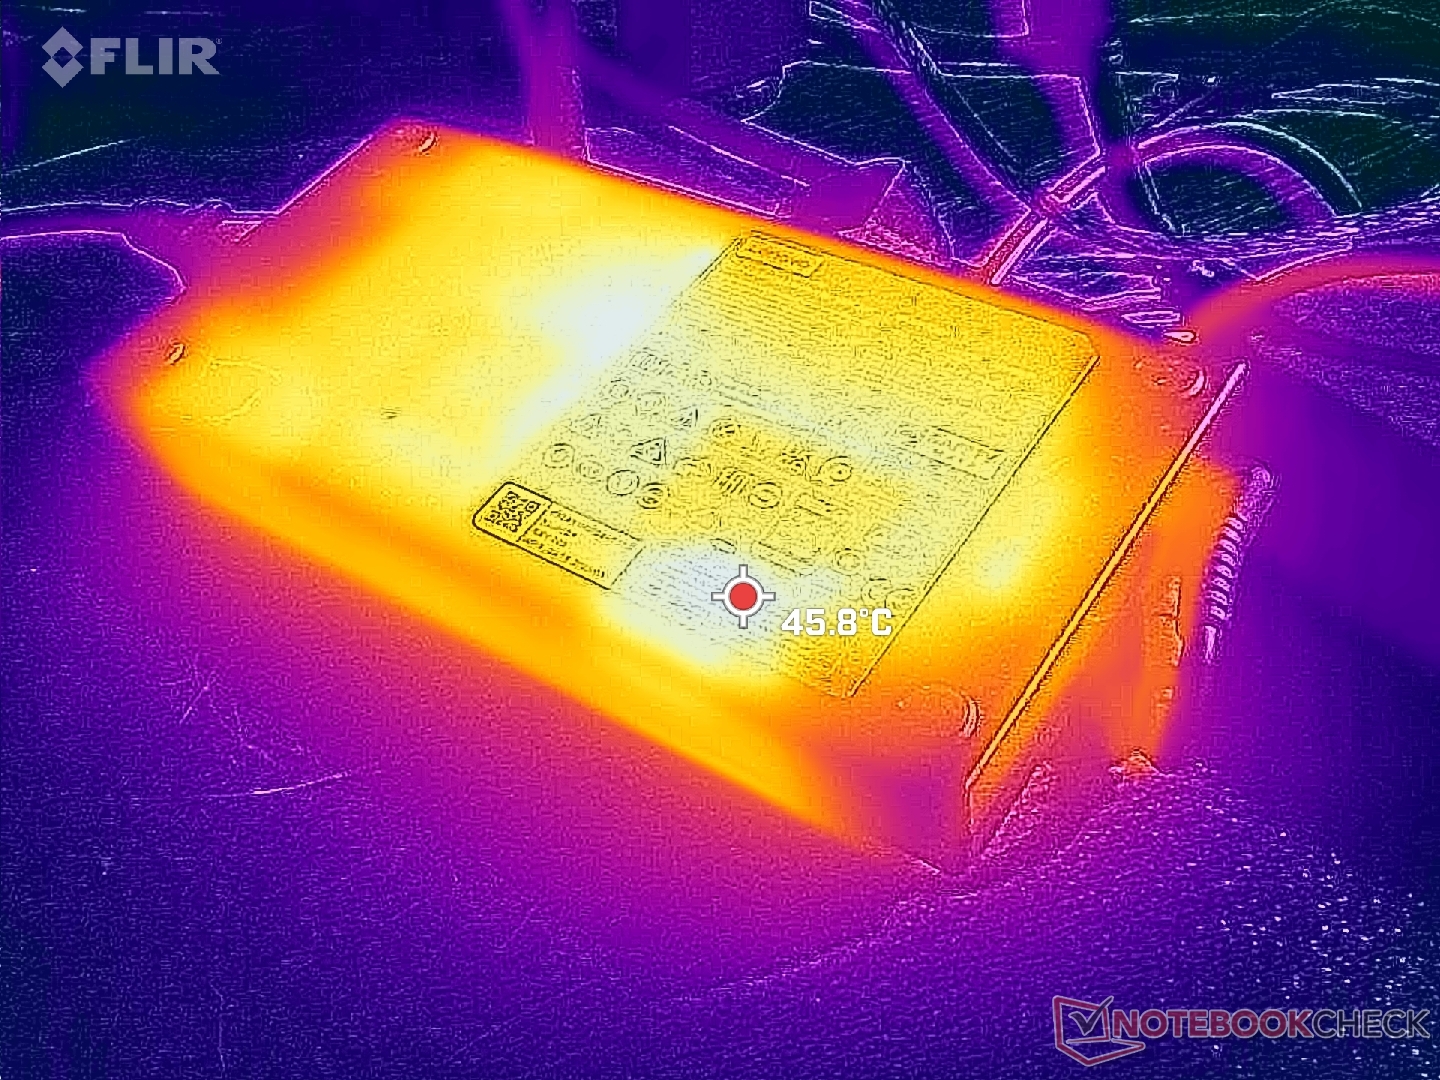
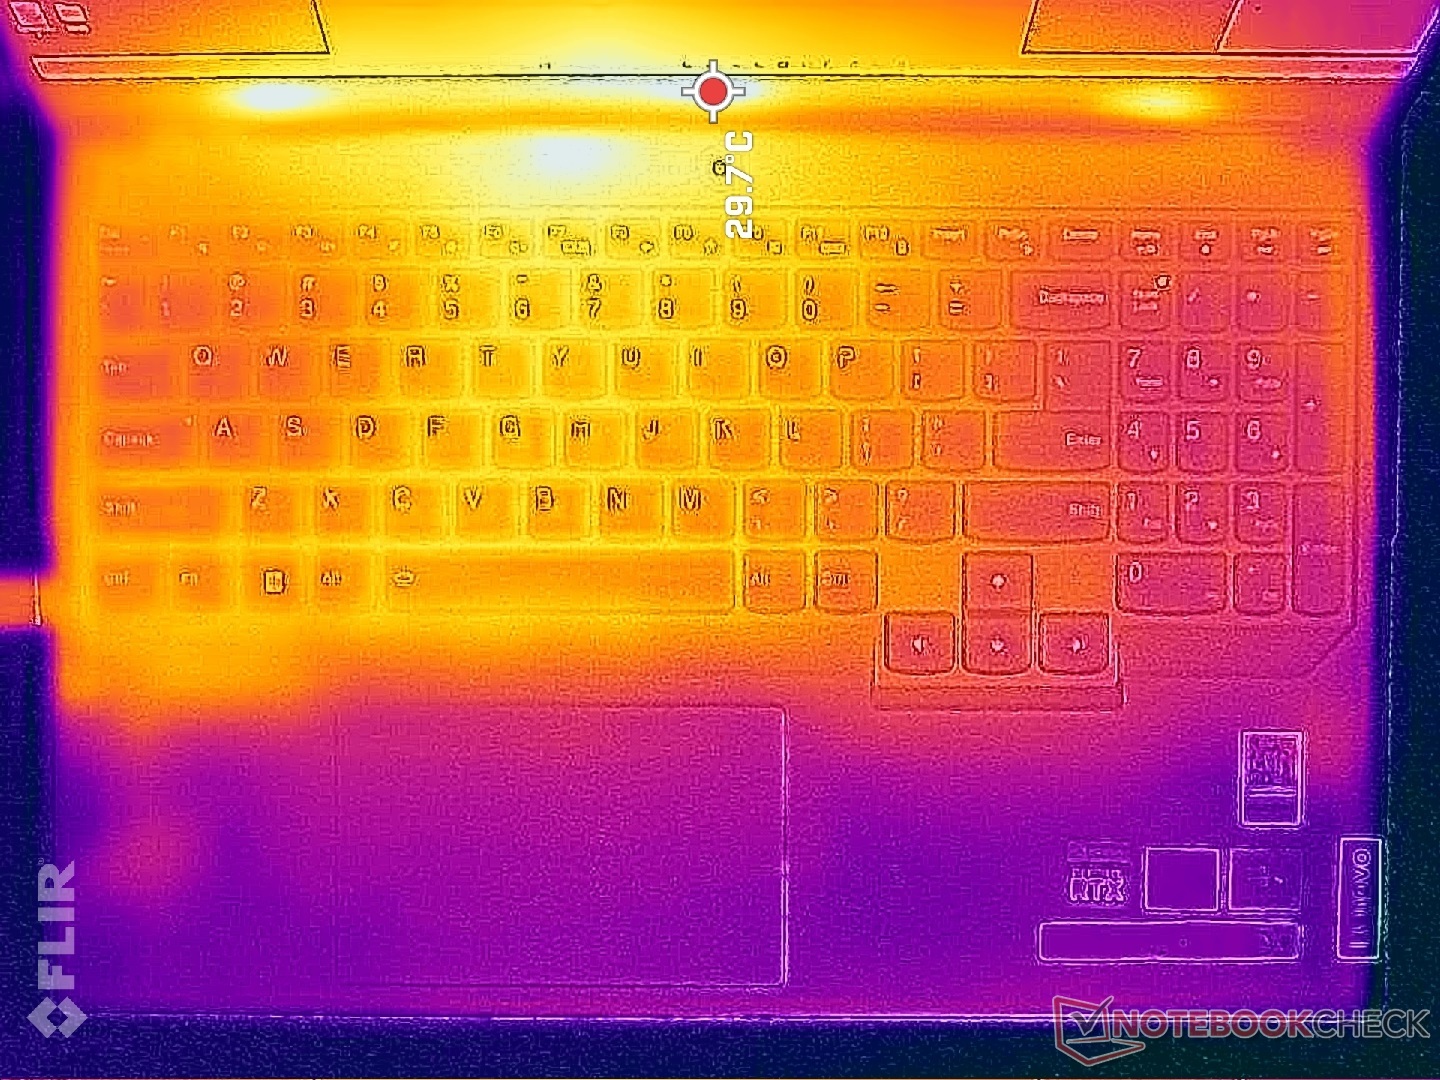
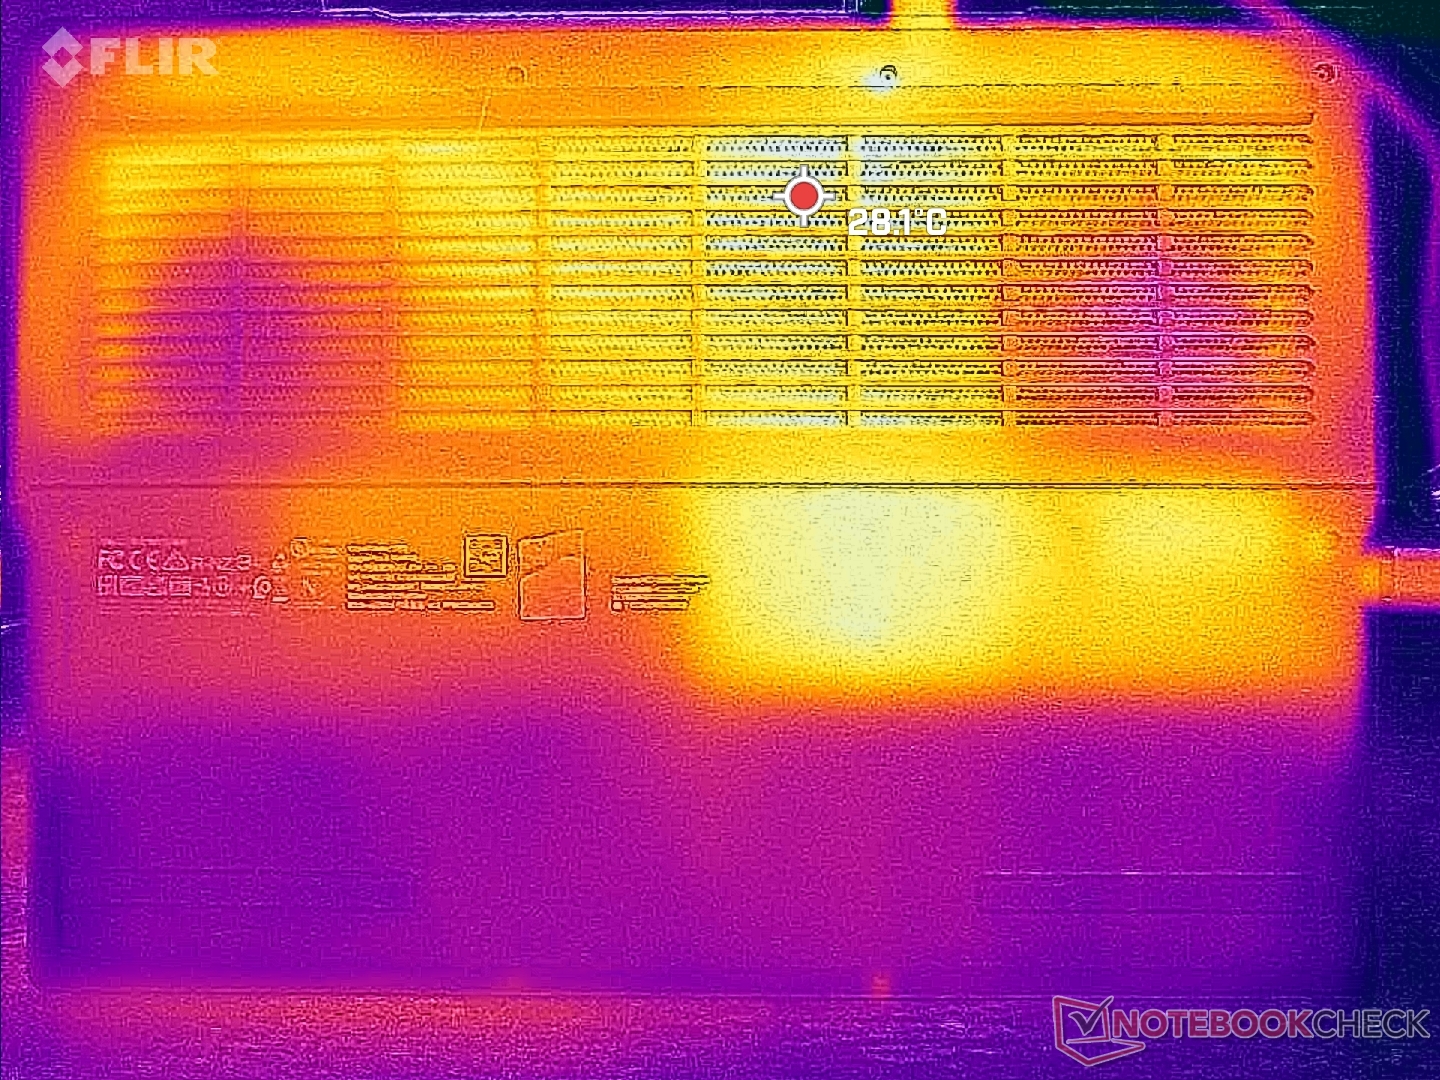
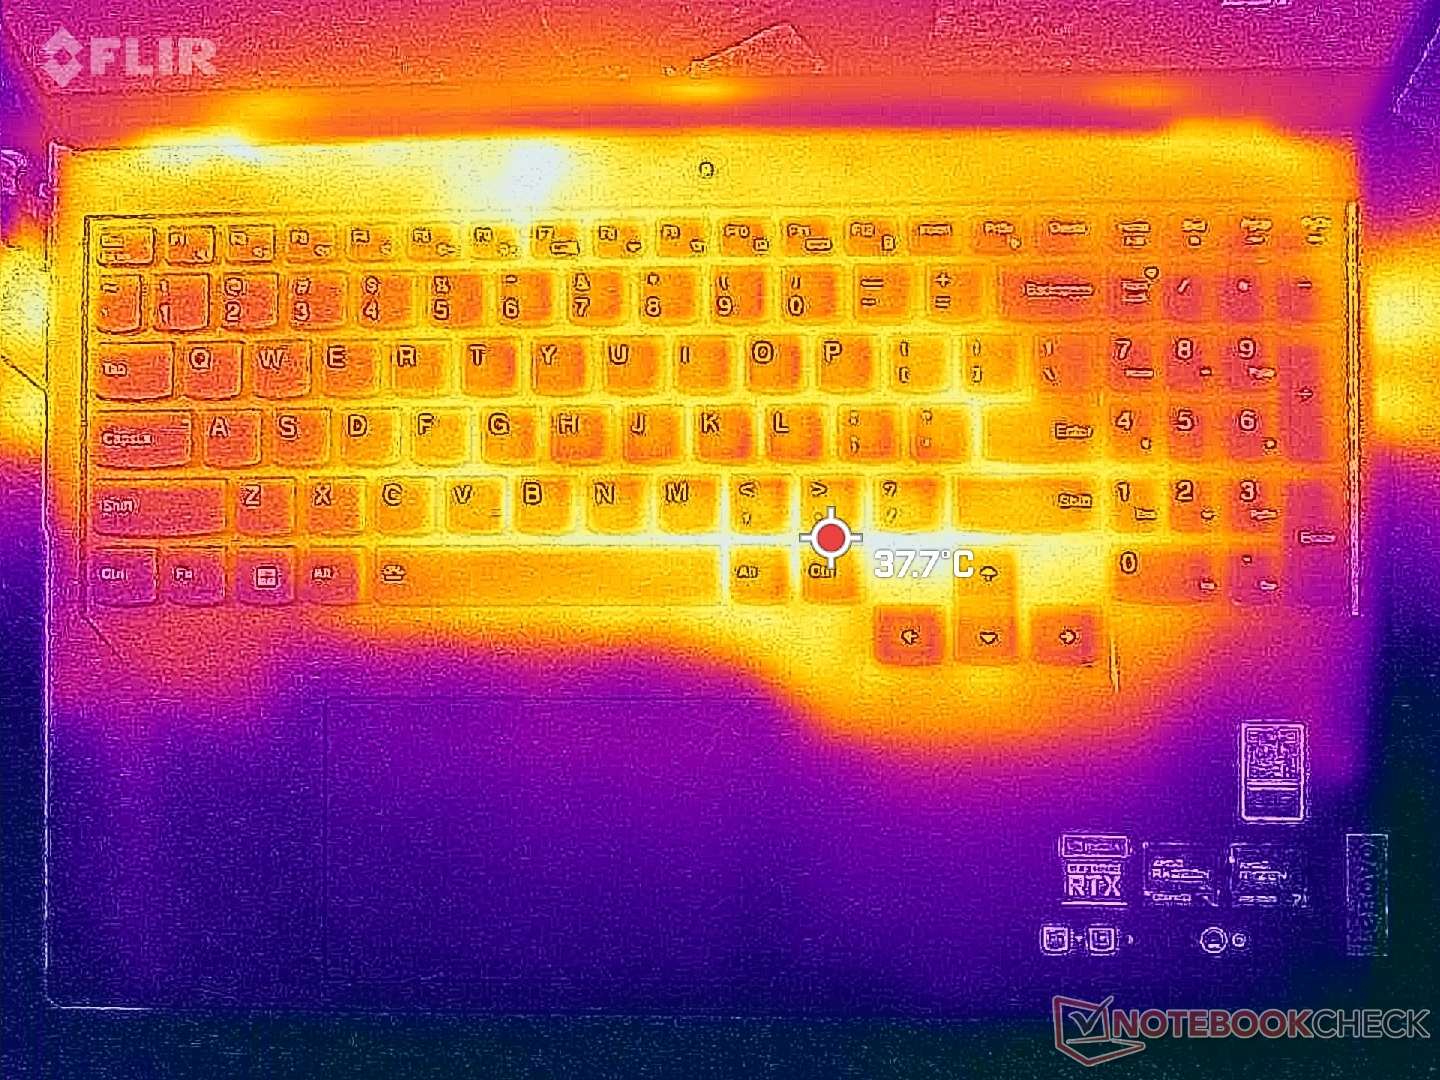
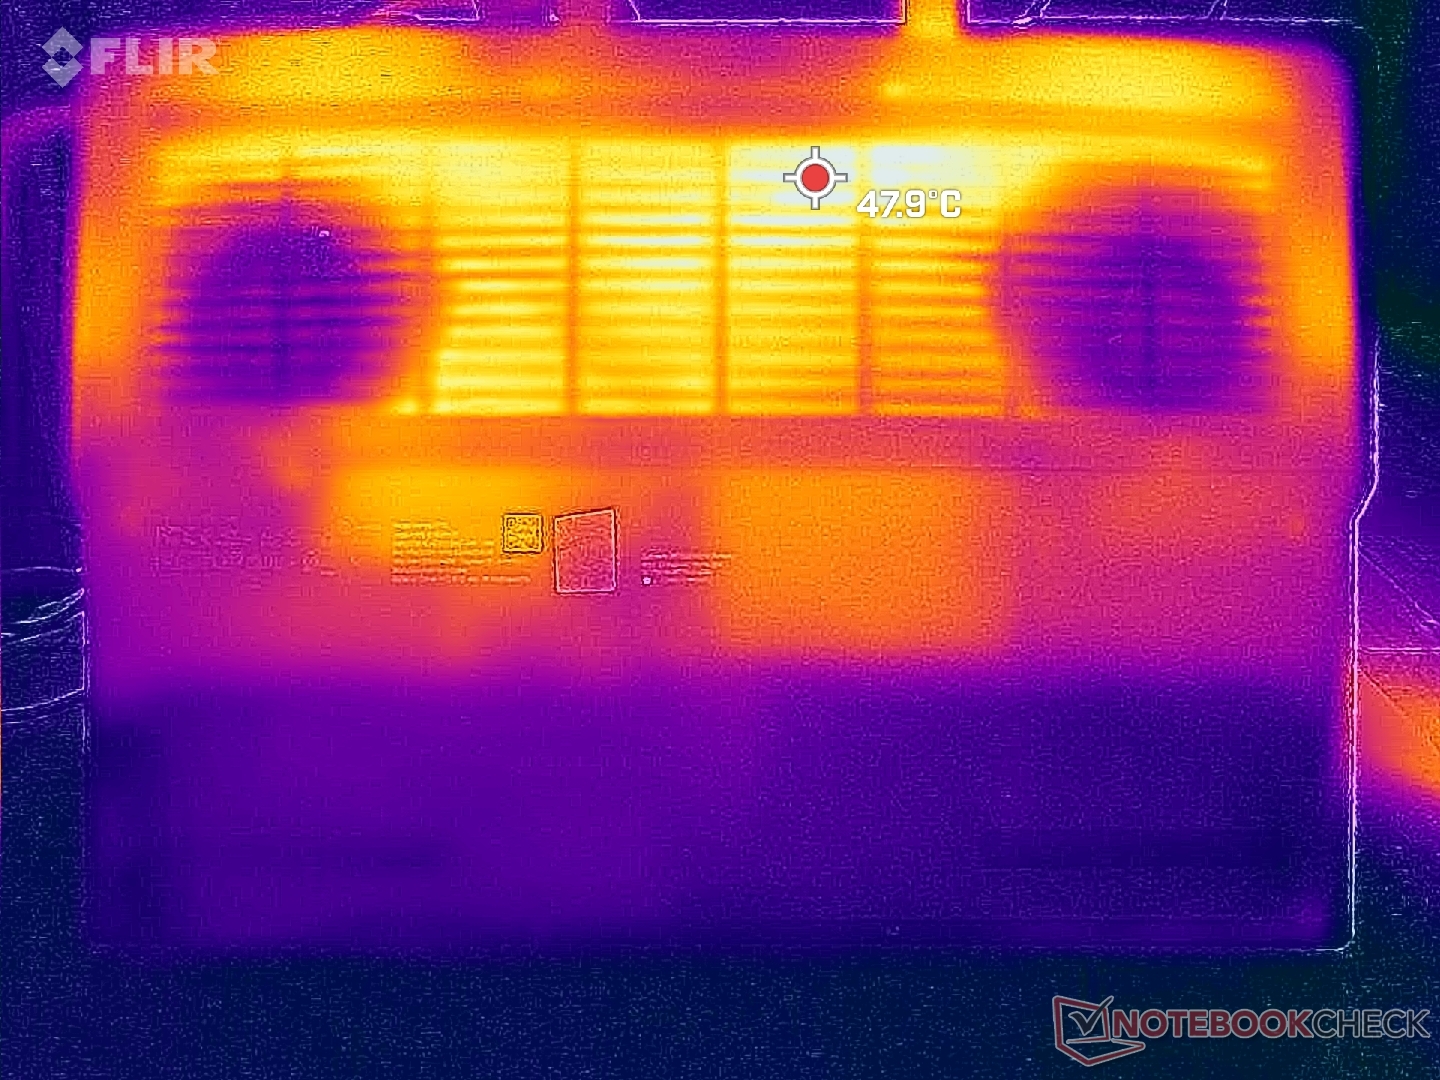
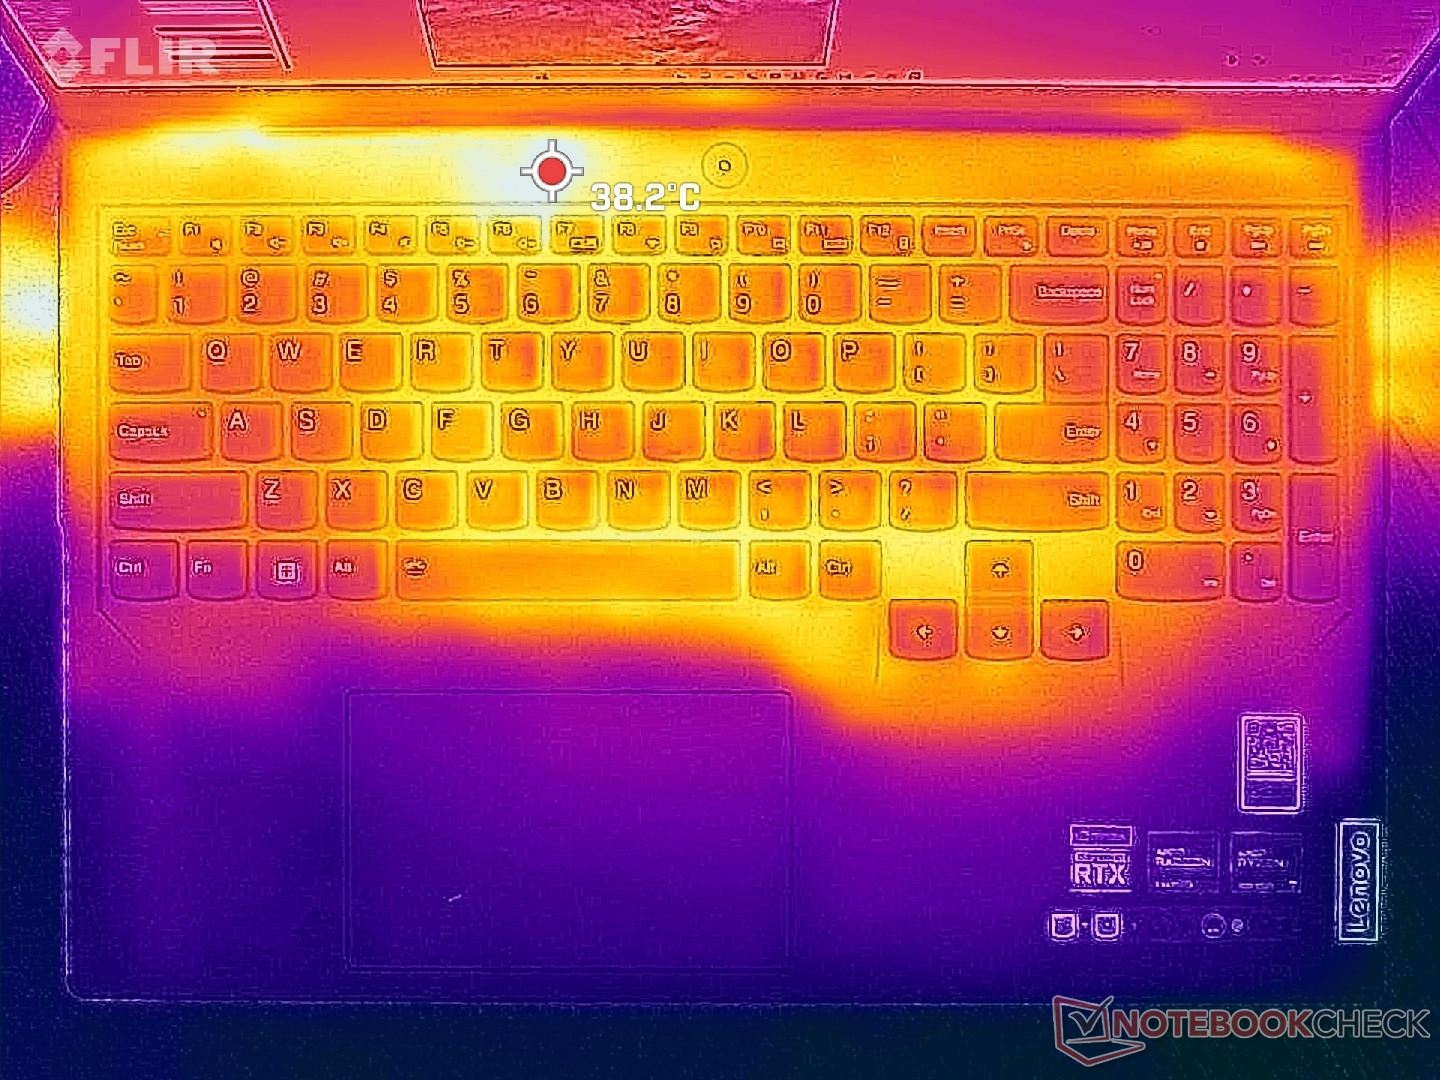
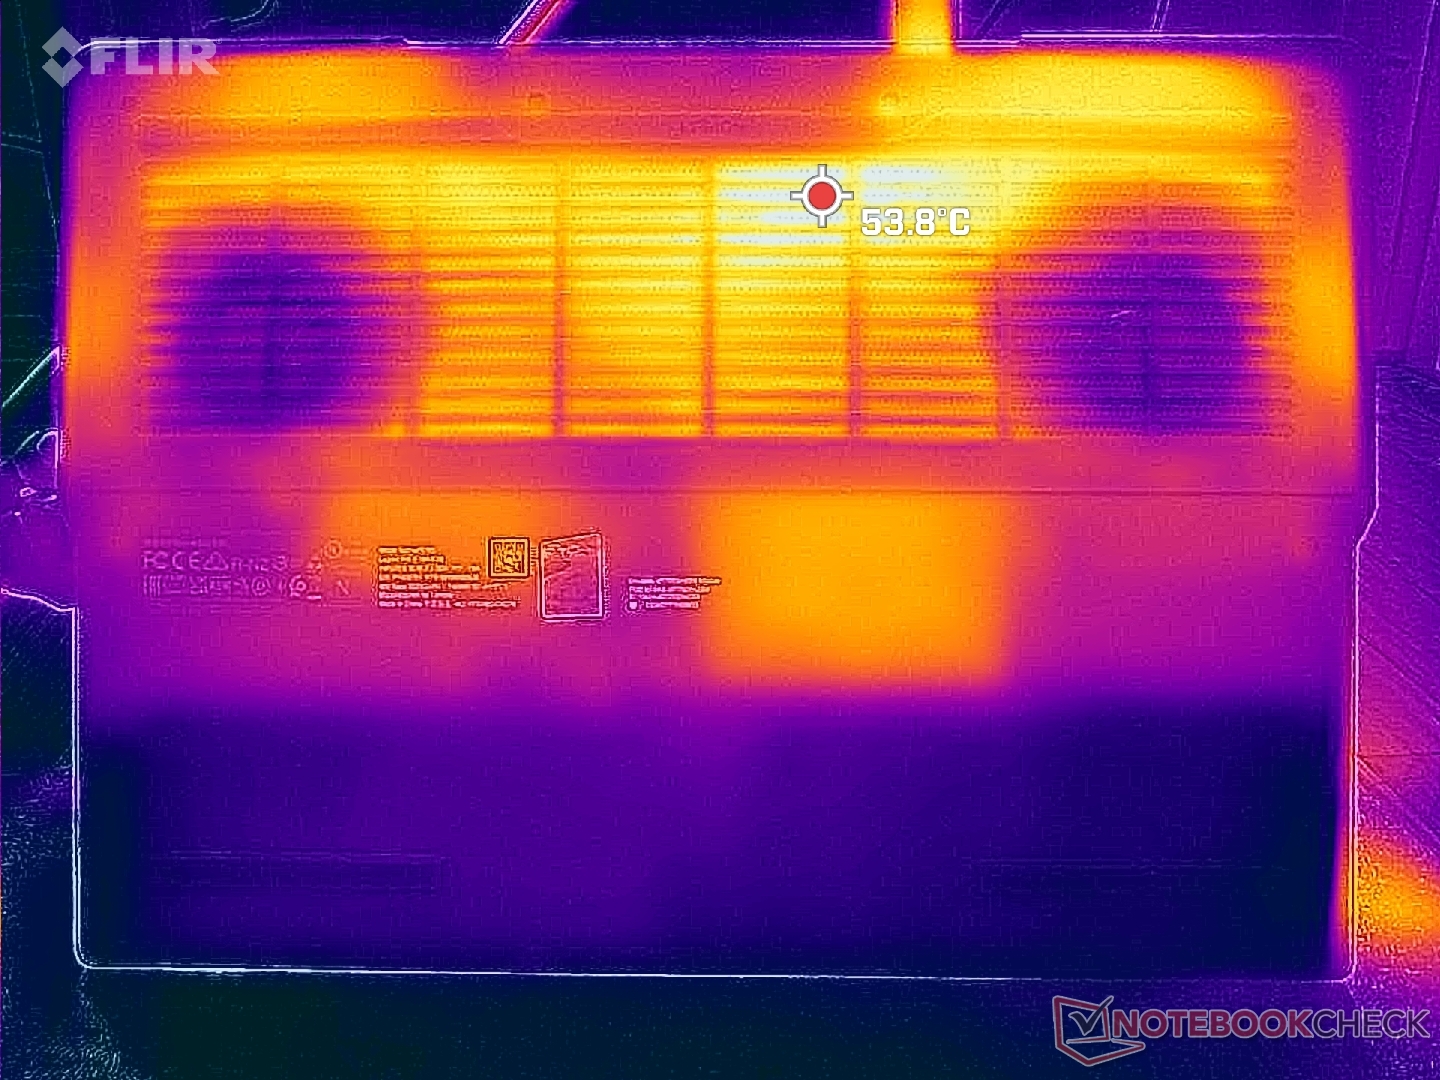
Temperatur
Yttemperaturerna är varmast vid mitten och baksidan av chassit, där de heta punkterna kan nå över 40 C när du spelar. Konkurrerande modeller somAsus ROG Zephyrus M16 skulle springa ännu varmare på strax över 50 C när de utsätts för liknande testförhållanden. Det råder ingen tvekan om att de jämförelsevis större ventilationsgallren på Legion -designen delvis är ansvariga för de bättre temperaturerna.
Handflatorna värms knappt upp oavsett belastning på skärmen för att hålla händerna bekväma när du spelar.
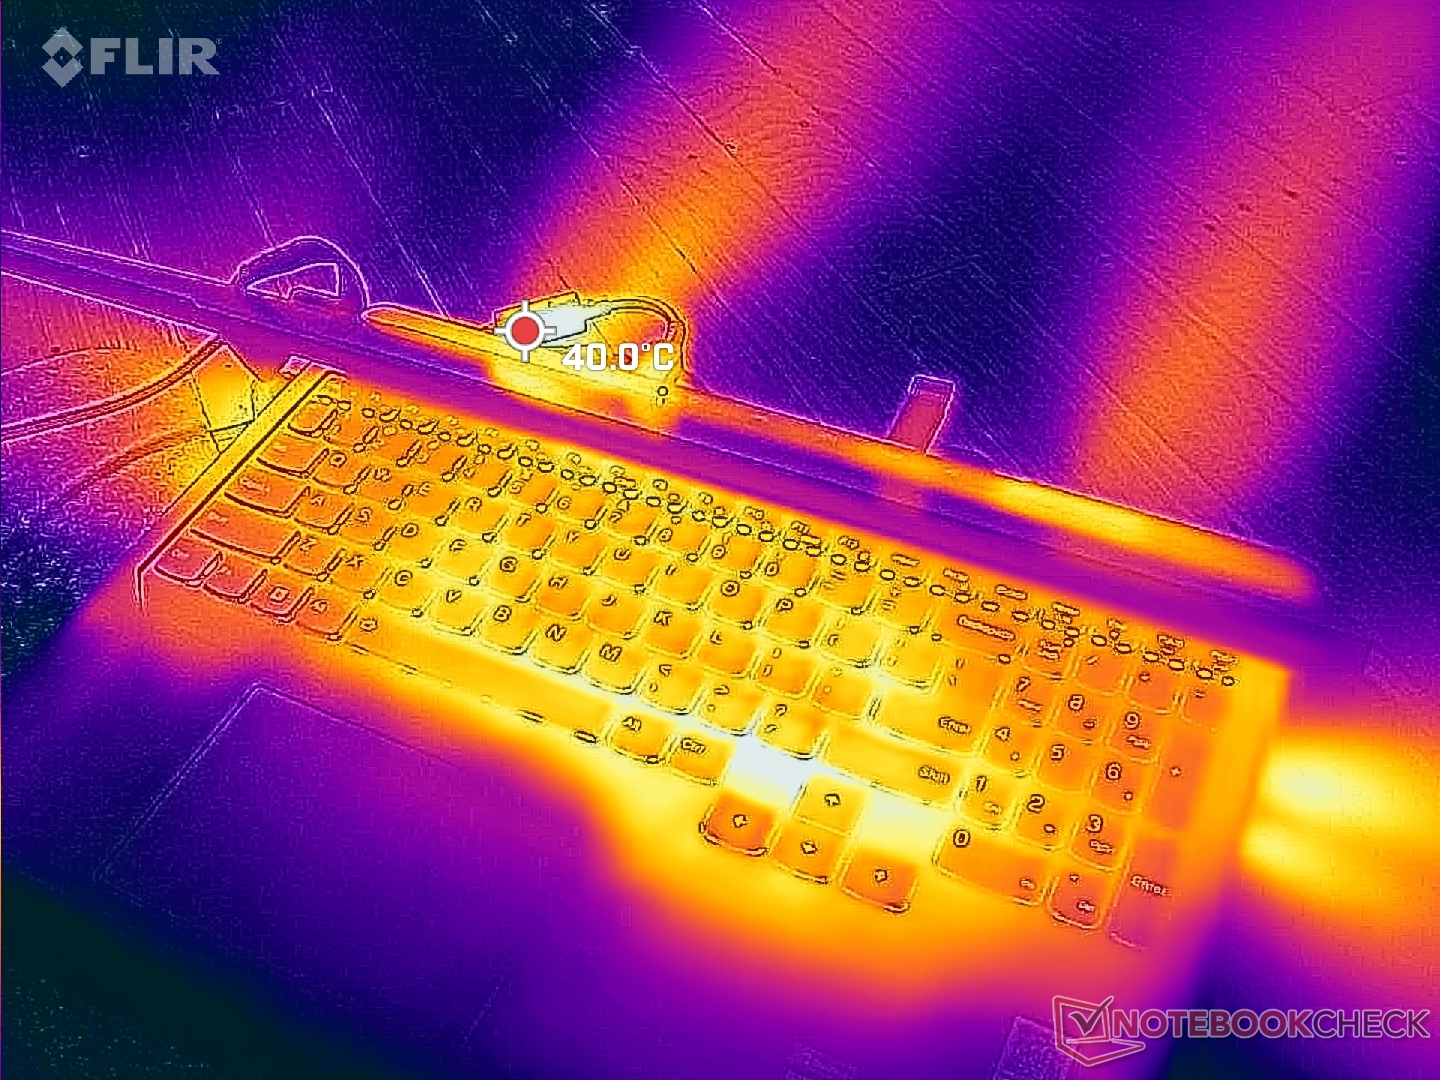
(±) Den maximala temperaturen på ovansidan är 41.8 °C / 107 F, jämfört med genomsnittet av 40.4 °C / 105 F , allt från 21.2 till 68.8 °C för klassen Gaming.
(±) Botten värms upp till maximalt 41.4 °C / 107 F, jämfört med genomsnittet av 43.2 °C / 110 F
(+) Vid tomgångsbruk är medeltemperaturen för ovansidan 26.2 °C / 79 F, jämfört med enhetsgenomsnittet på 33.9 °C / ### class_avg_f### F.
(±) När du spelar The Witcher 3 är medeltemperaturen för ovansidan 34.2 °C / 94 F, jämfört med enhetsgenomsnittet på 33.9 °C / ## #class_avg_f### F.
(+) Handledsstöden och pekplattan är kallare än hudtemperaturen med maximalt 30.4 °C / 86.7 F och är därför svala att ta på.
(±) Medeltemperaturen för handledsstödsområdet på liknande enheter var 28.8 °C / 83.8 F (-1.6 °C / -2.9 F).
| Lenovo Legion Pro 5 16ARX8 AMD Ryzen 7 7745HX, NVIDIA GeForce RTX 4070 Laptop GPU | Lenovo Legion Pro 5 16IRX8 Intel Core i7-13700HX, NVIDIA GeForce RTX 4060 Laptop GPU | Uniwill GM6PX7X RTX 4070 Intel Core i7-13700HX, NVIDIA GeForce RTX 4070 Laptop GPU | Schenker XMG Neo 16 E23 Intel Core i9-13900HX, NVIDIA GeForce RTX 4090 Laptop GPU | Asus ROG Strix G16 G614JZ Intel Core i9-13980HX, NVIDIA GeForce RTX 4080 Laptop GPU | Asus Zephyrus Duo 16 GX650PY-NM006W AMD Ryzen 9 7945HX, NVIDIA GeForce RTX 4090 Laptop GPU | |
|---|---|---|---|---|---|---|
| Heat | -9% | -12% | -7% | -18% | -5% | |
| Maximum Upper Side * (°C) | 41.8 | 42.8 -2% | 38.2 9% | 50 -20% | 54 -29% | 44.2 -6% |
| Maximum Bottom * (°C) | 41.4 | 50 -21% | 45 -9% | 51 -23% | 55 -33% | 46.8 -13% |
| Idle Upper Side * (°C) | 29 | 29.6 -2% | 33.6 -16% | 28 3% | 29 -0% | 29.2 -1% |
| Idle Bottom * (°C) | 30.4 | 34 -12% | 39.6 -30% | 26 14% | 33 -9% | 30.2 1% |
* ... mindre är bättre
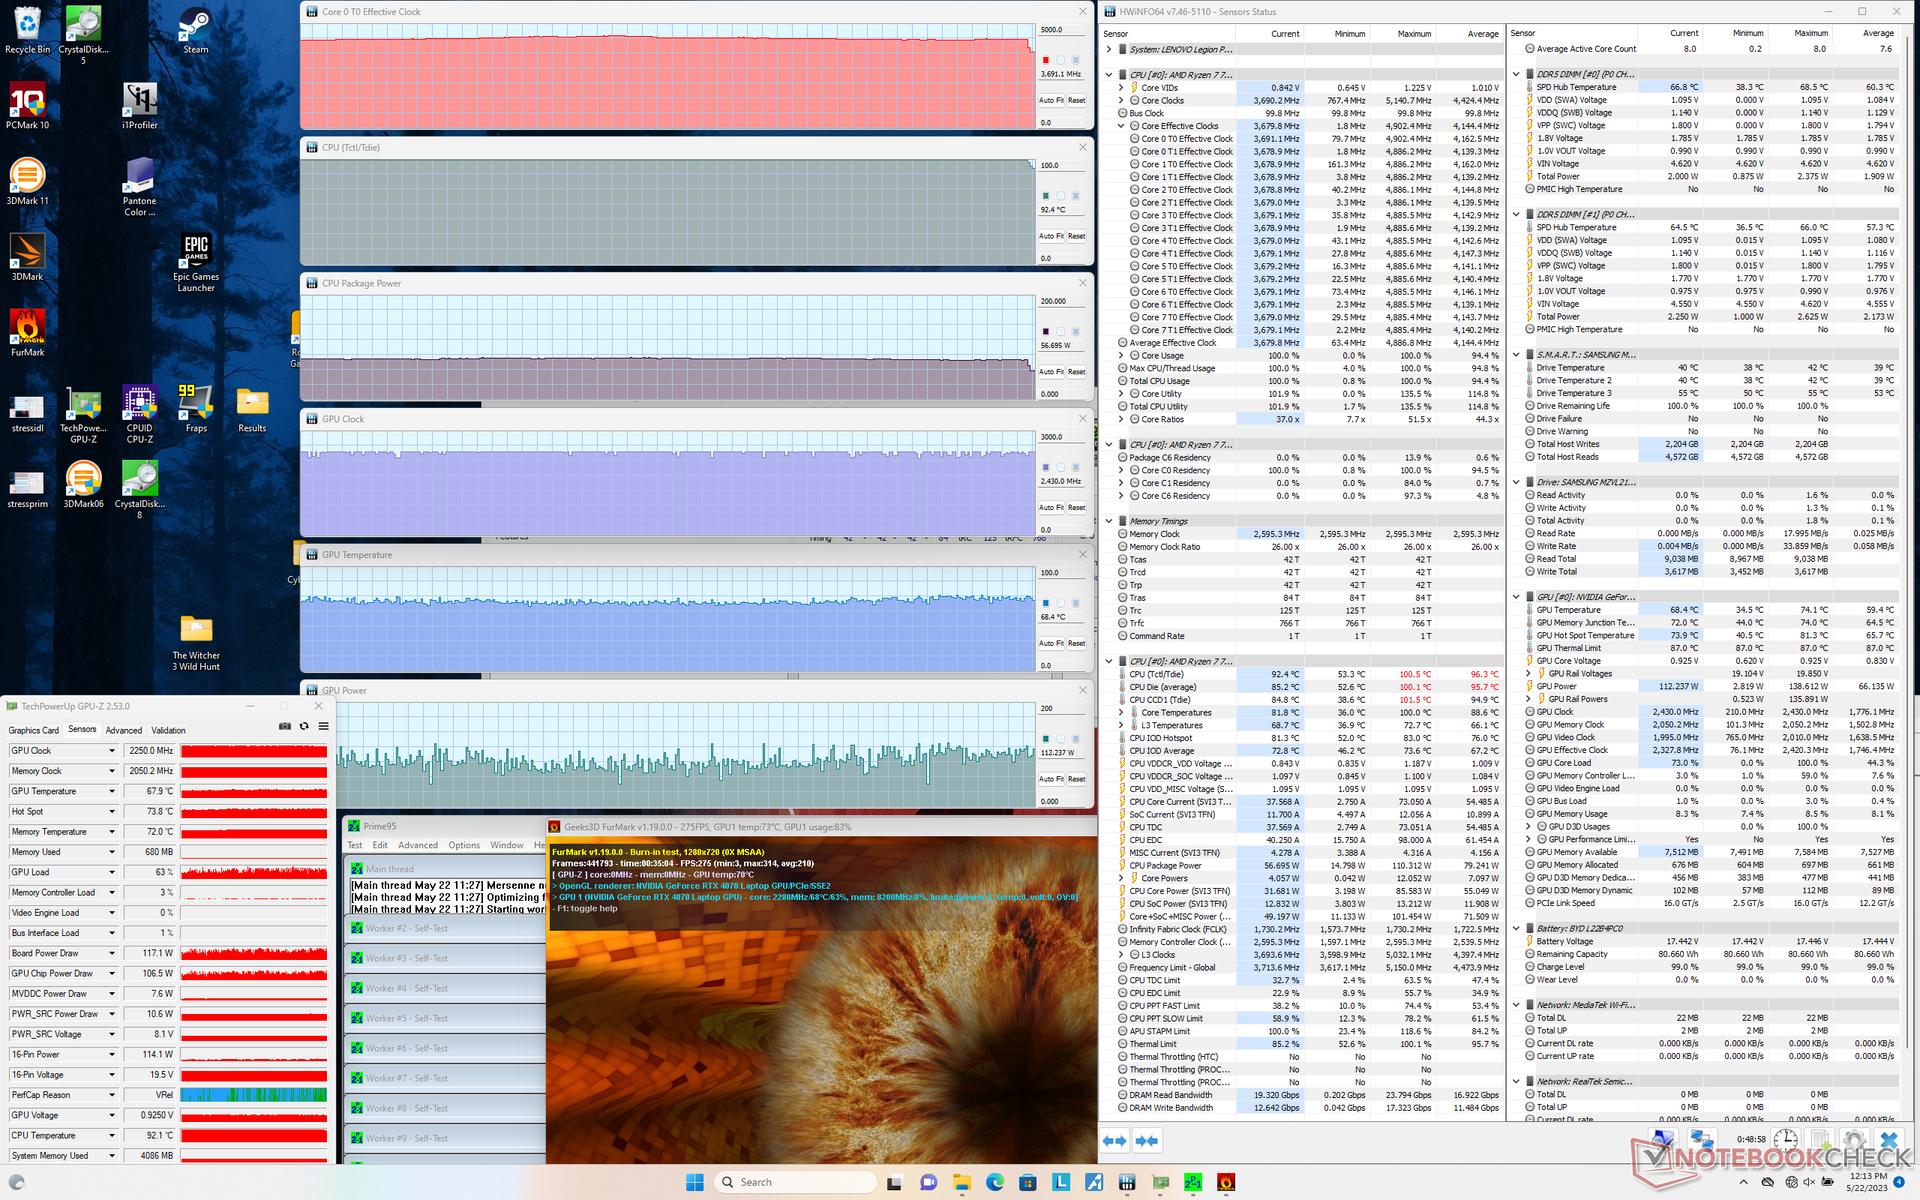
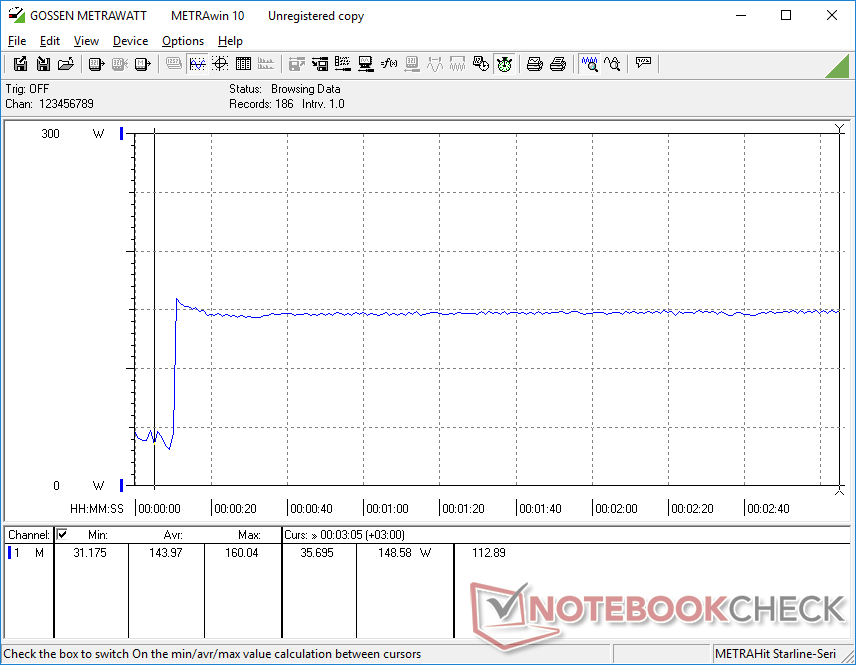
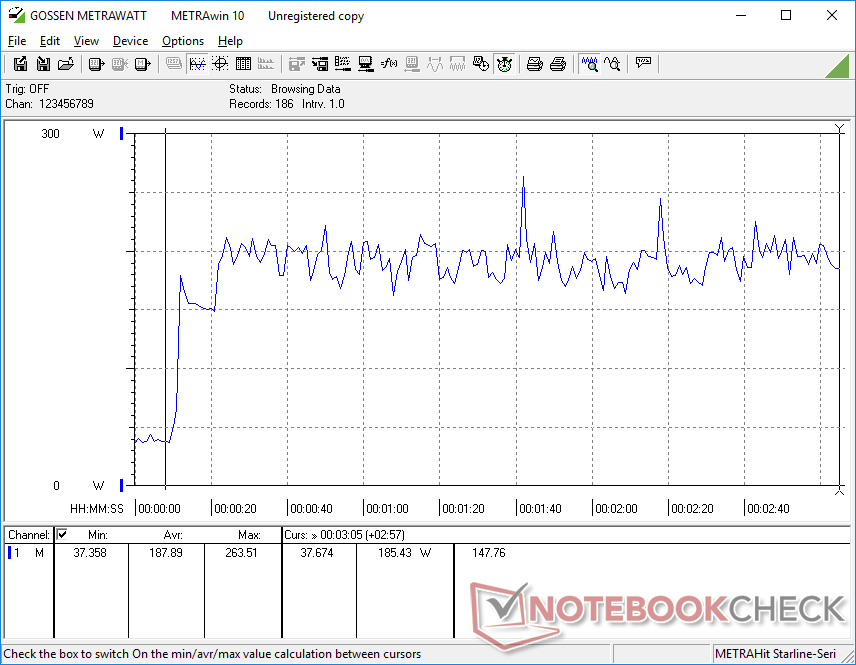
Stresstest - en varm CPU
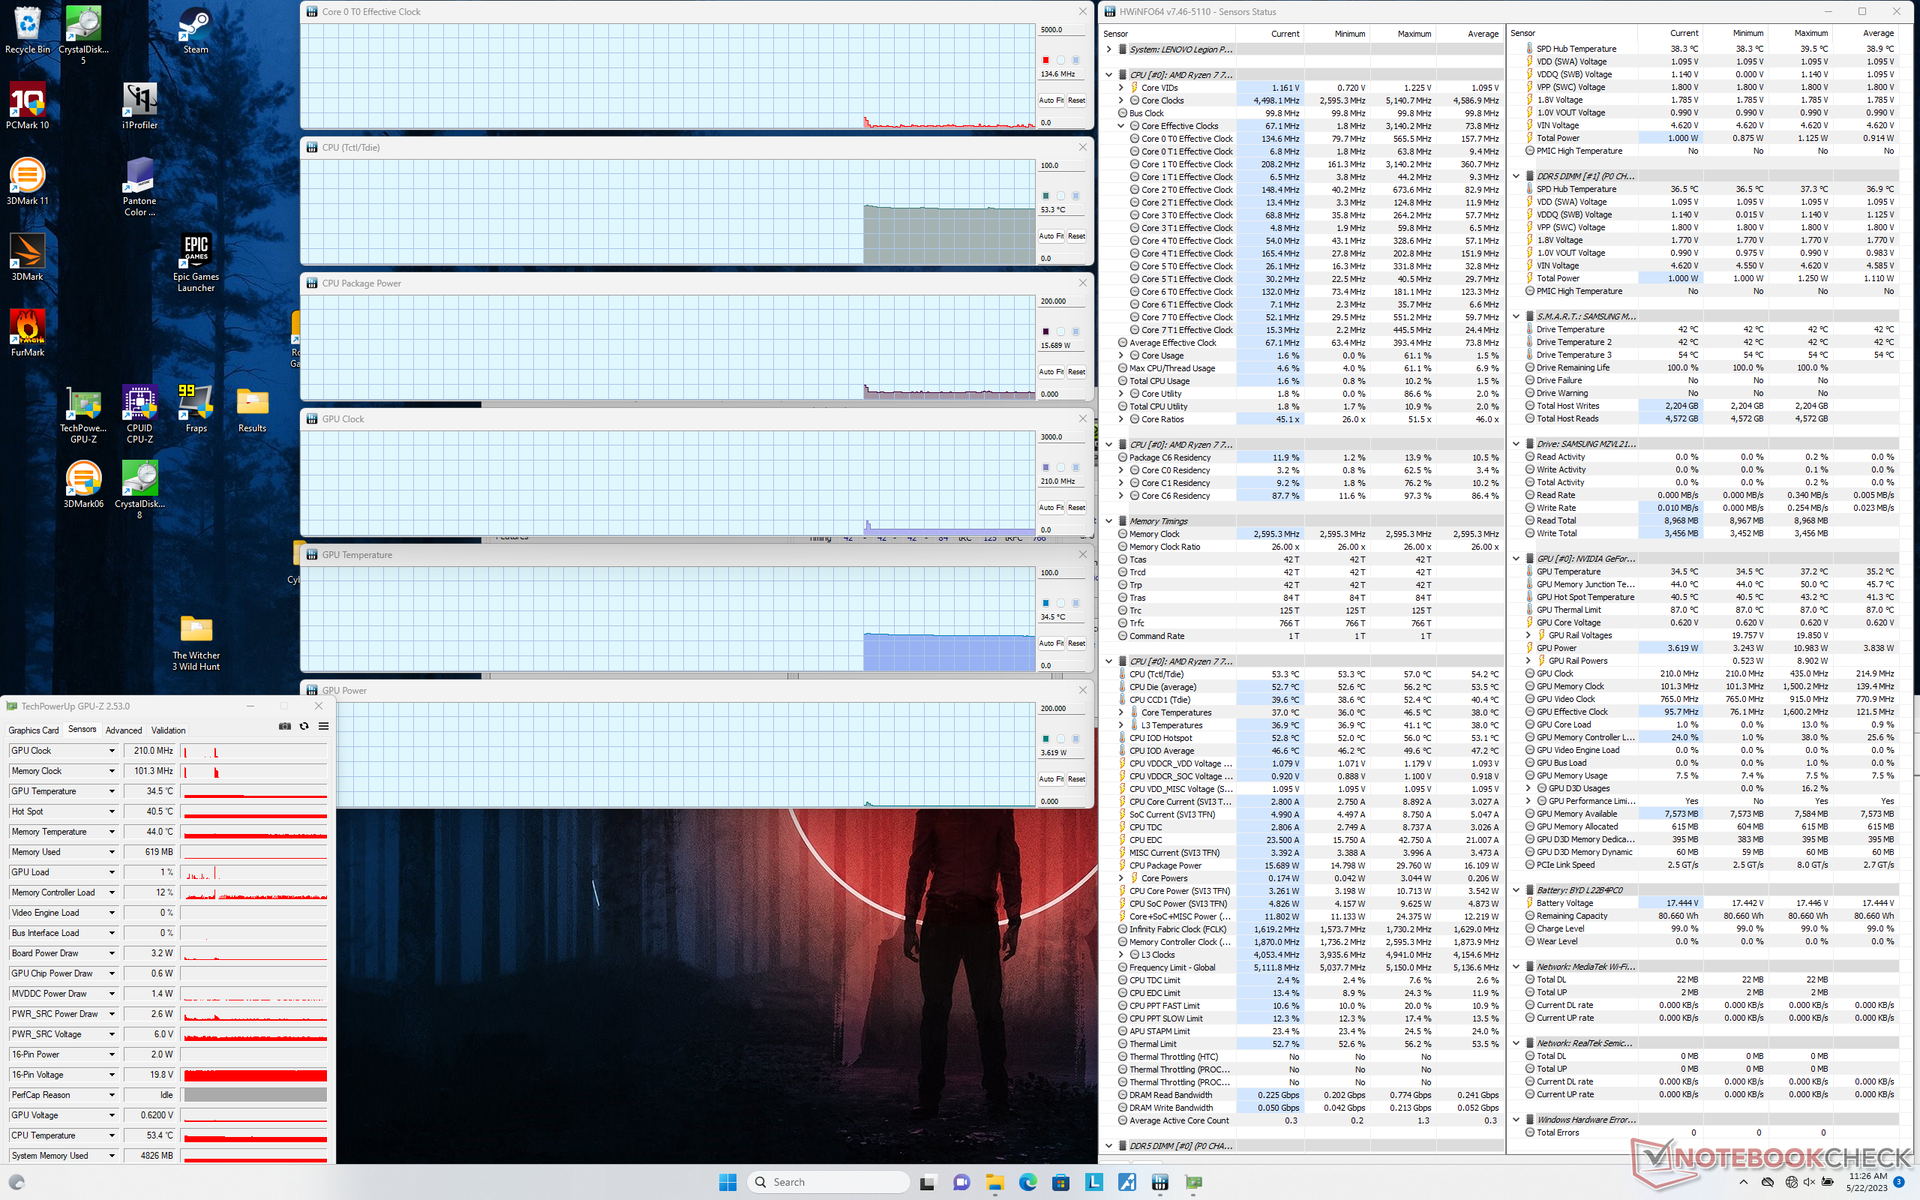
När vi körde Prime95 för att stressa processorn, steg klockfrekvensen och strömförbrukningen på kortet till 4,9 GHz respektive 110 W, för att sedan snabbt sjunka till 4,6 GHz och 90 W bara några sekunder senare. Kärnans temperatur stabiliserades vid mycket höga 90-100 C, vilket är ännu varmare med några grader än den redan varma Core i7-13700HX i alternativ Intel Legion modell. Det är tydligt att Ryzen 7 CPU:n pressar gränserna för chassiskylningslösningen och att en snabbare Ryzen 9-lösning skulle ha krävt kompromisser.
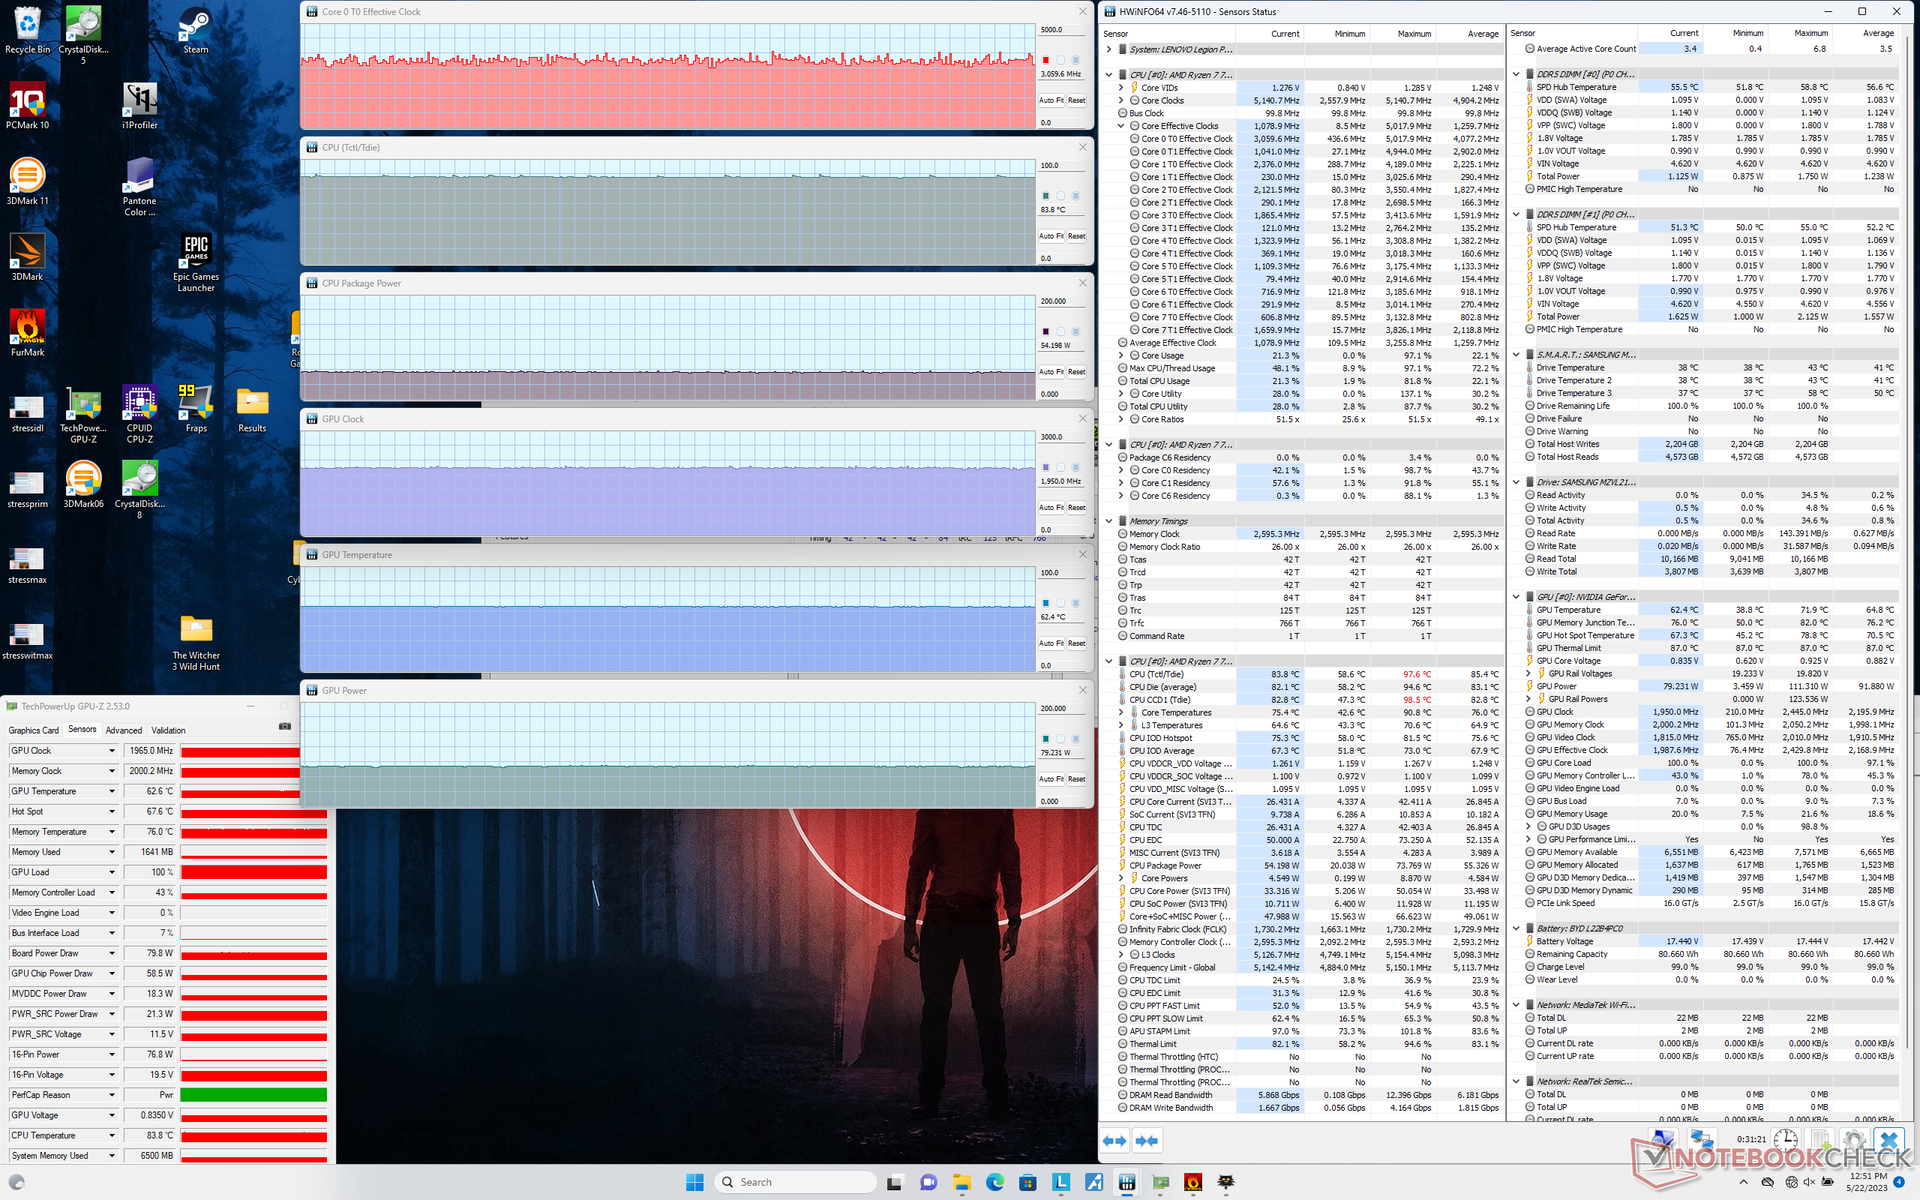
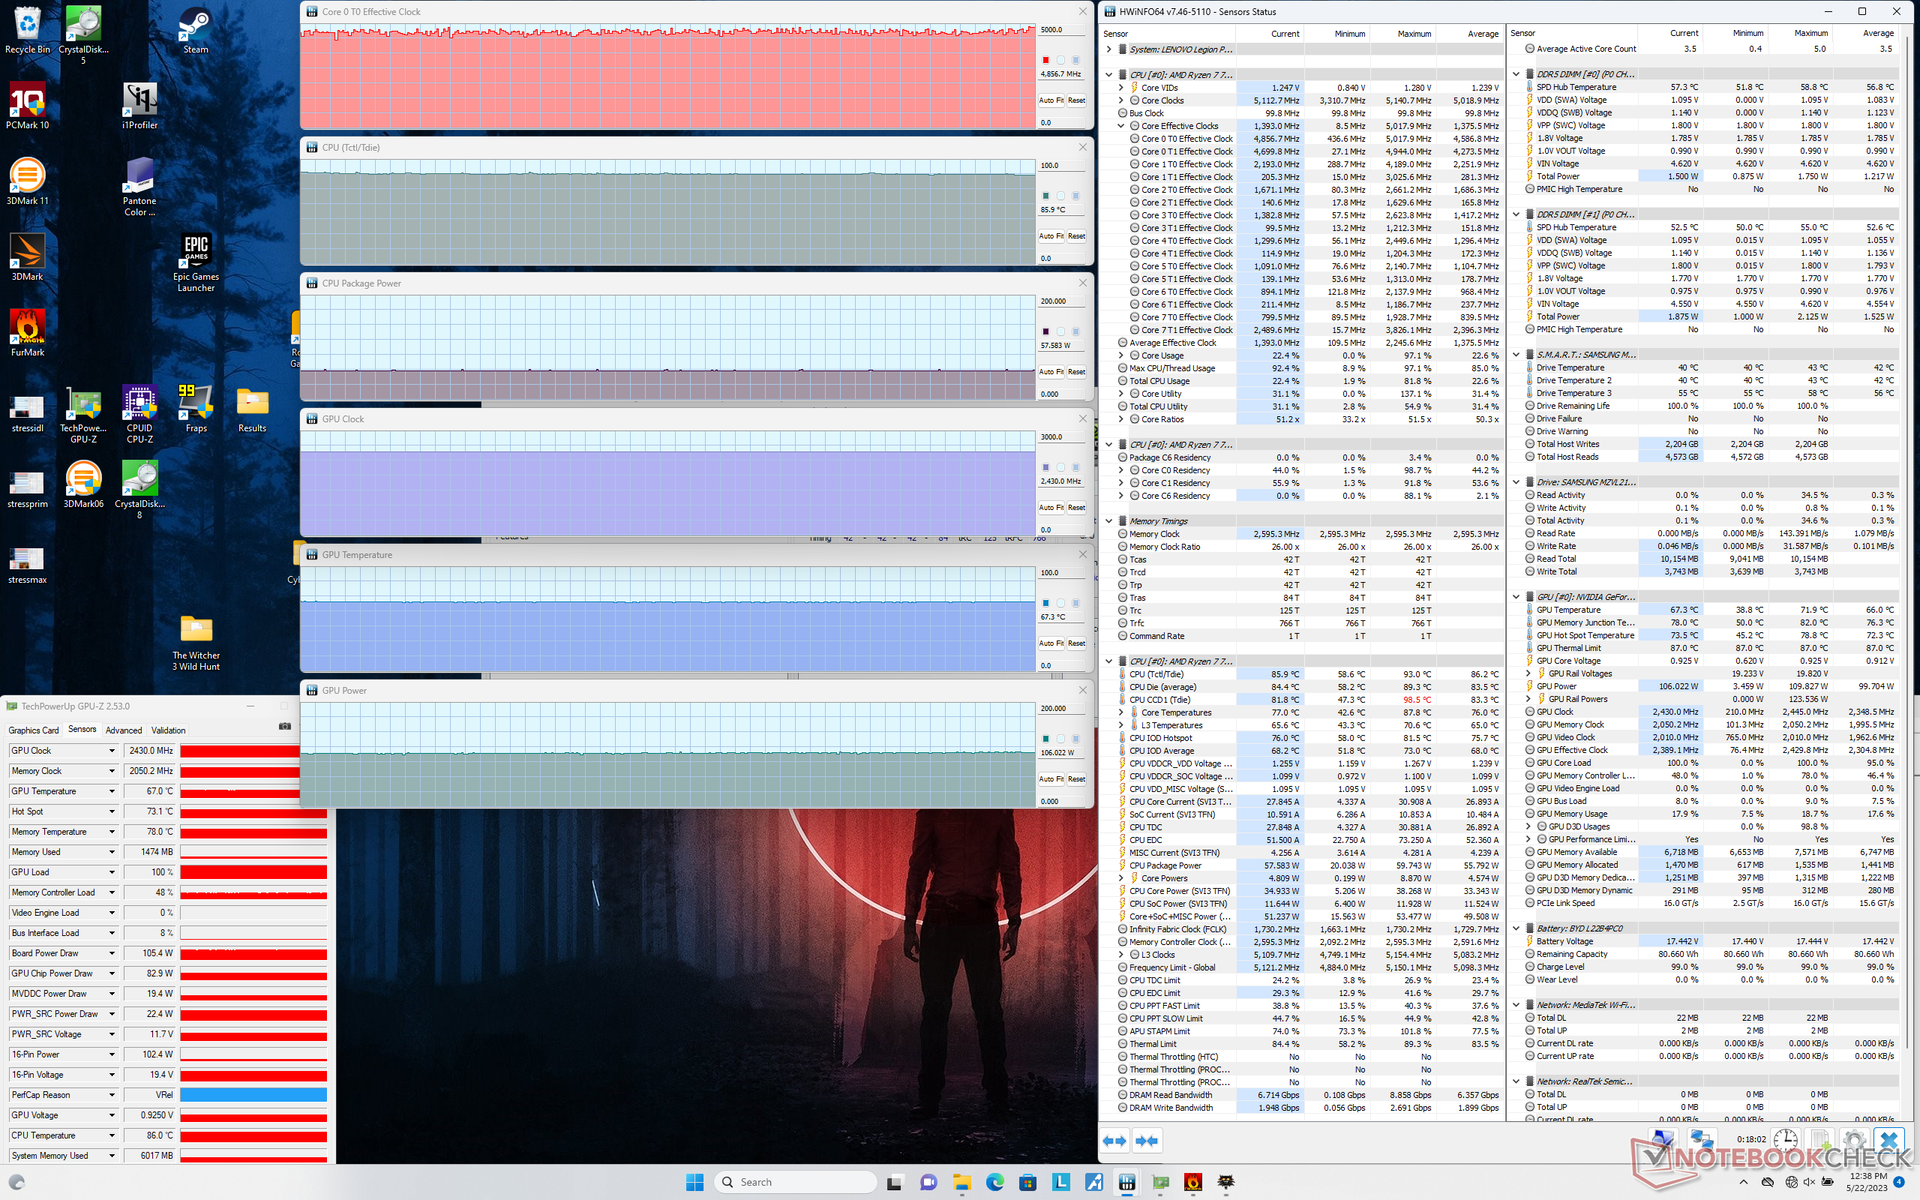
DGPU:n skulle stabilisera sig vid 2430 MHz kärna, 2050 MHz minne, 67 C och 105 W mot ett mål för TGP på 140 W när den körs Witcher 3 i prestandaläge. RTX 4060 i Intel Legion -modellen skulle också stabilisera sig mellan 105 W och 110 W eftersom båda GPU:erna ligger under liknande effektkuvert trots deras prestandaskillnader. Spel i balanserat läge med GPU-överklockningsfunktionen inaktiverad skulle resultera i en långsammare GPU-klocka på 1965 MHz och ett mycket lägre strömuttag på kortet på bara 80 W. Prestandaunderskottet mellan balanserat och prestandaläge är ungefär 10 till 15 procent som nämnts ovan.
Att köra på batteri minskar prestandan. Ett Fire Strike -test på batterier skulle ge fysik- och grafikpoäng på 10865 respektive 9334 poäng, jämfört med 11477 och 12617 poäng vid nätanslutning.
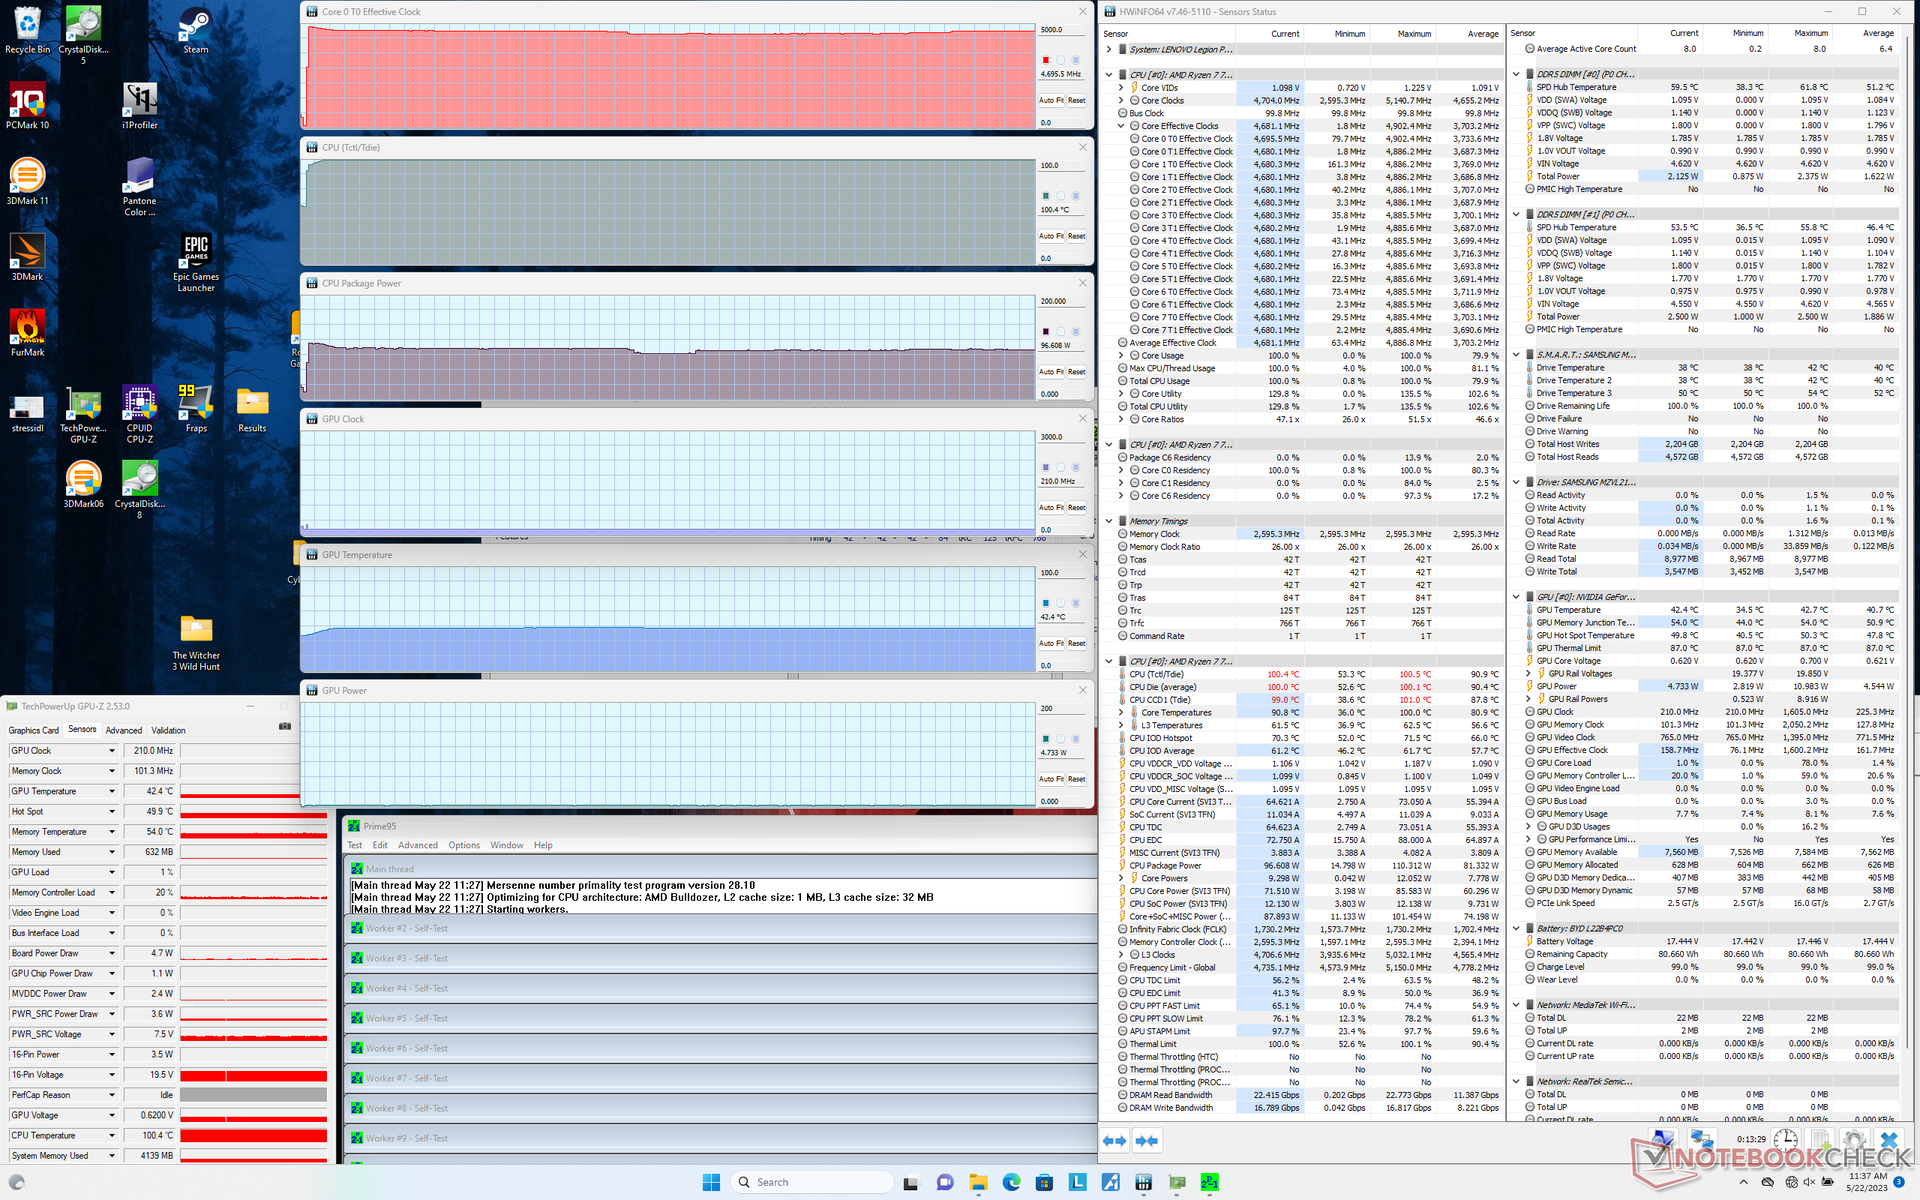
| CPU-klocka (GHz) | GPU-klocka (MHz) | Genomsnittlig CPU-temperatur (°C) | Genomsnittlig GPU-temperatur (°C) | |
| Systemets tomgång | -- | -- | 53 | 35 |
| Prime95 Stress | 4.6 - 4.7 | -- | 100 | 42 |
| Prime95 + FurMark Stress | 3,7 - 4,3 | 2250 | 92 - 100 | 69 |
| Witcher 3 Stress (prestationsläge) | 4,9 | 2430 | 86 | 67 |
| Witcher 3 Stress (balanserat läge) | 3,1 | 1965 | 84 | 62 |
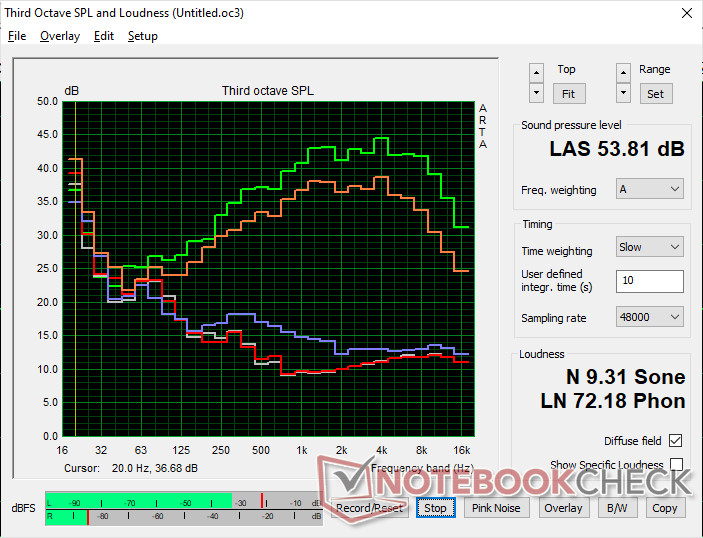
Högtalare
Lenovo Legion Pro 5 16ARX8 ljudanalys
(±) | högtalarljudstyrkan är genomsnittlig men bra (80.9 dB)
Bas 100 - 315 Hz
(-) | nästan ingen bas - i genomsnitt 24% lägre än medianen
(±) | linjäriteten för basen är genomsnittlig (13.4% delta till föregående frekvens)
Mellan 400 - 2000 Hz
(+) | balanserad mellan - endast 4.7% från medianen
(+) | mids är linjära (6.2% delta till föregående frekvens)
Högsta 2 - 16 kHz
(+) | balanserade toppar - endast 2.5% från medianen
(+) | toppar är linjära (6.2% delta till föregående frekvens)
Totalt 100 - 16 000 Hz
(±) | linjäriteten för det totala ljudet är genomsnittlig (21.9% skillnad mot median)
Jämfört med samma klass
» 79% av alla testade enheter i den här klassen var bättre, 6% liknande, 16% sämre
» Den bästa hade ett delta på 6%, genomsnittet var 18%, sämst var 132%
Jämfört med alla testade enheter
» 63% av alla testade enheter var bättre, 7% liknande, 31% sämre
» Den bästa hade ett delta på 4%, genomsnittet var 24%, sämst var 134%
Apple MacBook Pro 16 2021 M1 Pro ljudanalys
(+) | högtalare kan spela relativt högt (84.7 dB)
Bas 100 - 315 Hz
(+) | bra bas - bara 3.8% från medianen
(+) | basen är linjär (5.2% delta till föregående frekvens)
Mellan 400 - 2000 Hz
(+) | balanserad mellan - endast 1.3% från medianen
(+) | mids är linjära (2.1% delta till föregående frekvens)
Högsta 2 - 16 kHz
(+) | balanserade toppar - endast 1.9% från medianen
(+) | toppar är linjära (2.7% delta till föregående frekvens)
Totalt 100 - 16 000 Hz
(+) | det totala ljudet är linjärt (4.6% skillnad mot median)
Jämfört med samma klass
» 0% av alla testade enheter i den här klassen var bättre, 0% liknande, 100% sämre
» Den bästa hade ett delta på 5%, genomsnittet var 17%, sämst var 45%
Jämfört med alla testade enheter
» 0% av alla testade enheter var bättre, 0% liknande, 100% sämre
» Den bästa hade ett delta på 4%, genomsnittet var 24%, sämst var 134%
Energiförvaltning
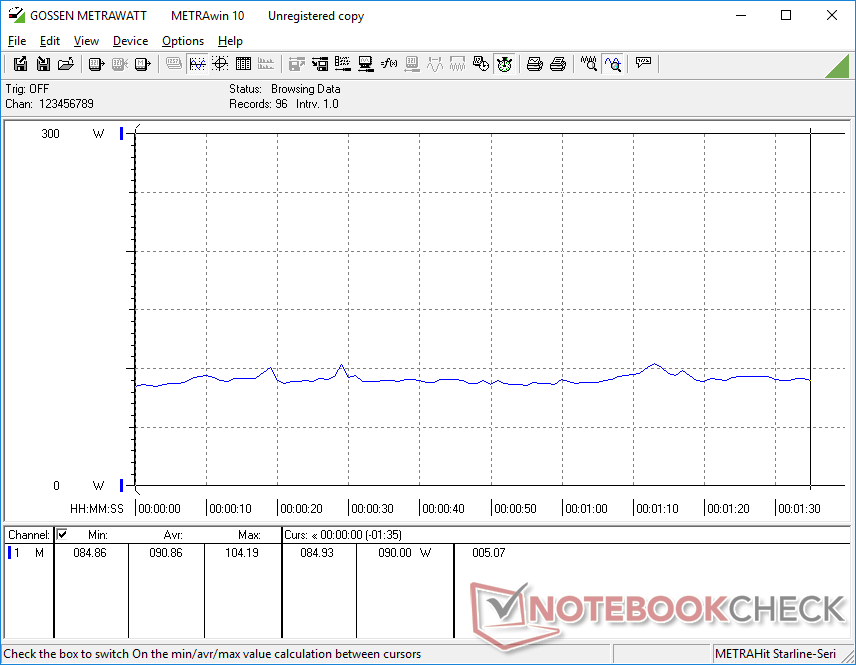
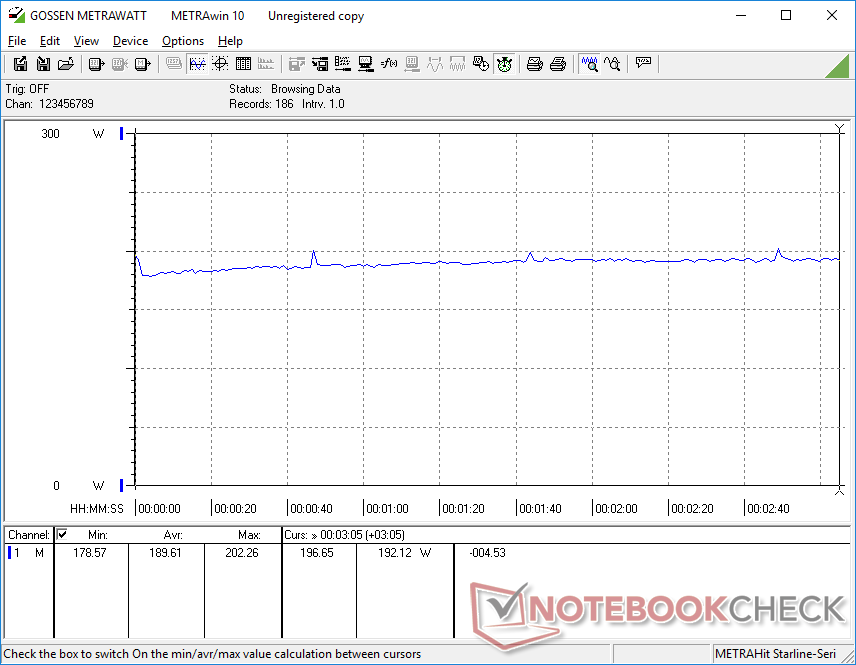
Strömförbrukning - Lägre CPU Boost än Core i7-13700HX
AMD-modellen är mer energisnål än Intel-modellen när den går på tomgång på skrivbordet. Annars kräver båda modellerna ungefär lika mycket ström när de kör högre belastningar, t.ex. spel. Båda modellerna levereras också med samma 300 W AC-adapter som ger mer än tillräckligt med utrymme för den ~140 W GPU:n och ~100 W CPU:n.
Det är värt att notera att Core i7-13700HX i Intel-modellen kan öka upp till ett kortuttag på 159 W jämfört med bara 110 W på vår Ryzen 7 7745HX, vilket delvis skulle förklara dess prestandafördel gentemot AMD:s CPU. När Turbo Boost-klockfrekvenserna lugnar ner sig efter ett par minuters belastning skulle dock strömförbrukningen mellan de två modellerna bli mycket närmare varandra, vilket framgår av jämförelsediagrammen nedan. När Intel- och AMD-modellerna kör Prime95 i några minuter stabiliseras de till exempel på 158 W respektive 149 W, även om Intel-modellen kan öka till så mycket som 220 W i början av testet.
| Av/Standby | |
| Låg belastning | |
| Hög belastning |
|
Förklaring:
min: | |
| Lenovo Legion Pro 5 16ARX8 R7 7745HX, GeForce RTX 4070 Laptop GPU, Samsung PM9A1 MZVL21T0HCLR, IPS, 2560x1600, 16" | Lenovo Legion Pro 5 16IRX8 i7-13700HX, GeForce RTX 4060 Laptop GPU, SK hynix PC801 HFS512GEJ9X115N, IPS, 2560x1600, 16" | Uniwill GM6PX7X RTX 4070 i7-13700HX, GeForce RTX 4070 Laptop GPU, Samsung PM9A1 MZVL2512HCJQ, IPS, 2560x1600, 16" | Schenker XMG Neo 16 E23 i9-13900HX, GeForce RTX 4090 Laptop GPU, Crucial P5 Plus 1TB CT1000P5PSSD8, IPS, 2560x1600, 16" | Asus ROG Strix G16 G614JZ i9-13980HX, GeForce RTX 4080 Laptop GPU, WD PC SN560 SDDPNQE-1T00, IPS, 2560x1600, 16" | Asus Zephyrus Duo 16 GX650PY-NM006W R9 7945HX, GeForce RTX 4090 Laptop GPU, SK hynix PC801 HFS002TEJ9X101N, MiniLED, 2560x1600, 16" | |
|---|---|---|---|---|---|---|
| Power Consumption | -46% | -13% | -23% | -17% | -51% | |
| Idle Minimum * (Watt) | 8.1 | 24.5 -202% | 12.6 -56% | 8 1% | 10 -23% | 19.2 -137% |
| Idle Average * (Watt) | 15.9 | 29.2 -84% | 17.7 -11% | 18 -13% | 16 -1% | 29.7 -87% |
| Idle Maximum * (Watt) | 37.2 | 34.3 8% | 31.8 15% | 28 25% | 27 27% | 30.8 17% |
| Load Average * (Watt) | 90.9 | 98.7 -9% | 101.4 -12% | 133 -46% | 129 -42% | 126 -39% |
| Witcher 3 ultra * (Watt) | 189.6 | 178.6 6% | 185.3 2% | 294 -55% | 247 -30% | 258 -36% |
| Load Maximum * (Watt) | 263.5 | 249.6 5% | 298 -13% | 399 -51% | 342 -30% | 330 -25% |
* ... mindre är bättre
Power Consumption Witcher 3 / Stresstest
Power Consumption external Monitor
Batteritid
WLAN-körtiden är bara något längre än Intel-versionen med cirka 30 minuter när den är inställd på Balanced power-profilen med iGPU aktiv. Även om det inte är dåligt för en bärbar dator för spel, kan alternativ som Schenker XMG Neo 16 ellerAsus ROG Strix G16 har batterier med större kapacitet och längre drifttid med över två timmar vardera.
Laddningen från tom till full kapacitet med den medföljande nätadaptern går snabbt på cirka 1 till 1,5 timme. Snabbladdning är aktiverad som standard till skillnad från äldre Legion - eller Yogamodeller där den kan vara inaktiverad. Laddning med USB-C-adaptrar från tredje part stöds endast på USB-C-porten längs baksidan.
| Lenovo Legion Pro 5 16ARX8 R7 7745HX, GeForce RTX 4070 Laptop GPU, 80 Wh | Lenovo Legion Pro 5 16IRX8 i7-13700HX, GeForce RTX 4060 Laptop GPU, 80 Wh | Uniwill GM6PX7X RTX 4070 i7-13700HX, GeForce RTX 4070 Laptop GPU, 62 Wh | Schenker XMG Neo 16 E23 i9-13900HX, GeForce RTX 4090 Laptop GPU, 99 Wh | Asus ROG Strix G16 G614JZ i9-13980HX, GeForce RTX 4080 Laptop GPU, 90 Wh | Asus Zephyrus Duo 16 GX650PY-NM006W R9 7945HX, GeForce RTX 4090 Laptop GPU, 90 Wh | |
|---|---|---|---|---|---|---|
| Batteridrifttid | -14% | 0% | 68% | 76% | 0% | |
| Reader / Idle (h) | 6.5 | 6.7 3% | ||||
| WiFi v1.3 (h) | 4 | 3.4 -15% | 4 0% | 6.7 68% | 9.7 142% | 4 0% |
| Load (h) | 1 | 0.7 -30% | 1.1 10% | 1 0% | ||
| H.264 (h) | 5.8 | 3.8 | ||||
| Witcher 3 ultra (h) | 1.4 |
För
Emot
Slutsats - AMD är det bättre alternativet för spelare
Lenovo har två mycket intressanta alternativ här: Intel Core i7-13700HX Legion Pro 5 16 med RTX 4060-grafik för 1 600 USD eller AMD Ryzen 7 7745HX Legion Pro 5 16 med RTX 4070-grafik - också för 1 600 USD. Den förstnämnda erbjuder cirka 10 procent snabbare CPU-prestanda till priset av 15 procent långsammare GPU-prestanda medan den sistnämnda är tvärtom. Nästan allt annat om de två alternativen är identiskt eftersom de båda har samma chassidesign. Användare som värderar CPU-prestanda högre än GPU:n kan alltså välja Intel-alternativet medan användare som värderar GPU:n högre kan välja AMD-alternativet.
Eftersom Legion Pro 5 16 först och främst är en bärbar dator för spel kommer majoriteten av användarna att vilja välja AMD-alternativet för den snabbare RTX 4070-grafiken. Nästan alla de senaste spelen är GPU-bundna och därför skulle eventuella ytterligare fördelar i fråga om CPU-prestanda jämfört med Ryzen 7 7745HX endast ha minimal inverkan på spelupplevelsen. I det här scenariot är det relativt höga priset på 1 600 dollar bättre motiverat eftersom användarna får ett RTX 4070 i stället för det långsammare RTX 4060.
Pris och tillgänglighet
Lenovo levererar för närvarande sin Legion Pro 5 16 Gen 8 från 1 280 USD för baskonfigurationen Ryzen 5/RTX 4050 till 1 600 USD för vår Ryzen 7/RTX 4070-konfiguration. Modellen är ännu inte allmänt tillgänglig via stora återförsäljare som Best Buy eller Amazon i skrivande stund.
Lenovo Legion Pro 5 16ARX8
- 05/24/2023 v7 (old)
Allen Ngo
Genomskinlighet
Valet av enheter som ska granskas görs av vår redaktion. Testprovet gavs till författaren som ett lån av tillverkaren eller återförsäljaren för denna recension. Långivaren hade inget inflytande på denna recension och inte heller fick tillverkaren en kopia av denna recension innan publiceringen. Det fanns ingen skyldighet att publicera denna recension. Som ett oberoende medieföretag är Notebookcheck inte föremål för auktoritet från tillverkare, återförsäljare eller förlag.
This is how Notebookcheck is testingEvery year, Notebookcheck independently reviews hundreds of laptops and smartphones using standardized procedures to ensure that all results are comparable. We have continuously developed our test methods for around 20 years and set industry standards in the process. In our test labs, high-quality measuring equipment is utilized by experienced technicians and editors. These tests involve a multi-stage validation process. Our complex rating system is based on hundreds of well-founded measurements and benchmarks, which maintains objectivity.
Price comparison

