HP Pavilion Plus 16 recension: Premium multimedia laptop som kunde ha dragit nytta av en RTX 4050
 i kortrecension")
HP lanserade nyligen två nya Pavilion Plus-modeller som ett mer prisvärt alternativ till Envy-serien. Vi har tidigare granskat Pavilion Plus 14 i både Intel Raptor Lake och AMD Zen 4 varianter. Nu tar vi en titt på den större Pavilion Plus 16.
Pavilion Plus 16 avstår från den "IMAX Enhanced" OLED-panelen i Pavilion Plus 14 men erbjuder istället en processor i H-serien och valfri Nvidia-grafik.
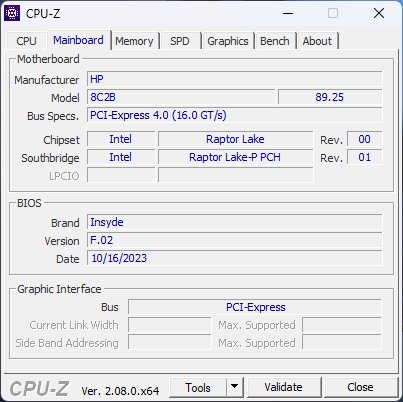
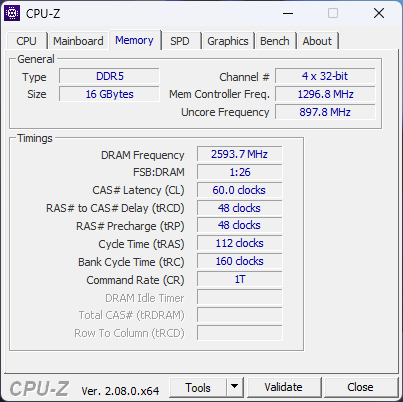
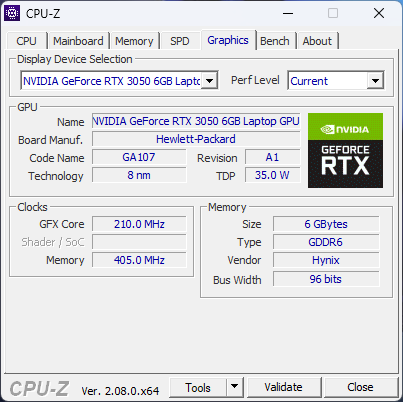
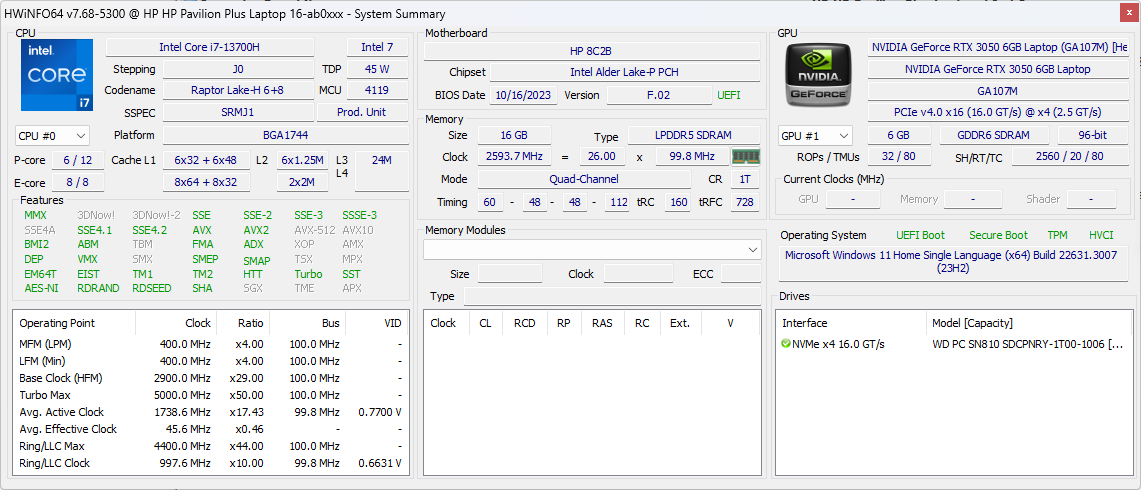
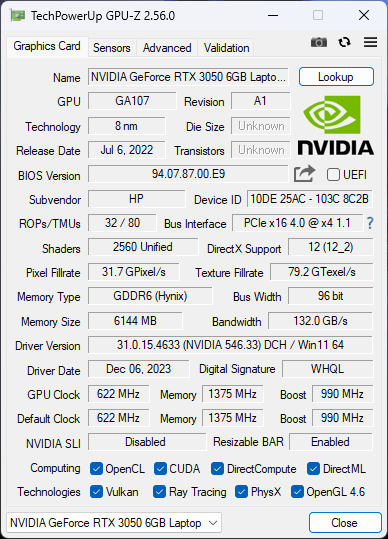
Vår Pavilion Plus 16-enhet har en Intel Core i7-13700H processor tillsammans med 16 GB RAM-minne, 1 TB SSD och en 16-tums IPS-skärm på 2560 x 1600 120 Hz. Pavilion Plus 16 är en av de få bärbara datorer som har Nvidia GeForce RTX 3050 6 GB GPU för bärbar dator. Denna konfiguration kostar 1 24 999 ₹ (1 350 USD) i den officiella HP India-butiken.
Potentiella konkurrenter i jämförelse
Gradering | Datum | Modell | Vikt | Höjd | Storlek | Upplösning | Pris |
|---|---|---|---|---|---|---|---|
| 88.7 % v7 (old) | 02/2024 | HP Pavilion Plus 16-ab0456tx i7-13700H, GeForce RTX 3050 6GB Laptop GPU | 1.9 kg | 19.9 mm | 16.00" | 2560x1600 | |
| 88.2 % v7 (old) | 01/2024 | Schenker Vision 14 M23 RTX 3050 i7-13700H, GeForce RTX 3050 6GB Laptop GPU | 1.3 kg | 16.6 mm | 14.00" | 2880x1800 | |
| 87.1 % v7 (old) | 08/2023 | Dell Inspiron 16 Plus 7630 i7-13700H, GeForce RTX 4060 Laptop GPU | 2.2 kg | 19.95 mm | 16.00" | 2560x1600 | |
| 85.6 % v7 (old) | 08/2023 | Asus VivoBook 14X K3405 i5-13500H, GeForce RTX 3050 4GB Laptop GPU | 1.4 kg | 18.9 mm | 14.00" | 2880x1800 | |
| 89.2 % v7 (old) | 04/2023 | Lenovo Slim Pro 7 14ARP8 R7 7735HS, GeForce RTX 3050 6GB Laptop GPU | 1.6 kg | 15.6 mm | 14.50" | 2560x1600 | |
| 87.6 % v7 (old) | 11/2023 | Asus VivoBook Pro 16 K6602VU i9-13900H, GeForce RTX 4050 Laptop GPU | 1.9 kg | 19 mm | 16.00" | 3200x2000 | |
| 89.4 % v7 (old) | 04/2023 | Samsung Galaxy Book3 Ultra 16 i7-13700H, GeForce RTX 4050 Laptop GPU | 1.8 kg | 16.5 mm | 16.00" | 2880x1800 |
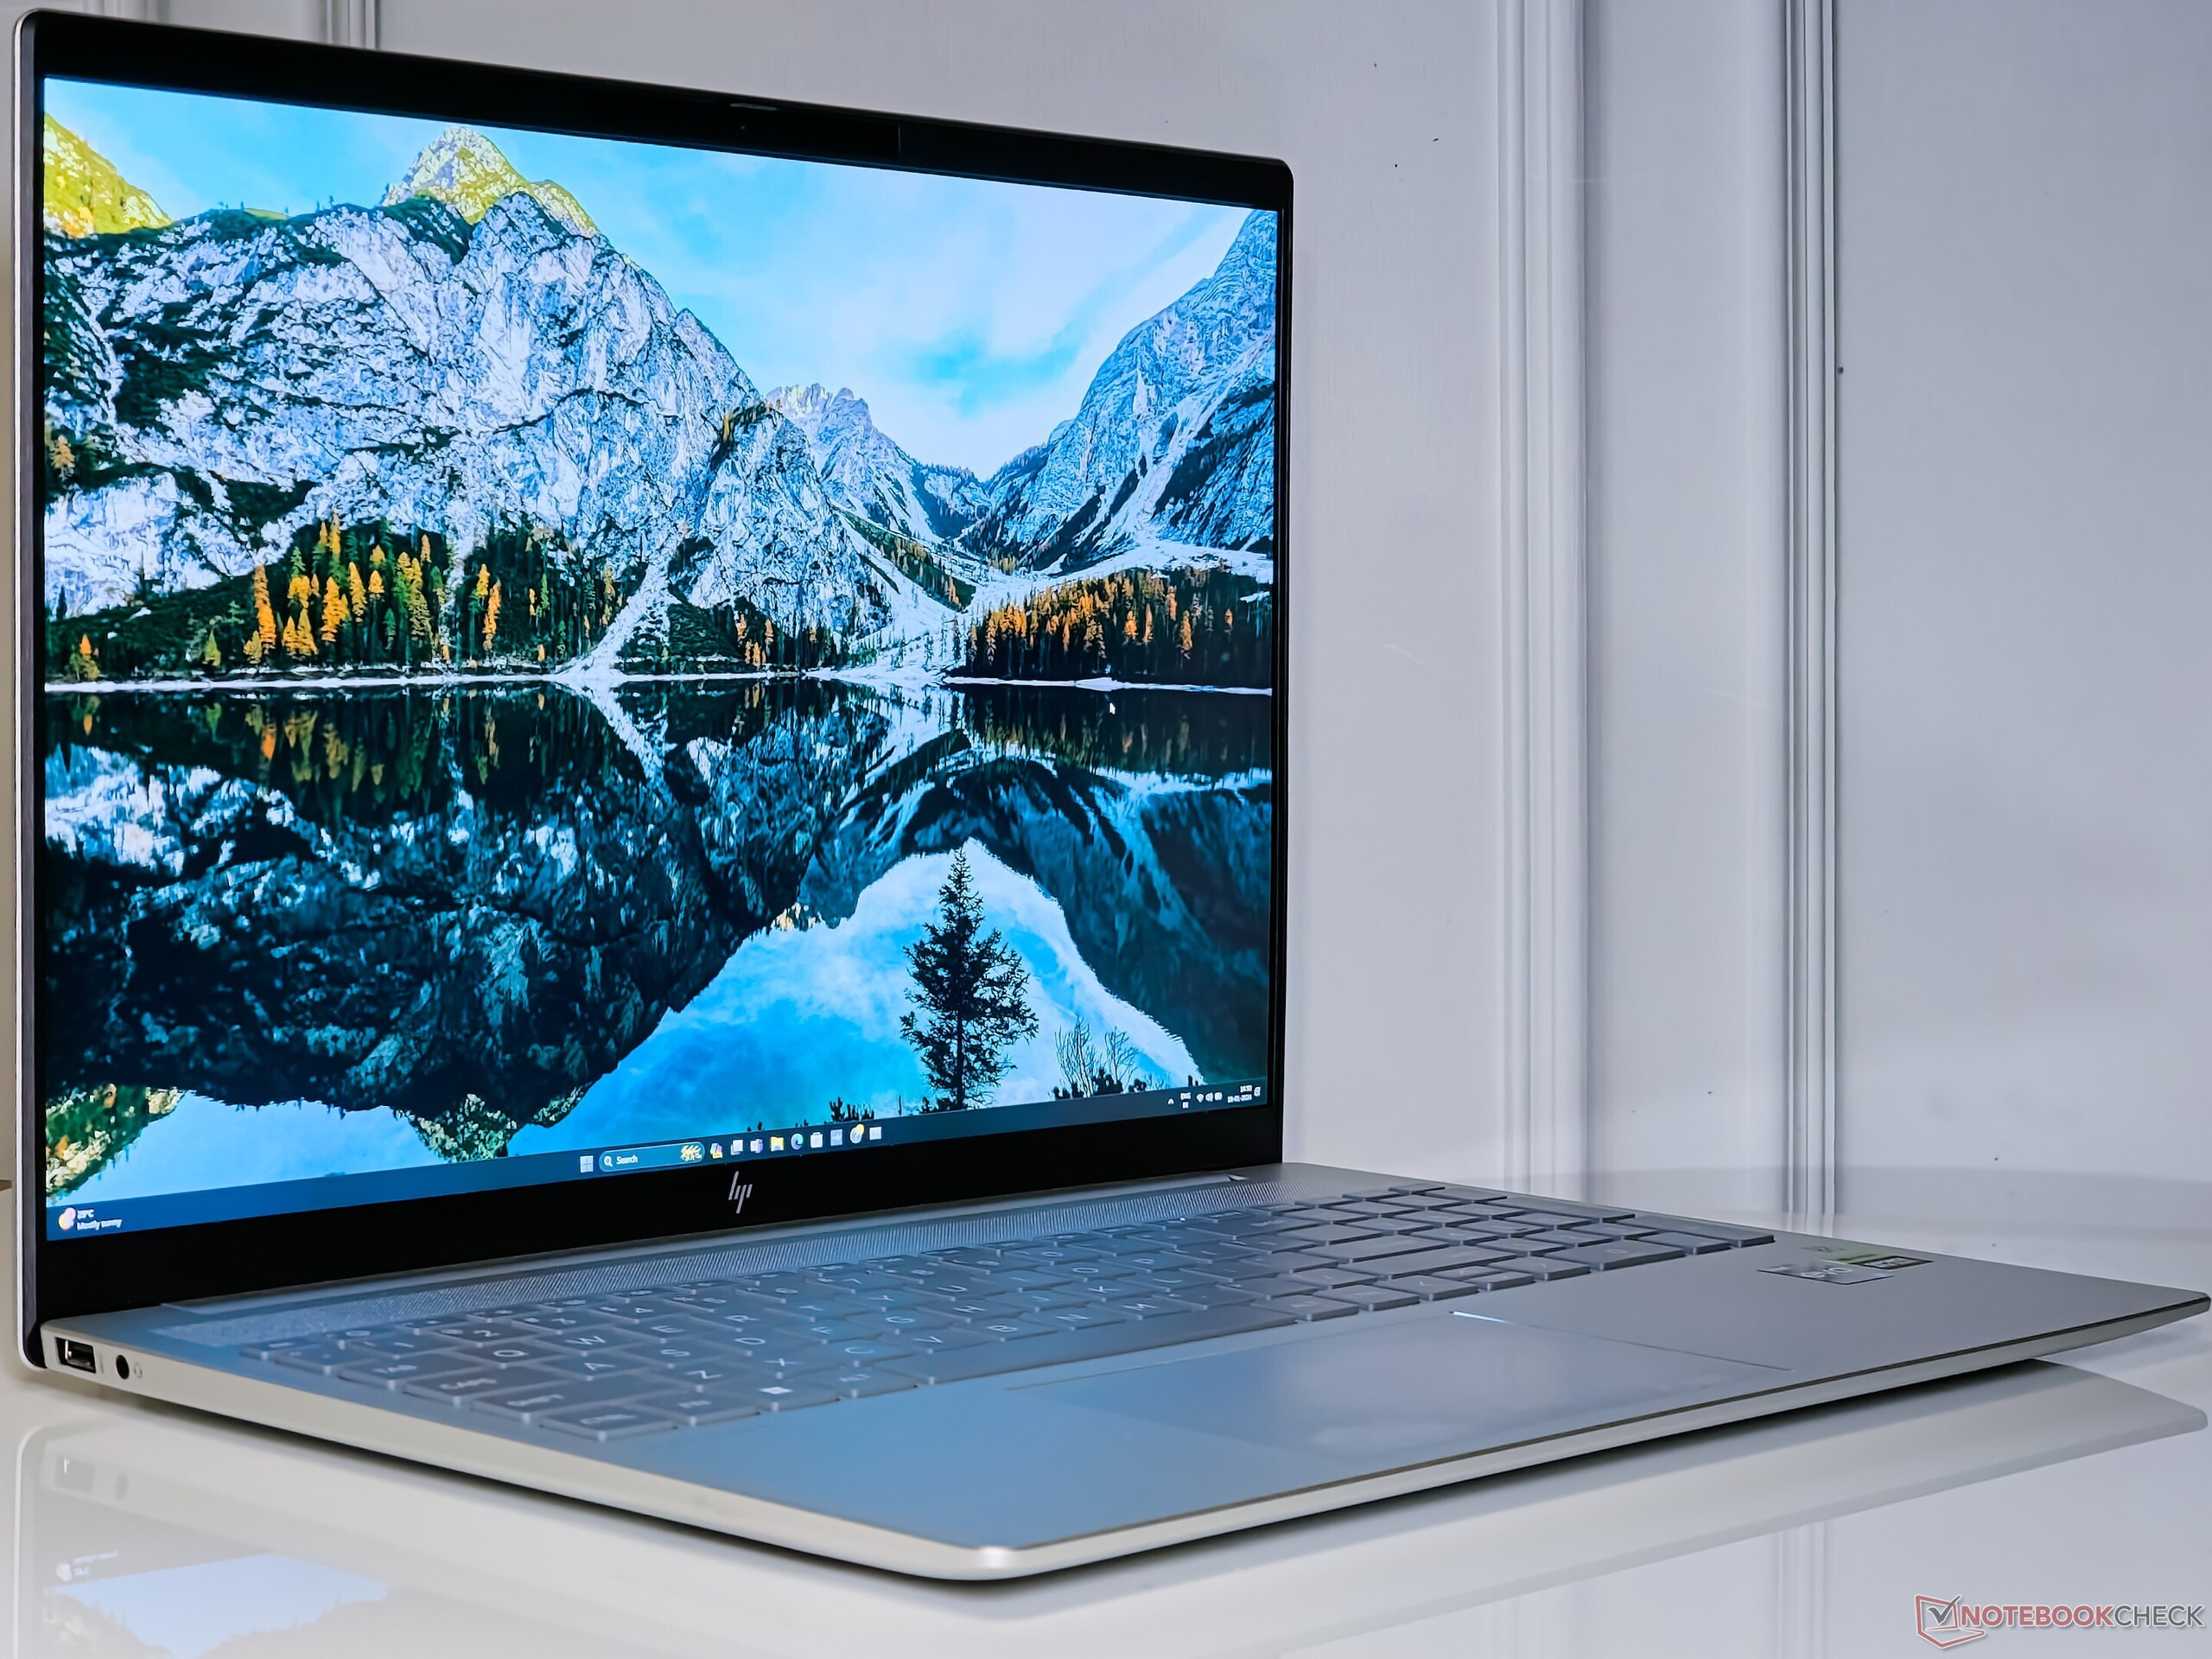
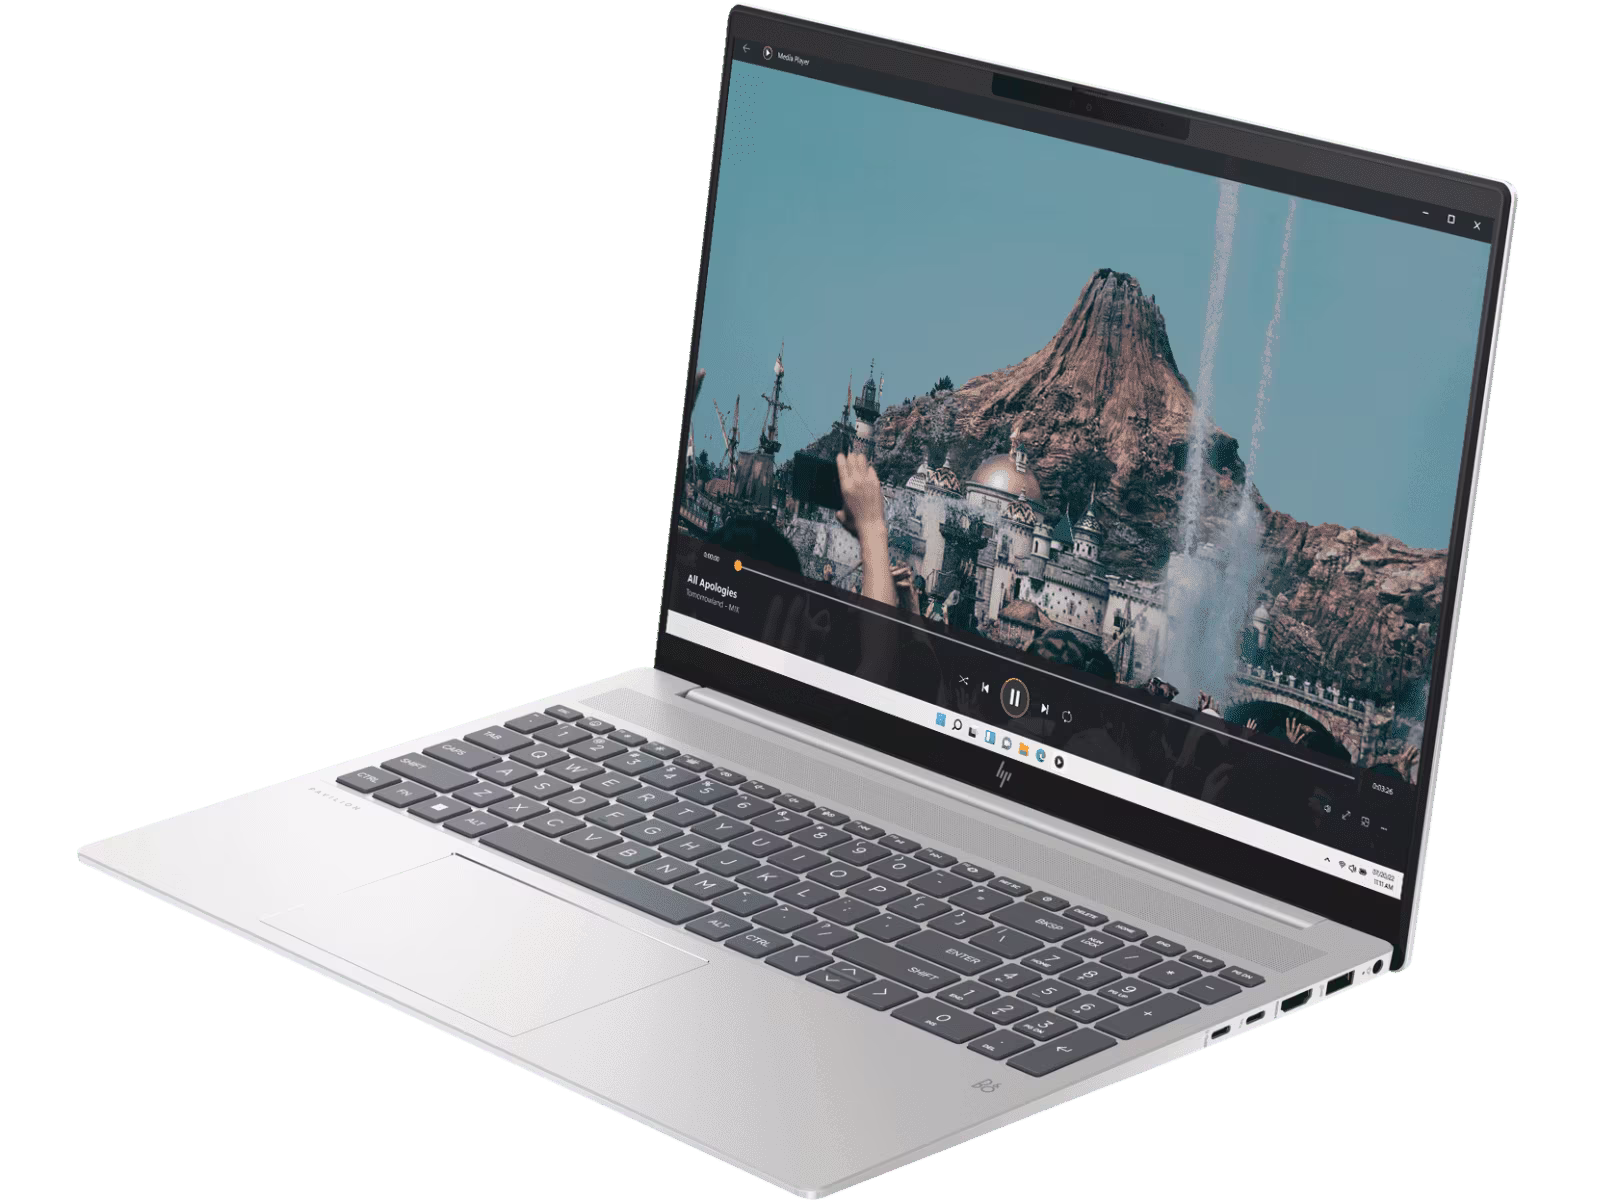
Chassi: Robust konstruktion helt i metall
I likhet med Pavilion Plus 14 har Pavilion Plus 16 en Natural Silver-metallkonstruktion för A-, C- och D-locken medan locket är tillverkat av aluminium.
Den övergripande byggkvaliteten lämnar lite utrymme för klagomål. Vi märkte inte av någon speciell flexibilitet i locket eller tangentbordsdäcket.
HP annonserar ett förhållande mellan skärm och kropp på 89,74%, men det uppmätta värdet uppgår till 83%. Med 1,9 kg väger den bärbara datorn ungefär som andra 16-tums multimedia-bärbara datorer på modet.
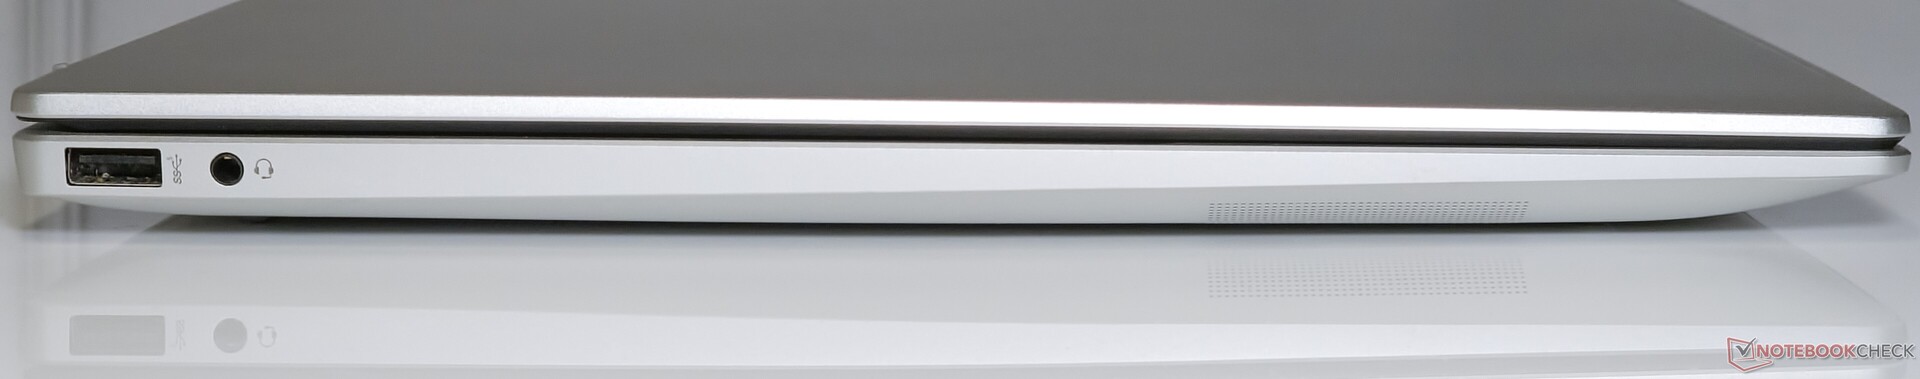
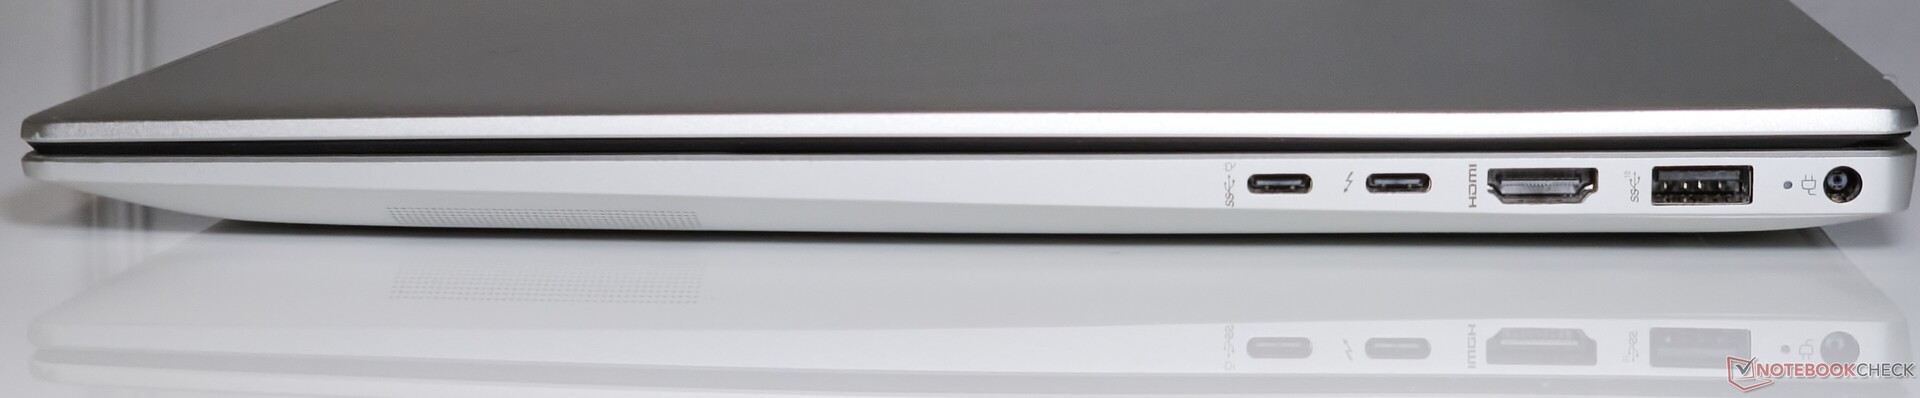
Anslutningsmöjligheter: Konsekvent genomströmning i WLAN
Pavilion Plus 16 erbjuder ett anständigt portval som inkluderar USB Type-A och USB Type-C-portar inklusive Thunderbolt 4.
Portplaceringen är bra och hindrar inte anslutningen av kringutrustning, men en av Type-C-portarna kunde ha varit på vänster sida för en jämnare fördelning.
Kommunikation
Pavilion Plus 16:s iPerf3-prestanda i 5 GHz-bandet är lite långsammare än vad vi observerar med Asus VivoBook Pro 16 med samma Intel Wi-Fi 6E AX211 WLAN-kort.
Pavilion kompenserar för denna brist mot VivoBook Pro 16 i 6 GHz mottagningsprestanda men inte mycket.
iPerf3-prestanda i både 5 GHz- och 6 GHz-banden är ganska konsekvent utan några hicka till skillnad från vad vi ser med Lenovo Slim Pro 7 med ett MediaTek Wi-Fi 6E MT7922-chip.
| Networking / iperf3 transmit AXE11000 | |
| Asus VivoBook 14X K3405 | |
| HP Pavilion Plus 16-ab0456tx | |
| Asus VivoBook Pro 16 K6602VU | |
| Samsung Galaxy Book3 Ultra 16 | |
| Genomsnitt av klass Multimedia (606 - 1978, n=56, senaste 2 åren) | |
| Lenovo Slim Pro 7 14ARP8 | |
| Dell Inspiron 16 Plus 7630 | |
| Genomsnitt Intel Wi-Fi 6E AX211 (64 - 1921, n=276) | |
| Networking / iperf3 receive AXE11000 | |
| Asus VivoBook 14X K3405 | |
| Asus VivoBook Pro 16 K6602VU | |
| HP Pavilion Plus 16-ab0456tx | |
| Samsung Galaxy Book3 Ultra 16 | |
| Lenovo Slim Pro 7 14ARP8 | |
| Genomsnitt Intel Wi-Fi 6E AX211 (582 - 1890, n=276) | |
| Genomsnitt av klass Multimedia (682 - 1818, n=56, senaste 2 åren) | |
| Dell Inspiron 16 Plus 7630 | |
| Networking / iperf3 transmit AXE11000 6GHz | |
| HP Pavilion Plus 16-ab0456tx | |
| Dell Inspiron 16 Plus 7630 | |
| Genomsnitt av klass Multimedia (869 - 2373, n=23, senaste 2 åren) | |
| Asus VivoBook 14X K3405 | |
| Asus VivoBook Pro 16 K6602VU | |
| Genomsnitt Intel Wi-Fi 6E AX211 (385 - 1851, n=226) | |
| Networking / iperf3 receive AXE11000 6GHz | |
| HP Pavilion Plus 16-ab0456tx | |
| Genomsnitt av klass Multimedia (1212 - 2361, n=23, senaste 2 åren) | |
| Asus VivoBook Pro 16 K6602VU | |
| Asus VivoBook 14X K3405 | |
| Genomsnitt Intel Wi-Fi 6E AX211 (700 - 1857, n=226) | |
| Dell Inspiron 16 Plus 7630 | |
Webbkamera
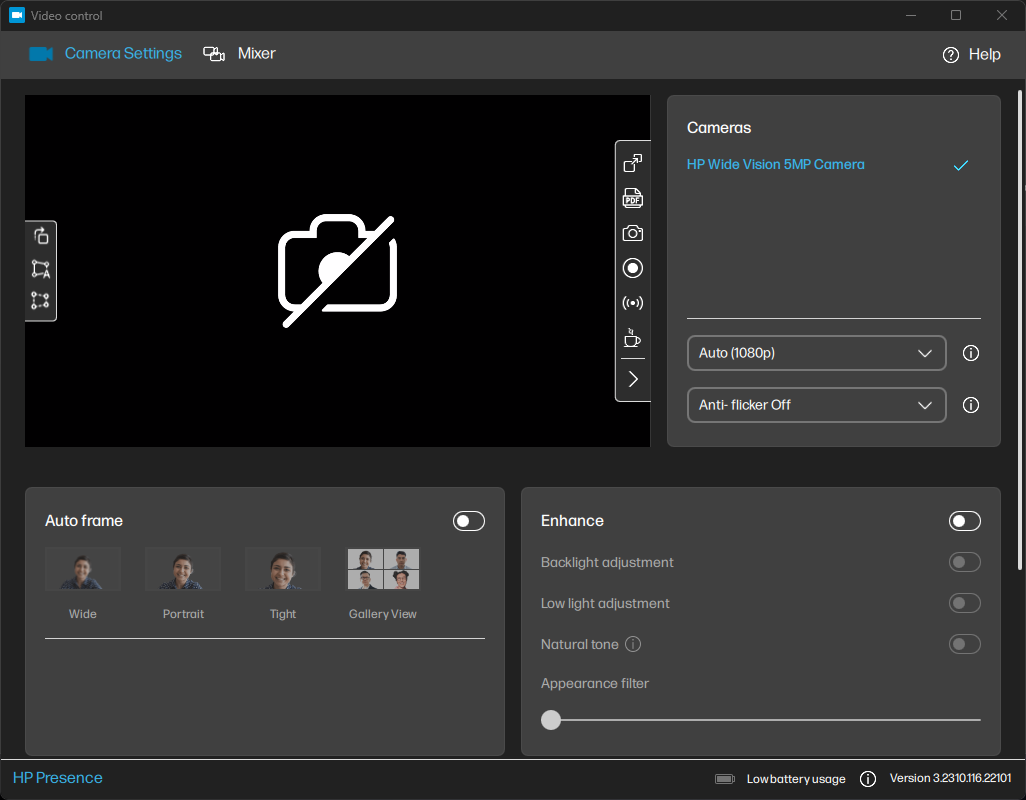
Webbkameran på 5 MP ger hyfsade bilder som är ganska användbara för videokonferenser. Detaljerna är ganska välbevarade för att vara en webbkamera i en bärbar dator, men kameran kan ha problem med svagt ljus.
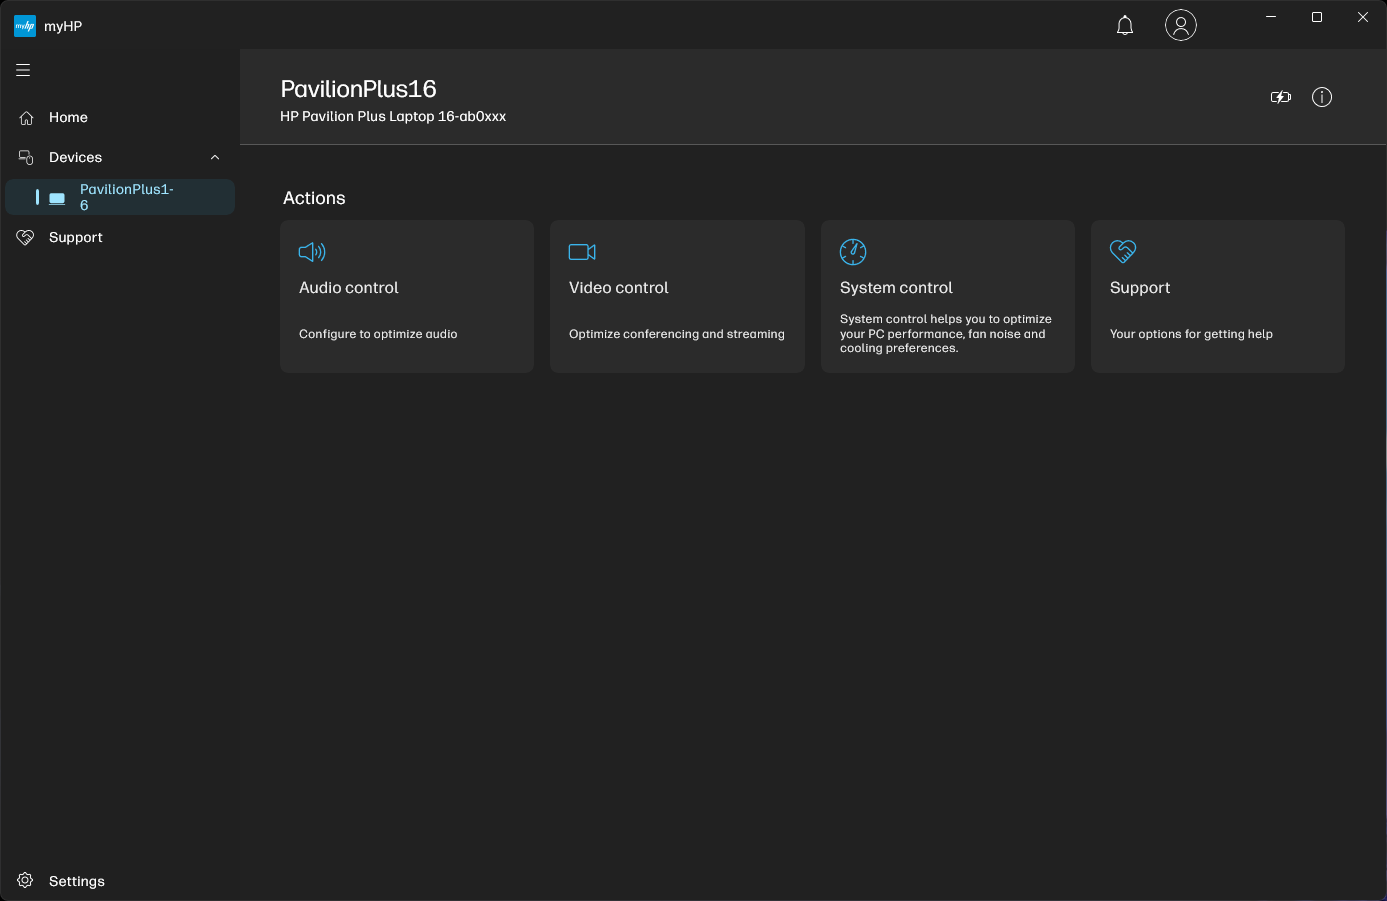
HP tillhandahåller några smarta verktyg som HP Enhanced Lighting som gör skärmen ljusare runt motivet och en Video Control-app som erbjuder ytterligare alternativ för inramning och bildjustering.


Säkerhet
HP tillhandahåller en Windows Hello-kompatibel IR-kamera för Pavilion Plus 16 tillsammans med en sekretesslucka för webbkameran. IR-kameran fungerade relativt snabbt under vår tid med enheten.
Dessutom finns en TPM 2.0-modul för att uppfylla säkerhetskraven i Windows 11.
Tillbehör och garanti
Det finns inga ytterligare tillbehör i förpackningen förutom 135 W nätadaptern och det vanliga pappersarbetet.
HP erbjuder ett års garanti för Pavilion Plus 16 i Indien. Köpare kan förlänga denna garanti med upp till tre år genom att köpa kvalificerade HP Care Packs.
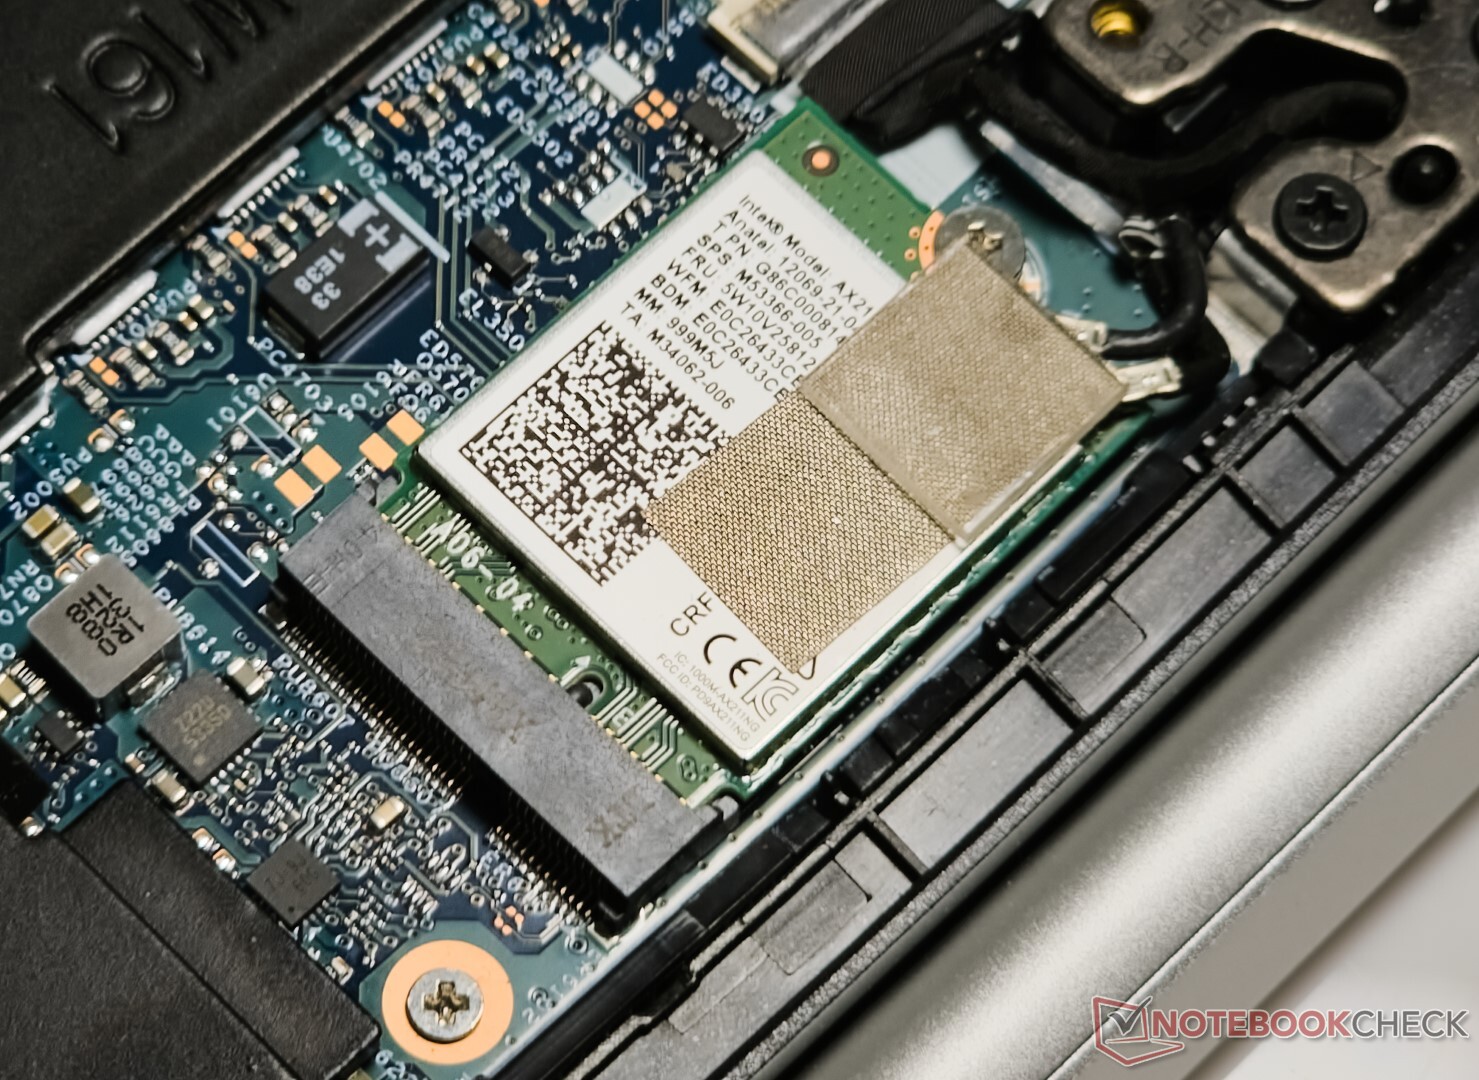
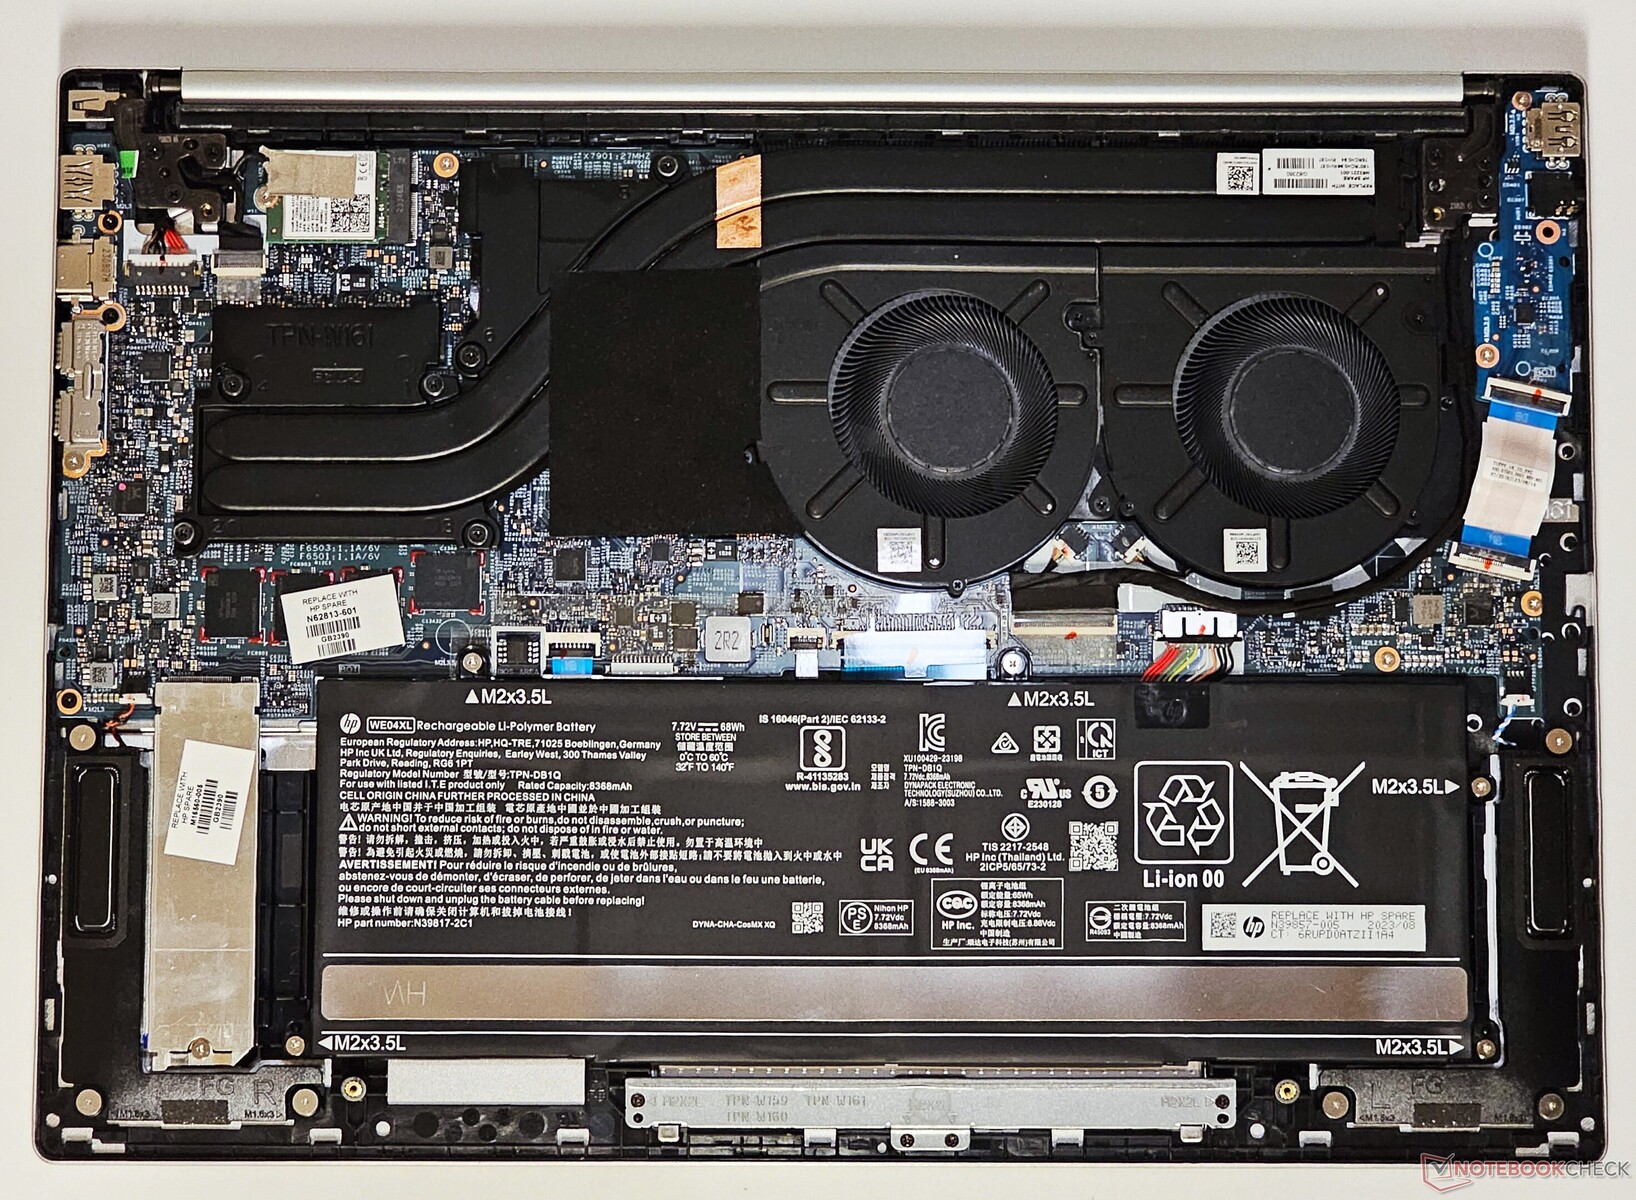
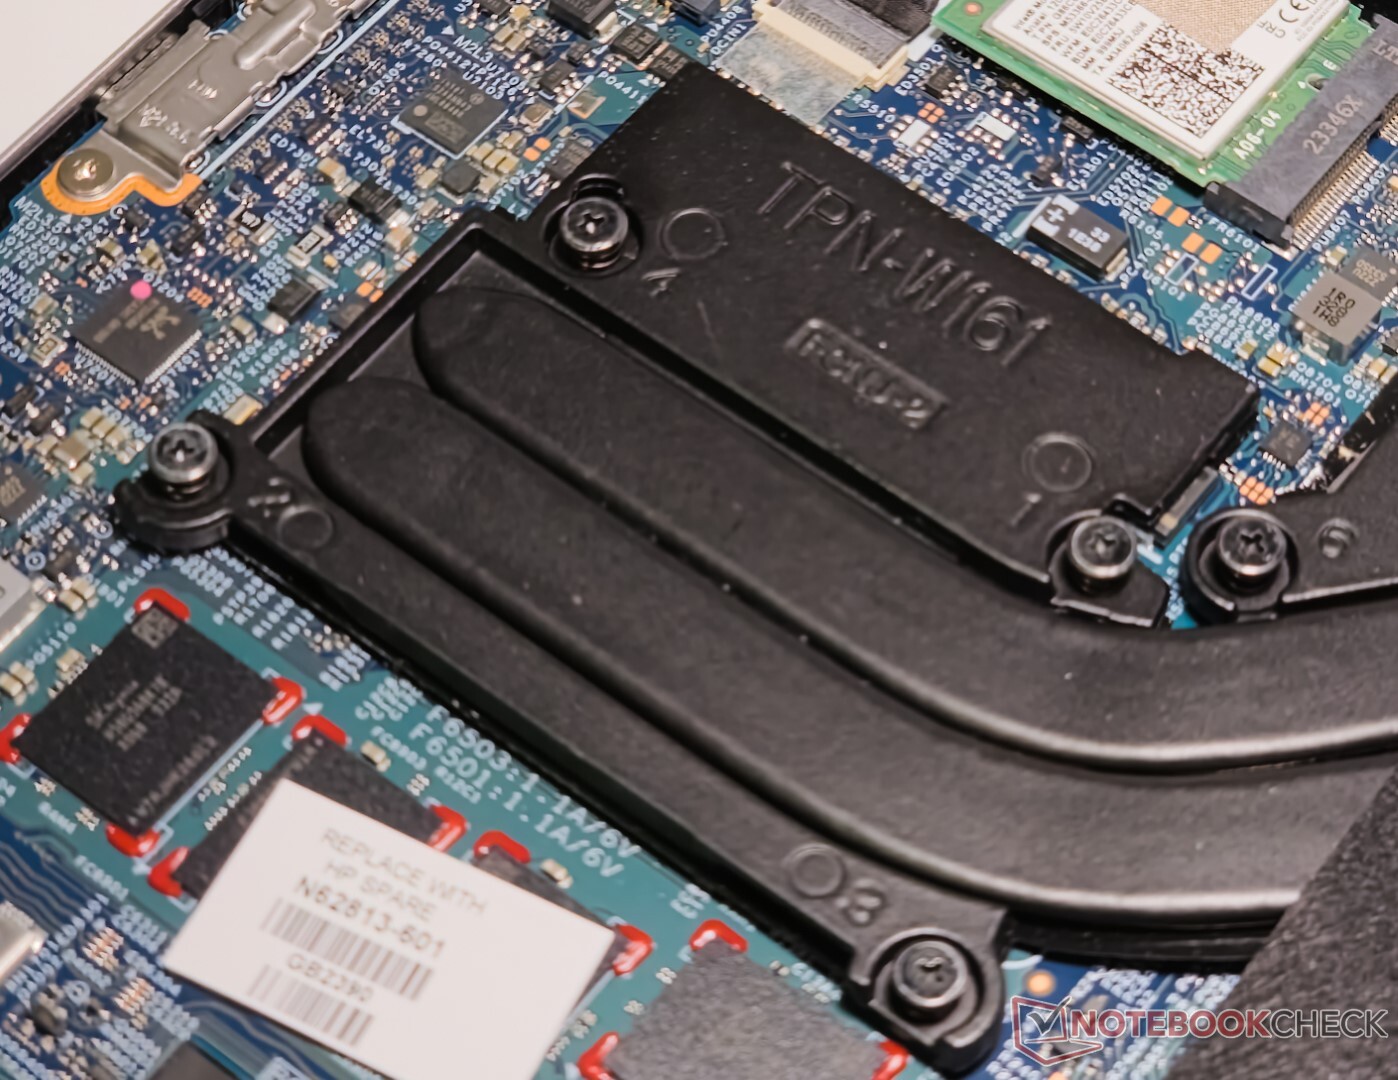
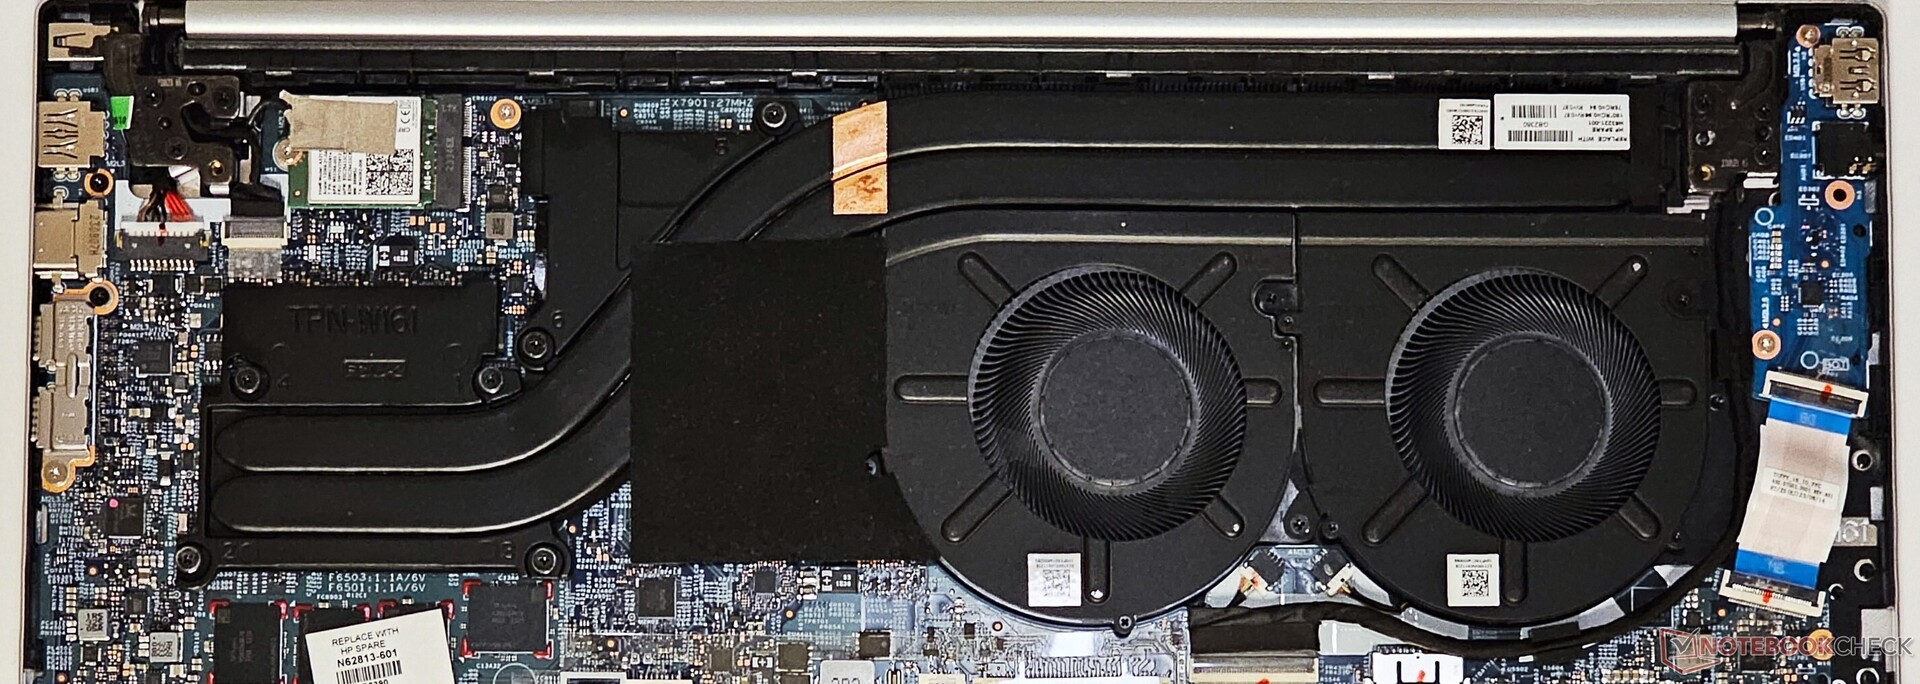
Underhåll
Bottenpanelen kan öppnas efter att de fyra PH0-skruvarna har tagits bort. Minnet är fastlödd, men WLAN-kortet, NVMe SSD och batteripaketet kan bytas ut vid behov.
Inmatningsenheter: Fullstor numpad med hyfsad taktilitet
Tangentbord
Tangentbordet på Pavilion Plus 16 erbjuder en anständig skrivupplevelse. De grå tangentknapparna ger bra kontrast till chassits färg Natural Silver. Nummerplattan är rymlig och kommer väl till pass när du räknar i Excel. Det saknar dock en Num Lock-indikator.
Strömknappen är placerad precis bredvid Delete-tangenten, vilket kan förvirra förstagångsanvändare. De övre och nedre piltangenterna känns också trånga. En vit bakgrundsbelysning i tre steg hjälper till med läsbarheten i svagt ljus.
Pekplatta
Pekplattan på 12,5 cm x 8 cm känns rymlig och ger en smidig glidupplevelse med bra återkoppling. Rörelsen är dock inte lika djup.
Hela pekplattan fungerar som vänster musknapp. Klick mot mitten och basen av pekplattan är mer responsiva än de överst.
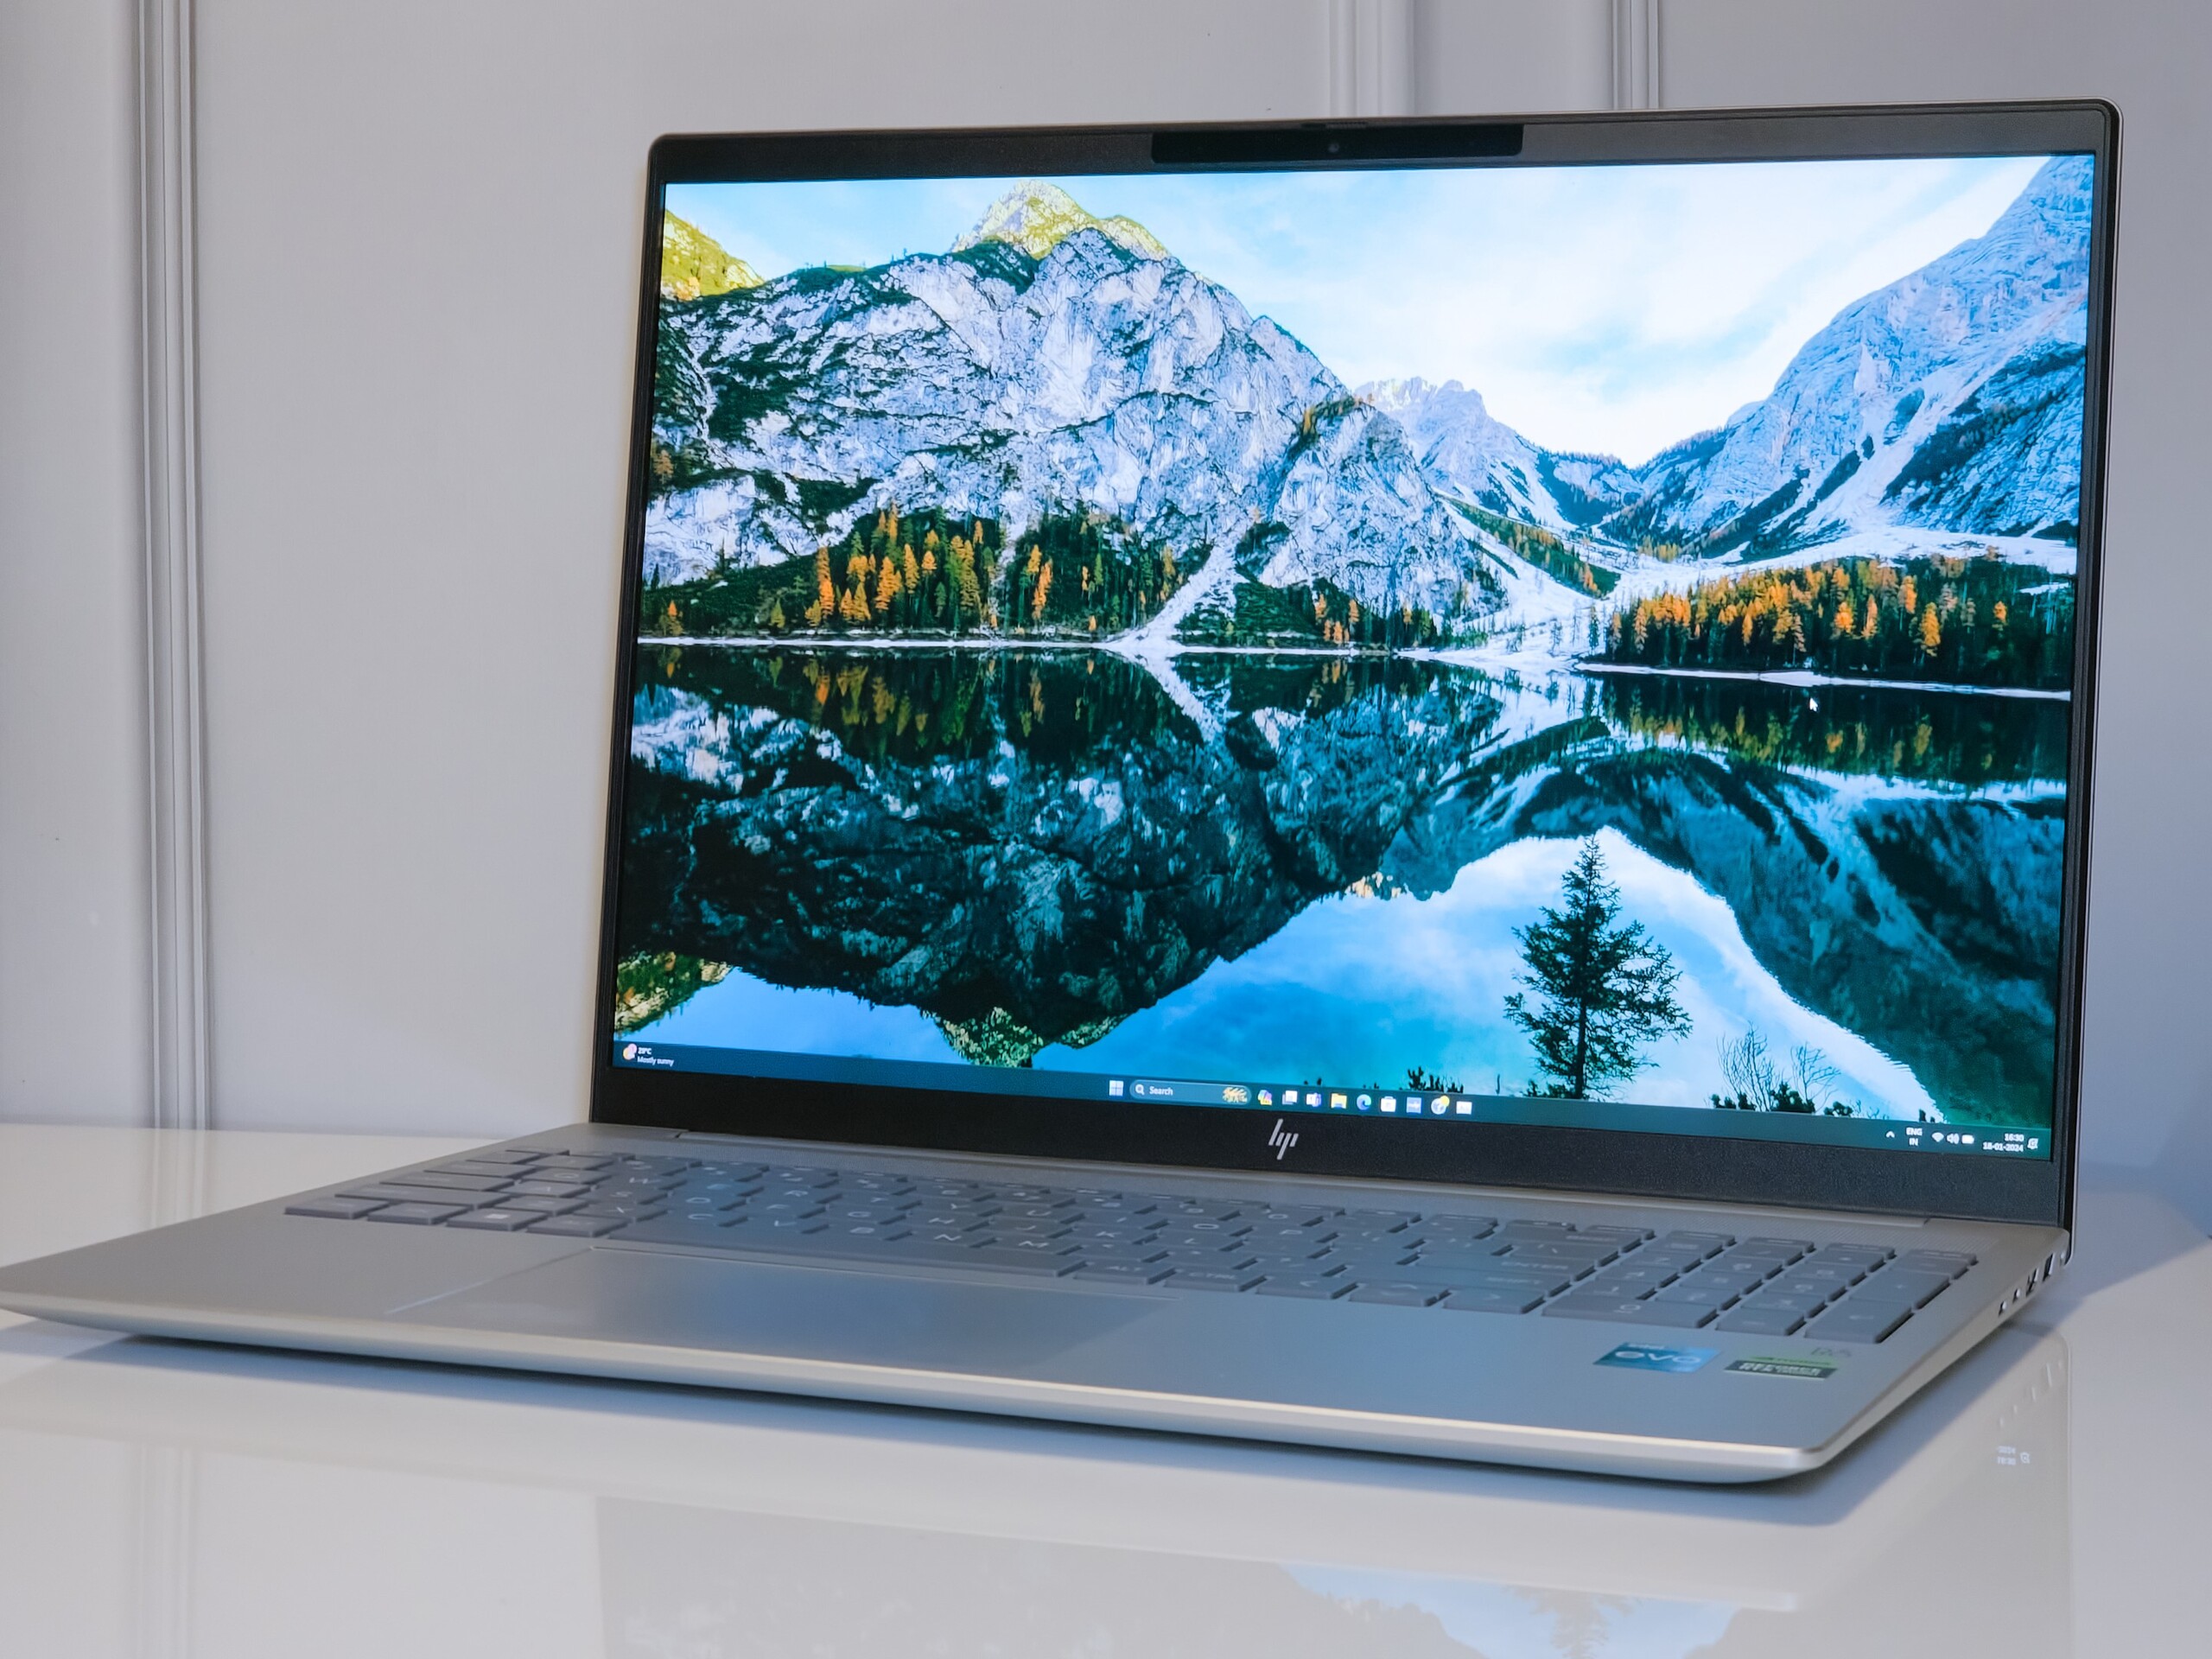
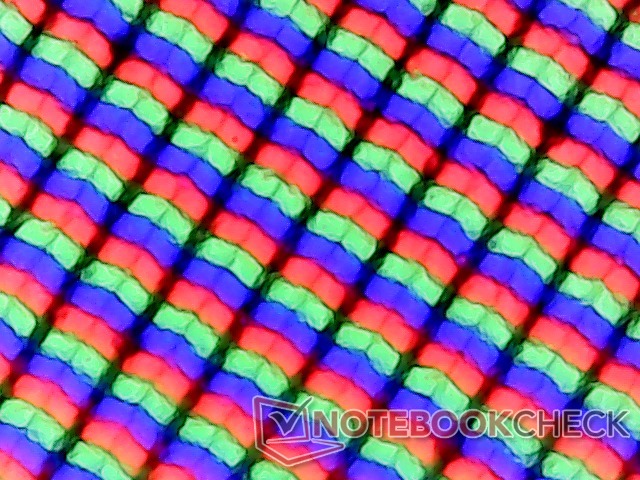
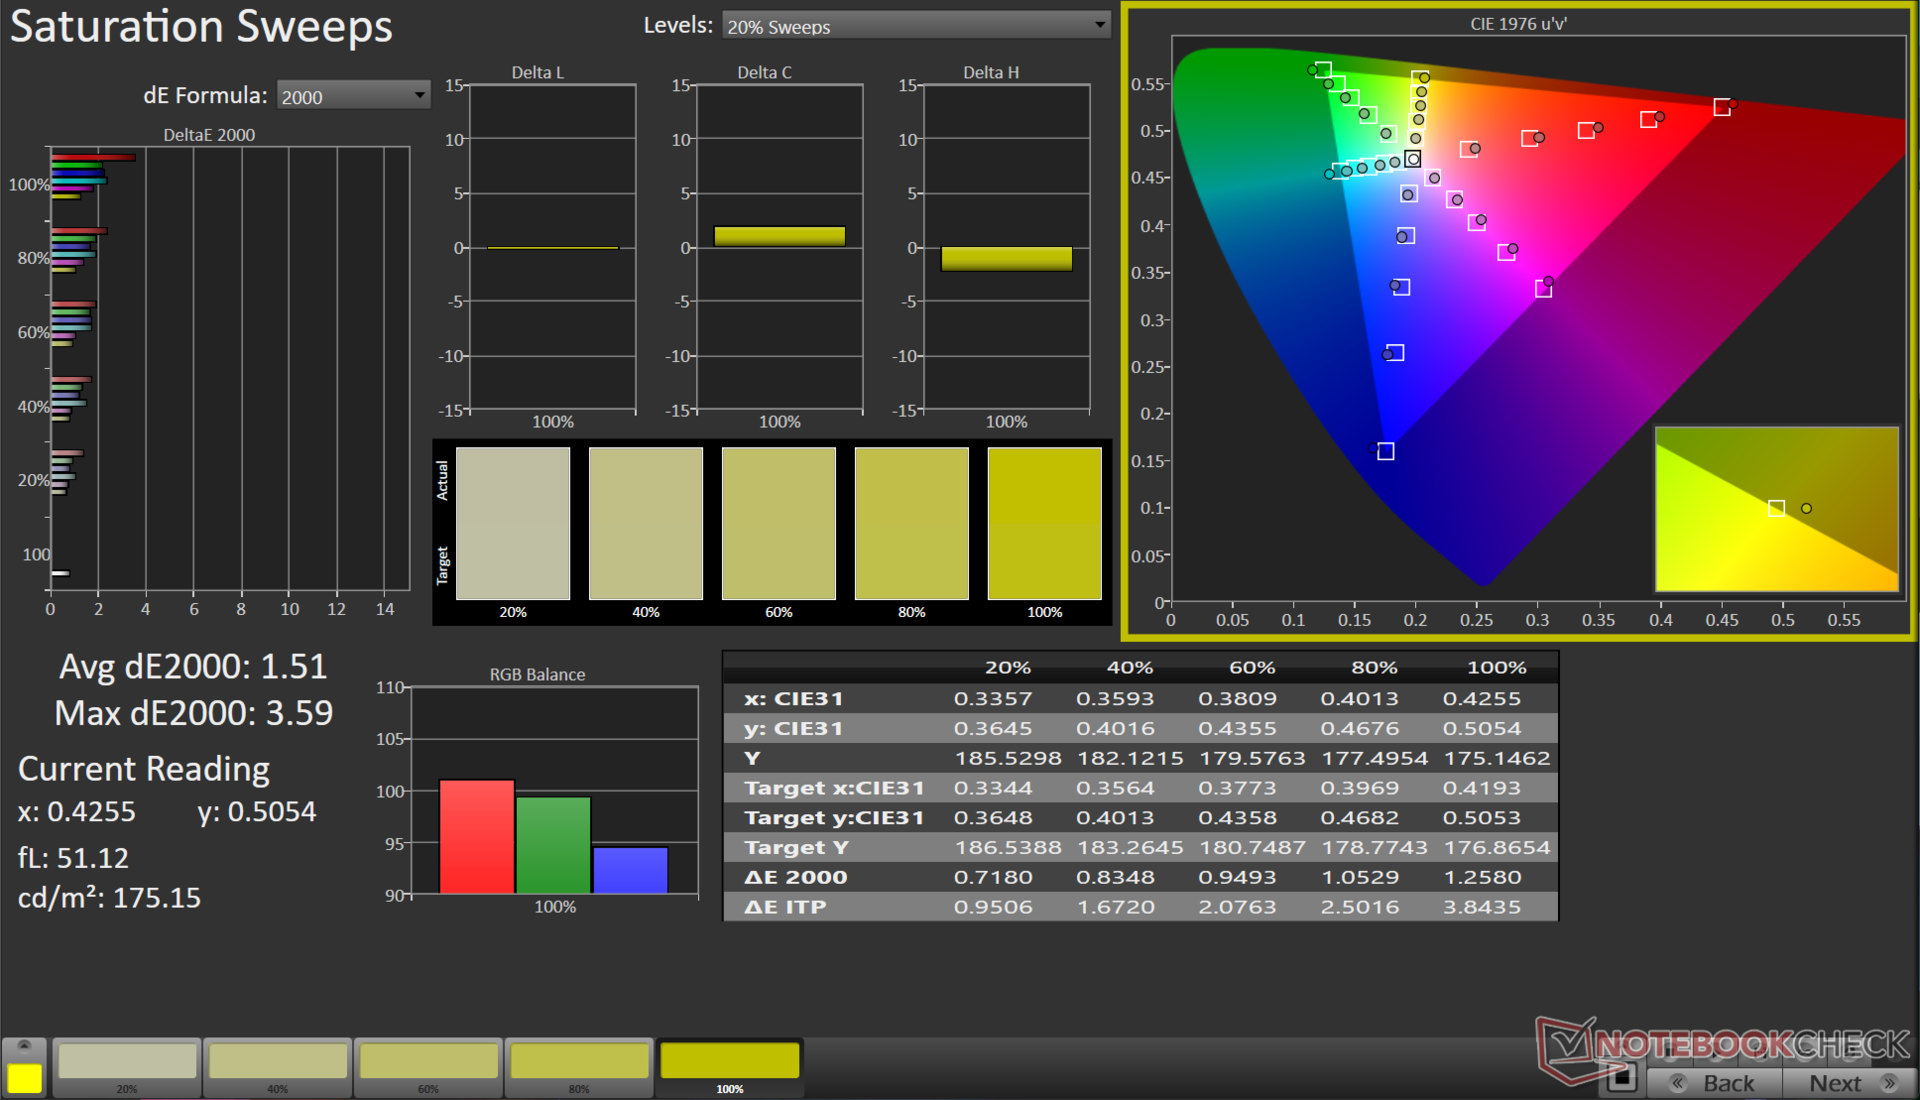
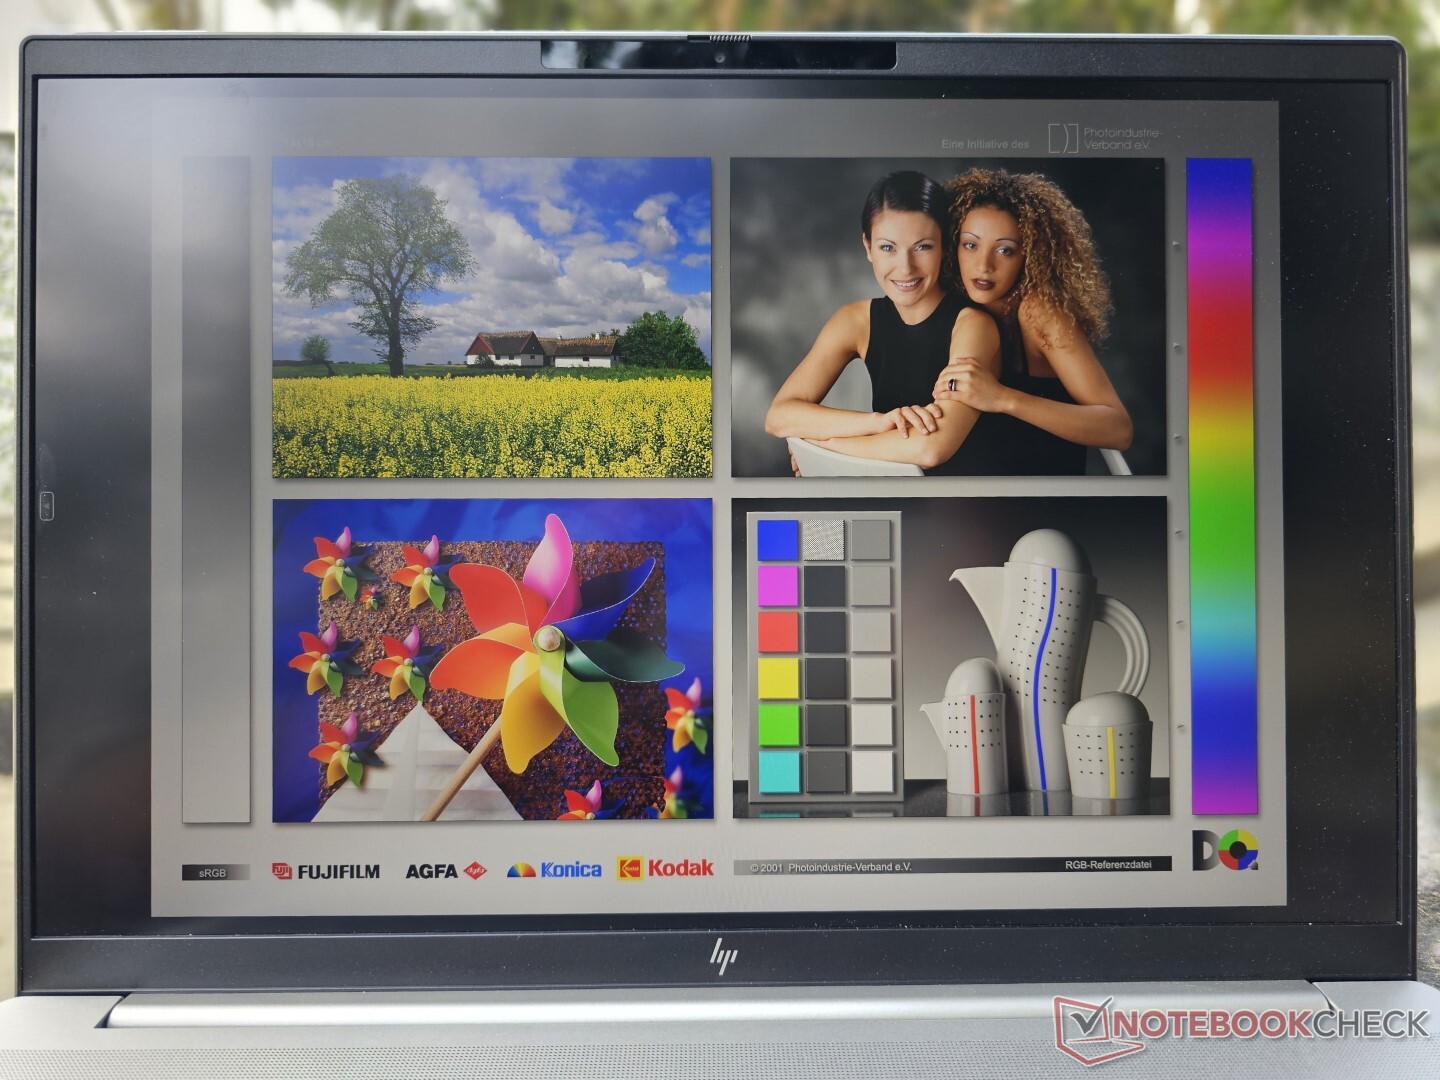
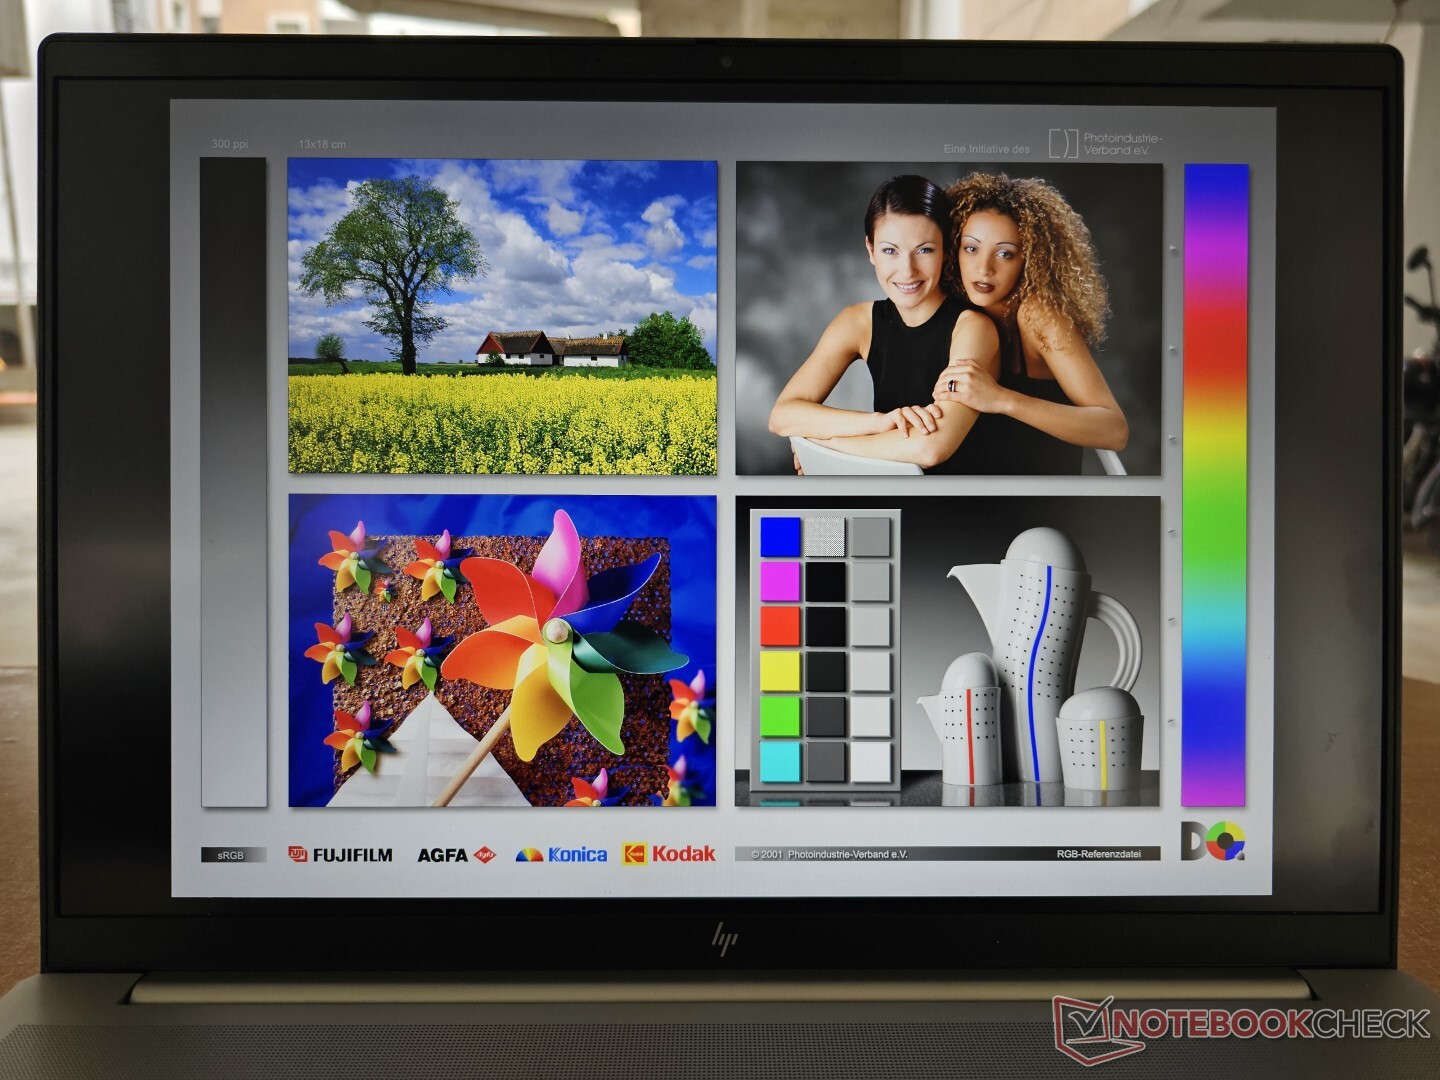
Bildskärm: 120 Hz WQXGA-panel med en anständig färgprofil och ingen PWM
Pavilion Plus 16 har en 16-tums 16:10 2560 x 1600 WQXGA IPS-panel med 120 Hz uppdateringsfrekvens och en nominell ljusstyrka på 400 nits.
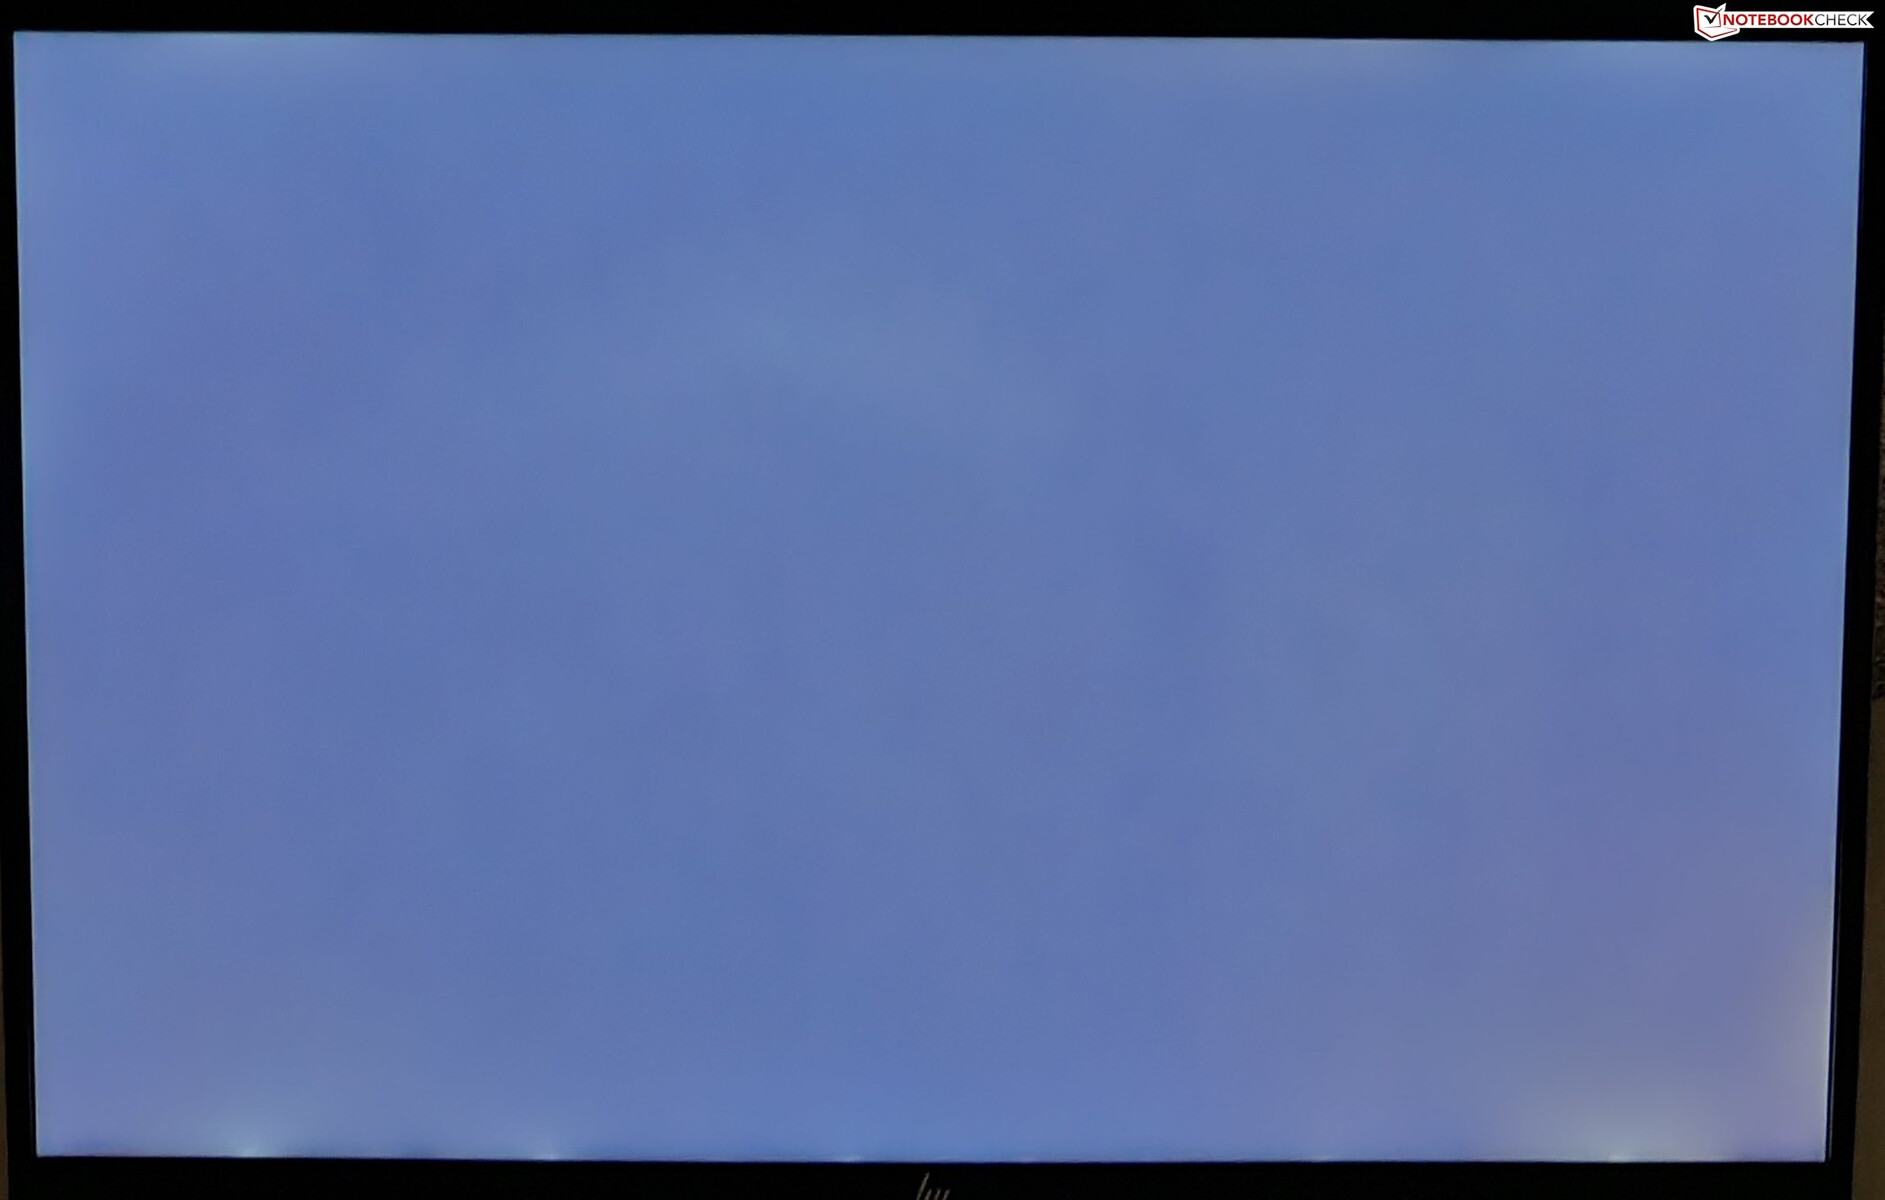
Vi mätte upp till 415 nits maximal ljusstyrka med ett genomsnitt på 394 nits och en bra 90% fördelning. Eftersom det är en IPS-panel är skärmen inte immun mot bakgrundsbelysning - detta kan märkas i de nedre hörnen under lång exponering.
Subjektivt sett erbjuder Pavilion Plus 16 en bra visningsupplevelse som bör vara lämplig för både arbete och underhållning.
| |||||||||||||||||||||||||
Distribution av ljusstyrkan: 90 %
Mitt på batteriet: 401 cd/m²
Kontrast: 1185:1 (Svärta: 0.34 cd/m²)
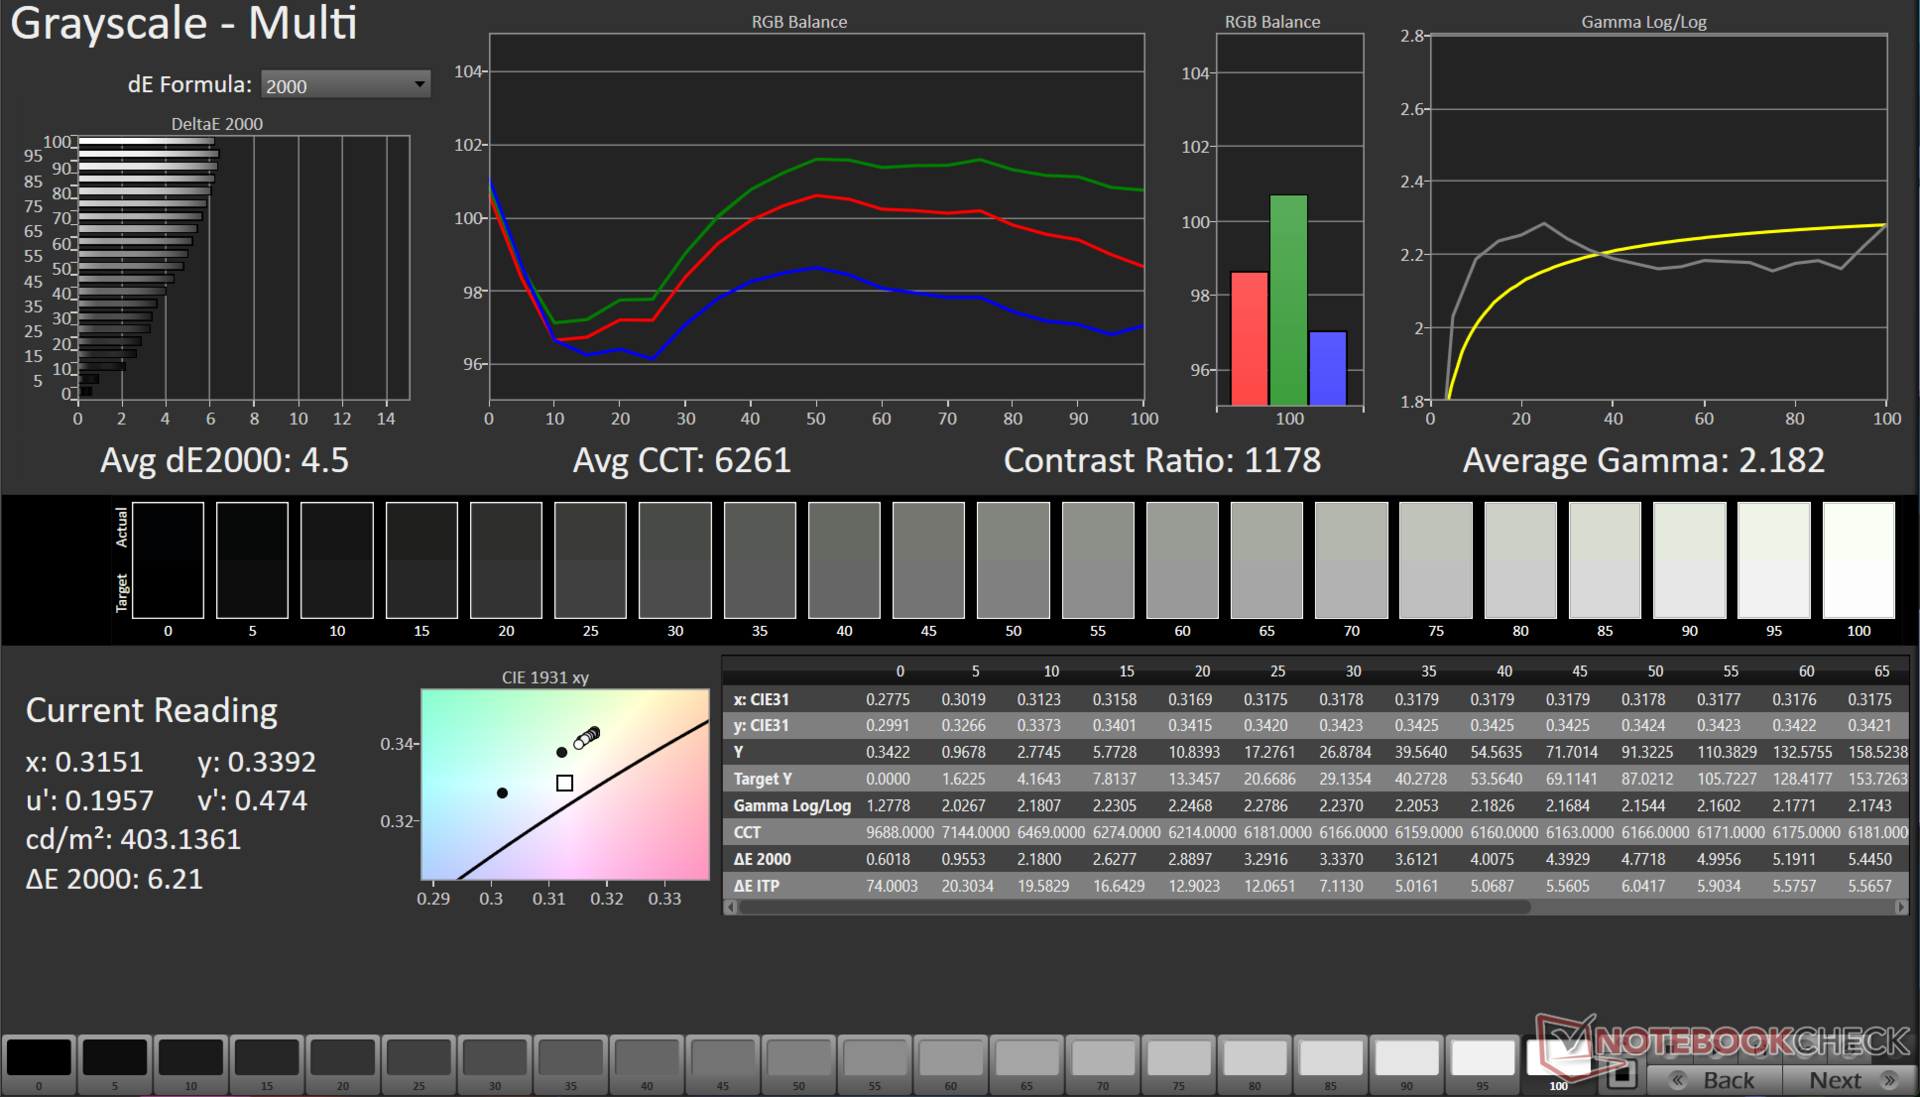
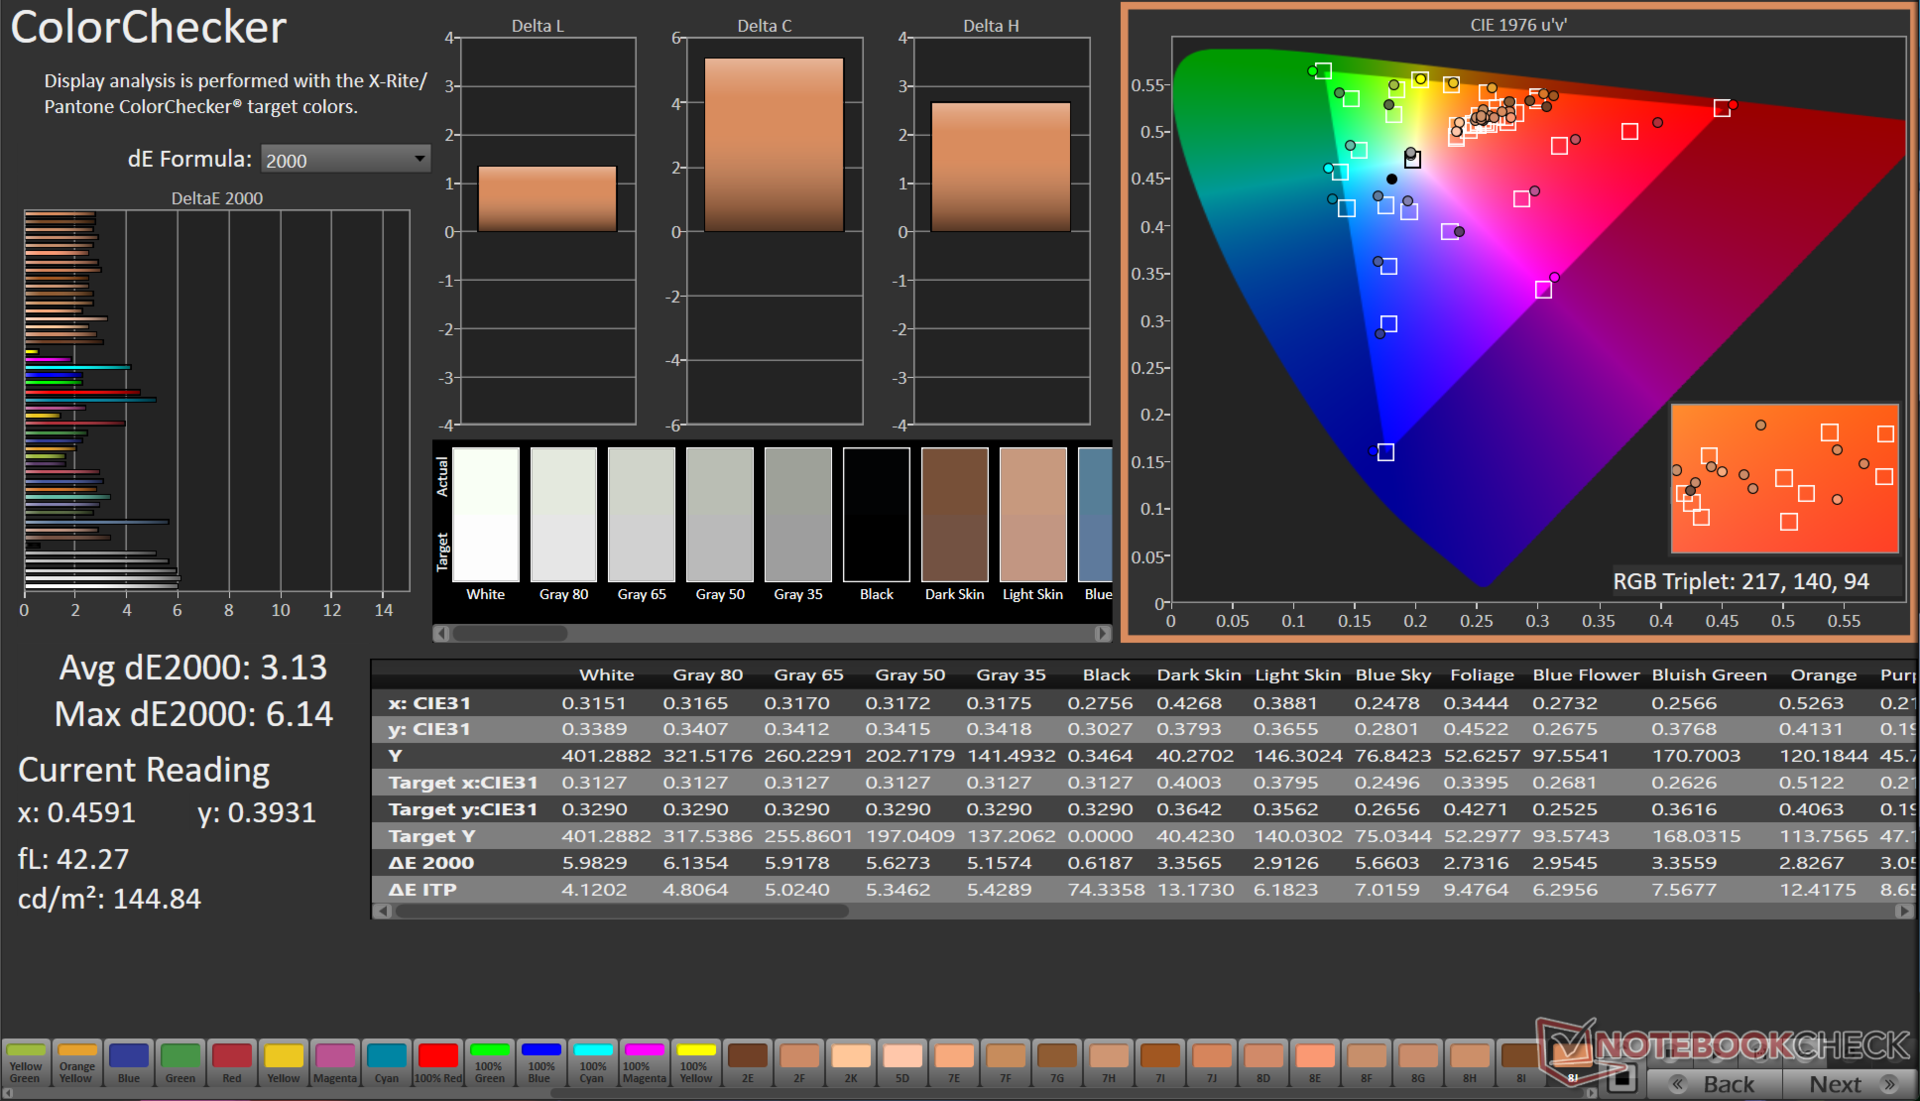
ΔE ColorChecker Calman: 3.13 | ∀{0.5-29.43 Ø4.71}
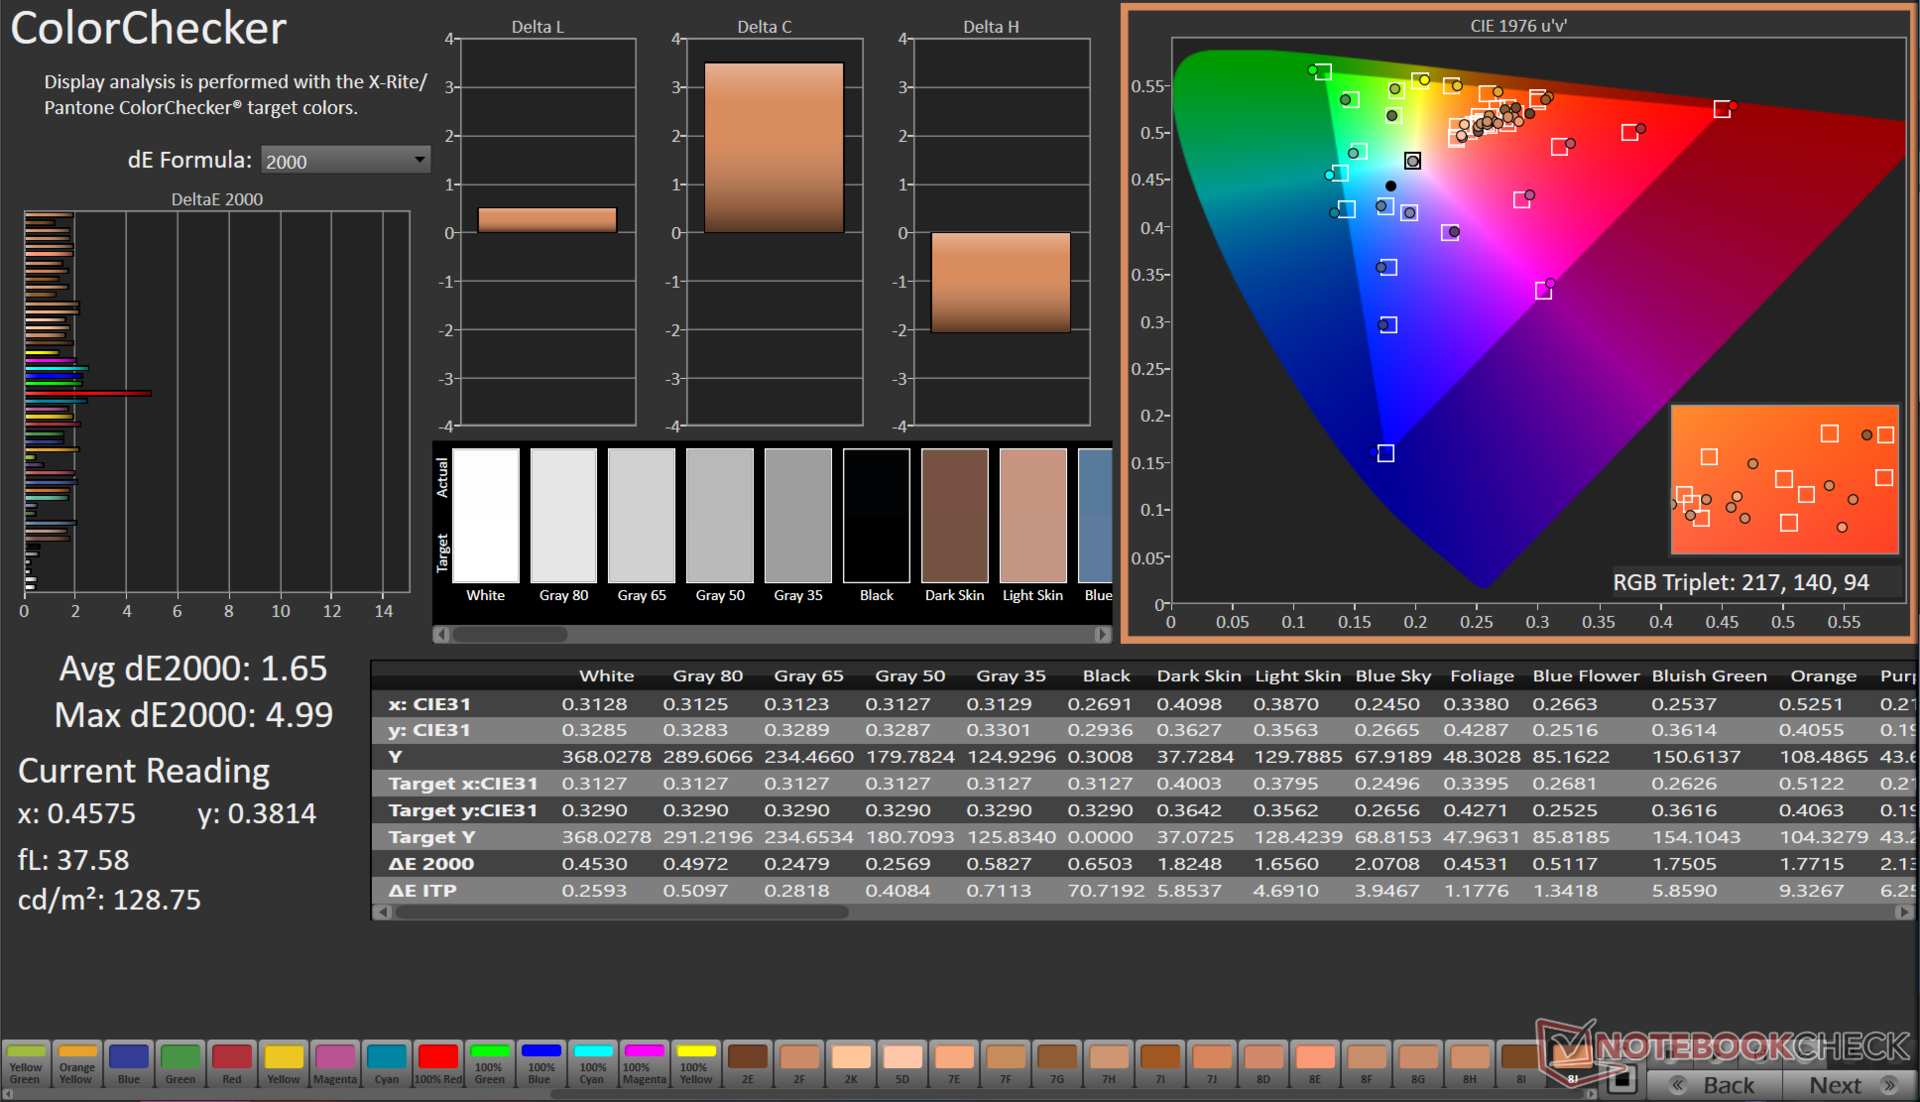
calibrated: 1.65
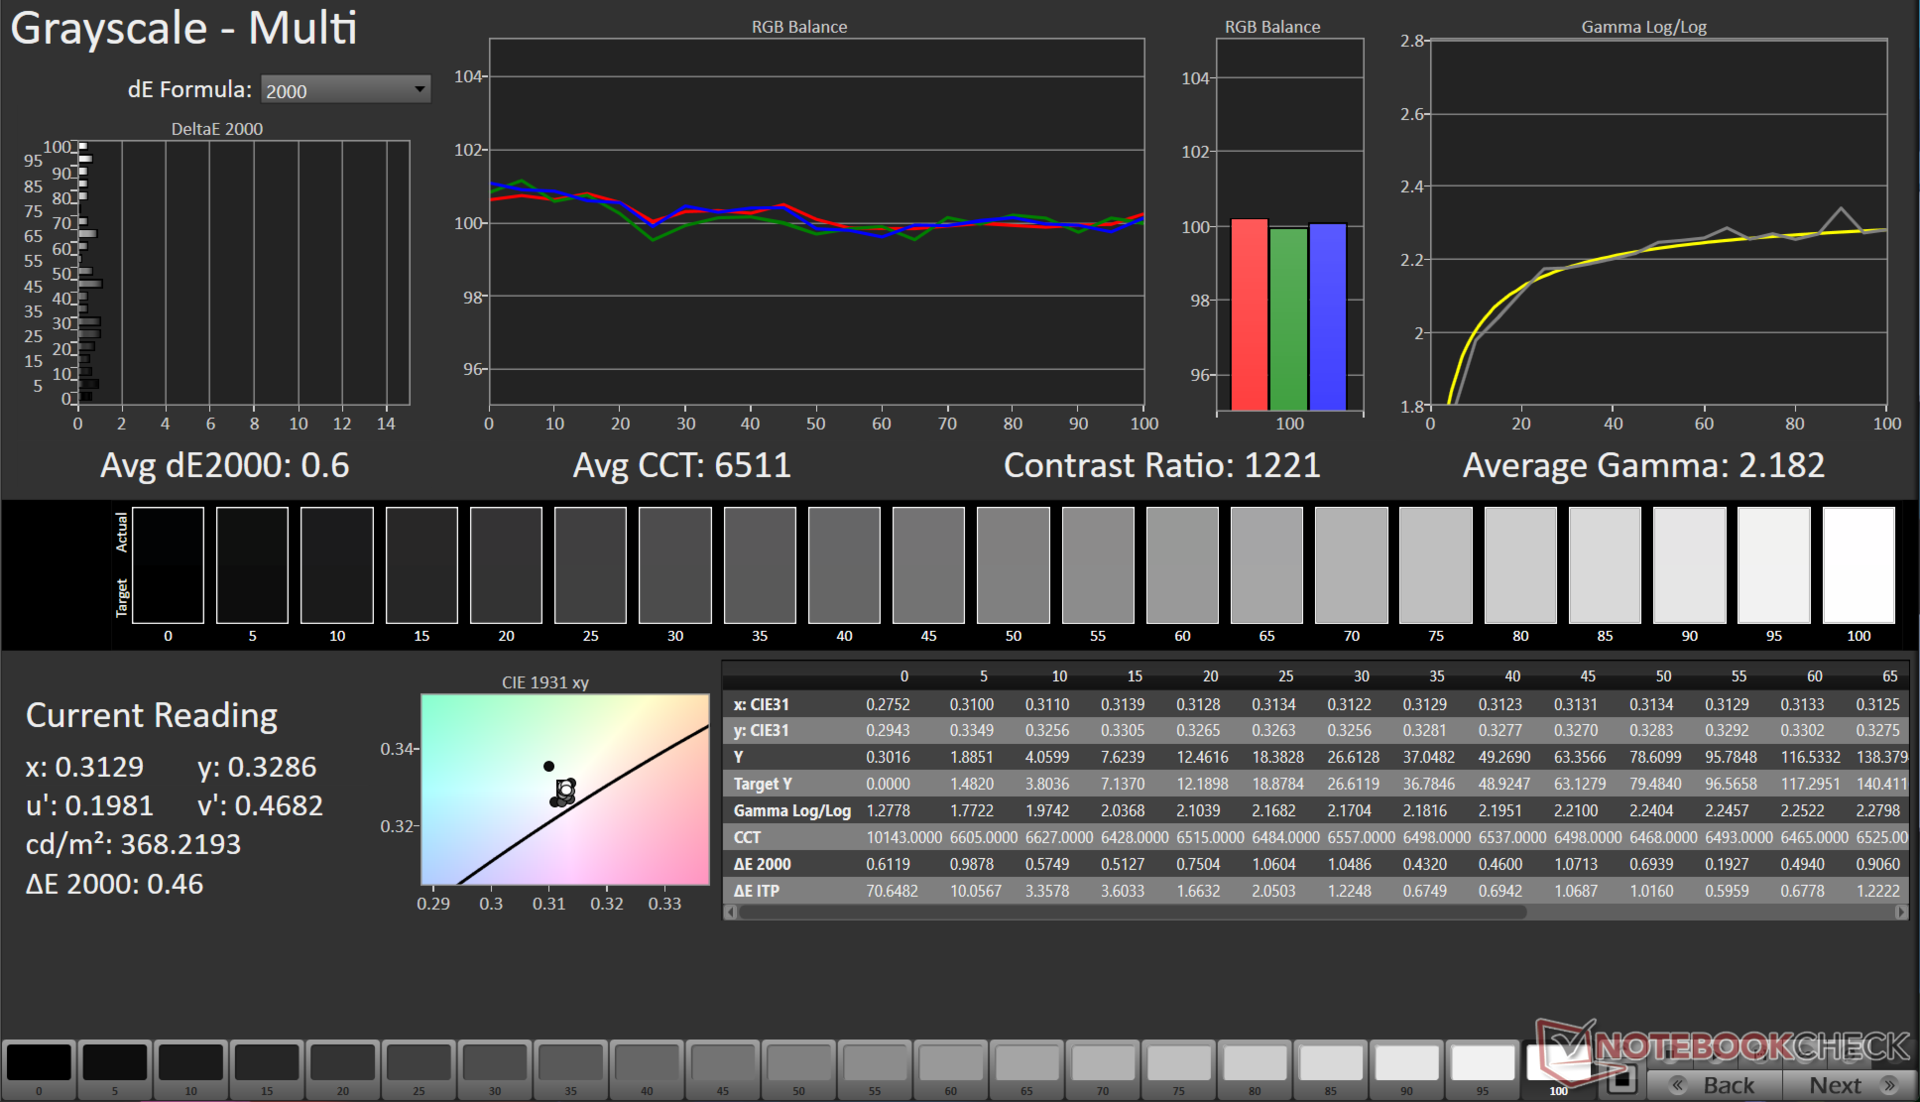
ΔE Greyscale Calman: 4.5 | ∀{0.09-98 Ø4.96}
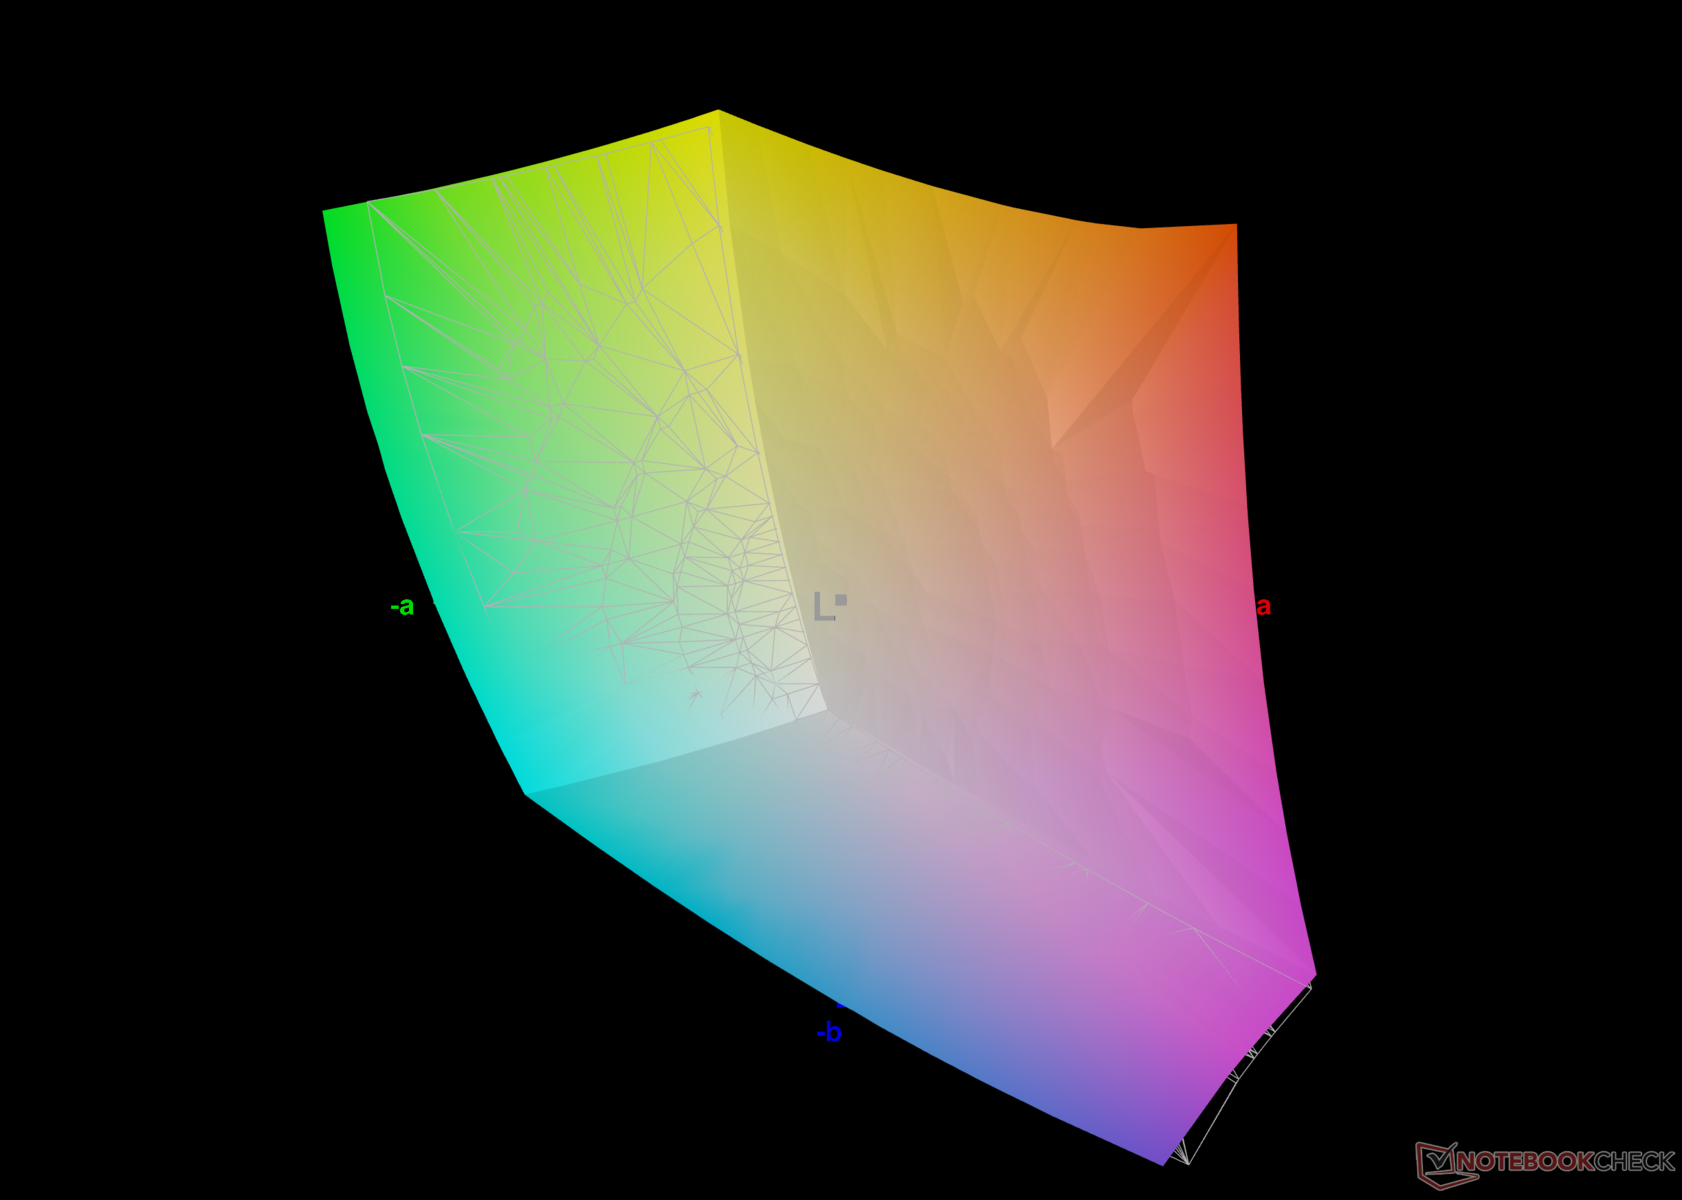
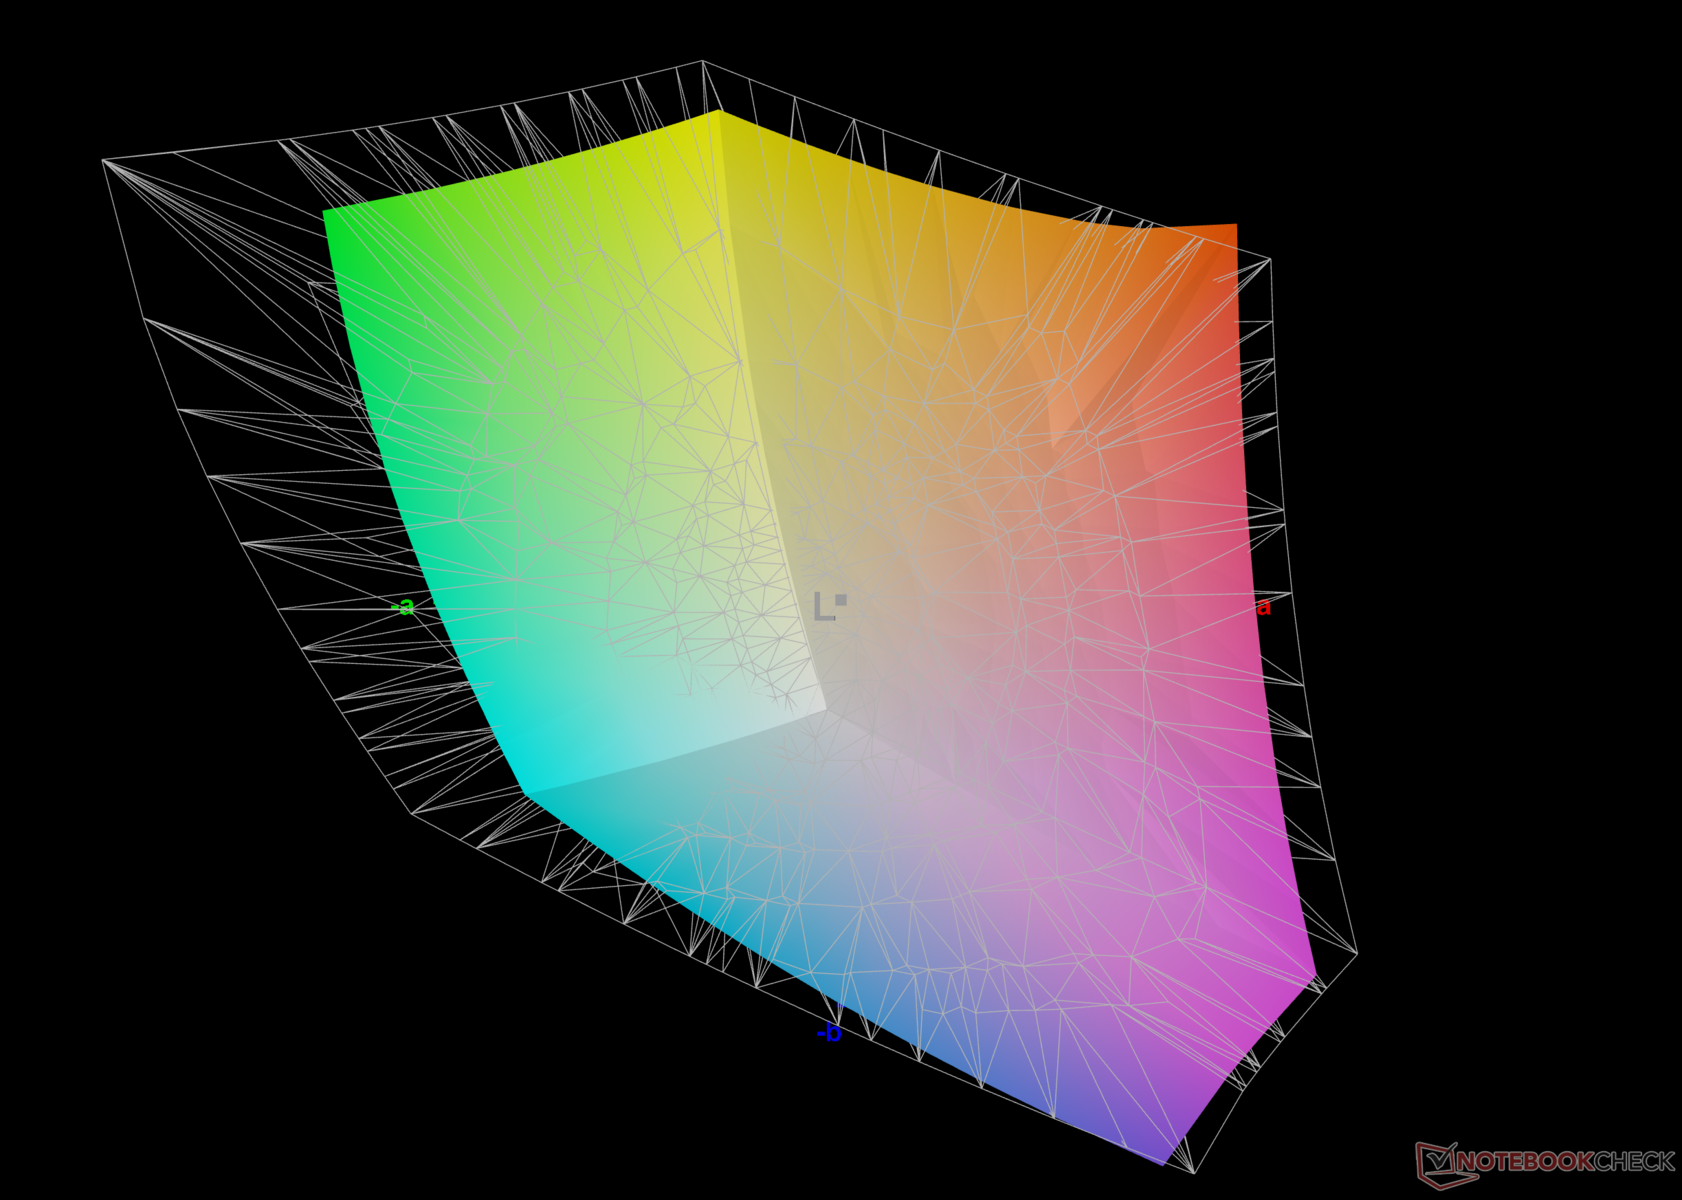
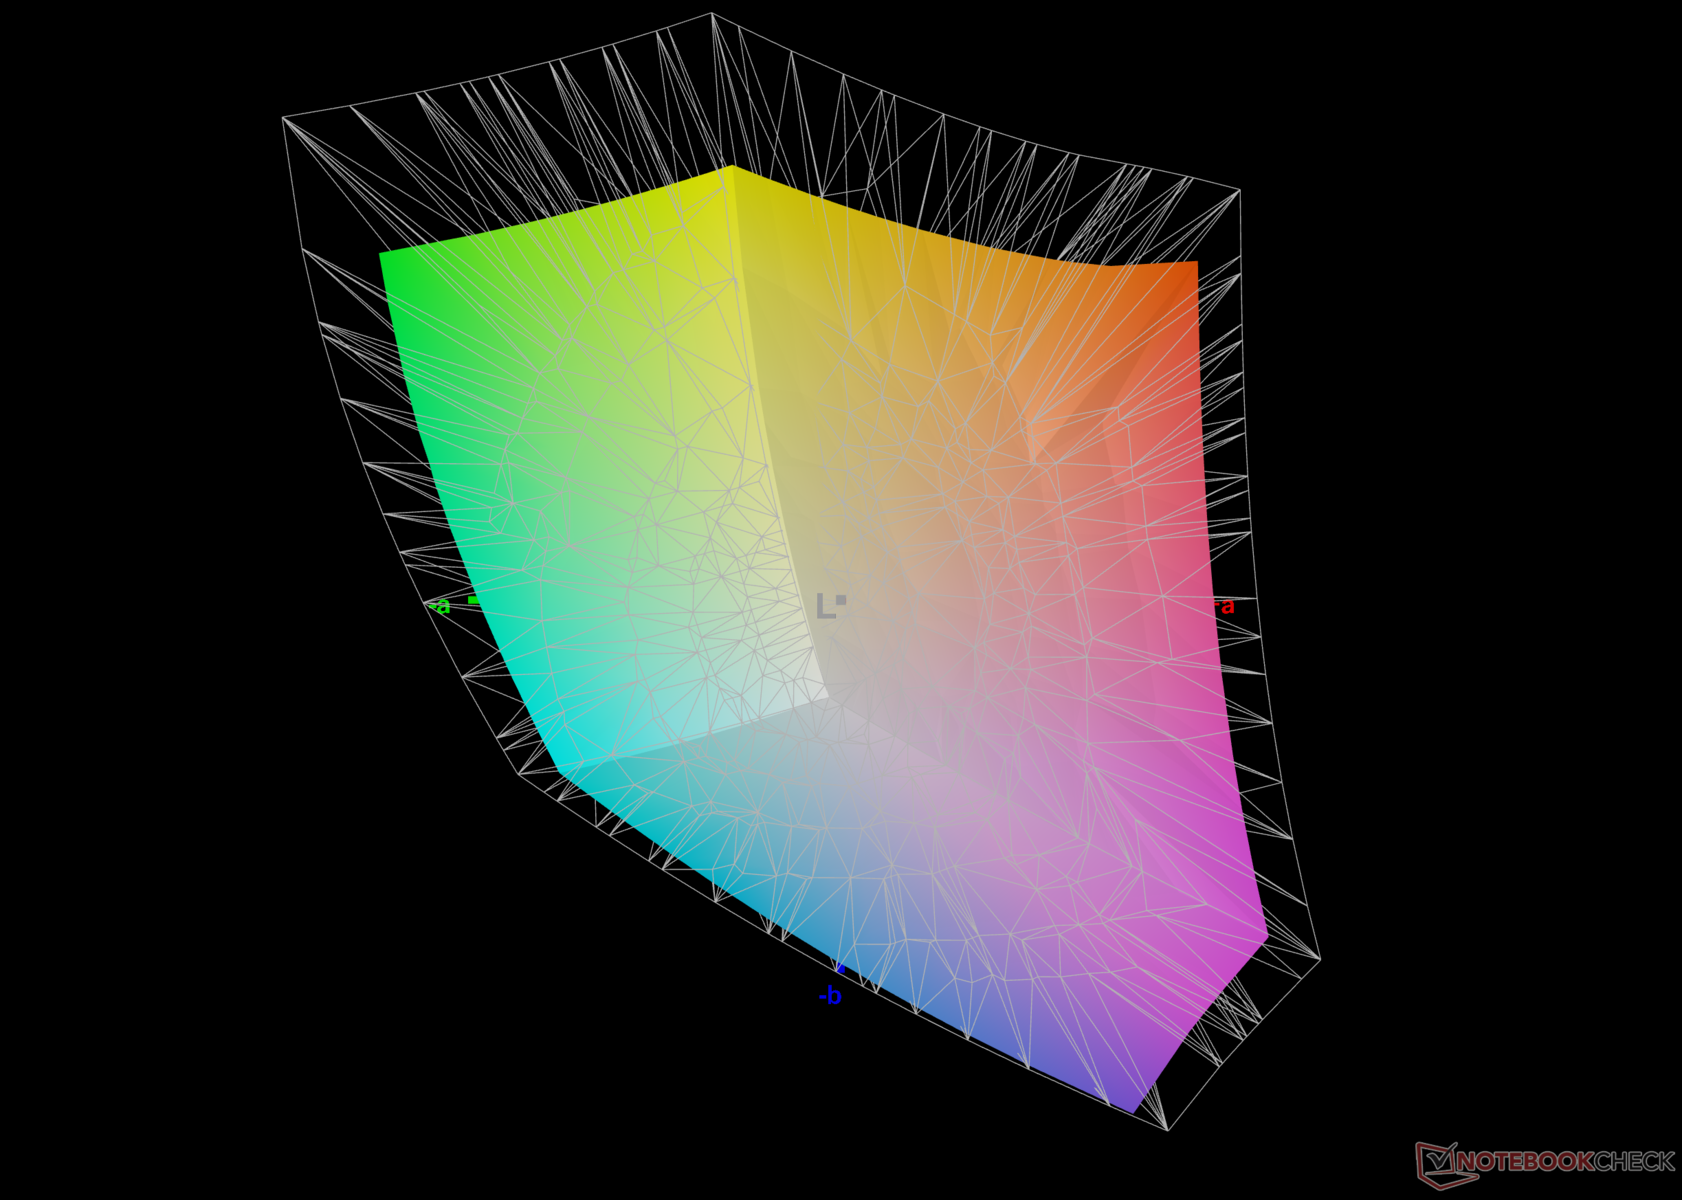
76.5% AdobeRGB 1998 (Argyll 3D)
99% sRGB (Argyll 3D)
74.6% Display P3 (Argyll 3D)
Gamma: 2.18
CCT: 6261 K
| HP Pavilion Plus 16-ab0456tx AU Optronics AUOFDA4, IPS, 2560x1600, 16" | Schenker Vision 14 2023 CSOT T3 MNE007ZA1-3, IPS, 2880x1800, 14" | Dell Inspiron 16 Plus 7630 LG Philips 160WQ2, IPS, 2560x1600, 16" | Asus VivoBook 14X K3405 Samsung ATNA40YK07-1, , 2880x1800, 14" | Lenovo Slim Pro 7 14ARP8 LEN89C1, IPS, 2560x1600, 14.5" | Asus VivoBook Pro 16 K6602VU Samsung ATNA60BX01-1, OLED, 3200x2000, 16" | Samsung Galaxy Book3 Ultra 16 Samsung ATNA60CL03-0, AMOLED, 2880x1800, 16" | |
|---|---|---|---|---|---|---|---|
| Display | 0% | -3% | 20% | -2% | 20% | 20% | |
| Display P3 Coverage (%) | 74.6 | 74.7 0% | 70.1 -6% | 99.9 34% | 72.9 -2% | 98.7 32% | 99.9 34% |
| sRGB Coverage (%) | 99 | 99.6 1% | 99.6 1% | 100 1% | 98.2 -1% | 99.7 1% | 100 1% |
| AdobeRGB 1998 Coverage (%) | 76.5 | 75.8 -1% | 72.3 -5% | 96.5 26% | 74.6 -2% | 96.5 26% | 96.3 26% |
| Response Times | -193% | -274% | -14% | -220% | -3% | 93% | |
| Response Time Grey 50% / Grey 80% * (ms) | 9.06 ? | 32.2 ? -255% | 35 ? -286% | 1.15 ? 87% | 31.8 ? -251% | 0.68 ? 92% | 0.49 ? 95% |
| Response Time Black / White * (ms) | 6.7 ? | 15.4 ? -130% | 24.2 ? -261% | 14.4 ? -115% | 19.3 ? -188% | 13.2 ? -97% | 0.65 ? 90% |
| PWM Frequency (Hz) | 90.02 ? | 240 ? | 240 ? | ||||
| Screen | 21% | 1% | 5% | 3% | -10% | 135% | |
| Brightness middle (cd/m²) | 403 | 402 0% | 299.4 -26% | 369 -8% | 344.7 -14% | 353 -12% | 400 -1% |
| Brightness (cd/m²) | 394 | 371 -6% | 290 -26% | 364 -8% | 334 -15% | 354 -10% | 399 1% |
| Brightness Distribution (%) | 90 | 86 -4% | 92 2% | 85 -6% | 92 2% | 98 9% | 93 3% |
| Black Level * (cd/m²) | 0.34 | 0.27 21% | 0.21 38% | 0.31 9% | 0.03 91% | ||
| Contrast (:1) | 1185 | 1489 26% | 1426 20% | 1112 -6% | 13333 1025% | ||
| Colorchecker dE 2000 * | 3.13 | 1.8 42% | 4.25 -36% | 2.85 9% | 3.01 4% | 4.23 -35% | 2.3 27% |
| Colorchecker dE 2000 max. * | 6.14 | 3.6 41% | 6.71 -9% | 4.22 31% | 6.3 -3% | 7.13 -16% | 4.15 32% |
| Colorchecker dE 2000 calibrated * | 1.65 | 1.5 9% | 0.52 68% | 2.18 -32% | 0.83 50% | 2.42 -47% | 1.66 -1% |
| Greyscale dE 2000 * | 4.5 | 1.8 60% | 5.5 -22% | 2.2 51% | 4.6 -2% | 2.5 44% | 2.7 40% |
| Gamma | 2.18 101% | 2.27 97% | 2.35 94% | 2.15 102% | 2.28 96% | 2.4 92% | 2.266 97% |
| CCT | 6261 104% | 6695 97% | 6368 102% | 6518 100% | 6420 101% | 6642 98% | 7047 92% |
| Totalt genomsnitt (program/inställningar) | -57% /
-14% | -92% /
-39% | 4% /
6% | -73% /
-30% | 2% /
-1% | 83% /
105% |
* ... mindre är bättre
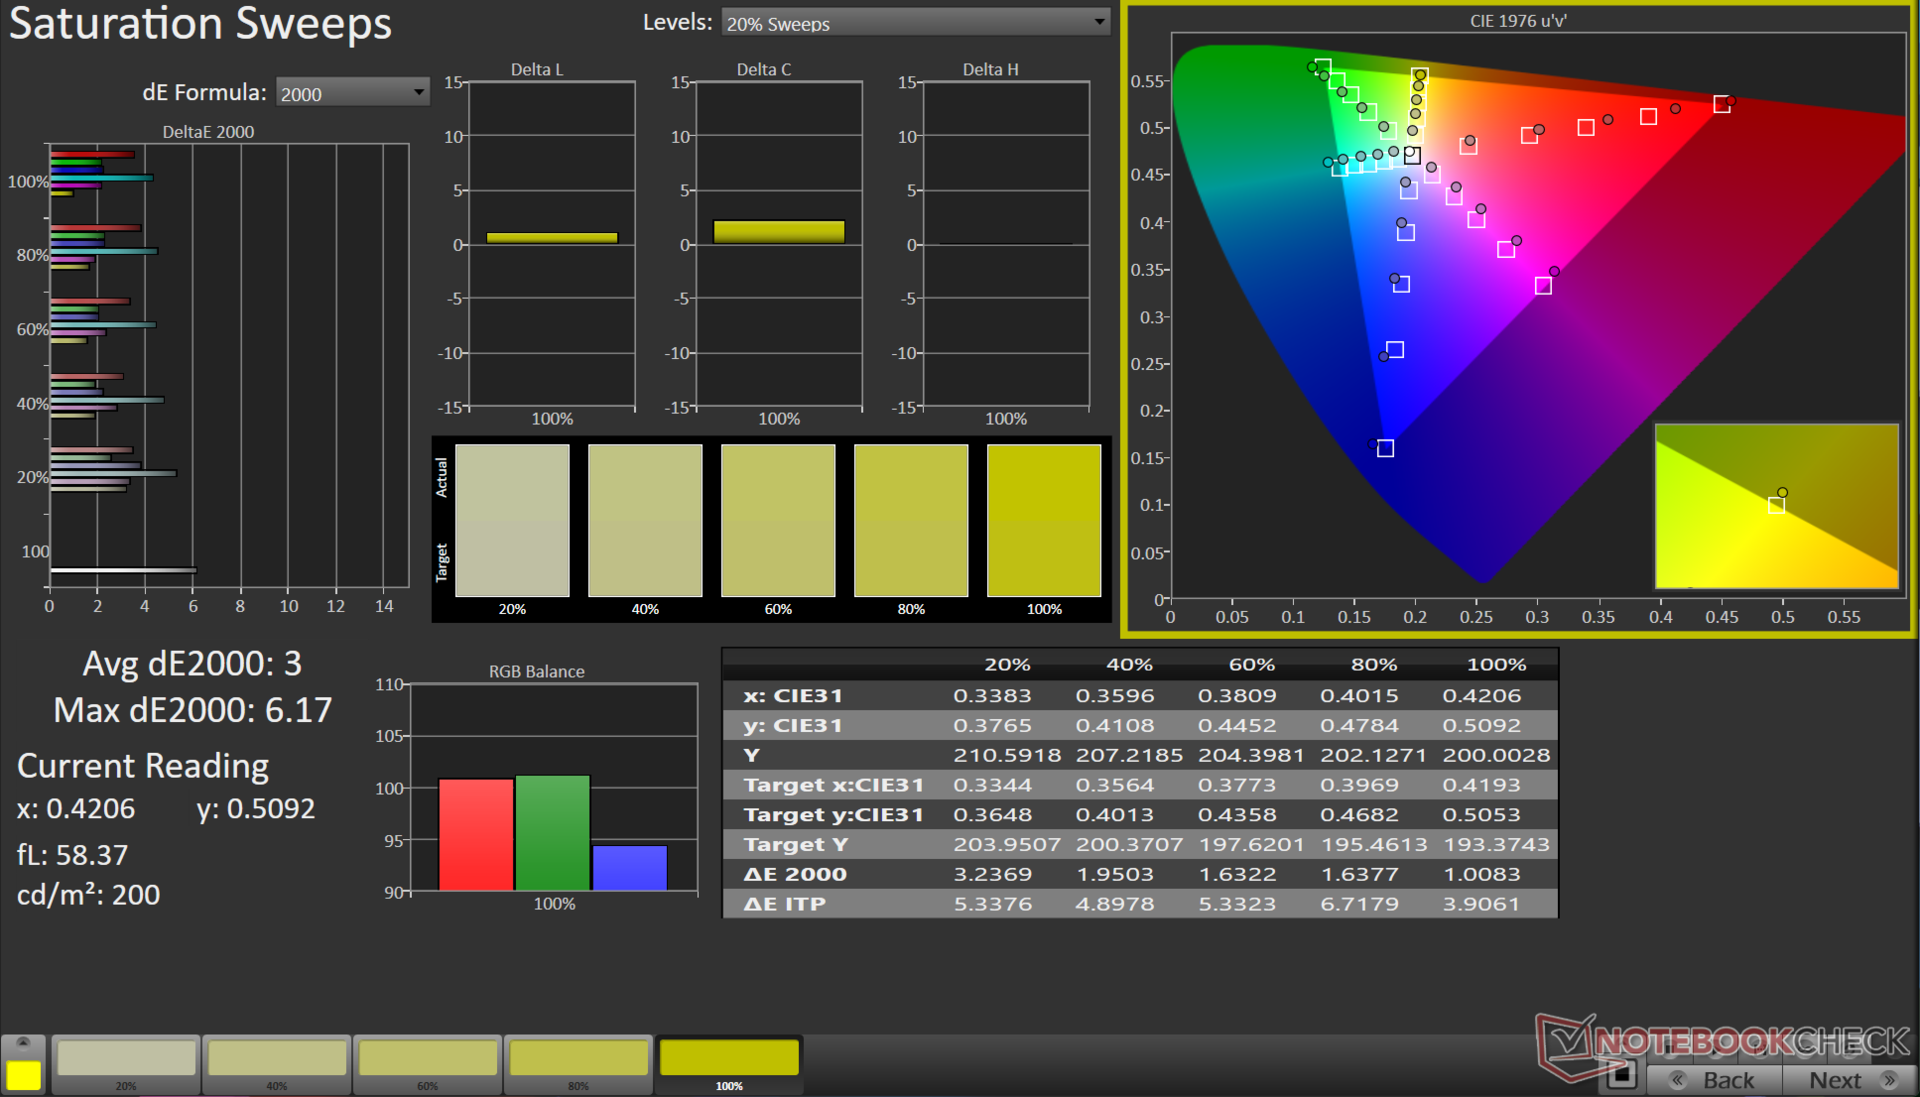
Panelen täcker 99 % av sRGB-färgrymden samtidigt som den ger bra återgivning av Adobe RGB och Display P3. Detta gör Pavilion Plus 16 lämplig för allmän multimediakonsumtion och även för grundläggande redigeringsarbetsflöden, särskilt för webbinnehåll.
Med hjälp av X-Rite i1Basic Pro 3 spektrofotometer och Calman Ultimate programvara från Portrait Displays, kunde vi förbättra de genomsnittliga gråskala och ColorChecker Delta E 2000 värden från 4,5 till 0,6 och 3,13 till 1,65, respektive.
Vår kalibrerade fil kan laddas ner från länken ovan.
Visa svarstider
| ↔ Svarstid svart till vitt | ||
|---|---|---|
| 6.7 ms ... stiga ↗ och falla ↘ kombinerat | ↗ 3.6 ms stiga | 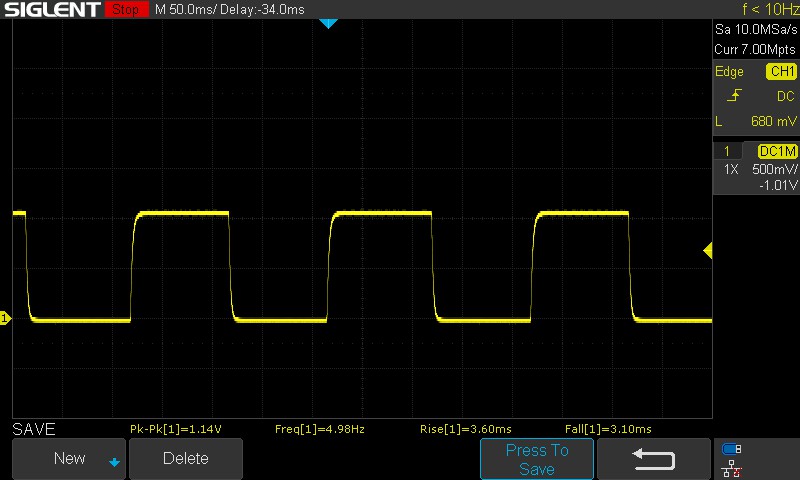 |
| ↘ 3.1 ms hösten | ||
| Skärmen visar väldigt snabba svarsfrekvenser i våra tester och borde vara mycket väl lämpad för fartfyllt spel. I jämförelse sträcker sig alla testade enheter från 0.1 (minst) till 240 (maximalt) ms. » 21 % av alla enheter är bättre. Det betyder att den uppmätta svarstiden är bättre än genomsnittet av alla testade enheter (19.8 ms). | ||
| ↔ Svarstid 50 % grått till 80 % grått | ||
| 9.06 ms ... stiga ↗ och falla ↘ kombinerat | ↗ 4.27 ms stiga | 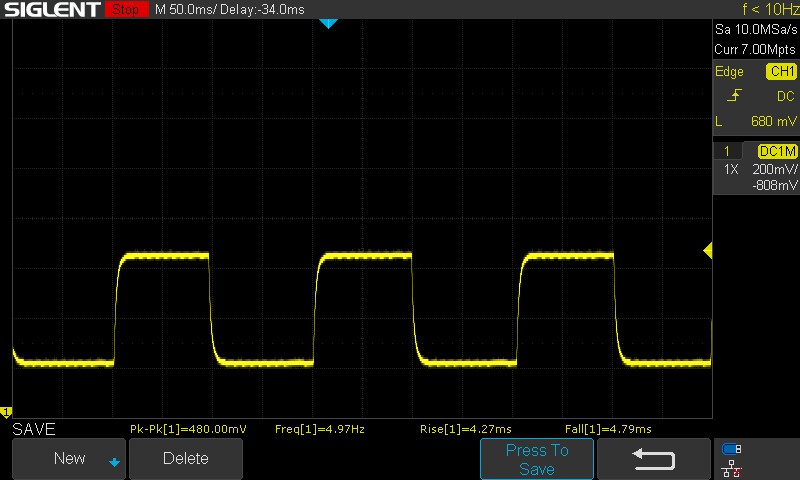 |
| ↘ 4.79 ms hösten | ||
| Skärmen visar snabba svarsfrekvenser i våra tester och bör passa för spel. I jämförelse sträcker sig alla testade enheter från 0.165 (minst) till 636 (maximalt) ms. » 23 % av alla enheter är bättre. Det betyder att den uppmätta svarstiden är bättre än genomsnittet av alla testade enheter (31 ms). | ||
Skärmflimmer / PWM (Puls-Width Modulation)
| Skärmflimmer / PWM upptäcktes inte | ≤ 100 % ljusstyrka inställning | 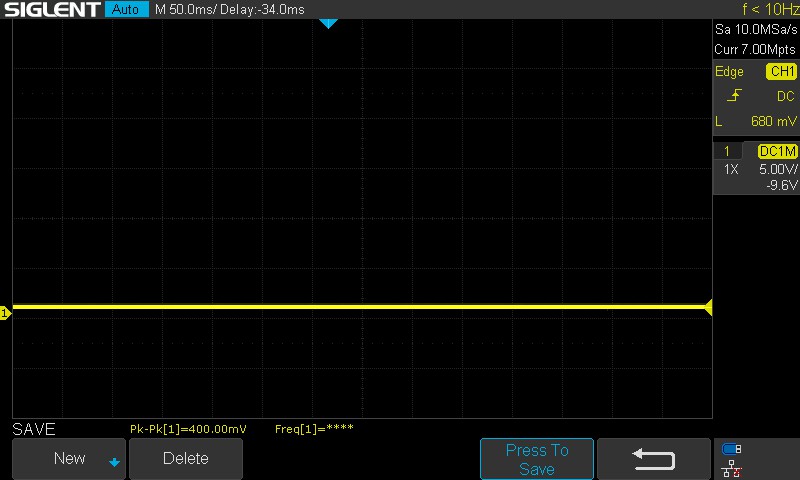 | |
Som jämförelse: 52 % av alla testade enheter använder inte PWM för att dämpa skärmen. Om PWM upptäcktes mättes ett medelvärde av 7757 (minst: 5 - maximum: 343500) Hz. | |||
Svarstiderna är anständiga med tanke på att Pavilion Plus 16 inte är inriktad på spelpubliken. Vi observerade ingen PWM vid alla testade ljusstyrkenivåer, vilket är en bra sak.
För mer information, se vår artikel "Varför PWM är en sådan huvudvärk". Vår tabell PWM Ranking ger en översikt över uppmätt PWM i de granskade enheterna.
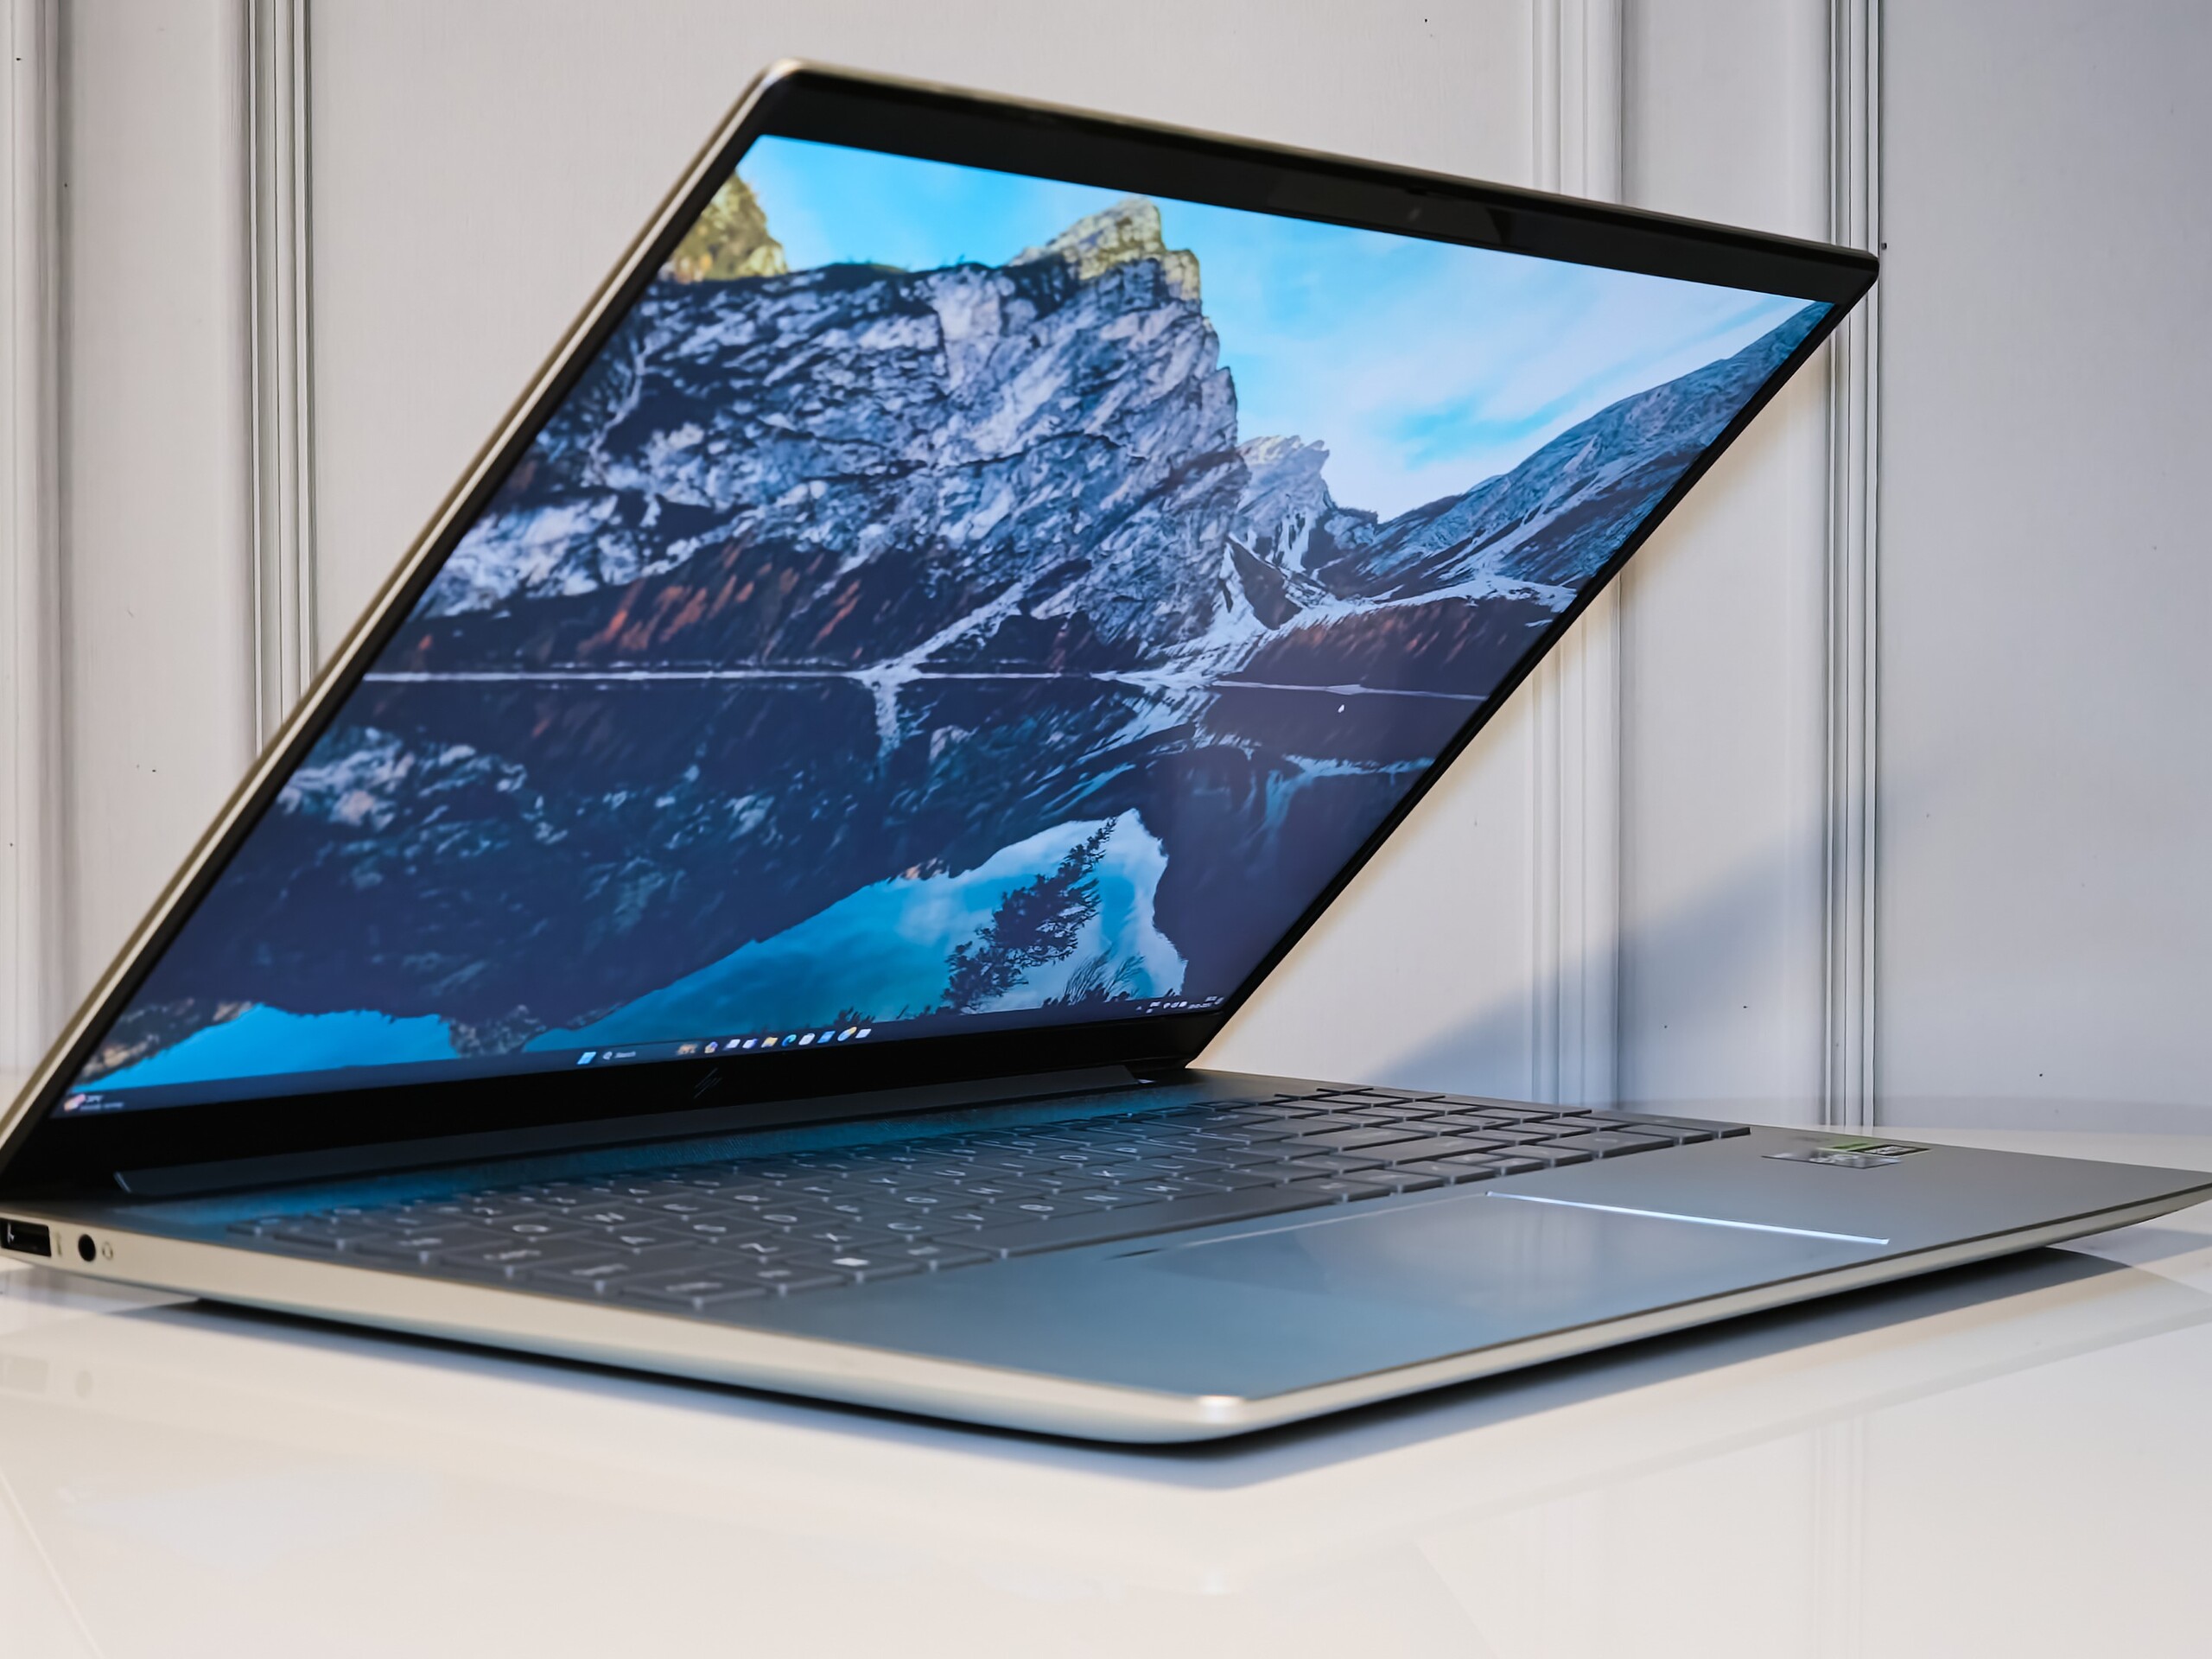
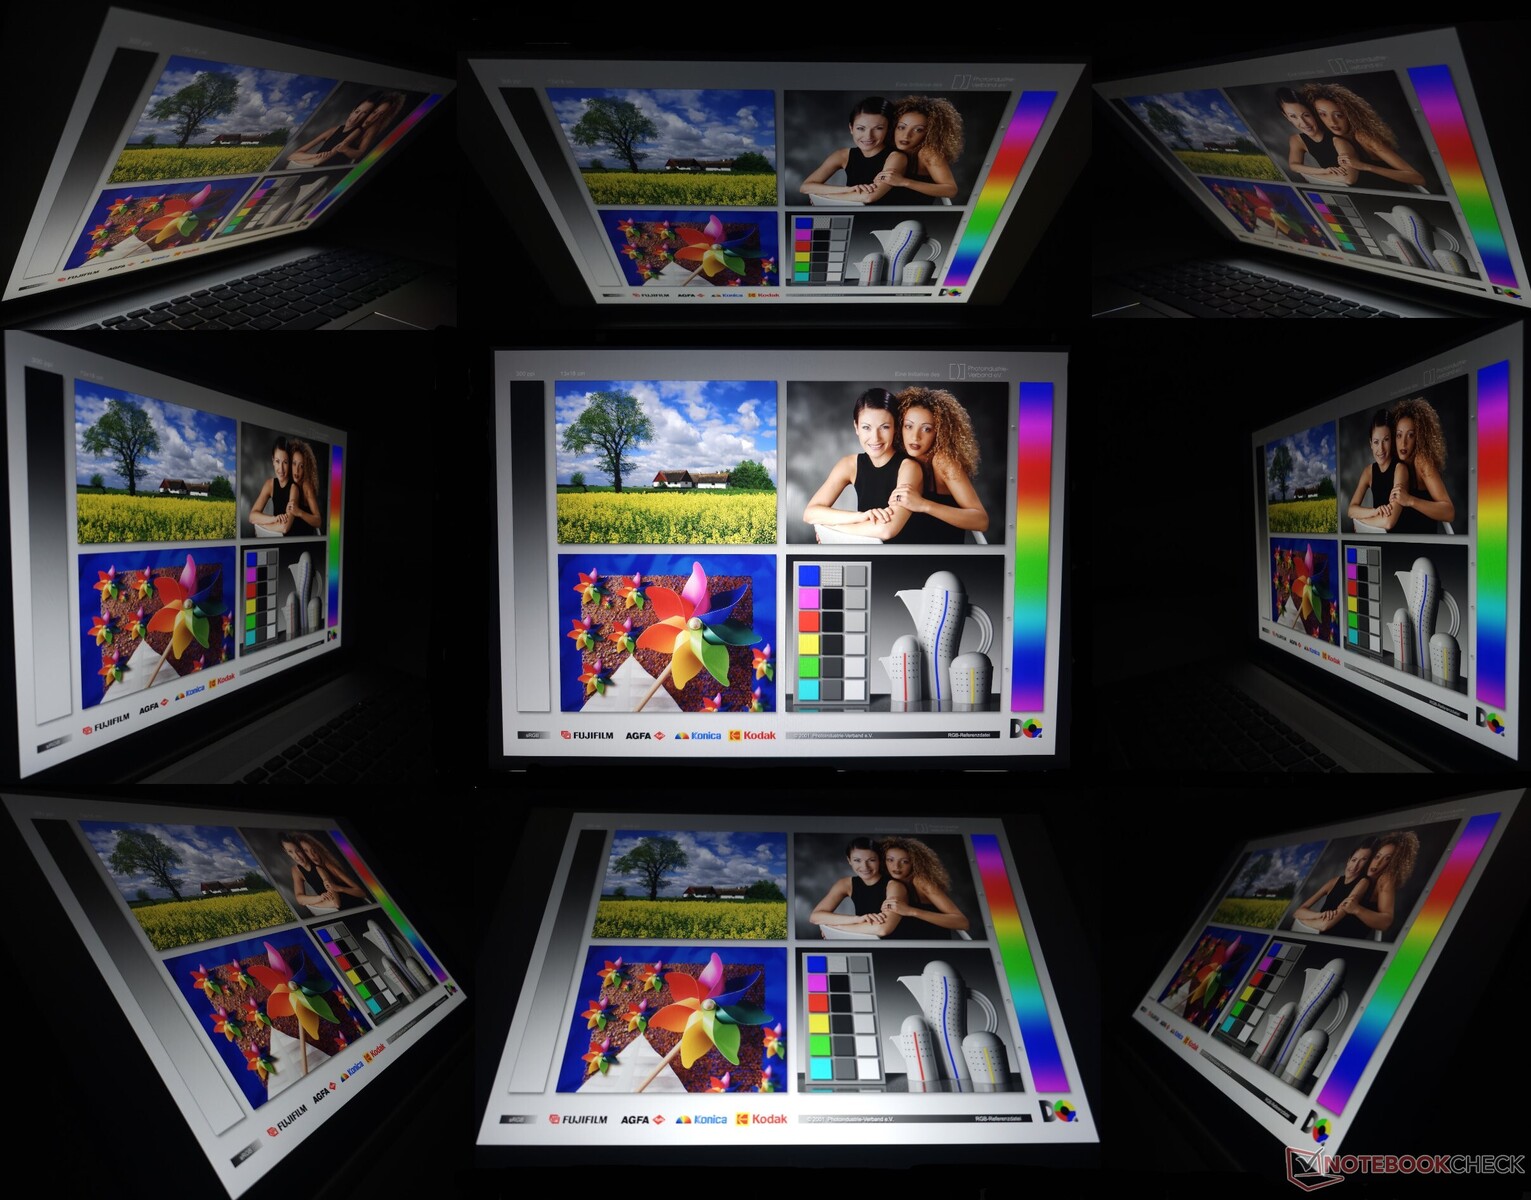
Utomhusvisning fungerar i allmänhet bra med maximal ljusstyrka så länge inget direkt solljus faller på skärmen. Betraktningsvinklarna är stabila, men vi observerade förlust av ljusstyrka och färginformation vid ytterligheterna.
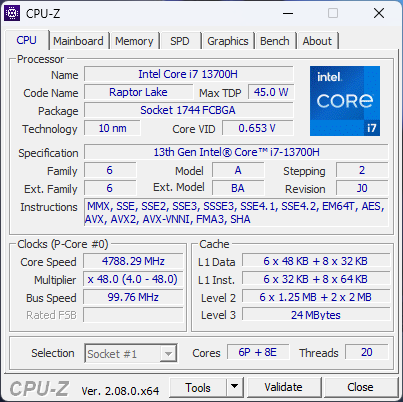
Prestanda: Core i7-13700H begränsas av låg PL2
Beroende på region erbjuder HP Pavilion Plus 16 i Core i5-13500H och Core i7-13700H tillsammans med RTX 3050 6 GB grafik som tillval.
Villkor för testning
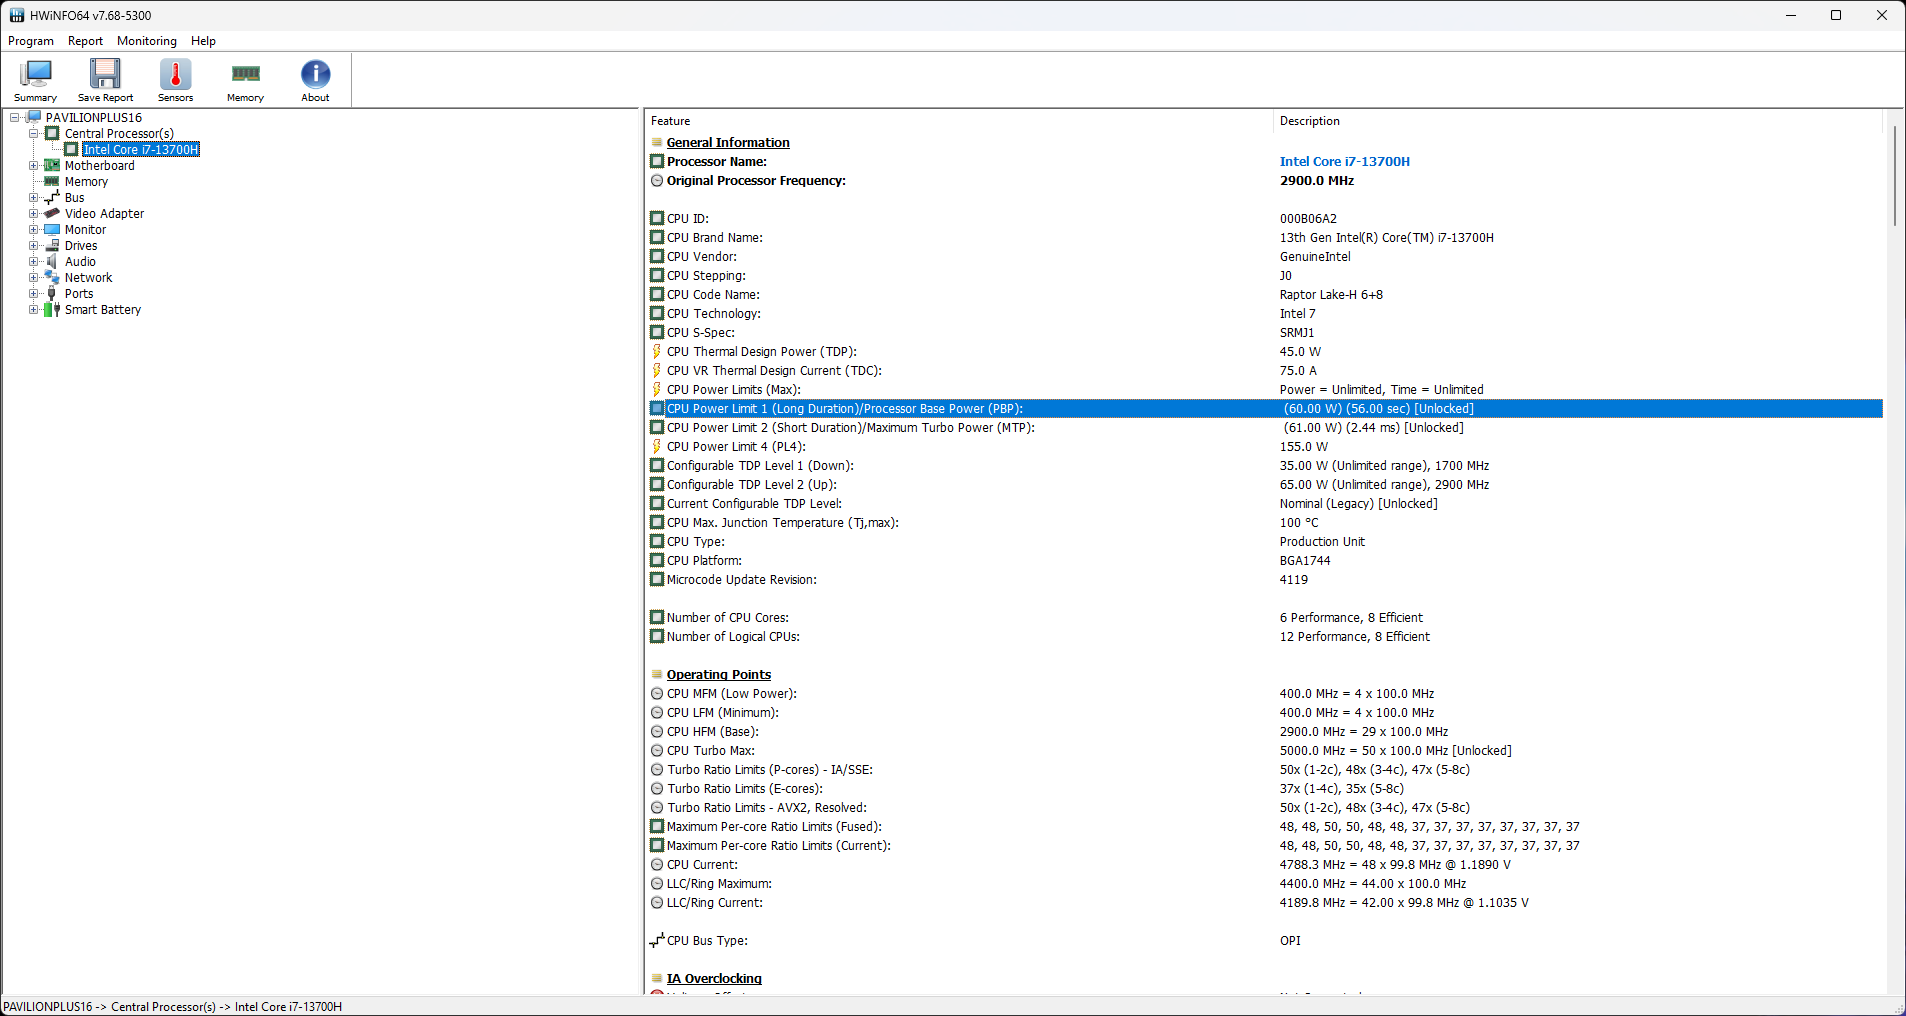
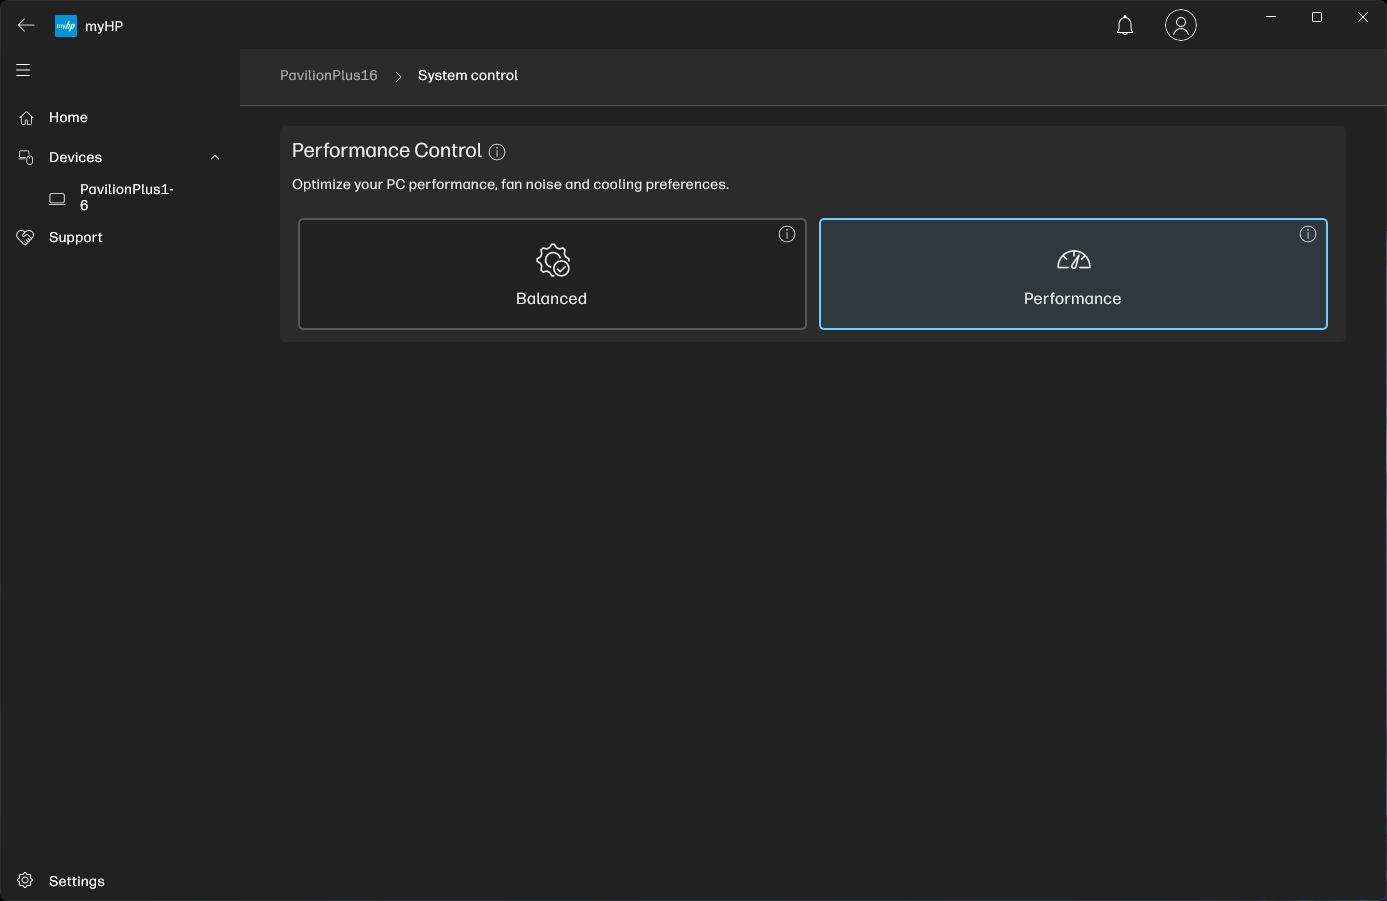
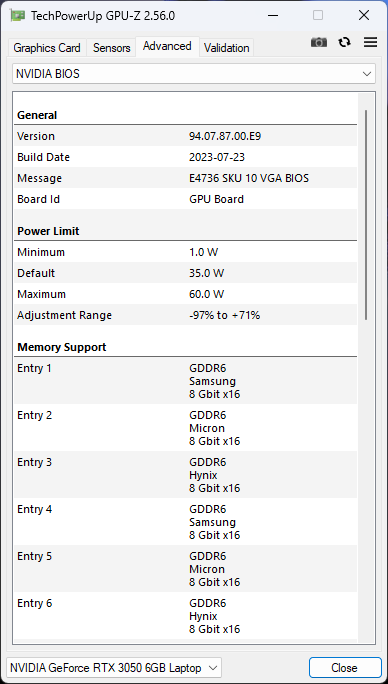
Med myHP-appen kan användaren välja mellan två driftlägen: Balanserad och Prestanda. I läget Balanced används en 50 W PL1, som går upp till 60 W i läget Performance. PL2 under båda dessa lägen är begränsad till 61 W.
RTX 3050 6 GB GPU körs som standard i MSHybrid/Optimus-läge utan möjlighet till MUX-växling.
Vi använde Performance-läget för alla riktmärken. PL1/PL2 sjunker till 35 W / 35 W vid batteridrift.
Processor
Pavilion Plus 16:s Core i7-13700H hämmas av ett lågt PL2-värde. Detta blir särskilt tydligt i flerkärniga riktmärken där den ligger betydligt efter sådana som Dell Inspiron 16 Plus 7630 som har en 89 W PL2 Core i7-13700H.
Med detta sagt verkar kylningen av Pavilion Plus 16 vara mycket effektiv för att säkerställa en väl bibehållen prestanda under vårt Cinebench R15 multi-core loop-test.
Pavilion Plus 16 toppar de flesta CPU single-core listorna, men Schenker Vision 14 M23 är precis i hälarna på den i dessa tester.
Cinebench R15 Multi Loop
Cinebench R23: Multi Core | Single Core
Cinebench R20: CPU (Multi Core) | CPU (Single Core)
Cinebench R15: CPU Multi 64Bit | CPU Single 64Bit
Blender: v2.79 BMW27 CPU
7-Zip 18.03: 7z b 4 | 7z b 4 -mmt1
Geekbench 6.7: Multi-Core | Single-Core
Geekbench 5.5: Multi-Core | Single-Core
HWBOT x265 Benchmark v2.2: 4k Preset
LibreOffice : 20 Documents To PDF
R Benchmark 2.5: Overall mean
| CPU Performance rating | |
| Genomsnitt av klass Multimedia | |
| Dell Inspiron 16 Plus 7630 | |
| Genomsnitt Intel Core i7-13700H | |
| HP Pavilion Plus 16-ab0456tx | |
| Asus VivoBook Pro 16 K6602VU | |
| Samsung Galaxy Book3 Ultra 16 -2! | |
| Schenker Vision 14 M23 RTX 3050 | |
| Asus VivoBook 14X K3405 -2! | |
| Lenovo Slim Pro 7 14ARP8 -2! | |
| Cinebench R23 / Multi Core | |
| Genomsnitt av klass Multimedia (4861 - 33362, n=76, senaste 2 åren) | |
| Dell Inspiron 16 Plus 7630 | |
| Samsung Galaxy Book3 Ultra 16 | |
| Genomsnitt Intel Core i7-13700H (5890 - 20034, n=29) | |
| Asus VivoBook Pro 16 K6602VU | |
| Asus VivoBook 14X K3405 | |
| Schenker Vision 14 M23 RTX 3050 | |
| Lenovo Slim Pro 7 14ARP8 | |
| HP Pavilion Plus 16-ab0456tx | |
| Cinebench R23 / Single Core | |
| Genomsnitt av klass Multimedia (1128 - 2459, n=68, senaste 2 åren) | |
| HP Pavilion Plus 16-ab0456tx | |
| Schenker Vision 14 M23 RTX 3050 | |
| Dell Inspiron 16 Plus 7630 | |
| Genomsnitt Intel Core i7-13700H (1323 - 1914, n=29) | |
| Asus VivoBook Pro 16 K6602VU | |
| Asus VivoBook 14X K3405 | |
| Samsung Galaxy Book3 Ultra 16 | |
| Lenovo Slim Pro 7 14ARP8 | |
| Cinebench R20 / CPU (Multi Core) | |
| Genomsnitt av klass Multimedia (1887 - 12912, n=59, senaste 2 åren) | |
| Dell Inspiron 16 Plus 7630 | |
| Samsung Galaxy Book3 Ultra 16 | |
| Genomsnitt Intel Core i7-13700H (2322 - 7674, n=29) | |
| HP Pavilion Plus 16-ab0456tx | |
| Asus VivoBook Pro 16 K6602VU | |
| Asus VivoBook 14X K3405 | |
| Schenker Vision 14 M23 RTX 3050 | |
| Lenovo Slim Pro 7 14ARP8 | |
| Cinebench R20 / CPU (Single Core) | |
| HP Pavilion Plus 16-ab0456tx | |
| Schenker Vision 14 M23 RTX 3050 | |
| Genomsnitt av klass Multimedia (425 - 853, n=59, senaste 2 åren) | |
| Dell Inspiron 16 Plus 7630 | |
| Genomsnitt Intel Core i7-13700H (508 - 741, n=29) | |
| Asus VivoBook Pro 16 K6602VU | |
| Asus VivoBook 14X K3405 | |
| Samsung Galaxy Book3 Ultra 16 | |
| Lenovo Slim Pro 7 14ARP8 | |
| Cinebench R15 / CPU Multi 64Bit | |
| Genomsnitt av klass Multimedia (856 - 5224, n=63, senaste 2 åren) | |
| Samsung Galaxy Book3 Ultra 16 | |
| Asus VivoBook Pro 16 K6602VU | |
| Dell Inspiron 16 Plus 7630 | |
| Genomsnitt Intel Core i7-13700H (905 - 2982, n=29) | |
| Asus VivoBook 14X K3405 | |
| HP Pavilion Plus 16-ab0456tx | |
| Lenovo Slim Pro 7 14ARP8 | |
| Schenker Vision 14 M23 RTX 3050 | |
| Cinebench R15 / CPU Single 64Bit | |
| Genomsnitt av klass Multimedia (184.8 - 326, n=61, senaste 2 åren) | |
| HP Pavilion Plus 16-ab0456tx | |
| Schenker Vision 14 M23 RTX 3050 | |
| Dell Inspiron 16 Plus 7630 | |
| Genomsnitt Intel Core i7-13700H (213 - 278, n=29) | |
| Asus VivoBook Pro 16 K6602VU | |
| Asus VivoBook 14X K3405 | |
| Samsung Galaxy Book3 Ultra 16 | |
| Lenovo Slim Pro 7 14ARP8 | |
| Blender / v2.79 BMW27 CPU | |
| Schenker Vision 14 M23 RTX 3050 | |
| Genomsnitt av klass Multimedia (100 - 557, n=60, senaste 2 åren) | |
| Lenovo Slim Pro 7 14ARP8 | |
| Asus VivoBook 14X K3405 | |
| Genomsnitt Intel Core i7-13700H (169 - 555, n=29) | |
| Samsung Galaxy Book3 Ultra 16 | |
| Dell Inspiron 16 Plus 7630 | |
| HP Pavilion Plus 16-ab0456tx | |
| Asus VivoBook Pro 16 K6602VU | |
| 7-Zip 18.03 / 7z b 4 | |
| Asus VivoBook Pro 16 K6602VU | |
| HP Pavilion Plus 16-ab0456tx | |
| Samsung Galaxy Book3 Ultra 16 | |
| Genomsnitt Intel Core i7-13700H (27322 - 76344, n=29) | |
| Dell Inspiron 16 Plus 7630 | |
| Genomsnitt av klass Multimedia (26062 - 130368, n=57, senaste 2 åren) | |
| Lenovo Slim Pro 7 14ARP8 | |
| Schenker Vision 14 M23 RTX 3050 | |
| Asus VivoBook 14X K3405 | |
| 7-Zip 18.03 / 7z b 4 -mmt1 | |
| Schenker Vision 14 M23 RTX 3050 | |
| HP Pavilion Plus 16-ab0456tx | |
| Genomsnitt av klass Multimedia (3666 - 7545, n=58, senaste 2 åren) | |
| Genomsnitt Intel Core i7-13700H (4825 - 6238, n=29) | |
| Asus VivoBook Pro 16 K6602VU | |
| Dell Inspiron 16 Plus 7630 | |
| Asus VivoBook 14X K3405 | |
| Samsung Galaxy Book3 Ultra 16 | |
| Lenovo Slim Pro 7 14ARP8 | |
| Geekbench 6.7 / Multi-Core | |
| Genomsnitt av klass Multimedia (4983 - 29415, n=71, senaste 2 åren) | |
| Dell Inspiron 16 Plus 7630 | |
| HP Pavilion Plus 16-ab0456tx | |
| Schenker Vision 14 M23 RTX 3050 | |
| Genomsnitt Intel Core i7-13700H (8415 - 13832, n=13) | |
| Asus VivoBook Pro 16 K6602VU | |
| Geekbench 6.7 / Single-Core | |
| Genomsnitt av klass Multimedia (1534 - 4335, n=70, senaste 2 åren) | |
| Schenker Vision 14 M23 RTX 3050 | |
| Dell Inspiron 16 Plus 7630 | |
| HP Pavilion Plus 16-ab0456tx | |
| Genomsnitt Intel Core i7-13700H (2316 - 2639, n=13) | |
| Asus VivoBook Pro 16 K6602VU | |
| Geekbench 5.5 / Multi-Core | |
| Genomsnitt av klass Multimedia (4652 - 20422, n=58, senaste 2 åren) | |
| Dell Inspiron 16 Plus 7630 | |
| Genomsnitt Intel Core i7-13700H (6165 - 14215, n=29) | |
| Samsung Galaxy Book3 Ultra 16 | |
| HP Pavilion Plus 16-ab0456tx | |
| Schenker Vision 14 M23 RTX 3050 | |
| Asus VivoBook Pro 16 K6602VU | |
| Asus VivoBook 14X K3405 | |
| Lenovo Slim Pro 7 14ARP8 | |
| Geekbench 5.5 / Single-Core | |
| Genomsnitt av klass Multimedia (805 - 2974, n=58, senaste 2 åren) | |
| Dell Inspiron 16 Plus 7630 | |
| Schenker Vision 14 M23 RTX 3050 | |
| HP Pavilion Plus 16-ab0456tx | |
| Genomsnitt Intel Core i7-13700H (1362 - 1919, n=29) | |
| Asus VivoBook Pro 16 K6602VU | |
| Samsung Galaxy Book3 Ultra 16 | |
| Asus VivoBook 14X K3405 | |
| Lenovo Slim Pro 7 14ARP8 | |
| HWBOT x265 Benchmark v2.2 / 4k Preset | |
| Genomsnitt av klass Multimedia (5.26 - 36.1, n=58, senaste 2 åren) | |
| Samsung Galaxy Book3 Ultra 16 | |
| Asus VivoBook Pro 16 K6602VU | |
| Genomsnitt Intel Core i7-13700H (6.72 - 21.2, n=29) | |
| HP Pavilion Plus 16-ab0456tx | |
| Lenovo Slim Pro 7 14ARP8 | |
| Dell Inspiron 16 Plus 7630 | |
| Asus VivoBook 14X K3405 | |
| Schenker Vision 14 M23 RTX 3050 | |
| LibreOffice / 20 Documents To PDF | |
| HP Pavilion Plus 16-ab0456tx | |
| Lenovo Slim Pro 7 14ARP8 | |
| Schenker Vision 14 M23 RTX 3050 | |
| Asus VivoBook Pro 16 K6602VU | |
| Genomsnitt av klass Multimedia (23.9 - 146.7, n=59, senaste 2 åren) | |
| Samsung Galaxy Book3 Ultra 16 | |
| Genomsnitt Intel Core i7-13700H (31.3 - 62.4, n=29) | |
| Asus VivoBook 14X K3405 | |
| Dell Inspiron 16 Plus 7630 | |
| R Benchmark 2.5 / Overall mean | |
| Lenovo Slim Pro 7 14ARP8 | |
| Asus VivoBook 14X K3405 | |
| Samsung Galaxy Book3 Ultra 16 | |
| Asus VivoBook Pro 16 K6602VU | |
| Genomsnitt Intel Core i7-13700H (0.4308 - 0.607, n=29) | |
| Genomsnitt av klass Multimedia (0.3604 - 0.947, n=58, senaste 2 åren) | |
| Schenker Vision 14 M23 RTX 3050 | |
| HP Pavilion Plus 16-ab0456tx | |
| Dell Inspiron 16 Plus 7630 | |
* ... mindre är bättre
AIDA64: FP32 Ray-Trace | FPU Julia | CPU SHA3 | CPU Queen | FPU SinJulia | FPU Mandel | CPU AES | CPU ZLib | FP64 Ray-Trace | CPU PhotoWorxx
| Performance rating | |
| Genomsnitt av klass Multimedia | |
| Asus VivoBook Pro 16 K6602VU | |
| Lenovo Slim Pro 7 14ARP8 | |
| HP Pavilion Plus 16-ab0456tx | |
| Samsung Galaxy Book3 Ultra 16 | |
| Genomsnitt Intel Core i7-13700H | |
| Dell Inspiron 16 Plus 7630 | |
| Asus VivoBook 14X K3405 | |
| Schenker Vision 14 M23 RTX 3050 | |
| AIDA64 / FP32 Ray-Trace | |
| Genomsnitt av klass Multimedia (2214 - 50388, n=55, senaste 2 åren) | |
| Lenovo Slim Pro 7 14ARP8 | |
| HP Pavilion Plus 16-ab0456tx | |
| Samsung Galaxy Book3 Ultra 16 | |
| Genomsnitt Intel Core i7-13700H (4986 - 18908, n=29) | |
| Dell Inspiron 16 Plus 7630 | |
| Asus VivoBook Pro 16 K6602VU | |
| Asus VivoBook 14X K3405 | |
| Schenker Vision 14 M23 RTX 3050 | |
| AIDA64 / FPU Julia | |
| Lenovo Slim Pro 7 14ARP8 | |
| Genomsnitt av klass Multimedia (12867 - 201874, n=56, senaste 2 åren) | |
| HP Pavilion Plus 16-ab0456tx | |
| Asus VivoBook Pro 16 K6602VU | |
| Genomsnitt Intel Core i7-13700H (25360 - 92359, n=29) | |
| Samsung Galaxy Book3 Ultra 16 | |
| Dell Inspiron 16 Plus 7630 | |
| Asus VivoBook 14X K3405 | |
| Schenker Vision 14 M23 RTX 3050 | |
| AIDA64 / CPU SHA3 | |
| Genomsnitt av klass Multimedia (626 - 8623, n=56, senaste 2 åren) | |
| Asus VivoBook 14X K3405 | |
| HP Pavilion Plus 16-ab0456tx | |
| Asus VivoBook Pro 16 K6602VU | |
| Samsung Galaxy Book3 Ultra 16 | |
| Genomsnitt Intel Core i7-13700H (1339 - 4224, n=29) | |
| Lenovo Slim Pro 7 14ARP8 | |
| Dell Inspiron 16 Plus 7630 | |
| Schenker Vision 14 M23 RTX 3050 | |
| AIDA64 / CPU Queen | |
| Dell Inspiron 16 Plus 7630 | |
| Samsung Galaxy Book3 Ultra 16 | |
| HP Pavilion Plus 16-ab0456tx | |
| Genomsnitt Intel Core i7-13700H (59324 - 107159, n=29) | |
| Asus VivoBook Pro 16 K6602VU | |
| Lenovo Slim Pro 7 14ARP8 | |
| Schenker Vision 14 M23 RTX 3050 | |
| Asus VivoBook 14X K3405 | |
| Genomsnitt av klass Multimedia (13483 - 181505, n=43, senaste 2 åren) | |
| AIDA64 / FPU SinJulia | |
| Lenovo Slim Pro 7 14ARP8 | |
| HP Pavilion Plus 16-ab0456tx | |
| Samsung Galaxy Book3 Ultra 16 | |
| Genomsnitt av klass Multimedia (886 - 28794, n=56, senaste 2 åren) | |
| Dell Inspiron 16 Plus 7630 | |
| Asus VivoBook Pro 16 K6602VU | |
| Genomsnitt Intel Core i7-13700H (4800 - 11050, n=29) | |
| Schenker Vision 14 M23 RTX 3050 | |
| Asus VivoBook 14X K3405 | |
| AIDA64 / FPU Mandel | |
| Lenovo Slim Pro 7 14ARP8 | |
| Genomsnitt av klass Multimedia (6395 - 105740, n=55, senaste 2 åren) | |
| HP Pavilion Plus 16-ab0456tx | |
| Samsung Galaxy Book3 Ultra 16 | |
| Genomsnitt Intel Core i7-13700H (12321 - 45118, n=29) | |
| Asus VivoBook Pro 16 K6602VU | |
| Dell Inspiron 16 Plus 7630 | |
| Asus VivoBook 14X K3405 | |
| Schenker Vision 14 M23 RTX 3050 | |
| AIDA64 / CPU AES | |
| Asus VivoBook Pro 16 K6602VU | |
| Asus VivoBook 14X K3405 | |
| Genomsnitt Intel Core i7-13700H (28769 - 151254, n=29) | |
| HP Pavilion Plus 16-ab0456tx | |
| Samsung Galaxy Book3 Ultra 16 | |
| Genomsnitt av klass Multimedia (8171 - 126790, n=56, senaste 2 åren) | |
| Dell Inspiron 16 Plus 7630 | |
| Schenker Vision 14 M23 RTX 3050 | |
| Lenovo Slim Pro 7 14ARP8 | |
| AIDA64 / CPU ZLib | |
| Samsung Galaxy Book3 Ultra 16 | |
| Genomsnitt av klass Multimedia (143.8 - 2022, n=56, senaste 2 åren) | |
| HP Pavilion Plus 16-ab0456tx | |
| Asus VivoBook Pro 16 K6602VU | |
| Genomsnitt Intel Core i7-13700H (389 - 1215, n=29) | |
| Asus VivoBook 14X K3405 | |
| Dell Inspiron 16 Plus 7630 | |
| Schenker Vision 14 M23 RTX 3050 | |
| Lenovo Slim Pro 7 14ARP8 | |
| AIDA64 / FP64 Ray-Trace | |
| Genomsnitt av klass Multimedia (1014 - 26875, n=56, senaste 2 åren) | |
| HP Pavilion Plus 16-ab0456tx | |
| Lenovo Slim Pro 7 14ARP8 | |
| Samsung Galaxy Book3 Ultra 16 | |
| Asus VivoBook Pro 16 K6602VU | |
| Genomsnitt Intel Core i7-13700H (2540 - 10135, n=29) | |
| Dell Inspiron 16 Plus 7630 | |
| Asus VivoBook 14X K3405 | |
| Schenker Vision 14 M23 RTX 3050 | |
| AIDA64 / CPU PhotoWorxx | |
| Genomsnitt av klass Multimedia (8187 - 88154, n=56, senaste 2 åren) | |
| Samsung Galaxy Book3 Ultra 16 | |
| Schenker Vision 14 M23 RTX 3050 | |
| HP Pavilion Plus 16-ab0456tx | |
| Genomsnitt Intel Core i7-13700H (12872 - 52727, n=29) | |
| Asus VivoBook Pro 16 K6602VU | |
| Dell Inspiron 16 Plus 7630 | |
| Lenovo Slim Pro 7 14ARP8 | |
| Asus VivoBook 14X K3405 | |
Kolla in vår dedikerade Intel Core i7-13700H sida för fler prestandajämförelser.
Systemets prestanda
Pavilion Plus 16 lyckas på något sätt ta sig förbi VivoBook Pro 16 med en Core i9-13900H och RTX 4050 kombinationen i övergripande CrossMark-tester men förlorar mot den senare i PCMark 10 med 6%.
I övrigt känns systemet ganska responsivt för daglig produktivitet och webbsurfning.
CrossMark: Overall | Productivity | Creativity | Responsiveness
AIDA64: Memory Copy | Memory Read | Memory Write | Memory Latency
WebXPRT 3: Overall
WebXPRT 4: Overall
Mozilla Kraken 1.1: Total
| PCMark 10 / Score | |
| Genomsnitt av klass Multimedia (4325 - 10386, n=54, senaste 2 åren) | |
| Dell Inspiron 16 Plus 7630 | |
| Asus VivoBook Pro 16 K6602VU | |
| Samsung Galaxy Book3 Ultra 16 | |
| Asus VivoBook 14X K3405 | |
| HP Pavilion Plus 16-ab0456tx | |
| Genomsnitt Intel Core i7-13700H, NVIDIA GeForce RTX 3050 6GB Laptop GPU (6290 - 6597, n=2) | |
| Lenovo Slim Pro 7 14ARP8 | |
| Schenker Vision 14 M23 RTX 3050 | |
| PCMark 10 / Essentials | |
| Dell Inspiron 16 Plus 7630 | |
| Samsung Galaxy Book3 Ultra 16 | |
| Genomsnitt av klass Multimedia (8025 - 11664, n=53, senaste 2 åren) | |
| Asus VivoBook Pro 16 K6602VU | |
| Asus VivoBook 14X K3405 | |
| HP Pavilion Plus 16-ab0456tx | |
| Genomsnitt Intel Core i7-13700H, NVIDIA GeForce RTX 3050 6GB Laptop GPU (9943 - 10112, n=2) | |
| Lenovo Slim Pro 7 14ARP8 | |
| Schenker Vision 14 M23 RTX 3050 | |
| PCMark 10 / Productivity | |
| Genomsnitt av klass Multimedia (7323 - 18233, n=53, senaste 2 åren) | |
| Dell Inspiron 16 Plus 7630 | |
| Asus VivoBook 14X K3405 | |
| Schenker Vision 14 M23 RTX 3050 | |
| Genomsnitt Intel Core i7-13700H, NVIDIA GeForce RTX 3050 6GB Laptop GPU (8803 - 8950, n=2) | |
| HP Pavilion Plus 16-ab0456tx | |
| Asus VivoBook Pro 16 K6602VU | |
| Samsung Galaxy Book3 Ultra 16 | |
| Lenovo Slim Pro 7 14ARP8 | |
| PCMark 10 / Digital Content Creation | |
| Dell Inspiron 16 Plus 7630 | |
| Asus VivoBook Pro 16 K6602VU | |
| Genomsnitt av klass Multimedia (3651 - 16240, n=53, senaste 2 åren) | |
| Samsung Galaxy Book3 Ultra 16 | |
| Lenovo Slim Pro 7 14ARP8 | |
| HP Pavilion Plus 16-ab0456tx | |
| Asus VivoBook 14X K3405 | |
| Genomsnitt Intel Core i7-13700H, NVIDIA GeForce RTX 3050 6GB Laptop GPU (7590 - 8752, n=2) | |
| Schenker Vision 14 M23 RTX 3050 | |
| CrossMark / Overall | |
| Genomsnitt av klass Multimedia (866 - 2728, n=62, senaste 2 åren) | |
| Dell Inspiron 16 Plus 7630 | |
| HP Pavilion Plus 16-ab0456tx | |
| Asus VivoBook Pro 16 K6602VU | |
| Asus VivoBook 14X K3405 | |
| Genomsnitt Intel Core i7-13700H, NVIDIA GeForce RTX 3050 6GB Laptop GPU (1504 - 1752, n=2) | |
| Samsung Galaxy Book3 Ultra 16 | |
| Schenker Vision 14 M23 RTX 3050 | |
| Lenovo Slim Pro 7 14ARP8 | |
| CrossMark / Productivity | |
| Genomsnitt av klass Multimedia (931 - 2489, n=62, senaste 2 åren) | |
| Dell Inspiron 16 Plus 7630 | |
| Asus VivoBook Pro 16 K6602VU | |
| HP Pavilion Plus 16-ab0456tx | |
| Asus VivoBook 14X K3405 | |
| Genomsnitt Intel Core i7-13700H, NVIDIA GeForce RTX 3050 6GB Laptop GPU (1417 - 1657, n=2) | |
| Samsung Galaxy Book3 Ultra 16 | |
| Schenker Vision 14 M23 RTX 3050 | |
| Lenovo Slim Pro 7 14ARP8 | |
| CrossMark / Creativity | |
| Genomsnitt av klass Multimedia (907 - 3465, n=62, senaste 2 åren) | |
| Dell Inspiron 16 Plus 7630 | |
| HP Pavilion Plus 16-ab0456tx | |
| Asus VivoBook Pro 16 K6602VU | |
| Genomsnitt Intel Core i7-13700H, NVIDIA GeForce RTX 3050 6GB Laptop GPU (1711 - 1970, n=2) | |
| Schenker Vision 14 M23 RTX 3050 | |
| Asus VivoBook 14X K3405 | |
| Samsung Galaxy Book3 Ultra 16 | |
| Lenovo Slim Pro 7 14ARP8 | |
| CrossMark / Responsiveness | |
| Dell Inspiron 16 Plus 7630 | |
| Genomsnitt av klass Multimedia (605 - 2024, n=62, senaste 2 åren) | |
| Asus VivoBook Pro 16 K6602VU | |
| Samsung Galaxy Book3 Ultra 16 | |
| Asus VivoBook 14X K3405 | |
| HP Pavilion Plus 16-ab0456tx | |
| Genomsnitt Intel Core i7-13700H, NVIDIA GeForce RTX 3050 6GB Laptop GPU (1220 - 1458, n=2) | |
| Schenker Vision 14 M23 RTX 3050 | |
| Lenovo Slim Pro 7 14ARP8 | |
| AIDA64 / Memory Copy | |
| Genomsnitt av klass Multimedia (11299 - 132135, n=56, senaste 2 åren) | |
| Samsung Galaxy Book3 Ultra 16 | |
| Schenker Vision 14 M23 RTX 3050 | |
| Genomsnitt Intel Core i7-13700H, NVIDIA GeForce RTX 3050 6GB Laptop GPU (64356 - 65837, n=2) | |
| HP Pavilion Plus 16-ab0456tx | |
| Dell Inspiron 16 Plus 7630 | |
| Asus VivoBook Pro 16 K6602VU | |
| Lenovo Slim Pro 7 14ARP8 | |
| Asus VivoBook 14X K3405 | |
| AIDA64 / Memory Read | |
| Genomsnitt av klass Multimedia (11624 - 174586, n=56, senaste 2 åren) | |
| Schenker Vision 14 M23 RTX 3050 | |
| Samsung Galaxy Book3 Ultra 16 | |
| Genomsnitt Intel Core i7-13700H, NVIDIA GeForce RTX 3050 6GB Laptop GPU (65825 - 70861, n=2) | |
| Dell Inspiron 16 Plus 7630 | |
| Asus VivoBook Pro 16 K6602VU | |
| HP Pavilion Plus 16-ab0456tx | |
| Lenovo Slim Pro 7 14ARP8 | |
| Asus VivoBook 14X K3405 | |
| AIDA64 / Memory Write | |
| Samsung Galaxy Book3 Ultra 16 | |
| Genomsnitt av klass Multimedia (11755 - 134998, n=56, senaste 2 åren) | |
| HP Pavilion Plus 16-ab0456tx | |
| Genomsnitt Intel Core i7-13700H, NVIDIA GeForce RTX 3050 6GB Laptop GPU (68174 - 76930, n=2) | |
| Schenker Vision 14 M23 RTX 3050 | |
| Asus VivoBook Pro 16 K6602VU | |
| Dell Inspiron 16 Plus 7630 | |
| Lenovo Slim Pro 7 14ARP8 | |
| Asus VivoBook 14X K3405 | |
| AIDA64 / Memory Latency | |
| Genomsnitt av klass Multimedia (7 - 535, n=55, senaste 2 åren) | |
| Lenovo Slim Pro 7 14ARP8 | |
| Samsung Galaxy Book3 Ultra 16 | |
| Dell Inspiron 16 Plus 7630 | |
| Asus VivoBook Pro 16 K6602VU | |
| HP Pavilion Plus 16-ab0456tx | |
| Asus VivoBook 14X K3405 | |
| Genomsnitt Intel Core i7-13700H, NVIDIA GeForce RTX 3050 6GB Laptop GPU (85.7 - 89.7, n=2) | |
| Schenker Vision 14 M23 RTX 3050 | |
| WebXPRT 3 / Overall | |
| Genomsnitt av klass Multimedia (136.4 - 596, n=65, senaste 2 åren) | |
| Dell Inspiron 16 Plus 7630 | |
| Schenker Vision 14 M23 RTX 3050 | |
| Genomsnitt Intel Core i7-13700H, NVIDIA GeForce RTX 3050 6GB Laptop GPU (286 - 300, n=2) | |
| HP Pavilion Plus 16-ab0456tx | |
| Asus VivoBook 14X K3405 | |
| Lenovo Slim Pro 7 14ARP8 | |
| Samsung Galaxy Book3 Ultra 16 | |
| WebXPRT 4 / Overall | |
| Schenker Vision 14 M23 RTX 3050 | |
| Genomsnitt Intel Core i7-13700H, NVIDIA GeForce RTX 3050 6GB Laptop GPU (273 - 325, n=2) | |
| Genomsnitt av klass Multimedia (167.3 - 402, n=67, senaste 2 åren) | |
| Dell Inspiron 16 Plus 7630 | |
| HP Pavilion Plus 16-ab0456tx | |
| Asus VivoBook 14X K3405 | |
| Asus VivoBook Pro 16 K6602VU | |
| Samsung Galaxy Book3 Ultra 16 | |
| Lenovo Slim Pro 7 14ARP8 | |
| Mozilla Kraken 1.1 / Total | |
| Lenovo Slim Pro 7 14ARP8 | |
| Samsung Galaxy Book3 Ultra 16 | |
| Asus VivoBook 14X K3405 | |
| Asus VivoBook Pro 16 K6602VU | |
| Dell Inspiron 16 Plus 7630 | |
| Schenker Vision 14 M23 RTX 3050 | |
| Genomsnitt Intel Core i7-13700H, NVIDIA GeForce RTX 3050 6GB Laptop GPU (490 - 496, n=2) | |
| HP Pavilion Plus 16-ab0456tx | |
| Genomsnitt av klass Multimedia (228 - 835, n=68, senaste 2 åren) | |
* ... mindre är bättre
| PCMark 8 Home Score Accelerated v2 | 5525 poäng | |
| PCMark 8 Work Score Accelerated v2 | 5653 poäng | |
| PCMark 10 Score | 6597 poäng | |
Hjälp | ||
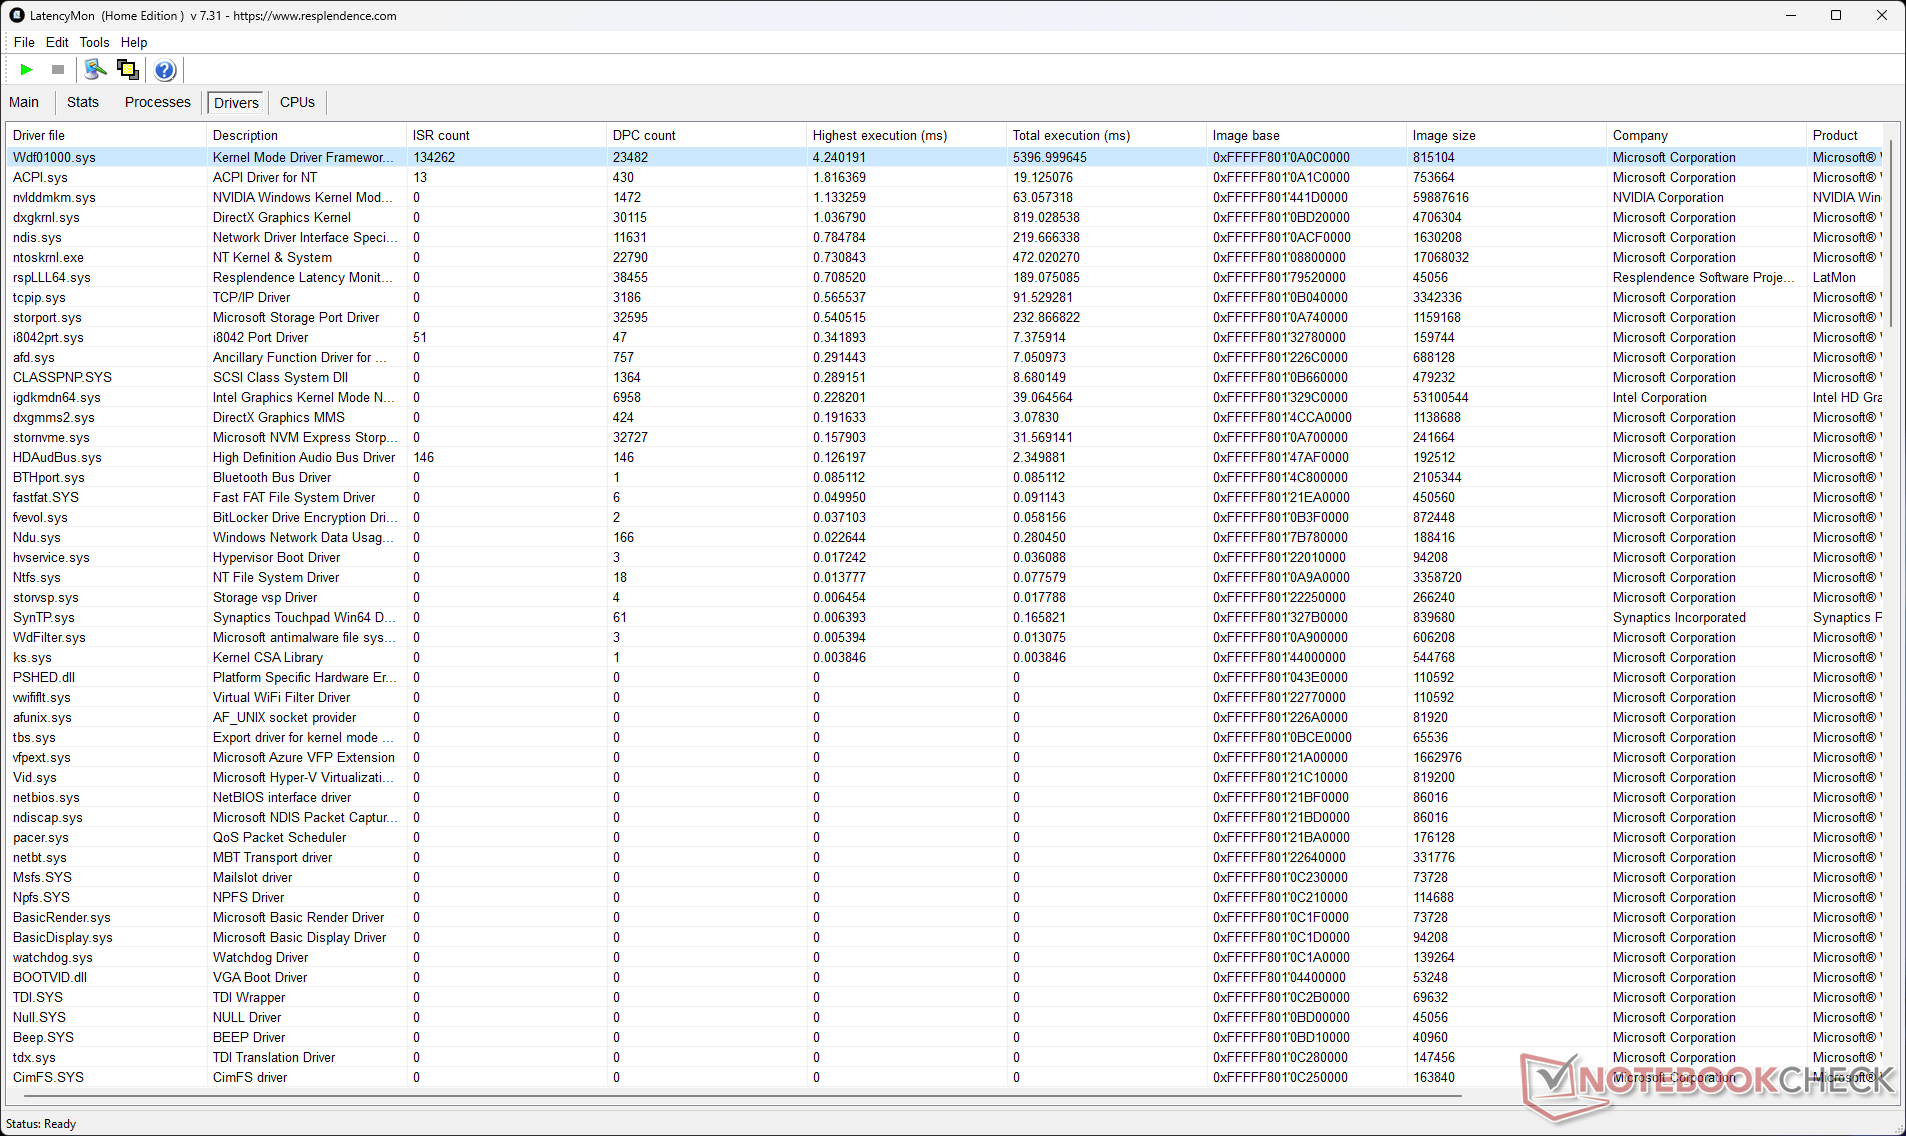
DPC-fördröjning
Den uppmätta interrupt-till-process-latenstiden på 5325,1 μs för Pavilion Plus 16 är på den högre sidan, vilket kan vara ett problem för dem som arbetar med ljud- och videoarbetsflöden i realtid.
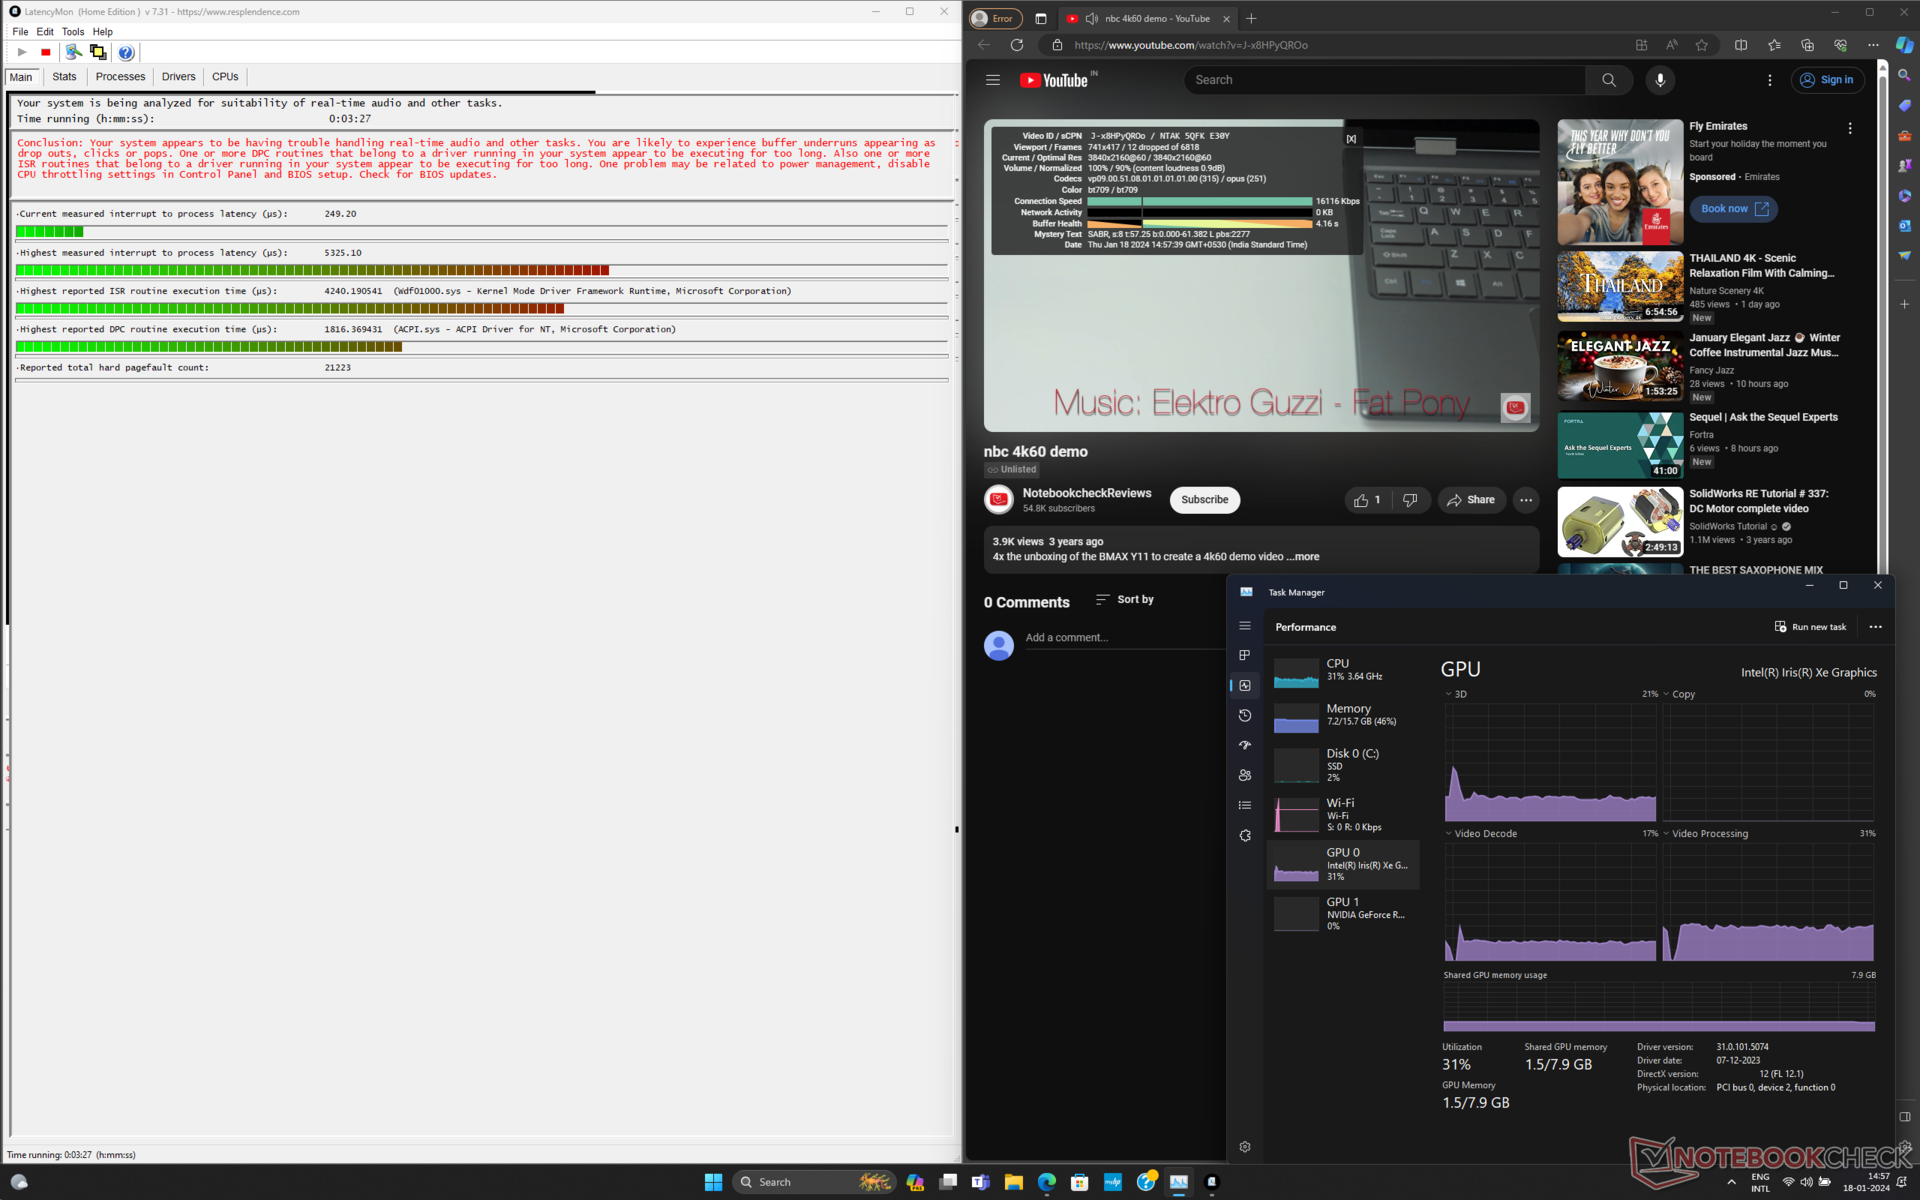
| DPC Latencies / LatencyMon - interrupt to process latency (max), Web, Youtube, Prime95 | |
| HP Pavilion Plus 16-ab0456tx | |
| Samsung Galaxy Book3 Ultra 16 | |
| Asus VivoBook Pro 16 K6602VU | |
| Schenker Vision 14 M23 RTX 3050 | |
| Lenovo Slim Pro 7 14ARP8 | |
| Asus VivoBook 14X K3405 | |
| Dell Inspiron 16 Plus 7630 | |
* ... mindre är bättre
Vår DPC-rankning av latens sida innehåller fler latensjämförelser mellan granskade enheter.
Lagringsenheter
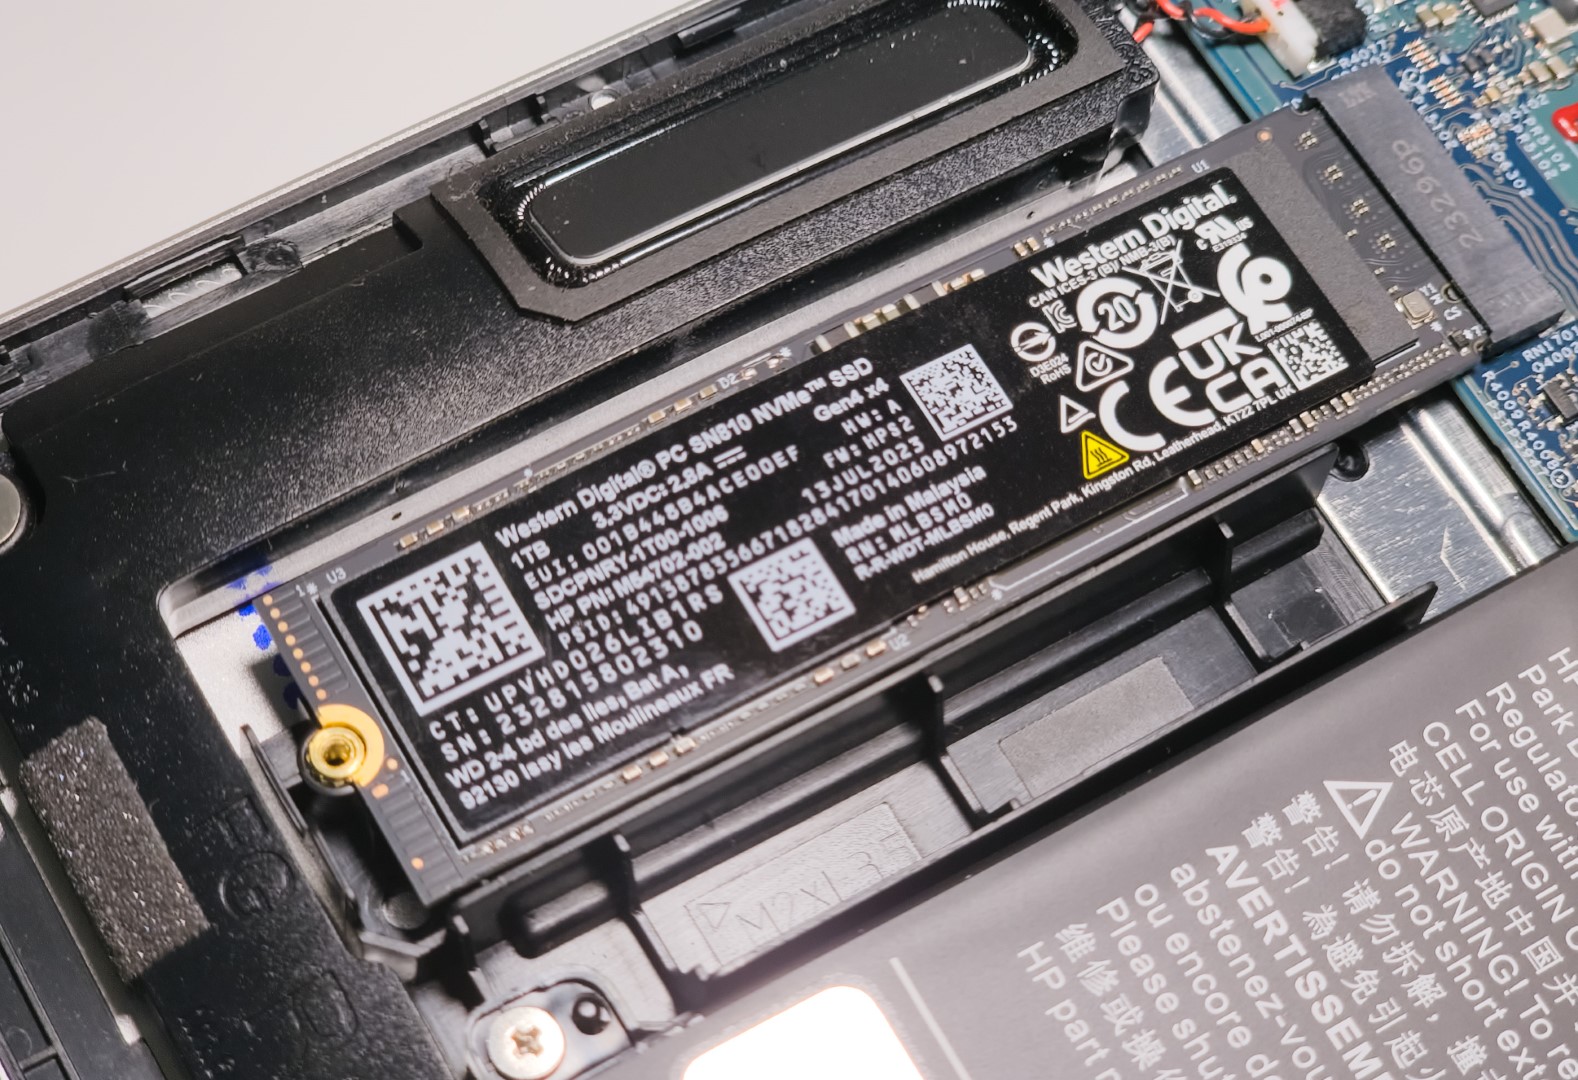
En Western Digital PC SN810 1 TB NVMe-enhet är installerad i vår Pavilion Plus 16-enhet. Den kumulativa enhetsprestandan är ca 10 % långsammare än Samsung 990 Pro i Schenker Vision 14 M23 och ca 16 % långsammare än Samsung PM9A1 i Samsung Galaxy Book3 Ultra 16.
Den lägre 4K läs-/skrivningsprestandan bidrar främst till denna prestandaförlust.
Tyvärr kan endast en SSD installeras i chassit. Det finns inte heller något utrymme för att lägga till 2,5-tums enheter.

* ... mindre är bättre
Strypning av disk: DiskSpd läsloop, ködjup 8
Även om HP tillhandahåller ett termiskt skydd för SSD, är det uppenbarligen inte tillräckligt för att förhindra att enheten stryps efter den 25: e loopen under vårt DiskSpd read loop-test med ett ködjup på 8.
Fler referensvärden för lagring finns på vår SSD-jämförelsesida.
GPU-prestanda
Pavilion Plus 16 är den enda andra bärbara datorn vi har testat som har den nyare RTX 3050 6 GB Laptop GPU förutom Lenovo Slim Pro 7 och Schenker Vision 14 M23.
RTX 3050 6 GB i HP:s bärbara dator har en TGP på 60 W medan Schenker och Lenovo har 50 W respektive 63 W implementeringar.
Följaktligen har Slim 7 Pro en liten fördel i kumulativ 3DMark-prestanda över Pavilion Plus 16 medan Vision 14 M23 släpar efter HP med 5%.
| 3DMark 11 Performance | 17282 poäng | |
| 3DMark Ice Storm Standard Score | 82182 poäng | |
| 3DMark Cloud Gate Standard Score | 43015 poäng | |
| 3DMark Fire Strike Score | 10890 poäng | |
| 3DMark Fire Strike Extreme Score | 5641 poäng | |
Hjälp | ||
| Blender / v3.3 Classroom OPTIX/RTX | |
| Asus VivoBook 14X K3405 | |
| Schenker Vision 14 M23 RTX 3050 | |
| Genomsnitt NVIDIA GeForce RTX 3050 4GB Laptop GPU (53 - 99, n=12) | |
| Lenovo Slim Pro 7 14ARP8 | |
| HP Pavilion Plus 16-ab0456tx | |
| Genomsnitt av klass Multimedia (12 - 105, n=23, senaste 2 åren) | |
| Samsung Galaxy Book3 Ultra 16 | |
| Asus VivoBook Pro 16 K6602VU | |
| Dell Inspiron 16 Plus 7630 | |
| Blender / v3.3 Classroom CUDA | |
| Asus VivoBook 14X K3405 | |
| Asus VivoBook 14X K3405 | |
| Genomsnitt NVIDIA GeForce RTX 3050 4GB Laptop GPU (97 - 152, n=13) | |
| Schenker Vision 14 M23 RTX 3050 | |
| Lenovo Slim Pro 7 14ARP8 | |
| HP Pavilion Plus 16-ab0456tx | |
| Samsung Galaxy Book3 Ultra 16 | |
| Genomsnitt av klass Multimedia (20 - 186, n=23, senaste 2 åren) | |
| Asus VivoBook Pro 16 K6602VU | |
| Dell Inspiron 16 Plus 7630 | |
| Blender / v3.3 Classroom CPU | |
| Genomsnitt NVIDIA GeForce RTX 3050 4GB Laptop GPU (388 - 937, n=11) | |
| Schenker Vision 14 M23 RTX 3050 | |
| Asus VivoBook 14X K3405 | |
| Lenovo Slim Pro 7 14ARP8 | |
| Dell Inspiron 16 Plus 7630 | |
| Genomsnitt av klass Multimedia (134.5 - 1042, n=63, senaste 2 åren) | |
| Samsung Galaxy Book3 Ultra 16 | |
| HP Pavilion Plus 16-ab0456tx | |
| Asus VivoBook Pro 16 K6602VU | |
* ... mindre är bättre
Spelprestanda
Vi ser en kumulativ fördel på cirka 10% i 1080p-spel med RTX 3050 6 GB jämfört med RTX 3050 4 GB genomsnitt.
Pavilion Plus 16:s RTX 3050 visar goda vinster i kumulativ 1080p-spelprestanda jämfört med Slim Pro 7 och Vision 14 M23 medan den släpar efter 65 W RTX 4050 Laptop GPU i VivoBook Pro 16 med 25%.
Intressant nog kan Pavilion Plus 16 också slå ut Galaxy Book3 Ultra 16 med en RTX 4050 i övergripande spel, men detta beror på den senare datorns dåliga resultat i Dota 2 Reborn och X-Plane 11.
RTX 3050 6 GB kan spela äldre titlar smidigt vid 1080p Ultra, men moderna AAA-spel kämpar med allt över 1080p High-inställningar.
Witcher 3 FPS-diagram
Vi observerade ingen märkbar strypning under ett stresstest med The Witcher 3 vid 1080p Ultra, vilket tyder på effektiv kylning.
| låg | med. | hög | ultra | QHD | |
|---|---|---|---|---|---|
| GTA V (2015) | 177.9 | 172 | 123.3 | 62.7 | 42.7 |
| The Witcher 3 (2015) | 244 | 159.1 | 91.4 | 50.1 | 37 |
| Dota 2 Reborn (2015) | 155.2 | 131 | 124.2 | 116.9 | |
| Final Fantasy XV Benchmark (2018) | 128.2 | 70.9 | 52 | 37.4 | |
| X-Plane 11.11 (2018) | 140.6 | 117 | 97.3 | ||
| Far Cry 5 (2018) | 89 | 82 | 76 | 52 | |
| Strange Brigade (2018) | 256 | 112.8 | 91.9 | 80.5 | 57.1 |
| F1 22 (2022) | 150.2 | 145.3 | 109.5 | 34 | 20.1 |
| F1 23 (2023) | 150.1 | 141.2 | 97.5 | 26 | 14.3 |
| Cyberpunk 2077 (2023) | 67.6 | 52.1 | 43.2 | 36.9 | 21.3 |
| Assassin's Creed Mirage (2023) | 70 | 63 | 55 | 41 | 31 |
| Avatar Frontiers of Pandora (2023) | 39.5 | 36.3 | 31.5 | 23.4 | 15.1 |
Se vår dedikerade Nvidia GeForce RTX 3050 6 GB GPU för bärbar dator sida för mer information.
Utsläpp: Tolerabelt fläktljud men hög yttemperatur under belastning
Buller från systemet
Vi uppmätte en ljudtrycksnivå (SPL) på 42,1 dB(A) i Performance-läget under maximal belastning. Det verkar som att HP har satt gränser för fläktljudet för att hålla sig under 35 dB(A) i läget Balanserad och 45 dB(A) i läget Prestanda.
Ljudnivå
| Låg belastning |
| 22.22 / 22.22 / 22.22 dB(A) |
| Hög belastning |
| 42.03 / 42.1 dB(A) |
 | ||
30 dB tyst 40 dB(A) hörbar 50 dB(A) högt ljud |
||
min: | ||
| Prestandaläge | Tomgång dB(A) | Genomsnittlig belastning dB(A) | Maximal belastning dB(A) | Witcher 3 1080p Ultra dB(A) |
|---|---|---|---|---|
| Balanserad | 22,22 | 33,81 | 34,08 | 34,41 / 48 fps |
| Prestanda | 22,22 | 42,03 | 42,1 | 42,1 / 50 fps |
| HP Pavilion Plus 16-ab0456tx i7-13700H, GeForce RTX 3050 6GB Laptop GPU | Schenker Vision 14 M23 RTX 3050 i7-13700H, GeForce RTX 3050 6GB Laptop GPU | Dell Inspiron 16 Plus 7630 i7-13700H, GeForce RTX 4060 Laptop GPU | Asus VivoBook 14X K3405 i5-13500H, GeForce RTX 3050 4GB Laptop GPU | Lenovo Slim Pro 7 14ARP8 R7 7735HS, GeForce RTX 3050 6GB Laptop GPU | Asus VivoBook Pro 16 K6602VU i9-13900H, GeForce RTX 4050 Laptop GPU | Samsung Galaxy Book3 Ultra 16 i7-13700H, GeForce RTX 4050 Laptop GPU | |
|---|---|---|---|---|---|---|---|
| Noise | -10% | -7% | -10% | -4% | -14% | -9% | |
| av / miljö * (dB) | 22.22 | 23.5 -6% | 23.2 -4% | 21.46 3% | 22.7 -2% | 20.96 6% | 25 -13% |
| Idle Minimum * (dB) | 22.22 | 23.5 -6% | 23.2 -4% | 22.08 1% | 22.8 -3% | 25.28 -14% | 26 -17% |
| Idle Average * (dB) | 22.22 | 23.5 -6% | 23.2 -4% | 22.08 1% | 22.8 -3% | 25.28 -14% | 27 -22% |
| Idle Maximum * (dB) | 22.22 | 26 -17% | 23.2 -4% | 22.08 1% | 22.8 -3% | 25.28 -14% | 28 -26% |
| Load Average * (dB) | 42.03 | 43.6 -4% | 35.1 16% | 52.98 -26% | 43.8 -4% | 51.88 -23% | 40 5% |
| Witcher 3 ultra * (dB) | 42.1 | 48.7 -16% | 52.5 -25% | 52.7 -25% | 43.8 -4% | 49 -16% | 39 7% |
| Load Maximum * (dB) | 42.1 | 49.1 -17% | 52.5 -25% | 52.67 -25% | 47.1 -12% | 51.8 -23% | 41 3% |
* ... mindre är bättre
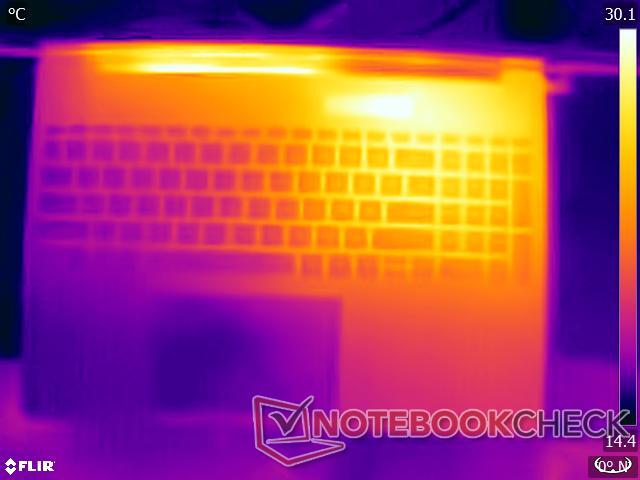
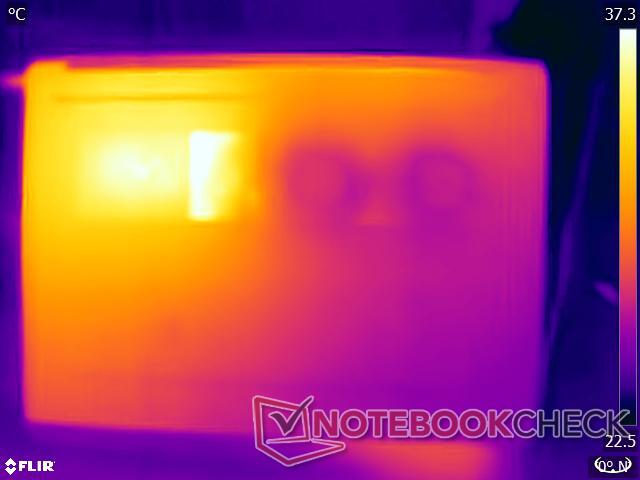
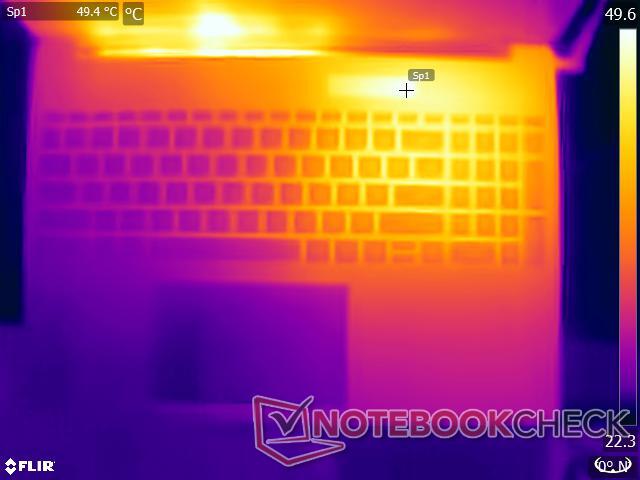
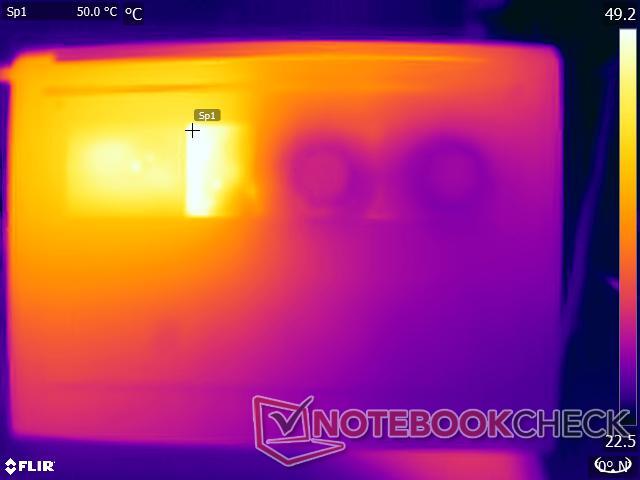
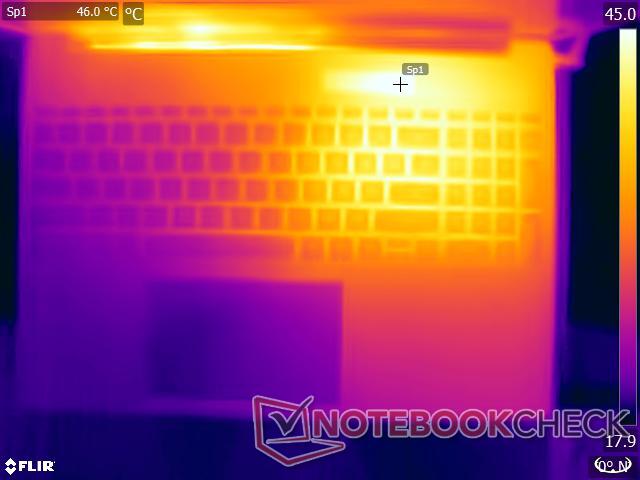
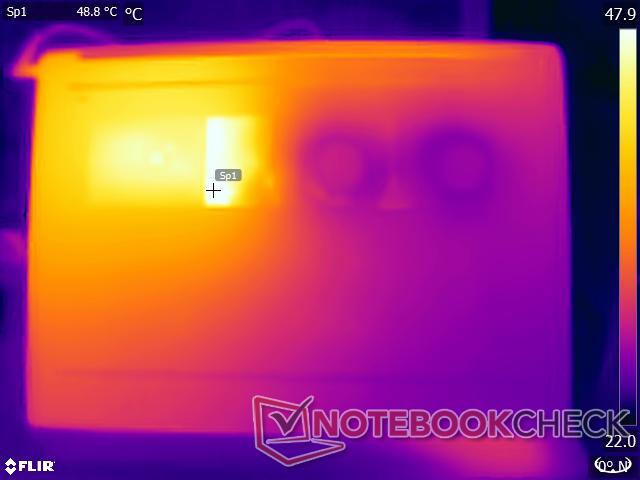
Temperatur
Pavilion Plus 16 använder ett system med dubbla fläktar och dubbla värmerör för att kyla CPU och GPU. Under våra stresstester pressades denna konfiguration till det yttersta med yttemperaturer på 49,6 °C upptill och 45,8 °C nedtill.
Även om enheten kan användas bekvämt i knät för lättare uppgifter kan det bli obekvämt under tunga arbetsbelastningar.
(-) Den maximala temperaturen på ovansidan är 49.6 °C / 121 F, jämfört med genomsnittet av 36.8 °C / 98 F , allt från 21 till 71 °C för klassen Multimedia.
(-) Botten värms upp till maximalt 45.8 °C / 114 F, jämfört med genomsnittet av 39.1 °C / 102 F
(±) Vid tomgångsbruk är medeltemperaturen för ovansidan 32.3 °C / 90 F, jämfört med enhetsgenomsnittet på 31.3 °C / ### class_avg_f### F.
(-) När du spelar The Witcher 3 är medeltemperaturen för ovansidan 39.7 °C / 103 F, jämfört med enhetsgenomsnittet på 31.3 °C / ## #class_avg_f### F.
(+) Handledsstöden och pekplattan når maximal hudtemperatur (35 °C / 95 F) och är därför inte varma.
(-) Medeltemperaturen för handledsstödsområdet på liknande enheter var 28.7 °C / 83.7 F (-6.3 °C / -11.3 F).
| HP Pavilion Plus 16-ab0456tx Intel Core i7-13700H, NVIDIA GeForce RTX 3050 6GB Laptop GPU | Schenker Vision 14 M23 RTX 3050 Intel Core i7-13700H, NVIDIA GeForce RTX 3050 6GB Laptop GPU | Dell Inspiron 16 Plus 7630 Intel Core i7-13700H, NVIDIA GeForce RTX 4060 Laptop GPU | Asus VivoBook 14X K3405 Intel Core i5-13500H, NVIDIA GeForce RTX 3050 4GB Laptop GPU | Lenovo Slim Pro 7 14ARP8 AMD Ryzen 7 7735HS, NVIDIA GeForce RTX 3050 6GB Laptop GPU | Asus VivoBook Pro 16 K6602VU Intel Core i9-13900H, NVIDIA GeForce RTX 4050 Laptop GPU | Samsung Galaxy Book3 Ultra 16 Intel Core i7-13700H, NVIDIA GeForce RTX 4050 Laptop GPU | |
|---|---|---|---|---|---|---|---|
| Heat | 10% | 6% | -2% | 19% | -1% | 22% | |
| Maximum Upper Side * (°C) | 49.6 | 48.5 2% | 47.8 4% | 49.2 1% | 42.2 15% | 42.6 14% | 41 17% |
| Maximum Bottom * (°C) | 45.8 | 52.8 -15% | 42.2 8% | 54 -18% | 49 -7% | 48.4 -6% | 44 4% |
| Idle Upper Side * (°C) | 39.2 | 27.6 30% | 35.2 10% | 33.6 14% | 24.4 38% | 39.4 -1% | 23 41% |
| Idle Bottom * (°C) | 35.4 | 27 24% | 35 1% | 37.6 -6% | 25.2 29% | 39.8 -12% | 26 27% |
* ... mindre är bättre
Stresstest
Under en Prime95 in-place stor FFT-stress klockar Pavilion Plus 16:s Core i7-13700H i genomsnitt 2,2 GHz samtidigt som den förbrukar i genomsnitt 53 W paketström.
När FurMark läggs till konkurrerar Core i7-13700H och RTX 3050 om strömmen, vilket leder till intermittent stigande och fallande klockfrekvens för både CPU och GPU.
I genomsnitt kan Core i7-13700H bara klocka upp till 1,96 GHz medan RTX 3050 klarar 910 MHz och förbrukar 41 W respektive 39 W i genomsnitt.
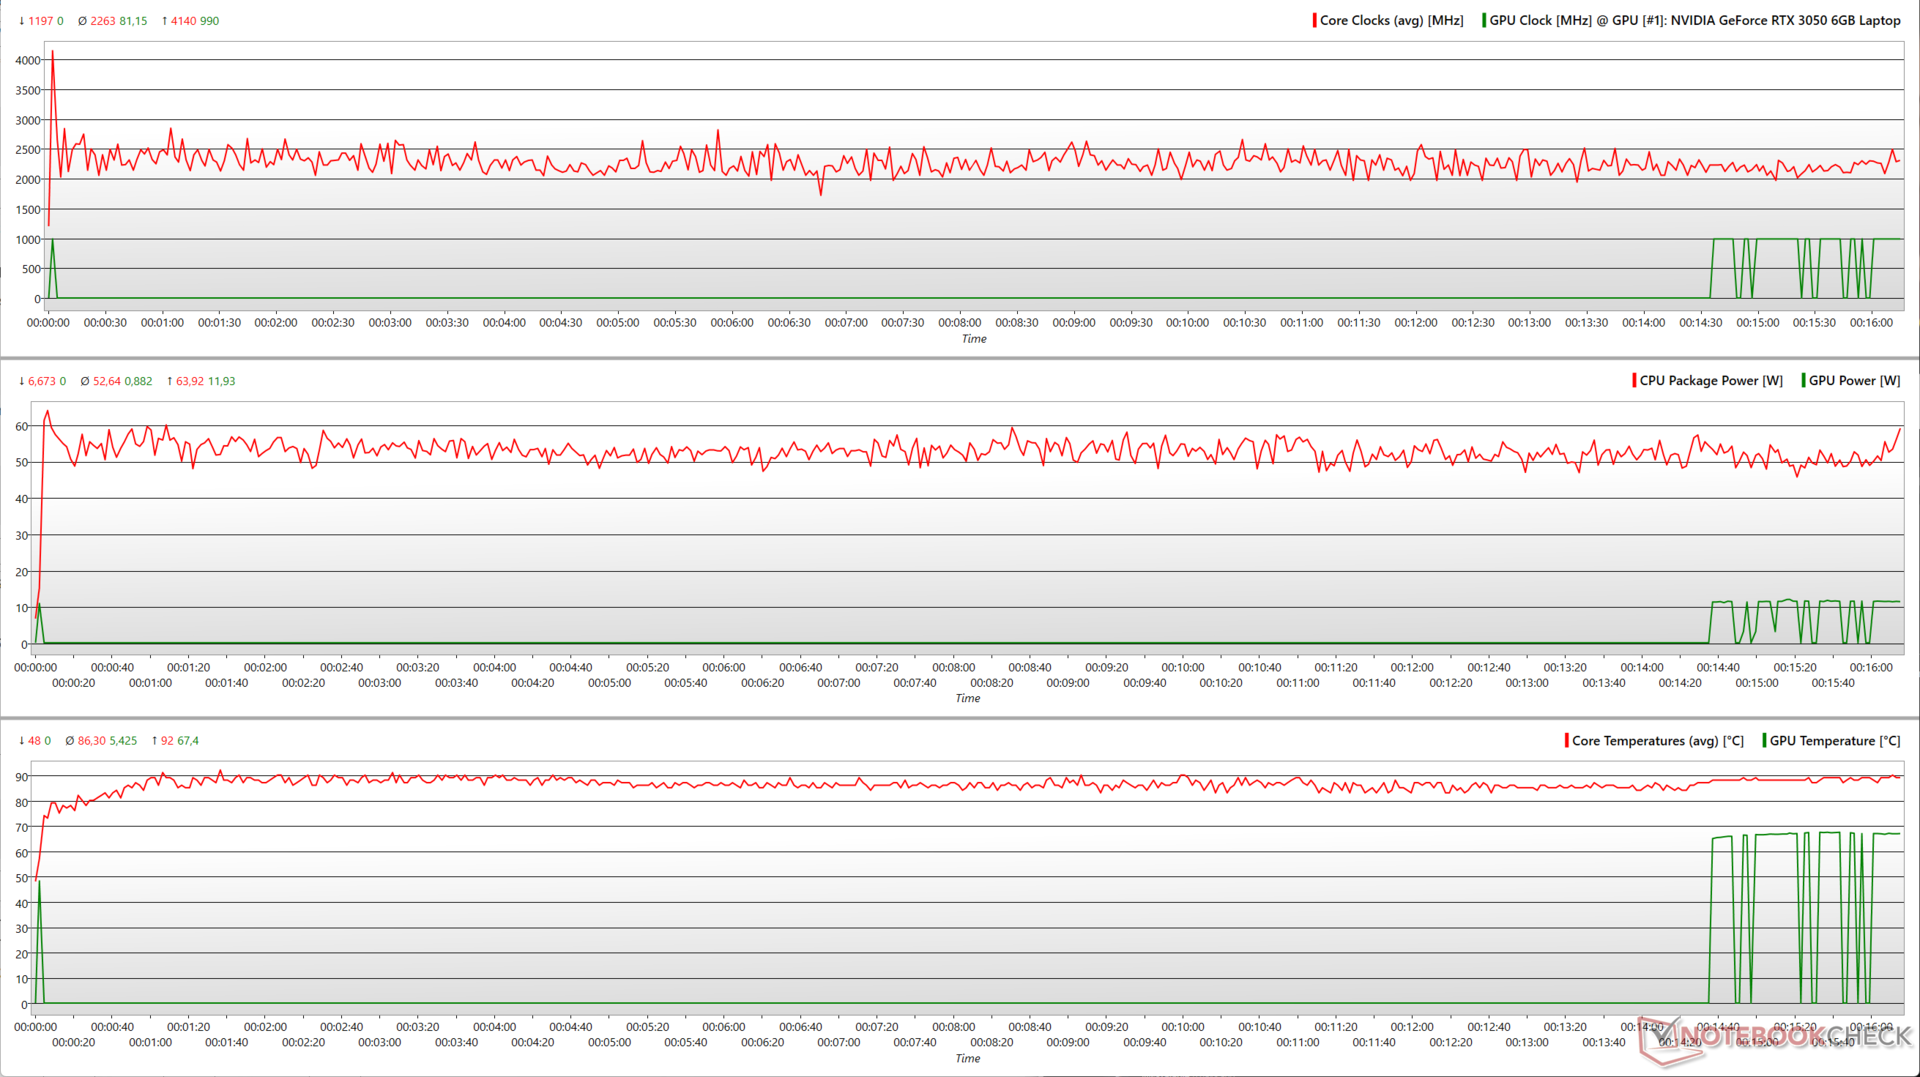
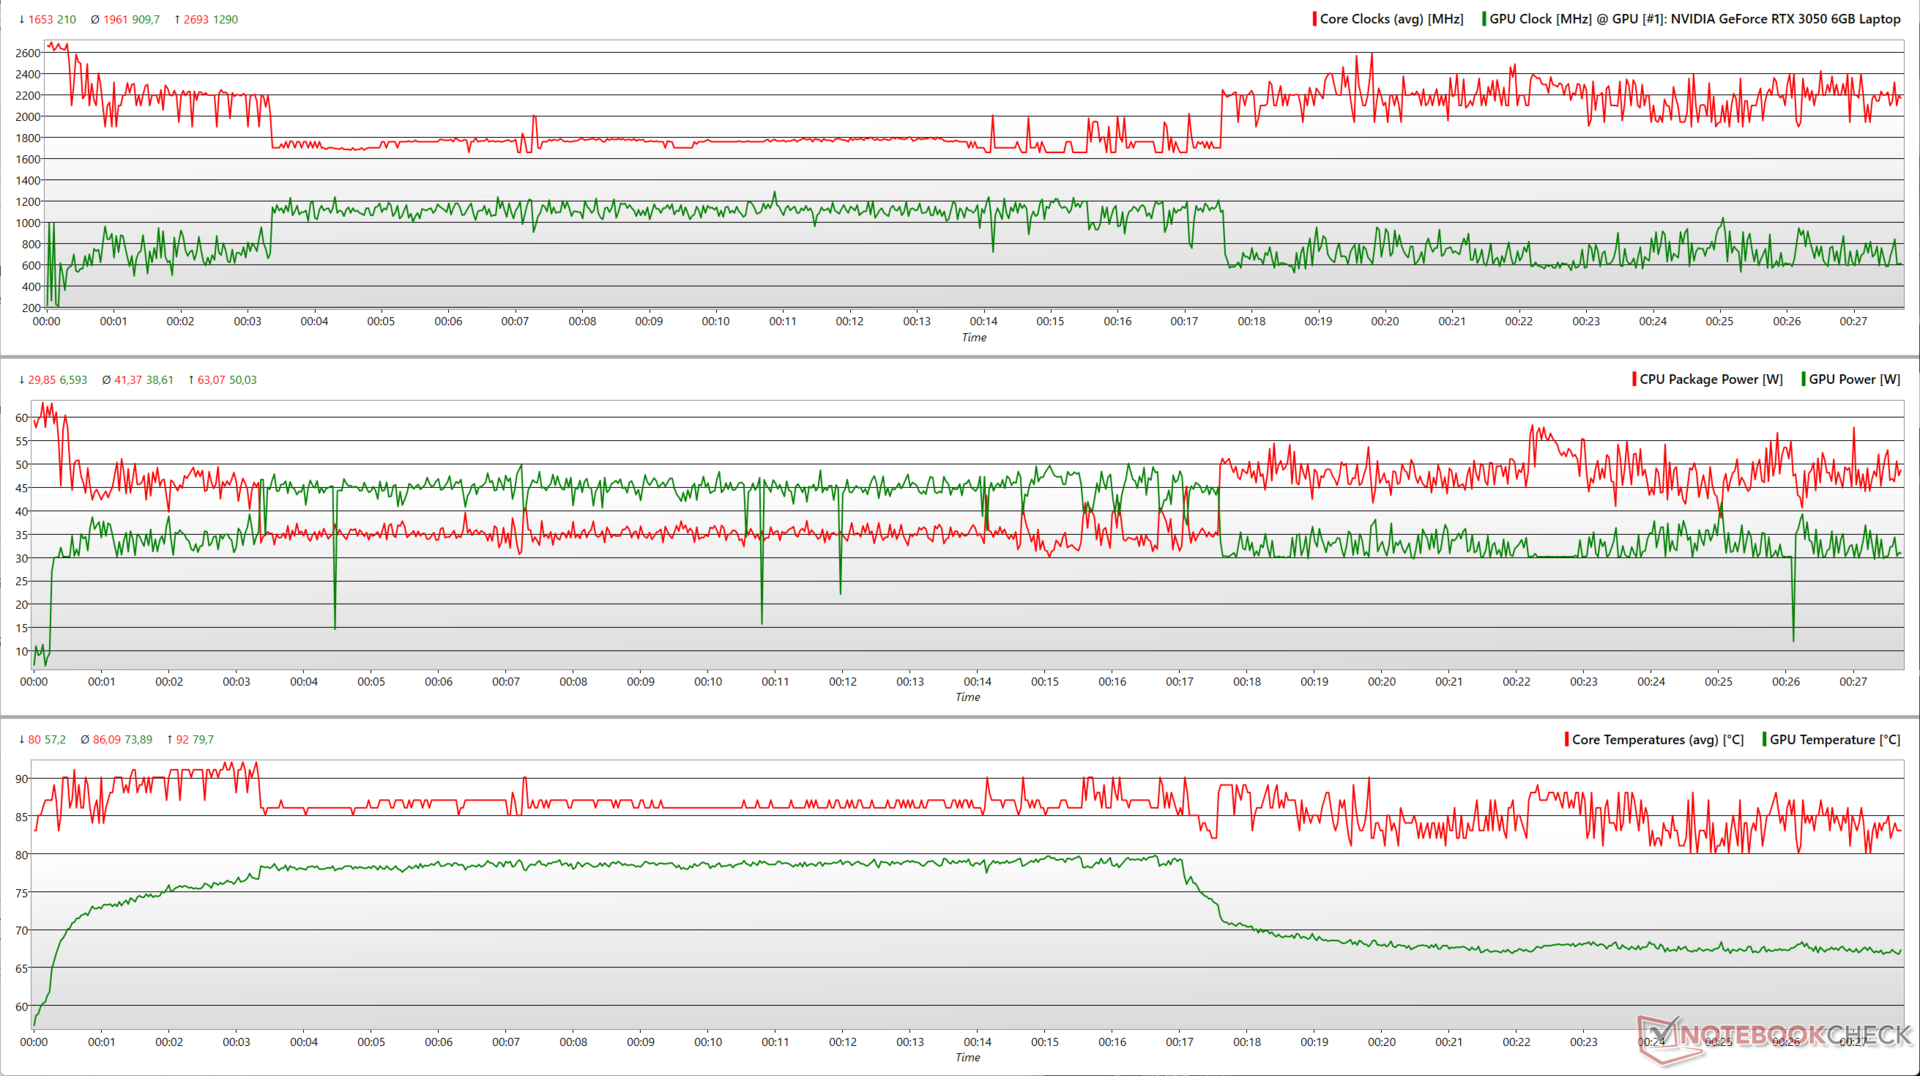
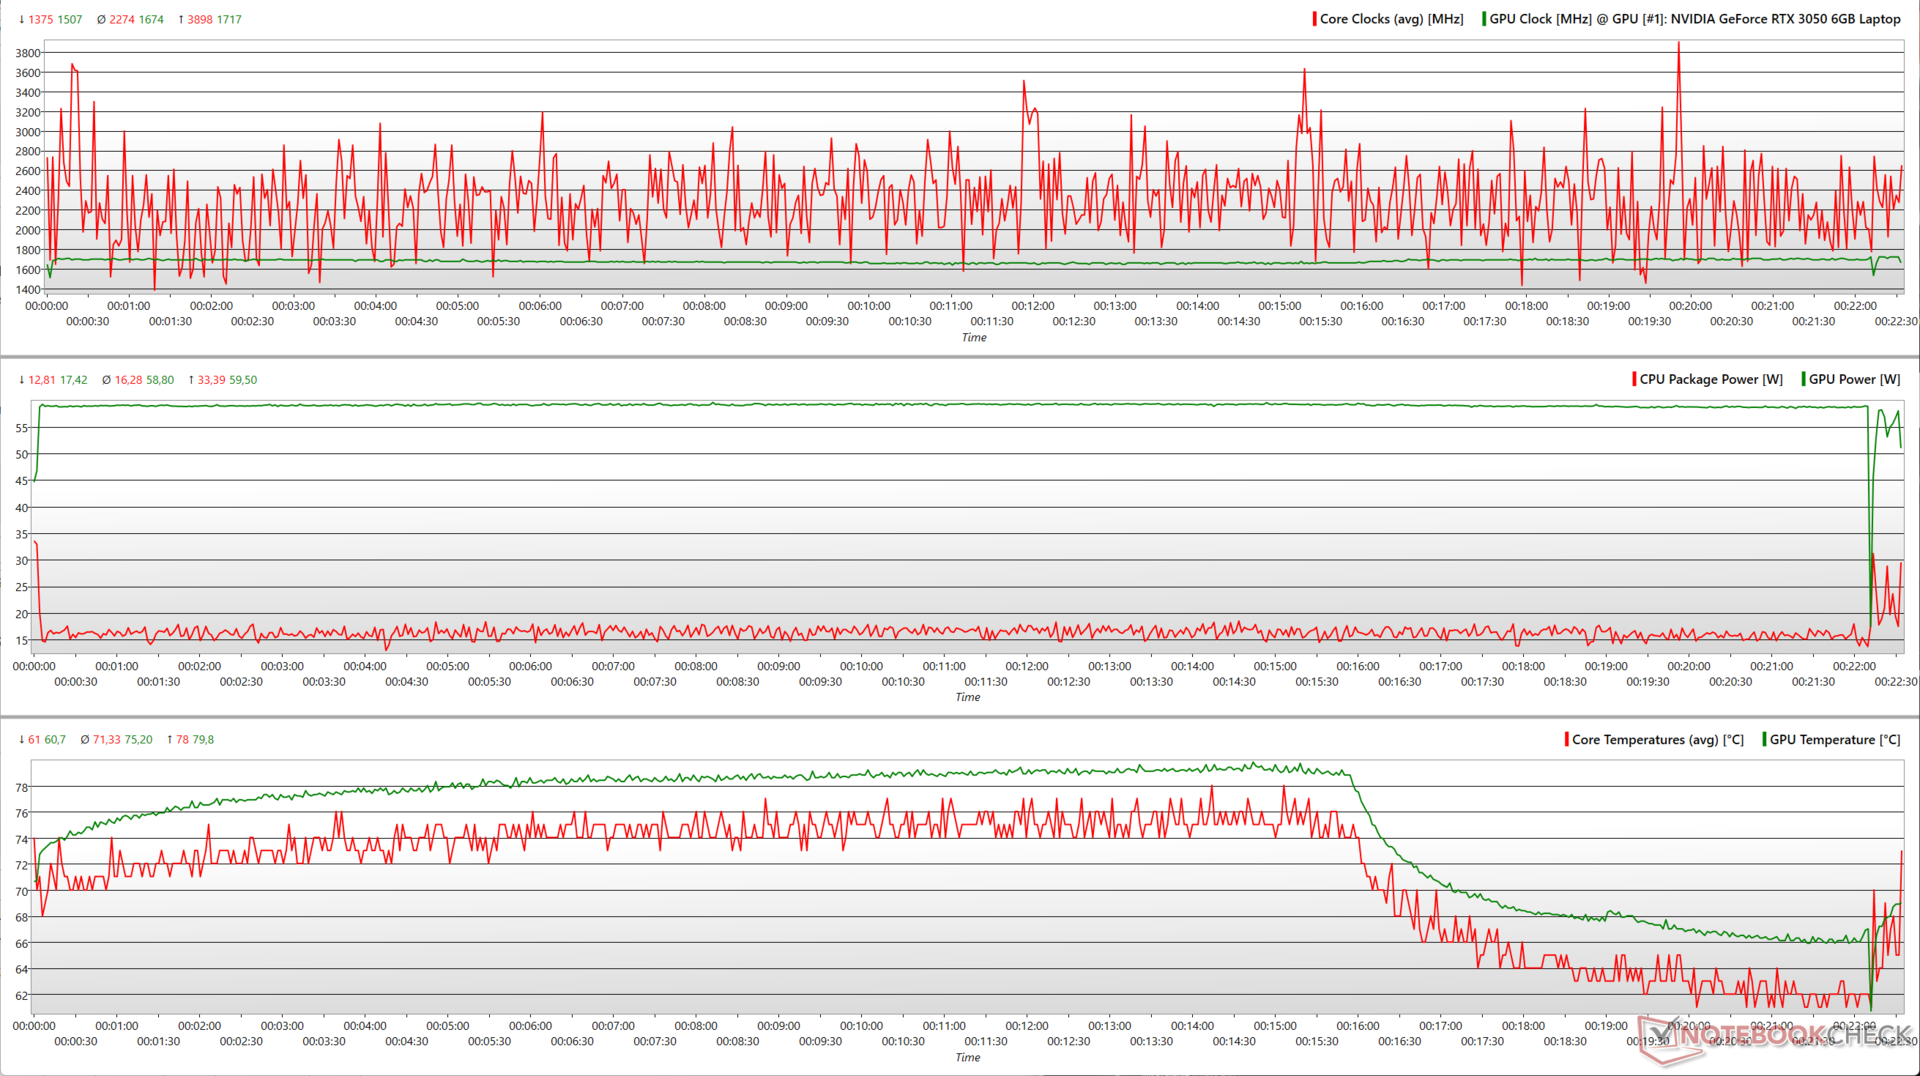
Saker och ting blir mycket mer förutsägbara med The Witcher 3 vid 1080p Ultra. RTX 3050 kan nu nästan utnyttja sin maximala TGP nära 60 W konsekvent.
Intressant nog börjar kärntemperaturerna sjunka efter ett tag även när CPU/GPU-klockorna och effekten förblir relativt oförändrade.
| Stresstest | CPU-klocka (GHz) | GPU-klocka (MHz) | Genomsnittlig CPU-temperatur (°C) | Genomsnittlig GPU-temperatur (°C) |
| System Idle | 3,74 | - | 52 | 31,1 |
| Prime95 | 2,1 | - | 86 | 67,4 |
| Prime95 + FurMark | 1,93 | 735 | 86 | 73,5 |
| The Witcher 3 1080p Ultra | 2,2 | 1 717 | 71 | 74,2 |
Högtalare
Pavilion Plus 16 levereras med ett par stereohögtalare som har en ganska hög uteffekt på 74,2 dB(A), vilket bör räcka i de flesta medelstora rum. Basen är förnimbar men inte särskilt framträdande. Däremot är mellan- och högregister relativt väldefinierade.
Användare kan dock få bättre ljud via externa högtalare eller Bluetooth 5.3.
HP Pavilion Plus 16-ab0456tx ljudanalys
(±) | högtalarljudstyrkan är genomsnittlig men bra (74.2 dB)
Bas 100 - 315 Hz
(±) | reducerad bas - i genomsnitt 14.7% lägre än medianen
(±) | linjäriteten för basen är genomsnittlig (7.8% delta till föregående frekvens)
Mellan 400 - 2000 Hz
(+) | balanserad mellan - endast 3.4% från medianen
(+) | mids är linjära (4.2% delta till föregående frekvens)
Högsta 2 - 16 kHz
(+) | balanserade toppar - endast 4.6% från medianen
(+) | toppar är linjära (4.8% delta till föregående frekvens)
Totalt 100 - 16 000 Hz
(±) | linjäriteten för det totala ljudet är genomsnittlig (16.7% skillnad mot median)
Jämfört med samma klass
» 44% av alla testade enheter i den här klassen var bättre, 8% liknande, 48% sämre
» Den bästa hade ett delta på 5%, genomsnittet var 17%, sämst var 45%
Jämfört med alla testade enheter
» 29% av alla testade enheter var bättre, 7% liknande, 64% sämre
» Den bästa hade ett delta på 4%, genomsnittet var 23%, sämst var 134%
Apple MacBook Pro 16 2021 M1 Pro ljudanalys
(+) | högtalare kan spela relativt högt (84.7 dB)
Bas 100 - 315 Hz
(+) | bra bas - bara 3.8% från medianen
(+) | basen är linjär (5.2% delta till föregående frekvens)
Mellan 400 - 2000 Hz
(+) | balanserad mellan - endast 1.3% från medianen
(+) | mids är linjära (2.1% delta till föregående frekvens)
Högsta 2 - 16 kHz
(+) | balanserade toppar - endast 1.9% från medianen
(+) | toppar är linjära (2.7% delta till föregående frekvens)
Totalt 100 - 16 000 Hz
(+) | det totala ljudet är linjärt (4.6% skillnad mot median)
Jämfört med samma klass
» 0% av alla testade enheter i den här klassen var bättre, 0% liknande, 100% sämre
» Den bästa hade ett delta på 5%, genomsnittet var 17%, sämst var 45%
Jämfört med alla testade enheter
» 0% av alla testade enheter var bättre, 0% liknande, 100% sämre
» Den bästa hade ett delta på 4%, genomsnittet var 23%, sämst var 134%
Energihantering: Låg energiförbrukning och lång batteritid
Strömförbrukning
Pavilion Plus 16 förbrukar relativt sett mindre ström för den givna hårdvaran totalt sett. Medan Schenker Vision 14 M23 och Lenovo Slim Pro 7 är mer sparsamma vid genomsnittlig belastning och Witcher 3, är Pavilion Plus 16 mer ekonomisk vid maximal belastning .
Den medföljande 135 W nätadaptern är mer än tillräcklig för att driva den bärbara datorn under stress.
| Av/Standby | |
| Låg belastning | |
| Hög belastning |
|
Förklaring:
min: | |
| HP Pavilion Plus 16-ab0456tx i7-13700H, GeForce RTX 3050 6GB Laptop GPU, IPS, 2560x1600, 16" | Schenker Vision 14 M23 RTX 3050 i7-13700H, GeForce RTX 3050 6GB Laptop GPU, IPS, 2880x1800, 14" | Dell Inspiron 16 Plus 7630 i7-13700H, GeForce RTX 4060 Laptop GPU, IPS, 2560x1600, 16" | Asus VivoBook 14X K3405 i5-13500H, GeForce RTX 3050 4GB Laptop GPU, , 2880x1800, 14" | Lenovo Slim Pro 7 14ARP8 R7 7735HS, GeForce RTX 3050 6GB Laptop GPU, IPS, 2560x1600, 14.5" | Asus VivoBook Pro 16 K6602VU i9-13900H, GeForce RTX 4050 Laptop GPU, OLED, 3200x2000, 16" | Samsung Galaxy Book3 Ultra 16 i7-13700H, GeForce RTX 4050 Laptop GPU, AMOLED, 2880x1800, 16" | Genomsnitt NVIDIA GeForce RTX 3050 6GB Laptop GPU | Genomsnitt av klass Multimedia | |
|---|---|---|---|---|---|---|---|---|---|
| Power Consumption | -2% | -100% | 6% | -30% | -141% | 20% | -8% | -14% | |
| Idle Minimum * (Watt) | 3.3 | 5.2 -58% | 15.6 -373% | 4.96 -50% | 7.6 -130% | 21.06 -538% | 3 9% | 4.55 ? -38% | 5.72 ? -73% |
| Idle Average * (Watt) | 7.3 | 7.8 -7% | 17.7 -142% | 7.54 -3% | 12.2 -67% | 24.27 -232% | 5 32% | 8.63 ? -18% | 10.2 ? -40% |
| Idle Maximum * (Watt) | 14.24 | 9 37% | 20.6 -45% | 9.31 35% | 12.8 10% | 25.12 -76% | 11 23% | 11.7 ? 18% | 12.4 ? 13% |
| Load Average * (Watt) | 91.7 | 78.6 14% | 87.4 5% | 83.4 9% | 76.5 17% | 52.4 43% | 72 21% | 86.6 ? 6% | 65.5 ? 29% |
| Witcher 3 ultra * (Watt) | 96.2 | 86.8 10% | 121.7 -27% | 73.3 24% | 89.5 7% | 110.2 -15% | 69.7 28% | ||
| Load Maximum * (Watt) | 115.8 | 121.2 -5% | 138 -19% | 91.74 21% | 135.7 -17% | 146 -26% | 108 7% | 127.6 ? -10% | 114 ? 2% |
* ... mindre är bättre
Power Consumption: The Witcher 3 / Stress test
Power Consumption: External monitor
Batteritid
Den kraftfulla men strömsnåla inbyggnaden bidrar till en bra batteritid. Vid en ljusstyrka på 150 nits kunde batteriet på 68 WHr i Pavilion Plus 16 klara nästan 10,5 timmars webbsurfning och 12 timmars videouppspelning i 1080p, vilket är imponerande drifttider.
| HP Pavilion Plus 16-ab0456tx i7-13700H, GeForce RTX 3050 6GB Laptop GPU, 68 Wh | Schenker Vision 14 M23 RTX 3050 i7-13700H, GeForce RTX 3050 6GB Laptop GPU, 99 Wh | Dell Inspiron 16 Plus 7630 i7-13700H, GeForce RTX 4060 Laptop GPU, 86 Wh | Asus VivoBook 14X K3405 i5-13500H, GeForce RTX 3050 4GB Laptop GPU, 63 Wh | Lenovo Slim Pro 7 14ARP8 R7 7735HS, GeForce RTX 3050 6GB Laptop GPU, 73 Wh | Asus VivoBook Pro 16 K6602VU i9-13900H, GeForce RTX 4050 Laptop GPU, 96 Wh | Samsung Galaxy Book3 Ultra 16 i7-13700H, GeForce RTX 4050 Laptop GPU, 76 Wh | Genomsnitt av klass Multimedia | |
|---|---|---|---|---|---|---|---|---|
| Batteridrifttid | 16% | -10% | -18% | 1% | -11% | 2% | 27% | |
| H.264 (h) | 12 | 10.4 -13% | 9.8 -18% | 13.4 12% | 16.4 ? 37% | |||
| WiFi v1.3 (h) | 10.4 | 12.1 16% | 9.4 -10% | 8.1 -22% | 10.5 1% | 10.1 -3% | 9.6 -8% | 12.2 ? 17% |
| Reader / Idle (h) | 17.6 | 18.2 | 24.9 ? | |||||
| Load (h) | 1.4 | 1.1 | 1.8 | 1.668 ? | ||||
| Witcher 3 ultra (h) | 1.3 |
För
Emot
Bedömning: Stor potential som hålls tillbaka av kompromisser
HP Pavilion Plus 16 uppfyller de flesta krav man kan ställa på en modern bärbar multimediadator för arbete och underhållning. Pavilion Plus 16 har en konstruktion helt i metall som ger en premiumkänsla utan onödiga böjningar, och ett portval som täcker det väsentliga.
Panelen på 2560 x 1600 120 Hz har inte HDR eller omfattande Adobe RGB- och Display P3-täckning som på Pavilion Plus 14s 2,8K OLED-panel. Den klarar dock grunderna med bra responstider och inget PWM-flimmer.
HP Pavilion Plus 16 är en kapabel allround bärbar dator för multimedia och produktivitet, men det begärda priset kunde idealiskt ha packat in åtminstone en RTX 4050."
Prestandabegränsningarna blir uppenbara när du börjar jämföra den med konkurrenterna. 60 W PL2 visar sig vara särskilt ofördelaktigt för Pavilion Plus 16 i multi-core jämfört med Dell Inspiron 16 Plus 7630 och även Samsung Galaxy Book3 Ultra 16som har en Core i7-13700H med högre wattal.
HP kunde enkelt ha tillåtit 80 W PL2 eller mer i en extra effektprofil för att maximera chipets potential. Kylningssystemet verkar dock redan ansträngt med den nuvarande konfigurationen under belastning.
Nvidia GeForce RTX 3050 6 GB når inte upp till Ada-generationen när det gäller prestanda och strömeffektivitet. Även om 1080p-spel ser en märkbar uppgång från RTX 3050 4 GB, visar syntetiska tester inte mycket av ett incitament.
Med ett pris på 1 350 USD på HP:s webbplats är Pavilion Plus 16 100 USD dyrare än Inspiron 16 Plus 7630 som erbjuder en 60 W RTX 4060 och en Core i7-13700H med bättre prestanda. Med detta sagt är Pavilion Plus 16 billigare än Inspiron 16 Plus 7630 på den indiska marknaden.
Den Asus VivoBook Pro 16 med en 3,2K OLED-skärm, Core i9-13900H och upp till en RTX 4060 är ett utmärkt alternativ för spirande kreatörer så länge plasten och den extra premien på 300 USD inte håller dig tillbaka.
Pris och tillgänglighet
Den testade HP Pavilion Plus 16-ab0456tx kan köpas från den officiella HP India webbplats för ₹1,24,999. Den bärbara datorn kan också konfigureras på HP:s amerikanska webbplats för 1 350 USD.
Amazon India erbjuder Pavilion Plus 16 utan RTX 3050 dGPU för 1,25,900 ₹.
HP Pavilion Plus 16-ab0456tx
- 02/07/2024 v7 (old)
Vaidyanathan Subramaniam
Genomskinlighet
Valet av enheter som ska granskas görs av vår redaktion. Testprovet gavs till författaren som ett lån av tillverkaren eller återförsäljaren för denna recension. Långivaren hade inget inflytande på denna recension och inte heller fick tillverkaren en kopia av denna recension innan publiceringen. Det fanns ingen skyldighet att publicera denna recension. Som ett oberoende medieföretag är Notebookcheck inte föremål för auktoritet från tillverkare, återförsäljare eller förlag.
This is how Notebookcheck is testingEvery year, Notebookcheck independently reviews hundreds of laptops and smartphones using standardized procedures to ensure that all results are comparable. We have continuously developed our test methods for around 20 years and set industry standards in the process. In our test labs, high-quality measuring equipment is utilized by experienced technicians and editors. These tests involve a multi-stage validation process. Our complex rating system is based on hundreds of well-founded measurements and benchmarks, which maintains objectivity.
Price comparison

