Test: MSI WP65 9TH - För proffs som behöver tänka på budgeten (Sammanfattning)
Gradering | Datum | Modell | Vikt | Höjd | Storlek | Upplösning | Pris |
|---|---|---|---|---|---|---|---|
| 76 % v7 (old) | 10/2019 | MSI WP65 i7-9750H, Quadro P620 | 1.9 kg | 21.7 mm | 15.60" | 1920x1080 | |
| 80.8 % v7 (old) | 10/2019 | HP ZBook 15u G6 6TP54EA i7-8565U, Radeon Pro WX 3200 | 1.6 kg | 19 mm | 15.60" | 3840x2160 | |
| 87.8 % v7 (old) | 08/2019 | Lenovo ThinkPad P1 2019-20QT000RGE i7-9850H, Quadro T1000 (Laptop) | 1.7 kg | 18.4 mm | 15.60" | 1920x1080 | |
| 86.9 % v7 (old) | 11/2018 | Dell Precision 7530 i9-8950HK, Quadro P3200 | 2.6 kg | 29.95 mm | 15.60" | 3840x2160 | |
| 83.2 % v6 (old) | 08/2018 | Lenovo ThinkPad P52s-20LB000HGE i5-8550U, Quadro P500 | 2.2 kg | 20.2 mm | 15.60" | 1920x1080 |
| |||||||||||||||||||||||||
Distribution av ljusstyrkan: 86 %
Mitt på batteriet: 267.4 cd/m²
Kontrast: 723:1 (Svärta: 0.37 cd/m²)
ΔE ColorChecker Calman: 4.21 | ∀{0.5-29.43 Ø4.72}
calibrated: 4.27
ΔE Greyscale Calman: 2.3 | ∀{0.09-98 Ø4.97}
58.5% sRGB (Argyll 1.6.3 3D)
37.2% AdobeRGB 1998 (Argyll 1.6.3 3D)
40.69% AdobeRGB 1998 (Argyll 3D)
58.8% sRGB (Argyll 3D)
39.46% Display P3 (Argyll 3D)
Gamma: 2.2
CCT: 6578 K
| MSI WP65 AU Optronics B156HAN02.1, IPS, 15.6", 1920x1080 | HP ZBook 15u G6 6TP54EA AU Optronics AUO30EB, IPS, 15.6", 3840x2160 | Lenovo ThinkPad P1 2019-20QT000RGE N156HCE-GN1, IPS LED, 15.6", 1920x1080 | Dell Precision 7530 Sharp LQ156D1, IPS, 15.6", 3840x2160 | Lenovo ThinkPad P52s-20LB000HGE NV156FHM-N47, IPS LED, 15.6", 1920x1080 | MSI WS63VR 7RL-023US SAMSUNG LƒFL156FL02-101 , IPS, 15.6", 3840x2160 | |
|---|---|---|---|---|---|---|
| Display | 70% | 57% | 105% | 6% | 20% | |
| Display P3 Coverage (%) | 39.46 | 69.2 75% | 62.4 58% | 82.5 109% | 41.83 6% | 47.43 20% |
| sRGB Coverage (%) | 58.8 | 97.1 65% | 91.5 56% | 99.4 69% | 62.1 6% | 71.4 21% |
| AdobeRGB 1998 Coverage (%) | 40.69 | 69.7 71% | 63.4 56% | 96.2 136% | 43.22 6% | 49 20% |
| Response Times | -45% | 29% | 5% | -33% | -1% | |
| Response Time Grey 50% / Grey 80% * (ms) | 37.6 ? | 68.8 ? -83% | 34.4 ? 9% | 35.2 ? 6% | 47.2 ? -26% | 36.8 ? 2% |
| Response Time Black / White * (ms) | 27.6 ? | 29.6 -7% | 14 ? 49% | 26.4 ? 4% | 38.4 ? -39% | 28.4 ? -3% |
| PWM Frequency (Hz) | 26040 ? | 198.4 ? | 21550 ? | 1351 ? | ||
| Screen | 42% | 39% | 24% | 20% | -5% | |
| Brightness middle (cd/m²) | 267.4 | 451 69% | 542 103% | 292.8 9% | 291 9% | 259.4 -3% |
| Brightness (cd/m²) | 259 | 434 68% | 528 104% | 295 14% | 284 10% | 247 -5% |
| Brightness Distribution (%) | 86 | 89 3% | 84 -2% | 85 -1% | 91 6% | 85 -1% |
| Black Level * (cd/m²) | 0.37 | 0.25 32% | 0.41 -11% | 0.36 3% | 0.11 70% | 0.43 -16% |
| Contrast (:1) | 723 | 1804 150% | 1322 83% | 813 12% | 2645 266% | 603 -17% |
| Colorchecker dE 2000 * | 4.21 | 4.4 -5% | 3.5 17% | 3.48 17% | 6.7 -59% | 5.5 -31% |
| Colorchecker dE 2000 max. * | 21.1 | 6.7 68% | 7.8 63% | 6.81 68% | 20.2 4% | 12.7 40% |
| Colorchecker dE 2000 calibrated * | 4.27 | 1.8 58% | 1.3 70% | 3.13 27% | 4.5 -5% | |
| Greyscale dE 2000 * | 2.3 | 5 -117% | 4.8 -109% | 4.1 -78% | 4.5 -96% | 3.6 -57% |
| Gamma | 2.2 100% | 2.31 95% | 2.33 94% | 2.2 100% | 2.28 96% | 2.24 98% |
| CCT | 6578 99% | 7717 84% | 7690 85% | 6740 96% | 7503 87% | 7163 91% |
| Color Space (Percent of AdobeRGB 1998) (%) | 37.2 | 63 69% | 58.8 58% | 84.4 127% | 39.6 6% | 45 21% |
| Color Space (Percent of sRGB) (%) | 58.5 | 97 66% | 91.1 56% | 99.6 70% | 61.7 5% | 71 21% |
| Totalt genomsnitt (program/inställningar) | 22% /
36% | 42% /
41% | 45% /
37% | -2% /
11% | 5% /
1% |
* ... mindre är bättre
Visa svarstider
| ↔ Svarstid svart till vitt | ||
|---|---|---|
| 27.6 ms ... stiga ↗ och falla ↘ kombinerat | ↗ 15.2 ms stiga | 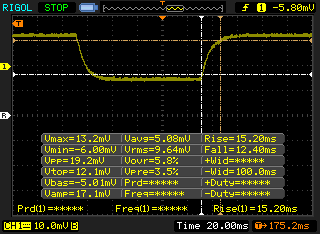 |
| ↘ 12.4 ms hösten | ||
| Skärmen visar relativt långsamma svarsfrekvenser i våra tester och kan vara för långsam för spelare. I jämförelse sträcker sig alla testade enheter från 0.1 (minst) till 240 (maximalt) ms. » 70 % av alla enheter är bättre. Detta innebär att den uppmätta svarstiden är sämre än genomsnittet av alla testade enheter (19.8 ms). | ||
| ↔ Svarstid 50 % grått till 80 % grått | ||
| 37.6 ms ... stiga ↗ och falla ↘ kombinerat | ↗ 20.4 ms stiga | 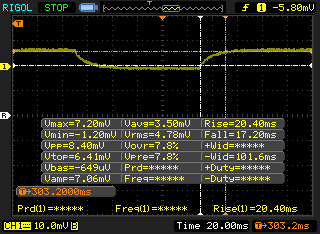 |
| ↘ 17.2 ms hösten | ||
| Skärmen visar långsamma svarsfrekvenser i våra tester och kommer att vara otillfredsställande för spelare. I jämförelse sträcker sig alla testade enheter från 0.165 (minst) till 636 (maximalt) ms. » 54 % av alla enheter är bättre. Detta innebär att den uppmätta svarstiden är sämre än genomsnittet av alla testade enheter (31 ms). | ||
Skärmflimmer / PWM (Puls-Width Modulation)
| Skärmflimmer / PWM upptäcktes inte | 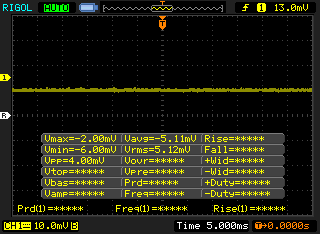 | ||
Som jämförelse: 52 % av alla testade enheter använder inte PWM för att dämpa skärmen. Om PWM upptäcktes mättes ett medelvärde av 7781 (minst: 5 - maximum: 343500) Hz. | |||
| PCMark 8 Home Score Accelerated v2 | 4165 poäng | |
| PCMark 8 Work Score Accelerated v2 | 5213 poäng | |
| PCMark 10 Score | 5025 poäng | |
Hjälp | ||
| MSI WP65 Samsung SSD PM981 MZVLB512HAJQ | HP ZBook 15u G6 6TP54EA Samsung SSD PM981 MZVLB512HAJQ | Lenovo ThinkPad P1 2019-20QT000RGE WDC PC SN720 SDAQNTW-512G | Dell Precision 7530 Samsung PM961 NVMe MZVLW512HMJP | Lenovo ThinkPad P52s-20LB000HGE Samsung PM961 MZVLW256HEHP | MSI WS63VR 7RL-023US Toshiba NVMe THNSN5512GPU7 | |
|---|---|---|---|---|---|---|
| AS SSD | 15% | 20% | 3% | -8% | -26% | |
| Seq Read (MB/s) | 1097 | 2083 90% | 2980 172% | 1807 65% | 1463 33% | 2133 94% |
| Seq Write (MB/s) | 1838 | 1715 -7% | 2094 14% | 1540 -16% | 1164 -37% | 1287 -30% |
| 4K Read (MB/s) | 52.9 | 55.3 5% | 45.05 -15% | 34.27 -35% | 44.98 -15% | 40.2 -24% |
| 4K Write (MB/s) | 108.4 | 137.6 27% | 155.4 43% | 103 -5% | 140 29% | 114.6 6% |
| 4K-64 Read (MB/s) | 1509 | 1211 -20% | 1291 -14% | 1304 -14% | 1312 -13% | 710 -53% |
| 4K-64 Write (MB/s) | 1695 | 1446 -15% | 1506 -11% | 1221 -28% | 612 -64% | 314 -81% |
| Access Time Read * (ms) | 0.067 | 0.039 42% | 0.064 4% | 0.055 18% | 0.065 3% | 0.128 -91% |
| Access Time Write * (ms) | 0.103 | 0.026 75% | 0.024 77% | 0.037 64% | 0.026 75% | 0.033 68% |
| Score Read (Points) | 1671 | 1474 -12% | 1634 -2% | 1519 -9% | 1504 -10% | 962 -42% |
| Score Write (Points) | 1988 | 1755 -12% | 1871 -6% | 1478 -26% | 868 -56% | 557 -72% |
| Score Total (Points) | 4558 | 3976 -13% | 4300 -6% | 3761 -17% | 3131 -31% | 1979 -57% |
| Copy ISO MB/s (MB/s) | 1800 | 2015 12% | 3015 68% | |||
| Copy Program MB/s (MB/s) | 569 | 597 5% | 519 -9% | |||
| Copy Game MB/s (MB/s) | 1409 | 1449 3% | 1172 -17% |
* ... mindre är bättre

| 3DMark | |
| 1280x720 Cloud Gate Standard Graphics | |
| MSI WS75 9TL-636 | |
| MSI WT75 8SM | |
| HP ZBook 17 G4-Y3J82AV | |
| Asus Zephyrus S GX531GM | |
| MSI WS63VR 7RL-023US | |
| MSI P65 Creator 9SF-657 | |
| Dell Precision 7530 | |
| Lenovo ThinkPad P1 2019-20QT000RGE | |
| MSI WP65 | |
| HP ZBook 15v G5 | |
| Asus Zenbook UX510UW-CN044T | |
| HP ZBook Studio G5-4QH10EA | |
| HP ZBook 15u G6 6TP54EA | |
| Lenovo ThinkPad P43s-20RH001FGE | |
| 1920x1080 Fire Strike Graphics | |
| MSI WT75 8SM | |
| MSI WS75 9TL-636 | |
| MSI P65 Creator 9SF-657 | |
| HP ZBook 17 G4-Y3J82AV | |
| MSI WS63VR 7RL-023US | |
| Asus Zephyrus S GX531GM | |
| Dell Precision 7530 | |
| Lenovo ThinkPad P1 2019-20QT000RGE | |
| HP ZBook Studio G5-4QH10EA | |
| MSI WP65 | |
| Asus Zenbook UX510UW-CN044T | |
| HP ZBook 15v G5 | |
| HP ZBook 15u G6 6TP54EA | |
| Lenovo ThinkPad P43s-20RH001FGE | |
| Lenovo ThinkPad P52s-20LB000HGE | |
| 2560x1440 Time Spy Graphics | |
| MSI WS75 9TL-636 | |
| MSI WT75 8SM | |
| HP ZBook 17 G4-Y3J82AV | |
| Dell Precision 7530 | |
| Asus Zephyrus S GX531GM | |
| Lenovo ThinkPad P1 2019-20QT000RGE | |
| HP ZBook Studio G5-4QH10EA | |
| MSI WP65 | |
| HP ZBook 15v G5 | |
| Asus Zenbook UX510UW-CN044T | |
| HP ZBook 15u G6 6TP54EA | |
| Lenovo ThinkPad P43s-20RH001FGE | |
| 3DMark 11 | |
| 1280x720 Performance GPU | |
| MSI WT75 8SM | |
| MSI WS75 9TL-636 | |
| MSI P65 Creator 9SF-657 | |
| HP ZBook 17 G4-Y3J82AV | |
| MSI WS63VR 7RL-023US | |
| Dell Precision 7530 | |
| Asus Zephyrus S GX531GM | |
| Lenovo ThinkPad P1 2019-20QT000RGE | |
| HP ZBook Studio G5-4QH10EA | |
| MSI WP65 | |
| Asus Zenbook UX510UW-CN044T | |
| HP ZBook 15v G5 | |
| HP ZBook 15u G6 6TP54EA | |
| Lenovo ThinkPad P43s-20RH001FGE | |
| Lenovo ThinkPad P52s-20LB000HGE | |
| 1280x720 Performance Combined | |
| MSI P65 Creator 9SF-657 | |
| MSI WT75 8SM | |
| MSI WS75 9TL-636 | |
| Dell Precision 7530 | |
| HP ZBook 17 G4-Y3J82AV | |
| MSI WS63VR 7RL-023US | |
| Lenovo ThinkPad P1 2019-20QT000RGE | |
| Asus Zephyrus S GX531GM | |
| HP ZBook Studio G5-4QH10EA | |
| MSI WP65 | |
| HP ZBook 15u G6 6TP54EA | |
| HP ZBook 15v G5 | |
| Asus Zenbook UX510UW-CN044T | |
| Lenovo ThinkPad P52s-20LB000HGE | |
| Lenovo ThinkPad P43s-20RH001FGE | |
| 3DMark 06 Standard Score | 34862 poäng | |
| 3DMark Vantage P Result | 25105 poäng | |
| 3DMark 11 Performance | 6492 poäng | |
| 3DMark Ice Storm Standard Score | 100811 poäng | |
| 3DMark Cloud Gate Standard Score | 22501 poäng | |
| 3DMark Fire Strike Score | 4493 poäng | |
| 3DMark Time Spy Score | 1572 poäng | |
Hjälp | ||
| låg | med. | hög | ultra | |
|---|---|---|---|---|
| Guild Wars 2 (2012) | 149.9 | 73.1 | 28.4 | |
| StarCraft II: Heart of the Swarm (2013) | 542 | 258.9 | 156.8 | 82.4 |
| BioShock Infinite (2013) | 301.7 | 160.9 | 140 | 52.8 |
| The Witcher 3 (2015) | 101 | 57.7 | 33 | 18.1 |
| Rise of the Tomb Raider (2016) | 101.9 | 62.9 | 33.7 | 26.4 |
| Ashes of the Singularity (2016) | 50.6 | 29.2 | 25.4 | |
| Doom (2016) | 96.7 | 76.3 | 44.1 | |
| Overwatch (2016) | 261.8 | 169 | 77 | |
| Prey (2017) | 144.7 | 74.8 | 56.7 | |
| Rocket League (2017) | 248.9 | 153.5 | 96.5 | |
| Middle-earth: Shadow of War (2017) | 96 | 37 | 27 | 20 |
| Destiny 2 (2017) | 100.5 | 48.6 | 37.6 | 30.1 |
| Fortnite (2018) | 183.6 | 113.2 | 41.9 | 29.3 |
| Final Fantasy XV Benchmark (2018) | 51.9 | 25.6 | 18.3 | |
| F1 2018 (2018) | 106 | 55 | 42 | 25 |
| Shadow of the Tomb Raider (2018) | 70 | 16 | 14 | 12 |
| Apex Legends (2019) | 88.4 | 35.2 | 29.1 | 26 |
| Metro Exodus (2019) | 46.6 | 21.4 | 15.5 | 12.9 |
| F1 2019 (2019) | 102 | 46 | 39 | 26 |
| Borderlands 3 (2019) | 75.8 | 29.7 | 19.3 | 14.5 |
| FIFA 20 (2019) | 166 | 117.8 | 112 | 92.4 |
| MSI WP65 Quadro P620, i7-9750H, Samsung SSD PM981 MZVLB512HAJQ | HP ZBook 15u G6 6TP54EA Radeon Pro WX 3200, i7-8565U, Samsung SSD PM981 MZVLB512HAJQ | Lenovo ThinkPad P1 2019-20QT000RGE Quadro T1000 (Laptop), i7-9850H, WDC PC SN720 SDAQNTW-512G | Dell Precision 7530 Quadro P3200, i9-8950HK, Samsung PM961 NVMe MZVLW512HMJP | Lenovo ThinkPad P52s-20LB000HGE Quadro P500, i5-8550U, Samsung PM961 MZVLW256HEHP | MSI WS63VR 7RL-023US Quadro P4000 Max-Q, i7-7700HQ, Toshiba NVMe THNSN5512GPU7 | |
|---|---|---|---|---|---|---|
| Noise | 13% | 14% | 5% | 14% | 3% | |
| av / miljö * (dB) | 28.7 | 29.7 -3% | 28.8 -0% | 28.3 1% | 29 -1% | 28 2% |
| Idle Minimum * (dB) | 33.4 | 29.7 11% | 28.8 14% | 28.3 15% | 29 13% | 33.2 1% |
| Idle Average * (dB) | 33.5 | 29.7 11% | 28.8 14% | 28.3 16% | 29 13% | 33.2 1% |
| Idle Maximum * (dB) | 33.5 | 30.3 10% | 28.8 14% | 30.5 9% | 31.2 7% | 33.2 1% |
| Load Average * (dB) | 37 | 32.6 12% | 36.1 2% | 34.5 7% | 32.5 12% | 41.4 -12% |
| Witcher 3 ultra * (dB) | 38.7 | 34.2 12% | 49.5 -28% | 32.5 16% | 38.4 1% | |
| Load Maximum * (dB) | 59.5 | 36.1 39% | 36.7 38% | 49.5 17% | 37.5 37% | 43.5 27% |
* ... mindre är bättre
Ljudnivå
| Låg belastning |
| 33.4 / 33.5 / 33.5 dB(A) |
| Hög belastning |
| 37 / 59.5 dB(A) |
 | ||
30 dB tyst 40 dB(A) hörbar 50 dB(A) högt ljud |
||
min: | ||
(±) Den maximala temperaturen på ovansidan är 42.8 °C / 109 F, jämfört med genomsnittet av 38.2 °C / 101 F , allt från 22.2 till 69.8 °C för klassen Workstation.
(-) Botten värms upp till maximalt 47.4 °C / 117 F, jämfört med genomsnittet av 41.1 °C / 106 F
(+) Vid tomgångsbruk är medeltemperaturen för ovansidan 28 °C / 82 F, jämfört med enhetsgenomsnittet på 32 °C / ### class_avg_f### F.
(+) När du spelar The Witcher 3 är medeltemperaturen för ovansidan 29.2 °C / 85 F, jämfört med enhetsgenomsnittet på 32 °C / ## #class_avg_f### F.
(+) Handledsstöden och pekplattan är kallare än hudtemperaturen med maximalt 27.4 °C / 81.3 F och är därför svala att ta på.
(±) Medeltemperaturen för handledsstödsområdet på liknande enheter var 27.8 °C / 82 F (+0.4 °C / 0.7 F).
MSI WP65 ljudanalys
(±) | högtalarljudstyrkan är genomsnittlig men bra (77.1 dB)
Bas 100 - 315 Hz
(-) | nästan ingen bas - i genomsnitt 16.5% lägre än medianen
(±) | linjäriteten för basen är genomsnittlig (14.1% delta till föregående frekvens)
Mellan 400 - 2000 Hz
(±) | högre mellan - i genomsnitt 5.4% högre än median
(±) | linjäriteten för mids är genomsnittlig (12.1% delta till föregående frekvens)
Högsta 2 - 16 kHz
(+) | balanserade toppar - endast 1.8% från medianen
(±) | linjäriteten för toppar är genomsnittlig (8.7% delta till föregående frekvens)
Totalt 100 - 16 000 Hz
(±) | linjäriteten för det totala ljudet är genomsnittlig (26% skillnad mot median)
Jämfört med samma klass
» 87% av alla testade enheter i den här klassen var bättre, 6% liknande, 6% sämre
» Den bästa hade ett delta på 7%, genomsnittet var 17%, sämst var 35%
Jämfört med alla testade enheter
» 80% av alla testade enheter var bättre, 4% liknande, 16% sämre
» Den bästa hade ett delta på 4%, genomsnittet var 24%, sämst var 134%
Apple MacBook 12 (Early 2016) 1.1 GHz ljudanalys
(+) | högtalare kan spela relativt högt (83.6 dB)
Bas 100 - 315 Hz
(±) | reducerad bas - i genomsnitt 11.3% lägre än medianen
(±) | linjäriteten för basen är genomsnittlig (14.2% delta till föregående frekvens)
Mellan 400 - 2000 Hz
(+) | balanserad mellan - endast 2.4% från medianen
(+) | mids är linjära (5.5% delta till föregående frekvens)
Högsta 2 - 16 kHz
(+) | balanserade toppar - endast 2% från medianen
(+) | toppar är linjära (4.5% delta till föregående frekvens)
Totalt 100 - 16 000 Hz
(+) | det totala ljudet är linjärt (10.2% skillnad mot median)
Jämfört med samma klass
» 7% av alla testade enheter i den här klassen var bättre, 2% liknande, 91% sämre
» Den bästa hade ett delta på 5%, genomsnittet var 18%, sämst var 53%
Jämfört med alla testade enheter
» 5% av alla testade enheter var bättre, 1% liknande, 94% sämre
» Den bästa hade ett delta på 4%, genomsnittet var 24%, sämst var 134%
| Av/Standby | |
| Låg belastning | |
| Hög belastning |
|
Förklaring:
min: | |
| MSI WP65 i7-9750H, Quadro P620, Samsung SSD PM981 MZVLB512HAJQ, IPS, 1920x1080, 15.6" | HP ZBook 15u G6 6TP54EA i7-8565U, Radeon Pro WX 3200, Samsung SSD PM981 MZVLB512HAJQ, IPS, 3840x2160, 15.6" | Dell Precision 7530 i9-8950HK, Quadro P3200, Samsung PM961 NVMe MZVLW512HMJP, IPS, 3840x2160, 15.6" | Lenovo ThinkPad P52s-20LB000HGE i5-8550U, Quadro P500, Samsung PM961 MZVLW256HEHP, IPS LED, 1920x1080, 15.6" | MSI WS63VR 7RL-023US i7-7700HQ, Quadro P4000 Max-Q, Toshiba NVMe THNSN5512GPU7, IPS, 3840x2160, 15.6" | Lenovo ThinkPad P1 2019-20QT000RGE i7-9850H, Quadro T1000 (Laptop), WDC PC SN720 SDAQNTW-512G, IPS LED, 1920x1080, 15.6" | Lenovo ThinkPad P52 20MAS03N00 i7-8750H, Quadro P1000, Samsung SSD PM981 MZVLB512HAJQ, IPS LED, 1920x1080, 15.6" | |
|---|---|---|---|---|---|---|---|
| Power Consumption | 25% | -77% | 39% | -38% | -38% | 17% | |
| Idle Minimum * (Watt) | 5.6 | 5.5 2% | 15.7 -180% | 4.1 27% | 13.3 -138% | 13.7 -145% | 4.02 28% |
| Idle Average * (Watt) | 8.6 | 9.8 -14% | 20.3 -136% | 7.7 10% | 17.2 -100% | 17.5 -103% | 7.2 16% |
| Idle Maximum * (Watt) | 30.7 | 12 61% | 25.7 16% | 10.7 65% | 17.9 42% | 20.9 32% | 11.46 63% |
| Load Average * (Watt) | 78 | 59 24% | 118.9 -52% | 52 33% | 83.7 -7% | 77.2 1% | 76.3 2% |
| Witcher 3 ultra * (Watt) | 63.5 | 51 20% | 131.2 -107% | 38.8 39% | 101.9 -60% | 74 -17% | |
| Load Maximum * (Watt) | 170.2 | 70 59% | 174 -2% | 65 62% | 114.3 33% | 123.7 27% | 154 10% |
* ... mindre är bättre
| MSI WP65 i7-9750H, Quadro P620, 51 Wh | HP ZBook 15u G6 6TP54EA i7-8565U, Radeon Pro WX 3200, 56 Wh | Lenovo ThinkPad P1 2019-20QT000RGE i7-9850H, Quadro T1000 (Laptop), 80 Wh | Dell Precision 7530 i9-8950HK, Quadro P3200, 97 Wh | Lenovo ThinkPad P52s-20LB000HGE i5-8550U, Quadro P500, 104 Wh | MSI WS63VR 7RL-023US i7-7700HQ, Quadro P4000 Max-Q, 48 Wh | |
|---|---|---|---|---|---|---|
| Batteridrifttid | 107% | 83% | 36% | 325% | -21% | |
| Reader / Idle (h) | 10.1 | 12.4 23% | 6.4 -37% | 39.3 289% | 3.9 -61% | |
| WiFi v1.3 (h) | 6 | 6.9 15% | 8.9 48% | 4.6 -23% | 16.2 170% | 2.9 -52% |
| Load (h) | 0.6 | 2.3 283% | 1.3 117% | 1.6 167% | 3.7 517% | 0.9 50% |
För
Emot
Läs den fullständiga versionen av den här recensionen på engelska här.
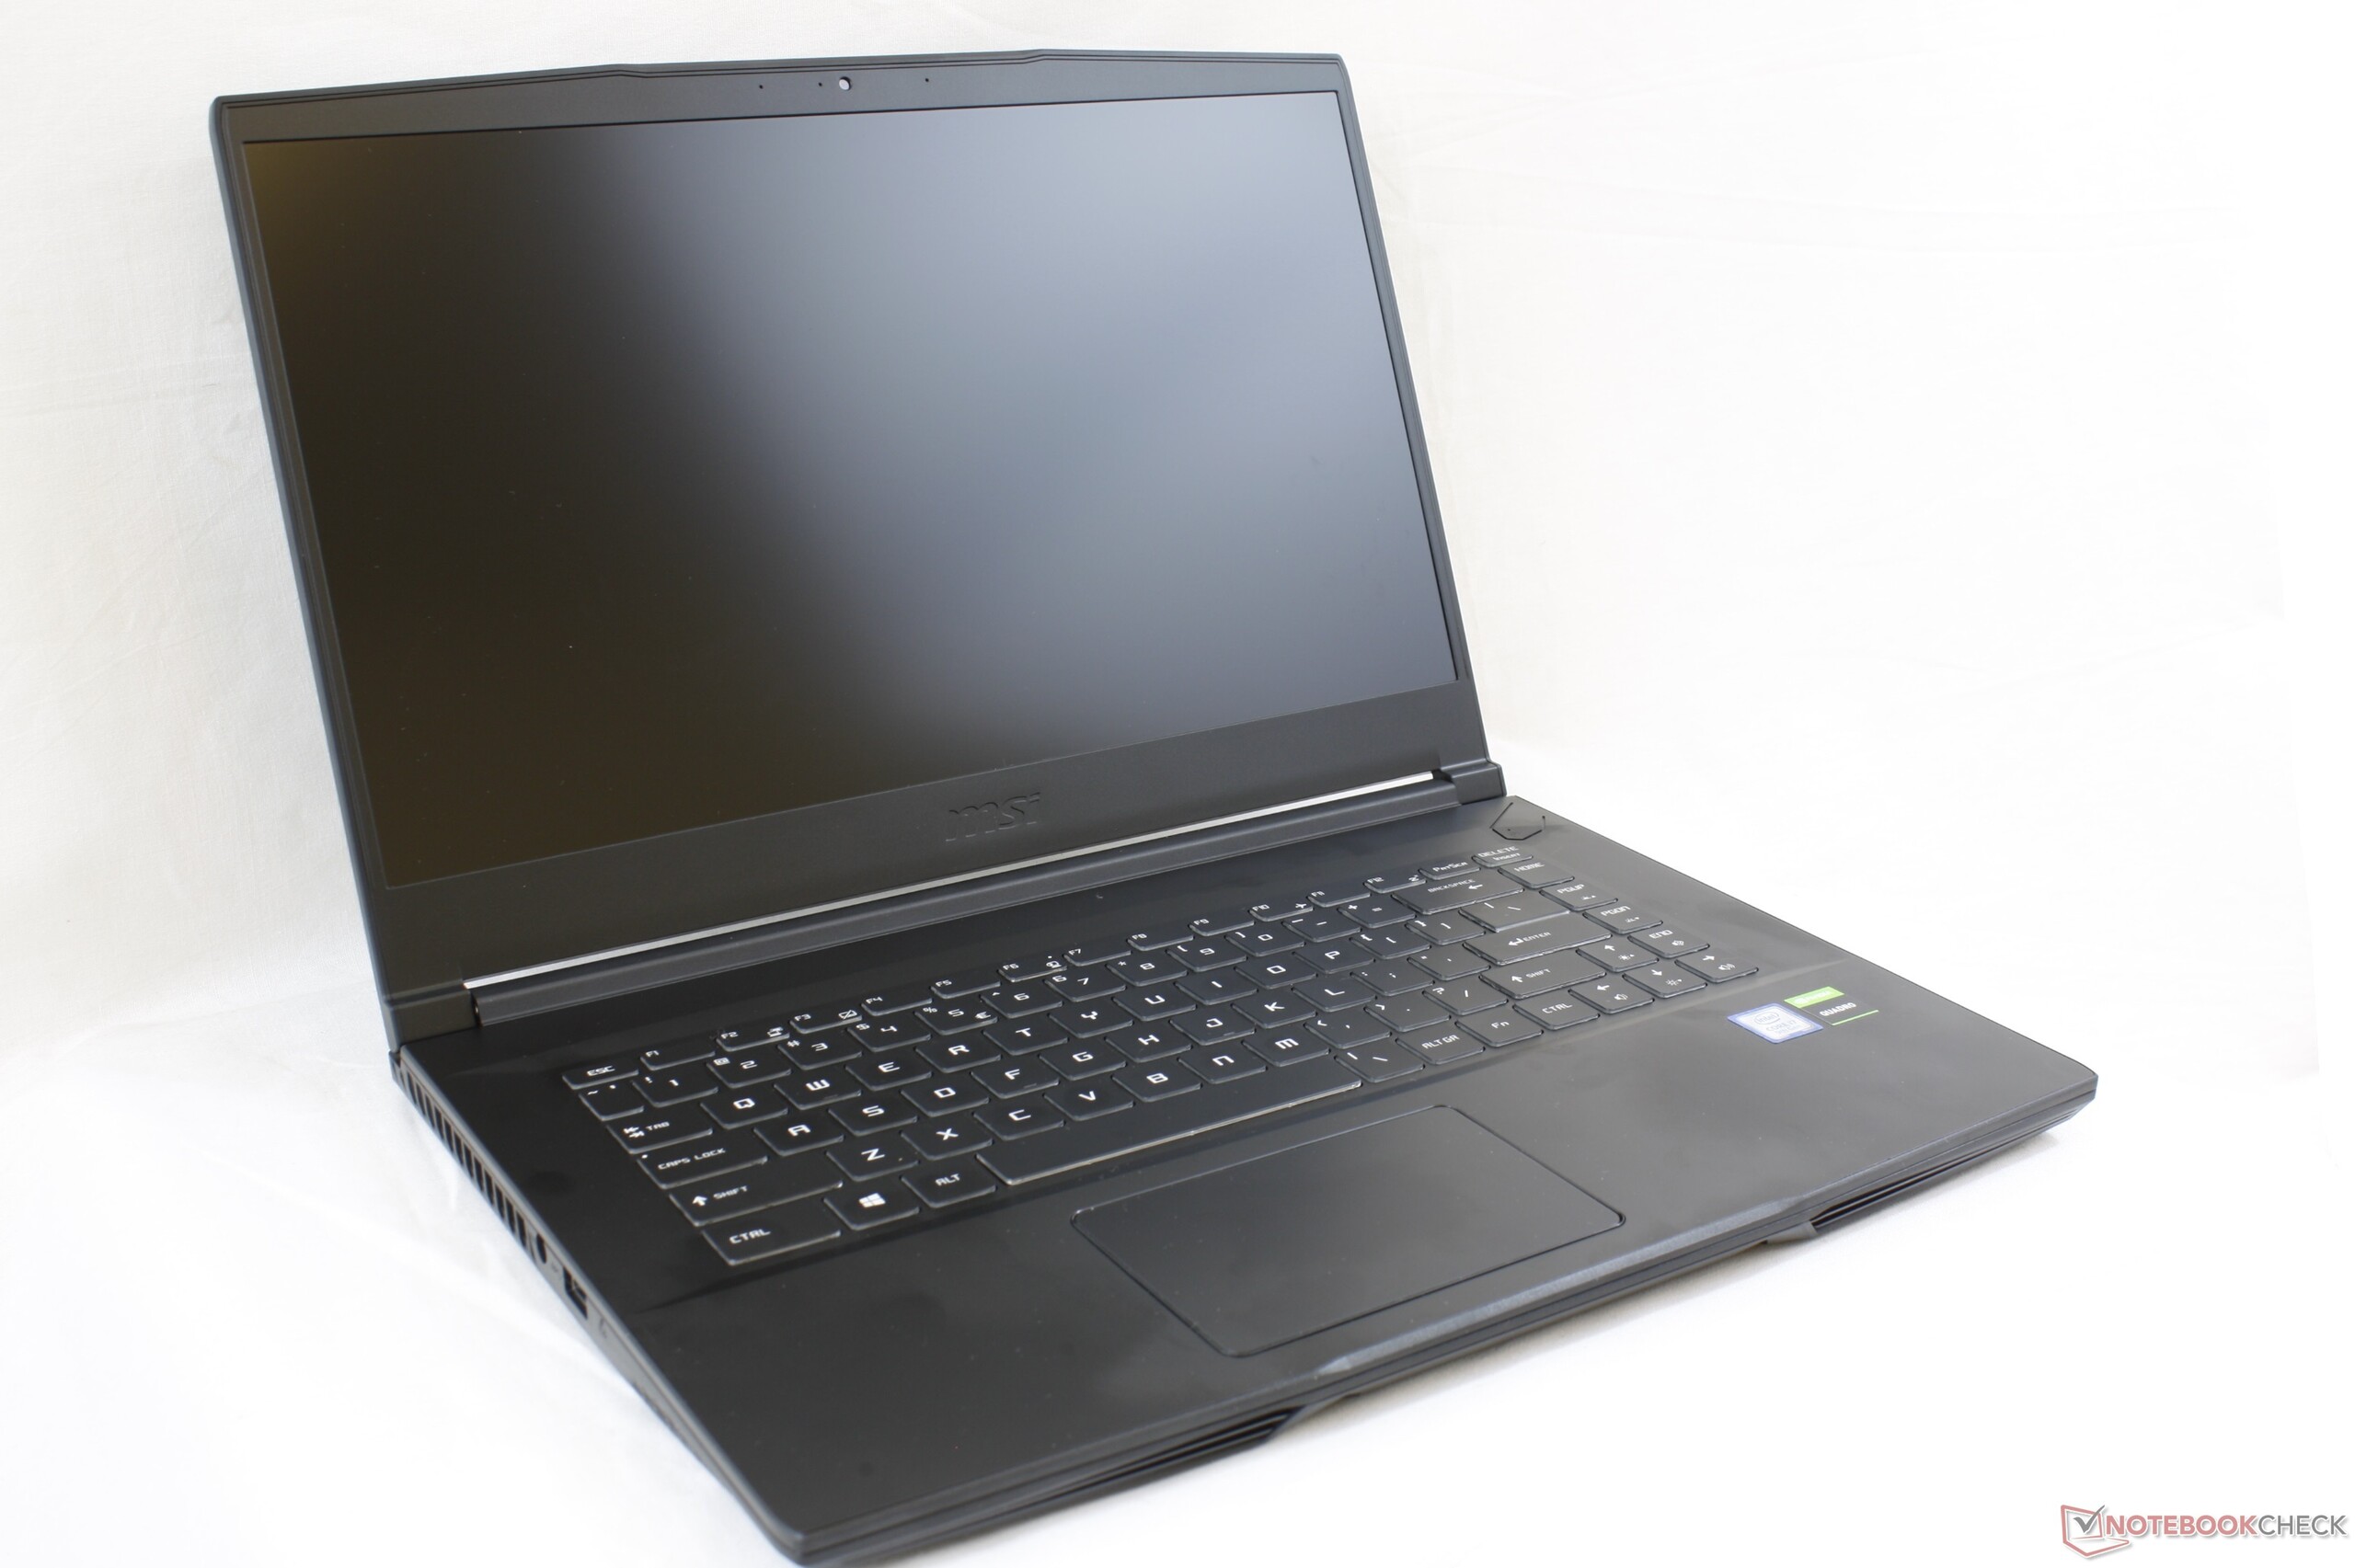
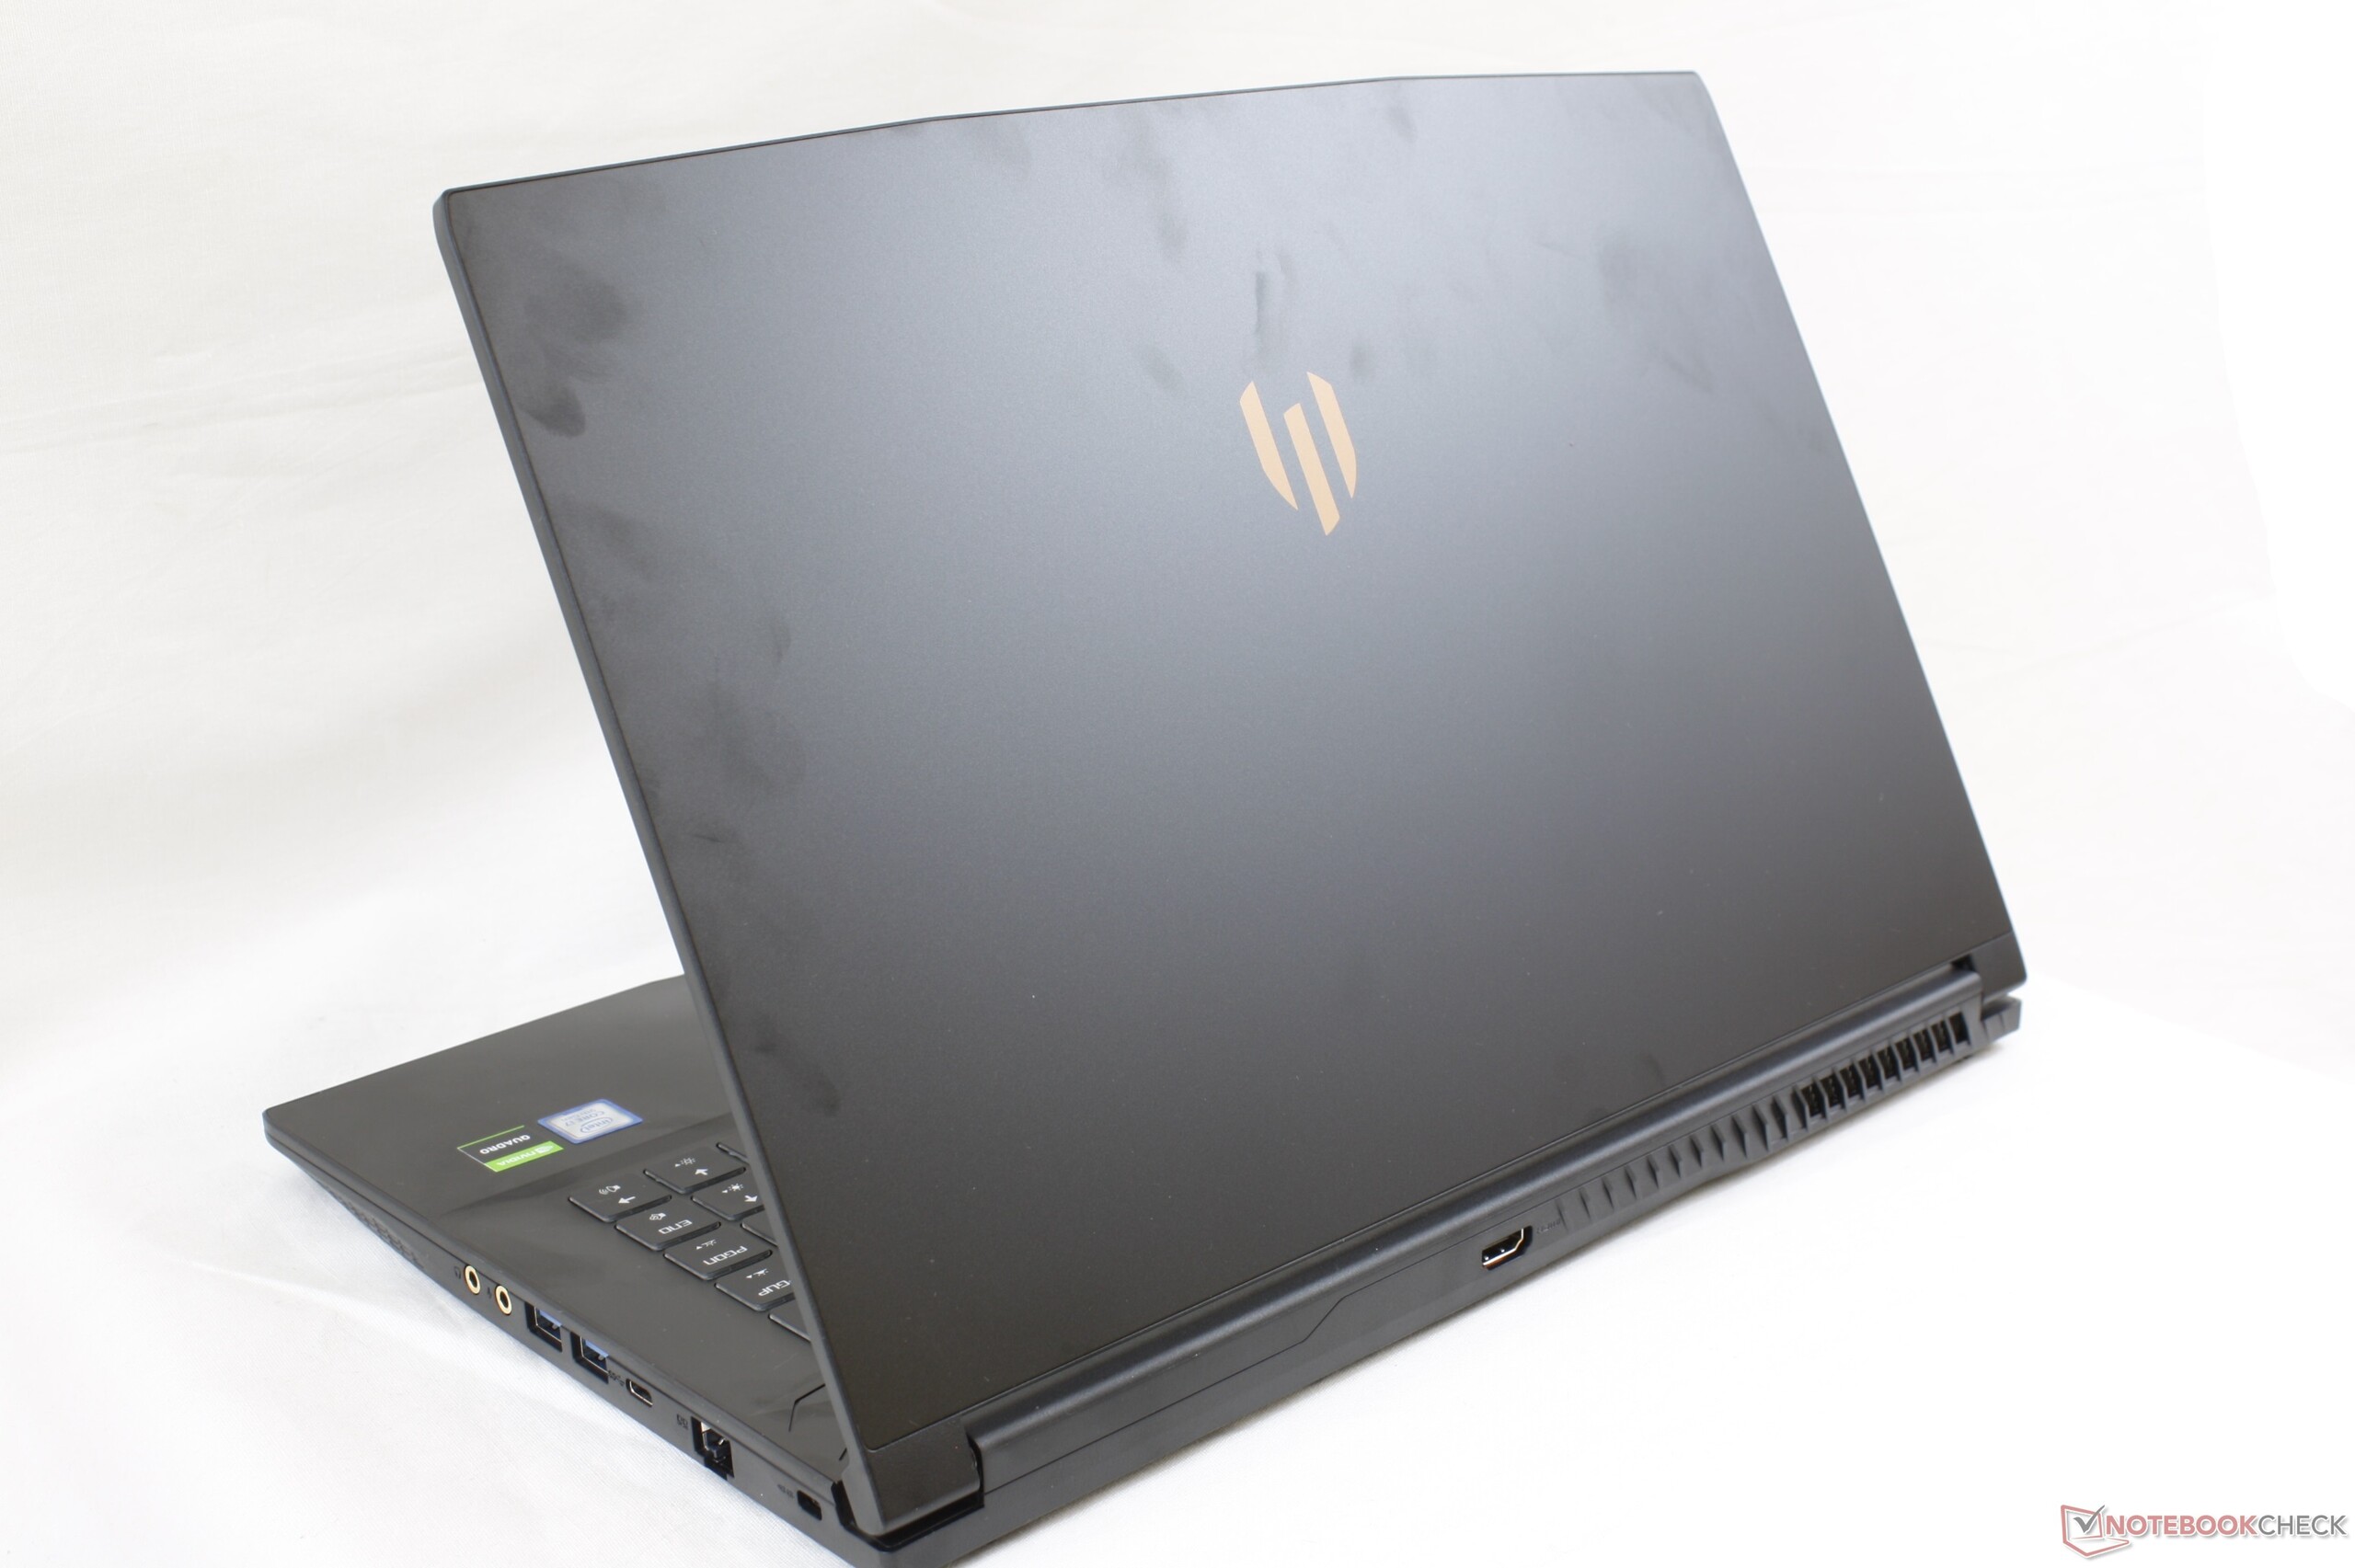
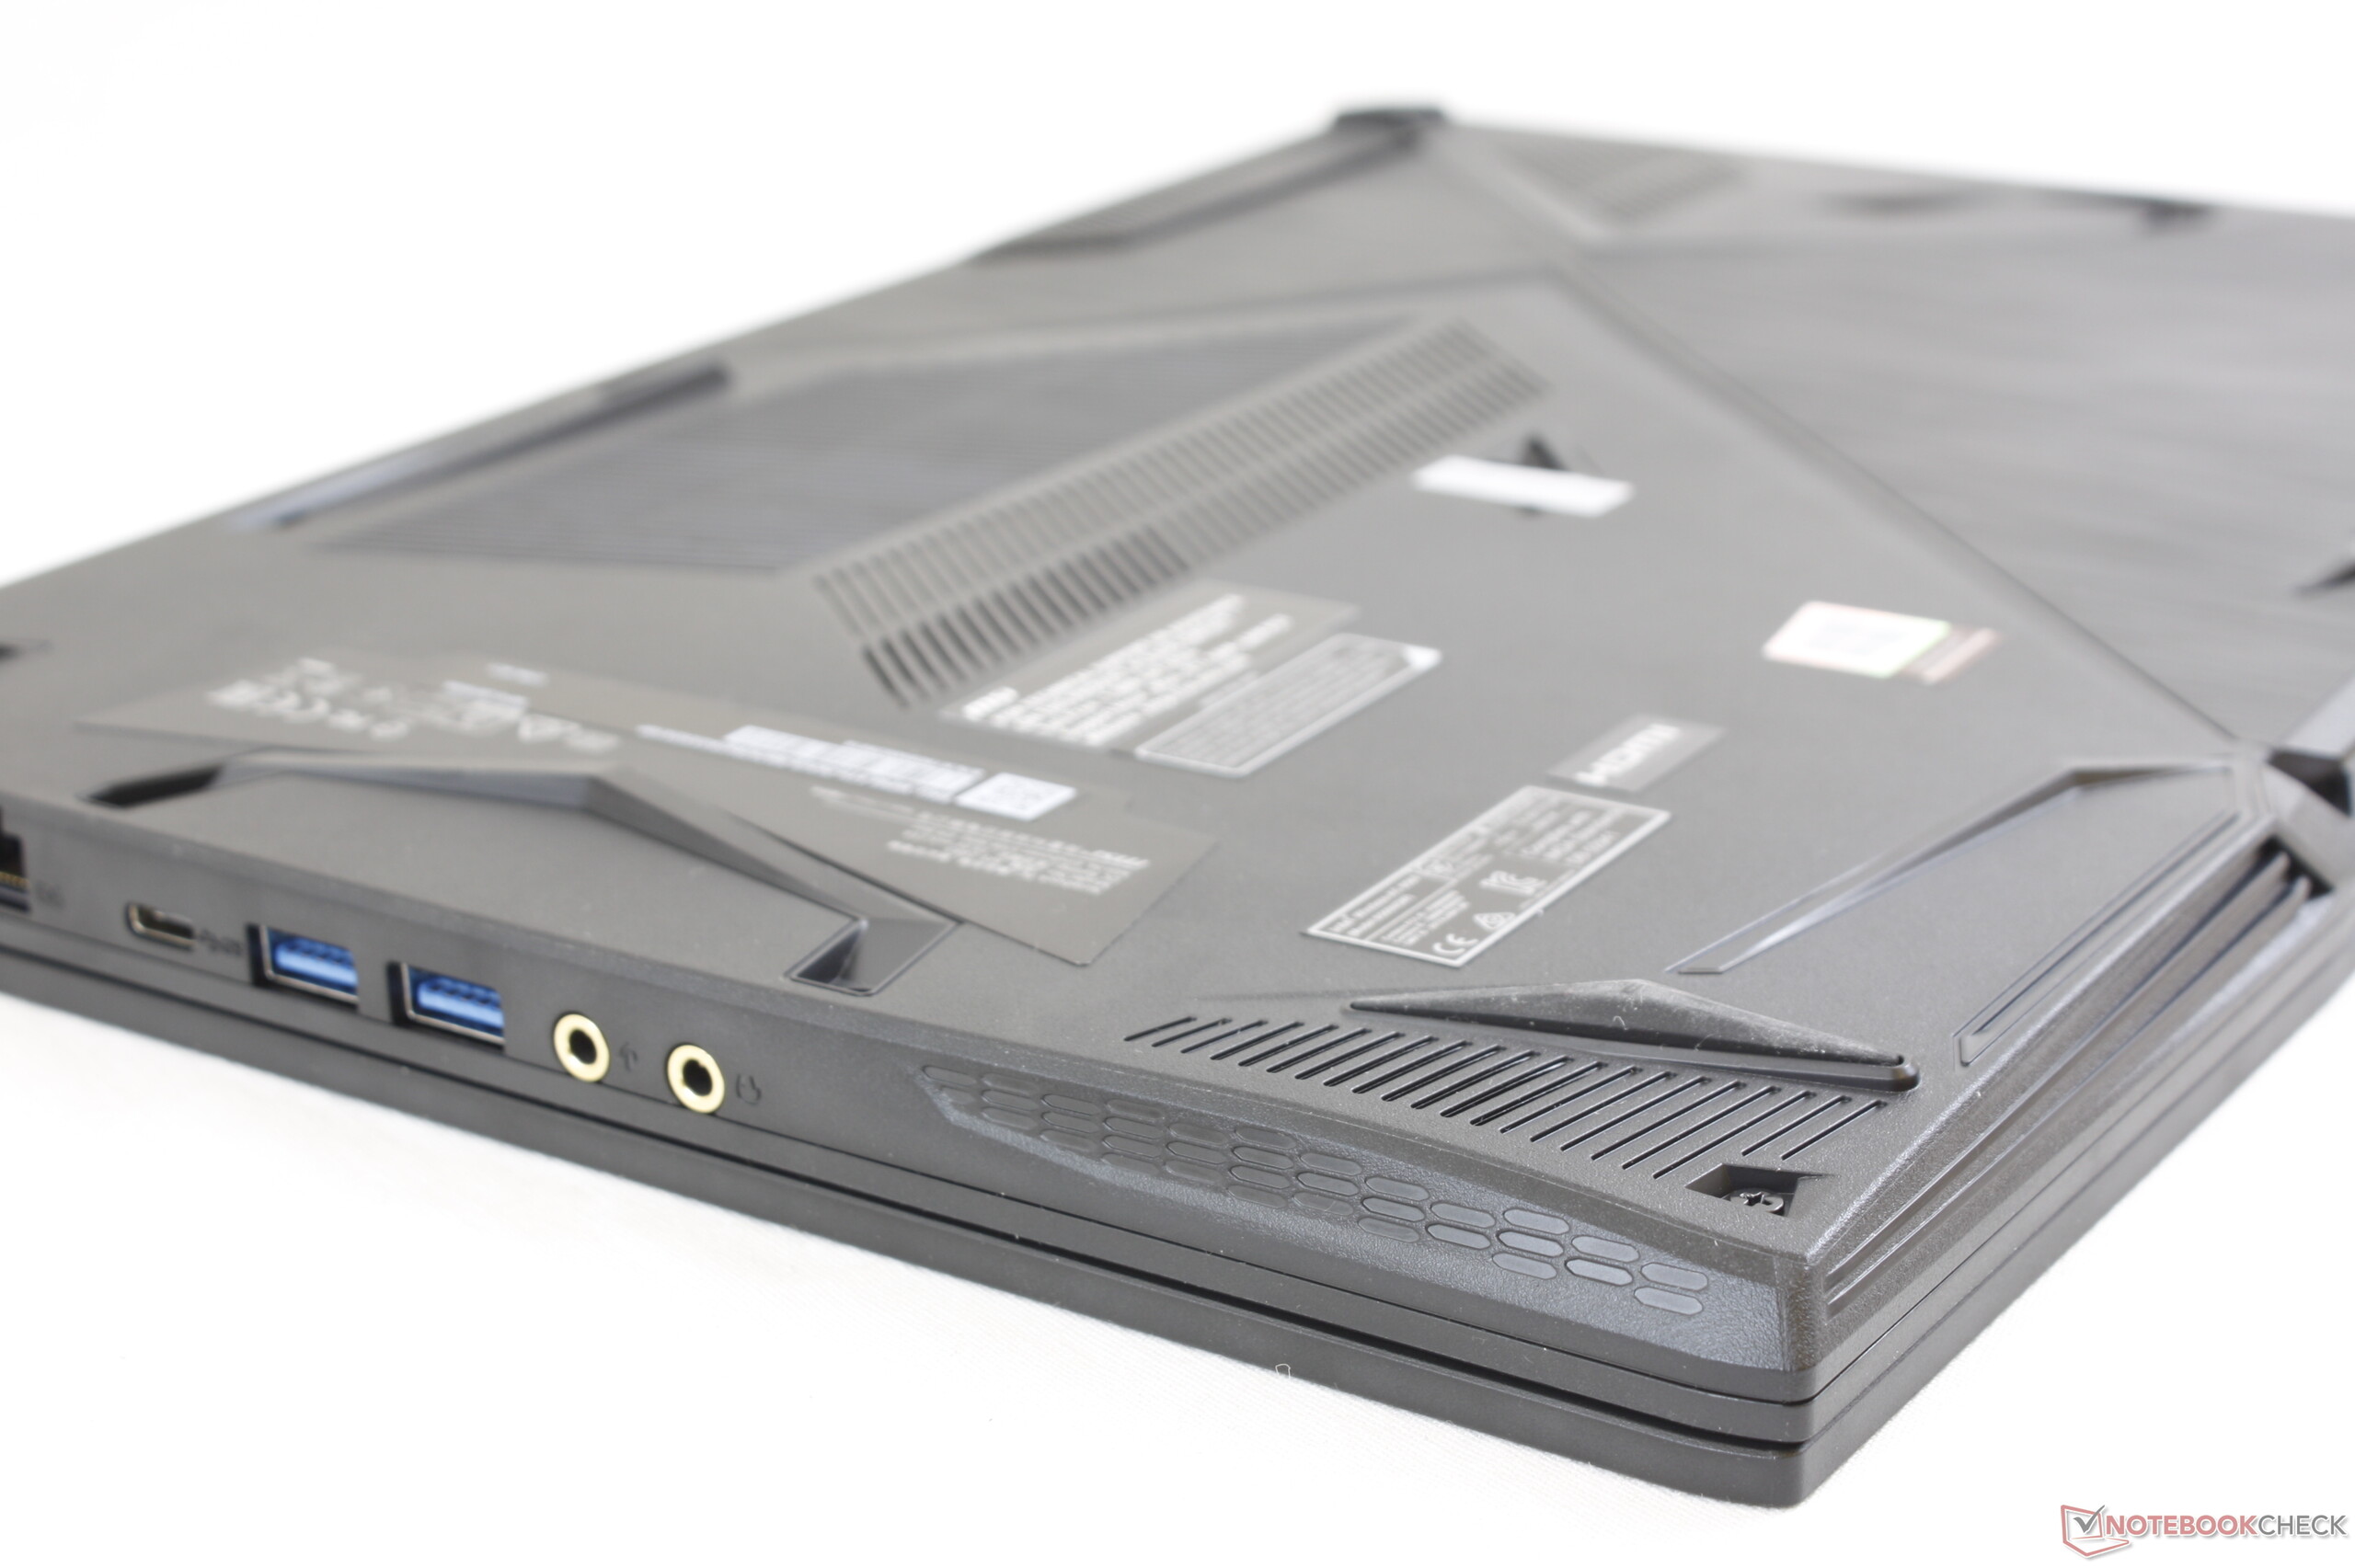
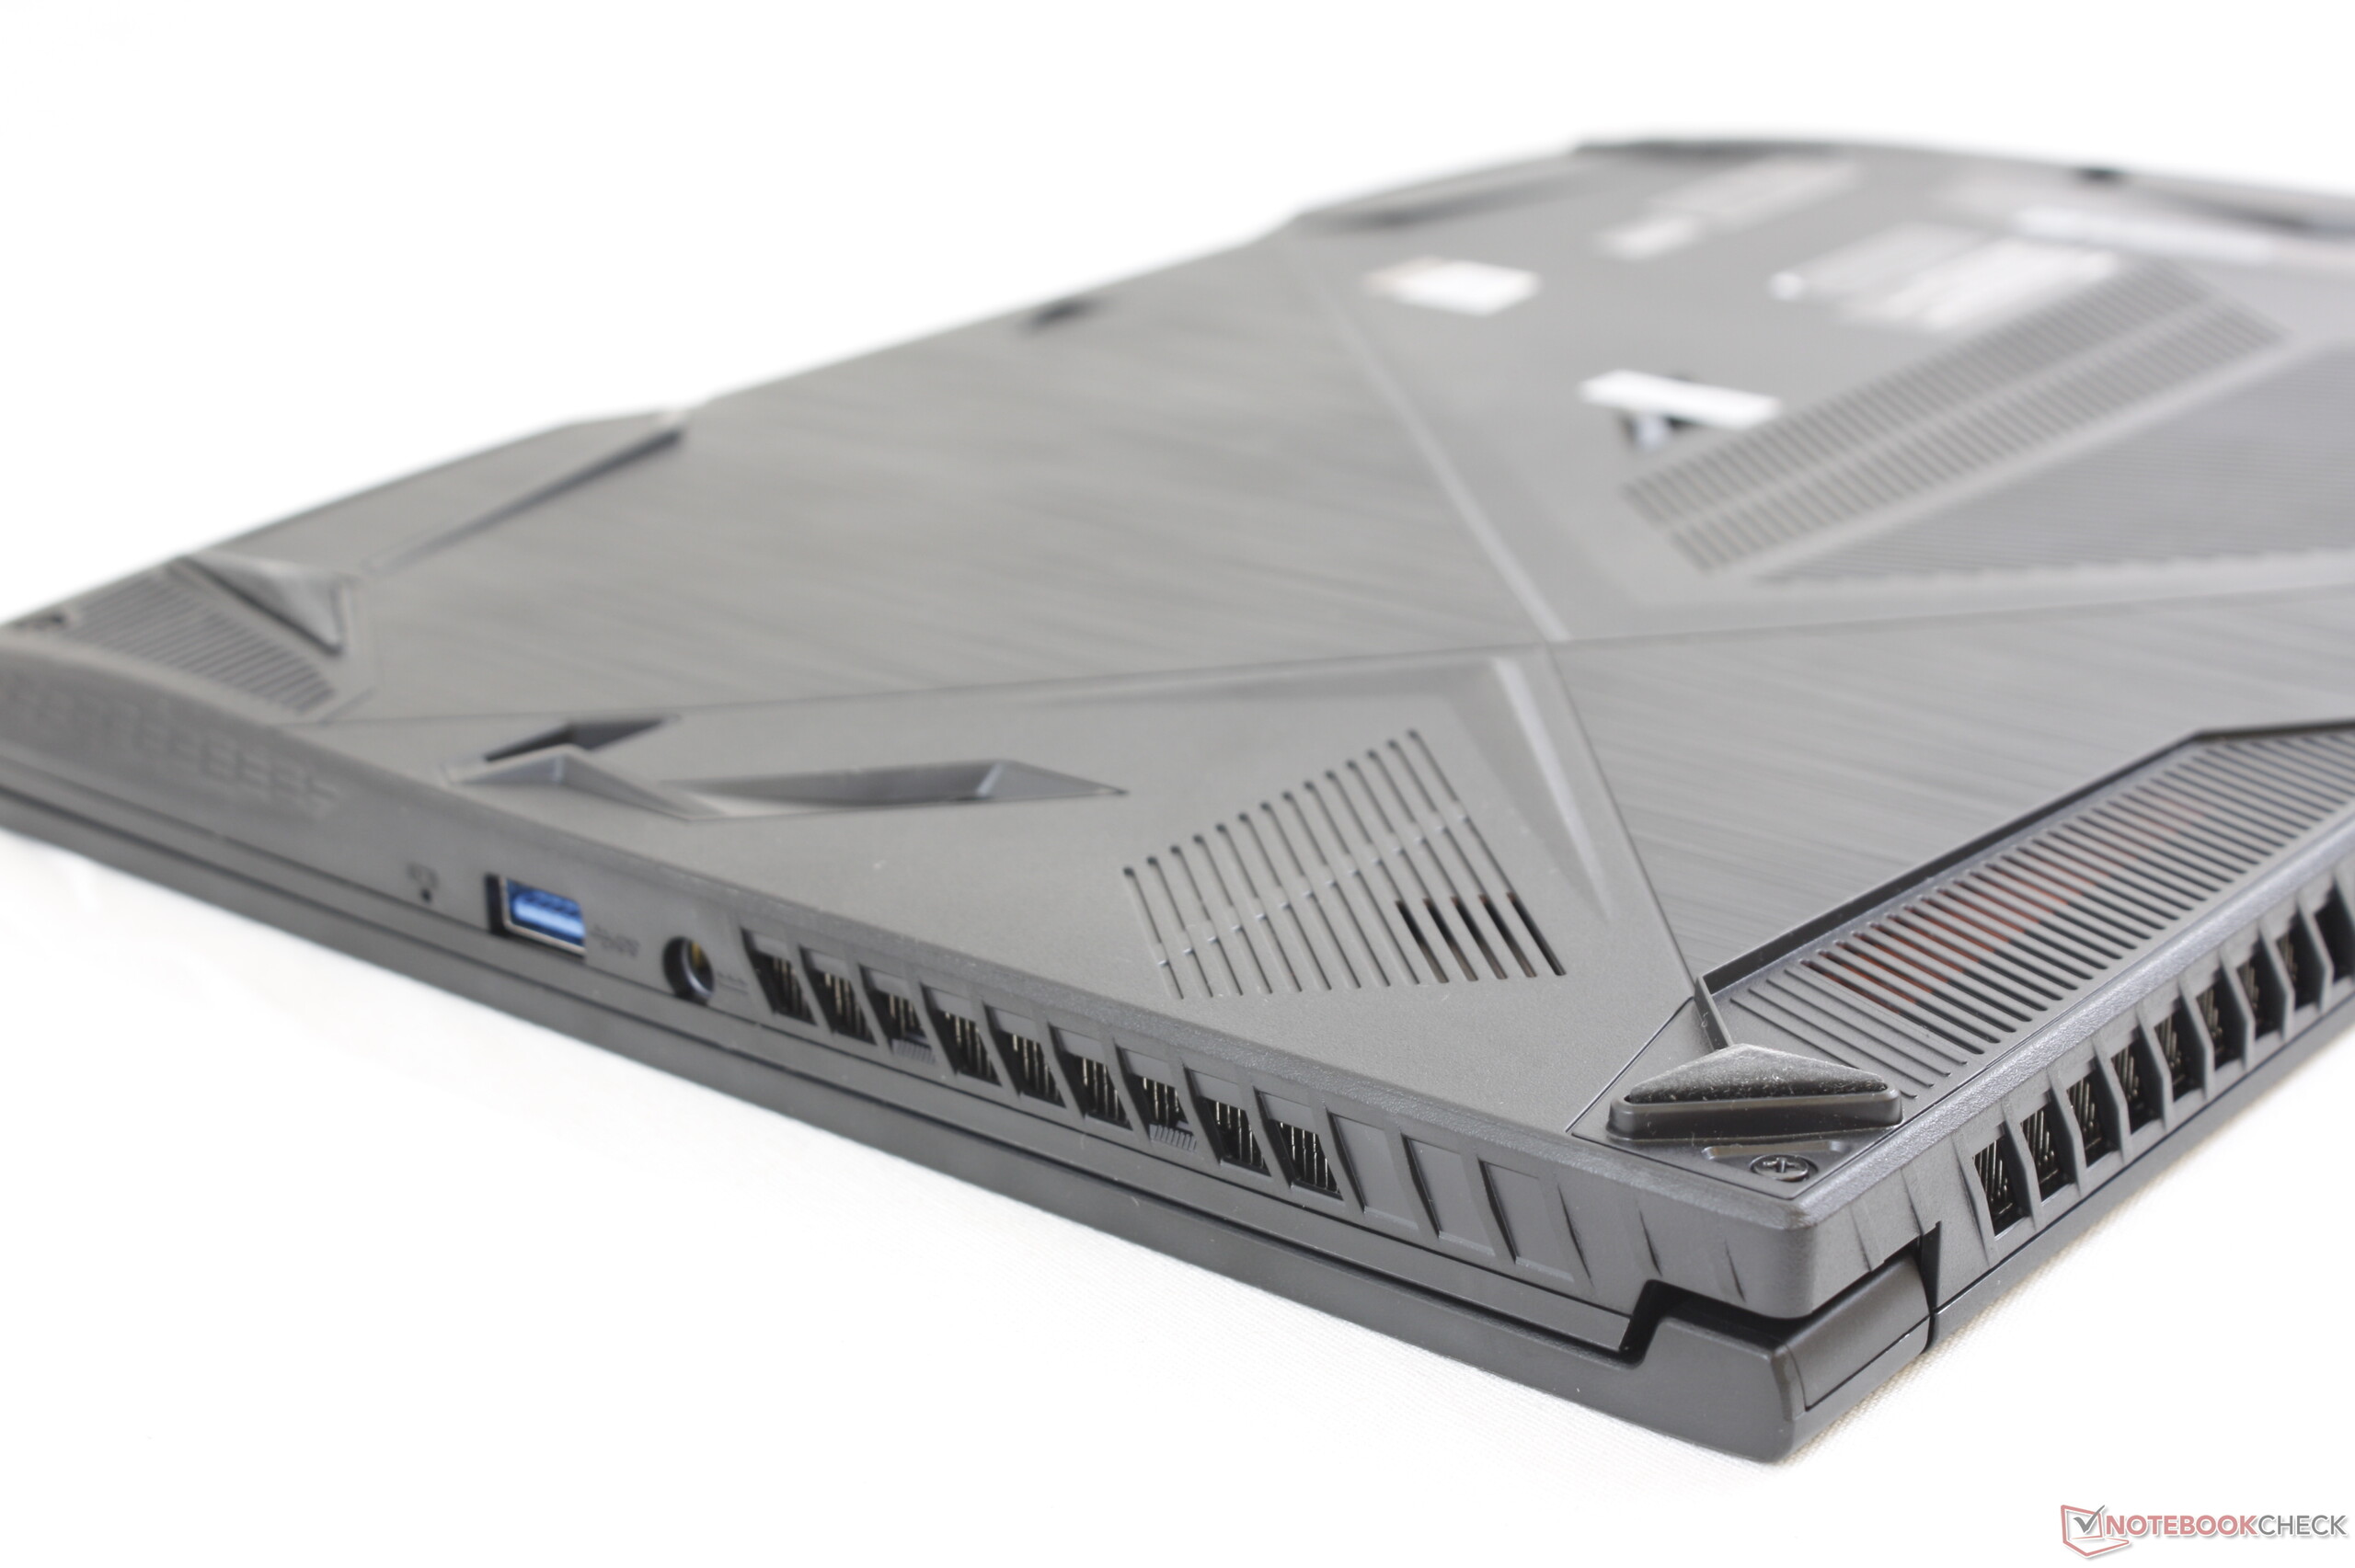
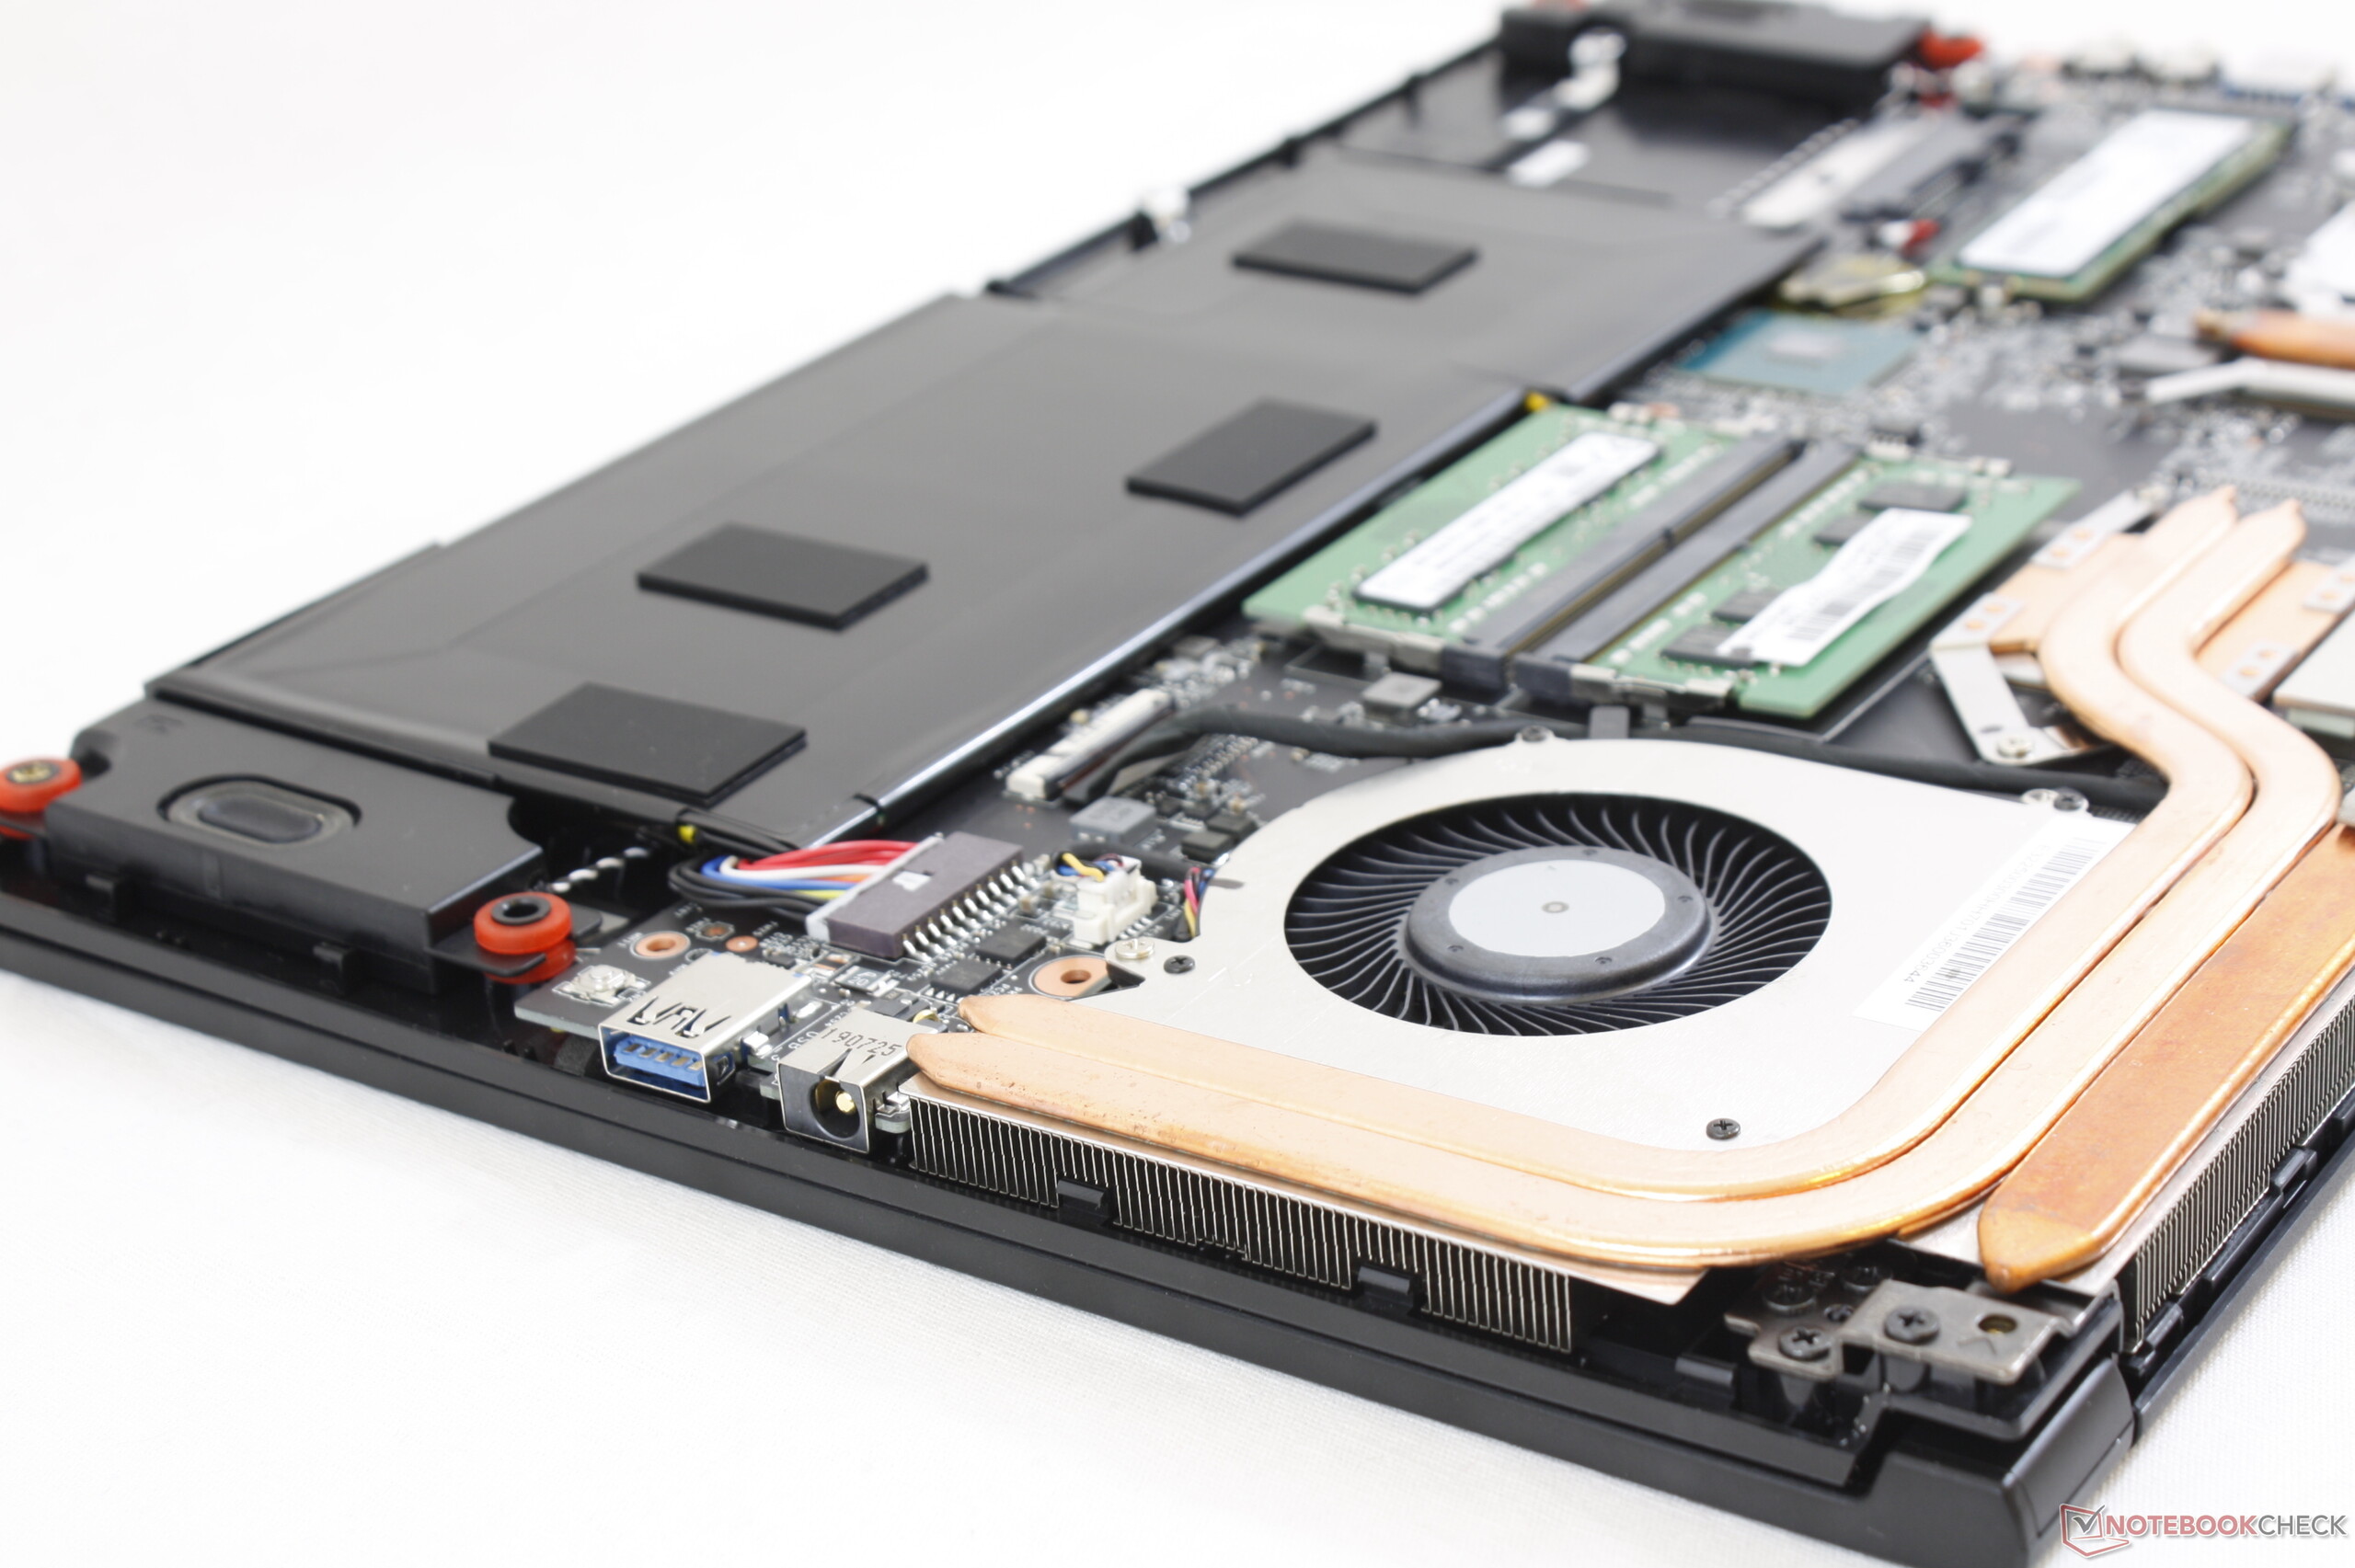
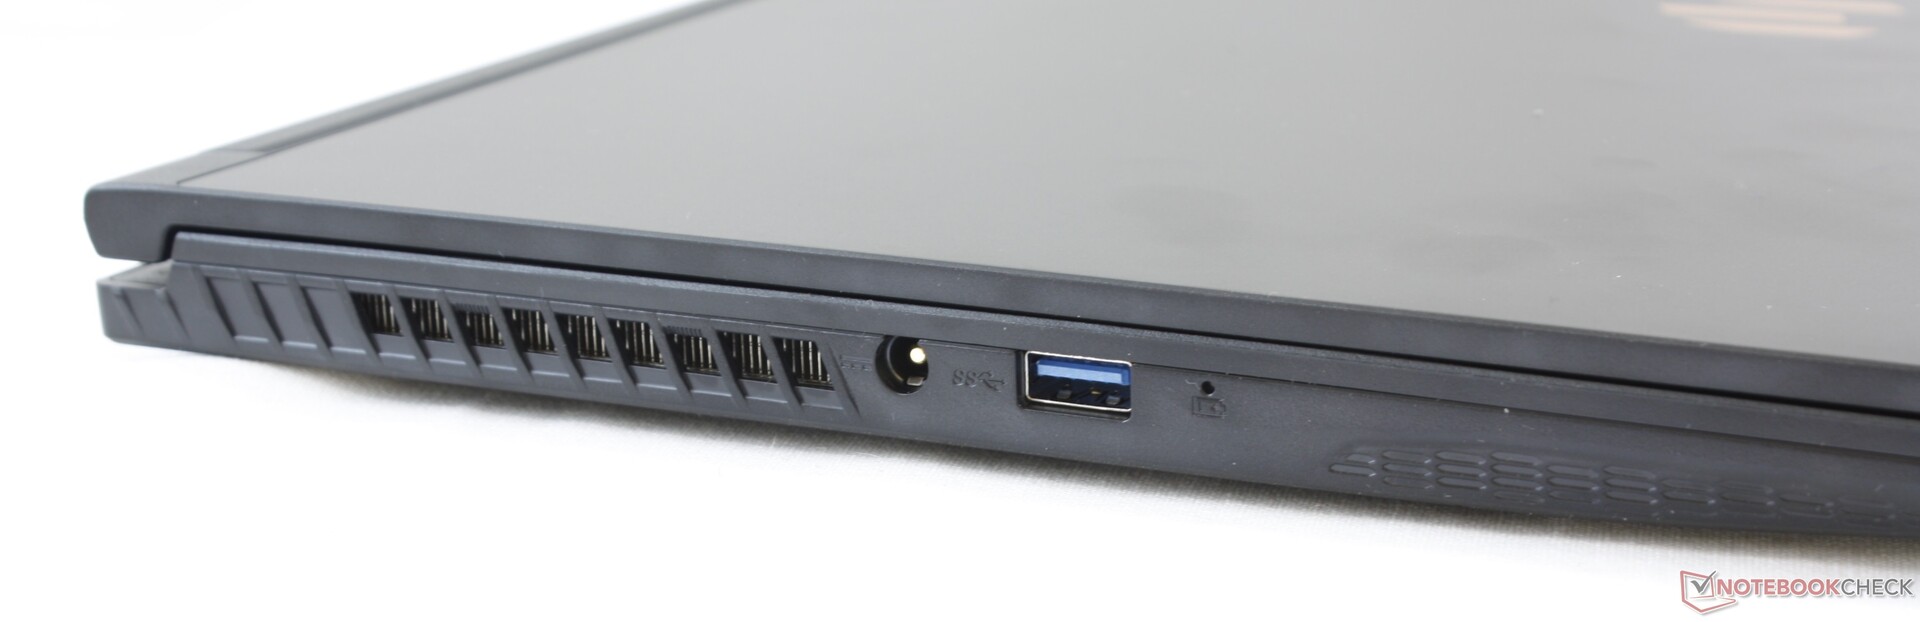
MSI är i huvudsak kända för sina spellaptops så det är kanske inte så förvånande att arbetsstationen WP65 känns som och ser ut som en laptop från G-serien. Den har till och med flera ljudanslutningar i guld för mikrofon och hörlurar, vilket är ovanligt för en arbetsstation. Från ett professionellt perspektiv är detta ett tveeggat svärd; WP65 är definitivt mer tilltalande och visuellt sett livlig än en typisk tråkig instegsmodell som Dell Precision 3000 eller HP ZBook 15v, men de ytliga fördelarna kommer på bekostnad av hårdvaran.
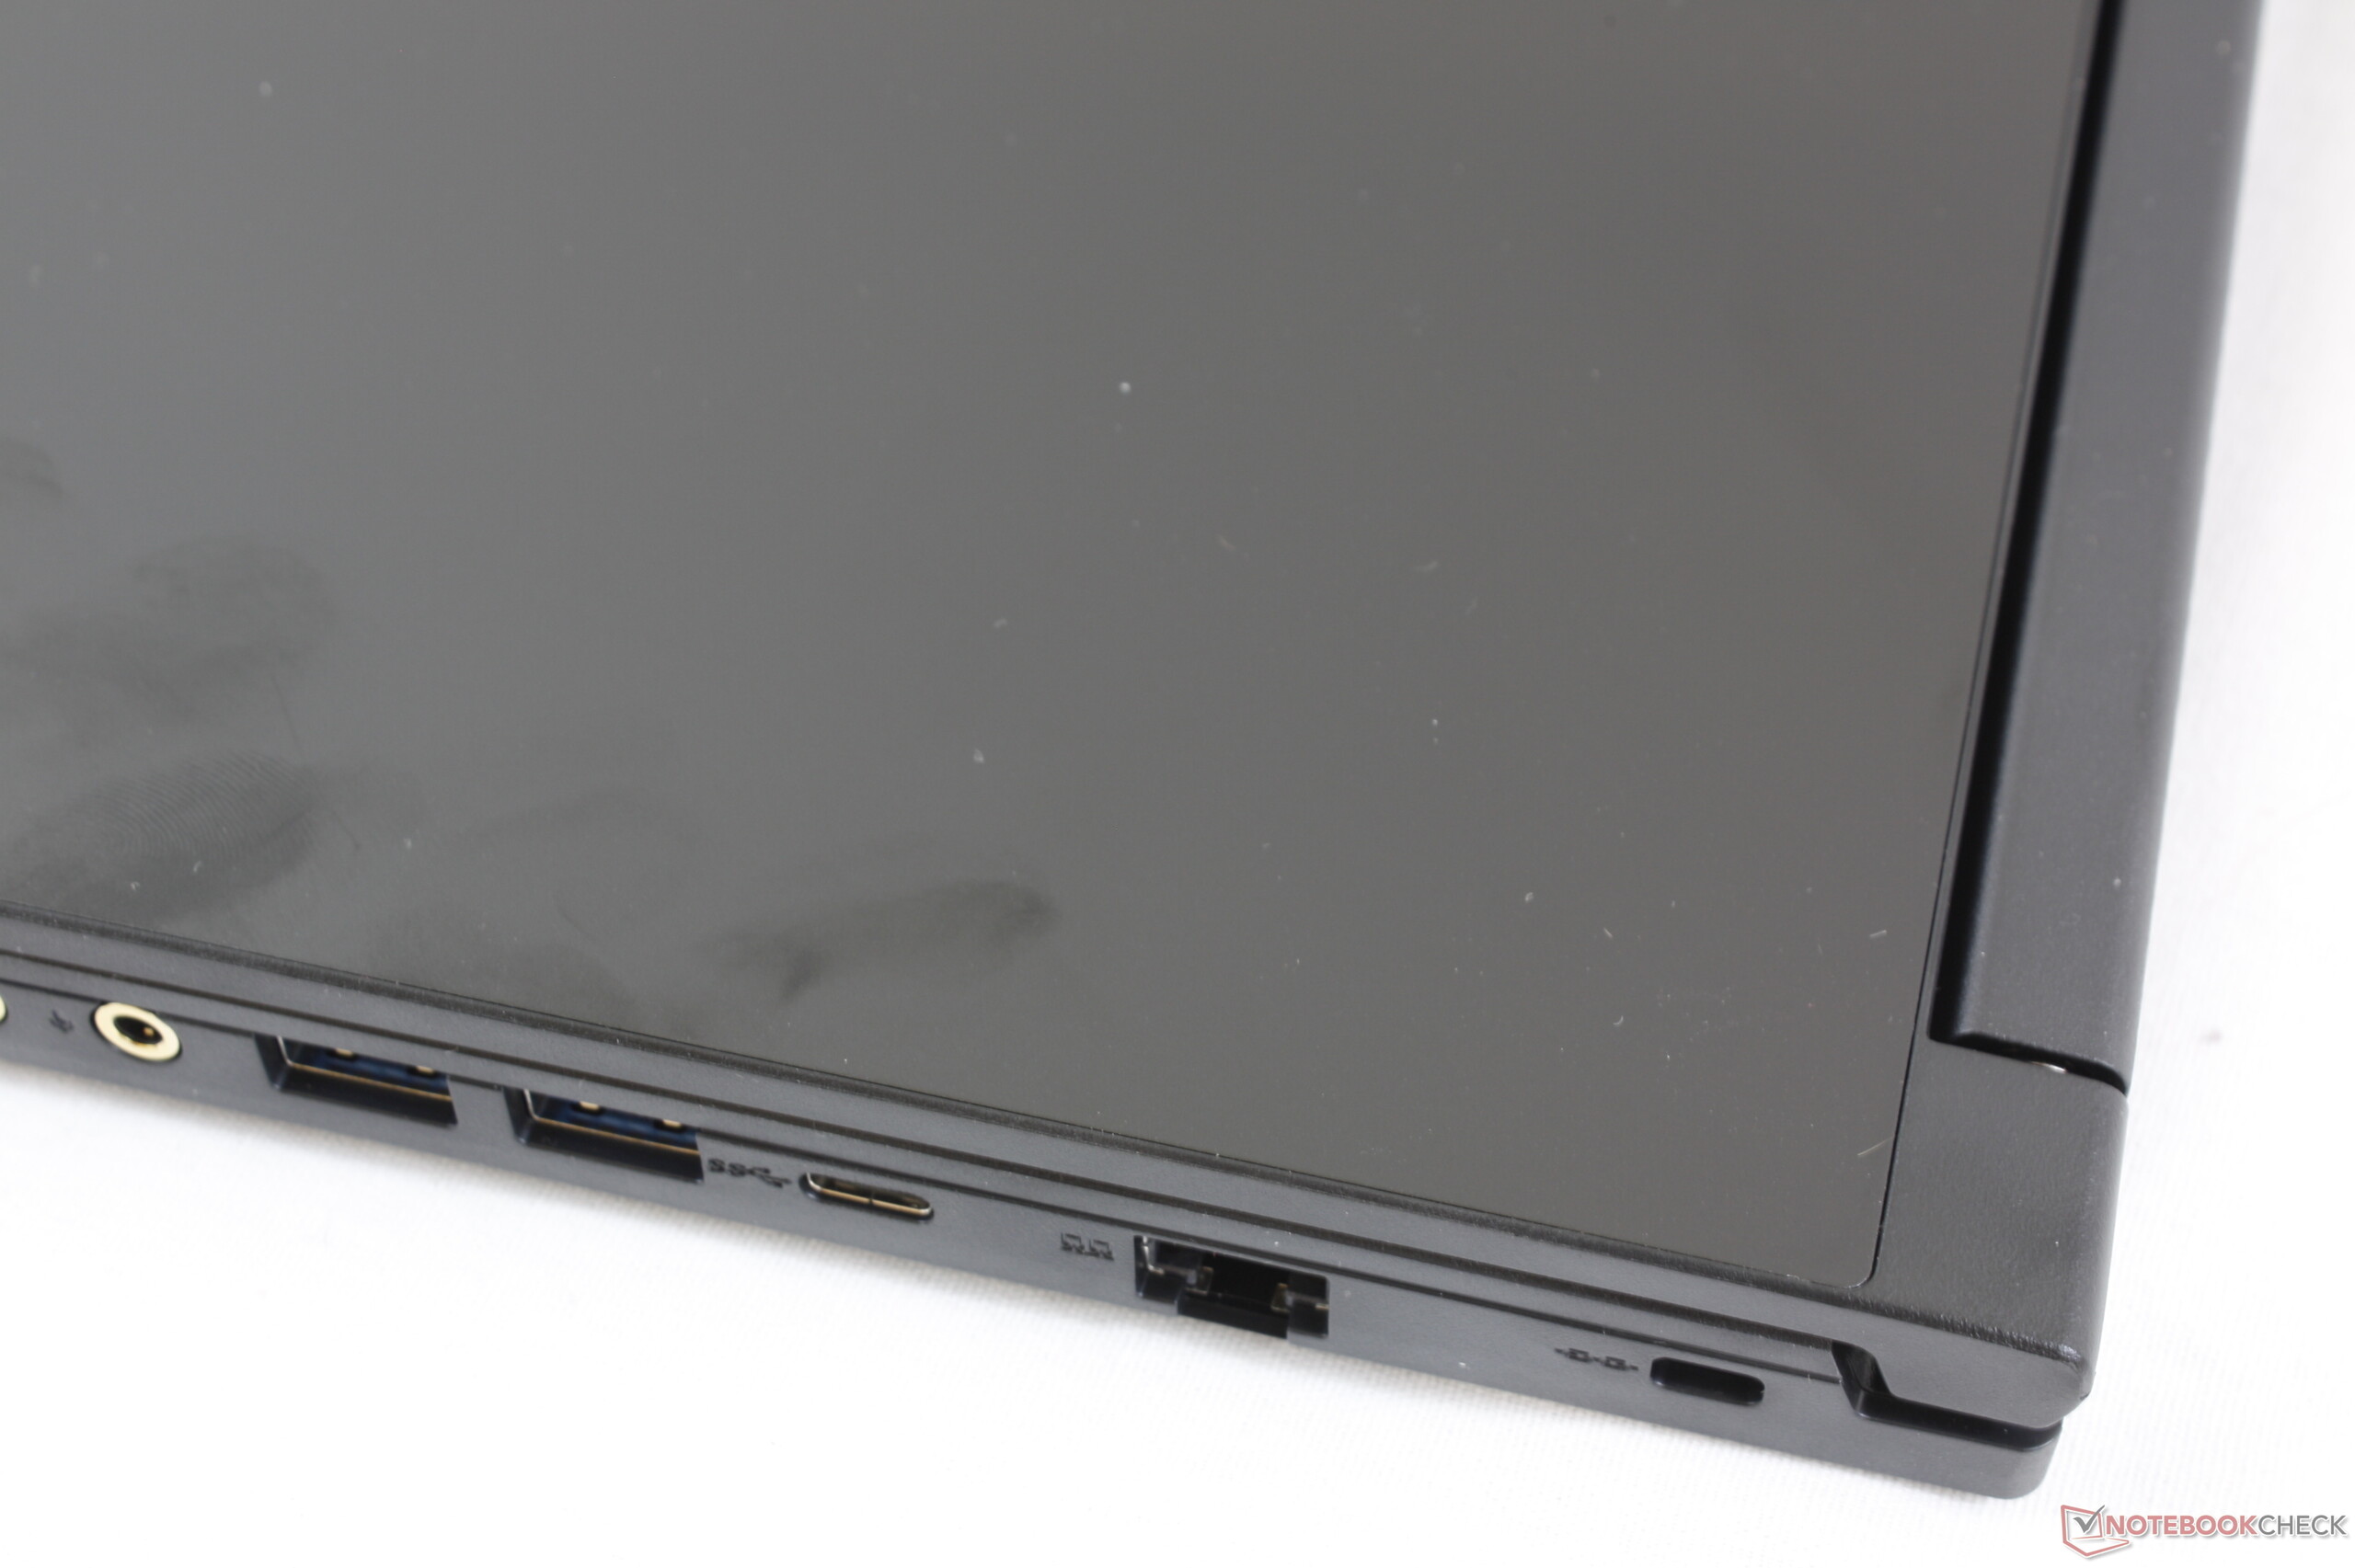
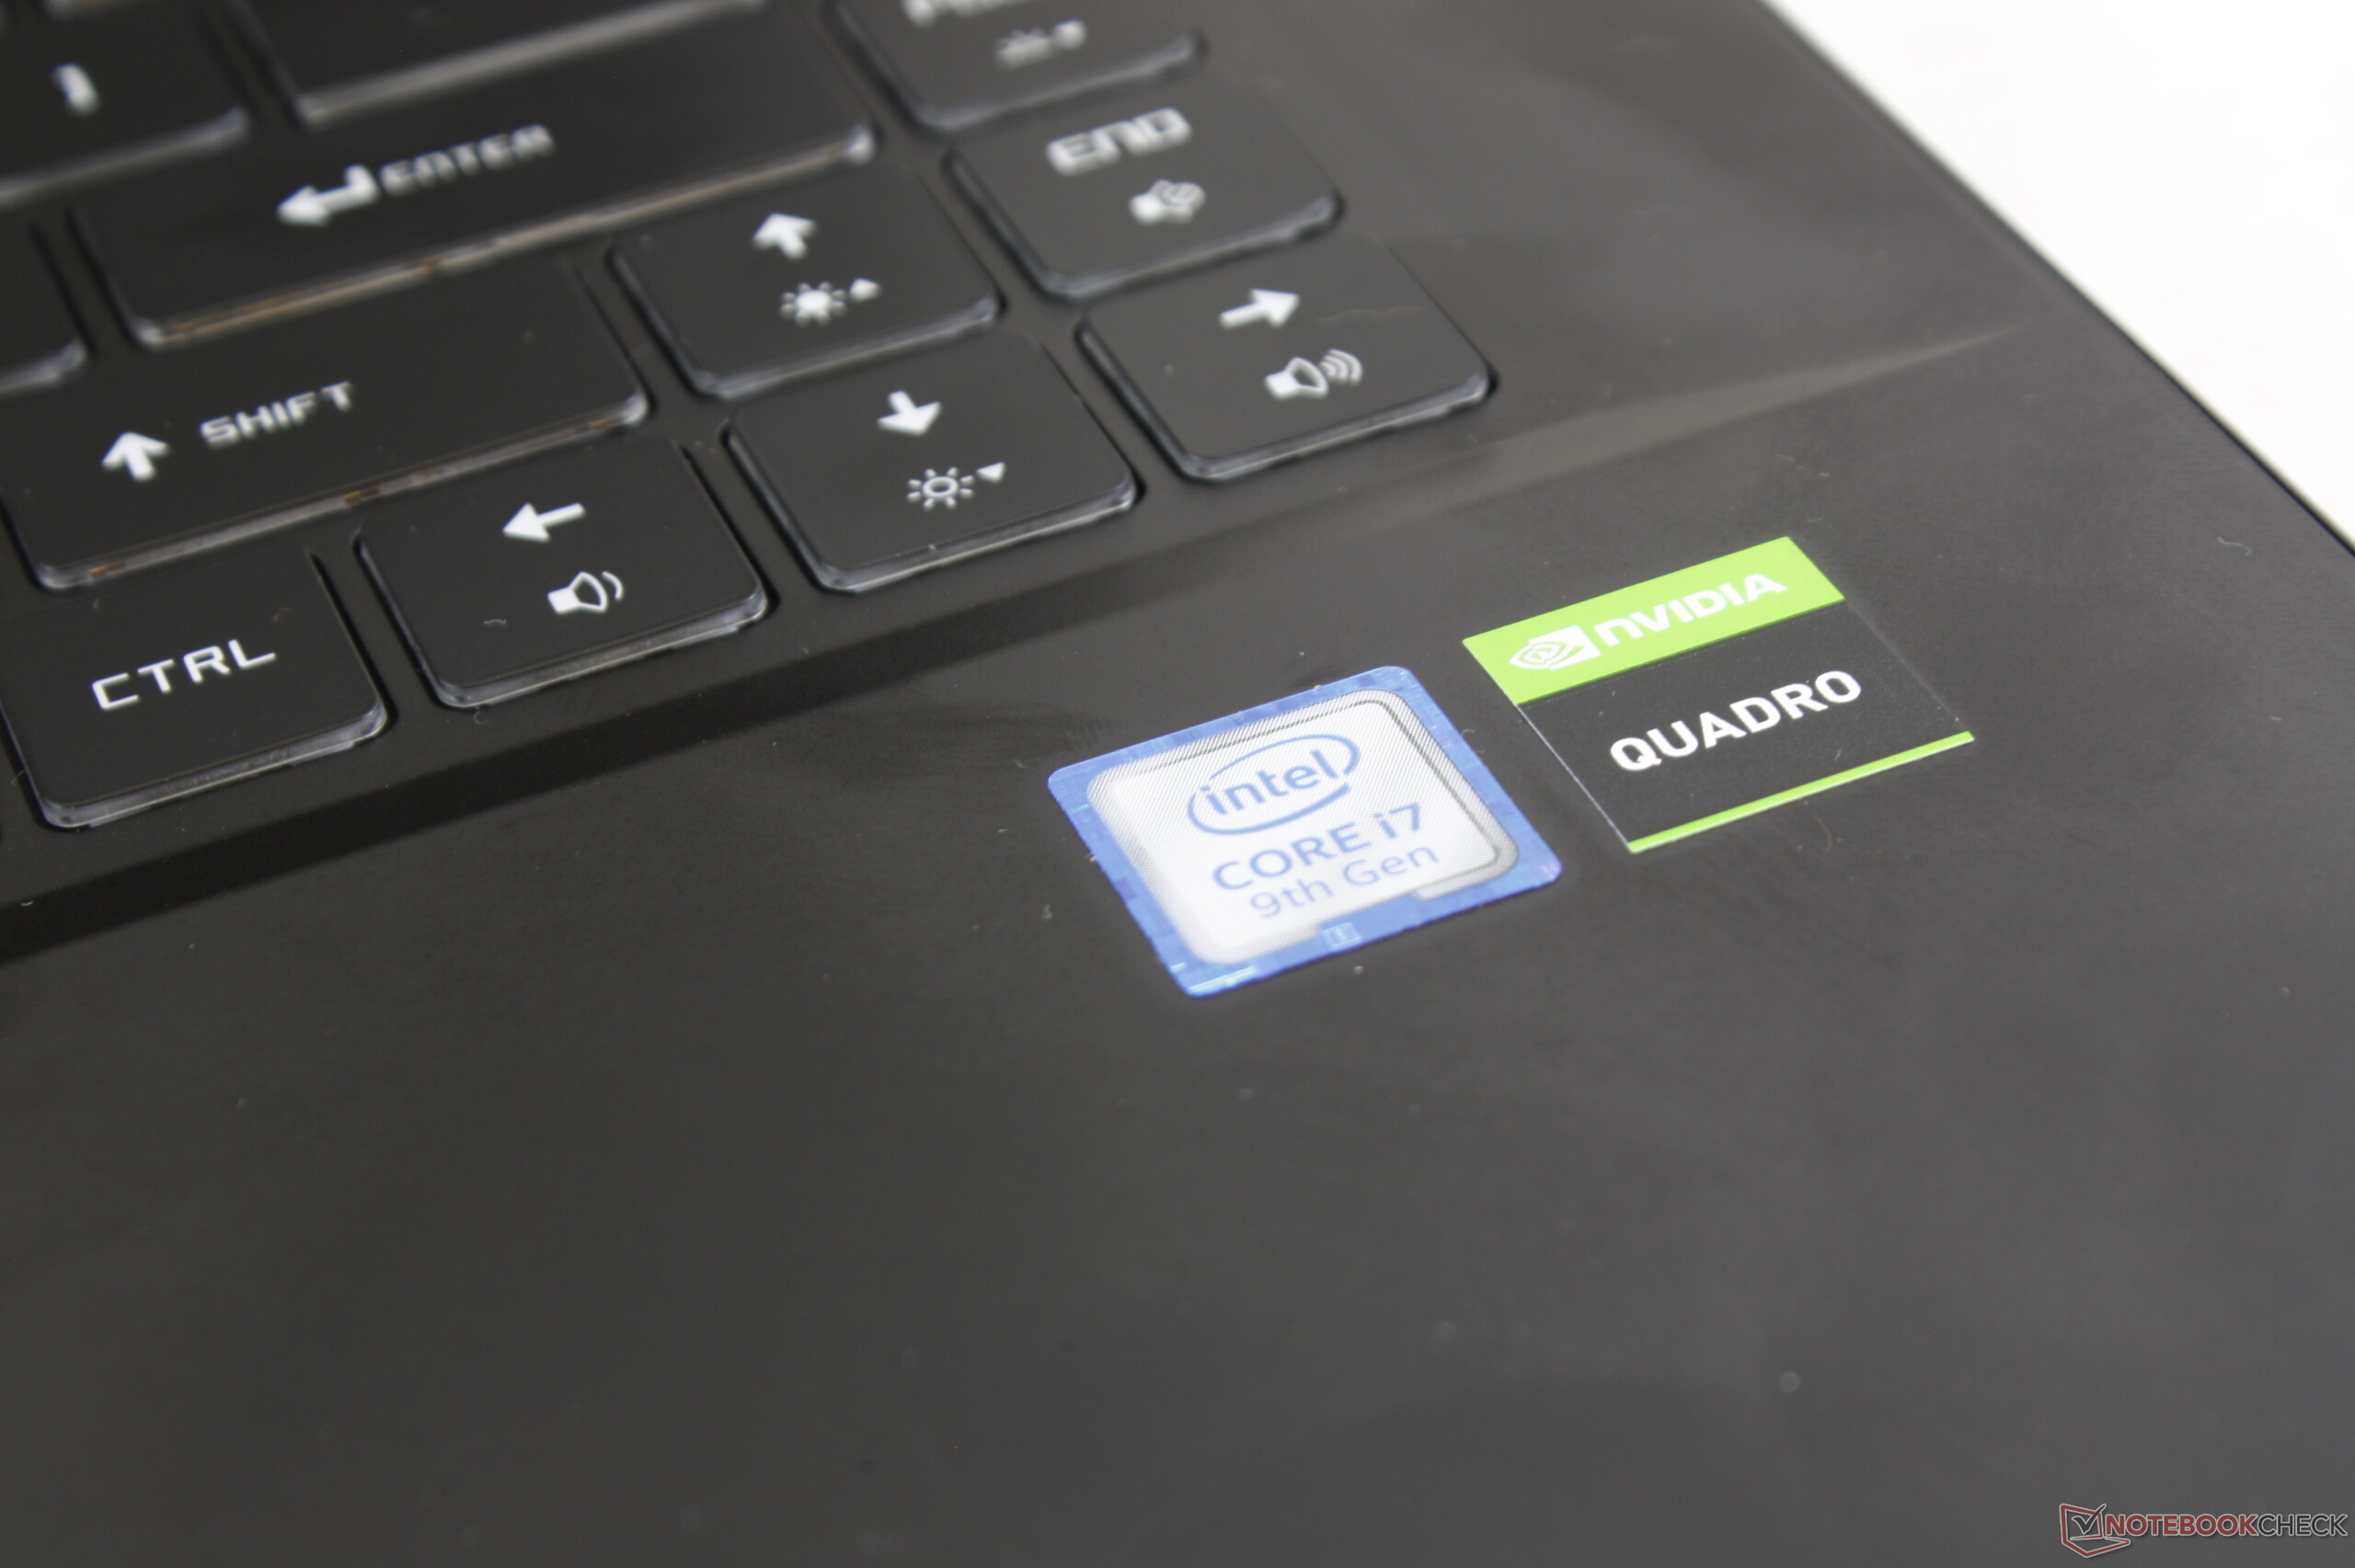
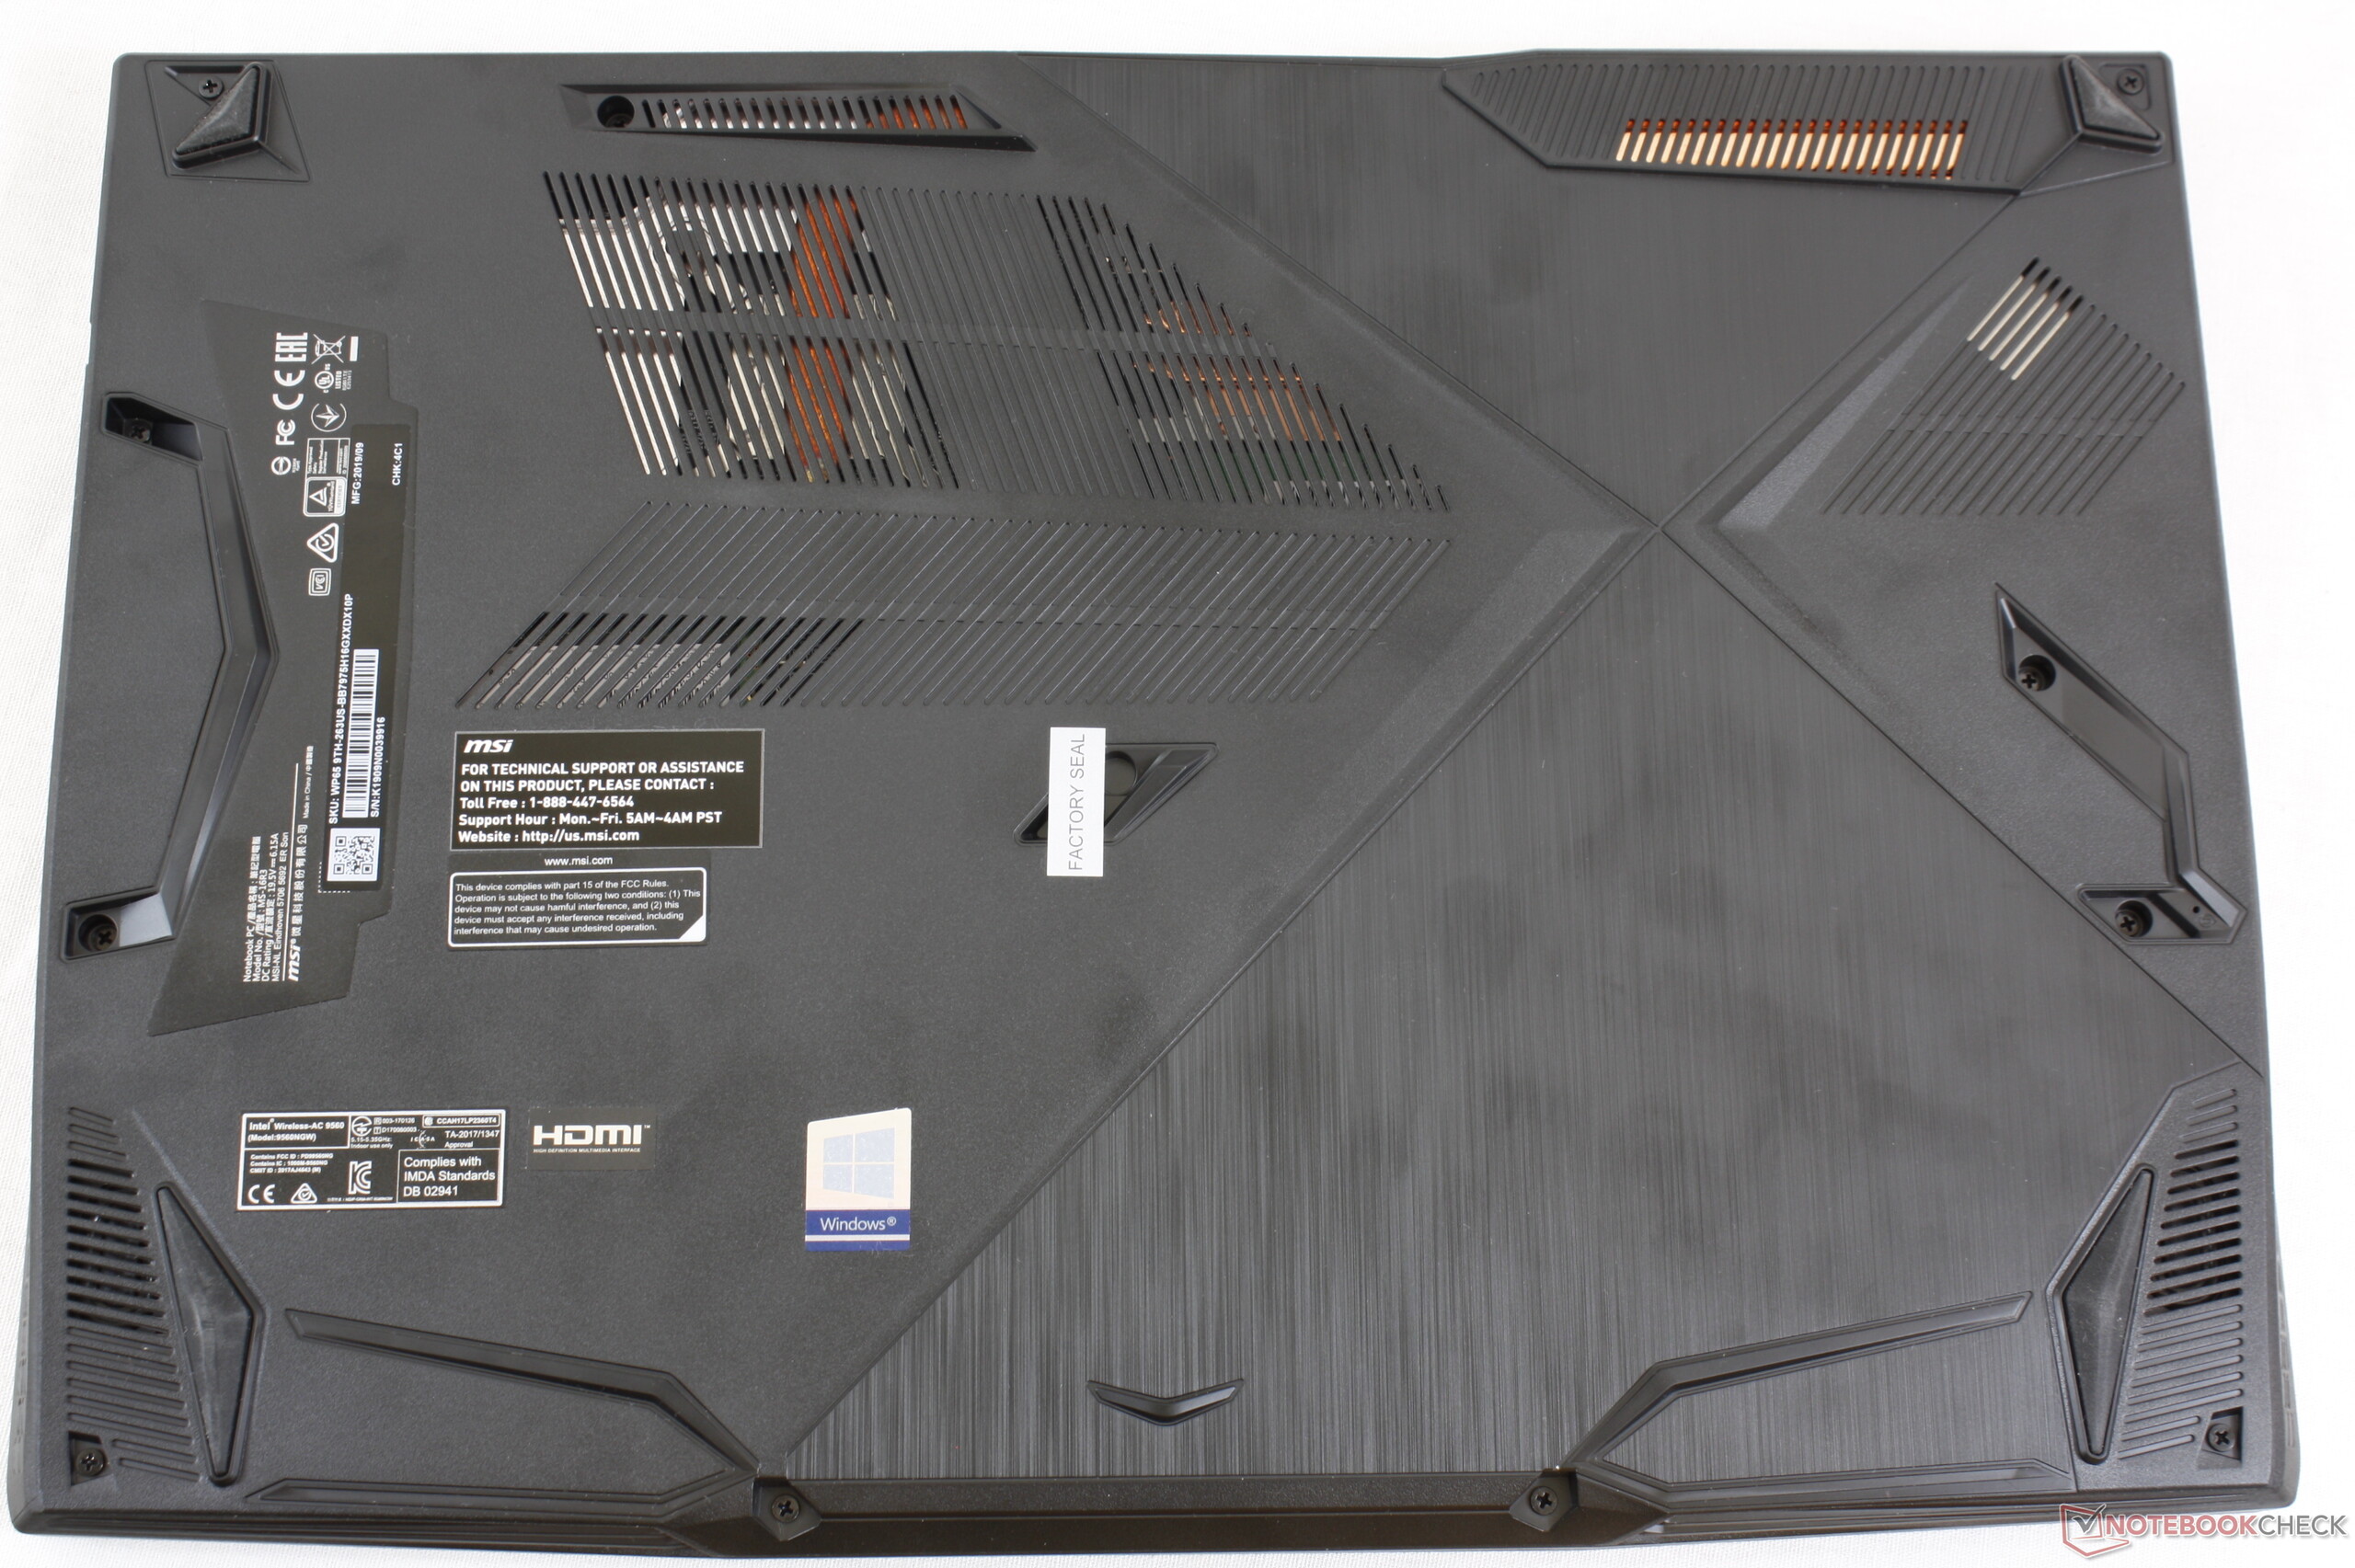
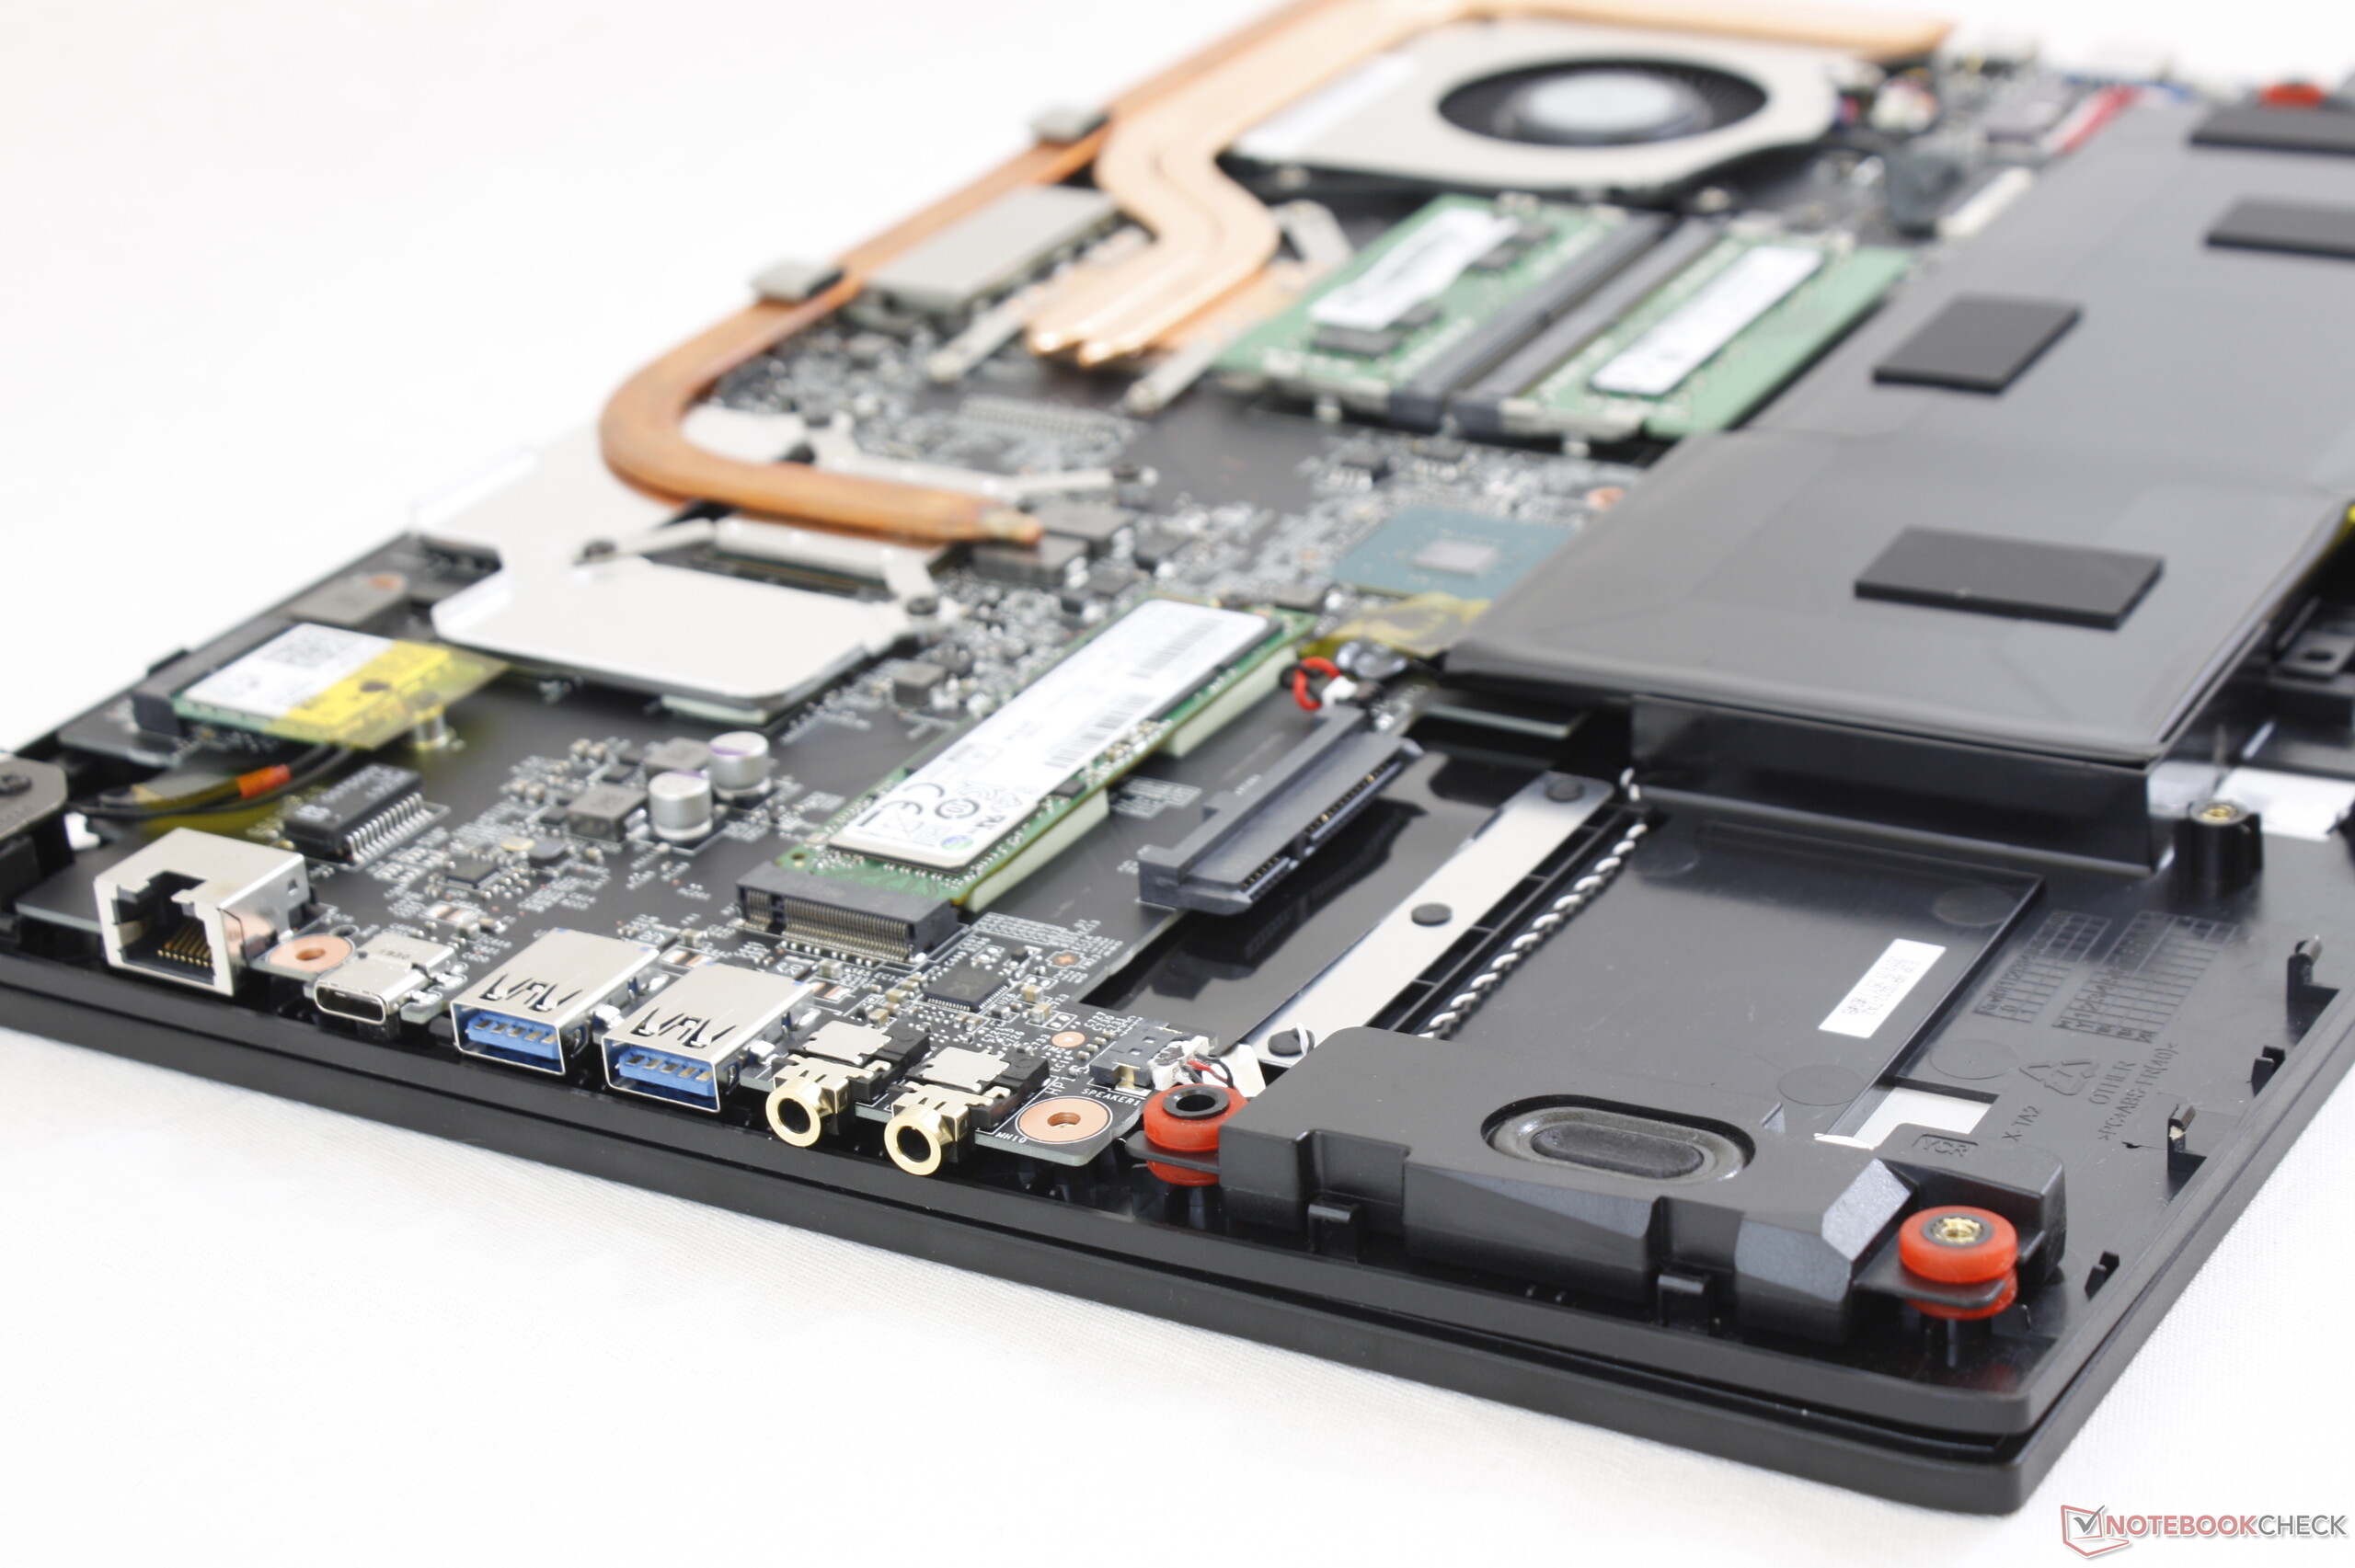
Gräv djupare och en lång lista över brister uppenbarar sig. Funktioner som är vanliga på arbetsstationer såsom Xeon-processorer, ECC-minne, full sRGB-täckning, SD-kortläsare, inbyggt numeriskt tangentbord, Smart Card-läsare eller inloggning genom fingeravtryck saknas på WP65. Dessutom böjer sig chassit och gångjärnen mer än på de allra billigaste arbetsstationerna ThinkPad P eller Precision 3541, vilket ger ett dåligt första intryck. Klickplattan och fabriksförseglingen som avråder från användarservice känns som kvarlevor från en konsumentlaptop snarare än något tänkt att tilltala proffs. Du får byta upp dig till MSI:s lyxigare WS-serie eller den riktigt kraftfulla WT-serien om du vill ha dessa vanliga arbetsstationsalternativ.
Vanliga billiga arbetsstationer prioriterar alternativ och funktioner framför utseende. MSI WP65 lutar lite för mycket åt det sistnämnda och inte tillräckligt mycket mot det första vilket resulterar i en avskalad upplevelse. Fler varianter och funktioner dedikerade åt proffs hade hjälpt den att stå ut mer vid jämförelse med giganter som HP, Lenovo och Dell.
MSI WP65
- 10/15/2019 v7 (old)
Allen Ngo
Price comparison
