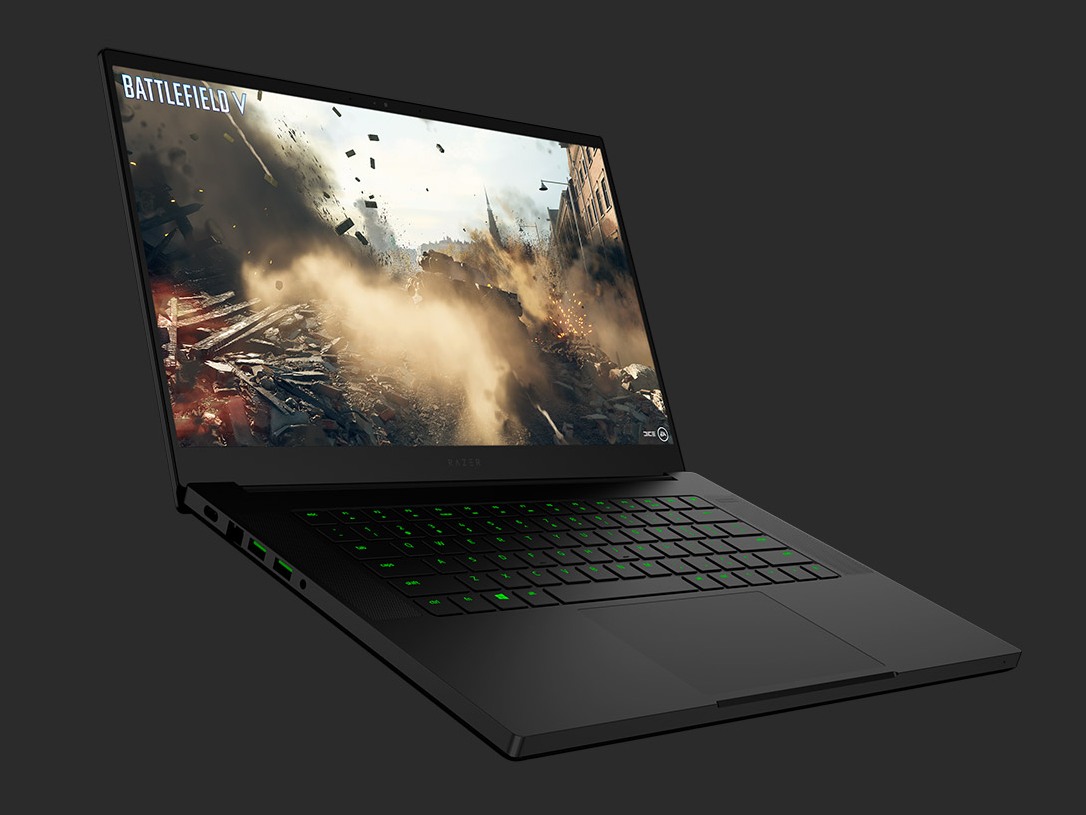
Test: Razer Blade 15 GTX 1660 Ti Base Model — Ingen RTX? Inga problem! (Sammanfattning)
| |||||||||||||||||||||||||
Distribution av ljusstyrkan: 90 %
Mitt på batteriet: 312.7 cd/m²
Kontrast: 1158:1 (Svärta: 0.27 cd/m²)
ΔE ColorChecker Calman: 4.57 | ∀{0.5-29.43 Ø4.73}
calibrated: 2.91
ΔE Greyscale Calman: 4.3 | ∀{0.09-98 Ø4.97}
91.3% sRGB (Argyll 1.6.3 3D)
59.4% AdobeRGB 1998 (Argyll 1.6.3 3D)
66.5% AdobeRGB 1998 (Argyll 3D)
91.8% sRGB (Argyll 3D)
65.3% Display P3 (Argyll 3D)
Gamma: 2.29
CCT: 7098 K
| Razer Blade 15 GTX 1660 Ti BOE NV156FHM-N4K, IPS, 15.6", 1920x1080 | Razer Blade 15 RTX 2080 Max-Q Sharp LQ156M1JW03 (SHP14C5), IPS, 15.6", 1920x1080 | Razer Blade 15 RTX 2070 Max-Q LG Philips LGD05C0, IPS, 15.6", 1920x1080 | Alienware m15 R2 P87F Sharp LQ156M1, IPS, 15.6", 1920x1080 | Dell XPS 15 7590 9980HK GTX 1650 Samsung 156WR04, SDCA029, OLED, 15.6", 3840x2160 | Gigabyte Aero 15 Classic-XA Sharp LQ156M1JW03 (SHP14C5), IGZO, 15.6", 1920x1080 | |
|---|---|---|---|---|---|---|
| Display | 4% | 1% | 1% | 27% | 1% | |
| Display P3 Coverage (%) | 65.3 | 66.9 2% | 65.3 0% | 65.3 0% | 88.1 35% | 65.3 0% |
| sRGB Coverage (%) | 91.8 | 98.1 7% | 94.9 3% | 95.1 4% | 99.6 8% | 95.5 4% |
| AdobeRGB 1998 Coverage (%) | 66.5 | 68.5 3% | 66.3 0% | 65.9 -1% | 91.8 38% | 66.5 0% |
| Response Times | 1% | -20% | -5% | 80% | -12% | |
| Response Time Grey 50% / Grey 80% * (ms) | 13.6 ? | 12.8 ? 6% | 16.8 ? -24% | 16.4 ? -21% | 2.3 ? 83% | 15.2 ? -12% |
| Response Time Black / White * (ms) | 10 ? | 10.4 ? -4% | 11.6 ? -16% | 8.8 ? 12% | 2.4 ? 76% | 11.2 ? -12% |
| PWM Frequency (Hz) | 200 ? | 23810 ? | 23810 ? | 59.5 ? | 23580 ? | |
| Screen | 17% | 7% | -17% | 6% | 6% | |
| Brightness middle (cd/m²) | 312.7 | 293 -6% | 314.7 1% | 324.2 4% | 421.2 35% | 266 -15% |
| Brightness (cd/m²) | 305 | 270 -11% | 312 2% | 304 0% | 417 37% | 248 -19% |
| Brightness Distribution (%) | 90 | 87 -3% | 90 0% | 90 0% | 94 4% | 89 -1% |
| Black Level * (cd/m²) | 0.27 | 0.29 -7% | 0.38 -41% | 0.38 -41% | 0.31 -15% | |
| Contrast (:1) | 1158 | 1010 -13% | 828 -28% | 853 -26% | 858 -26% | |
| Colorchecker dE 2000 * | 4.57 | 1.69 63% | 2.56 44% | 5.01 -10% | 6.06 -33% | 2.78 39% |
| Colorchecker dE 2000 max. * | 6.81 | 3.37 51% | 4.89 28% | 12.7 -86% | 11.89 -75% | 5.96 12% |
| Colorchecker dE 2000 calibrated * | 2.91 | 1.24 57% | 1.71 41% | 1.64 44% | 0.91 69% | |
| Greyscale dE 2000 * | 4.3 | 2.3 47% | 3.4 21% | 7.9 -84% | 2.8 35% | 3.58 17% |
| Gamma | 2.29 96% | 2.3 96% | 2.3 96% | 2.35 94% | 2.15 102% | 2.46 89% |
| CCT | 7098 92% | 6758 96% | 6435 101% | 8455 77% | 6235 104% | 7186 90% |
| Color Space (Percent of AdobeRGB 1998) (%) | 59.4 | 63 6% | 60.7 2% | 60.8 2% | 81 36% | 62 4% |
| Color Space (Percent of sRGB) (%) | 91.3 | 98.5 8% | 94.6 4% | 95.5 5% | 99.6 9% | 96 5% |
| Totalt genomsnitt (program/inställningar) | 7% /
13% | -4% /
2% | -7% /
-12% | 38% /
22% | -2% /
3% |
* ... mindre är bättre
Visa svarstider
| ↔ Svarstid svart till vitt | ||
|---|---|---|
| 10 ms ... stiga ↗ och falla ↘ kombinerat | ↗ 6 ms stiga | 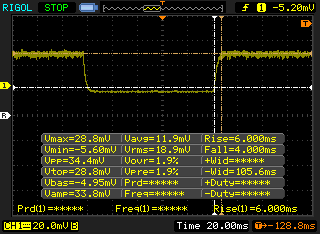 |
| ↘ 4 ms hösten | ||
| Skärmen visar bra svarsfrekvens i våra tester, men kan vara för långsam för konkurrenskraftiga spelare. I jämförelse sträcker sig alla testade enheter från 0.1 (minst) till 240 (maximalt) ms. » 27 % av alla enheter är bättre. Det betyder att den uppmätta svarstiden är bättre än genomsnittet av alla testade enheter (19.9 ms). | ||
| ↔ Svarstid 50 % grått till 80 % grått | ||
| 13.6 ms ... stiga ↗ och falla ↘ kombinerat | ↗ 7.2 ms stiga | 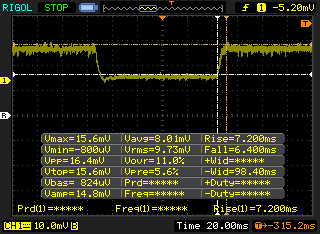 |
| ↘ 6.4 ms hösten | ||
| Skärmen visar bra svarsfrekvens i våra tester, men kan vara för långsam för konkurrenskraftiga spelare. I jämförelse sträcker sig alla testade enheter från 0.165 (minst) till 636 (maximalt) ms. » 27 % av alla enheter är bättre. Det betyder att den uppmätta svarstiden är bättre än genomsnittet av alla testade enheter (31.1 ms). | ||
Skärmflimmer / PWM (Puls-Width Modulation)
| Skärmflimmer / PWM upptäckt | 200 Hz | ≤ 99 % ljusstyrka inställning | 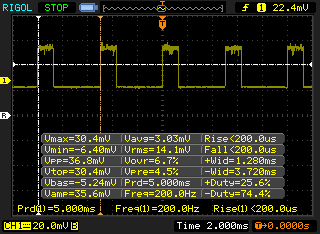 |
Displayens bakgrundsbelysning flimrar vid 200 Hz (i värsta fall, t.ex. med PWM) Flimrande upptäckt vid en ljusstyrkeinställning på 99 % och lägre. Det ska inte finnas något flimmer eller PWM över denna ljusstyrkeinställning. Frekvensen för 200 Hz är relativt låg, så känsliga användare kommer sannolikt att märka flimmer och uppleva ansträngda ögon vid den angivna ljusstyrkeinställningen och nedan. Som jämförelse: 52 % av alla testade enheter använder inte PWM för att dämpa skärmen. Om PWM upptäcktes mättes ett medelvärde av 7798 (minst: 5 - maximum: 343500) Hz. | |||
| Cinebench R15 | |
| CPU Single 64Bit | |
| Schenker XMG Ultra 15 Turing | |
| Eurocom Nightsky RX15 | |
| MSI GE75 9SG | |
| Genomsnitt Intel Core i7-9750H (170 - 194, n=82) | |
| Razer Blade Stealth i7-8565U | |
| MSI GF63 8RC-040XPL | |
| Lenovo Legion Y540-17IRH | |
| Schenker Key 16 | |
| Razer Blade 15 GTX 1660 Ti | |
| Asus FX503VM-EH73 | |
| Asus ROG Zephyrus G15 GA502DU | |
| CPU Multi 64Bit | |
| Eurocom Nightsky RX15 | |
| MSI GE75 9SG | |
| Schenker XMG Ultra 15 Turing | |
| Genomsnitt Intel Core i7-9750H (952 - 1306, n=85) | |
| Schenker Key 16 | |
| Razer Blade 15 GTX 1660 Ti | |
| Lenovo Legion Y540-17IRH | |
| MSI GF63 8RC-040XPL | |
| Asus ROG Zephyrus G15 GA502DU | |
| Asus FX503VM-EH73 | |
| Razer Blade Stealth i7-8565U | |
| Cinebench R11.5 | |
| CPU Single 64Bit | |
| MSI GE75 9SG | |
| Genomsnitt Intel Core i7-9750H (1.96 - 2.19, n=10) | |
| Asus FX503VM-EH73 | |
| Asus ROG Zephyrus G15 GA502DU | |
| CPU Multi 64Bit | |
| MSI GE75 9SG | |
| Genomsnitt Intel Core i7-9750H (11.3 - 14.1, n=10) | |
| Asus ROG Zephyrus G15 GA502DU | |
| Asus FX503VM-EH73 | |
| Cinebench R10 | |
| Rendering Multiple CPUs 32Bit | |
| Eurocom Nightsky RX15 | |
| Schenker XMG Ultra 15 Turing | |
| MSI GE75 9SG | |
| Genomsnitt Intel Core i7-9750H (28251 - 36304, n=13) | |
| Schenker Key 16 | |
| Lenovo Legion Y540-17IRH | |
| Asus FX503VM-EH73 | |
| Asus ROG Zephyrus G15 GA502DU | |
| Rendering Single 32Bit | |
| Eurocom Nightsky RX15 | |
| Schenker XMG Ultra 15 Turing | |
| MSI GE75 9SG | |
| Genomsnitt Intel Core i7-9750H (6659 - 7214, n=13) | |
| Schenker Key 16 | |
| Lenovo Legion Y540-17IRH | |
| Asus FX503VM-EH73 | |
| Asus ROG Zephyrus G15 GA502DU | |
| wPrime 2.10 - 1024m | |
| MSI GF63 8RC-040XPL | |
| Asus FX503VM-EH73 | |
| Asus ROG Zephyrus G15 GA502DU | |
| Genomsnitt Intel Core i7-9750H (n=1) | |
| MSI GE75 9SG | |
| Eurocom Nightsky RX15 | |
* ... mindre är bättre
| PCMark 8 Home Score Accelerated v2 | 4074 poäng | |
| PCMark 8 Work Score Accelerated v2 | 5480 poäng | |
| PCMark 10 Score | 5301 poäng | |
Hjälp | ||
| Razer Blade 15 GTX 1660 Ti Samsung SSD PM981 MZVLB256HAHQ | Razer Blade 15 RTX 2080 Max-Q Samsung SSD PM981 MZVLB512HAJQ | Alienware m15 R2 P87F 2x Toshiba XG6 KXG60ZNV512G (RAID 0) | Dell XPS 15 7590 9980HK GTX 1650 Toshiba XG6 KXG60ZNV1T02 | Gigabyte Aero 15 Classic-XA Intel SSD 760p SSDPEKKW512G8 | MSI GS65 Stealth Thin 8RE-051US Samsung SSD PM981 MZVLB256HAHQ | |
|---|---|---|---|---|---|---|
| AS SSD | 23% | 13% | 29% | 6% | -17% | |
| Seq Read (MB/s) | 1829 | 1832 0% | 1925 5% | 1723 -6% | 2517 38% | 1612 -12% |
| Seq Write (MB/s) | 1315 | 1864 42% | 2371 80% | 1386 5% | 924 -30% | 1475 12% |
| 4K Read (MB/s) | 51.3 | 52.1 2% | 37.2 -27% | 43.25 -16% | 59.1 15% | 43.09 -16% |
| 4K Write (MB/s) | 106 | 108.3 2% | 108.9 3% | 98.3 -7% | 126.5 19% | 83.8 -21% |
| 4K-64 Read (MB/s) | 917 | 1159 26% | 1177 28% | 1078 18% | 876 -4% | 611 -33% |
| 4K-64 Write (MB/s) | 1212 | 1807 49% | 1135 -6% | 1456 20% | 922 -24% | 570 -53% |
| Access Time Read * (ms) | 0.063 | 0.05 21% | 0.065 -3% | 0.05 21% | 0.042 33% | 0.071 -13% |
| Access Time Write * (ms) | 0.104 | 0.034 67% | 0.108 -4% | 0.039 62% | 0.065 37% | 0.045 57% |
| Score Read (Points) | 1152 | 1394 21% | 1407 22% | 1294 12% | 1186 3% | 815 -29% |
| Score Write (Points) | 1450 | 2102 45% | 1481 2% | 1693 17% | 1141 -21% | 802 -45% |
| Score Total (Points) | 3177 | 4221 33% | 3633 14% | 3638 15% | 2870 -10% | 2039 -36% |
| Copy ISO MB/s (MB/s) | 1539 | 2083 35% | 2073 35% | 3182 107% | 2086 36% | |
| Copy Program MB/s (MB/s) | 513 | 496.5 -3% | 576 12% | 984 92% | 454.2 -11% | |
| Copy Game MB/s (MB/s) | 1150 | 977 -15% | 1426 24% | 1824 59% | 1141 -1% |
* ... mindre är bättre

| 3DMark 11 | |
| 1280x720 Performance GPU | |
| Razer Blade 15 RTX 2080 Max-Q | |
| MSI RTX 2060 Gaming Z 6G | |
| Razer Blade Pro 2017 | |
| Razer Blade 15 RTX 2070 Max-Q | |
| Zotac GeForce GTX 1660 Ti 6 GB | |
| Asus Strix Hero III G731GV | |
| Genomsnitt NVIDIA GeForce GTX 1660 Ti Mobile (18610 - 22670, n=24) | |
| Razer Blade 15 GTX 1660 Ti | |
| MSI P65 8RF-451 - Creator | |
| MSI GF75 Thin 9SC | |
| Asus TUF FX705GE-EW096T | |
| 1280x720 Performance Combined | |
| Zotac GeForce GTX 1660 Ti 6 GB | |
| MSI RTX 2060 Gaming Z 6G | |
| Razer Blade 15 RTX 2080 Max-Q | |
| Asus Strix Hero III G731GV | |
| Genomsnitt NVIDIA GeForce GTX 1660 Ti Mobile (9500 - 13311, n=23) | |
| MSI GF75 Thin 9SC | |
| Razer Blade 15 GTX 1660 Ti | |
| Razer Blade 15 RTX 2070 Max-Q | |
| Razer Blade Pro 2017 | |
| MSI P65 8RF-451 - Creator | |
| Asus TUF FX705GE-EW096T | |
| 3DMark 11 Performance | 16594 poäng | |
| 3DMark Cloud Gate Standard Score | 31563 poäng | |
| 3DMark Fire Strike Score | 12926 poäng | |
| 3DMark Time Spy Score | 5406 poäng | |
Hjälp | ||
| Shadow of the Tomb Raider - 1920x1080 Highest Preset AA:T | |
| Schenker XMG Ultra 17 Coffee Lake Refresh | |
| Alienware m15 R2 P87F | |
| HP Omen X 2S 15-dg0075cl | |
| Zotac GeForce GTX 1660 Ti 6 GB | |
| Asus G752VS | |
| Asus Strix Hero III G731GV | |
| Genomsnitt NVIDIA GeForce GTX 1660 Ti Mobile (62 - 73, n=8) | |
| Razer Blade 15 GTX 1660 Ti | |
| Asus TUF FX705GM | |
| Dell XPS 15 7590 9980HK GTX 1650 | |
| Asus TUF FX705GE-EW096T | |
| HP Envy 13-ah0003ng | |
| The Witcher 3 - 1920x1080 Ultra Graphics & Postprocessing (HBAO+) | |
| Alienware m15 R2 P87F | |
| HP Omen X 2S 15-dg0075cl | |
| Zotac GeForce GTX 1660 Ti 6 GB | |
| Schenker XMG Ultra 17 Coffee Lake Refresh | |
| Genomsnitt NVIDIA GeForce GTX 1660 Ti Mobile (51.6 - 65.1, n=21) | |
| Asus Strix Hero III G731GV | |
| Razer Blade 15 GTX 1660 Ti | |
| Asus TUF FX705GM | |
| Dell XPS 15 7590 9980HK GTX 1650 | |
| Asus TUF FX705GE-EW096T | |
| HP Envy 13-ah0003ng | |
| låg | med. | hög | ultra | |
|---|---|---|---|---|
| BioShock Infinite (2013) | 291.2 | 259.6 | 241.3 | 132.5 |
| The Witcher 3 (2015) | 247.6 | 169.7 | 97.5 | 51.6 |
| Shadow of the Tomb Raider (2018) | 115 | 83 | 75 | 67 |
| Razer Blade 15 GTX 1660 Ti GeForce GTX 1660 Ti Mobile, i7-9750H, Samsung SSD PM981 MZVLB256HAHQ | Razer Blade 15 RTX 2080 Max-Q GeForce RTX 2080 Max-Q, i7-9750H, Samsung SSD PM981 MZVLB512HAJQ | Alienware m15 R2 P87F GeForce RTX 2080 Max-Q, i7-9750H, 2x Toshiba XG6 KXG60ZNV512G (RAID 0) | Dell XPS 15 7590 9980HK GTX 1650 GeForce GTX 1650 Mobile, i9-9980HK, Toshiba XG6 KXG60ZNV1T02 | Gigabyte Aero 15 Classic-XA GeForce RTX 2070 Max-Q, i7-9750H, Intel SSD 760p SSDPEKKW512G8 | MSI GS65 Stealth Thin 8RE-051US GeForce GTX 1060 Mobile, i7-8750H, Samsung SSD PM981 MZVLB256HAHQ | |
|---|---|---|---|---|---|---|
| Noise | 8% | -11% | 3% | -11% | 4% | |
| av / miljö * (dB) | 28.5 | 28.3 1% | 28.3 1% | 28.2 1% | 30 -5% | 28.4 -0% |
| Idle Minimum * (dB) | 30.3 | 28.8 5% | 28.5 6% | 28.2 7% | 31 -2% | 28.4 6% |
| Idle Average * (dB) | 30.5 | 28.8 6% | 28.5 7% | 28.2 8% | 34 -11% | 28.4 7% |
| Idle Maximum * (dB) | 30.5 | 29 5% | 49 -61% | 30.4 -0% | 39 -28% | 29.6 3% |
| Load Average * (dB) | 41 | 33.5 18% | 49 -20% | 43.8 -7% | 46 -12% | 43.5 -6% |
| Witcher 3 ultra * (dB) | 48 | 45 6% | 49 -2% | 47.2 2% | 53 -10% | 45.7 5% |
| Load Maximum * (dB) | 51.9 | 45.2 13% | 55 -6% | 47.2 9% | 55 -6% | 45.7 12% |
* ... mindre är bättre
Ljudnivå
| Låg belastning |
| 30.3 / 30.5 / 30.5 dB(A) |
| Hög belastning |
| 41 / 51.9 dB(A) |
 | ||
30 dB tyst 40 dB(A) hörbar 50 dB(A) högt ljud |
||
min: | ||
(-) Den maximala temperaturen på ovansidan är 52 °C / 126 F, jämfört med genomsnittet av 40.4 °C / 105 F , allt från 21.2 till 68.8 °C för klassen Gaming.
(-) Botten värms upp till maximalt 52.2 °C / 126 F, jämfört med genomsnittet av 43.2 °C / 110 F
(±) Vid tomgångsbruk är medeltemperaturen för ovansidan 34.3 °C / 94 F, jämfört med enhetsgenomsnittet på 33.9 °C / ### class_avg_f### F.
(-) När du spelar The Witcher 3 är medeltemperaturen för ovansidan 39.2 °C / 103 F, jämfört med enhetsgenomsnittet på 33.9 °C / ## #class_avg_f### F.
(±) Handledsstöden och pekplattan kan bli väldigt varma vid beröring med maximalt 39.6 °C / 103.3 F.
(-) Medeltemperaturen för handledsstödsområdet på liknande enheter var 28.8 °C / 83.8 F (-10.8 °C / -19.5 F).
Razer Blade 15 GTX 1660 Ti ljudanalys
(±) | högtalarljudstyrkan är genomsnittlig men bra (80.1 dB)
Bas 100 - 315 Hz
(±) | reducerad bas - i genomsnitt 13.5% lägre än medianen
(±) | linjäriteten för basen är genomsnittlig (13.2% delta till föregående frekvens)
Mellan 400 - 2000 Hz
(±) | högre mellan - i genomsnitt 5.3% högre än median
(+) | mids är linjära (4.7% delta till föregående frekvens)
Högsta 2 - 16 kHz
(±) | reducerade toppar - i genomsnitt 5.1% lägre än medianen
(±) | linjäriteten för toppar är genomsnittlig (7.2% delta till föregående frekvens)
Totalt 100 - 16 000 Hz
(±) | linjäriteten för det totala ljudet är genomsnittlig (25.2% skillnad mot median)
Jämfört med samma klass
» 90% av alla testade enheter i den här klassen var bättre, 3% liknande, 7% sämre
» Den bästa hade ett delta på 6%, genomsnittet var 18%, sämst var 132%
Jämfört med alla testade enheter
» 77% av alla testade enheter var bättre, 5% liknande, 18% sämre
» Den bästa hade ett delta på 4%, genomsnittet var 24%, sämst var 134%
Apple MacBook 12 (Early 2016) 1.1 GHz ljudanalys
(+) | högtalare kan spela relativt högt (83.6 dB)
Bas 100 - 315 Hz
(±) | reducerad bas - i genomsnitt 11.3% lägre än medianen
(±) | linjäriteten för basen är genomsnittlig (14.2% delta till föregående frekvens)
Mellan 400 - 2000 Hz
(+) | balanserad mellan - endast 2.4% från medianen
(+) | mids är linjära (5.5% delta till föregående frekvens)
Högsta 2 - 16 kHz
(+) | balanserade toppar - endast 2% från medianen
(+) | toppar är linjära (4.5% delta till föregående frekvens)
Totalt 100 - 16 000 Hz
(+) | det totala ljudet är linjärt (10.2% skillnad mot median)
Jämfört med samma klass
» 7% av alla testade enheter i den här klassen var bättre, 2% liknande, 91% sämre
» Den bästa hade ett delta på 5%, genomsnittet var 18%, sämst var 53%
Jämfört med alla testade enheter
» 5% av alla testade enheter var bättre, 1% liknande, 94% sämre
» Den bästa hade ett delta på 4%, genomsnittet var 24%, sämst var 134%
| Av/Standby | |
| Låg belastning | |
| Hög belastning |
|
Förklaring:
min: | |
| Razer Blade 15 GTX 1660 Ti i7-9750H, GeForce GTX 1660 Ti Mobile, Samsung SSD PM981 MZVLB256HAHQ, IPS, 1920x1080, 15.6" | Razer Blade 15 RTX 2080 Max-Q i7-9750H, GeForce RTX 2080 Max-Q, Samsung SSD PM981 MZVLB512HAJQ, IPS, 1920x1080, 15.6" | Dell XPS 15 7590 9980HK GTX 1650 i9-9980HK, GeForce GTX 1650 Mobile, Toshiba XG6 KXG60ZNV1T02, OLED, 3840x2160, 15.6" | Gigabyte Aero 15 Classic-XA i7-9750H, GeForce RTX 2070 Max-Q, Intel SSD 760p SSDPEKKW512G8, IGZO, 1920x1080, 15.6" | MSI GS65 Stealth Thin 8RE-051US i7-8750H, GeForce GTX 1060 Mobile, Samsung SSD PM981 MZVLB256HAHQ, IPS, 1920x1080, 15.6" | MSI GP65 Leopard 9SE-225US i7-9750H, GeForce RTX 2060 Mobile, Toshiba KBG30ZMT512G, IPS, 1920x1080, 15.6" | |
|---|---|---|---|---|---|---|
| Power Consumption | 19% | 39% | 2% | 33% | 16% | |
| Idle Minimum * (Watt) | 18.7 | 12.5 33% | 6.2 67% | 21 -12% | 8.7 53% | 13.6 27% |
| Idle Average * (Watt) | 30.7 | 15.3 50% | 9.6 69% | 23 25% | 13 58% | 17.9 42% |
| Idle Maximum * (Watt) | 33.9 | 20.7 39% | 21.2 37% | 32 6% | 14.3 58% | 20.6 39% |
| Load Average * (Watt) | 93.4 | 90.2 3% | 104.3 -12% | 97 -4% | 107.4 -15% | 96 -3% |
| Witcher 3 ultra * (Watt) | 158.9 | 162 -2% | 91.7 42% | 148 7% | 129 19% | 154.6 3% |
| Load Maximum * (Watt) | 195.3 | 209.3 -7% | 135.3 31% | 213 -9% | 151.5 22% | 218.6 -12% |
* ... mindre är bättre
| Razer Blade 15 GTX 1660 Ti i7-9750H, GeForce GTX 1660 Ti Mobile, 65 Wh | Razer Blade 15 RTX 2080 Max-Q i7-9750H, GeForce RTX 2080 Max-Q, 80 Wh | MSI GP65 Leopard 9SE-225US i7-9750H, GeForce RTX 2060 Mobile, 51 Wh | Alienware m15 R2 P87F i7-9750H, GeForce RTX 2080 Max-Q, 76 Wh | Dell XPS 15 7590 9980HK GTX 1650 i9-9980HK, GeForce GTX 1650 Mobile, 97 Wh | Gigabyte Aero 15 Classic-XA i7-9750H, GeForce RTX 2070 Max-Q, 94.24 Wh | |
|---|---|---|---|---|---|---|
| Batteridrifttid | 20% | -29% | 0% | 42% | 27% | |
| WiFi v1.3 (h) | 5.5 | 6.6 20% | 3.9 -29% | 5.5 0% | 7.8 42% | 7 27% |
| Reader / Idle (h) | 15.9 | 6 | 9.2 | 15.2 | 9.1 | |
| Load (h) | 1.7 | 1.1 | 0.7 | 3.3 | 3 |
För
Emot
Läs den fullständiga versionen av den här recensionen på engelska här.
I laptopvärlden är GeForce RTX 2060 bara runt 5 till 10 procent snabbare än GTX 1660 Ti när RTX-specifika funktioner som RT och DLSS är avstängda. Om du inte är intresserad av sådana alternativ kan du spara 4.000 kronor på en Blade 15 GTX 1660 Ti utan att det påverkar din spelupplevelse särskilt mycket.
Även om Blade 15 GTX 1660 Ti är den billigaste Blade 15-varianten med Turing är den faktiskt 10 till 15 procent snabbare när man spelar än den snabbaste varianten från förra generationen, Blade 15 GTX 1070 Max-Q. Man får på så sätt en överlägsen spelupplevelse jämfört med vad det bästa som Pascal-varianterna av Blade 15 hade att erbjuda.
Utöver det vi tog upp i höljessektionen ovan har Blade 15 GTX 1660 Ti ytterligare några dolda brister. För det första förekommer PWN på nästan alla ljusstyrkenivåer och det på en tillräckligt låg frekvens för att kunna påverka användare som är känsliga för skärmflimmer. För det andra är skärmen inte lika bra kalibrerad som på Blade 15 RTX-serien. Som exempel är färgtemperaturen vid leverans en aning svalare än vad den borde vara. För det tredje är kärntemperaturen och fläktljudet aningen varmare respektive högre eftersom Blade 15 GTX 1660 Ti inte kommer med avancerad ångkammarkylning. För det fjärde verkar spel köras lite snabbare i Creator-läget jämfört med Spel-läget då CPU-prestandan är högre i Creator-läget. Du kan lika gärna skippa Spelläget helt och hållet och helt enkelt hålla dig till Creatorläget för att få ut maximal prestanda.
Den största bristen är att den har lägre CPU-prestanda än Blade 15 RTX 2070 Max-Q eller 2080 Max-Q trots att de har samma Core i7-9750H processor. Skillnaden på runt 15 procent bör inte påverka spelprestandan särskilt mycket, särskilt inte om du siktar på 60 FPS. Men det är ändå tråkigt för entusiaster eller kreatörer som vill få ut mesta möjliga hur sin Core i7-9750H.
Bortsett från sakerna vi listat ovan gäller våra existerande kommentarer för Blade 15 även konfigurationen med GTX 1660 Ti. Yttemperaturerna, ljusstyrkan, färgerna och till och med energiförbrukningen ligger alla väldigt nära varandra på de olika Turing-varianterna av Blade 15 trots skillnaderna i prestanda.
Razer Blade 15 GTX 1660 Ti
- 09/19/2019 v7 (old)
Allen Ngo
Price comparison
