Test: MSI P65 Creator 9SF (i9-9880H, RTX2070 Max-Q) Laptop (Sammanfattning)
| |||||||||||||||||||||||||
Distribution av ljusstyrkan: 83 %
Mitt på batteriet: 476 cd/m²
Kontrast: 890:1 (Svärta: 0.5 cd/m²)
ΔE ColorChecker Calman: 4.75 | ∀{0.5-29.43 Ø4.73}
ΔE Greyscale Calman: 4.49 | ∀{0.09-98 Ø4.97}
100% sRGB (Argyll 1.6.3 3D)
87% AdobeRGB 1998 (Argyll 1.6.3 3D)
98.5% AdobeRGB 1998 (Argyll 3D)
100% sRGB (Argyll 3D)
84.4% Display P3 (Argyll 3D)
Gamma: 2.49
CCT: 7374 K
| MSI P65 Creator 9SF-657 AU Optronics AUO41EB, , 3840x2160, 15.6" | Razer Blade 15 RTX 2070 Max-Q LG Philips LGD05C0, , 1920x1080, 15.6" | Asus Zephyrus S GX502GW AU Optronics B156HAN08.2 (AUO82ED), , 1920x1080, 15.6" | Schenker XMG Ultra 15 Turing AU Optronics B156HAN07.0 (AUO70ED), , 1920x1080, 15.6" | Gigabyte Aero 15-X9 LGD05C0, , 1920x1080, 15.6" | |
|---|---|---|---|---|---|
| Display | -20% | -22% | -20% | -22% | |
| Display P3 Coverage (%) | 84.4 | 65.3 -23% | 64.9 -23% | 66.1 -22% | 63.5 -25% |
| sRGB Coverage (%) | 100 | 94.9 -5% | 91 -9% | 92.6 -7% | 93.1 -7% |
| AdobeRGB 1998 Coverage (%) | 98.5 | 66.3 -33% | 65.9 -33% | 67.1 -32% | 64.5 -35% |
| Response Times | 65% | 79% | 62% | 62% | |
| Response Time Grey 50% / Grey 80% * (ms) | 51 ? | 16.8 ? 67% | 7.2 ? 86% | 17.6 ? 65% | 16.4 ? 68% |
| Response Time Black / White * (ms) | 31 ? | 11.6 ? 63% | 8.8 ? 72% | 12.8 ? 59% | 13.6 ? 56% |
| PWM Frequency (Hz) | |||||
| Screen | 4% | 5% | 2% | 12% | |
| Brightness middle (cd/m²) | 445 | 314.7 -29% | 286 -36% | 263 -41% | 250 -44% |
| Brightness (cd/m²) | 462 | 312 -32% | 275 -40% | 264 -43% | 235 -49% |
| Brightness Distribution (%) | 83 | 90 8% | 90 8% | 89 7% | 85 2% |
| Black Level * (cd/m²) | 0.5 | 0.38 24% | 0.37 26% | 0.17 66% | 0.29 42% |
| Contrast (:1) | 890 | 828 -7% | 773 -13% | 1547 74% | 862 -3% |
| Colorchecker dE 2000 * | 4.75 | 2.56 46% | 2.19 54% | 4.45 6% | 1.46 69% |
| Colorchecker dE 2000 max. * | 7.79 | 4.89 37% | 4.4 44% | 8.33 -7% | 2.47 68% |
| Greyscale dE 2000 * | 4.49 | 3.4 24% | 2.2 51% | 4.77 -6% | 1.27 72% |
| Gamma | 2.49 88% | 2.3 96% | 2.41 91% | 2.52 87% | 2.4 92% |
| CCT | 7374 88% | 6435 101% | 6405 101% | 7767 84% | 6749 96% |
| Color Space (Percent of AdobeRGB 1998) (%) | 87 | 60.7 -30% | 59 -32% | 60 -31% | 60 -31% |
| Color Space (Percent of sRGB) (%) | 100 | 94.6 -5% | 91 -9% | 93 -7% | 93 -7% |
| Colorchecker dE 2000 calibrated * | 1.71 | 2.27 | 1.93 | ||
| Totalt genomsnitt (program/inställningar) | 16% /
7% | 21% /
10% | 15% /
5% | 17% /
12% |
* ... mindre är bättre
Visa svarstider
| ↔ Svarstid svart till vitt | ||
|---|---|---|
| 31 ms ... stiga ↗ och falla ↘ kombinerat | ↗ 18 ms stiga | 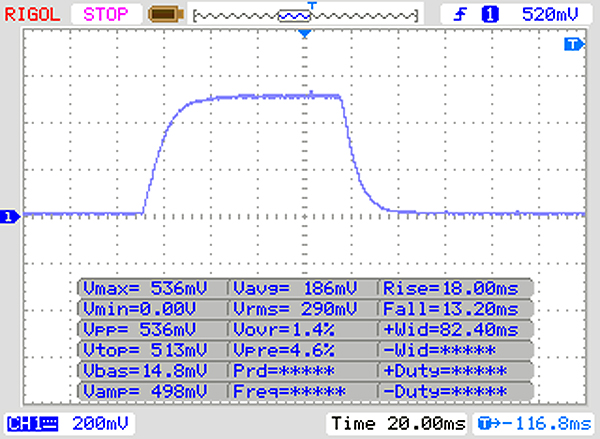 |
| ↘ 13 ms hösten | ||
| Skärmen visar långsamma svarsfrekvenser i våra tester och kommer att vara otillfredsställande för spelare. I jämförelse sträcker sig alla testade enheter från 0.1 (minst) till 240 (maximalt) ms. » 84 % av alla enheter är bättre. Detta innebär att den uppmätta svarstiden är sämre än genomsnittet av alla testade enheter (19.9 ms). | ||
| ↔ Svarstid 50 % grått till 80 % grått | ||
| 51 ms ... stiga ↗ och falla ↘ kombinerat | ↗ 24 ms stiga | 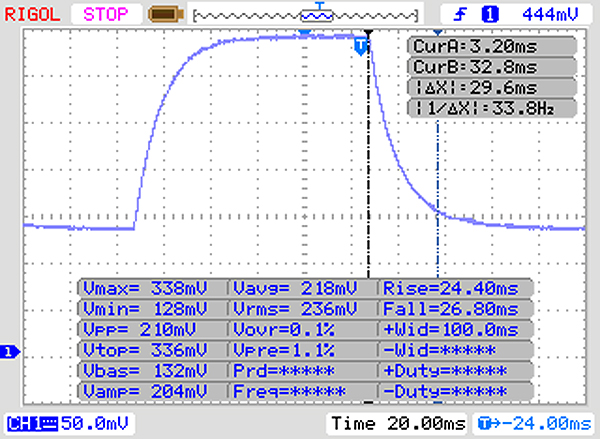 |
| ↘ 27 ms hösten | ||
| Skärmen visar långsamma svarsfrekvenser i våra tester och kommer att vara otillfredsställande för spelare. I jämförelse sträcker sig alla testade enheter från 0.165 (minst) till 636 (maximalt) ms. » 87 % av alla enheter är bättre. Detta innebär att den uppmätta svarstiden är sämre än genomsnittet av alla testade enheter (31.1 ms). | ||
Skärmflimmer / PWM (Puls-Width Modulation)
| Skärmflimmer / PWM upptäcktes inte | 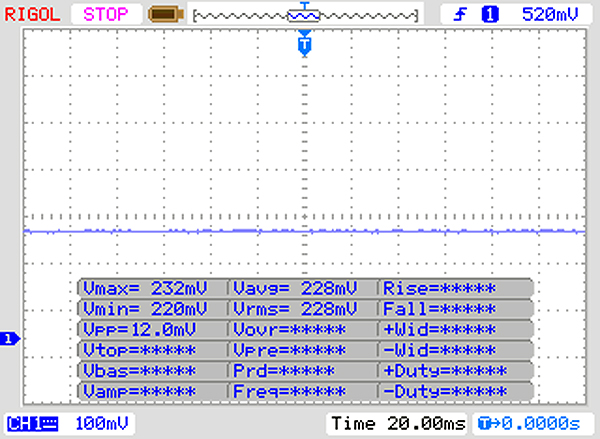 | ||
Som jämförelse: 52 % av alla testade enheter använder inte PWM för att dämpa skärmen. Om PWM upptäcktes mättes ett medelvärde av 7798 (minst: 5 - maximum: 343500) Hz. | |||
| PCMark 8 Home Score Accelerated v2 | 3505 poäng | |
| PCMark 8 Work Score Accelerated v2 | 4482 poäng | |
| PCMark 10 Score | 5211 poäng | |
Hjälp | ||
| MSI P65 Creator 9SF-657 2x Samsung SSD PM981 MZVLB512HAJQ (RAID 0) | Razer Blade 15 RTX 2070 Max-Q Samsung SSD PM981 MZVLB512HAJQ | Asus Zephyrus S GX502GW 2x Intel SSD 660p SSDPEKNW512G8 (RAID 0) | Schenker XMG Ultra 15 Turing Samsung SSD 970 EVO Plus 1TB | Gigabyte Aero 15-X9 Intel SSD 760p SSDPEKKW010T8 | Genomsnitt 2x Samsung SSD PM981 MZVLB512HAJQ (RAID 0) | |
|---|---|---|---|---|---|---|
| CrystalDiskMark 5.2 / 6 | -32% | -24% | -17% | -31% | -7% | |
| Write 4K (MB/s) | 105.6 | 93.9 -11% | 97 -8% | 129.9 23% | 97.1 -8% | 98.6 ? -7% |
| Read 4K (MB/s) | 46.32 | 40.56 -12% | 49.58 7% | 47.15 2% | 53.7 16% | 42.5 ? -8% |
| Write Seq (MB/s) | 2910 | 1468 -50% | 1838 -37% | 1840 -37% | 1526 -48% | 2804 ? -4% |
| Read Seq (MB/s) | 2820 | 1540 -45% | 2421 -14% | 1775 -37% | 2020 -28% | 2806 ? 0% |
| Write 4K Q32T1 (MB/s) | 545 | 293.5 -46% | 326.9 -40% | 294.5 -46% | 285.6 -48% | 446 ? -18% |
| Read 4K Q32T1 (MB/s) | 632 | 346 -45% | 372.9 -41% | 373.6 -41% | 321.8 -49% | 512 ? -19% |
| Write Seq Q32T1 (MB/s) | 3349 | 1941 -42% | 1894 -43% | 3295 -2% | 1533 -54% | 3252 ? -3% |
| Read Seq Q32T1 (MB/s) | 3333 | 3266 -2% | 2828 -15% | 3535 6% | 2351 -29% | 3324 ? 0% |
| AS SSD | -4% | -24% | 19% | -34% | -5% | |
| Seq Read (MB/s) | 2860 | 1840 -36% | 2506 -12% | 2739 -4% | 2113 -26% | 2811 ? -2% |
| Seq Write (MB/s) | 2604 | 1822 -30% | 1712 -34% | 2650 2% | 1471 -44% | 2627 ? 1% |
| 4K Read (MB/s) | 45.15 | 52.3 16% | 48.32 7% | 27.86 -38% | 55 22% | 42.4 ? -6% |
| 4K Write (MB/s) | 100.2 | 110.7 10% | 103.6 3% | 134.7 34% | 107.1 7% | 97.5 ? -3% |
| 4K-64 Read (MB/s) | 1428 | 1126 -21% | 624 -56% | 1651 16% | 914 -36% | 1382 ? -3% |
| 4K-64 Write (MB/s) | 1401 | 1717 23% | 1253 -11% | 2190 56% | 703 -50% | 1245 ? -11% |
| Access Time Read * (ms) | 0.049 | 0.047 4% | 0.08 -63% | 0.031 37% | 0.114 -133% | 0.05367 ? -10% |
| Access Time Write * (ms) | 0.037 | 0.033 11% | 0.04 -8% | 0.028 24% | 0.034 8% | 0.038 ? -3% |
| Score Read (Points) | 1759 | 1362 -23% | 923 -48% | 1953 11% | 1180 -33% | 1706 ? -3% |
| Score Write (Points) | 1762 | 2010 14% | 1528 -13% | 2590 47% | 957 -46% | 1605 ? -9% |
| Score Total (Points) | 4411 | 4079 -8% | 2896 -34% | 5529 25% | 2722 -38% | 4176 ? -5% |
| Copy ISO MB/s (MB/s) | 1975 | 2031 | 1864 | |||
| Copy Program MB/s (MB/s) | 526 | 452.1 | 362.6 | |||
| Copy Game MB/s (MB/s) | 1200 | 1043 | 936 | |||
| Totalt genomsnitt (program/inställningar) | -18% /
-15% | -24% /
-24% | 1% /
4% | -33% /
-32% | -6% /
-6% |
* ... mindre är bättre

| 3DMark 11 Performance | 19440 poäng | |
| 3DMark Cloud Gate Standard Score | 36379 poäng | |
| 3DMark Fire Strike Score | 14946 poäng | |
Hjälp | ||
| Thief | |
| 1920x1080 Very High Preset AA:FXAA & High SS AF:8x | |
| Genomsnitt NVIDIA GeForce RTX 2070 Max-Q (99 - 103, n=2) | |
| MSI P65 Creator 9SF-657 | |
| 1366x768 High Preset AA:FXAA & Low SS AF:4x | |
| MSI P65 Creator 9SF-657 | |
| Genomsnitt NVIDIA GeForce RTX 2070 Max-Q (n=1) | |
| 1366x768 Normal Preset AA:FX | |
| MSI P65 Creator 9SF-657 | |
| Genomsnitt NVIDIA GeForce RTX 2070 Max-Q (n=1) | |
| 1024x768 Very Low Preset | |
| MSI P65 Creator 9SF-657 | |
| Genomsnitt NVIDIA GeForce RTX 2070 Max-Q (n=1) | |
| låg | med. | hög | ultra | 4K | |
|---|---|---|---|---|---|
| BioShock Infinite (2013) | 369.7 | 291.8 | 277.2 | 148.8 | |
| Thief (2014) | 134.8 | 131.6 | 128.7 | 99 | |
| The Witcher 3 (2015) | 295.7 | 205.8 | 116.5 | 80.8 | 42.3 |
| Dota 2 Reborn (2015) | 142.2 | 131.4 | 122.9 | 117.4 |
Ljudnivå
| Låg belastning |
| 32.8 / 32.8 / 33.6 dB(A) |
| Hög belastning |
| 40.9 / 42.7 dB(A) |
 | ||
30 dB tyst 40 dB(A) hörbar 50 dB(A) högt ljud |
||
min: | ||
(-) Den maximala temperaturen på ovansidan är 49.7 °C / 121 F, jämfört med genomsnittet av 36.8 °C / 98 F , allt från 21 till 71 °C för klassen Multimedia.
(-) Botten värms upp till maximalt 60.4 °C / 141 F, jämfört med genomsnittet av 39.1 °C / 102 F
(+) Vid tomgångsbruk är medeltemperaturen för ovansidan 26.8 °C / 80 F, jämfört med enhetsgenomsnittet på 31.3 °C / ### class_avg_f### F.
(+) Handledsstöden och pekplattan når maximal hudtemperatur (34.9 °C / 94.8 F) och är därför inte varma.
(-) Medeltemperaturen för handledsstödsområdet på liknande enheter var 28.7 °C / 83.7 F (-6.2 °C / -11.1 F).
MSI P65 Creator 9SF-657 ljudanalys
(±) | högtalarljudstyrkan är genomsnittlig men bra (77.4 dB)
Bas 100 - 315 Hz
(-) | nästan ingen bas - i genomsnitt 23.6% lägre än medianen
(±) | linjäriteten för basen är genomsnittlig (9.9% delta till föregående frekvens)
Mellan 400 - 2000 Hz
(±) | högre mellan - i genomsnitt 8.4% högre än median
(±) | linjäriteten för mids är genomsnittlig (7.8% delta till föregående frekvens)
Högsta 2 - 16 kHz
(±) | högre toppar - i genomsnitt 6% högre än medianen
(±) | linjäriteten för toppar är genomsnittlig (9.3% delta till föregående frekvens)
Totalt 100 - 16 000 Hz
(±) | linjäriteten för det totala ljudet är genomsnittlig (28.3% skillnad mot median)
Jämfört med samma klass
» 94% av alla testade enheter i den här klassen var bättre, 2% liknande, 5% sämre
» Den bästa hade ett delta på 5%, genomsnittet var 17%, sämst var 45%
Jämfört med alla testade enheter
» 85% av alla testade enheter var bättre, 3% liknande, 12% sämre
» Den bästa hade ett delta på 4%, genomsnittet var 24%, sämst var 134%
Apple MacBook 12 (Early 2016) 1.1 GHz ljudanalys
(+) | högtalare kan spela relativt högt (83.6 dB)
Bas 100 - 315 Hz
(±) | reducerad bas - i genomsnitt 11.3% lägre än medianen
(±) | linjäriteten för basen är genomsnittlig (14.2% delta till föregående frekvens)
Mellan 400 - 2000 Hz
(+) | balanserad mellan - endast 2.4% från medianen
(+) | mids är linjära (5.5% delta till föregående frekvens)
Högsta 2 - 16 kHz
(+) | balanserade toppar - endast 2% från medianen
(+) | toppar är linjära (4.5% delta till föregående frekvens)
Totalt 100 - 16 000 Hz
(+) | det totala ljudet är linjärt (10.2% skillnad mot median)
Jämfört med samma klass
» 7% av alla testade enheter i den här klassen var bättre, 2% liknande, 91% sämre
» Den bästa hade ett delta på 5%, genomsnittet var 18%, sämst var 53%
Jämfört med alla testade enheter
» 5% av alla testade enheter var bättre, 1% liknande, 94% sämre
» Den bästa hade ett delta på 4%, genomsnittet var 24%, sämst var 134%
| Av/Standby | |
| Låg belastning | |
| Hög belastning |
|
Förklaring:
min: | |
| MSI P65 Creator 9SF-657 i9-9880H, GeForce RTX 2070 Max-Q, 2x Samsung SSD PM981 MZVLB512HAJQ (RAID 0), IPS, 3840x2160, 15.6" | Razer Blade 15 RTX 2070 Max-Q i7-8750H, GeForce RTX 2070 Max-Q, Samsung SSD PM981 MZVLB512HAJQ, IPS, 1920x1080, 15.6" | Asus Zephyrus S GX502GW i7-9750H, GeForce RTX 2070 Mobile, 2x Intel SSD 660p SSDPEKNW512G8 (RAID 0), IPS, 1920x1080, 15.6" | Schenker XMG Ultra 15 Turing i7-9700K, GeForce RTX 2070 Mobile, Samsung SSD 970 EVO Plus 1TB, IPS, 1920x1080, 15.6" | Gigabyte Aero 15-X9 i7-8750H, GeForce RTX 2070 Max-Q, Intel SSD 760p SSDPEKKW010T8, IPS, 1920x1080, 15.6" | Genomsnitt NVIDIA GeForce RTX 2070 Max-Q | Genomsnitt av klass Multimedia | |
|---|---|---|---|---|---|---|---|
| Power Consumption | 10% | -61% | -118% | -10% | -22% | 41% | |
| Idle Minimum * (Watt) | 9.4 | 10.4 -11% | 24 -155% | 35 -272% | 16 -70% | 15.4 ? -64% | 5.71 ? 39% |
| Idle Average * (Watt) | 17.4 | 14.6 16% | 27 -55% | 39 -124% | 18 -3% | 20 ? -15% | 10.1 ? 42% |
| Idle Maximum * (Watt) | 19.6 | 16.3 17% | 33 -68% | 47 -140% | 23 -17% | 26.7 ? -36% | 12.4 ? 37% |
| Load Average * (Watt) | 103 | 88.5 14% | 129 -25% | 117 -14% | 88 15% | 105.2 ? -2% | 65 ? 37% |
| Load Maximum * (Watt) | 216 | 182.4 16% | 216 -0% | 299 -38% | 167 23% | 201 ? 7% | 112.2 ? 48% |
| Witcher 3 ultra * (Watt) | 155.4 | 176 | 196 | 120 |
* ... mindre är bättre
| MSI P65 Creator 9SF-657 i9-9880H, GeForce RTX 2070 Max-Q, 82 Wh | Razer Blade 15 RTX 2070 Max-Q i7-8750H, GeForce RTX 2070 Max-Q, 80 Wh | Asus Zephyrus S GX502GW i7-9750H, GeForce RTX 2070 Mobile, 76 Wh | Schenker XMG Ultra 15 Turing i7-9700K, GeForce RTX 2070 Mobile, 82 Wh | Gigabyte Aero 15-X9 i7-8750H, GeForce RTX 2070 Max-Q, 94.24 Wh | Genomsnitt av klass Multimedia | |
|---|---|---|---|---|---|---|
| Batteridrifttid | 21% | -29% | -32% | 56% | 105% | |
| Reader / Idle (h) | 9.6 | 11.4 19% | 5.9 -39% | 3.2 -67% | 9.2 -4% | 25.2 ? 163% |
| WiFi v1.3 (h) | 6 | 6.5 8% | 3.7 -38% | 2.6 -57% | 6.4 7% | 12 ? 100% |
| Load (h) | 1.1 | 1.5 36% | 1 -9% | 1.4 27% | 2.9 164% | 1.675 ? 52% |
| H.264 (h) | 2.6 | 6.1 | 16.4 ? |
För
Emot
Omdöme - Kompakt multimedialaptop med mycket kraft
Läs den fullständiga versionen av den här recensionen på engelska här.
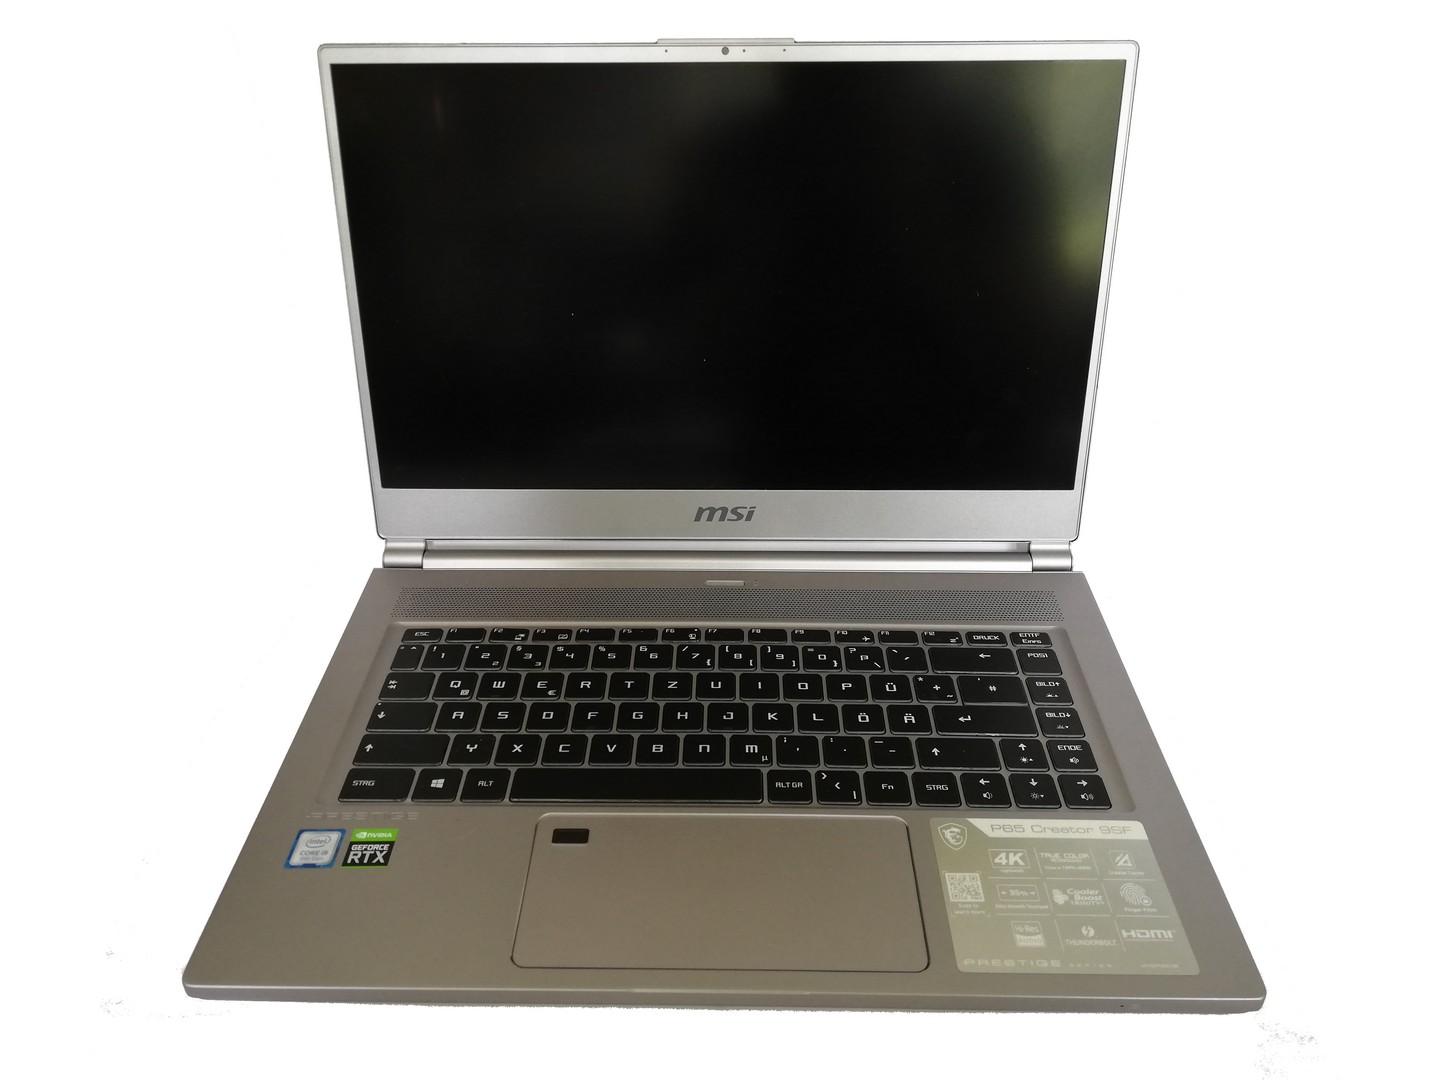
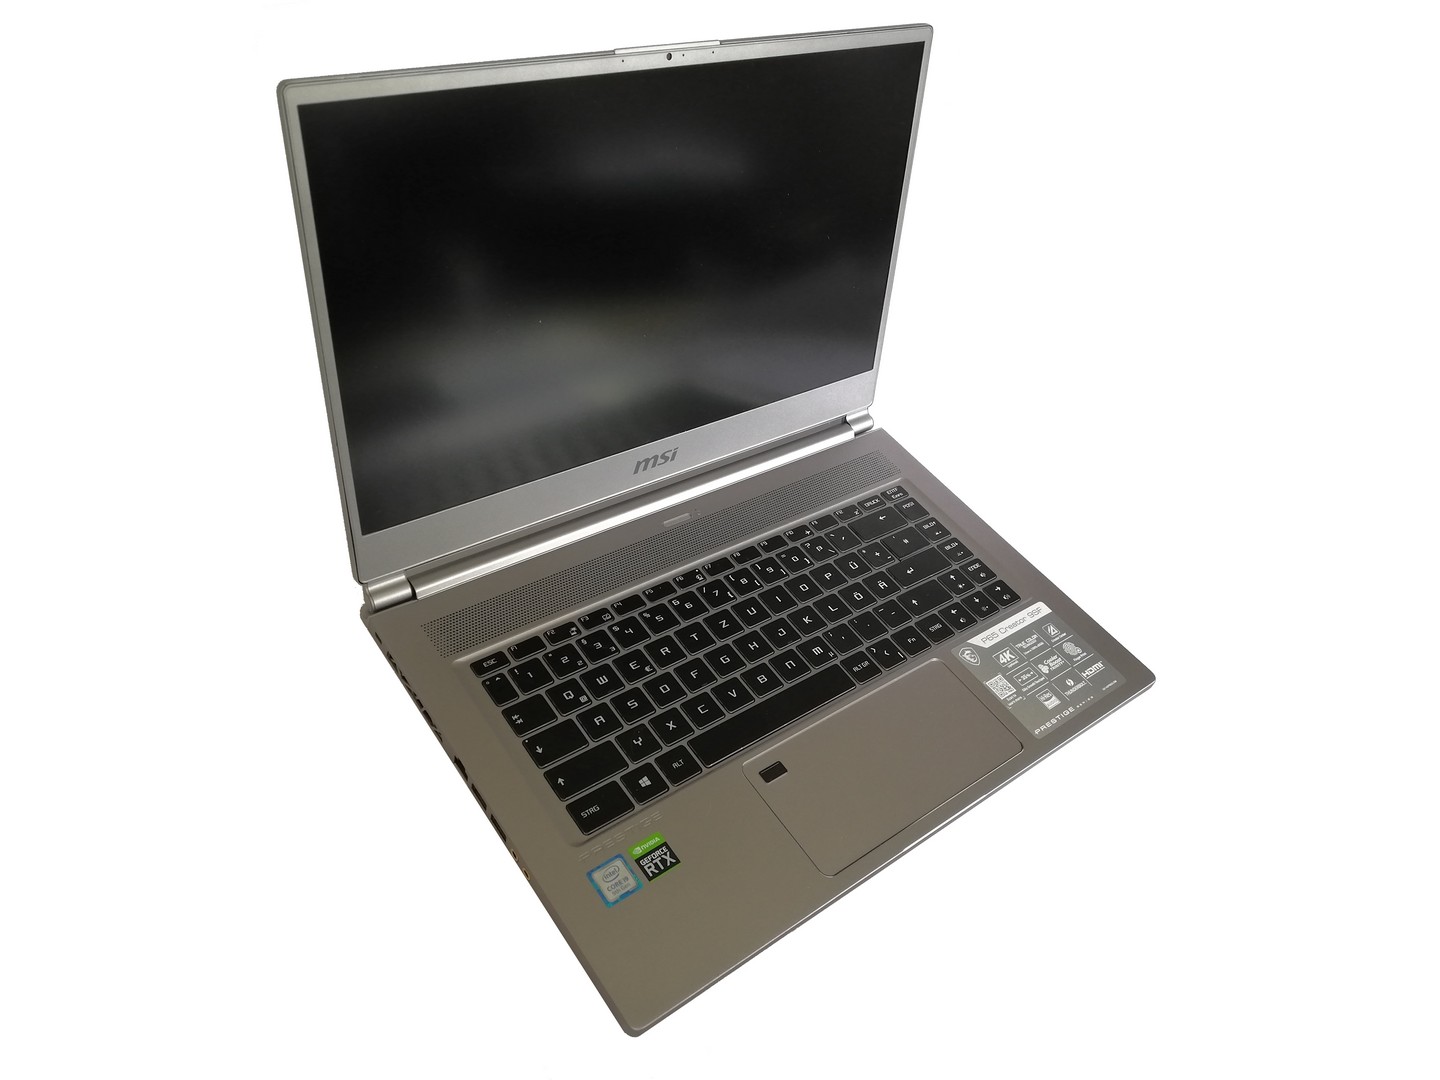
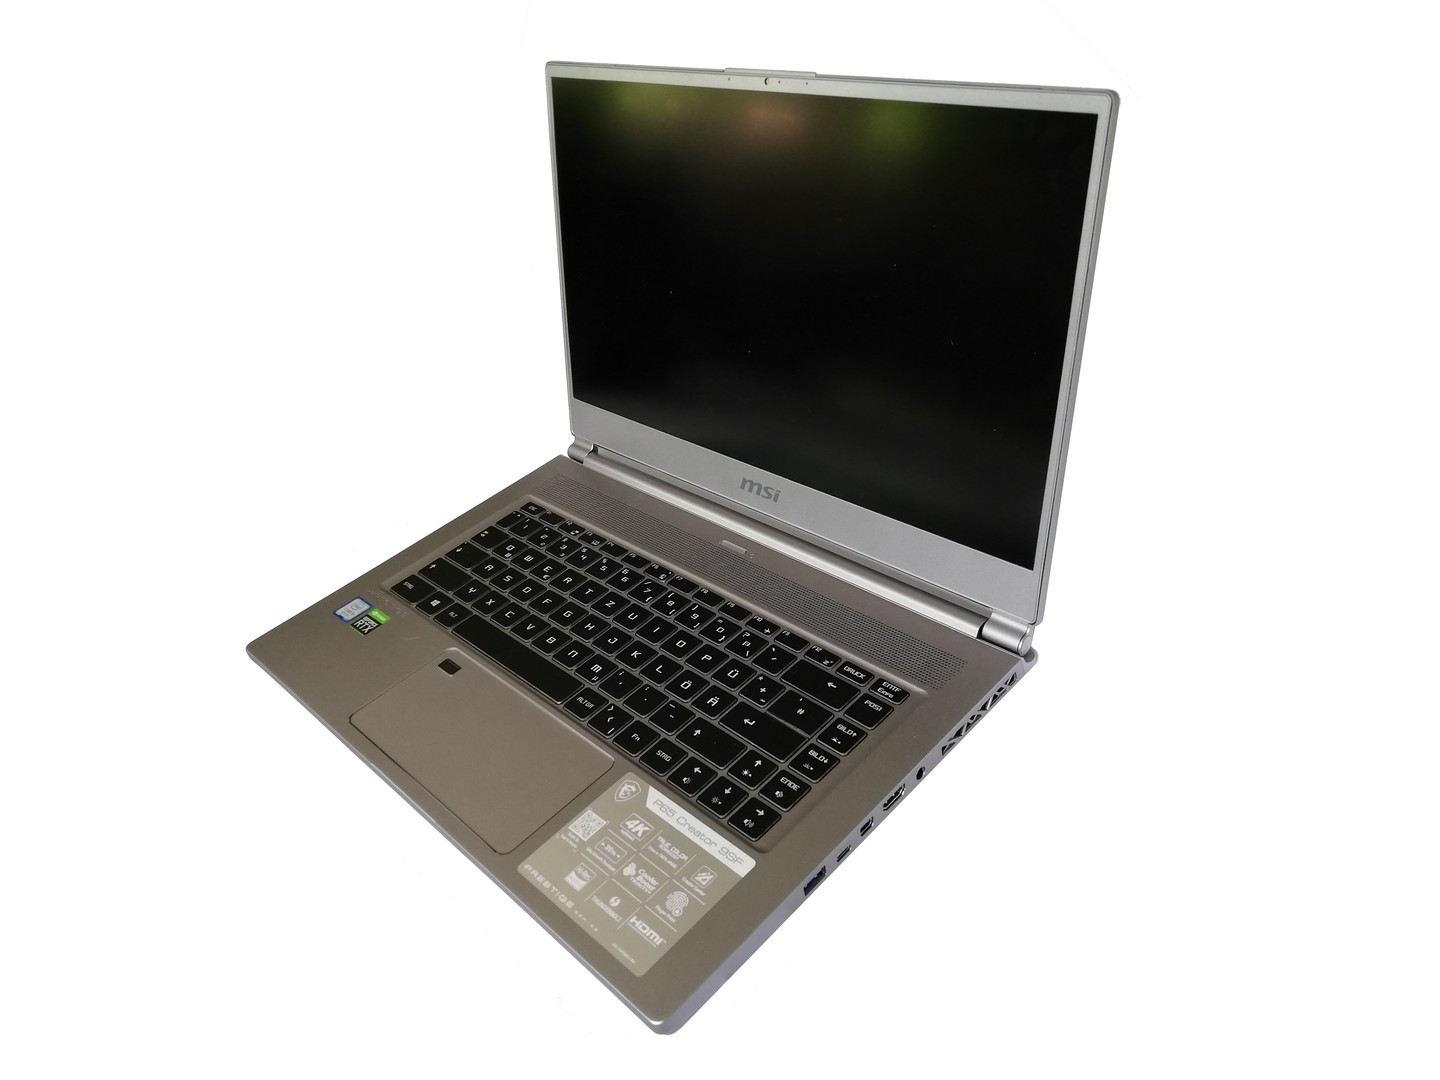
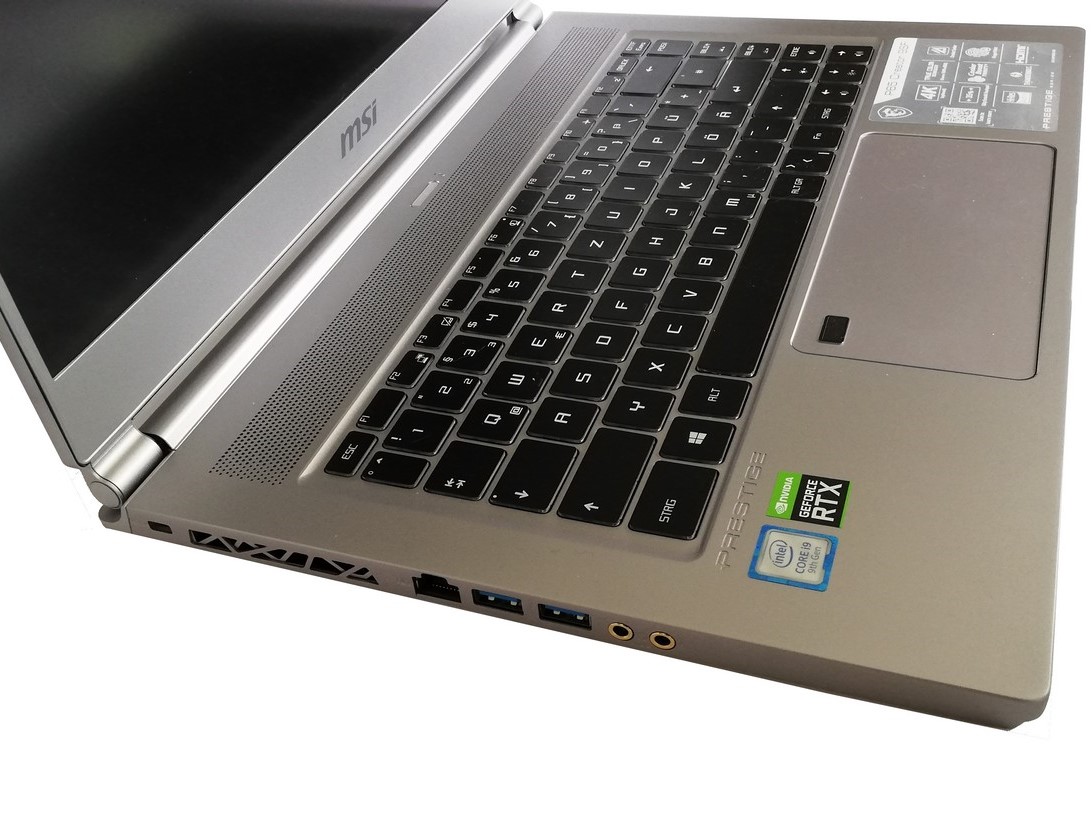
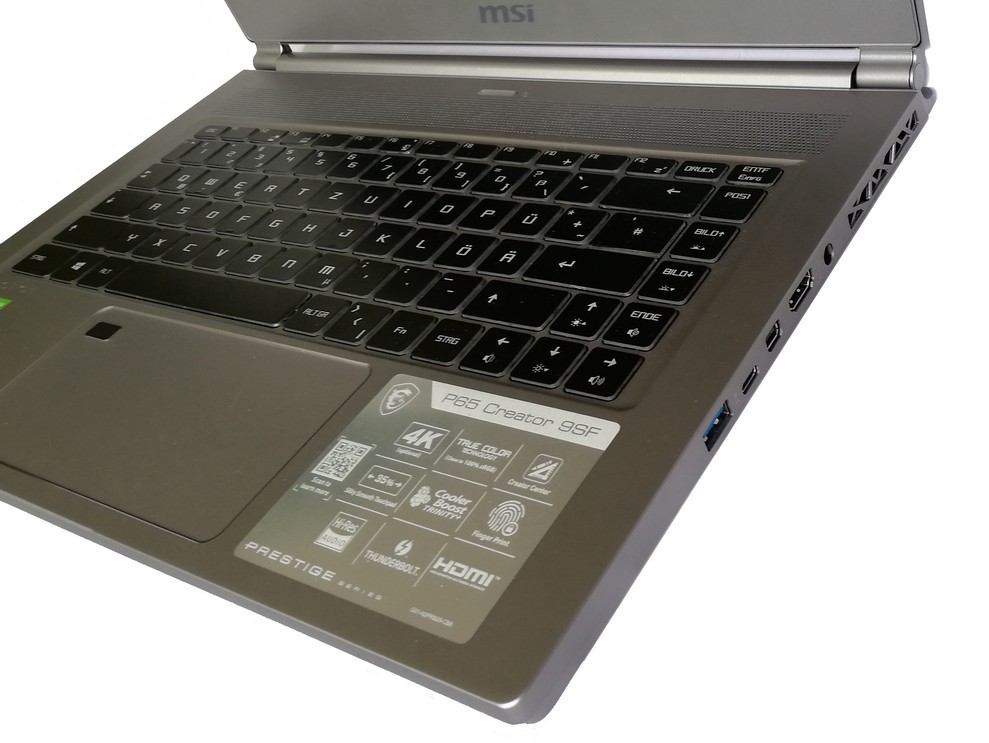
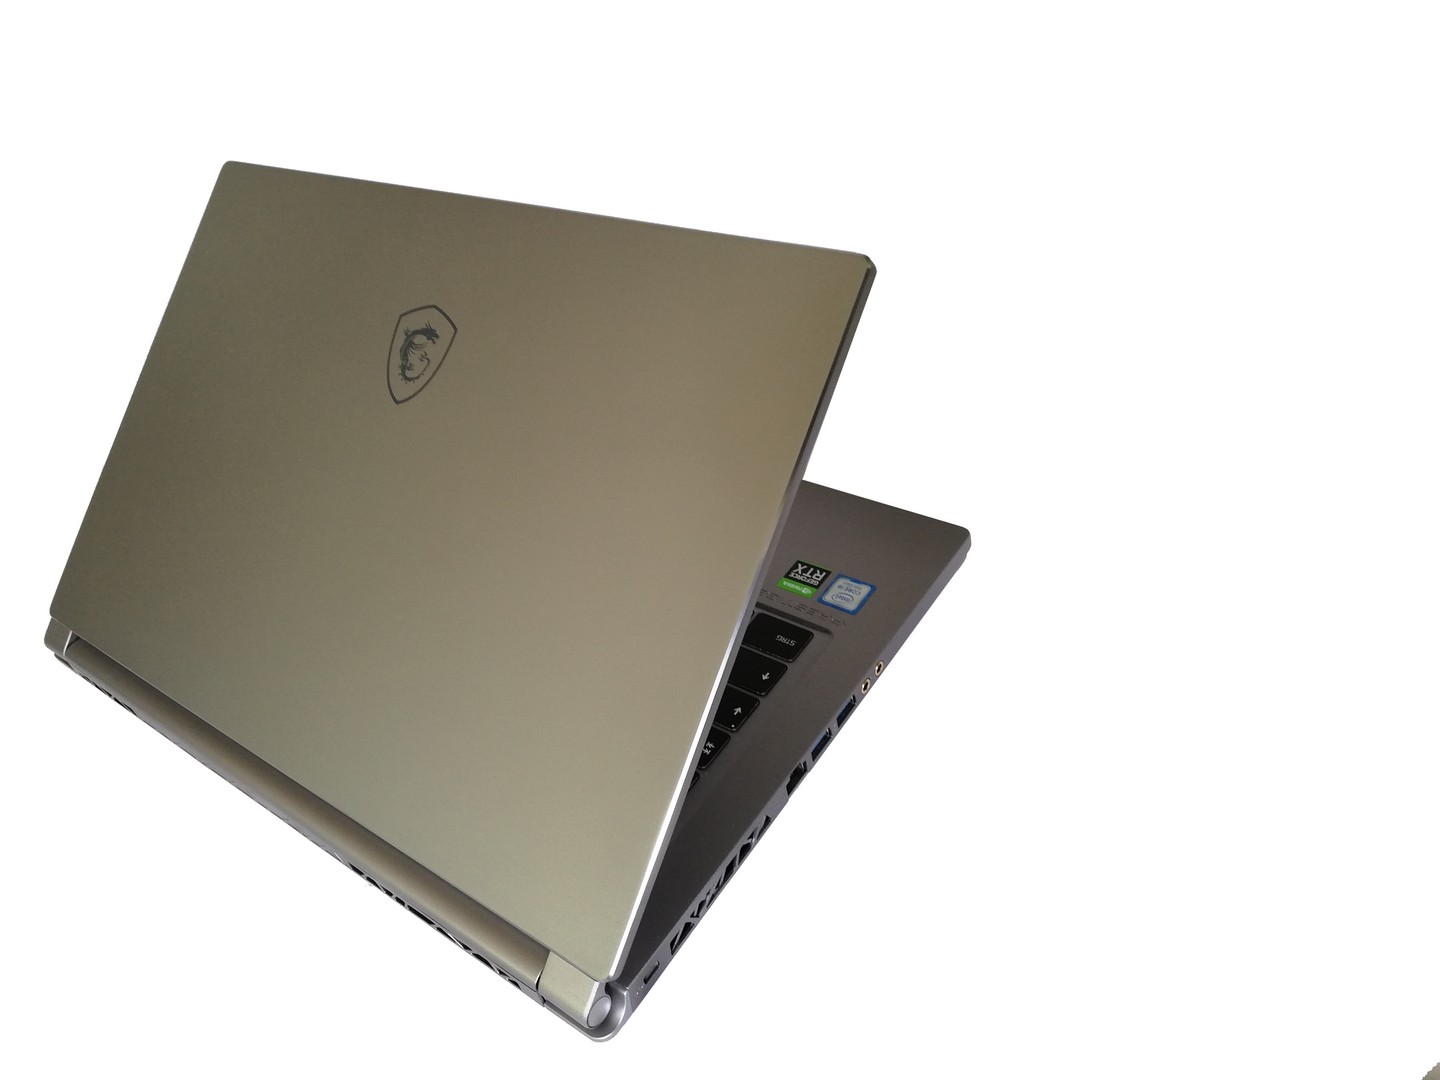
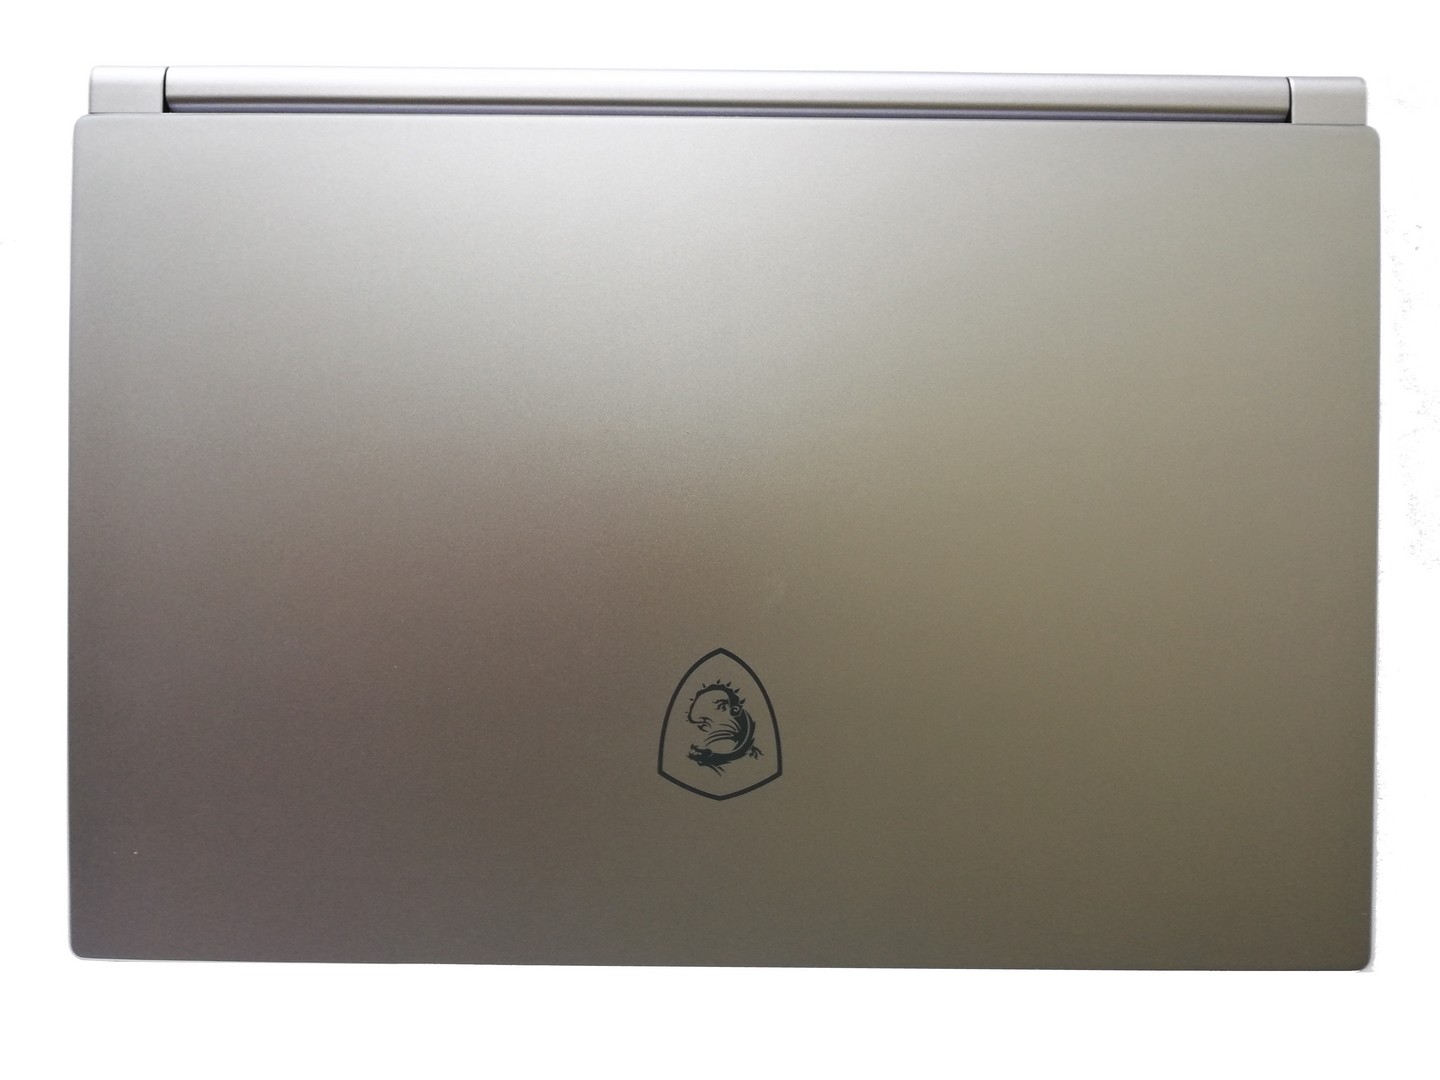
Vår recension har visat att MSI P65 Creator 9SF är ett kompakt kraftpaket med en levande skärm. Höljet passar kontorsliknande miljöer perfekt och datorn är välbyggd. Thunderbolt 3-porten säkrar att den förblir välutrustad när det kommer till framtida portbehov.
MSI P65 Creator 9SF är slående med en attraktiv design och utmärkt prestanda. MSI kunde dock valt en version av Nvidia GeForce RTX 2070 Max-Q med ett högre TDP-värde.
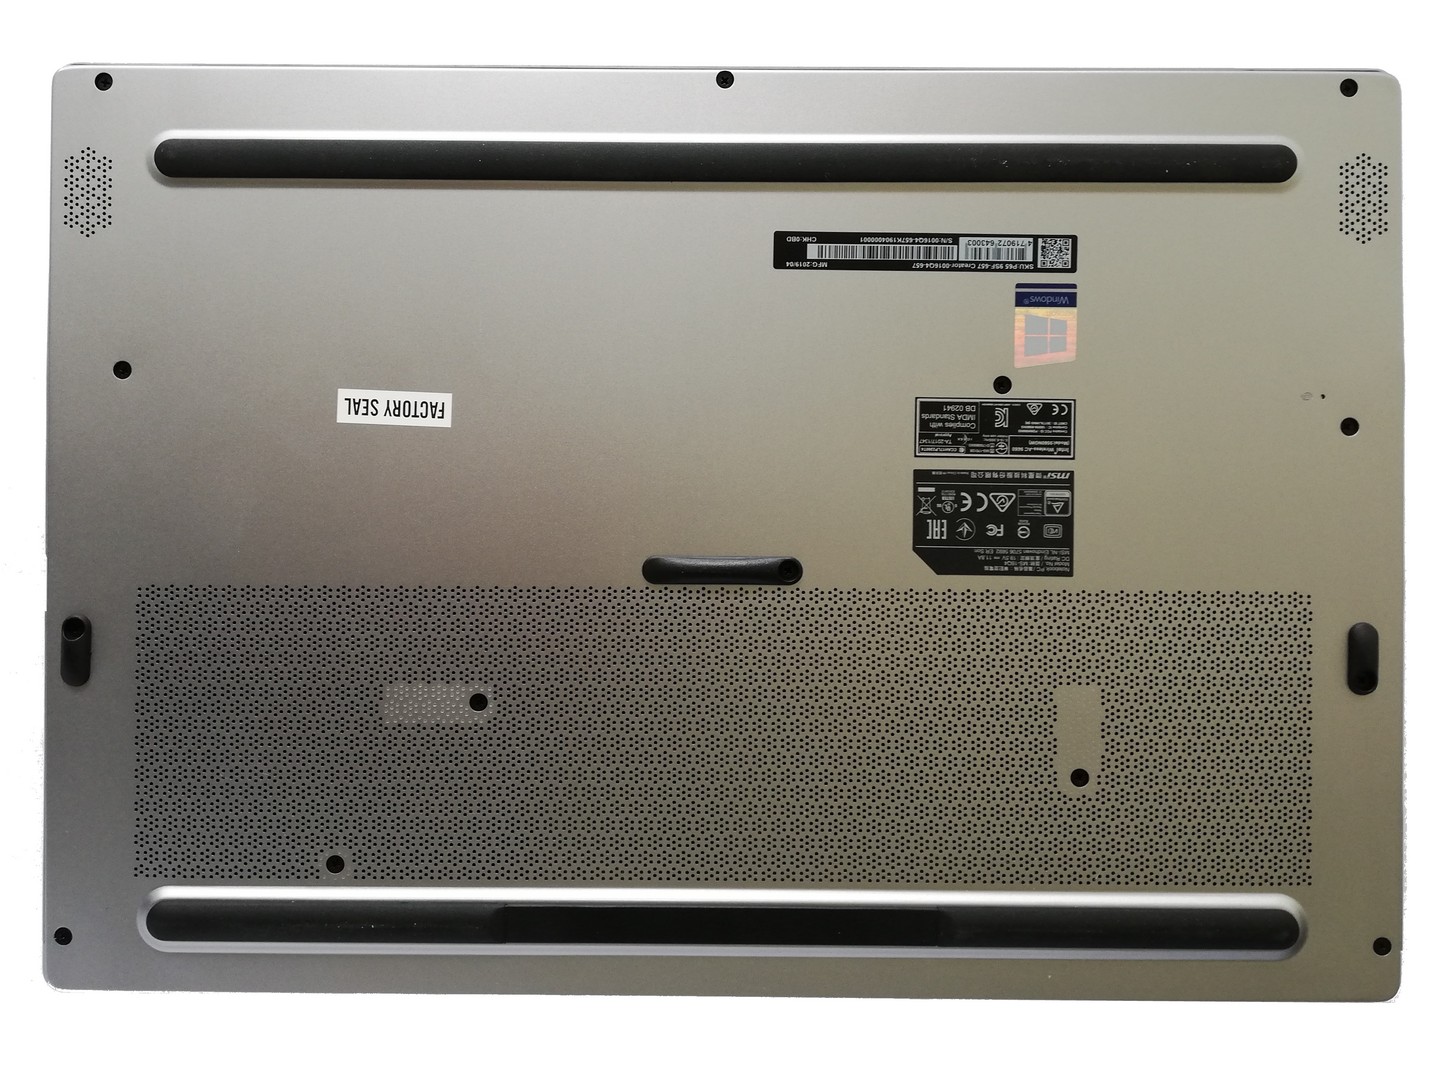
Systemets prestanda är bra och kan lätt hålla jämna steg med de flesta av sina konkurrenter. Andra tillverkare lyckas dock krama ur lite mer ur GPU:n - även om P65 Creator förstås är utrustad med en version av RTX 2070 Max-Q som har ett lägre TDP-värde. I likhet med den föregående modellen finns det i princip inga servicemöjligheter alls. Versionen vi recenserade hade fortfarande en fingeravtrycksläsare inbyggd i styrplattan. Den sistnämnda är betydligt bredare än innan och har därför mer rum för gestnavigering.
MSI P65 Creator 9SF-657
- 10/25/2019 v7 (old)
Mike Wobker
Price comparison
