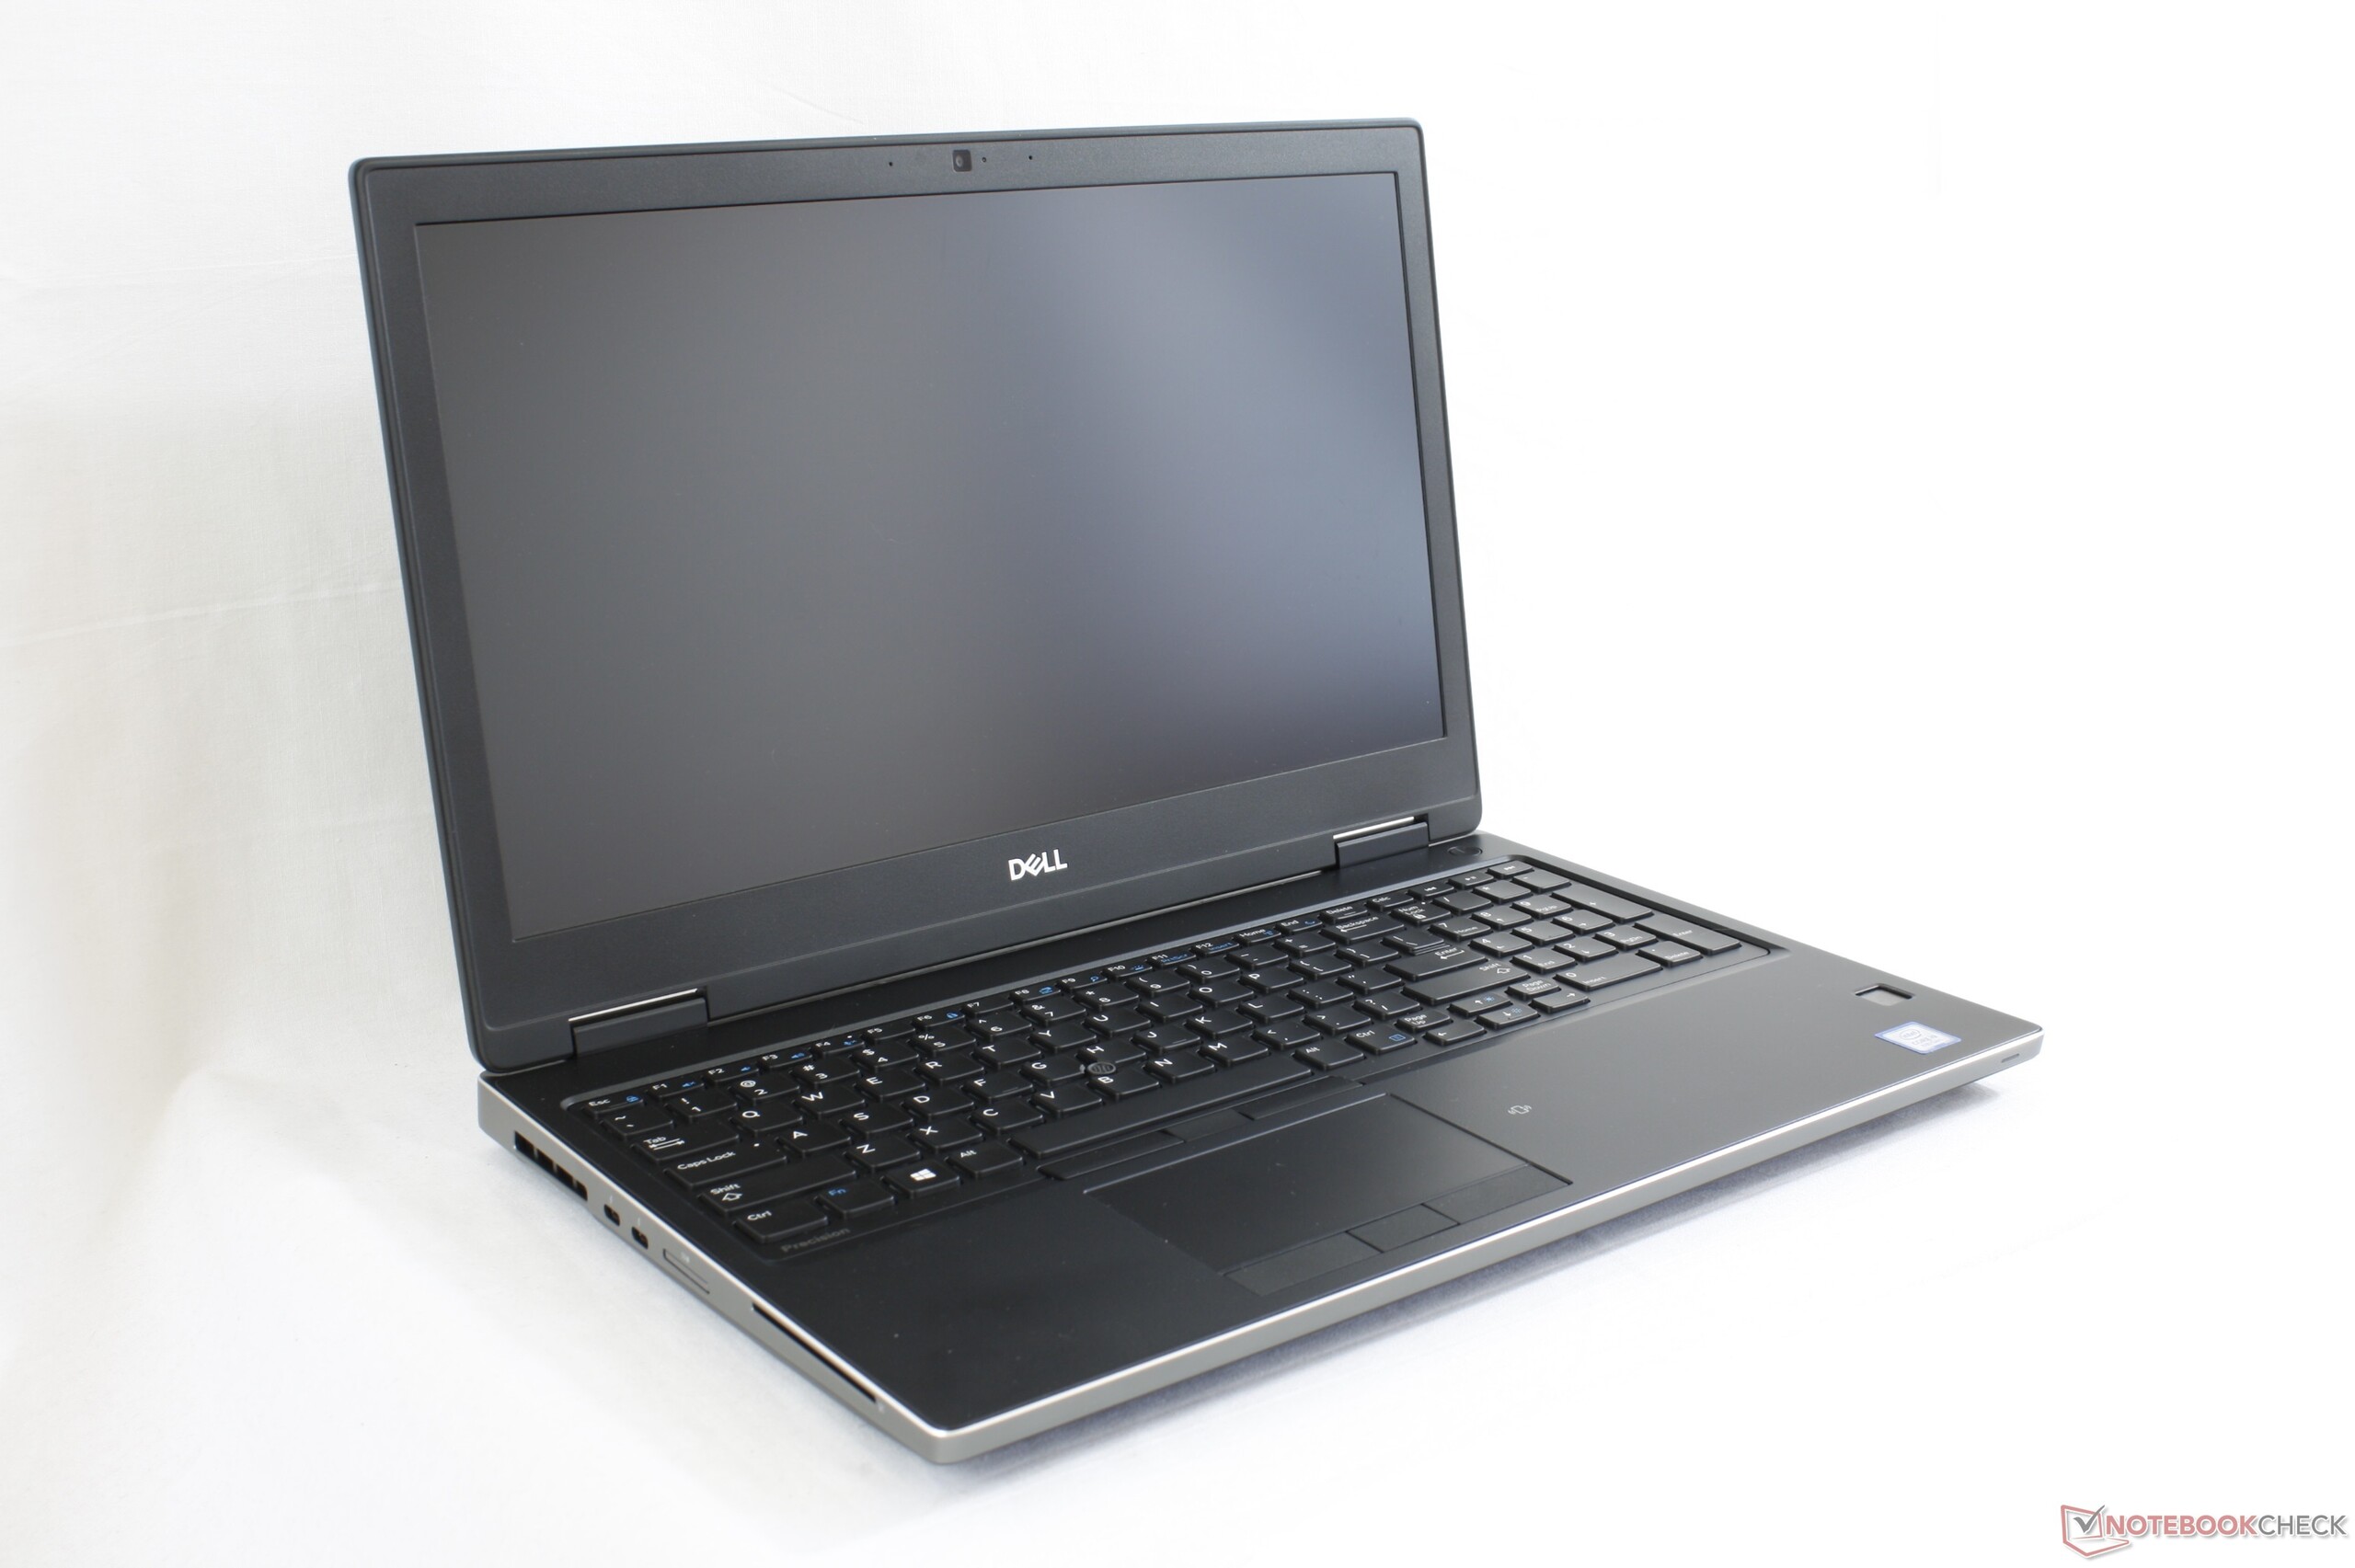
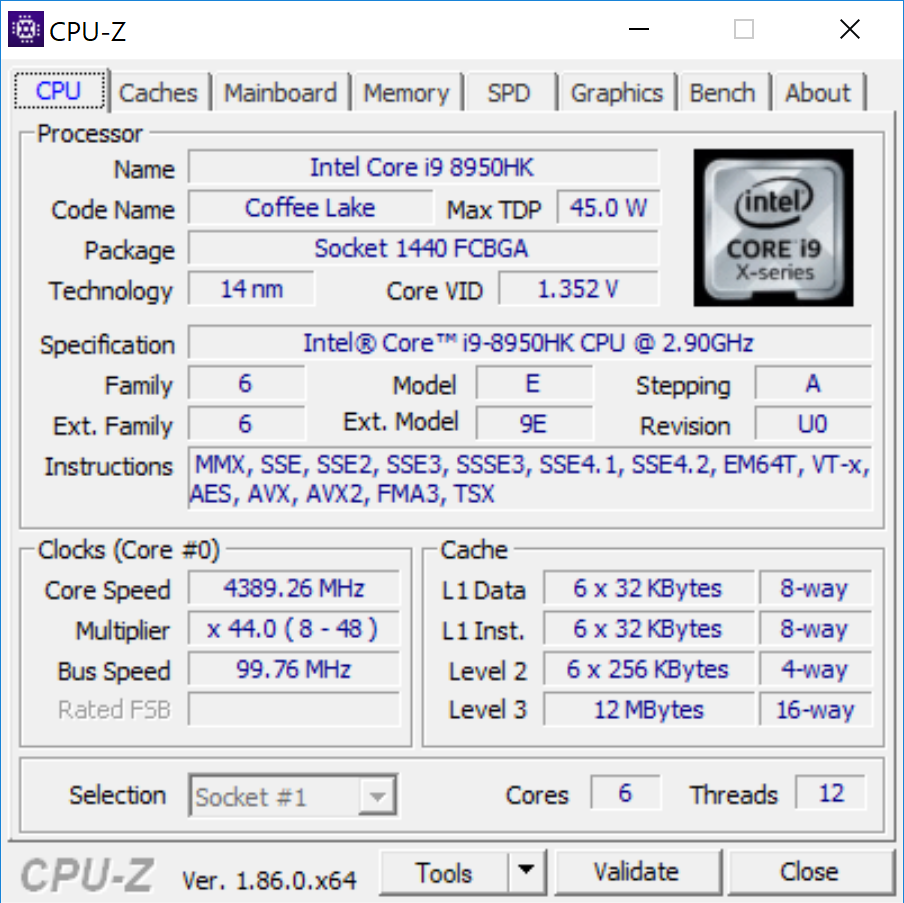
Test: Dell Precision 7530 (i9-8950HK, Quadro P3200) Arbetsstation (Sammanfattning)
| SD Card Reader | |
| average JPG Copy Test (av. of 3 runs) | |
| Dell Precision 7530 (Toshiba Exceria Pro SDXC 64 GB UHS-II) | |
| Gigabyte Aero 15X v8 (Toshiba Exceria Pro SDXC 64 GB UHS-II) | |
| Dell Precision 3530 (Toshiba Exceria Pro SDXC 64 GB UHS-II) | |
| Lenovo ThinkPad P1-20MD002LUS (Toshiba Exceria Pro SDXC 64 GB UHS-II) | |
| Dell Precision 5530 2-in-1 (Toshiba Exceria Pro M501 UHS-II) | |
| maximum AS SSD Seq Read Test (1GB) | |
| Gigabyte Aero 15X v8 (Toshiba Exceria Pro SDXC 64 GB UHS-II) | |
| Lenovo ThinkPad P1-20MD002LUS (Toshiba Exceria Pro SDXC 64 GB UHS-II) | |
| Dell Precision 5530 2-in-1 (Toshiba Exceria Pro M501 UHS-II) | |
| Dell Precision 3530 (Toshiba Exceria Pro SDXC 64 GB UHS-II) | |
| Dell Precision 7530 (Toshiba Exceria Pro SDXC 64 GB UHS-II) | |
| |||||||||||||||||||||||||
Distribution av ljusstyrkan: 85 %
Mitt på batteriet: 292.8 cd/m²
Kontrast: 813:1 (Svärta: 0.36 cd/m²)
ΔE ColorChecker Calman: 3.48 | ∀{0.5-29.43 Ø4.71}
calibrated: 3.13
ΔE Greyscale Calman: 4.1 | ∀{0.09-98 Ø4.96}
99.6% sRGB (Argyll 1.6.3 3D)
84.4% AdobeRGB 1998 (Argyll 1.6.3 3D)
96.2% AdobeRGB 1998 (Argyll 3D)
99.4% sRGB (Argyll 3D)
82.5% Display P3 (Argyll 3D)
Gamma: 2.2
CCT: 6740 K
| Dell Precision 7530 Sharp LQ156D1, IPS, 15.6", 3840x2160 | Lenovo ThinkPad P1-20MD002LUS B156ZAN03.2, IPS, 15.6", 3840x2160 | Dell Precision 5530 2-in-1 Sharp SHP148D, IPS, 15.6", 3840x2160 | Dell Precision 3530 BOE BOE06F1, IPS, 15.6", 1920x1080 | HP ZBook 15u G5 2ZC05EA CMN15E7, IPS LED, 15.6", 1920x1080 | Eurocom Tornado F5W AUO52ED B156HTN05.2, TN, 15.6", 1920x1080 | |
|---|---|---|---|---|---|---|
| Display | 3% | 5% | -15% | -46% | -22% | |
| Display P3 Coverage (%) | 82.5 | 86.4 5% | 91.2 11% | 72.8 -12% | 43.05 -48% | 66.1 -20% |
| sRGB Coverage (%) | 99.4 | 99.9 1% | 99.9 1% | 94.6 -5% | 64.7 -35% | 87.7 -12% |
| AdobeRGB 1998 Coverage (%) | 96.2 | 99.1 3% | 99.4 3% | 69.3 -28% | 44.5 -54% | 64.2 -33% |
| Response Times | -38% | -42% | -24% | -14% | 51% | |
| Response Time Grey 50% / Grey 80% * (ms) | 35.2 ? | 55.6 ? -58% | 49.6 ? -41% | 40.4 ? -15% | 41.6 ? -18% | 23.2 ? 34% |
| Response Time Black / White * (ms) | 26.4 ? | 30.8 ? -17% | 37.6 ? -42% | 34.8 ? -32% | 28.8 ? -9% | 8.5 ? 68% |
| PWM Frequency (Hz) | 198.4 ? | 990 ? | 1053 ? | 25770 ? | ||
| Screen | 5% | 14% | -16% | -22% | -53% | |
| Brightness middle (cd/m²) | 292.8 | 397.6 36% | 430.9 47% | 285.7 -2% | 229 -22% | 405.7 39% |
| Brightness (cd/m²) | 295 | 396 34% | 398 35% | 275 -7% | 212 -28% | 397 35% |
| Brightness Distribution (%) | 85 | 85 0% | 79 -7% | 85 0% | 88 4% | 92 8% |
| Black Level * (cd/m²) | 0.36 | 0.25 31% | 0.35 3% | 0.31 14% | 0.23 36% | 0.65 -81% |
| Contrast (:1) | 813 | 1590 96% | 1231 51% | 922 13% | 996 23% | 624 -23% |
| Colorchecker dE 2000 * | 3.48 | 4.95 -42% | 3.29 5% | 5.84 -68% | 4.2 -21% | 8.5 -144% |
| Colorchecker dE 2000 max. * | 6.81 | 10.23 -50% | 7.46 -10% | 8.76 -29% | 18 -164% | 16.2 -138% |
| Colorchecker dE 2000 calibrated * | 3.13 | 4.22 -35% | 3.58 -14% | 3.14 -0% | 4.2 -34% | |
| Greyscale dE 2000 * | 4.1 | 5.1 -24% | 2.6 37% | 6.5 -59% | 2 51% | 11.6 -183% |
| Gamma | 2.2 100% | 2.234 98% | 2.19 100% | 2.383 92% | 2.23 99% | 2.37 93% |
| CCT | 6740 96% | 7543 86% | 6870 95% | 7176 91% | 6292 103% | 10468 62% |
| Color Space (Percent of AdobeRGB 1998) (%) | 84.4 | 87.6 4% | 87.2 3% | 62 -27% | 41 -51% | 57 -32% |
| Color Space (Percent of sRGB) (%) | 99.6 | 100 0% | 100 0% | 94 -6% | 64.5 -35% | 87 -13% |
| Totalt genomsnitt (program/inställningar) | -10% /
-1% | -8% /
5% | -18% /
-16% | -27% /
-25% | -8% /
-33% |
* ... mindre är bättre
Visa svarstider
| ↔ Svarstid svart till vitt | ||
|---|---|---|
| 26.4 ms ... stiga ↗ och falla ↘ kombinerat | ↗ 14 ms stiga | 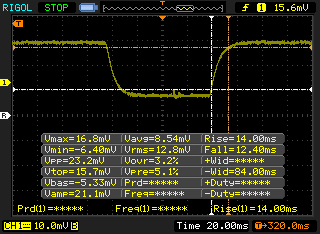 |
| ↘ 12.4 ms hösten | ||
| Skärmen visar relativt långsamma svarsfrekvenser i våra tester och kan vara för långsam för spelare. I jämförelse sträcker sig alla testade enheter från 0.1 (minst) till 240 (maximalt) ms. » 66 % av alla enheter är bättre. Detta innebär att den uppmätta svarstiden är sämre än genomsnittet av alla testade enheter (19.8 ms). | ||
| ↔ Svarstid 50 % grått till 80 % grått | ||
| 35.2 ms ... stiga ↗ och falla ↘ kombinerat | ↗ 17.2 ms stiga | 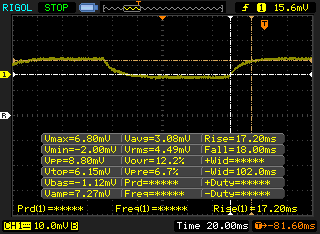 |
| ↘ 18 ms hösten | ||
| Skärmen visar långsamma svarsfrekvenser i våra tester och kommer att vara otillfredsställande för spelare. I jämförelse sträcker sig alla testade enheter från 0.165 (minst) till 636 (maximalt) ms. » 49 % av alla enheter är bättre. Detta innebär att den uppmätta svarstiden är sämre än genomsnittet av alla testade enheter (31 ms). | ||
Skärmflimmer / PWM (Puls-Width Modulation)
| Skärmflimmer / PWM upptäckt | 198.4 Hz | ≤ 25 % ljusstyrka inställning | 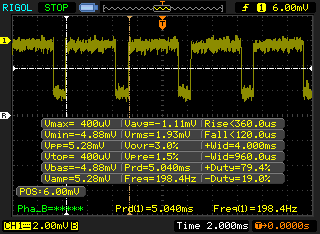 |
Displayens bakgrundsbelysning flimrar vid 198.4 Hz (i värsta fall, t.ex. med PWM) Flimrande upptäckt vid en ljusstyrkeinställning på 25 % och lägre. Det ska inte finnas något flimmer eller PWM över denna ljusstyrkeinställning. Frekvensen för 198.4 Hz är relativt låg, så känsliga användare kommer sannolikt att märka flimmer och uppleva ansträngda ögon vid den angivna ljusstyrkeinställningen och nedan. Som jämförelse: 52 % av alla testade enheter använder inte PWM för att dämpa skärmen. Om PWM upptäcktes mättes ett medelvärde av 7754 (minst: 5 - maximum: 343500) Hz. | |||
| wPrime 2.10 - 1024m | |
| Asus ROG Strix GL702ZC-GC204T | |
| Dell Precision 7510 (4K IGZO) | |
| Eurocom Tornado F5W | |
| Genomsnitt Intel Core i9-8950HK (n=1) | |
| Dell Precision 5530 2-in-1 | |
| Eurocom Sky X4C | |
* ... mindre är bättre
| PCMark 8 | |
| Home Score Accelerated v2 | |
| Eurocom Tornado F5W | |
| Dell Precision 3530 | |
| Dell Precision 7530 | |
| Lenovo ThinkPad P1-20MD002LUS | |
| Dell Precision 5530 2-in-1 | |
| Work Score Accelerated v2 | |
| Dell Precision 7530 | |
| Eurocom Tornado F5W | |
| Dell Precision 3530 | |
| Lenovo ThinkPad P1-20MD002LUS | |
| Dell Precision 5530 2-in-1 | |
| Creative Score Accelerated v2 | |
| Eurocom Tornado F5W | |
| Dell Precision 3530 | |
| Lenovo ThinkPad P1-20MD002LUS | |
| PCMark 8 Home Score Accelerated v2 | 4200 poäng | |
| PCMark 8 Work Score Accelerated v2 | 5568 poäng | |
| PCMark 10 Score | 5738 poäng | |
Hjälp | ||
| Dell Precision 7530 Samsung PM961 NVMe MZVLW512HMJP | Lenovo ThinkPad P1-20MD002LUS Samsung SSD PM981 MZVLB2T0HMLB | Dell Precision 5530 2-in-1 SK Hynix PC401 512GB M.2 (HFS512GD9TNG) | Dell Precision 3530 SK hynix PC400 512 GB | Eurocom Tornado F5W Samsung SSD 960 Pro 512 GB m.2 | HP ZBook 15u G5 2ZC05EA Toshiba XG5 KXG50ZNV256G | |
|---|---|---|---|---|---|---|
| CrystalDiskMark 5.2 / 6 | 12% | 1% | 11% | 64% | -15% | |
| Write 4K (MB/s) | 105.9 | 108 2% | 128.9 22% | 113.6 7% | 211.4 100% | 98.8 -7% |
| Read 4K (MB/s) | 23.87 | 37.24 56% | 45.7 91% | 41.18 73% | 56.7 138% | 33.98 42% |
| Write Seq (MB/s) | 1542 | 1476 -4% | 635 -59% | 1417 -8% | 1983 29% | 395.7 -74% |
| Read Seq (MB/s) | 1916 | 1367 -29% | 2065 8% | 1896 -1% | 2841 48% | 2063 8% |
| Write 4K Q32T1 (MB/s) | 305.4 | 302.4 -1% | 336.6 10% | 355 16% | 571 87% | 352.3 15% |
| Read 4K Q32T1 (MB/s) | 358.4 | 375 5% | 393.6 10% | 404.3 13% | 606 69% | 281.8 -21% |
| Write Seq Q32T1 (MB/s) | 1572 | 2433 55% | 662 -58% | 1411 -10% | 1986 26% | 355 -77% |
| Read Seq Q32T1 (MB/s) | 3061 | 3493 14% | 2664 -13% | 3095 1% | 3467 13% | 2775 -9% |
| Write 4K Q8T8 (MB/s) | 361 | |||||
| Read 4K Q8T8 (MB/s) | 447.3 |

| 3DMark 06 Standard Score | 24576 poäng | |
| 3DMark Vantage P Result | 45851 poäng | |
| 3DMark 11 Performance | 14244 poäng | |
| 3DMark Ice Storm Standard Score | 49190 poäng | |
| 3DMark Cloud Gate Standard Score | 30100 poäng | |
| 3DMark Fire Strike Score | 10128 poäng | |
| 3DMark Time Spy Score | 3979 poäng | |
Hjälp | ||
| The Witcher 3 - 1920x1080 Ultra Graphics & Postprocessing (HBAO+) | |
| Eurocom Tornado F5W | |
| Genomsnitt NVIDIA Quadro P3200 (41.6 - 46.4, n=4) | |
| Nvidia GeForce GTX 1060 Founders Edition 6 GB | |
| Dell Precision 7530 | |
| Dell Precision 5530 Xeon E-2176M | |
| Lenovo ThinkPad P1-20MD002LUS | |
| HP ZBook 15 G4-Y4E80AV | |
| Lenovo ThinkPad P52 20MAS03N00 | |
| Dell Precision 3530 | |
| låg | med. | hög | ultra | 4K | |
|---|---|---|---|---|---|
| The Witcher 3 (2015) | 208.9 | 141 | 80.6 | 41.6 | 28.2 |
| Batman: Arkham Knight (2015) | 140 | 127 | 89 | 59 | 29 |
| Rise of the Tomb Raider (2016) | 180.9 | 139.7 | 77.4 | 65.8 | 27.6 |
| Dell Precision 7530 i9-8950HK, Quadro P3200 | HP ZBook 15 G4-Y4E80AV E3-1535M v6, Quadro M2200 | Dell Precision 7510 (4K IGZO) E3-1535M v5, Quadro M2000M | Lenovo ThinkPad P52 20MAS03N00 i7-8750H, Quadro P1000 | Lenovo ThinkPad P1-20MD002LUS E-2176M, Quadro P2000 Max-Q | Eurocom Tornado F5W E3-1280 v5, Quadro P5000 | |
|---|---|---|---|---|---|---|
| Noise | 3% | -3% | 6% | 3% | 0% | |
| av / miljö * (dB) | 28.3 | 29.5 -4% | 28.2 -0% | 29.5 -4% | 28.3 -0% | 29.6 -5% |
| Idle Minimum * (dB) | 28.3 | 29.5 -4% | 29.8 -5% | 29.5 -4% | 28.4 -0% | 31.2 -10% |
| Idle Average * (dB) | 28.3 | 29.5 -4% | 29.8 -5% | 29.5 -4% | 28.4 -0% | 31.2 -10% |
| Idle Maximum * (dB) | 30.5 | 30 2% | 31.2 -2% | 29.5 3% | 29.2 4% | 32.6 -7% |
| Load Average * (dB) | 34.5 | 39.5 -14% | 37.2 -8% | 34.7 -1% | 41.8 -21% | 32.6 6% |
| Witcher 3 ultra * (dB) | 49.5 | 39.5 20% | 33.1 33% | 39.1 21% | 43.1 13% | |
| Load Maximum * (dB) | 49.5 | 36 27% | 49.4 -0% | 39.4 20% | 41.8 16% | 43.3 13% |
* ... mindre är bättre
Ljudnivå
| Låg belastning |
| 28.3 / 28.3 / 30.5 dB(A) |
| Hög belastning |
| 34.5 / 49.5 dB(A) |
 | ||
30 dB tyst 40 dB(A) hörbar 50 dB(A) högt ljud |
||
min: | ||
(-) Den maximala temperaturen på ovansidan är 54.4 °C / 130 F, jämfört med genomsnittet av 38.2 °C / 101 F , allt från 22.2 till 69.8 °C för klassen Workstation.
(-) Botten värms upp till maximalt 49 °C / 120 F, jämfört med genomsnittet av 41.1 °C / 106 F
(±) Vid tomgångsbruk är medeltemperaturen för ovansidan 33 °C / 91 F, jämfört med enhetsgenomsnittet på 32 °C / ### class_avg_f### F.
(±) När du spelar The Witcher 3 är medeltemperaturen för ovansidan 34.9 °C / 95 F, jämfört med enhetsgenomsnittet på 32 °C / ## #class_avg_f### F.
(+) Handledsstöden och pekplattan är kallare än hudtemperaturen med maximalt 28.8 °C / 83.8 F och är därför svala att ta på.
(±) Medeltemperaturen för handledsstödsområdet på liknande enheter var 27.8 °C / 82 F (-1 °C / -1.8 F).
Dell Precision 7530 ljudanalys
(±) | högtalarljudstyrkan är genomsnittlig men bra (74.4 dB)
Bas 100 - 315 Hz
(±) | reducerad bas - i genomsnitt 8% lägre än medianen
(±) | linjäriteten för basen är genomsnittlig (12.3% delta till föregående frekvens)
Mellan 400 - 2000 Hz
(+) | balanserad mellan - endast 3.3% från medianen
(±) | linjäriteten för mids är genomsnittlig (7.8% delta till föregående frekvens)
Högsta 2 - 16 kHz
(+) | balanserade toppar - endast 2.3% från medianen
(+) | toppar är linjära (5% delta till föregående frekvens)
Totalt 100 - 16 000 Hz
(+) | det totala ljudet är linjärt (11.4% skillnad mot median)
Jämfört med samma klass
» 13% av alla testade enheter i den här klassen var bättre, 4% liknande, 83% sämre
» Den bästa hade ett delta på 7%, genomsnittet var 17%, sämst var 35%
Jämfört med alla testade enheter
» 7% av alla testade enheter var bättre, 2% liknande, 90% sämre
» Den bästa hade ett delta på 4%, genomsnittet var 23%, sämst var 134%
Apple MacBook 12 (Early 2016) 1.1 GHz ljudanalys
(+) | högtalare kan spela relativt högt (83.6 dB)
Bas 100 - 315 Hz
(±) | reducerad bas - i genomsnitt 11.3% lägre än medianen
(±) | linjäriteten för basen är genomsnittlig (14.2% delta till föregående frekvens)
Mellan 400 - 2000 Hz
(+) | balanserad mellan - endast 2.4% från medianen
(+) | mids är linjära (5.5% delta till föregående frekvens)
Högsta 2 - 16 kHz
(+) | balanserade toppar - endast 2% från medianen
(+) | toppar är linjära (4.5% delta till föregående frekvens)
Totalt 100 - 16 000 Hz
(+) | det totala ljudet är linjärt (10.2% skillnad mot median)
Jämfört med samma klass
» 7% av alla testade enheter i den här klassen var bättre, 2% liknande, 90% sämre
» Den bästa hade ett delta på 5%, genomsnittet var 18%, sämst var 53%
Jämfört med alla testade enheter
» 5% av alla testade enheter var bättre, 1% liknande, 94% sämre
» Den bästa hade ett delta på 4%, genomsnittet var 23%, sämst var 134%
| Av/Standby | |
| Låg belastning | |
| Hög belastning |
|
Förklaring:
min: | |
| Dell Precision 7530 i9-8950HK, Quadro P3200, Samsung PM961 NVMe MZVLW512HMJP, IPS, 3840x2160, 15.6" | Lenovo ThinkPad P1-20MD002LUS E-2176M, Quadro P2000 Max-Q, Samsung SSD PM981 MZVLB2T0HMLB, IPS, 3840x2160, 15.6" | Dell Precision 5530 2-in-1 i7-8706G, WX Vega M GL, SK Hynix PC401 512GB M.2 (HFS512GD9TNG), IPS, 3840x2160, 15.6" | Dell Precision 7510 (4K IGZO) E3-1535M v5, Quadro M2000M, Samsung SSD SM951a 512GB M.2 PCIe 3.0 x4 NVMe (MZVKV512), IGZO IPS, 3840x2160, 15.6" | HP ZBook 15u G5 2ZC05EA i5-8550U, Radeon Pro WX 3100, Toshiba XG5 KXG50ZNV256G, IPS LED, 1920x1080, 15.6" | Asus Strix GL504GM i7-8750H, GeForce GTX 1060 Mobile, Toshiba NVMe THNSN5256GPU7, IPS, 1920x1080, 15.6" | |
|---|---|---|---|---|---|---|
| Power Consumption | 40% | 43% | -16% | 64% | 14% | |
| Idle Minimum * (Watt) | 15.7 | 7.1 55% | 7.4 53% | 23.9 -52% | 3.2 80% | 10 36% |
| Idle Average * (Watt) | 20.3 | 14.4 29% | 12.4 39% | 28.9 -42% | 6.1 70% | 16.9 17% |
| Idle Maximum * (Watt) | 25.7 | 14.6 43% | 13.3 48% | 30 -17% | 9.7 62% | 21.1 18% |
| Load Average * (Watt) | 118.9 | 93.9 21% | 79.2 33% | 95.2 20% | 62 48% | 112.4 5% |
| Witcher 3 ultra * (Watt) | 131.2 | 77.9 41% | 82.2 37% | 48 63% | 135.5 -3% | |
| Load Maximum * (Watt) | 174 | 88.3 49% | 96.5 45% | 157.1 10% | 71 59% | 157.3 10% |
* ... mindre är bättre
| Dell Precision 7530 i9-8950HK, Quadro P3200, 97 Wh | Lenovo ThinkPad P1-20MD002LUS E-2176M, Quadro P2000 Max-Q, 80 Wh | Dell Precision 7510 (4K IGZO) E3-1535M v5, Quadro M2000M, 91 Wh | Dell Precision 5530 2-in-1 i7-8706G, WX Vega M GL, 75 Wh | HP ZBook 15u G5 2ZC05EA i5-8550U, Radeon Pro WX 3100, 56 Wh | Eurocom Tornado F5W E3-1280 v5, Quadro P5000, 75.24 Wh | |
|---|---|---|---|---|---|---|
| Batteridrifttid | 15% | -23% | 42% | 144% | -22% | |
| Reader / Idle (h) | 6.4 | 4.5 -30% | 12.3 92% | 21.7 239% | 4.7 -27% | |
| WiFi v1.3 (h) | 4.6 | 5.3 15% | 4 -13% | 7.3 59% | 8.6 87% | 4 -13% |
| Load (h) | 1.6 | 1.2 -25% | 1.2 -25% | 3.3 106% | 1.2 -25% |
För
Emot
Läs den fullständiga versionen av den här recensionen på engelska här.
Precision 7530 är en värdig uppgradering från 7510. Den är mindre utan att offra stabilitet och den har betydligt snabbare alternativ för CPU och GPU vilket användare av högpresterande arbetsstationer kommer uppskatta.
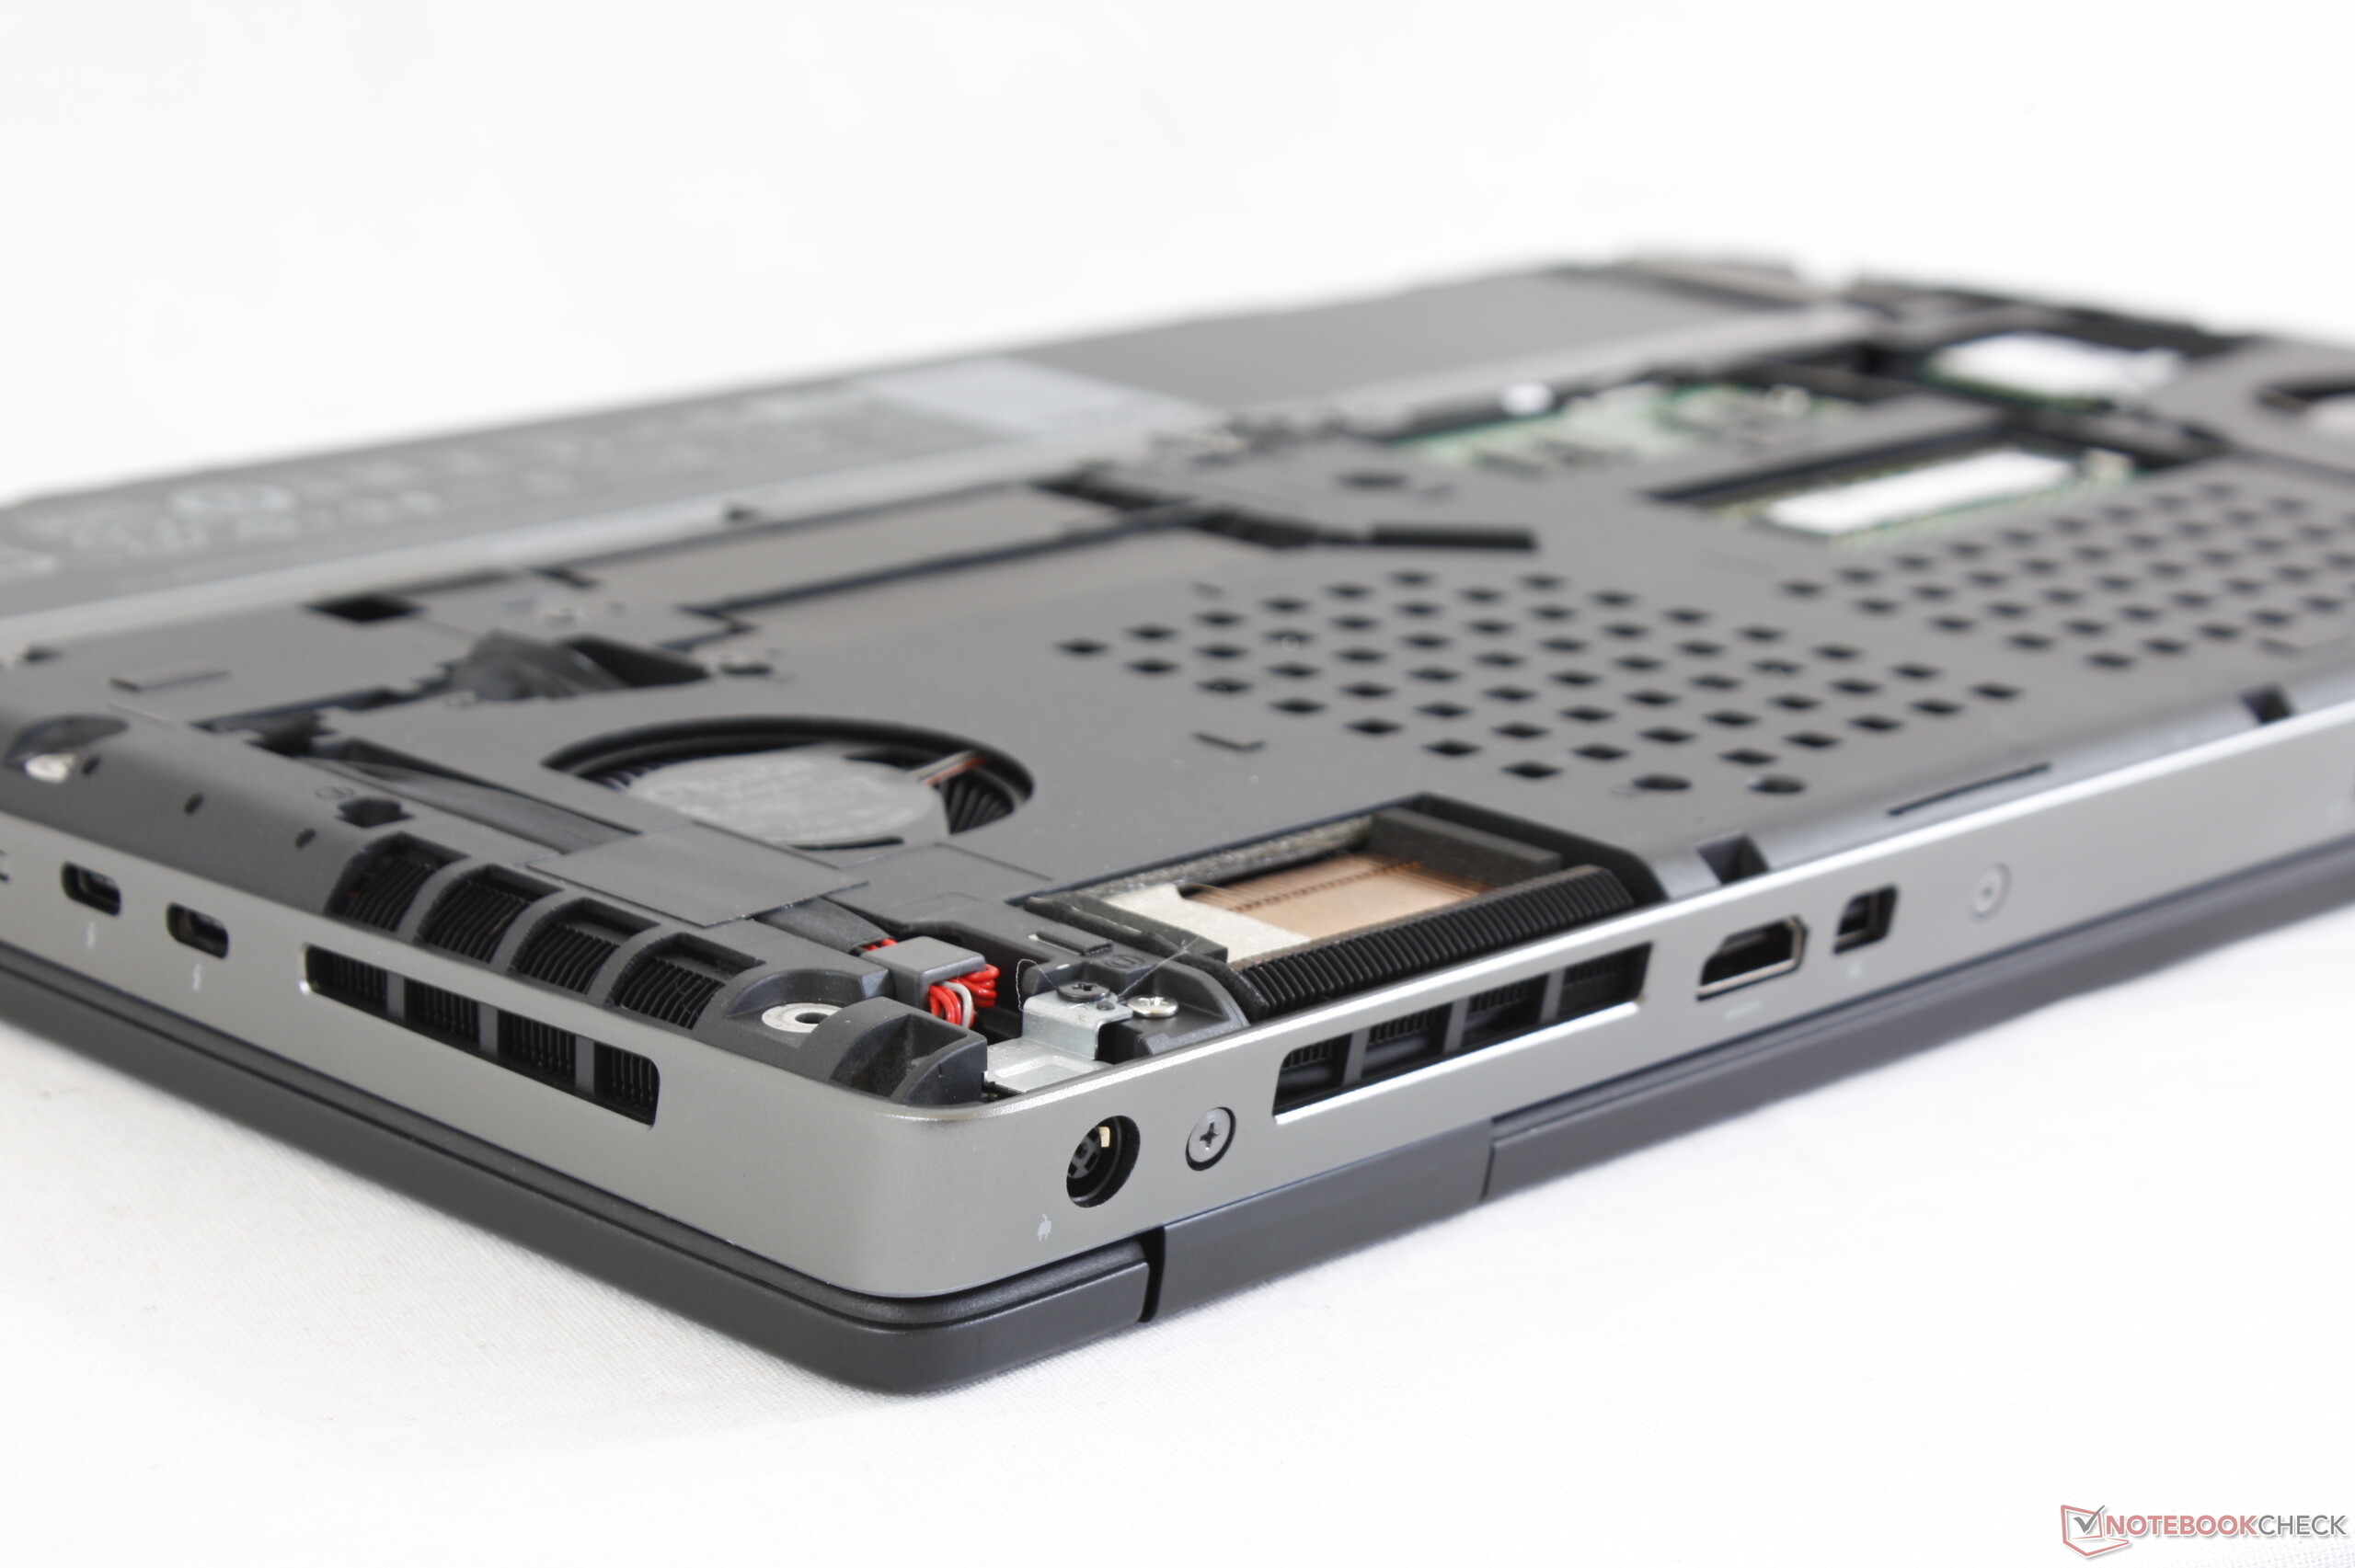
Det finns ett flertal nackdelar relaterade till processorn och anslutningsalternativen. För det första blir Core i9-processorn för varm för att verkligen kunna utnyttja Turbo Boost-klockfrekvenserna. Som ett resultat av detta är prestandan som bäst bara en aning bättre än den billigare Core i7-8750H och vi rekommenderar därför i7-8750H eller lägre. Vi blev också besvikna över att se reducerad prestanda vid batteridrift samt att det inte fanns något alternativ för Quadro P4000 eller bättre med tanke på att detta är "världens kraftigaste" arbetsstation på 15 tum som även är "den första som är redo för VR". Den aningen gryniga 4K-skärmen och fläktar som låter högt vid belastning dämpar också ett i övrigt gediget byggt system.
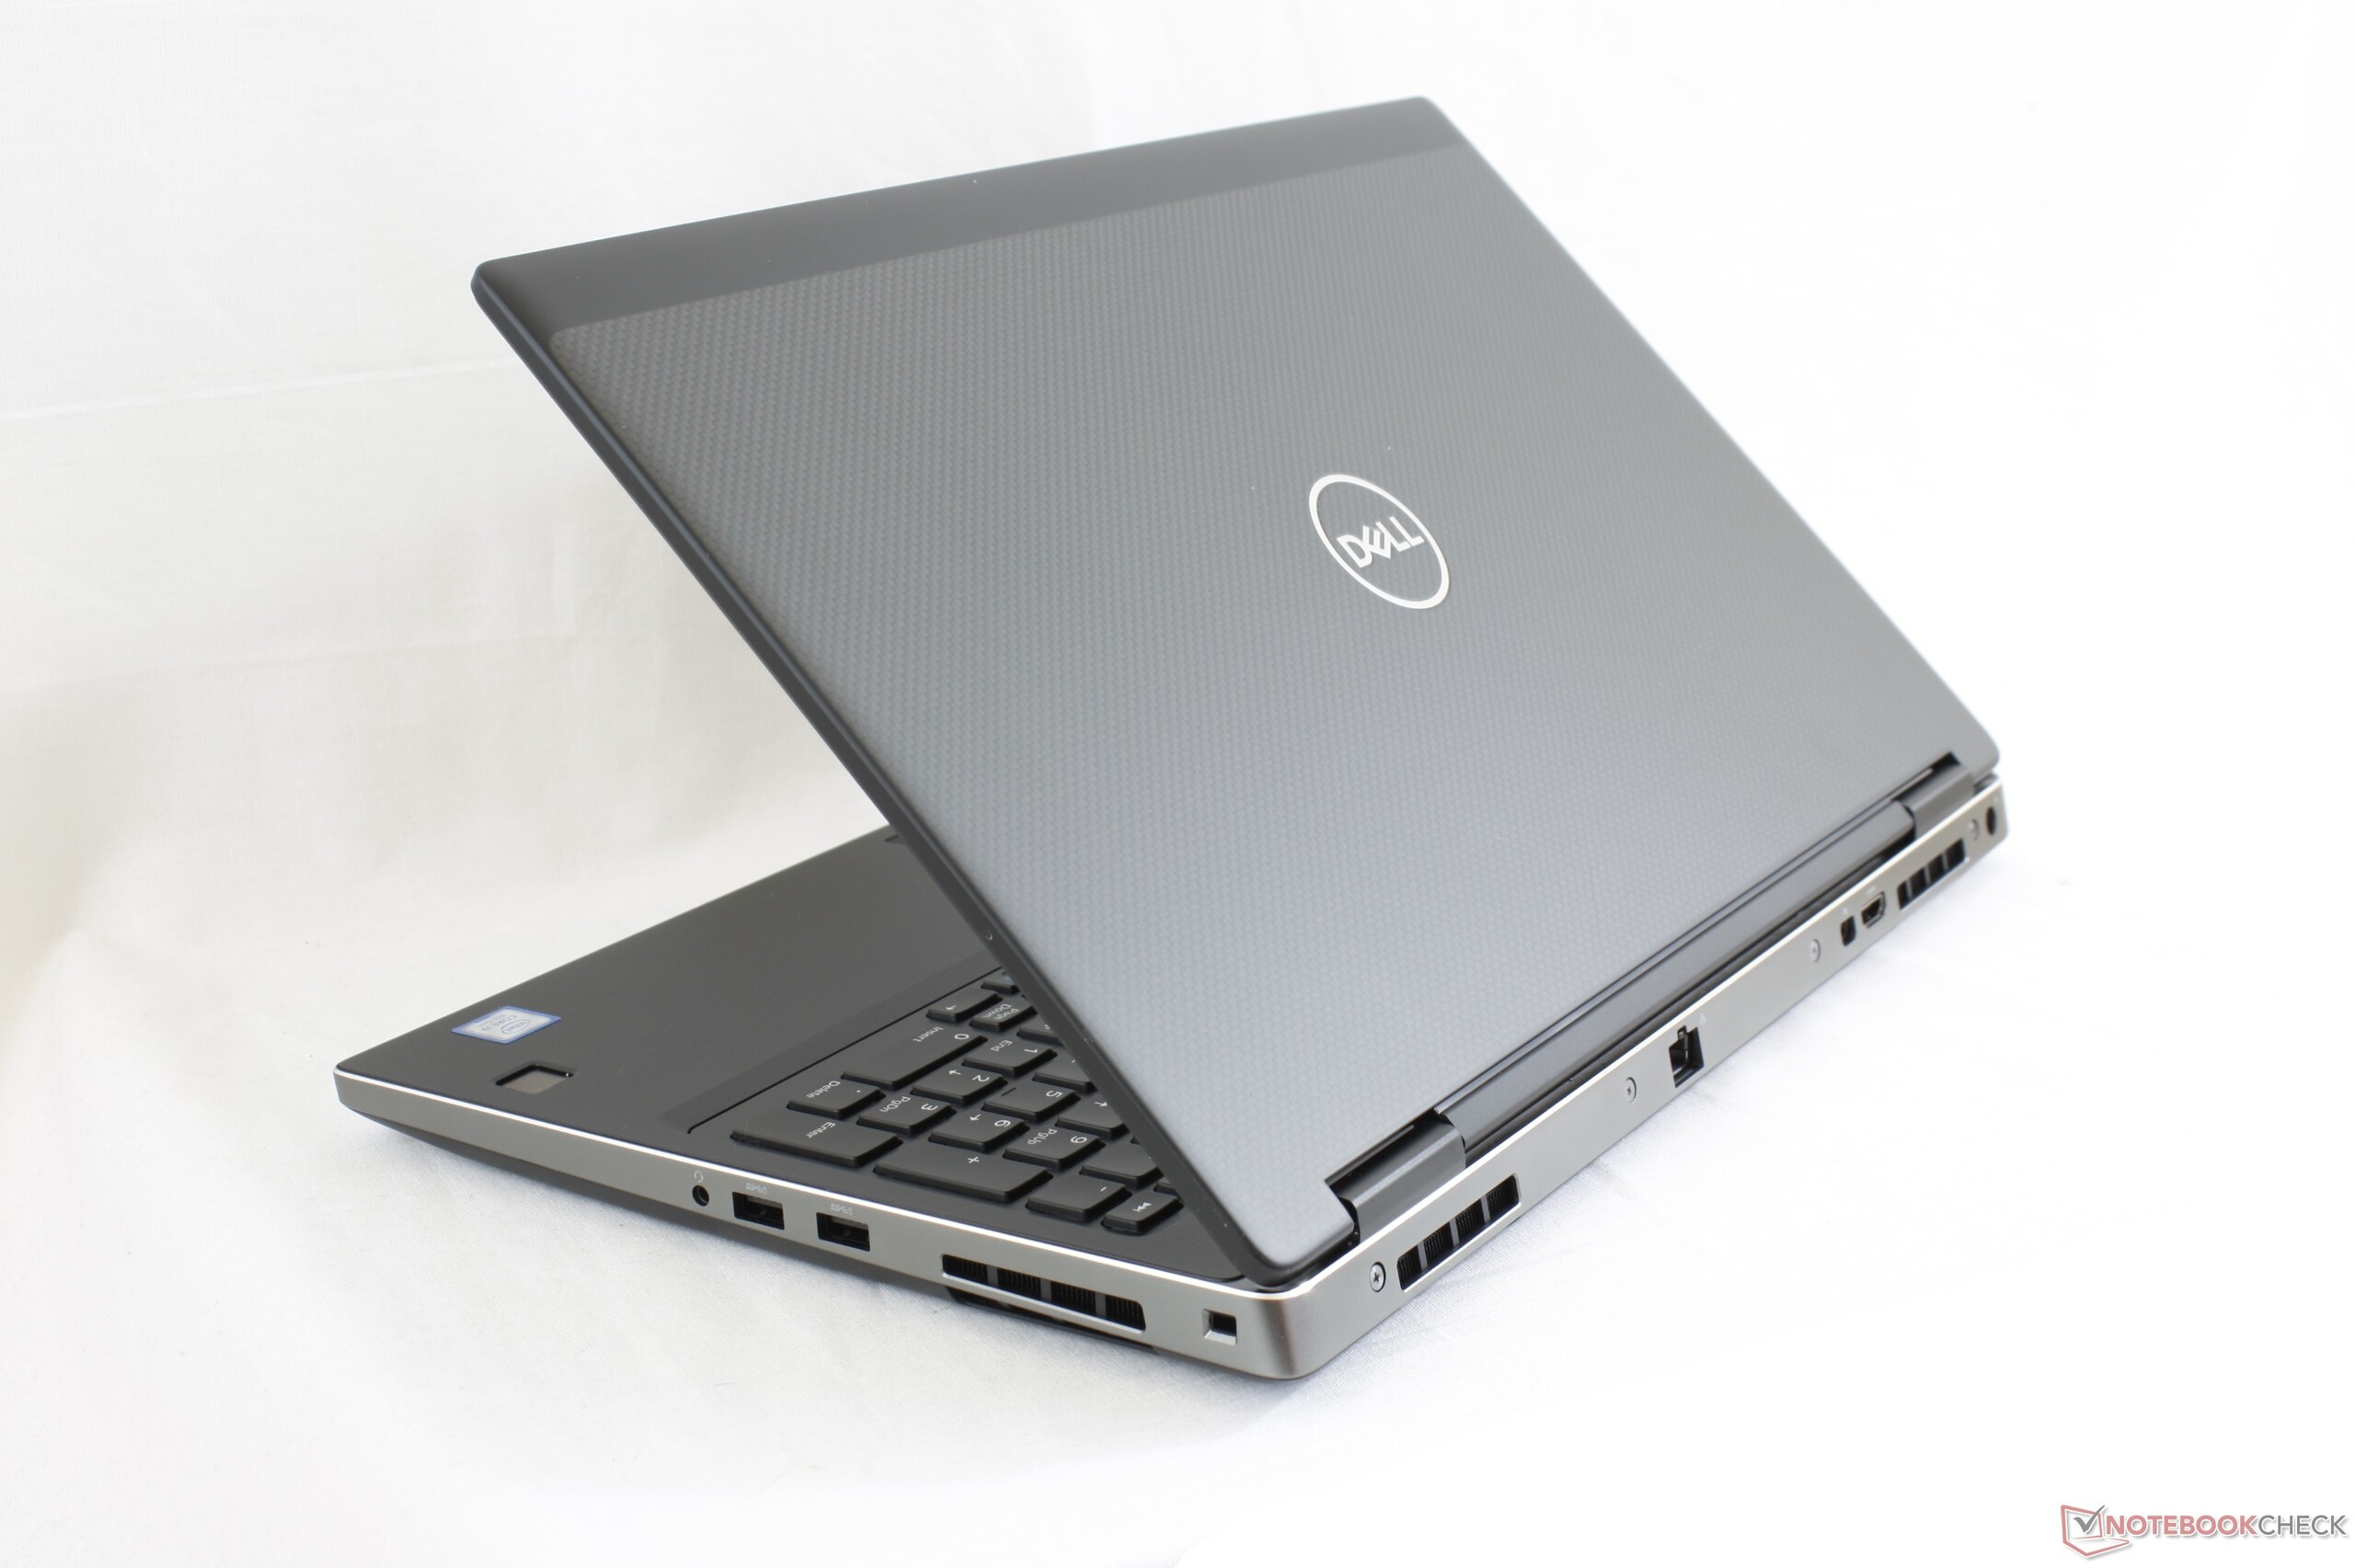
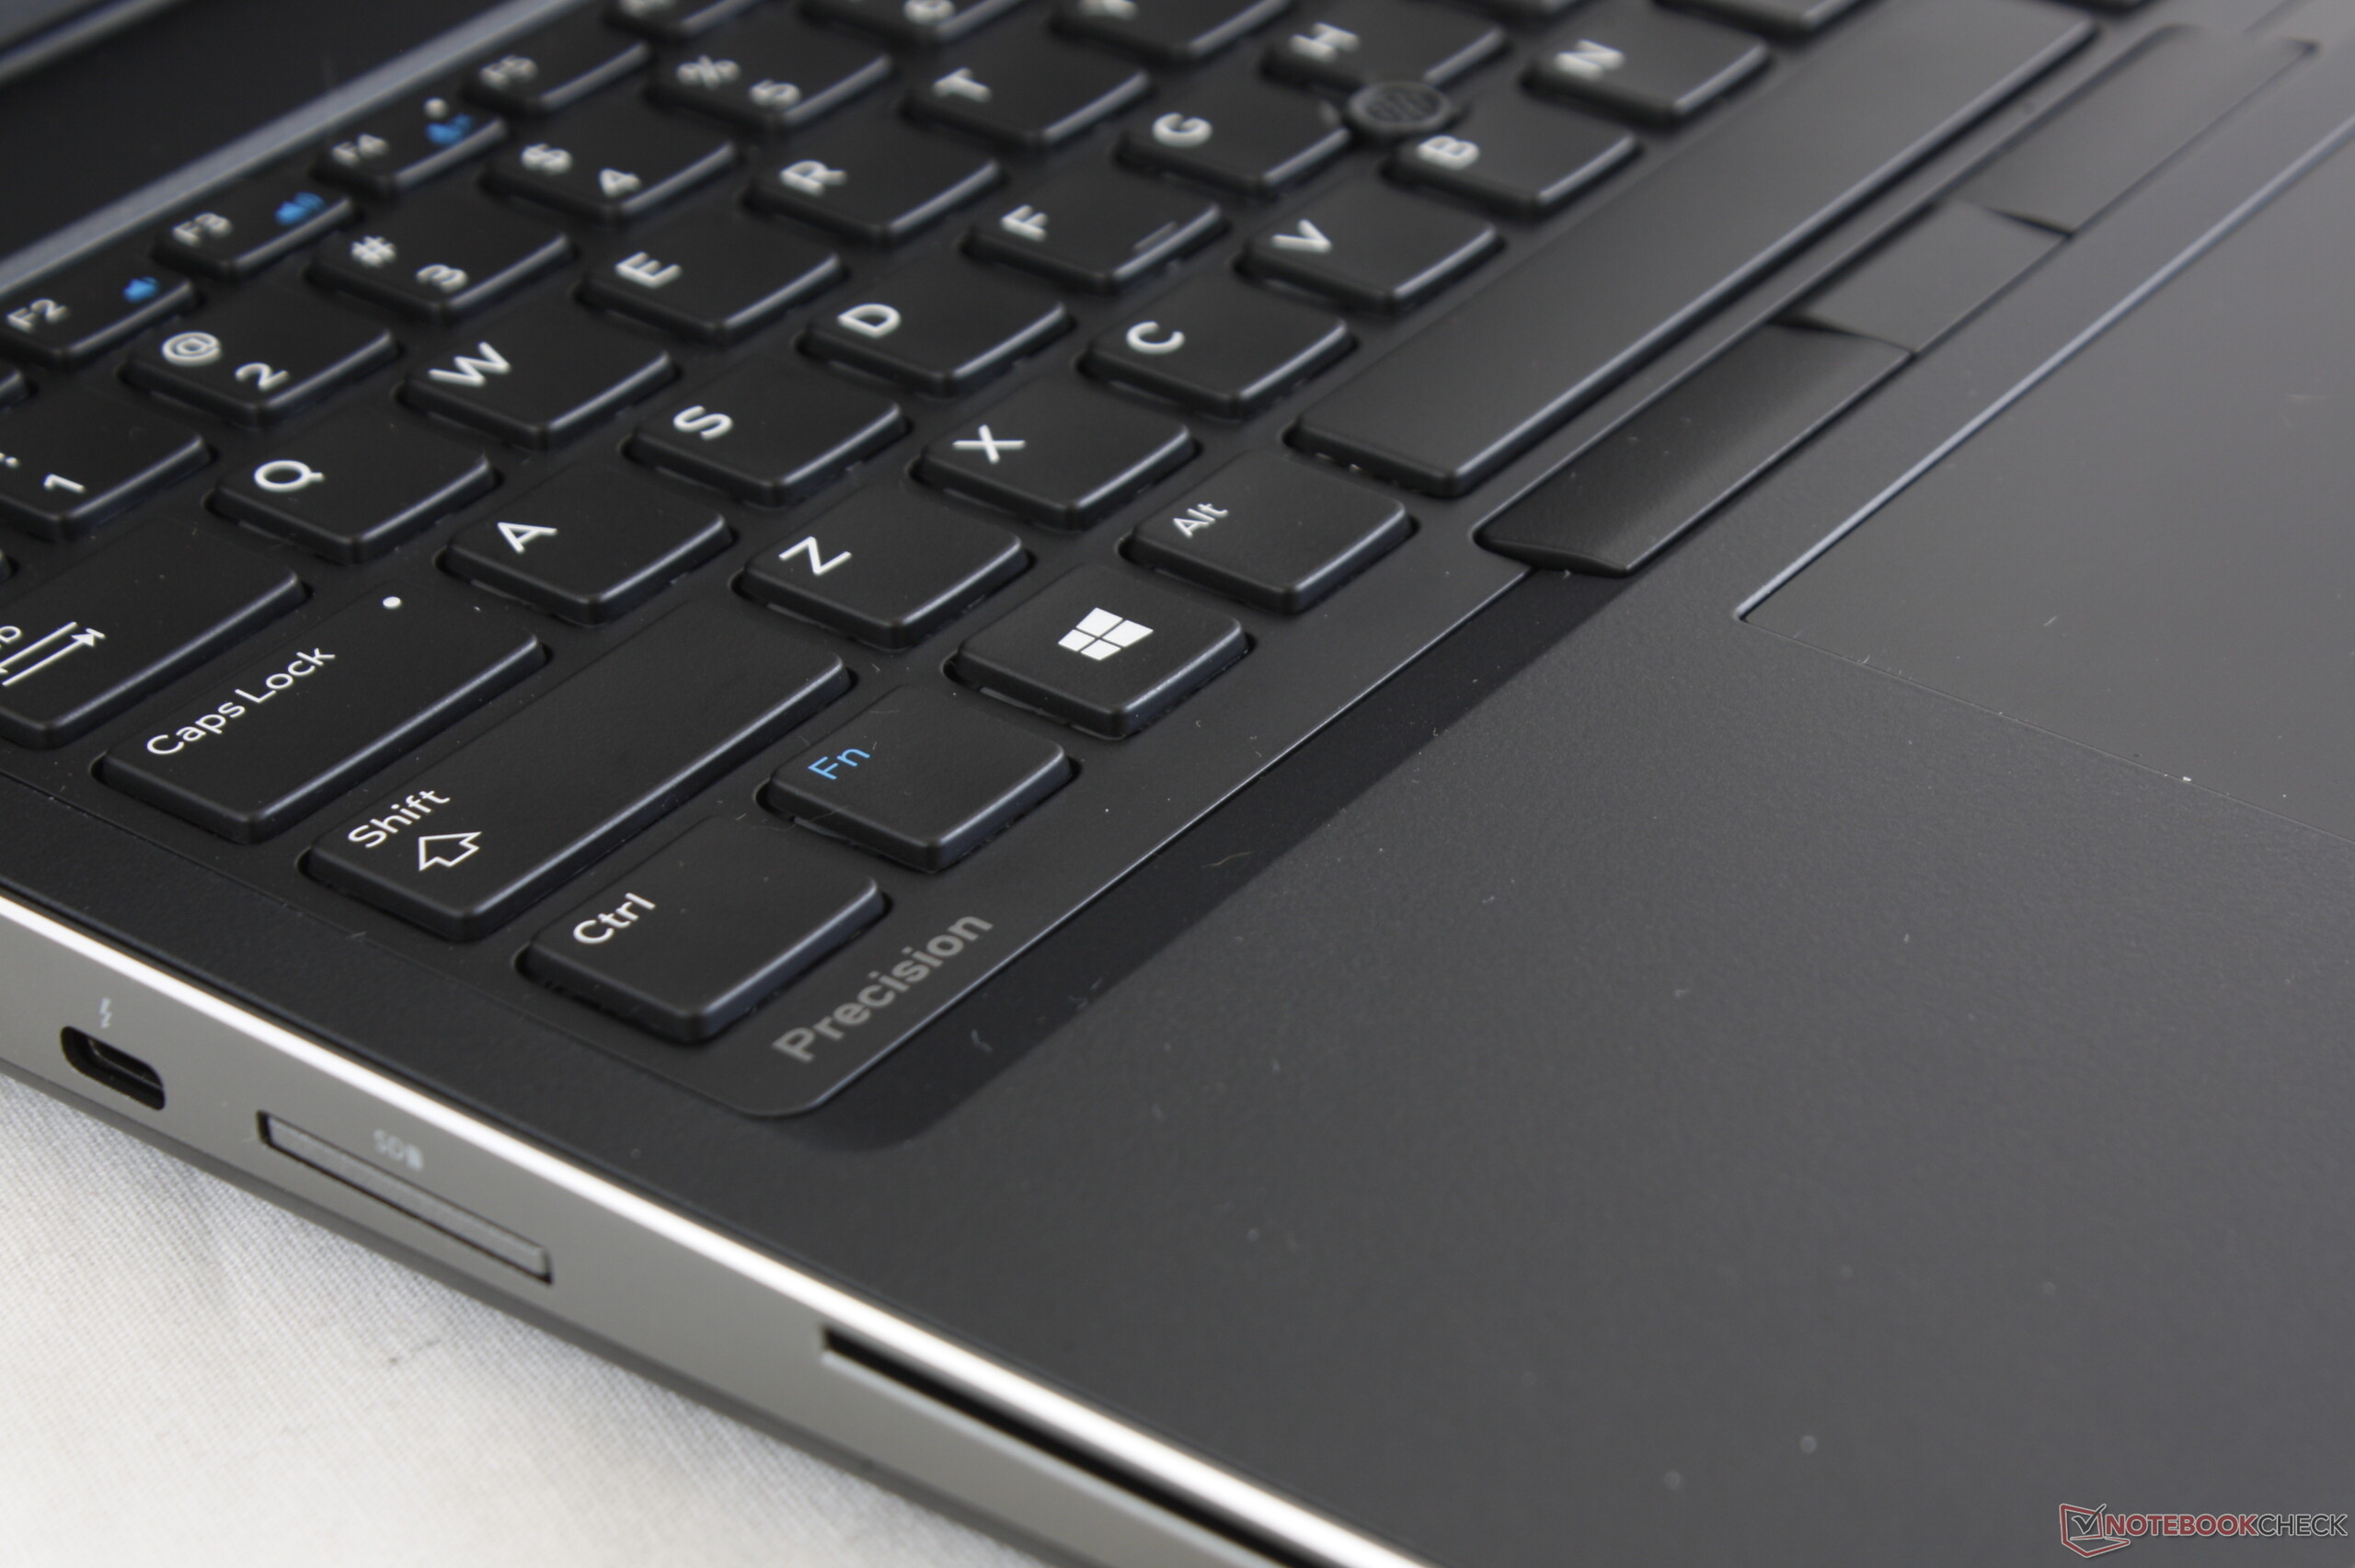
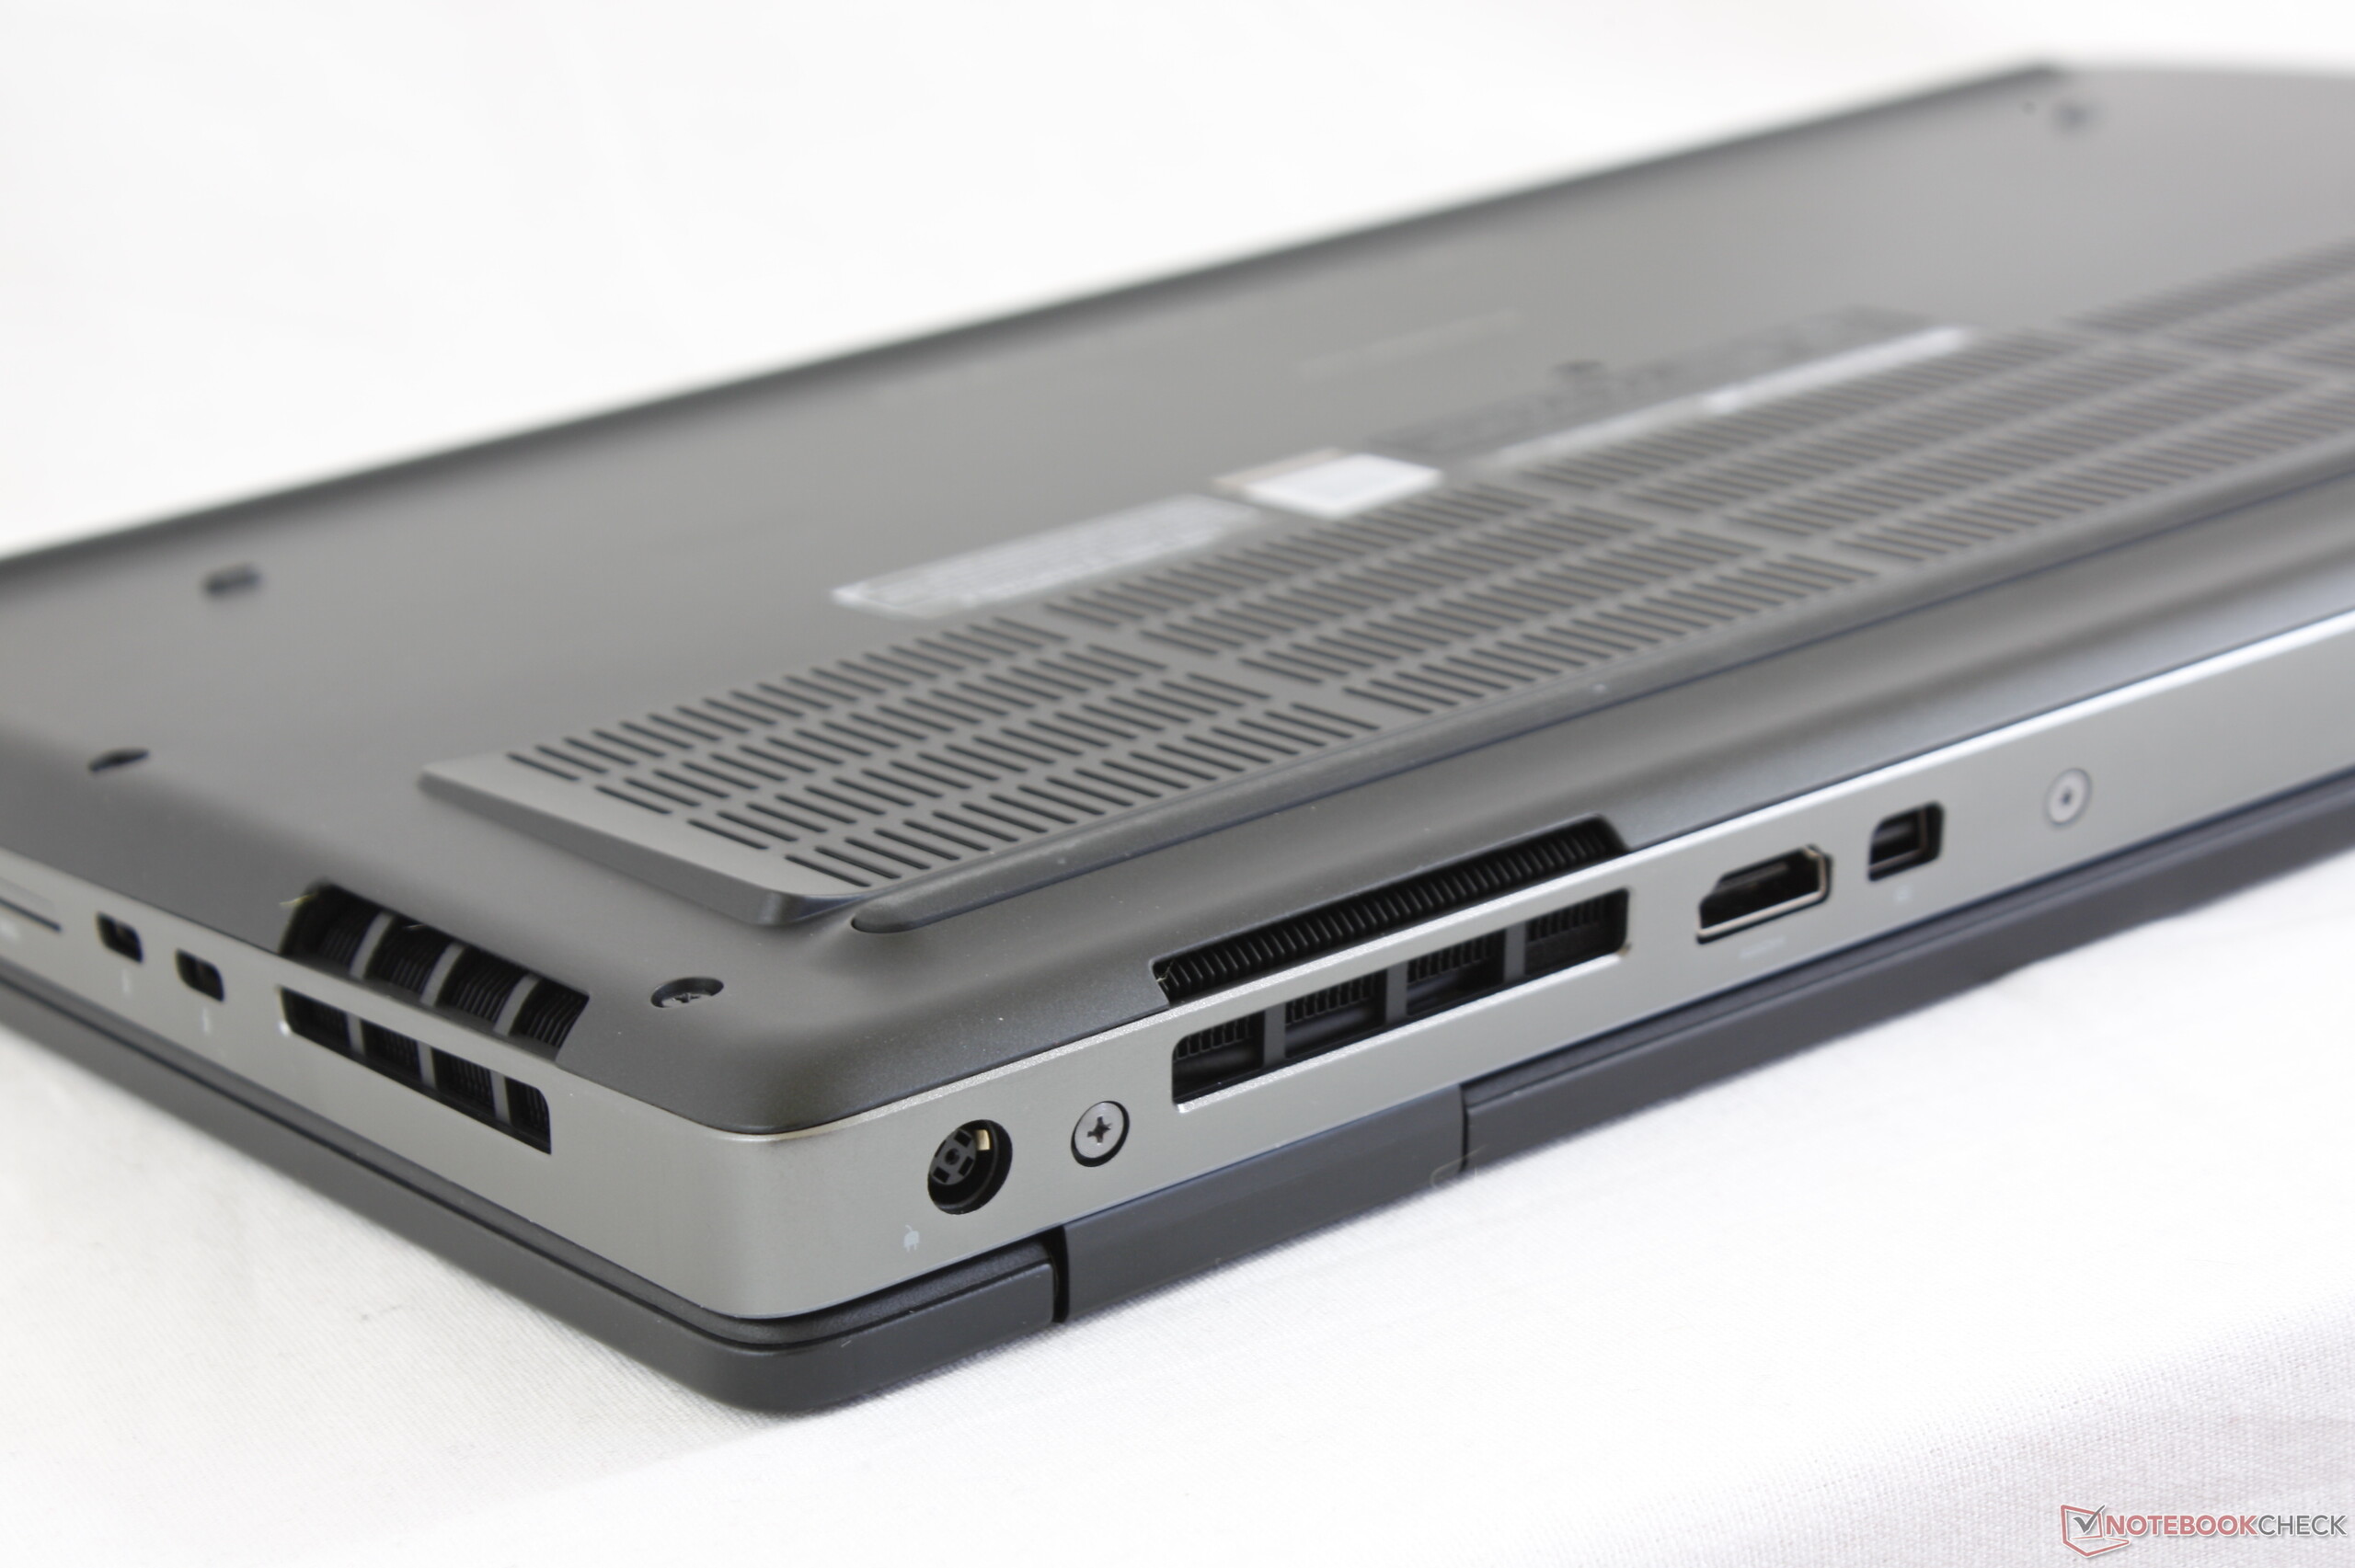
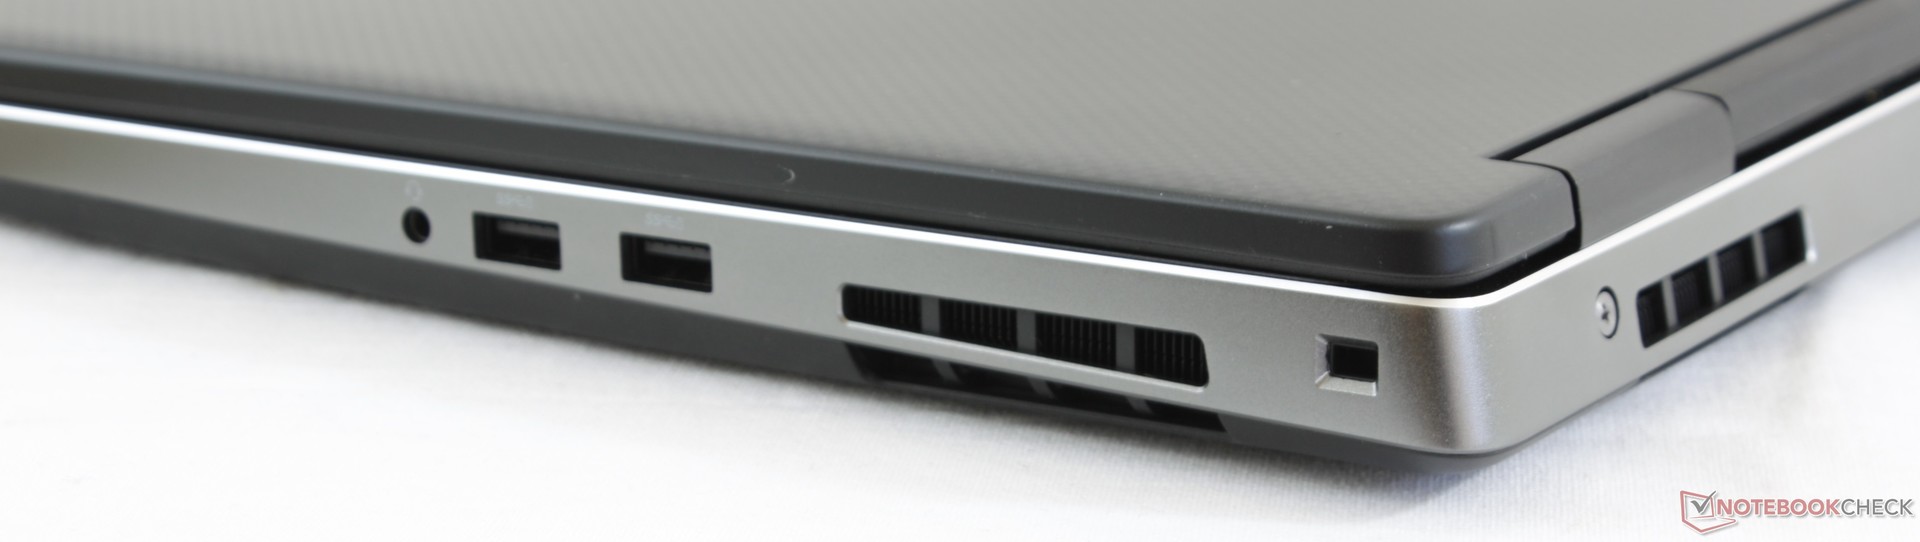
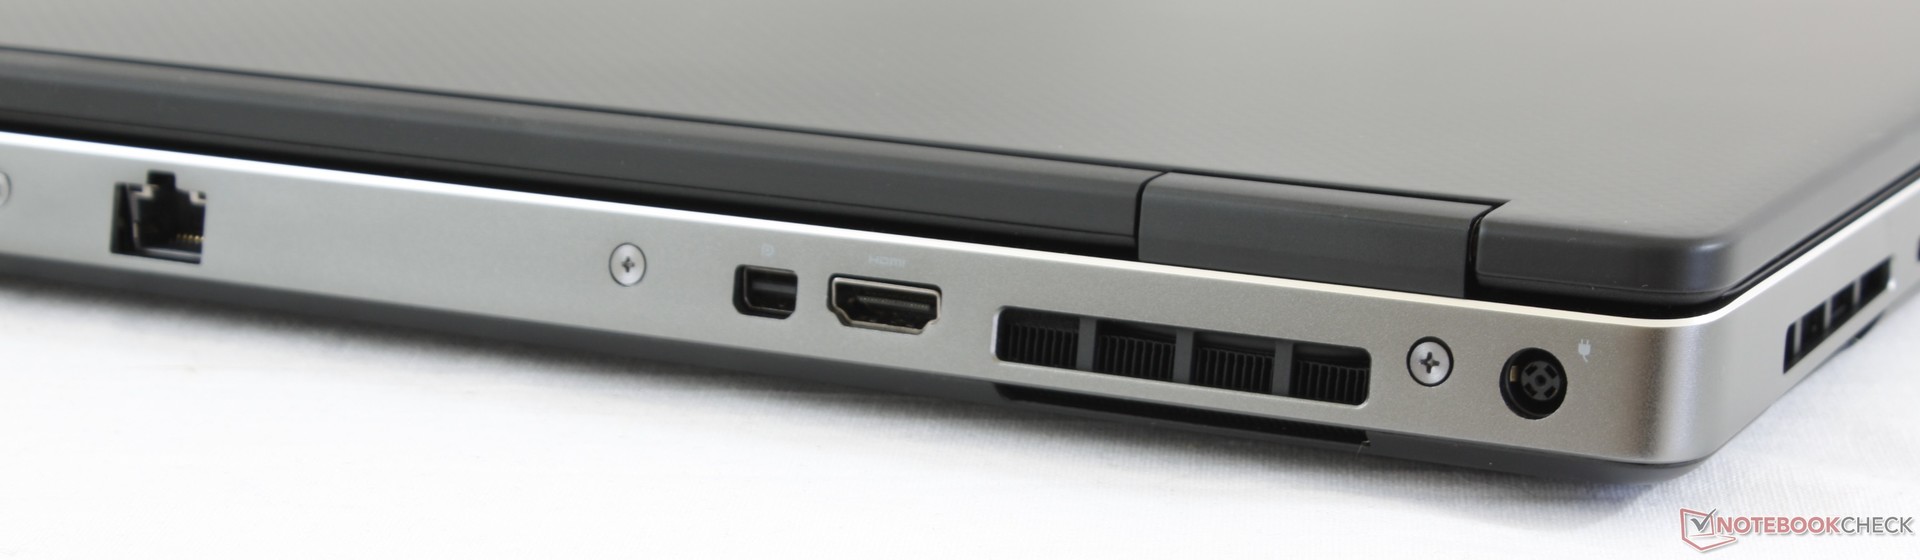
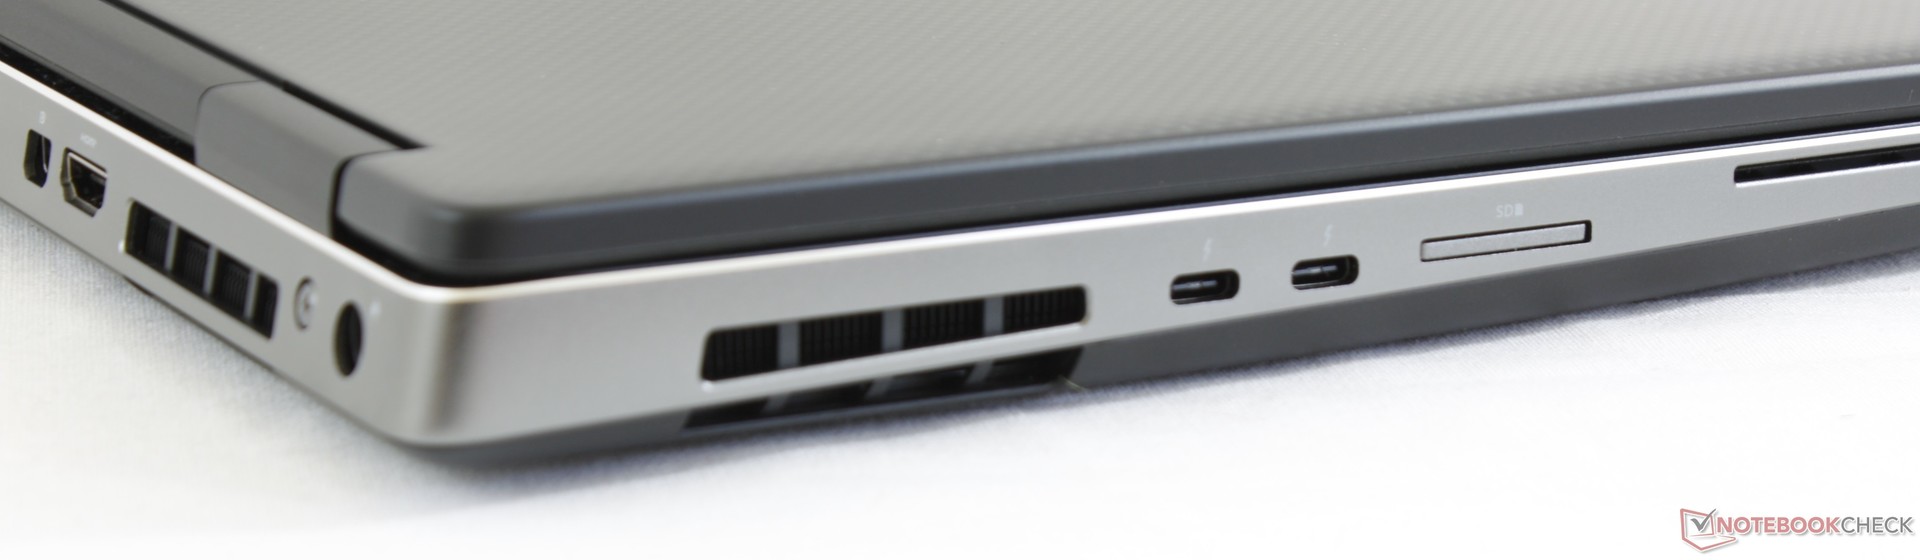
När det gäller anslutbarhet tycker vi definitivt att den kunde haft fler än bara 2 st USB Typ A-portar när den äldre Precision 7510 hade dubbelt så många. Kan du se bortom dessa brister är Precision 7530 ändå ett steg uppåt både i fråga om estetik och prestanda jämfört med sina föregångare.
Core i9 var en aning mer än vad Precision 7530 kunde hantera. För att få en mer balanserad maskin vore det bättre att välja en konfiguration med Core i7-8750H eller Xeon E-2176M. Detta är ett välbyggt kraftpaket till arbetsstation med ett alternativ för 128 GB RAM som de flesta andra arbetsstationer på marknaden inte har.
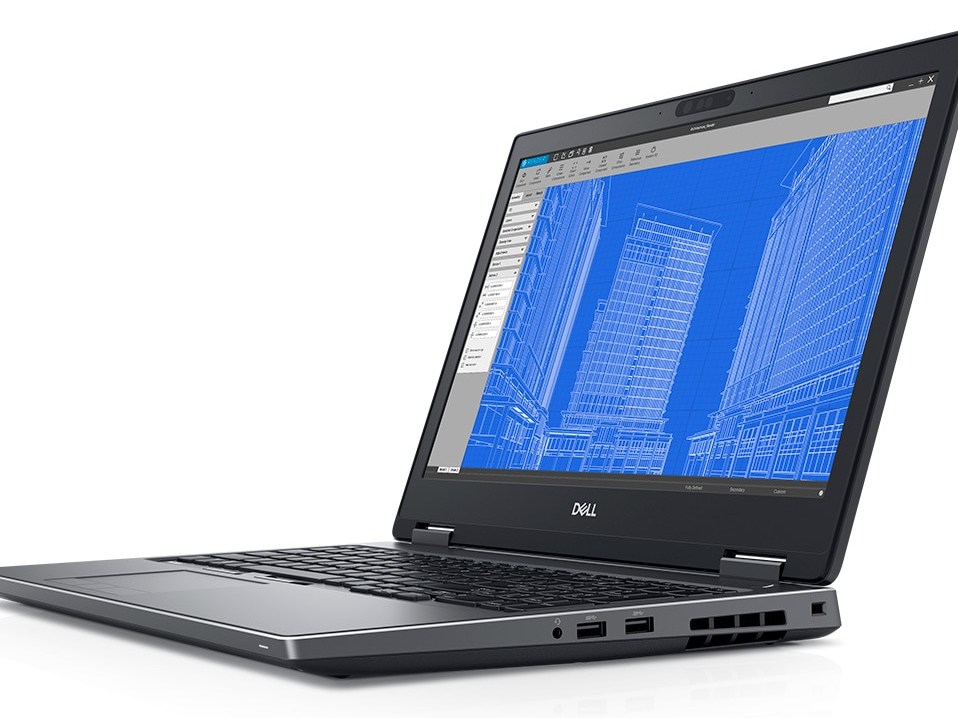
Dell Precision 7530
- 10/25/2019 v7 (old)
Allen Ngo
Price comparison
