Test: Lenovo ThinkPad P1 (Xeon E-2176M, Quadro P2000 Max-Q) Arbetsstation (Sammanfattning)
| SD Card Reader | |
| average JPG Copy Test (av. of 3 runs) | |
| Lenovo ThinkPad X1 Carbon 2018-20KGS03900 (Toshiba Exceria Pro M501) | |
| Lenovo ThinkPad X1 Extreme-20MF000XGE (Toshiba Exceria Pro SDXC 64 GB UHS-II) | |
| Lenovo ThinkPad P1-20MD002LUS (Toshiba Exceria Pro SDXC 64 GB UHS-II) | |
| Dell Precision 5530 Xeon E-2176M (Toshiba Exceria Pro SDXC 64 GB UHS-II) | |
| HP EliteBook 1050 G1-4QY20EA (Toshiba Exceria Pro SDXC 64 GB UHS-II) | |
| Genomsnitt av klass Workstation (49.6 - 681, n=14, senaste 2 åren) | |
| maximum AS SSD Seq Read Test (1GB) | |
| Lenovo ThinkPad X1 Extreme-20MF000XGE (Toshiba Exceria Pro SDXC 64 GB UHS-II) | |
| Lenovo ThinkPad P1-20MD002LUS (Toshiba Exceria Pro SDXC 64 GB UHS-II) | |
| Lenovo ThinkPad X1 Carbon 2018-20KGS03900 (Toshiba Exceria Pro M501) | |
| Genomsnitt av klass Workstation (87.6 - 1455, n=14, senaste 2 åren) | |
| HP EliteBook 1050 G1-4QY20EA (Toshiba Exceria Pro SDXC 64 GB UHS-II) | |
| Dell Precision 5530 Xeon E-2176M (Toshiba Exceria Pro SDXC 64 GB UHS-II) | |
| |||||||||||||||||||||||||
Distribution av ljusstyrkan: 85 %
Mitt på batteriet: 397.6 cd/m²
Kontrast: 1590:1 (Svärta: 0.25 cd/m²)
ΔE ColorChecker Calman: 4.95 | ∀{0.5-29.43 Ø4.71}
calibrated: 4.22
ΔE Greyscale Calman: 5.1 | ∀{0.09-98 Ø4.96}
100% sRGB (Argyll 1.6.3 3D)
87.6% AdobeRGB 1998 (Argyll 1.6.3 3D)
99.1% AdobeRGB 1998 (Argyll 3D)
99.9% sRGB (Argyll 3D)
86.4% Display P3 (Argyll 3D)
Gamma: 2.234
CCT: 7543 K
| Lenovo ThinkPad P1-20MD002LUS B156ZAN03.2, IPS, 15.6", 3840x2160 | Lenovo ThinkPad X1 Extreme-20MF000XGE B156ZAN03.2, IPS, 15.6", 3840x2160 | Dell Precision 5530 Xeon E-2176M Sharp SHP148D / LQ156D1, IGZO, 15.6", 3840x2160 | HP EliteBook 1050 G1-4QY20EA AUO30EB, IPS LED, 15.6", 3840x2160 | Apple MacBook Pro 15 2018 (2.6 GHz, 560X) APPA040, IPS, 15.4", 2880x1800 | |
|---|---|---|---|---|---|
| Display | 0% | -12% | -20% | 0% | |
| Display P3 Coverage (%) | 86.4 | 86.3 0% | 76.5 -11% | 67.8 -22% | 98.7 14% |
| sRGB Coverage (%) | 99.9 | 100 0% | 98.4 -2% | 94.1 -6% | 99.9 0% |
| AdobeRGB 1998 Coverage (%) | 99.1 | 99.4 0% | 76.4 -23% | 67.9 -31% | 86.6 -13% |
| Response Times | -8% | 3% | 3% | 11% | |
| Response Time Grey 50% / Grey 80% * (ms) | 55.6 ? | 61.6 ? -11% | 48 ? 14% | 56 ? -1% | 43.2 ? 22% |
| Response Time Black / White * (ms) | 30.8 ? | 32 ? -4% | 33.6 ? -9% | 29 ? 6% | 31.2 ? -1% |
| PWM Frequency (Hz) | 1000 | 117000 ? | |||
| Screen | 8% | 2% | 0% | 27% | |
| Brightness middle (cd/m²) | 397.6 | 396 0% | 451.7 14% | 440 11% | 520 31% |
| Brightness (cd/m²) | 396 | 380 -4% | 440 11% | 389 -2% | 492 24% |
| Brightness Distribution (%) | 85 | 90 6% | 90 6% | 83 -2% | 88 4% |
| Black Level * (cd/m²) | 0.25 | 0.28 -12% | 0.4 -60% | 0.34 -36% | 0.39 -56% |
| Contrast (:1) | 1590 | 1414 -11% | 1129 -29% | 1294 -19% | 1333 -16% |
| Colorchecker dE 2000 * | 4.95 | 4 19% | 3.11 37% | 5.04 -2% | 1.2 76% |
| Colorchecker dE 2000 max. * | 10.23 | 7.6 26% | 8.62 16% | 6.99 32% | 2.3 78% |
| Colorchecker dE 2000 calibrated * | 4.22 | 0.9 79% | 3.07 27% | 2.04 52% | |
| Greyscale dE 2000 * | 5.1 | 6.1 -20% | 3.7 27% | 4.98 2% | 1.3 75% |
| Gamma | 2.234 98% | 2.25 98% | 2.11 104% | 2.48 89% | 2.18 101% |
| CCT | 7543 86% | 7786 83% | 6492 100% | 7777 84% | 6738 96% |
| Color Space (Percent of AdobeRGB 1998) (%) | 87.6 | 88.5 1% | 69 -21% | 61 -30% | |
| Color Space (Percent of sRGB) (%) | 100 | 100 0% | 98 -2% | 94 -6% | |
| Totalt genomsnitt (program/inställningar) | 0% /
4% | -2% /
-0% | -6% /
-3% | 13% /
18% |
* ... mindre är bättre
Visa svarstider
| ↔ Svarstid svart till vitt | ||
|---|---|---|
| 30.8 ms ... stiga ↗ och falla ↘ kombinerat | ↗ 16.4 ms stiga | 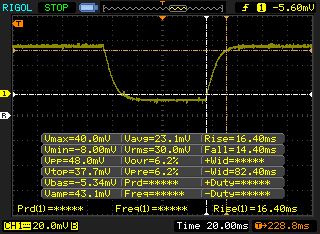 |
| ↘ 14.4 ms hösten | ||
| Skärmen visar långsamma svarsfrekvenser i våra tester och kommer att vara otillfredsställande för spelare. I jämförelse sträcker sig alla testade enheter från 0.1 (minst) till 240 (maximalt) ms. » 83 % av alla enheter är bättre. Detta innebär att den uppmätta svarstiden är sämre än genomsnittet av alla testade enheter (19.8 ms). | ||
| ↔ Svarstid 50 % grått till 80 % grått | ||
| 55.6 ms ... stiga ↗ och falla ↘ kombinerat | ↗ 38 ms stiga | 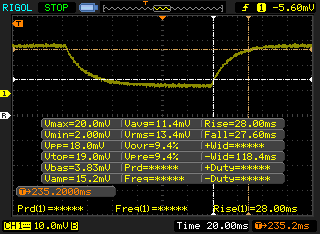 |
| ↘ 37.6 ms hösten | ||
| Skärmen visar långsamma svarsfrekvenser i våra tester och kommer att vara otillfredsställande för spelare. I jämförelse sträcker sig alla testade enheter från 0.165 (minst) till 636 (maximalt) ms. » 92 % av alla enheter är bättre. Detta innebär att den uppmätta svarstiden är sämre än genomsnittet av alla testade enheter (31 ms). | ||
Skärmflimmer / PWM (Puls-Width Modulation)
| Skärmflimmer / PWM upptäcktes inte | 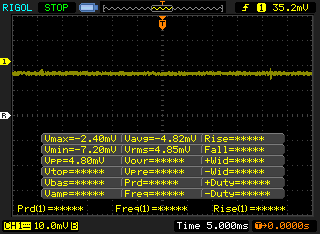 | ||
Som jämförelse: 52 % av alla testade enheter använder inte PWM för att dämpa skärmen. Om PWM upptäcktes mättes ett medelvärde av 7754 (minst: 5 - maximum: 343500) Hz. | |||
| PCMark 8 Home Score Accelerated v2 | 3536 poäng | |
| PCMark 8 Creative Score Accelerated v2 | 4832 poäng | |
| PCMark 8 Work Score Accelerated v2 | 4404 poäng | |
| PCMark 10 Score | 4618 poäng | |
Hjälp | ||
| Lenovo ThinkPad P1-20MD002LUS Samsung SSD PM981 MZVLB2T0HMLB | Lenovo ThinkPad X1 Extreme-20MF000XGE Samsung SSD PM981 MZVLB1T0HALR | Dell Precision 5530 Xeon E-2176M SK hynix PC400 512 GB | HP EliteBook 1050 G1-4QY20EA Toshiba XG5-P KXG50PNV2T04 | Apple MacBook Pro 15 2018 (2.6 GHz, 560X) Apple SSD AP0512 | Genomsnitt Samsung SSD PM981 MZVLB2T0HMLB | |
|---|---|---|---|---|---|---|
| AS SSD | 19% | -37% | -38% | -97% | 4% | |
| Score Total (Points) | 4784 | 5355 12% | 2922 -39% | 2768 -42% | 2119 -56% | 4881 ? 2% |
| Score Write (Points) | 2200 | 2147 -2% | 1121 -49% | 1153 -48% | 347 -84% | 2139 ? -3% |
| Score Read (Points) | 1722 | 2132 24% | 1226 -29% | 1120 -35% | 1199 -30% | 1828 ? 6% |
| Access Time Write * (ms) | 0.032 | 0.028 12% | 0.053 -66% | 0.056 -75% | 0.0295 ? 8% | |
| Access Time Read * (ms) | 0.038 | 0.034 11% | 0.073 -92% | 0.051 -34% | 0.225 -492% | 0.0485 ? -28% |
| 4K-64 Write (MB/s) | 1866 | 1782 -5% | 926 -50% | 953 -49% | 163.5 -91% | 1789 ? -4% |
| 4K-64 Read (MB/s) | 1450 | 1805 24% | 970 -33% | 856 -41% | 965 -33% | 1527 ? 5% |
| 4K Write (MB/s) | 118.4 | 130.9 11% | 92.8 -22% | 105.4 -11% | 18.78 -84% | 128.8 ? 9% |
| 4K Read (MB/s) | 28.61 | 56.8 99% | 38.43 34% | 19.07 -33% | 9.46 -67% | 39.1 ? 37% |
| Seq Write (MB/s) | 2155 | 2336 8% | 1022 -53% | 948 -56% | 1644 -24% | 2217 ? 3% |
| Seq Read (MB/s) | 2440 | 2703 11% | 2169 -11% | 2454 1% | 2239 -8% | 2628 ? 8% |
* ... mindre är bättre

| 3DMark 06 Standard Score | 31482 poäng | |
| 3DMark Vantage P Result | 32724 poäng | |
| 3DMark 11 Performance | 8363 poäng | |
| 3DMark Ice Storm Standard Score | 23769 poäng | |
| 3DMark Cloud Gate Standard Score | 14996 poäng | |
| 3DMark Fire Strike Score | 5958 poäng | |
| 3DMark Fire Strike Extreme Score | 3104 poäng | |
| 3DMark Time Spy Score | 2206 poäng | |
Hjälp | ||
| SPECviewperf 13 | |
| Solidworks (sw-04) | |
| Lenovo ThinkPad P52 20MAS03N00 | |
| Lenovo ThinkPad P1-20MD002LUS | |
| Siemens NX (snx-03) | |
| Lenovo ThinkPad P52 20MAS03N00 | |
| Lenovo ThinkPad P1-20MD002LUS | |
| Showcase (showcase-02) | |
| Lenovo ThinkPad P1-20MD002LUS | |
| Lenovo ThinkPad P52 20MAS03N00 | |
| Medical (medical-02) | |
| Lenovo ThinkPad P1-20MD002LUS | |
| Lenovo ThinkPad P52 20MAS03N00 | |
| Maya (maya-05) | |
| Lenovo ThinkPad P1-20MD002LUS | |
| Lenovo ThinkPad P52 20MAS03N00 | |
| Energy (energy-02) | |
| Lenovo ThinkPad P1-20MD002LUS | |
| Lenovo ThinkPad P52 20MAS03N00 | |
| Creo (creo-02) | |
| Lenovo ThinkPad P1-20MD002LUS | |
| Lenovo ThinkPad P52 20MAS03N00 | |
| Catia (catia-05) | |
| Lenovo ThinkPad P1-20MD002LUS | |
| Lenovo ThinkPad P52 20MAS03N00 | |
| 3ds Max (3dsmax-06) | |
| Lenovo ThinkPad P1-20MD002LUS | |
| Lenovo ThinkPad P52 20MAS03N00 | |
| låg | med. | hög | ultra | 4K | |
|---|---|---|---|---|---|
| Sleeping Dogs (2012) | 197 | 135 | 133 | 46 | |
| BioShock Infinite (2013) | 264 | 192 | 168 | 65 | |
| Metro: Last Light (2013) | 122 | 111 | 84 | 46 | |
| GRID 2 (2013) | 194 | 132 | 117 | 85 | |
| Company of Heroes 2 (2013) | 72 | 65 | 54 | 27 | |
| Total War: Rome II (2013) | 241 | 177 | 142 | 21 | |
| Thief (2014) | 57 | 54 | 51 | 44 | |
| Dirt Rally (2015) | 234 | 131 | 88 | 73 | 49 |
| The Witcher 3 (2015) | 106 | 73 | 32 | 25 | 12 |
| Batman: Arkham Knight (2015) | 100 | 92 | 59 | 58 | 17 |
| Metal Gear Solid V (2015) | 60 | 60 | 60 | 60 | 28 |
| Rise of the Tomb Raider (2016) | 44 | 40 | 36 | 32 | 15 |
| Ashes of the Singularity (2016) | 54.5 | 39.6 | 34.9 | 13 | |
| Doom (2016) | 103 | 104 | 63 | 61 | 20 |
| Deus Ex Mankind Divided (2016) | 70 | 53 | 31 | 16 | 10 |
| Prey (2017) | 140 | 111 | 109 | 109 | 36 |
| Middle-earth: Shadow of War (2017) | 67 | 49 | 38 | 29 | 13 |
| F1 2018 (2018) | 118 | 72 | 72 | 40 | 24 |
| Shadow of the Tomb Raider (2018) | 79 | 33 | 30 | 23 | 3 |
| Shadow of the Tomb Raider | |
| 1280x720 Lowest Preset | |
| Lenovo ThinkPad X1 Extreme-20MF000XGE | |
| Apple MacBook Pro 15 2018 (2.6 GHz, 560X) | |
| Lenovo ThinkPad P1-20MD002LUS | |
| 1920x1080 Medium Preset | |
| Lenovo ThinkPad X1 Extreme-20MF000XGE | |
| Lenovo ThinkPad P1-20MD002LUS | |
| Apple MacBook Pro 15 2018 (2.6 GHz, 560X) | |
| 1920x1080 High Preset AA:SM | |
| Lenovo ThinkPad X1 Extreme-20MF000XGE | |
| Lenovo ThinkPad P1-20MD002LUS | |
| Apple MacBook Pro 15 2018 (2.6 GHz, 560X) | |
| 1920x1080 Highest Preset AA:T | |
| Lenovo ThinkPad X1 Extreme-20MF000XGE | |
| Apple MacBook Pro 15 2018 (2.6 GHz, 560X) | |
| Lenovo ThinkPad P1-20MD002LUS | |
| 3840x2160 Highest Preset AA:T | |
| Lenovo ThinkPad X1 Extreme-20MF000XGE | |
| Apple MacBook Pro 15 2018 (2.6 GHz, 560X) | |
| Lenovo ThinkPad P1-20MD002LUS | |
| Batman: Arkham Knight | |
| 1280x720 Low / Off AF:Trilinear | |
| Dell Precision 5530 Xeon E-2176M | |
| Lenovo ThinkPad P1-20MD002LUS | |
| 1366x768 Normal / Off AF:4x | |
| Dell Precision 5530 Xeon E-2176M | |
| Lenovo ThinkPad P1-20MD002LUS | |
| 1920x1080 High / On (Interactive Smoke & Paper Debris Off) AA:SM AF:8x | |
| MSI WS63 7RF-290US | |
| Lenovo ThinkPad P1-20MD002LUS | |
| Dell Precision 5530 Xeon E-2176M | |
| 1920x1080 High / On AA:SM AF:16x | |
| Eurocom Tornado F5W | |
| Lenovo ThinkPad P1-20MD002LUS | |
| MSI WS63 7RF-290US | |
| Dell Precision 5530 Xeon E-2176M | |
| 3840x2160 High / On (Interactive Smoke & Paper Debris Off) AA:SM AF:8x | |
| Dell Precision 5530 Xeon E-2176M | |
| Lenovo ThinkPad P1-20MD002LUS | |
| Prey | |
| 1280x720 Low Preset AF:2x | |
| Lenovo ThinkPad P1-20MD002LUS | |
| Dell Precision 5530 Xeon E-2176M | |
| 1366x768 Medium Preset AA:FX AF:4x | |
| Dell Precision 5530 Xeon E-2176M | |
| 1920x1080 High Preset AA:2TX SM AF:8x | |
| Lenovo ThinkPad P1-20MD002LUS | |
| Dell Precision 5530 Xeon E-2176M | |
| 1920x1080 Very High Preset AA:2TX SM AF:16x | |
| Lenovo ThinkPad P1-20MD002LUS | |
| MSI WS63 7RF-290US | |
| Dell Precision 5530 Xeon E-2176M | |
| 3840x2160 High Preset AA:2TX SM AF:8x | |
| Lenovo ThinkPad P1-20MD002LUS | |
| Dell Precision 5530 Xeon E-2176M | |
Ljudnivå
| Låg belastning |
| 28.4 / 28.4 / 29.2 dB(A) |
| Hög belastning |
| 41.8 / 41.8 dB(A) |
 | ||
30 dB tyst 40 dB(A) hörbar 50 dB(A) högt ljud |
||
min: | ||
| Lenovo ThinkPad P1-20MD002LUS Quadro P2000 Max-Q, E-2176M, Samsung SSD PM981 MZVLB2T0HMLB | Lenovo ThinkPad X1 Extreme-20MF000XGE GeForce GTX 1050 Ti Max-Q, i7-8750H, Samsung SSD PM981 MZVLB1T0HALR | Dell Precision 5530 Xeon E-2176M Quadro P2000, E-2176M, SK hynix PC400 512 GB | HP EliteBook 1050 G1-4QY20EA GeForce GTX 1050 Max-Q, i7-8750H, Toshiba XG5-P KXG50PNV2T04 | Lenovo ThinkPad X1 Carbon 2018-20KGS03900 UHD Graphics 620, i5-8550U, Samsung SSD PM981 MZVLB512HAJQ | Apple MacBook Pro 15 2018 (2.6 GHz, 560X) Radeon Pro 560X, i7-8850H, Apple SSD AP0512 | |
|---|---|---|---|---|---|---|
| Noise | 2% | -5% | -6% | 3% | -5% | |
| av / miljö * (dB) | 28.3 | 28.8 -2% | 28.4 -0% | 30.25 -7% | 28.9 -2% | 29.6 -5% |
| Idle Minimum * (dB) | 28.4 | 28.8 -1% | 28.4 -0% | 30.25 -7% | 28.9 -2% | 30.1 -6% |
| Idle Average * (dB) | 28.4 | 28.8 -1% | 28.4 -0% | 30.25 -7% | 28.9 -2% | 30.1 -6% |
| Idle Maximum * (dB) | 29.2 | 31.3 -7% | 28.4 3% | 31.8 -9% | 32.5 -11% | 30.1 -3% |
| Load Average * (dB) | 41.8 | 36.4 13% | 46.5 -11% | 44.7 -7% | 35.1 16% | 46.8 -12% |
| Witcher 3 ultra * (dB) | 39.1 | 36.4 7% | 46.5 -19% | 36 8% | ||
| Load Maximum * (dB) | 41.8 | 39.2 6% | 46.5 -11% | 42 -0% | 35.1 16% | 46.8 -12% |
* ... mindre är bättre
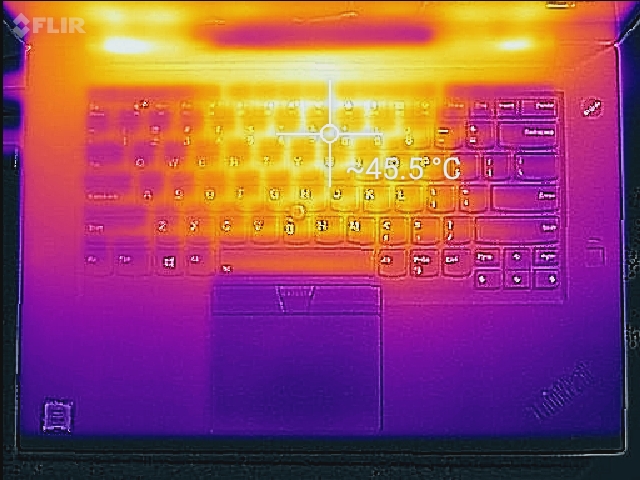
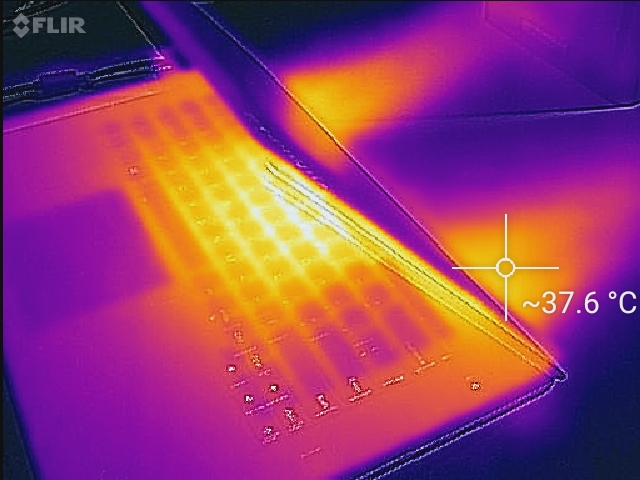
(±) Den maximala temperaturen på ovansidan är 43.4 °C / 110 F, jämfört med genomsnittet av 38.2 °C / 101 F , allt från 22.2 till 69.8 °C för klassen Workstation.
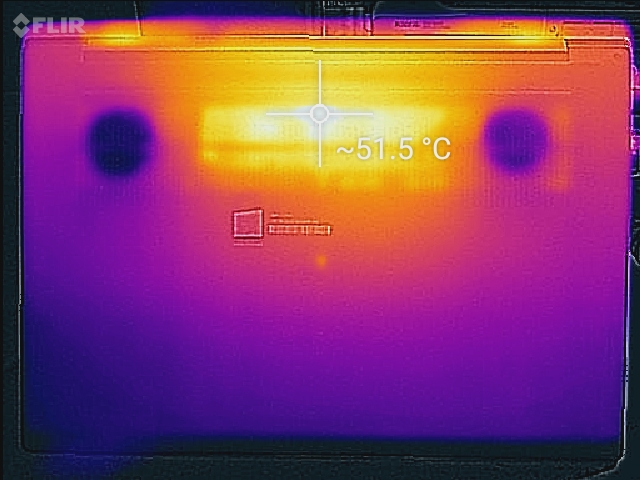
(-) Botten värms upp till maximalt 50 °C / 122 F, jämfört med genomsnittet av 41.1 °C / 106 F
(+) Vid tomgångsbruk är medeltemperaturen för ovansidan 24.8 °C / 77 F, jämfört med enhetsgenomsnittet på 32 °C / ### class_avg_f### F.
(±) När du spelar The Witcher 3 är medeltemperaturen för ovansidan 33.9 °C / 93 F, jämfört med enhetsgenomsnittet på 32 °C / ## #class_avg_f### F.
(+) Handledsstöden och pekplattan är kallare än hudtemperaturen med maximalt 28.8 °C / 83.8 F och är därför svala att ta på.
(±) Medeltemperaturen för handledsstödsområdet på liknande enheter var 27.8 °C / 82 F (-1 °C / -1.8 F).
Lenovo ThinkPad P1-20MD002LUS ljudanalys
(±) | högtalarljudstyrkan är genomsnittlig men bra (73.7 dB)
Bas 100 - 315 Hz
(±) | reducerad bas - i genomsnitt 10.1% lägre än medianen
(±) | linjäriteten för basen är genomsnittlig (12.3% delta till föregående frekvens)
Mellan 400 - 2000 Hz
(±) | högre mellan - i genomsnitt 5.9% högre än median
(±) | linjäriteten för mids är genomsnittlig (8.9% delta till föregående frekvens)
Högsta 2 - 16 kHz
(+) | balanserade toppar - endast 2% från medianen
(+) | toppar är linjära (5.1% delta till föregående frekvens)
Totalt 100 - 16 000 Hz
(±) | linjäriteten för det totala ljudet är genomsnittlig (21.8% skillnad mot median)
Jämfört med samma klass
» 77% av alla testade enheter i den här klassen var bättre, 6% liknande, 17% sämre
» Den bästa hade ett delta på 7%, genomsnittet var 17%, sämst var 35%
Jämfört med alla testade enheter
» 62% av alla testade enheter var bättre, 7% liknande, 31% sämre
» Den bästa hade ett delta på 4%, genomsnittet var 23%, sämst var 134%
Apple MacBook Pro 15 2018 (2.6 GHz, 560X) ljudanalys
(+) | högtalare kan spela relativt högt (85 dB)
Bas 100 - 315 Hz
(+) | bra bas - bara 4.7% från medianen
(±) | linjäriteten för basen är genomsnittlig (8.3% delta till föregående frekvens)
Mellan 400 - 2000 Hz
(+) | balanserad mellan - endast 1.8% från medianen
(+) | mids är linjära (3.5% delta till föregående frekvens)
Högsta 2 - 16 kHz
(+) | balanserade toppar - endast 2.6% från medianen
(+) | toppar är linjära (5.7% delta till föregående frekvens)
Totalt 100 - 16 000 Hz
(+) | det totala ljudet är linjärt (6.4% skillnad mot median)
Jämfört med samma klass
» 4% av alla testade enheter i den här klassen var bättre, 1% liknande, 95% sämre
» Den bästa hade ett delta på 5%, genomsnittet var 17%, sämst var 45%
Jämfört med alla testade enheter
» 1% av alla testade enheter var bättre, 0% liknande, 99% sämre
» Den bästa hade ett delta på 4%, genomsnittet var 23%, sämst var 134%
| Av/Standby | |
| Låg belastning | |
| Hög belastning |
|
Förklaring:
min: | |
| Lenovo ThinkPad P1-20MD002LUS E-2176M, Quadro P2000 Max-Q, Samsung SSD PM981 MZVLB2T0HMLB, IPS, 3840x2160, 15.6" | Lenovo ThinkPad X1 Extreme-20MF000XGE i7-8750H, GeForce GTX 1050 Ti Max-Q, Samsung SSD PM981 MZVLB1T0HALR, IPS, 3840x2160, 15.6" | Dell Precision 5530 Xeon E-2176M E-2176M, Quadro P2000, SK hynix PC400 512 GB, IGZO, 3840x2160, 15.6" | HP EliteBook 1050 G1-4QY20EA i7-8750H, GeForce GTX 1050 Max-Q, Toshiba XG5-P KXG50PNV2T04, IPS LED, 3840x2160, 15.6" | Apple MacBook Pro 15 2018 (2.6 GHz, 560X) i7-8850H, Radeon Pro 560X, Apple SSD AP0512, IPS, 2880x1800, 15.4" | |
|---|---|---|---|---|---|
| Power Consumption | -11% | -18% | 5% | 17% | |
| Idle Minimum * (Watt) | 7.1 | 7.6 -7% | 9.8 -38% | 6.1 14% | 3.4 52% |
| Idle Average * (Watt) | 14.4 | 14.8 -3% | 16.8 -17% | 10.2 29% | 11 24% |
| Idle Maximum * (Watt) | 14.6 | 17.6 -21% | 16.9 -16% | 13.4 8% | 14.9 -2% |
| Load Average * (Watt) | 93.9 | 86 8% | 102.3 -9% | 82 13% | 78.9 16% |
| Witcher 3 ultra * (Watt) | 77.9 | 85 -9% | 76.5 2% | ||
| Load Maximum * (Watt) | 88.3 | 118.9 -35% | 114.5 -30% | 122 -38% | 91.2 -3% |
* ... mindre är bättre
| Lenovo ThinkPad P1-20MD002LUS E-2176M, Quadro P2000 Max-Q, 80 Wh | Lenovo ThinkPad X1 Extreme-20MF000XGE i7-8750H, GeForce GTX 1050 Ti Max-Q, 80 Wh | Dell Precision 5530 Xeon E-2176M E-2176M, Quadro P2000, 97 Wh | HP EliteBook 1050 G1-4QY20EA i7-8750H, GeForce GTX 1050 Max-Q, 96 Wh | Lenovo ThinkPad X1 Carbon 2018-20KGS03900 i5-8550U, UHD Graphics 620, 57 Wh | Apple MacBook Pro 15 2018 (2.6 GHz, 560X) i7-8850H, Radeon Pro 560X, 83 Wh | |
|---|---|---|---|---|---|---|
| Batteridrifttid | 21% | 58% | 64% | 64% | 92% | |
| WiFi v1.3 (h) | 5.3 | 6.4 21% | 8.4 58% | 8.7 64% | 8.7 64% | 10.2 92% |
| Reader / Idle (h) | 11.5 | 16.5 | 17.1 | 22.1 | ||
| Witcher 3 ultra (h) | 1.1 | 1.5 | ||||
| Load (h) | 2 | 1.8 | 2.1 | 1.8 |
För
Emot
Läs den fullständiga versionen av den här recensionen på engelska här.
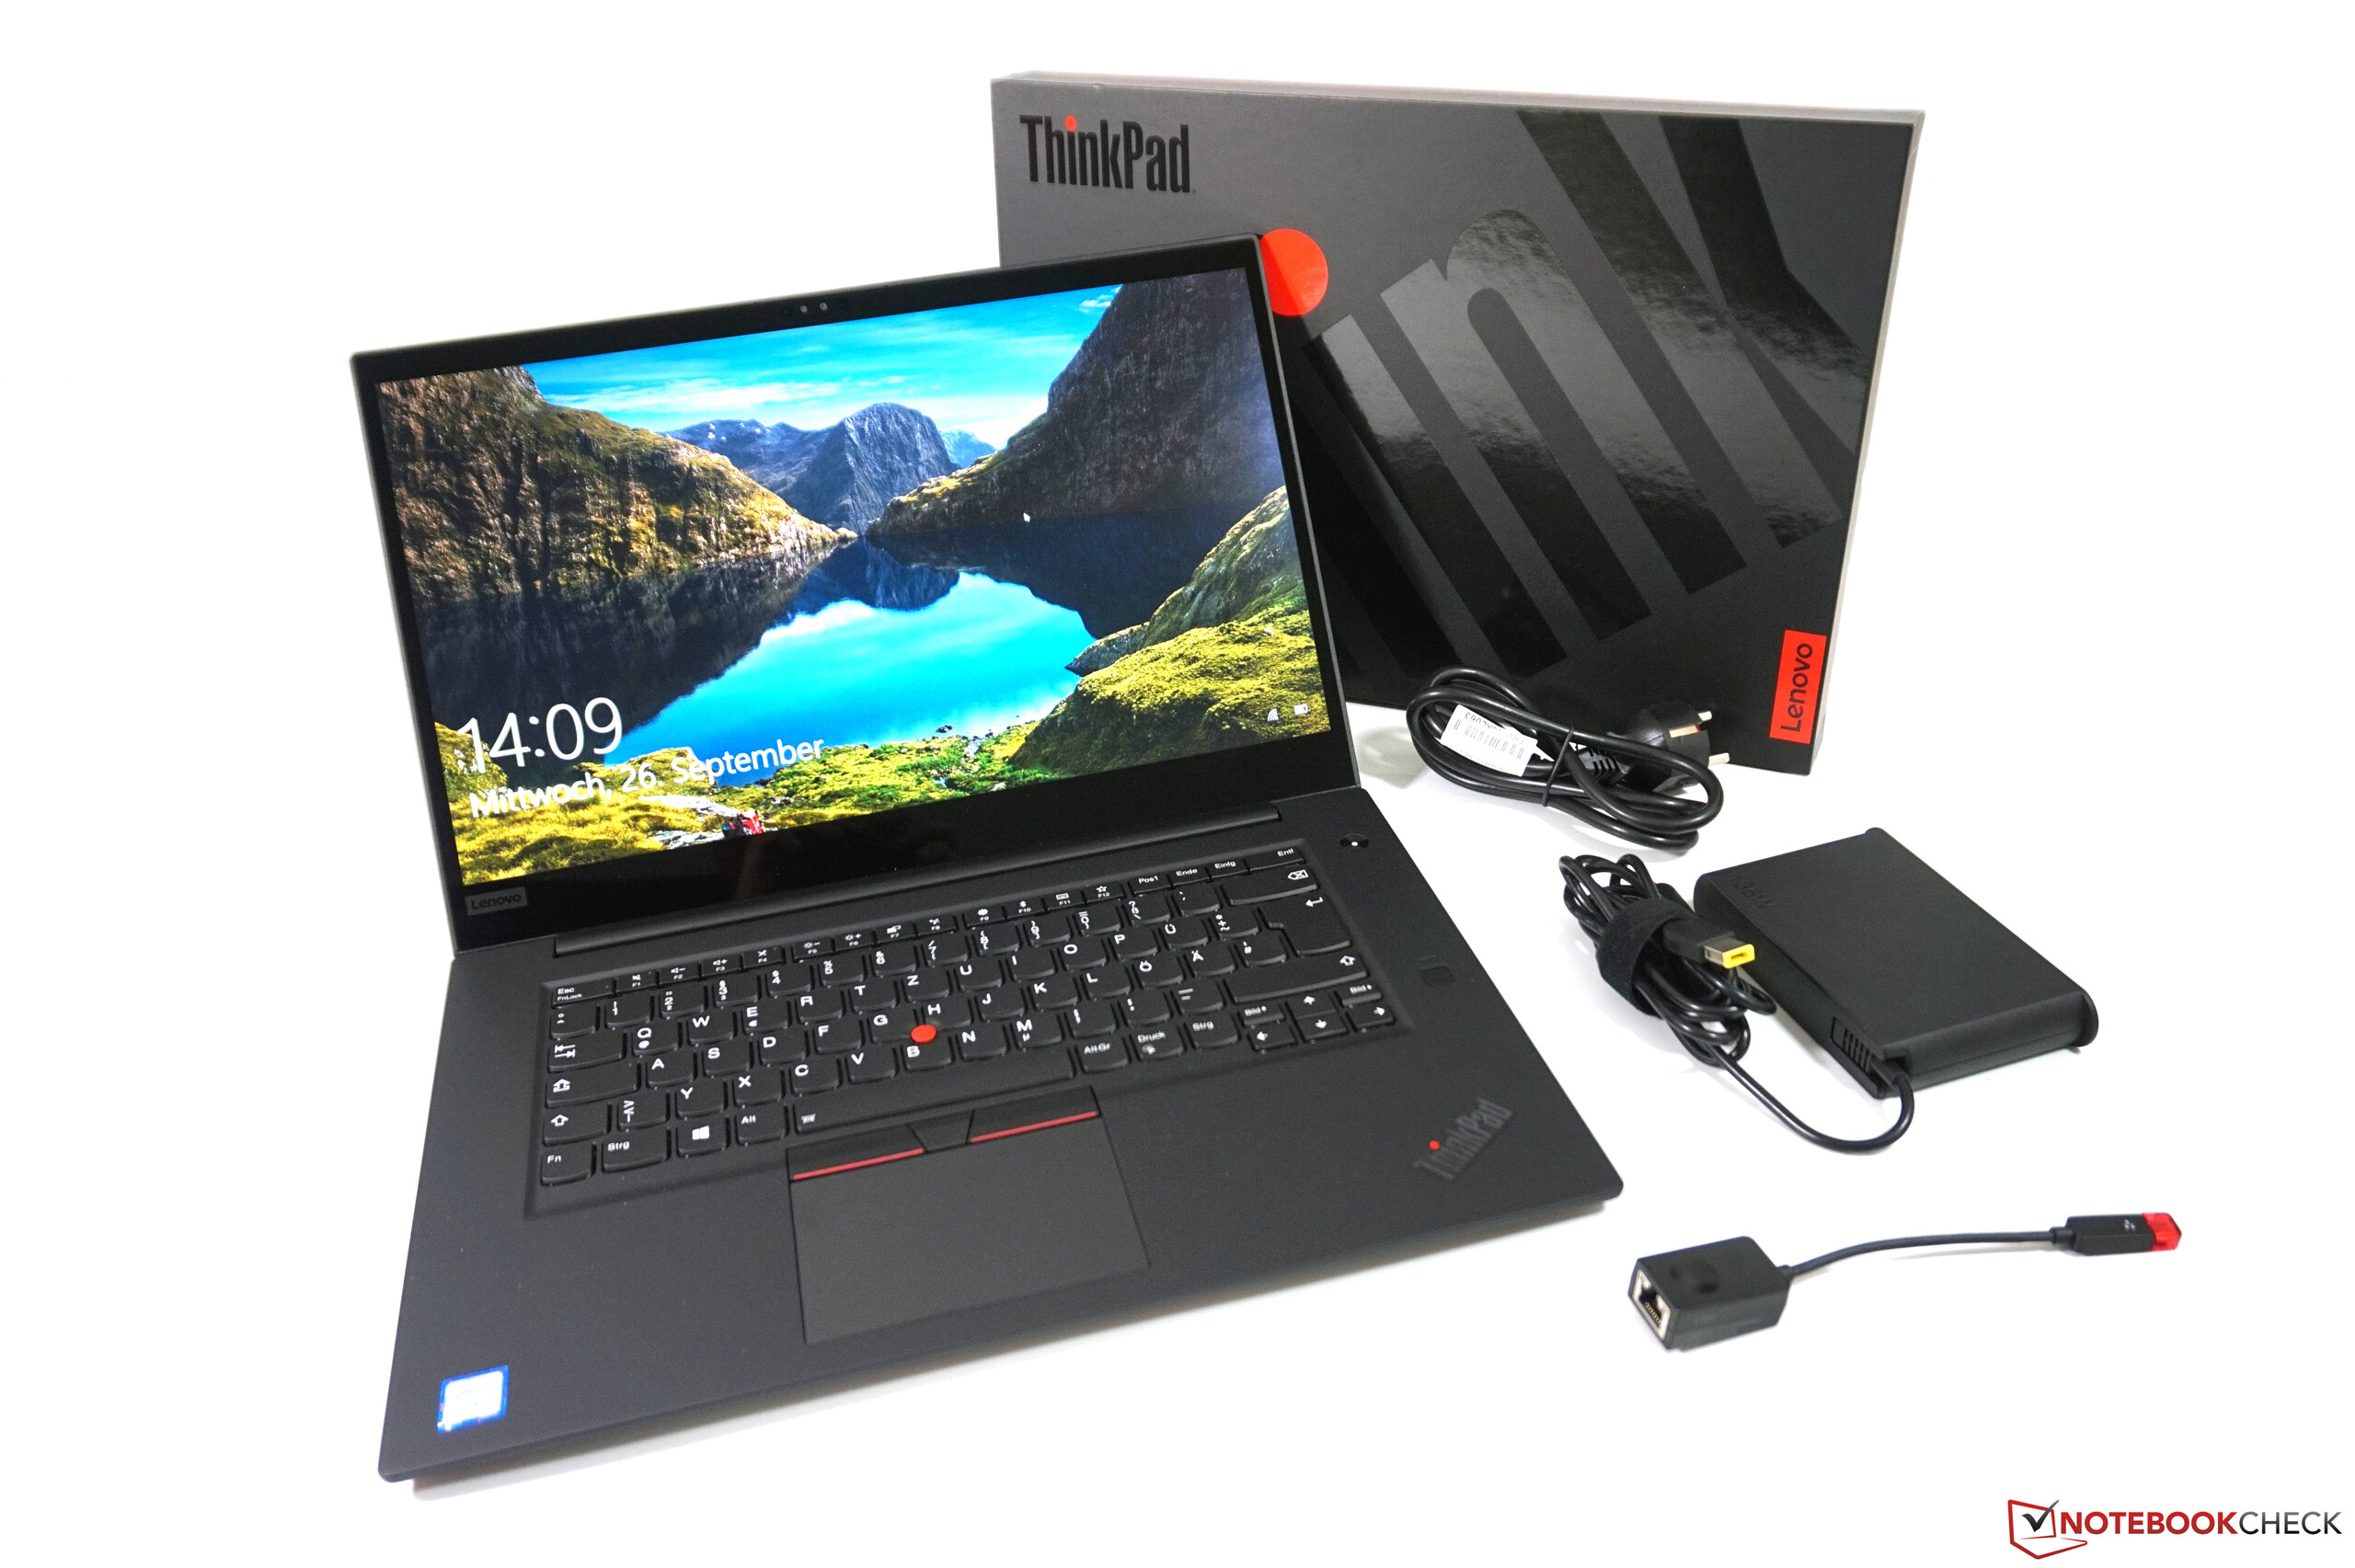
Bredvid det ökade intresset för lätta spelmaskiner så har tunna och lätta arbetsstationer (i stil med Dells Precision 5530) också hittat sin egen nisch på marknaden och Lenovos ThinkPad P1 står för ett starkt tillskott till detta blommande utbud.
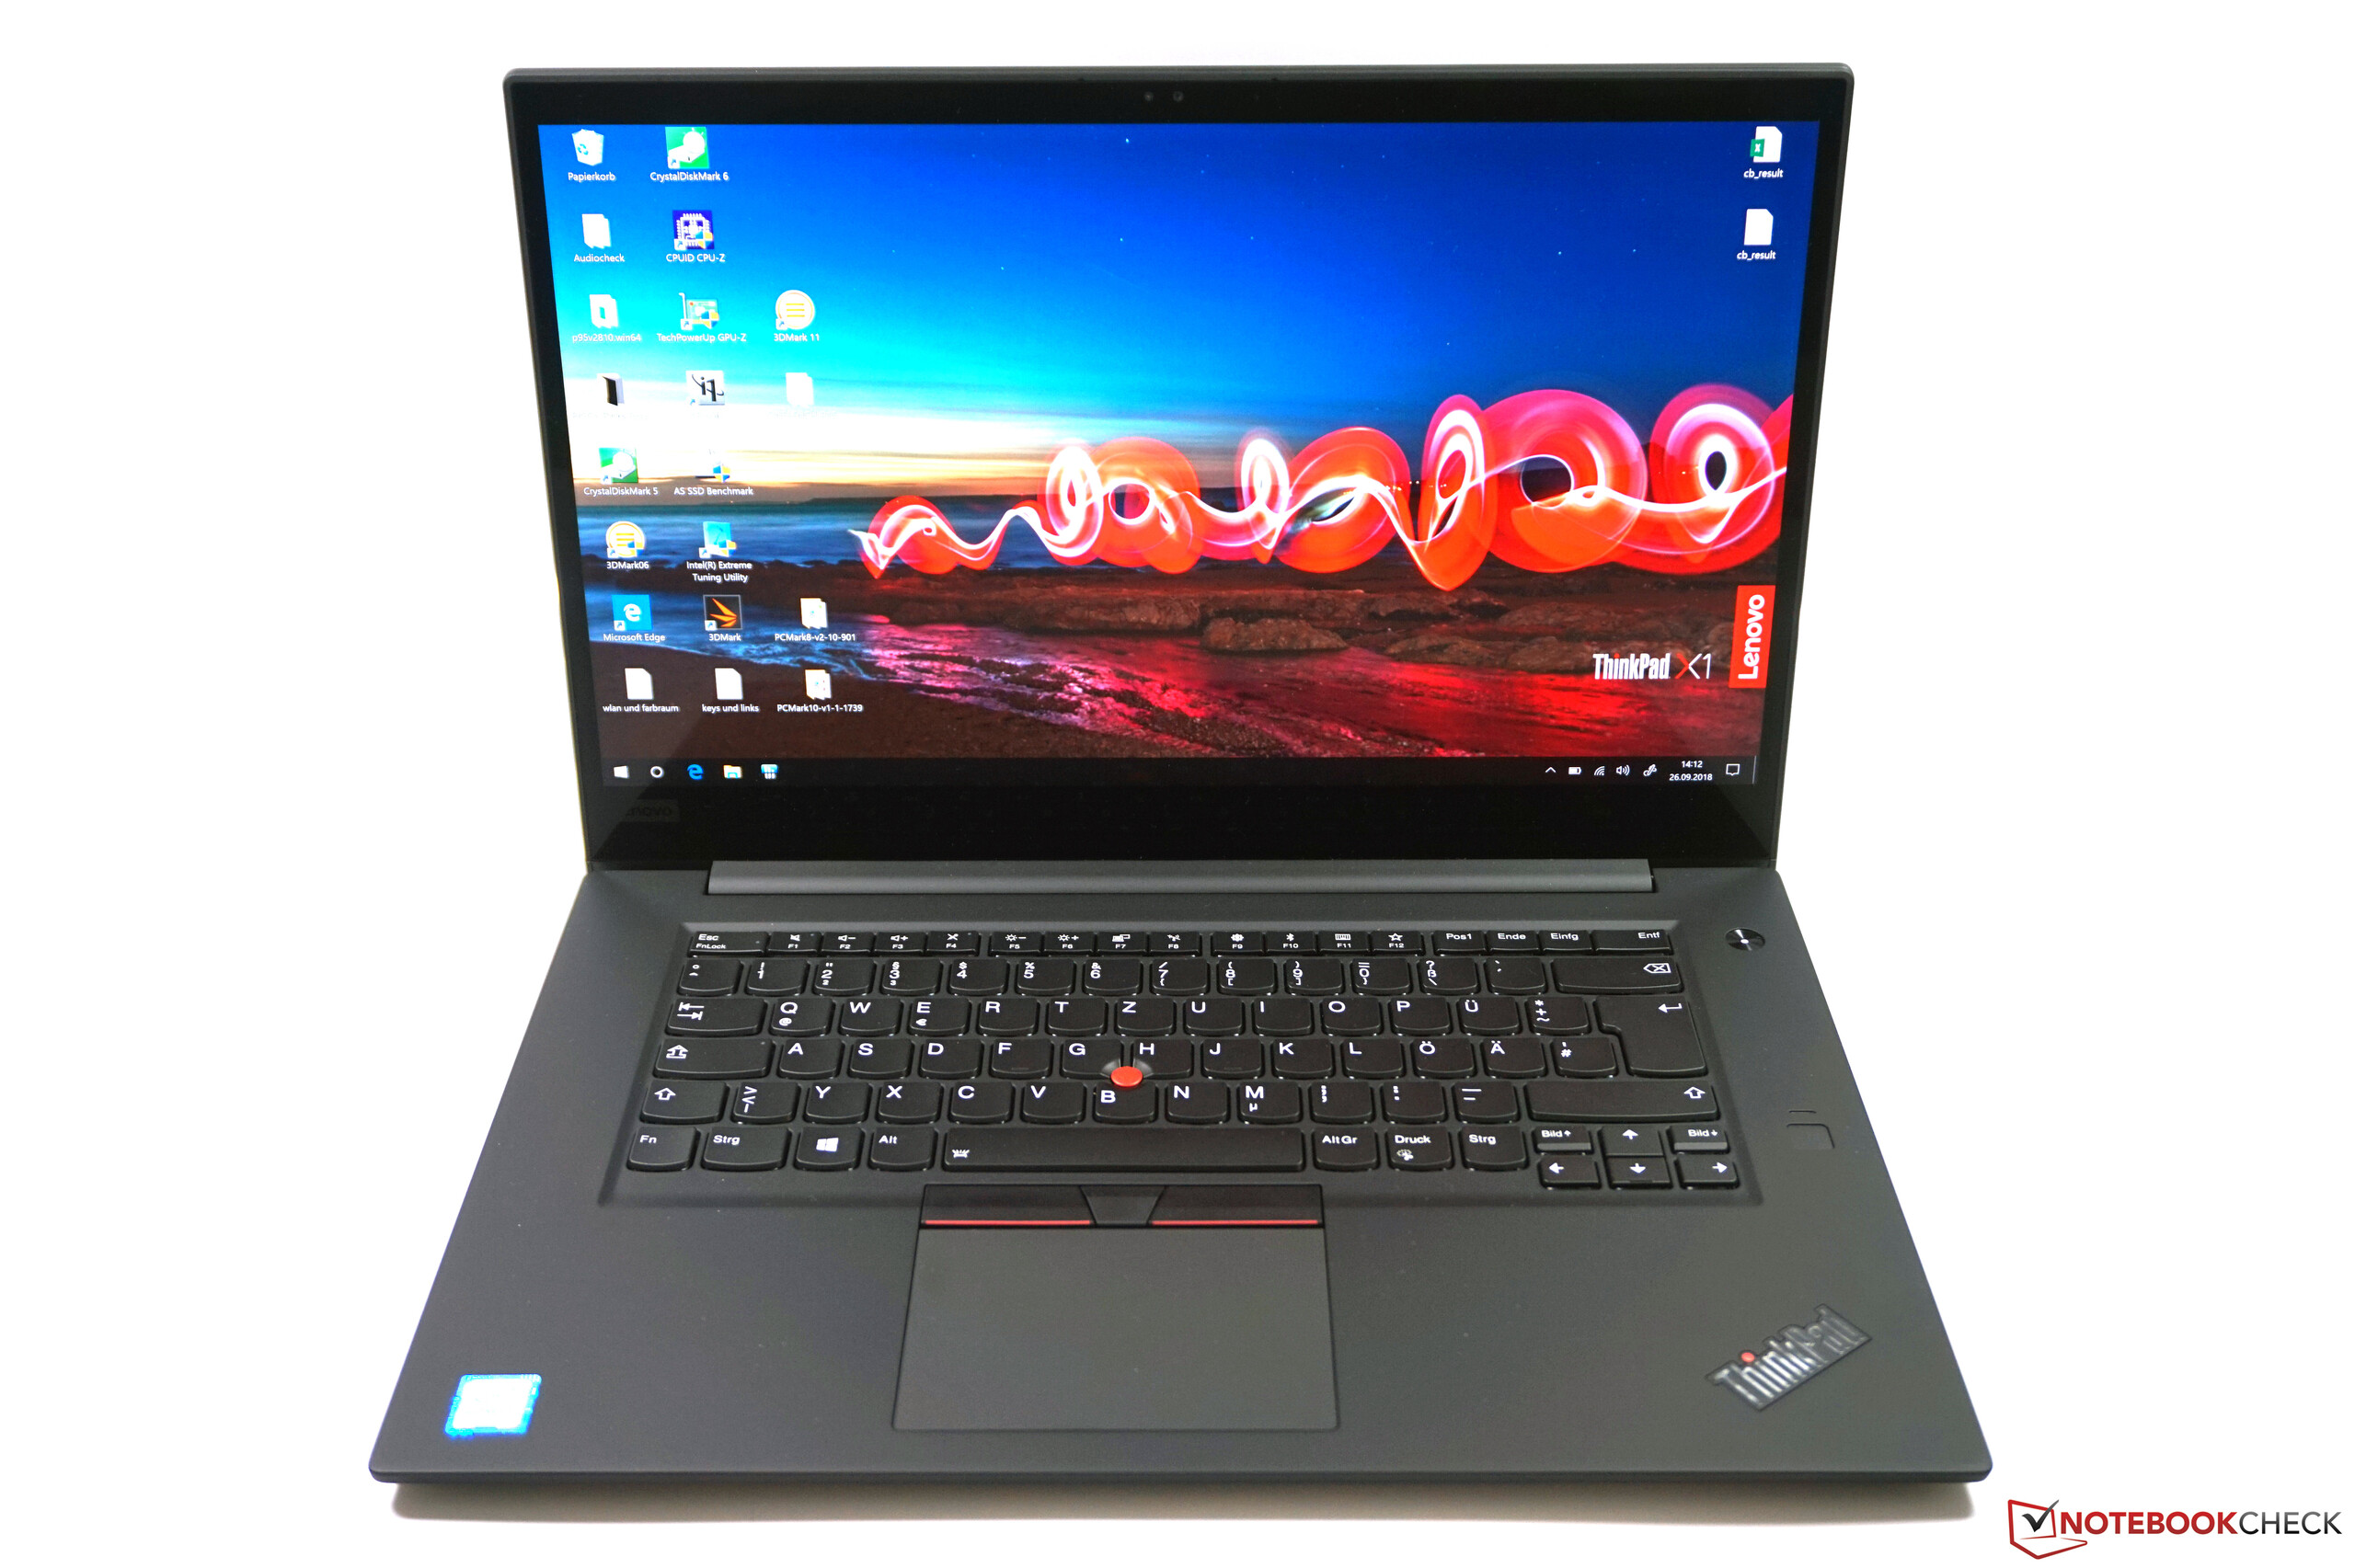
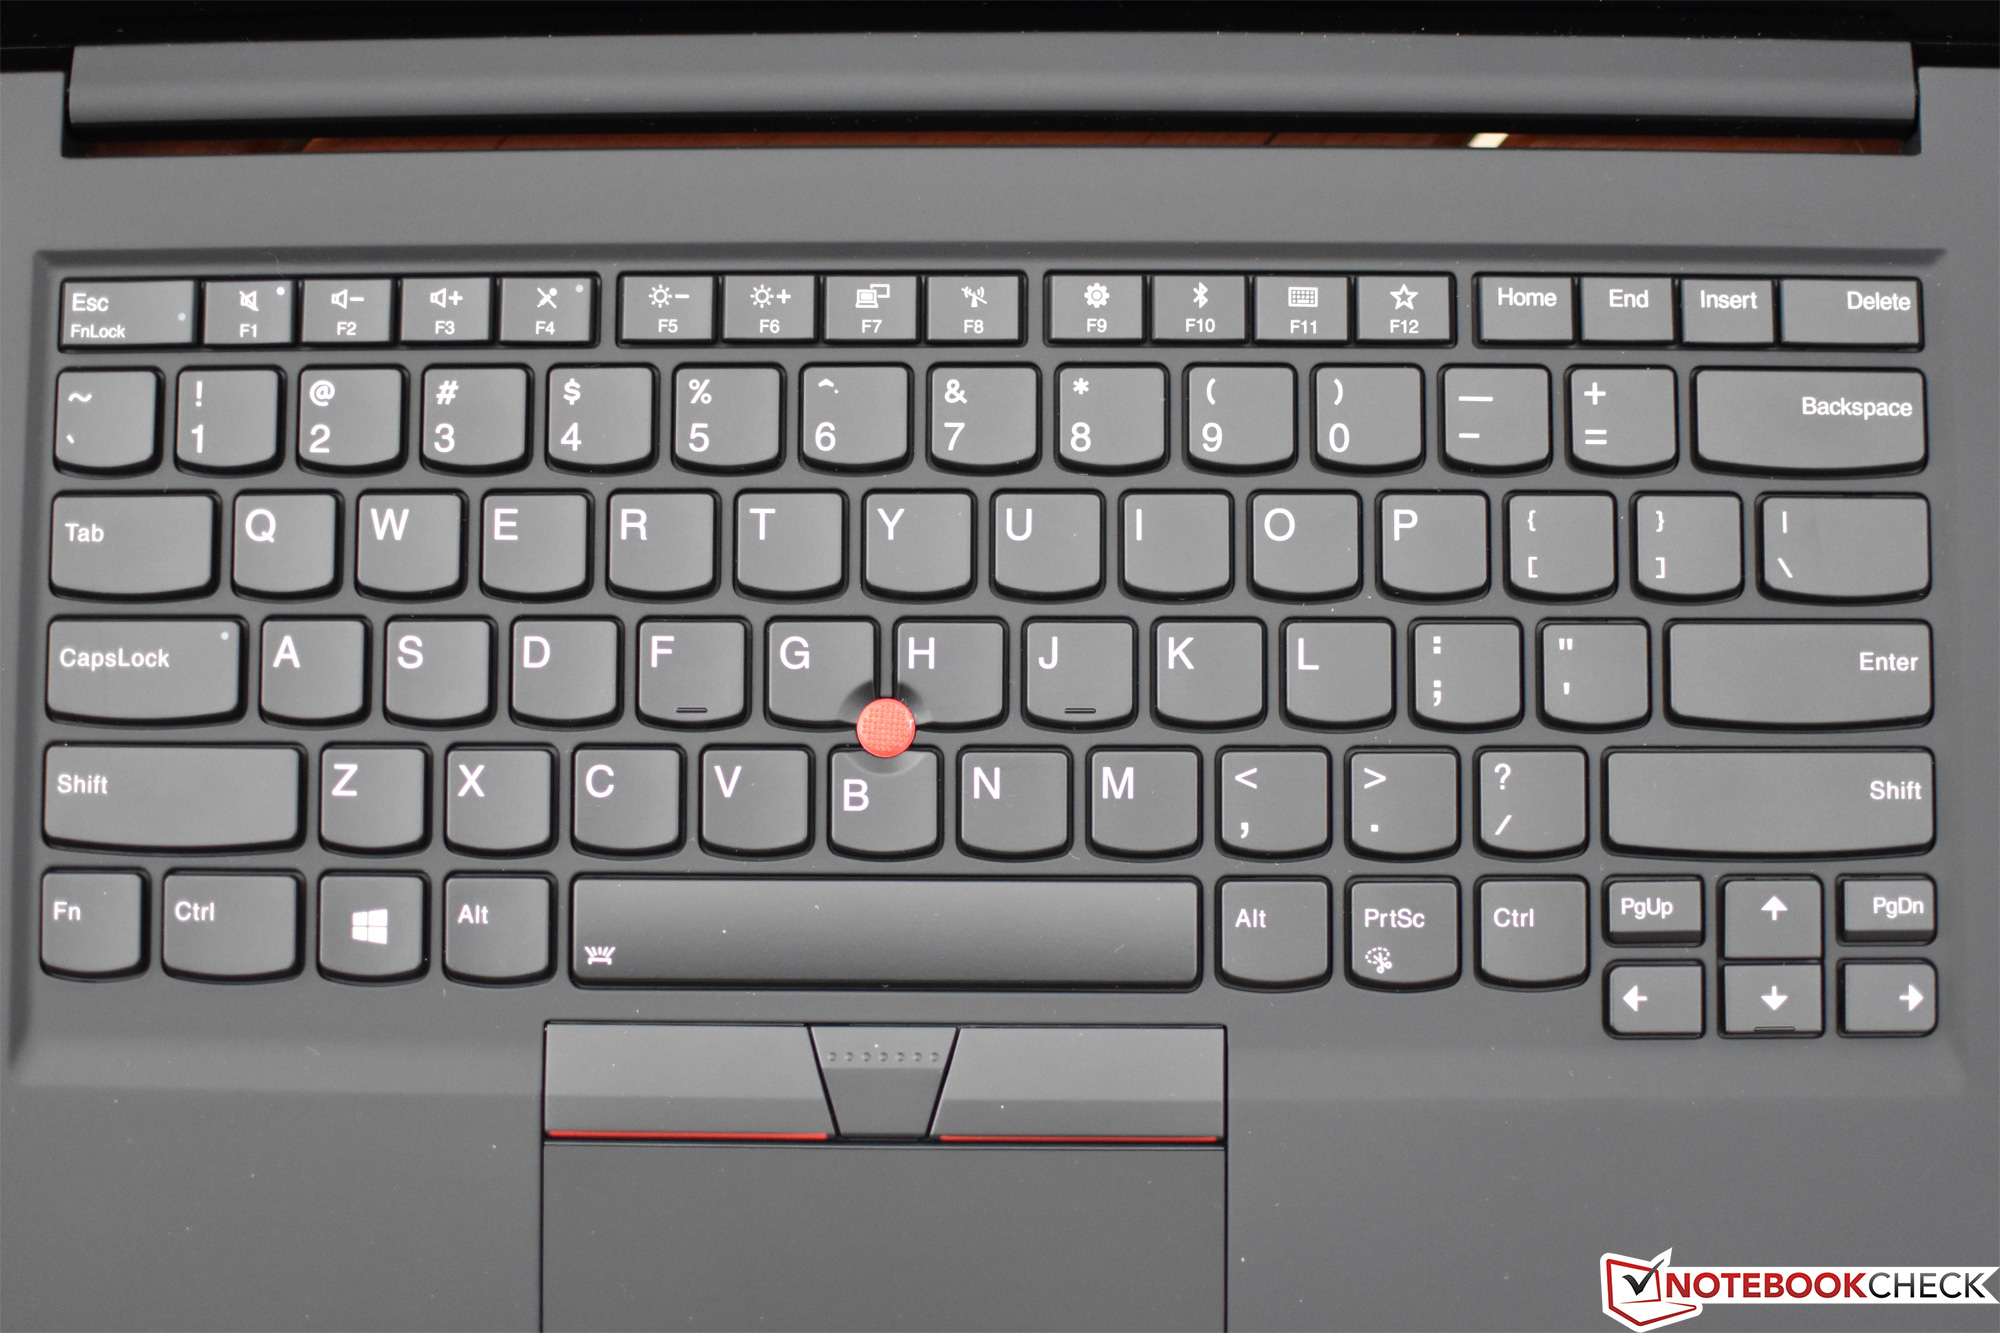
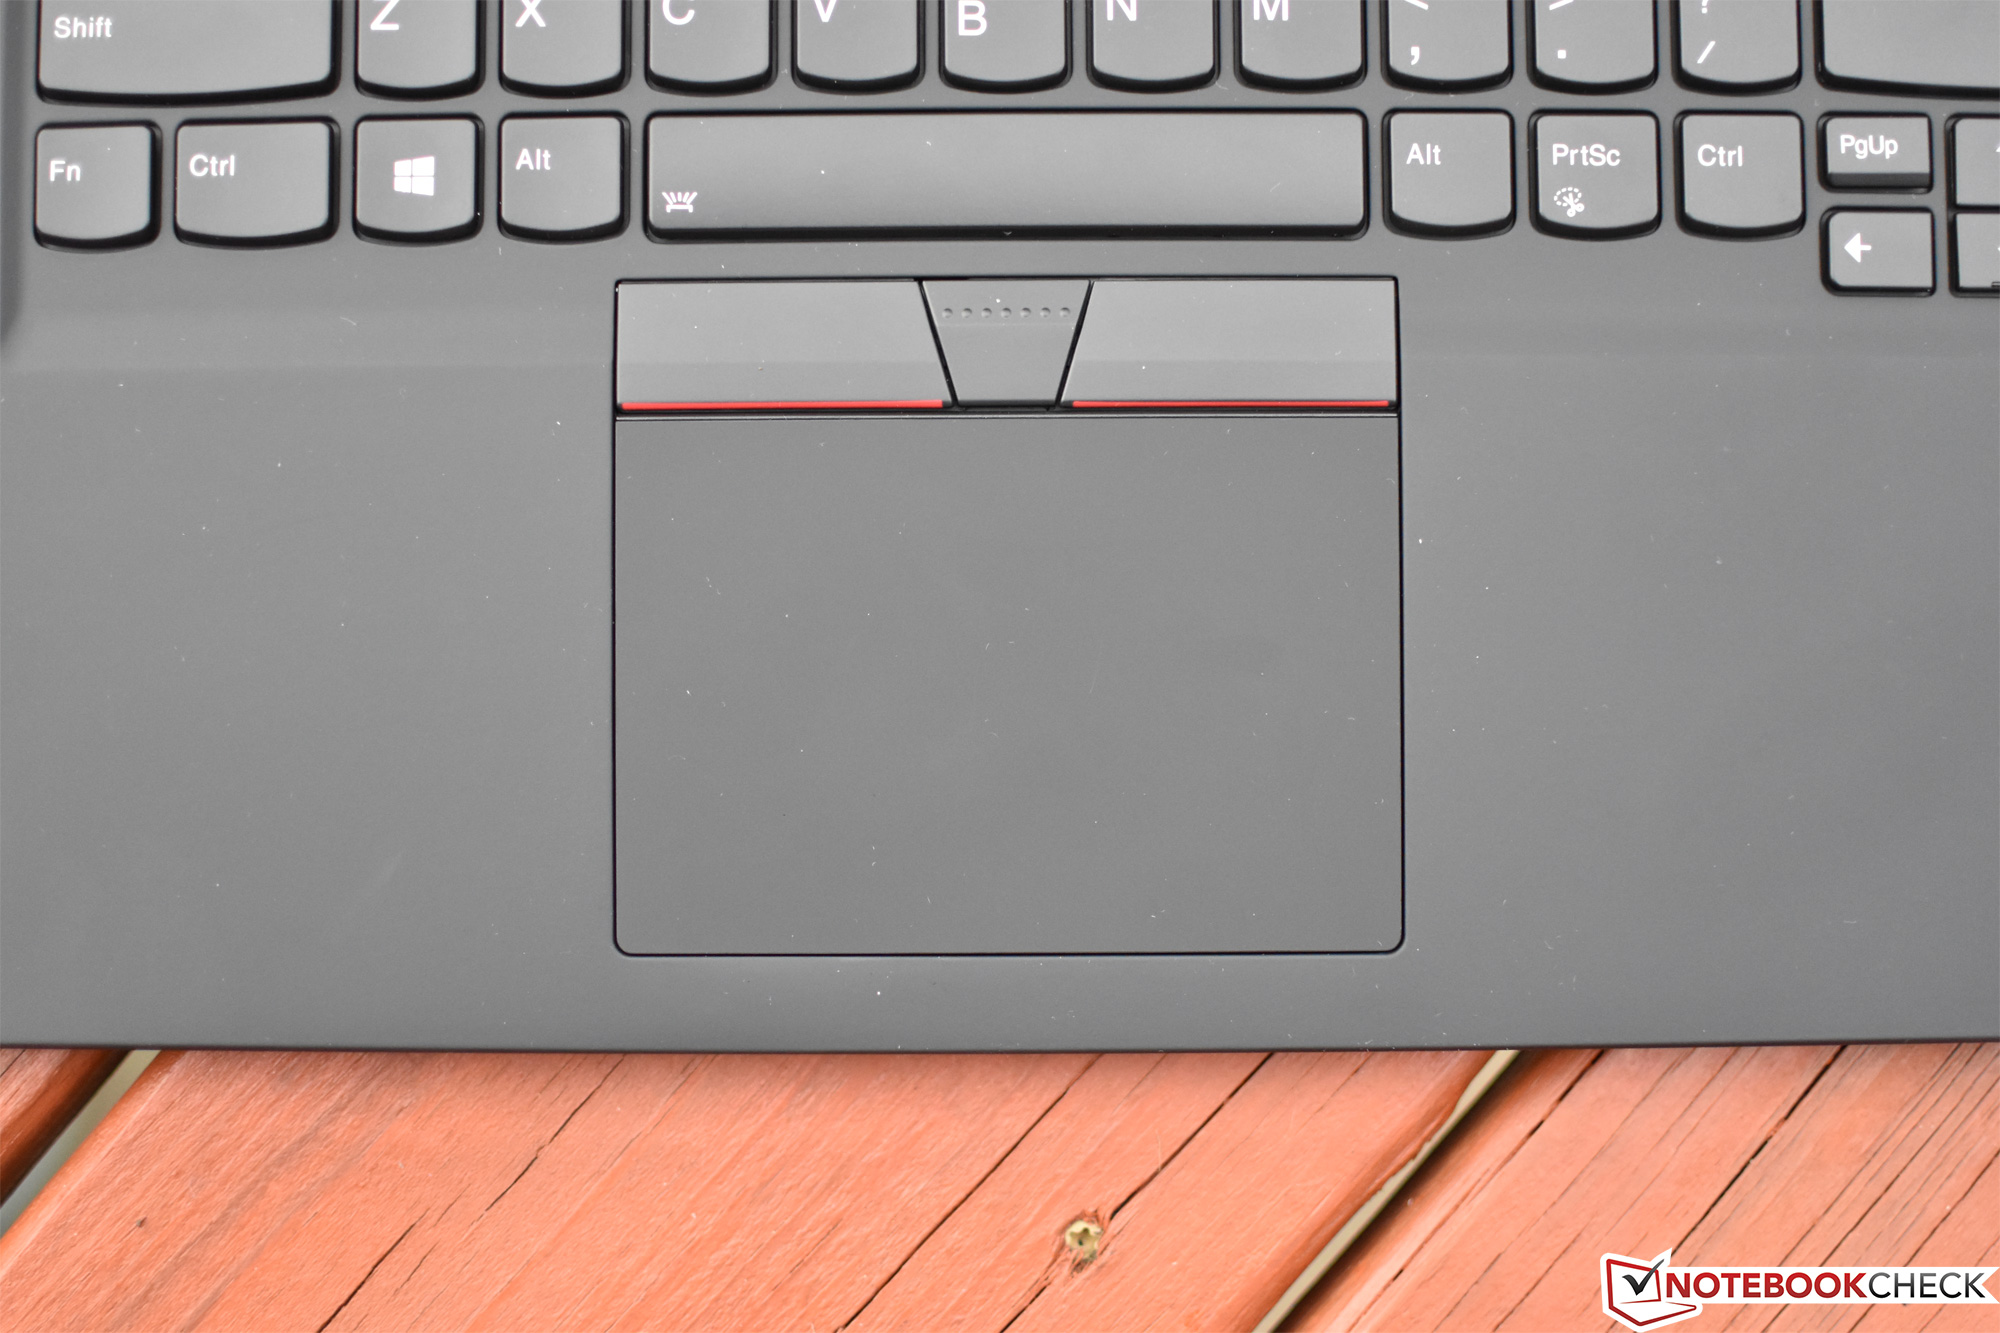
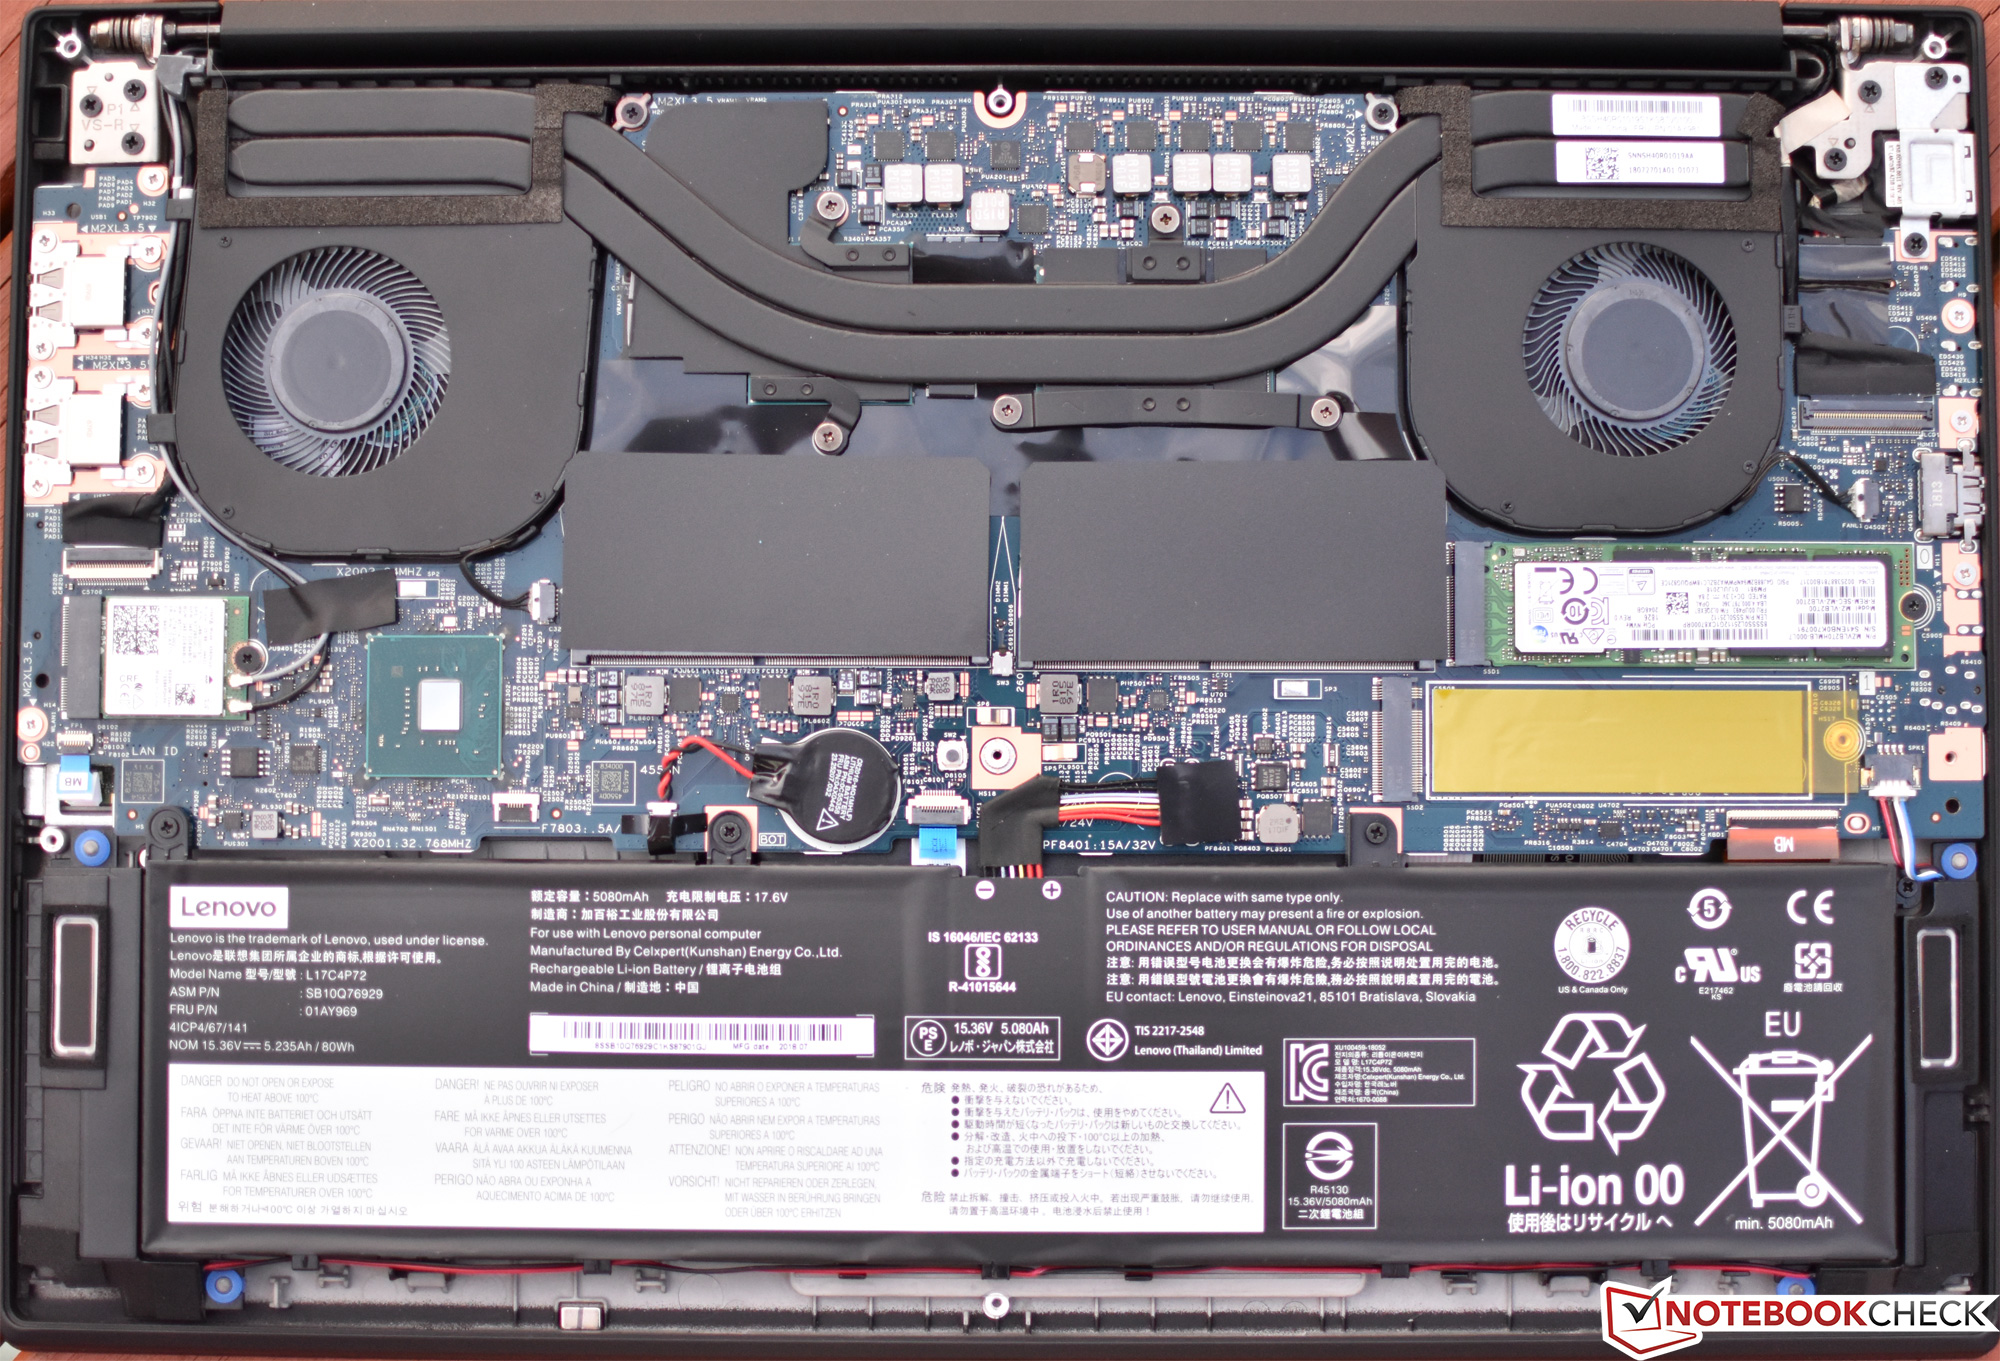
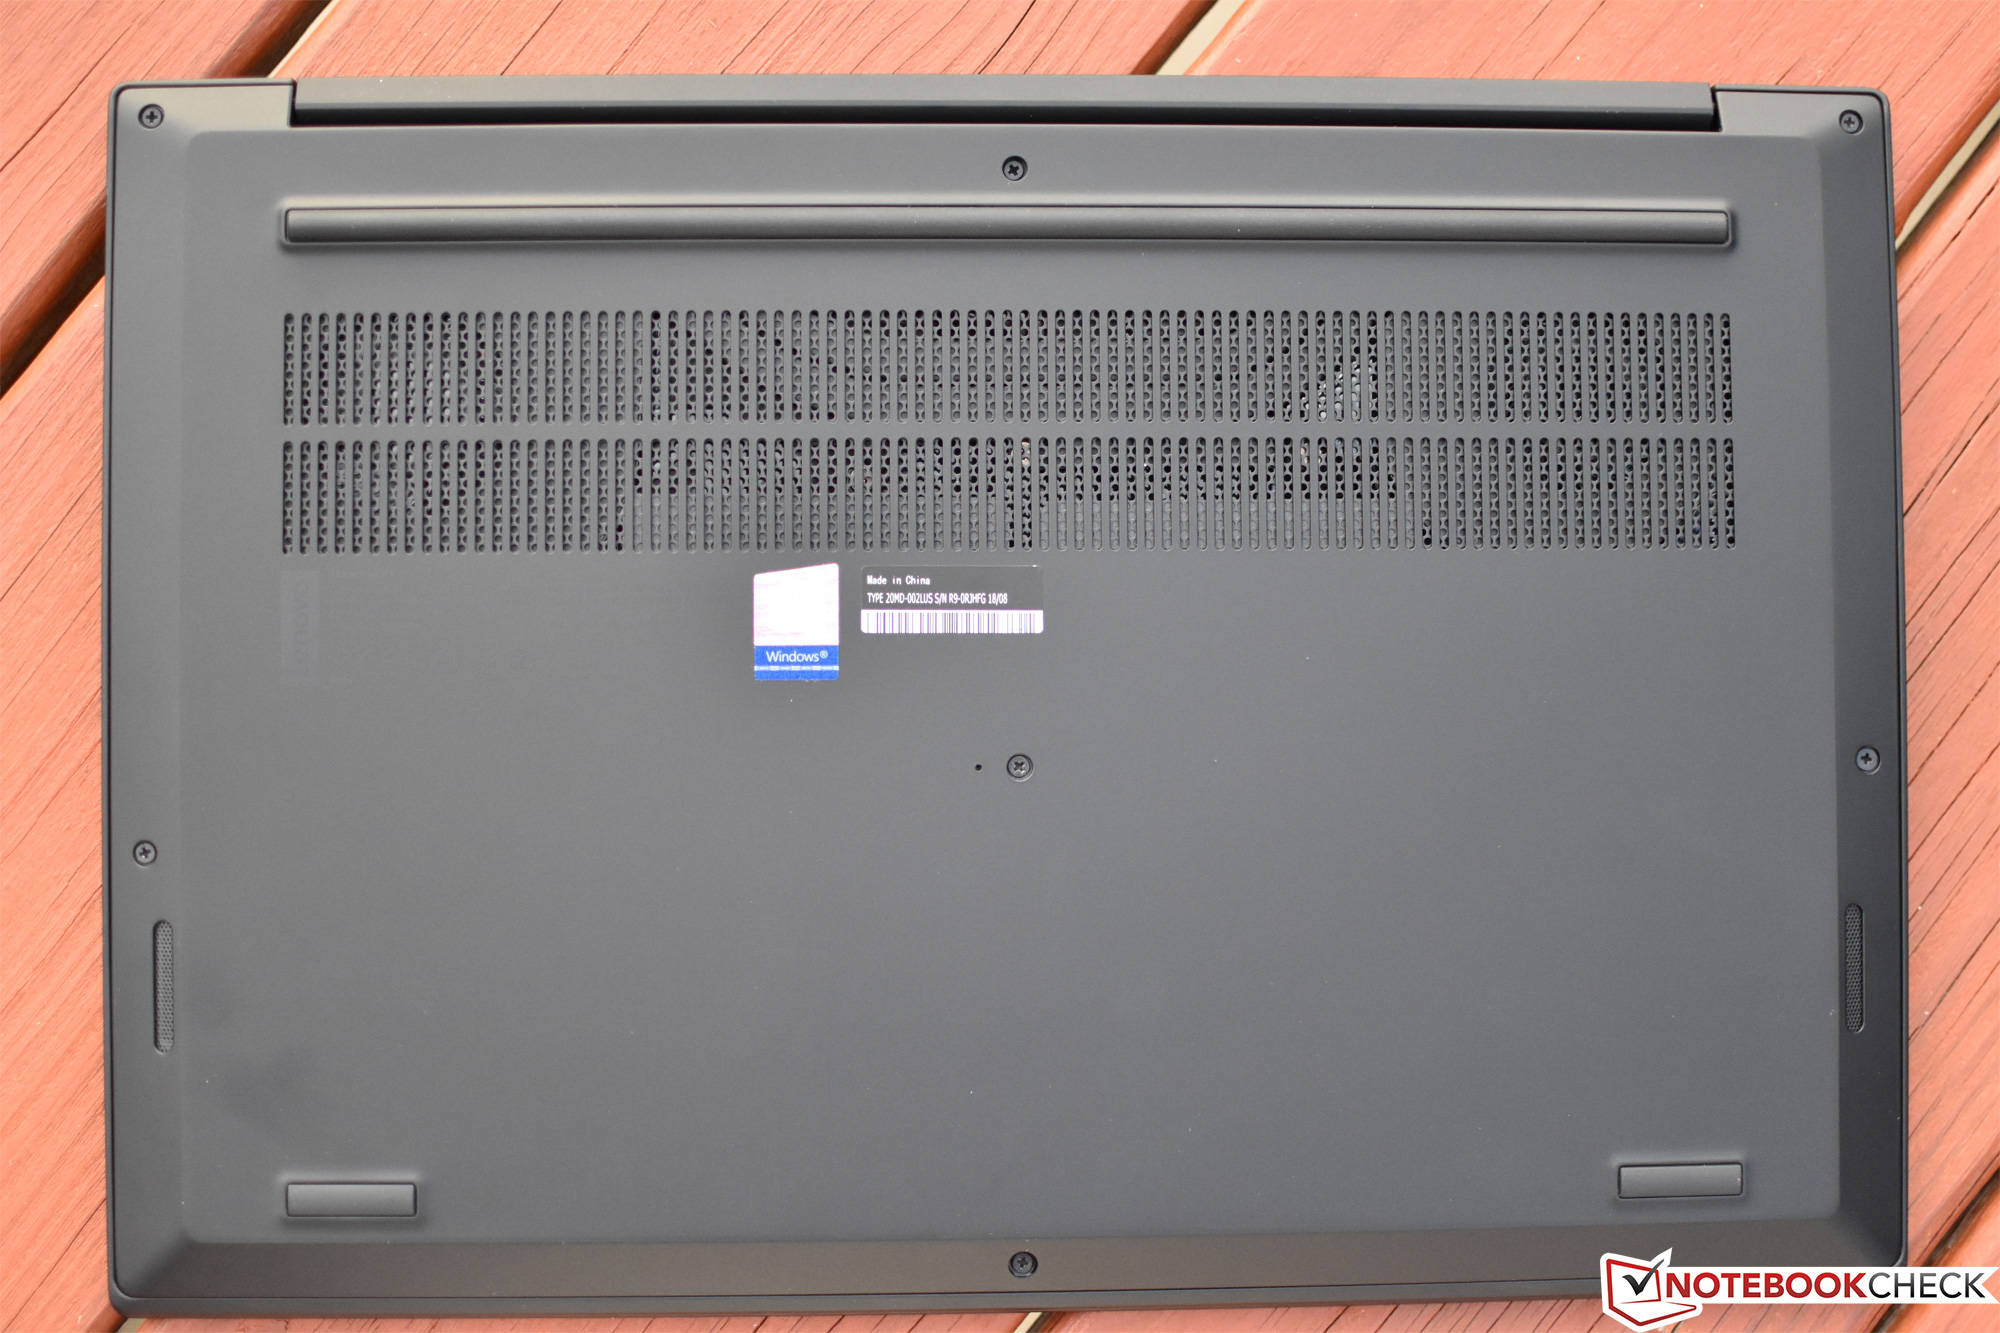
Med tanke på att de två maskinerna har en identisk design är det inte mycket som förändrats med ThinkPad P1 sen vi recenserade X1 Extreme för några veckor sedan. Vi imponeras återigen av ett robust, högkvalitativt och attraktivt hölje, en färgrik IPS-skärm, stark CPU- och GPU-prestanda, diskret men ändå effektiv kylning och förstklassiga inmatningsenheter. Vi uppskattade också hur lätt den var att underhålla och uppgradera, med en bottenplatta som var lätt att ta bort och många möjligheter till expansion (dualkanals-RAM upp till 64 GB, dubbla PCIe x4 M.2-platser).
X1 Extreme var redan innan en iögonfallande och lyxig konsumentmaskin, men designen har ännu fler förtjänster i formen av en ultraportabel arbetsstation.
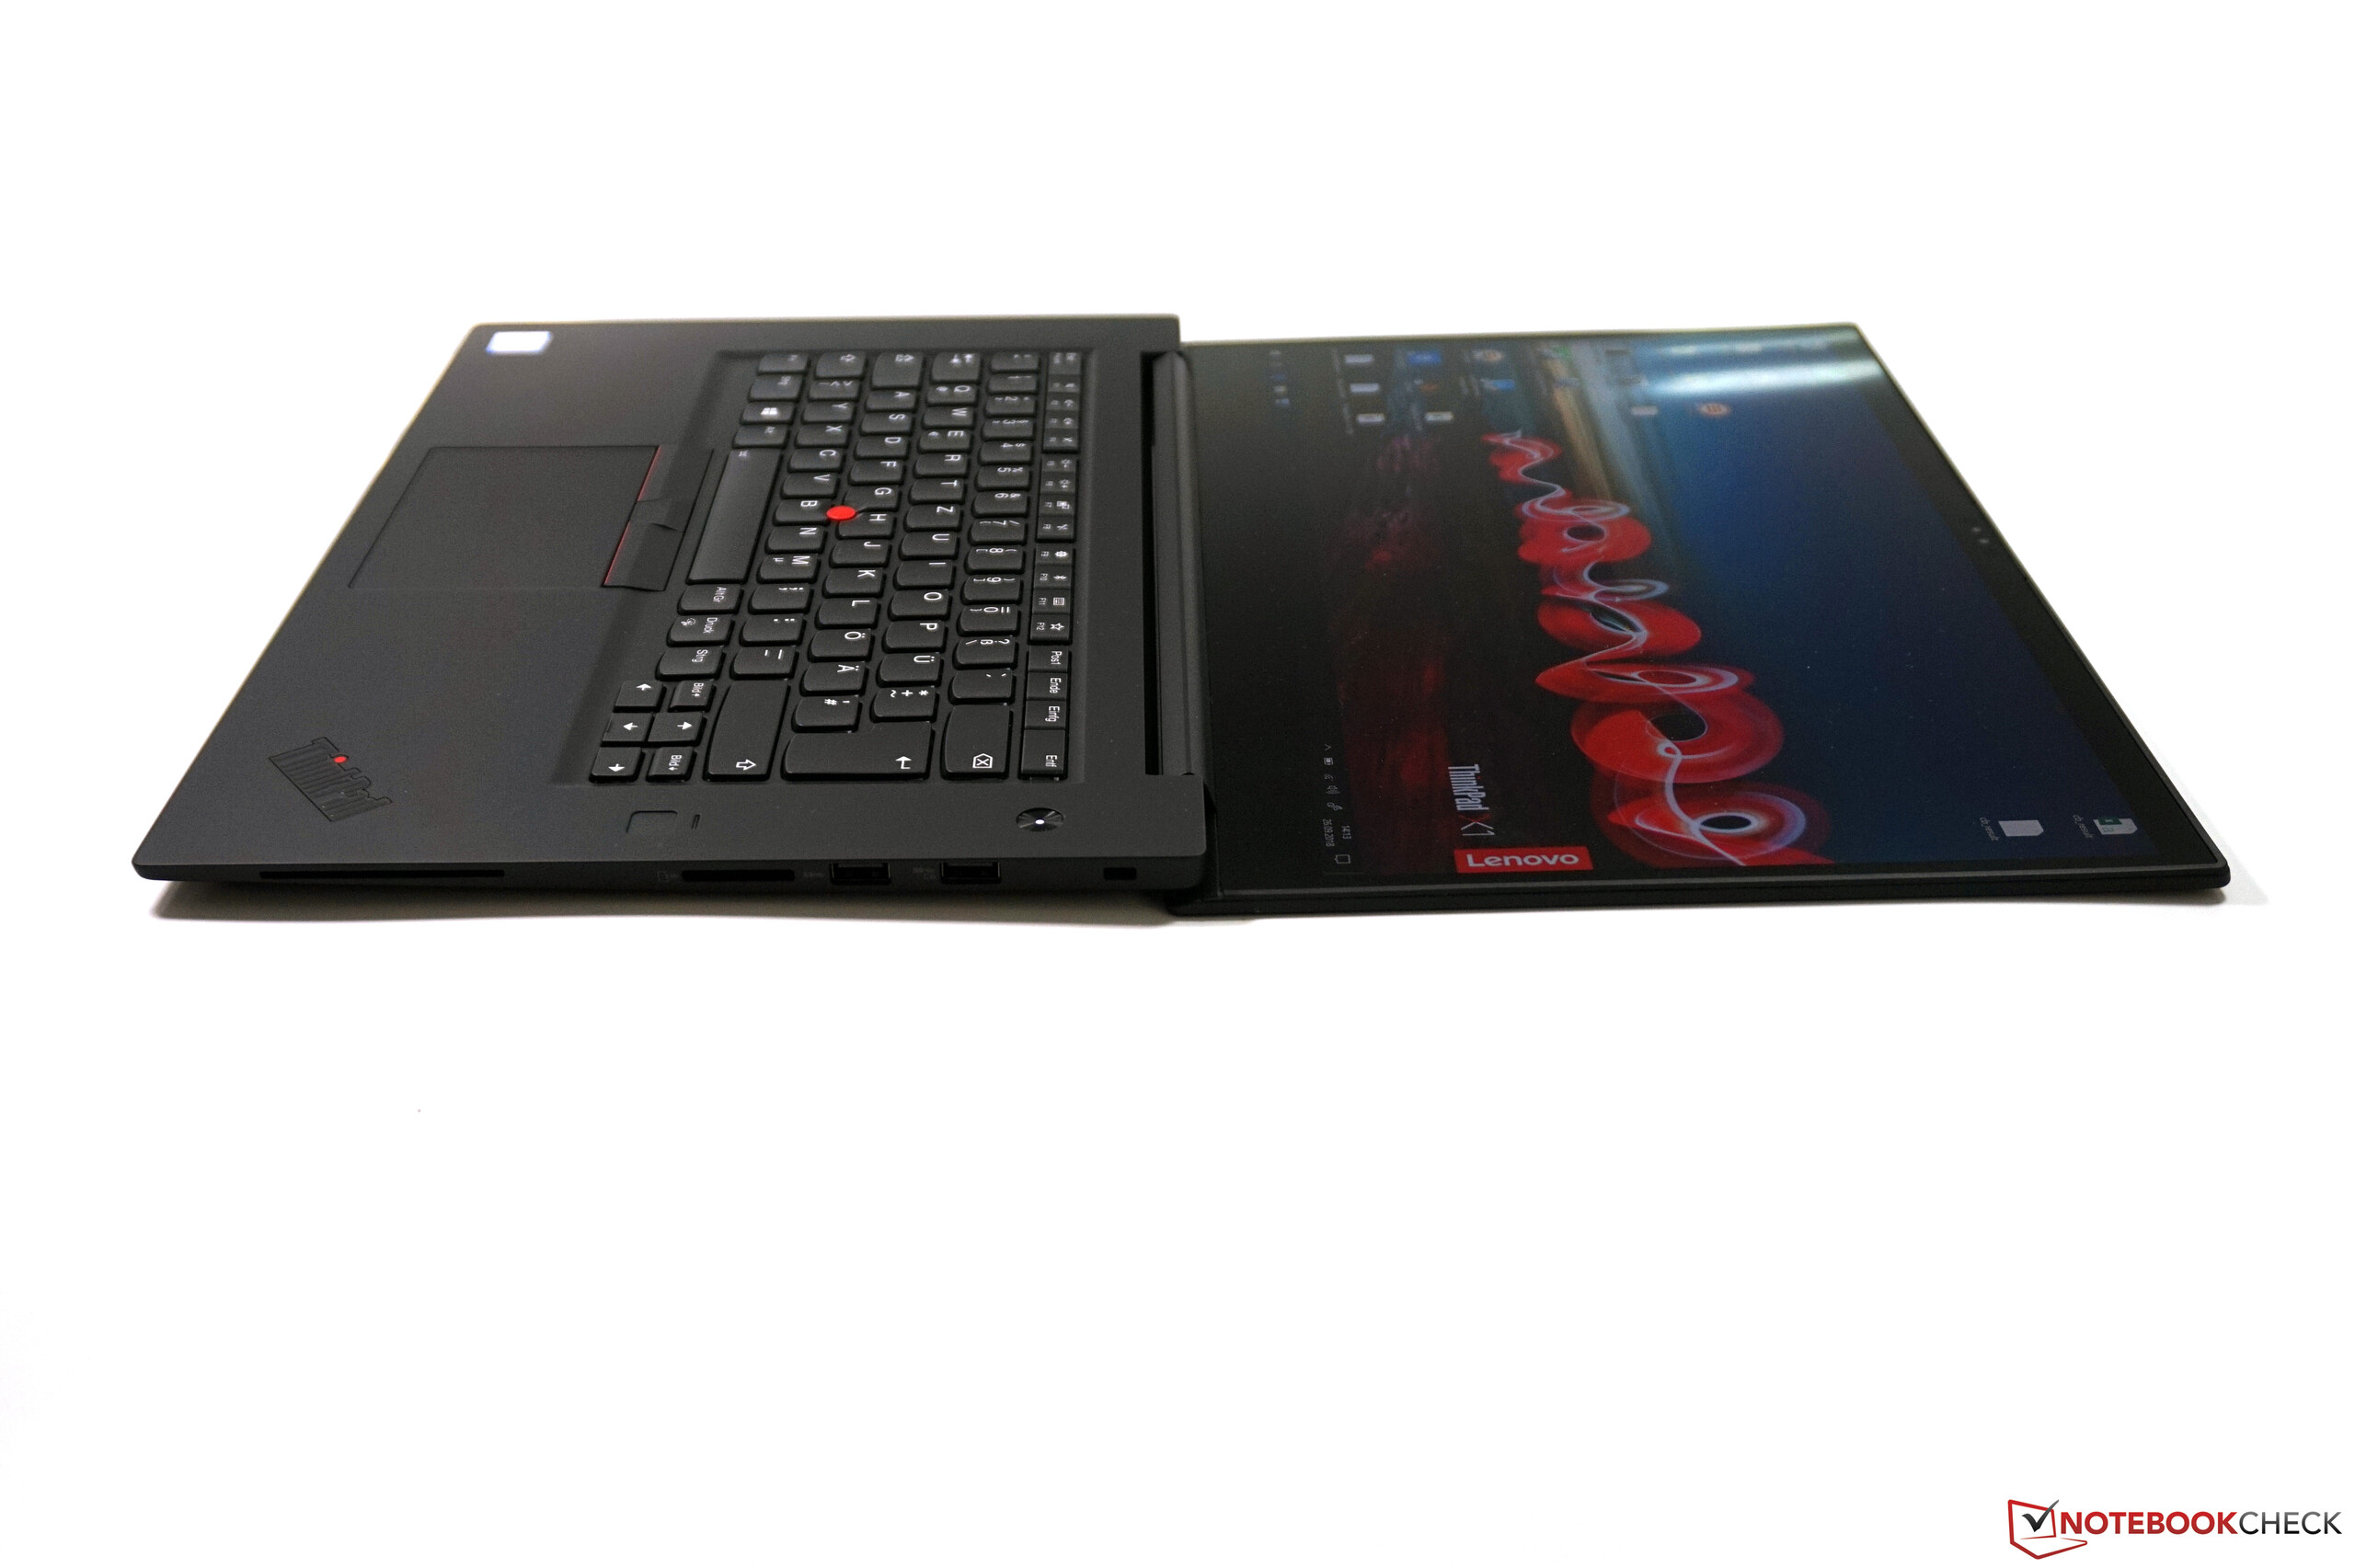
Men det kommer förstås bli kompromisser när du i praktiken kapar av 30 till 50% av storleken för en typisk arbetsstation. ThinkPad P1 klarar av att leverera bra prestanda vid de flesta former av belastning, men tung kombinerad stress blir en nykter påminnelse om att en sådan design har begränsningar. Då NVIDIAs Max-Q står vid rodret hamnar värme och energiförbrukning aldrig ur kontroll, men GPU:n störtdyker (och CPU-prestandan minskar märkbart) vid de tyngsta beräkningsbelastningarna. Men arbetsstationsprestandan är ändå tillräcklig för att hantera en majoritet av kraven som ställs av modellering och design, även om prestandan ligger under konventionella P2000-drivna enheter (såsom Precision 5530).
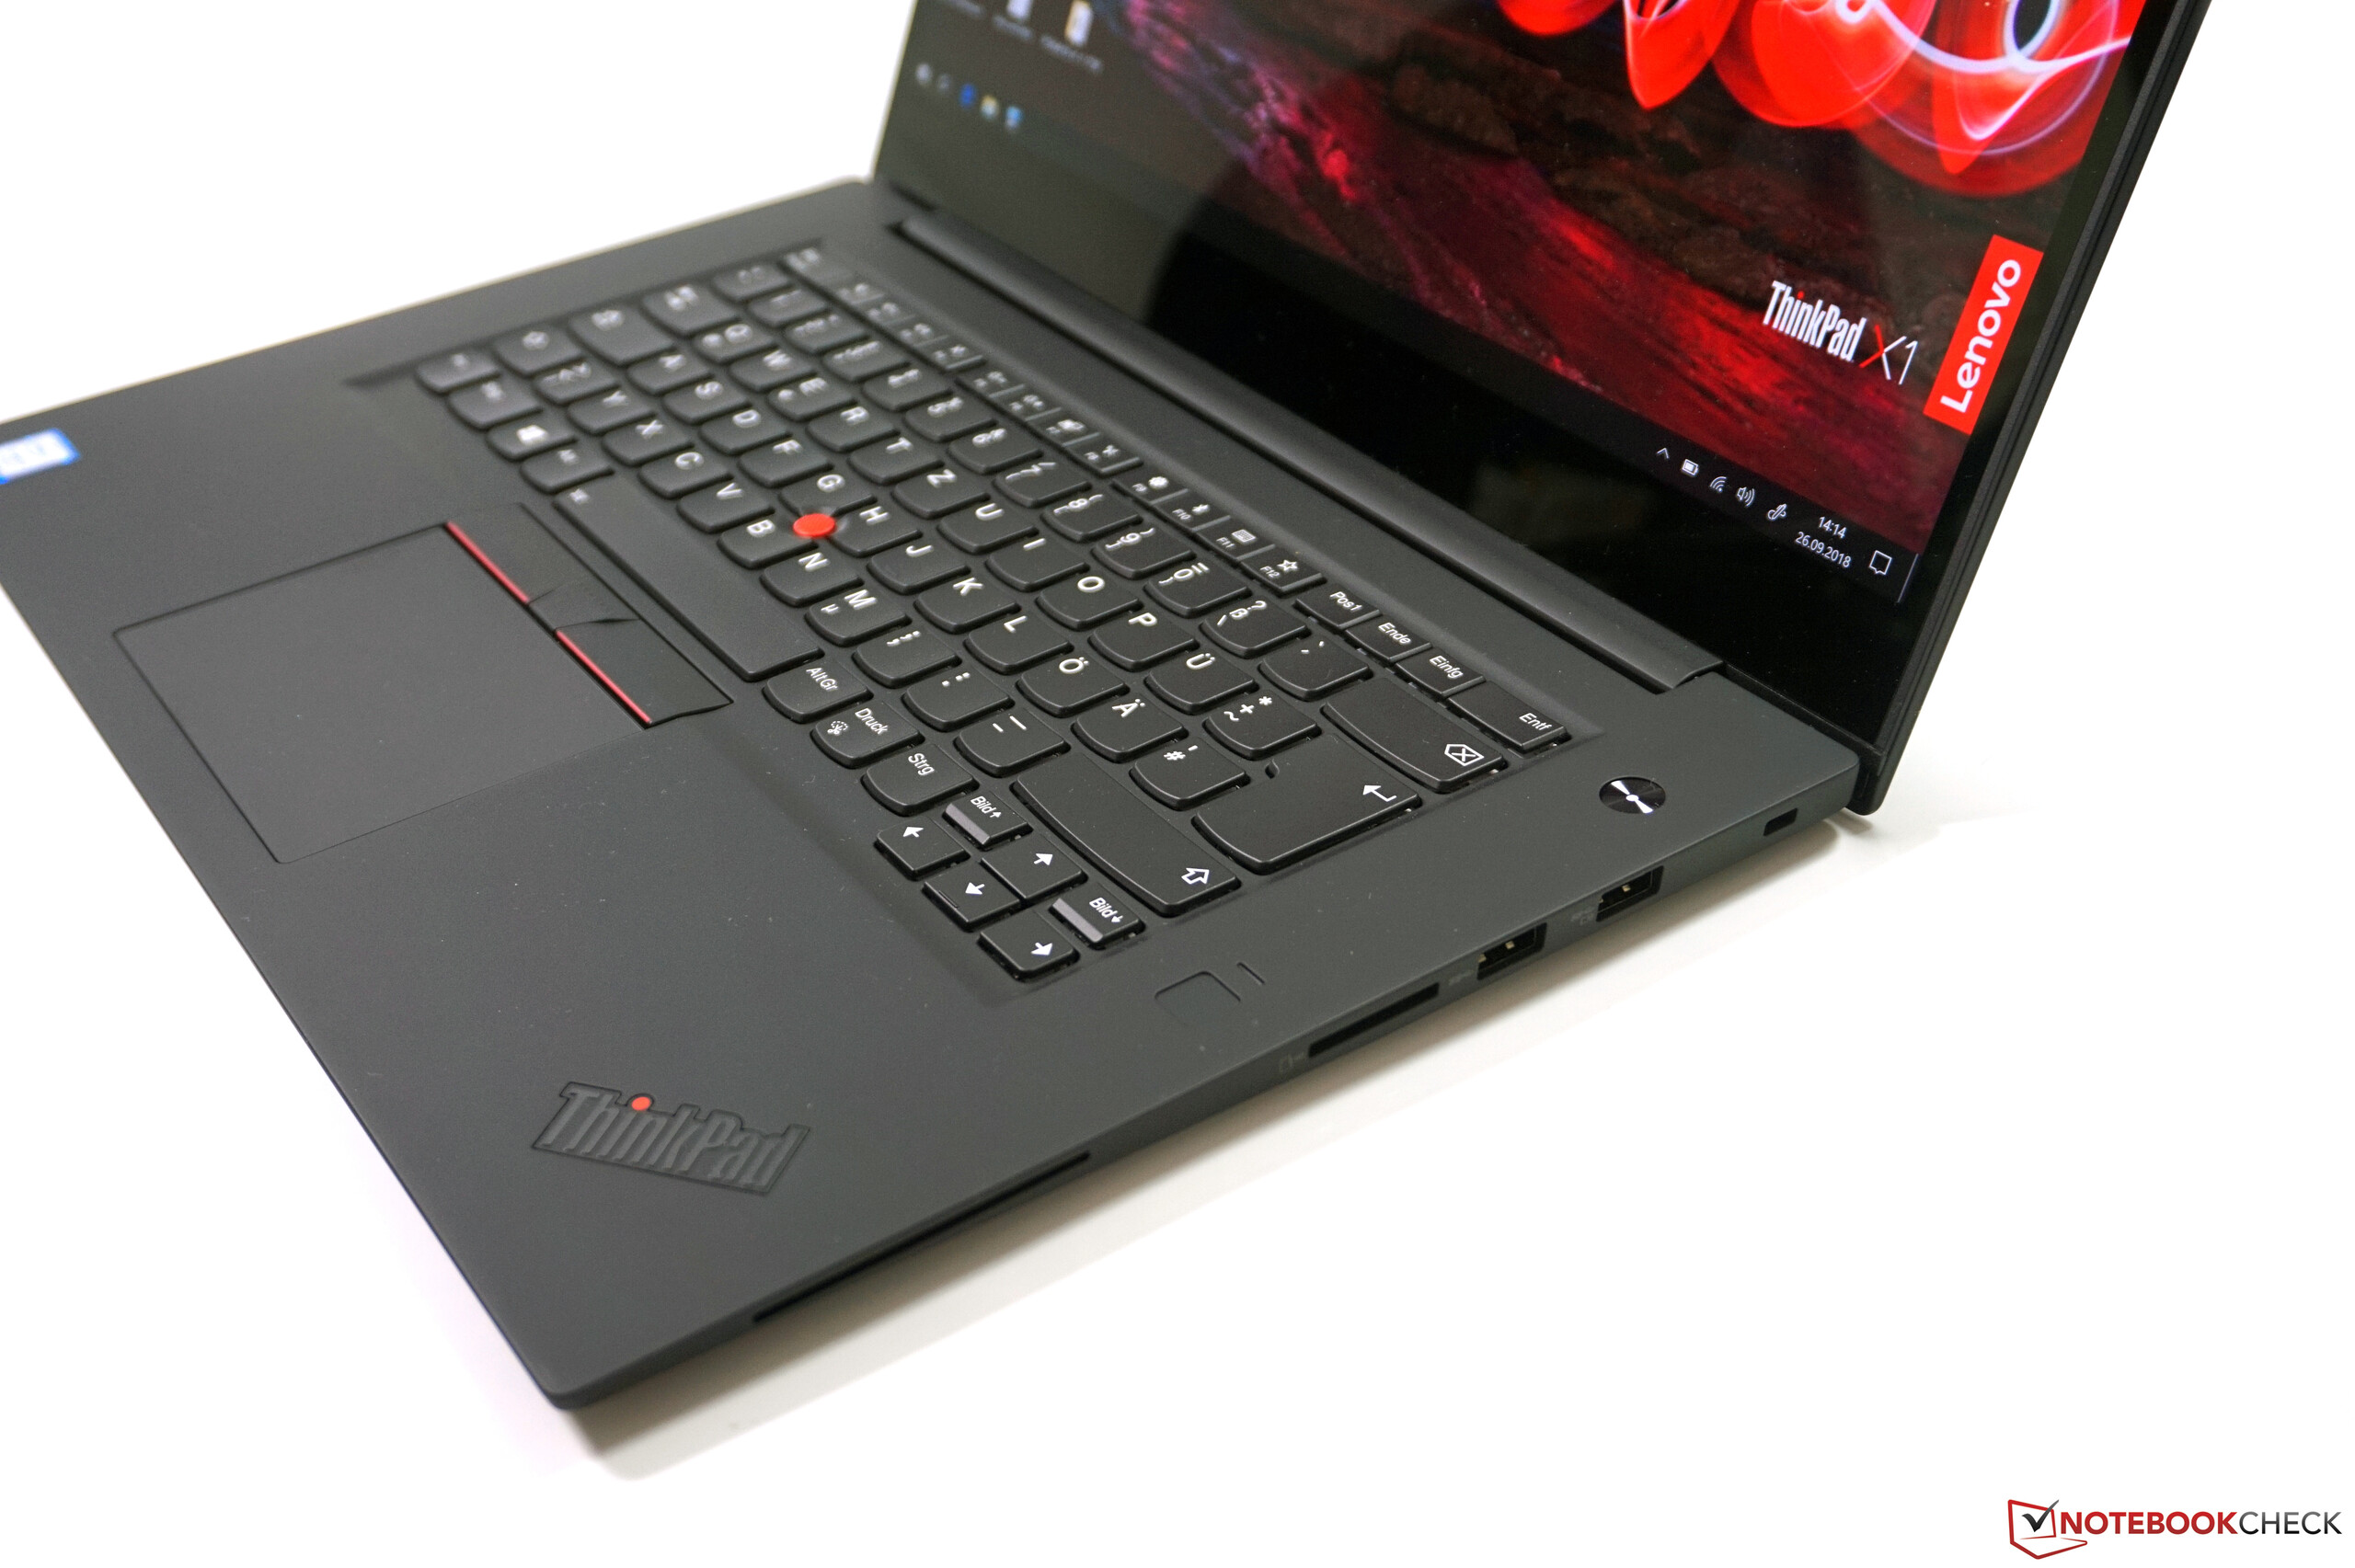
De flesta av problemen vi ursprungligen hade med X1 Extreme gäller även ThinkPad P1. Tryck mot skärmlocket producerar fortfarande ett slående knarrande/poppande och fläkten har fortfarande problem med slumpartade (och ljudligt irriterande) stunder av plötslig aktivitet. Batteritiden hamnar efter kategorins ledare med god marginal och avsaknaden av ett alternativ för en antireflexbehandlad skärm gör den svår att använda i ljusa miljöer.
Priset på ungefär 42.000 kronor för vår närmast fullmatade recensionsenhet — med sin massiva NVMe SSD-enhet på 2 TB — kommer också få en att tänka till. Det går att hitta aningen billigare alternativ med jämförbar prestanda i form av X1 Extreme, Precision 5530, EliteBook 1050 G1 eller till och med XPS 15-9570. Men det är egentligen inget särskilt som är fel med P1, och vad den lyckas med i fråga om balans är viktigt för att rättfärdiga priset i det konkurrensutsatta företagsuniversat.
Lenovo ThinkPad P1-20MD002LUS
- 10/11/2018 v6 (old)
Steve Schardein
Price comparison
