Test: MSI WS63VR (i7-7700HQ, 4K, Quadro P4000 Max-Q) (Sammanfattning)

| SD Card Reader | |
| average JPG Copy Test (av. of 3 runs) | |
| HP ZBook 15 G4-Y4E80AV | |
| Dell Precision 5520 UHD | |
| Lenovo ThinkPad P51 20HH0016GE | |
| MSI WT72-6QM | |
| MSI WS63VR 7RL-023US | |
| Lenovo ThinkPad P51s 20HB000SGE | |
| MSI WS63 7RF-290US | |
| MSI GS63VR 7RF-228US | |
| maximum AS SSD Seq Read Test (1GB) | |
| Dell Precision 5520 UHD | |
| Lenovo ThinkPad P51 20HH0016GE | |
| MSI WS63VR 7RL-023US | |
| HP ZBook 15 G4-Y4E80AV | |
| MSI WT72-6QM | |
| Lenovo ThinkPad P51s 20HB000SGE | |
| MSI WS63 7RF-290US | |
| MSI GS63VR 7RF-228US | |
| Networking | |
| iperf3 transmit AX12 | |
| MSI GS63VR 7RF-228US | |
| MSI WS63 7RF-290US | |
| Lenovo ThinkPad P51s 20HB000SGE | |
| Lenovo ThinkPad P51 20HH0016GE | |
| Dell Precision 5520 UHD | |
| HP ZBook 15 G4-Y4E80AV | |
| MSI WS63VR 7RL-023US | |
| iperf3 receive AX12 | |
| Lenovo ThinkPad P51s 20HB000SGE | |
| MSI GS63VR 7RF-228US | |
| MSI WS63VR 7RL-023US | |
| Lenovo ThinkPad P51 20HH0016GE | |
| MSI WS63 7RF-290US | |
| Dell Precision 5520 UHD | |
| HP ZBook 15 G4-Y4E80AV | |
| |||||||||||||||||||||||||
Distribution av ljusstyrkan: 85 %
Mitt på batteriet: 259.4 cd/m²
Kontrast: 603:1 (Svärta: 0.43 cd/m²)
ΔE ColorChecker Calman: 5.5 | ∀{0.5-29.43 Ø4.71}
ΔE Greyscale Calman: 3.6 | ∀{0.09-98 Ø4.96}
71% sRGB (Argyll 1.6.3 3D)
45% AdobeRGB 1998 (Argyll 1.6.3 3D)
49% AdobeRGB 1998 (Argyll 3D)
71.4% sRGB (Argyll 3D)
47.43% Display P3 (Argyll 3D)
Gamma: 2.24
CCT: 7163 K
| MSI WS63VR 7RL-023US SAMSUNG LƒFL156FL02-101 , IPS, 15.6", 3840x2160 | HP ZBook 15 G4-Y4E80AV LG Philips LGD057E, IPS, 15.6", 1920x1080 | MSI WS63 7RF-290US ID: LGD046F, Name: LG Philips LP156W6, Dell P/N: 3874Y, IPS, 15.6", 1920x1080 | Lenovo ThinkPad P51 20HH0016GE LEN40BD, B156ZAN02.1, IPS, 15.6", 3840x2160 | Lenovo ThinkPad P51s 20HB000SGE BOE NV156QUM-N44, IPS, 15.6", 3840x2160 | Dell Precision 5520 UHD SHP1476, IPS, 15.6", 3840x2160 | MSI GS63VR 7RF-228US IPS, 15.6", 3840x2160 | MSI WT72-6QM LG Philips LP173WF4-SPF1, IPS, 17.3", 1920x1080 | |
|---|---|---|---|---|---|---|---|---|
| Display | 25% | 26% | 75% | 37% | 40% | 2% | 30% | |
| Display P3 Coverage (%) | 47.43 | 64 35% | 63.6 34% | 86.3 82% | 69.7 47% | 67.4 42% | 48.21 2% | 67.3 42% |
| sRGB Coverage (%) | 71.4 | 82.7 16% | 84.2 18% | 99.5 39% | 91.2 28% | 98.5 38% | 72.6 2% | 85.4 20% |
| AdobeRGB 1998 Coverage (%) | 49 | 60.4 23% | 61.5 26% | 99.3 103% | 66.8 36% | 68.9 41% | 49.81 2% | 62.5 28% |
| Response Times | 2% | -10% | 0% | 5% | -54% | 21% | -3% | |
| Response Time Grey 50% / Grey 80% * (ms) | 36.8 ? | 39.2 ? -7% | 38 ? -3% | 40.8 ? -11% | 38.4 ? -4% | 59.2 ? -61% | 28 ? 24% | 42 ? -14% |
| Response Time Black / White * (ms) | 28.4 ? | 25.6 ? 10% | 33 ? -16% | 25.2 ? 11% | 24.8 ? 13% | 41.6 ? -46% | 23.6 ? 17% | 26 ? 8% |
| PWM Frequency (Hz) | 1351 ? | 20830 ? | 21740 ? | 980 ? | 1351 ? | 86 ? | ||
| Screen | 27% | 24% | 39% | 26% | 30% | -19% | 6% | |
| Brightness middle (cd/m²) | 259.4 | 321 24% | 302.5 17% | 317 22% | 317 22% | 372.4 44% | 274.2 6% | 303 17% |
| Brightness (cd/m²) | 247 | 320 30% | 295 19% | 309 25% | 290 17% | 368 49% | 263 6% | 298 21% |
| Brightness Distribution (%) | 85 | 89 5% | 92 8% | 89 5% | 85 0% | 90 6% | 92 8% | 94 11% |
| Black Level * (cd/m²) | 0.43 | 0.29 33% | 0.31 28% | 0.36 16% | 0.32 26% | 0.48 -12% | 0.44 -2% | 0.46 -7% |
| Contrast (:1) | 603 | 1107 84% | 976 62% | 881 46% | 991 64% | 776 29% | 623 3% | 659 9% |
| Colorchecker dE 2000 * | 5.5 | 4.5 18% | 4.3 22% | 2.7 51% | 3.6 35% | 2.6 53% | 8 -45% | 5.77 -5% |
| Colorchecker dE 2000 max. * | 12.7 | 9.5 25% | 9.4 26% | 4.1 68% | 6.6 48% | 5.6 56% | 14.6 -15% | |
| Greyscale dE 2000 * | 3.6 | 2.9 19% | 3.1 14% | 3 17% | 4.2 -17% | 3.7 -3% | 9.1 -153% | 4.87 -35% |
| Gamma | 2.24 98% | 2.27 97% | 2.16 102% | 2.27 97% | 2.24 98% | 2.14 103% | 2.24 98% | 1.99 111% |
| CCT | 7163 91% | 6519 100% | 7071 92% | 6077 107% | 6740 96% | 7096 92% | 5020 129% | 7363 88% |
| Color Space (Percent of AdobeRGB 1998) (%) | 45 | 54.2 20% | 55 22% | 87.6 95% | 59.5 32% | 63 40% | 45.7 2% | 56.04 25% |
| Color Space (Percent of sRGB) (%) | 71 | 82.6 16% | 84.3 19% | 99.5 40% | 91.1 28% | 99 39% | 72.1 2% | 85.27 20% |
| Totalt genomsnitt (program/inställningar) | 18% /
23% | 13% /
20% | 38% /
41% | 23% /
25% | 5% /
21% | 1% /
-9% | 11% /
10% |
* ... mindre är bättre
Visa svarstider
| ↔ Svarstid svart till vitt | ||
|---|---|---|
| 28.4 ms ... stiga ↗ och falla ↘ kombinerat | ↗ 19.6 ms stiga | 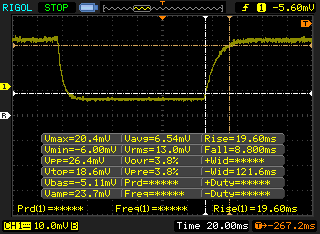 |
| ↘ 8.8 ms hösten | ||
| Skärmen visar relativt långsamma svarsfrekvenser i våra tester och kan vara för långsam för spelare. I jämförelse sträcker sig alla testade enheter från 0.1 (minst) till 240 (maximalt) ms. » 75 % av alla enheter är bättre. Detta innebär att den uppmätta svarstiden är sämre än genomsnittet av alla testade enheter (19.8 ms). | ||
| ↔ Svarstid 50 % grått till 80 % grått | ||
| 36.8 ms ... stiga ↗ och falla ↘ kombinerat | ↗ 21.2 ms stiga | 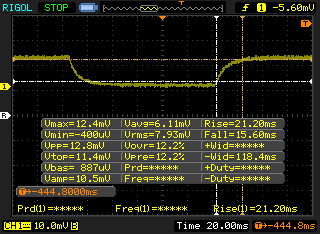 |
| ↘ 15.6 ms hösten | ||
| Skärmen visar långsamma svarsfrekvenser i våra tester och kommer att vara otillfredsställande för spelare. I jämförelse sträcker sig alla testade enheter från 0.165 (minst) till 636 (maximalt) ms. » 53 % av alla enheter är bättre. Detta innebär att den uppmätta svarstiden är sämre än genomsnittet av alla testade enheter (31 ms). | ||
Skärmflimmer / PWM (Puls-Width Modulation)
| Skärmflimmer / PWM upptäckt | 1351 Hz | ≤ 30 % ljusstyrka inställning | 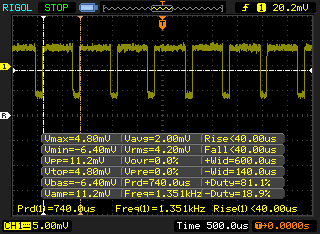 |
Displayens bakgrundsbelysning flimrar vid 1351 Hz (i värsta fall, t.ex. med PWM) Flimrande upptäckt vid en ljusstyrkeinställning på 30 % och lägre. Det ska inte finnas något flimmer eller PWM över denna ljusstyrkeinställning. Frekvensen för 1351 Hz är ganska hög, så de flesta användare som är känsliga för PWM bör inte märka något flimmer. Som jämförelse: 52 % av alla testade enheter använder inte PWM för att dämpa skärmen. Om PWM upptäcktes mättes ett medelvärde av 7754 (minst: 5 - maximum: 343500) Hz. | |||
| Cinebench R15 | |
| CPU Single 64Bit | |
| HP ZBook 15 G4-Y4E80AV | |
| Lenovo ThinkPad P51 20HH0016GE | |
| Dell Precision 5520 UHD | |
| MSI GS63VR 7RF-228US | |
| Lenovo ThinkPad P51s 20HB000SGE | |
| MSI WS63 7RF-290US | |
| MSI WT72-6QM | |
| MSI WS63VR 7RL-023US | |
| CPU Multi 64Bit | |
| HP ZBook 15 G4-Y4E80AV | |
| Lenovo ThinkPad P51 20HH0016GE | |
| MSI WS63 7RF-290US | |
| MSI GS63VR 7RF-228US | |
| MSI WS63VR 7RL-023US | |
| MSI WT72-6QM | |
| Dell Precision 5520 UHD | |
| Lenovo ThinkPad P51s 20HB000SGE | |
| Cinebench R11.5 | |
| CPU Single 64Bit | |
| Dell Precision 5520 UHD | |
| Lenovo ThinkPad P51 20HH0016GE | |
| Lenovo ThinkPad P51s 20HB000SGE | |
| MSI WS63 7RF-290US | |
| MSI WT72-6QM | |
| MSI GS63VR 7RF-228US | |
| MSI WS63VR 7RL-023US | |
| CPU Multi 64Bit | |
| Lenovo ThinkPad P51 20HH0016GE | |
| MSI GS63VR 7RF-228US | |
| MSI WS63 7RF-290US | |
| MSI WS63VR 7RL-023US | |
| Dell Precision 5520 UHD | |
| MSI WT72-6QM | |
| Lenovo ThinkPad P51s 20HB000SGE | |
| Cinebench R10 | |
| Rendering Multiple CPUs 32Bit | |
| MSI WS63VR 7RL-023US | |
| Lenovo ThinkPad P51 20HH0016GE | |
| MSI WS63 7RF-290US | |
| MSI GS63VR 7RF-228US | |
| MSI WT72-6QM | |
| Lenovo ThinkPad P51s 20HB000SGE | |
| Rendering Single 32Bit | |
| Lenovo ThinkPad P51 20HH0016GE | |
| Lenovo ThinkPad P51s 20HB000SGE | |
| MSI WS63 7RF-290US | |
| MSI GS63VR 7RF-228US | |
| MSI WT72-6QM | |
| wPrime 2.10 - 1024m | |
| Lenovo ThinkPad P51 20HH0016GE | |
| Dell Precision 5520 UHD | |
| MSI GS63VR 7RF-228US | |
| MSI WS63 7RF-290US | |
| MSI WS63VR 7RL-023US | |
* ... mindre är bättre
| PCMark 8 | |
| Home Score Accelerated v2 | |
| MSI WT72-6QM | |
| HP ZBook 15 G4-Y4E80AV | |
| MSI WS63 7RF-290US | |
| MSI GS63VR 7RF-228US | |
| MSI WS63VR 7RL-023US | |
| Lenovo ThinkPad P51 20HH0016GE | |
| Dell Precision 5520 UHD | |
| Lenovo ThinkPad P51s 20HB000SGE | |
| Work Score Accelerated v2 | |
| MSI WT72-6QM | |
| HP ZBook 15 G4-Y4E80AV | |
| MSI WS63 7RF-290US | |
| MSI GS63VR 7RF-228US | |
| MSI WS63VR 7RL-023US | |
| Dell Precision 5520 UHD | |
| Lenovo ThinkPad P51 20HH0016GE | |
| Lenovo ThinkPad P51s 20HB000SGE | |
| Creative Score Accelerated v2 | |
| Lenovo ThinkPad P51 20HH0016GE | |
| HP ZBook 15 G4-Y4E80AV | |
| MSI WS63 7RF-290US | |
| MSI WS63VR 7RL-023US | |
| MSI GS63VR 7RF-228US | |
| Dell Precision 5520 UHD | |
| Lenovo ThinkPad P51s 20HB000SGE | |
| PCMark 8 Home Score Accelerated v2 | 3739 poäng | |
| PCMark 8 Creative Score Accelerated v2 | 5328 poäng | |
| PCMark 8 Work Score Accelerated v2 | 4390 poäng | |
| PCMark 10 Score | 4751 poäng | |
Hjälp | ||
| MSI WS63VR 7RL-023US Toshiba NVMe THNSN5512GPU7 | MSI WS63 7RF-290US Samsung SM961 MZVKW512HMJP m.2 PCI-e | Lenovo ThinkPad P51 20HH0016GE Samsung PM961 NVMe MZVLW512HMJP | Lenovo ThinkPad P51s 20HB000SGE Samsung SSD PM961 1TB M.2 PCIe 3.0 x4 NVMe (MZVLW1T0) | Dell Precision 5520 UHD Samsung SM961 MZVKW512HMJP m.2 PCI-e | MSI GS63VR 7RF-228US Samsung SM961 MZVKW512HMJP m.2 PCI-e | MSI WT72-6QM Toshiba NVMe THNSN5256GPU7 | |
|---|---|---|---|---|---|---|---|
| AS SSD | 75% | 55% | 43% | 76% | 75% | 11% | |
| Copy Game MB/s (MB/s) | 1121 | 1140 | 721 | 921 | 1082 | 1025 | |
| Copy Program MB/s (MB/s) | 447.3 | 425.6 | 411.5 | 372.8 | 401.9 | 554 | |
| Copy ISO MB/s (MB/s) | 1760 | 1607 | 1200 | 1659 | 1666 | 1777 | |
| Score Total (Points) | 1979 | 3759 90% | 3424 73% | 2771 40% | 3681 86% | 3756 90% | 2433 23% |
| Score Write (Points) | 557 | 1440 159% | 917 65% | 1271 128% | 1379 148% | 1468 164% | 651 17% |
| Score Read (Points) | 962 | 1568 63% | 1690 76% | 990 3% | 1554 62% | 1549 61% | 1237 29% |
| Access Time Write * (ms) | 0.033 | 0.028 15% | 0.025 24% | 0.027 18% | 0.023 30% | 0.029 12% | 0.04 -21% |
| Access Time Read * (ms) | 0.128 | 0.036 72% | 0.032 75% | 0.082 36% | 0.038 70% | 0.041 68% | 0.092 28% |
| 4K-64 Write (MB/s) | 314 | 1151 267% | 623 98% | 1018 224% | 1055 236% | 1185 277% | 473.5 51% |
| 4K-64 Read (MB/s) | 710 | 1244 75% | 1372 93% | 792 12% | 1223 72% | 1229 73% | 935 32% |
| 4K Write (MB/s) | 114.6 | 128.5 12% | 143.1 25% | 130.8 14% | 155.3 36% | 127.6 11% | 96.4 -16% |
| 4K Read (MB/s) | 40.2 | 49.02 22% | 55.6 38% | 52.8 31% | 51.5 28% | 48.01 19% | 37.5 -7% |
| Seq Write (MB/s) | 1287 | 1603 25% | 1506 17% | 1217 -5% | 1694 32% | 1550 20% | 810 -37% |
| Seq Read (MB/s) | 2133 | 2750 29% | 2624 23% | 1450 -32% | 2799 31% | 2719 27% | 2638 24% |
* ... mindre är bättre

| LuxMark v2.0 64Bit | |
| Room GPUs-only | |
| MSI WS63VR 7RL-023US | |
| Fujitsu Celsius H970 | |
| Lenovo ThinkPad P71-20HK0004GE | |
| MSI WS63 7RF-290US | |
| MSI WT72-6QM | |
| Lenovo ThinkPad P51 20HH0016GE | |
| HP ZBook 15 G4-Y4E80AV | |
| Dell Precision 5520 UHD | |
| Lenovo ThinkPad P51s 20HB000SGE | |
| Sala GPUs-only | |
| MSI WS63VR 7RL-023US | |
| Fujitsu Celsius H970 | |
| Lenovo ThinkPad P71-20HK0004GE | |
| MSI WS63 7RF-290US | |
| MSI WT72-6QM | |
| Lenovo ThinkPad P51 20HH0016GE | |
| HP ZBook 15 G4-Y4E80AV | |
| Dell Precision 5520 UHD | |
| Lenovo ThinkPad P51s 20HB000SGE | |
| 3DMark 11 | |
| 1280x720 Performance GPU | |
| Aorus X7 v7 | |
| Asus Zephyrus GX501VS | |
| MSI WS63VR 7RL-023US | |
| Fujitsu Celsius H970 | |
| Acer Aspire 7 A717-71G-72VY | |
| MSI GS63VR 7RF-228US | |
| Lenovo Legion Y520-15IKBM 80YY001APB | |
| MSI WS63 7RF-290US | |
| MSI WT72-6QM | |
| Lenovo ThinkPad P71-20HK0004GE | |
| Lenovo ThinkPad P70-20ER000XUS | |
| Lenovo ThinkPad P51 20HH0016GE | |
| Dell Precision 5520 UHD | |
| Lenovo ThinkPad P51s 20HB000SGE | |
| 1280x720 Performance Combined | |
| Aorus X7 v7 | |
| Lenovo ThinkPad P71-20HK0004GE | |
| MSI WT72-6QM | |
| MSI WS63VR 7RL-023US | |
| Asus Zephyrus GX501VS | |
| MSI WS63 7RF-290US | |
| MSI GS63VR 7RF-228US | |
| Lenovo ThinkPad P70-20ER000XUS | |
| Fujitsu Celsius H970 | |
| Lenovo ThinkPad P51 20HH0016GE | |
| Acer Aspire 7 A717-71G-72VY | |
| Lenovo Legion Y520-15IKBM 80YY001APB | |
| Dell Precision 5520 UHD | |
| Lenovo ThinkPad P51s 20HB000SGE | |
| 3DMark | |
| 1280x720 Cloud Gate Standard Graphics | |
| Aorus X7 v7 | |
| Asus Zephyrus GX501VS | |
| MSI WS63VR 7RL-023US | |
| Acer Aspire 7 A717-71G-72VY | |
| MSI WS63 7RF-290US | |
| MSI WT72-6QM | |
| Lenovo ThinkPad P71-20HK0004GE | |
| Lenovo Legion Y520-15IKBM 80YY001APB | |
| Fujitsu Celsius H970 | |
| Lenovo ThinkPad P70-20ER000XUS | |
| HP ZBook 15 G4-Y4E80AV | |
| Lenovo ThinkPad P51 20HH0016GE | |
| MSI GS63VR 7RF-228US | |
| Dell Precision 5520 UHD | |
| Lenovo ThinkPad P51s 20HB000SGE | |
| 1920x1080 Fire Strike Graphics | |
| Aorus X7 v7 | |
| Asus Zephyrus GX501VS | |
| MSI WS63VR 7RL-023US | |
| Fujitsu Celsius H970 | |
| Acer Aspire 7 A717-71G-72VY | |
| MSI GS63VR 7RF-228US | |
| Lenovo Legion Y520-15IKBM 80YY001APB | |
| MSI WS63 7RF-290US | |
| MSI WT72-6QM | |
| Lenovo ThinkPad P71-20HK0004GE | |
| Lenovo ThinkPad P70-20ER000XUS | |
| Lenovo ThinkPad P51 20HH0016GE | |
| HP ZBook 15 G4-Y4E80AV | |
| Dell Precision 5520 UHD | |
| Lenovo ThinkPad P51s 20HB000SGE | |
| 1920x1080 Ice Storm Extreme Graphics | |
| Aorus X7 v7 | |
| MSI WT72-6QM | |
| Asus Zephyrus GX501VS | |
| Lenovo ThinkPad P70-20ER000XUS | |
| MSI WS63 7RF-290US | |
| Lenovo Legion Y520-15IKBM 80YY001APB | |
| Dell Precision 5520 UHD | |
| Lenovo ThinkPad P51s 20HB000SGE | |
| 3DMark 06 Standard Score | 28211 poäng | |
| 3DMark 11 Performance | 13482 poäng | |
| 3DMark Cloud Gate Standard Score | 25528 poäng | |
| 3DMark Fire Strike Score | 10473 poäng | |
Hjälp | ||
| The Witcher 3 | |
| 1920x1080 Ultra Graphics & Postprocessing (HBAO+) | |
| Aorus X7 v7 | |
| Asus Zephyrus GX501VS | |
| MSI WS63VR 7RL-023US | |
| Fujitsu Celsius H970 | |
| MSI GS63VR 7RF-228US | |
| Acer Aspire 7 A717-71G-72VY | |
| Lenovo Legion Y520-15IKBM 80YY001APB | |
| MSI WS63 7RF-290US | |
| Lenovo ThinkPad P71-20HK0004GE | |
| Lenovo ThinkPad P51 20HH0016GE | |
| HP ZBook 15 G4-Y4E80AV | |
| 3840x2160 High Graphics & Postprocessing (Nvidia HairWorks Off) | |
| MSI WS63VR 7RL-023US | |
| MSI GS63VR 7RF-228US | |
| Lenovo ThinkPad P71-20HK0004GE | |
| Lenovo ThinkPad P51 20HH0016GE | |
| Batman: Arkham Knight | |
| 3840x2160 High / On (Interactive Smoke & Paper Debris Off) AA:SM AF:8x | |
| MSI WS63VR 7RL-023US | |
| MSI GS63VR 7RF-228US | |
| Dell Precision 5520 UHD | |
| 1920x1080 High / On AA:SM AF:16x | |
| MSI WS63VR 7RL-023US | |
| Asus Zephyrus GX501VS | |
| MSI GS63VR 7RF-228US | |
| MSI WS63 7RF-290US | |
| Lenovo Legion Y520-15IKBM 80YY001APB | |
| Dell Precision 5520 UHD | |
| BioShock Infinite - 1920x1080 Ultra Preset, DX11 (DDOF) | |
| Aorus X7 v7 | |
| Asus Zephyrus GX501VS | |
| MSI WS63VR 7RL-023US | |
| MSI GS63VR 7RF-228US | |
| Fujitsu Celsius H970 | |
| MSI WS63 7RF-290US | |
| Lenovo ThinkPad P71-20HK0004GE | |
| Lenovo Legion Y520-15IKBM 80YY001APB | |
| Lenovo ThinkPad P70-20ER000XUS | |
| HP ZBook 15 G4-Y4E80AV | |
| Dell Precision 5520 UHD | |
| Lenovo ThinkPad P51s 20HB000SGE | |
| Metro: Last Light - 1920x1080 Very High (DX11) AF:16x | |
| Asus Zephyrus GX501VS | |
| MSI WS63VR 7RL-023US | |
| MSI GS63VR 7RF-228US | |
| MSI WS63 7RF-290US | |
| MSI WT72-6QM | |
| Rise of the Tomb Raider | |
| 3840x2160 High Preset AA:FX AF:4x | |
| MSI WS63VR 7RL-023US | |
| MSI GS63VR 7RF-228US | |
| Lenovo ThinkPad P71-20HK0004GE | |
| Lenovo ThinkPad P70-20ER000XUS | |
| Lenovo ThinkPad P51 20HH0016GE | |
| 1920x1080 Very High Preset AA:FX AF:16x | |
| Asus Zephyrus GX501VS | |
| Fujitsu Celsius H970 | |
| MSI WS63VR 7RL-023US | |
| MSI GS63VR 7RF-228US | |
| MSI WS63 7RF-290US | |
| Lenovo ThinkPad P71-20HK0004GE | |
| Lenovo ThinkPad P70-20ER000XUS | |
| Lenovo ThinkPad P51 20HH0016GE | |
| HP ZBook 15 G4-Y4E80AV | |
| Lenovo ThinkPad P51s 20HB000SGE | |
| Ashes of the Singularity | |
| 1920x1080 high | |
| Asus Zephyrus GX501VS | |
| MSI WS63VR 7RL-023US | |
| MSI WS63 7RF-290US | |
| Lenovo ThinkPad P51s 20HB000SGE | |
| 3840x2160 extreme | |
| MSI WS63VR 7RL-023US | |
| 3840x2160 crazy | |
| MSI WS63VR 7RL-023US | |
| Civilization 6 | |
| 3840x2160 High Preset | |
| MSI WS63VR 7RL-023US | |
| 1920x1080 Ultra Preset AA:4xMS | |
| MSI WS63VR 7RL-023US | |
| Fujitsu Celsius H970 | |
| Lenovo ThinkPad P51s 20HB000SGE | |
| låg | med. | hög | ultra | 4K | |
|---|---|---|---|---|---|
| Batman: Arkham City (2011) | 195 | 170 | 144 | 106 | |
| BioShock Infinite (2013) | 256 | 218 | 202 | 113 | |
| Metro: Last Light (2013) | 129 | 79 | 78 | 84 | |
| Company of Heroes 2 (2013) | 69 | 63 | 62 | 50 | |
| Batman: Arkham Origins (2013) | 330 | 270 | 177 | 82 | |
| Thief (2014) | 96 | 94 | 93 | 79 | |
| Middle-earth: Shadow of Mordor (2014) | 123 | 112 | 107 | 90 | |
| Alien: Isolation (2014) | 250 | 212 | 192 | 148 | |
| Ryse: Son of Rome (2014) | 121 | 111 | 88 | 82 | |
| The Witcher 3 (2015) | 162 | 119 | 79 | 42 | 29 |
| Batman: Arkham Knight (2015) | 171 | 152 | 96 | 94 | 32 |
| Metal Gear Solid V (2015) | 60 | 60 | 60 | 60 | 50 |
| Call of Duty: Black Ops 3 (2015) | 145 | 133 | 85 | 82 | 32 |
| Fallout 4 (2015) | 156 | 151 | 93 | 76 | 30 |
| Just Cause 3 (2015) | 140 | 133 | 89 | 77 | 35 |
| Rise of the Tomb Raider (2016) | 176 | 144 | 77 | 65 | 28 |
| Ashes of the Singularity (2016) | 76 | 67 | 62 | 26 | |
| Doom (2016) | 130 | 121 | 97 | 92 | 35 |
| Deus Ex Mankind Divided (2016) | 129 | 106 | 60 | 32 | 21 |
| Mafia 3 (2016) | 84 | 104 | 43 | 17 | |
| Civilization 6 (2016) | 80 | 76 | 63 | 60 | 44 |
| Resident Evil 7 (2017) | 354 | 195 | 161 | 135 | 60 |
| Prey (2017) | 142 | 129 | 125 | 109 | 38 |
| Rocket League (2017) | 244 | 223 | 163 | ||
| Dirt 4 (2017) | 220 | 164 | 93 | 55 | 34 |
| F1 2017 (2017) | 193 | 140 | 105 | 72 | 34 |
| Ark Survival Evolved (2017) | 92 | 52 | 51 | 27 | 27 |
Ljudnivå
| Låg belastning |
| 33.2 / 33.2 / 33.2 dB(A) |
| Hög belastning |
| 41.4 / 43.5 dB(A) |
 | ||
30 dB tyst 40 dB(A) hörbar 50 dB(A) högt ljud |
||
min: | ||
| MSI WS63VR 7RL-023US Quadro P4000 Max-Q, i7-7700HQ, Toshiba NVMe THNSN5512GPU7 | HP ZBook 15 G4-Y4E80AV Quadro M2200, E3-1535M v6, Samsung SSD SM961 1TB M.2 MZVKW1T0HMLH | MSI WS63 7RF-290US Quadro P3000, i7-7700HQ, Samsung SM961 MZVKW512HMJP m.2 PCI-e | Lenovo ThinkPad P51 20HH0016GE Quadro M2200, E3-1505M v6, Samsung PM961 NVMe MZVLW512HMJP | Lenovo ThinkPad P51s 20HB000SGE Quadro M520, i7-7600U, Samsung SSD PM961 1TB M.2 PCIe 3.0 x4 NVMe (MZVLW1T0) | Dell Precision 5520 UHD Quadro M1200, E3-1505M v6, Samsung SM961 MZVKW512HMJP m.2 PCI-e | MSI GS63VR 7RF-228US GeForce GTX 1060 Mobile, i7-7700HQ, Samsung SM961 MZVKW512HMJP m.2 PCI-e | MSI WT72-6QM Quadro M5000M, E3-1505M v5, Toshiba NVMe THNSN5256GPU7 | |
|---|---|---|---|---|---|---|---|---|
| Noise | 7% | 6% | 11% | 8% | -1% | -3% | 2% | |
| av / miljö * (dB) | 28 | 29.5 -5% | 28.1 -0% | 29.6 -6% | 29.2 -4% | 28.7 -2% | 28.8 -3% | |
| Idle Minimum * (dB) | 33.2 | 29.5 11% | 28.1 15% | 29.6 11% | 29.2 12% | 28.7 14% | 33.1 -0% | 33.3 -0% |
| Idle Average * (dB) | 33.2 | 29.5 11% | 28.1 15% | 29.6 11% | 29.2 12% | 32.1 3% | 33.1 -0% | 33.4 -1% |
| Idle Maximum * (dB) | 33.2 | 30 10% | 32 4% | 29.6 11% | 31.1 6% | 32.1 3% | 34 -2% | 33.5 -1% |
| Load Average * (dB) | 41.4 | 39.5 5% | 38 8% | 32.2 22% | 36.7 11% | 41.3 -0% | 37.2 10% | 38.8 6% |
| Witcher 3 ultra * (dB) | 38.4 | 39.5 -3% | 35.8 7% | 45.5 -18% | 46.1 -20% | |||
| Load Maximum * (dB) | 43.5 | 36 17% | 47.2 -9% | 36.6 16% | 39.4 9% | 45.5 -5% | 47.1 -8% | 40.2 8% |
* ... mindre är bättre
(±) Den maximala temperaturen på ovansidan är 45 °C / 113 F, jämfört med genomsnittet av 38.2 °C / 101 F , allt från 22.2 till 69.8 °C för klassen Workstation.
(-) Botten värms upp till maximalt 56.8 °C / 134 F, jämfört med genomsnittet av 41.1 °C / 106 F
(+) Vid tomgångsbruk är medeltemperaturen för ovansidan 25.9 °C / 79 F, jämfört med enhetsgenomsnittet på 32 °C / ### class_avg_f### F.
(±) När du spelar The Witcher 3 är medeltemperaturen för ovansidan 37.1 °C / 99 F, jämfört med enhetsgenomsnittet på 32 °C / ## #class_avg_f### F.
(+) Handledsstöden och pekplattan når maximal hudtemperatur (35.4 °C / 95.7 F) och är därför inte varma.
(-) Medeltemperaturen för handledsstödsområdet på liknande enheter var 27.8 °C / 82 F (-7.6 °C / -13.7 F).
MSI WS63VR 7RL-023US ljudanalys
(±) | högtalarljudstyrkan är genomsnittlig men bra (73.2 dB)
Bas 100 - 315 Hz
(±) | reducerad bas - i genomsnitt 11.6% lägre än medianen
(+) | basen är linjär (6% delta till föregående frekvens)
Mellan 400 - 2000 Hz
(±) | högre mellan - i genomsnitt 6.7% högre än median
(±) | linjäriteten för mids är genomsnittlig (14% delta till föregående frekvens)
Högsta 2 - 16 kHz
(+) | balanserade toppar - endast 1.4% från medianen
(+) | toppar är linjära (5.5% delta till föregående frekvens)
Totalt 100 - 16 000 Hz
(±) | linjäriteten för det totala ljudet är genomsnittlig (26% skillnad mot median)
Jämfört med samma klass
» 87% av alla testade enheter i den här klassen var bättre, 6% liknande, 6% sämre
» Den bästa hade ett delta på 7%, genomsnittet var 17%, sämst var 35%
Jämfört med alla testade enheter
» 80% av alla testade enheter var bättre, 4% liknande, 16% sämre
» Den bästa hade ett delta på 4%, genomsnittet var 23%, sämst var 134%
Lenovo ThinkPad P51 20HH0016GE ljudanalys
(-) | inte särskilt höga högtalare (64.5 dB)
Bas 100 - 315 Hz
(±) | reducerad bas - i genomsnitt 12.3% lägre än medianen
(±) | linjäriteten för basen är genomsnittlig (10.4% delta till föregående frekvens)
Mellan 400 - 2000 Hz
(+) | balanserad mellan - endast 3.9% från medianen
(+) | mids är linjära (6.4% delta till föregående frekvens)
Högsta 2 - 16 kHz
(+) | balanserade toppar - endast 2.7% från medianen
(±) | linjäriteten för toppar är genomsnittlig (13.3% delta till föregående frekvens)
Totalt 100 - 16 000 Hz
(±) | linjäriteten för det totala ljudet är genomsnittlig (24.7% skillnad mot median)
Jämfört med samma klass
» 86% av alla testade enheter i den här klassen var bättre, 2% liknande, 12% sämre
» Den bästa hade ett delta på 7%, genomsnittet var 17%, sämst var 35%
Jämfört med alla testade enheter
» 75% av alla testade enheter var bättre, 5% liknande, 19% sämre
» Den bästa hade ett delta på 4%, genomsnittet var 23%, sämst var 134%
Dell Precision 5520 UHD ljudanalys
(±) | högtalarljudstyrkan är genomsnittlig men bra (79.6 dB)
Bas 100 - 315 Hz
(±) | reducerad bas - i genomsnitt 12.8% lägre än medianen
(±) | linjäriteten för basen är genomsnittlig (14.2% delta till föregående frekvens)
Mellan 400 - 2000 Hz
(+) | balanserad mellan - endast 4% från medianen
(±) | linjäriteten för mids är genomsnittlig (9.9% delta till föregående frekvens)
Högsta 2 - 16 kHz
(+) | balanserade toppar - endast 3.3% från medianen
(±) | linjäriteten för toppar är genomsnittlig (12% delta till föregående frekvens)
Totalt 100 - 16 000 Hz
(±) | linjäriteten för det totala ljudet är genomsnittlig (16.7% skillnad mot median)
Jämfört med samma klass
» 46% av alla testade enheter i den här klassen var bättre, 9% liknande, 45% sämre
» Den bästa hade ett delta på 7%, genomsnittet var 17%, sämst var 35%
Jämfört med alla testade enheter
» 29% av alla testade enheter var bättre, 7% liknande, 64% sämre
» Den bästa hade ett delta på 4%, genomsnittet var 23%, sämst var 134%
| Av/Standby | |
| Låg belastning | |
| Hög belastning |
|
Förklaring:
min: | |
| MSI WS63VR 7RL-023US i7-7700HQ, Quadro P4000 Max-Q, Toshiba NVMe THNSN5512GPU7, IPS, 3840x2160, 15.6" | Fujitsu Celsius H970 E3-1535M v6, Quadro P4000, Samsung SM961 MZVKW512HMJP m.2 PCI-e, IPS LED, 1920x1080, 17.3" | MSI WS63 7RF-290US i7-7700HQ, Quadro P3000, Samsung SM961 MZVKW512HMJP m.2 PCI-e, IPS, 1920x1080, 15.6" | MSI GS63VR 7RF-228US i7-7700HQ, GeForce GTX 1060 Mobile, Samsung SM961 MZVKW512HMJP m.2 PCI-e, IPS, 3840x2160, 15.6" | MSI WT72-6QM E3-1505M v5, Quadro M5000M, Toshiba NVMe THNSN5256GPU7, IPS, 1920x1080, 17.3" | HP ZBook 15 G4-Y4E80AV E3-1535M v6, Quadro M2200, Samsung SSD SM961 1TB M.2 MZVKW1T0HMLH, IPS, 1920x1080, 15.6" | Lenovo ThinkPad P51 20HH0016GE E3-1505M v6, Quadro M2200, Samsung PM961 NVMe MZVLW512HMJP, IPS, 3840x2160, 15.6" | Lenovo ThinkPad P51s 20HB000SGE i7-7600U, Quadro M520, Samsung SSD PM961 1TB M.2 PCIe 3.0 x4 NVMe (MZVLW1T0), IPS, 3840x2160, 15.6" | Dell Precision 5520 UHD E3-1505M v6, Quadro M1200, Samsung SM961 MZVKW512HMJP m.2 PCI-e, IPS, 3840x2160, 15.6" | |
|---|---|---|---|---|---|---|---|---|---|
| Power Consumption | -0% | 5% | -9% | -64% | 16% | 1% | 36% | 8% | |
| Idle Minimum * (Watt) | 13.3 | 10.7 20% | 11 17% | 14.5 -9% | 24.8 -86% | 5.9 56% | 8.6 35% | 5.8 56% | 8.9 33% |
| Idle Average * (Watt) | 17.2 | 15.8 8% | 14.2 17% | 17.3 -1% | 29.7 -73% | 8.9 48% | 15.9 8% | 10.4 40% | 13.6 21% |
| Idle Maximum * (Watt) | 17.9 | 17.8 1% | 14.6 18% | 17.4 3% | 30.1 -68% | 12.7 29% | 22.1 -23% | 13.5 25% | 14.1 21% |
| Load Average * (Watt) | 83.7 | 92 -10% | 77.7 7% | 93 -11% | 105.2 -26% | 95.2 -14% | 84.4 -1% | 62.4 25% | 100.3 -20% |
| Witcher 3 ultra * (Watt) | 101.9 | 89.1 13% | 128.8 -26% | 87.7 14% | 100.2 2% | ||||
| Load Maximum * (Watt) | 114.3 | 137 -20% | 161.7 -41% | 192.2 -68% | 154 -35% | 130.6 -14% | 73.1 36% | 126.3 -10% |
* ... mindre är bättre
| MSI WS63VR 7RL-023US i7-7700HQ, Quadro P4000 Max-Q, 48 Wh | MSI WS63 7RF-290US i7-7700HQ, Quadro P3000, 65 Wh | Lenovo ThinkPad P51 20HH0016GE E3-1505M v6, Quadro M2200, 90 Wh | Lenovo ThinkPad P51s 20HB000SGE i7-7600U, Quadro M520, 104 Wh | Dell Precision 5520 UHD E3-1505M v6, Quadro M1200, 97 Wh | MSI GS63VR 7RF-228US i7-7700HQ, GeForce GTX 1060 Mobile, 65 Wh | MSI WT72-6QM E3-1505M v5, Quadro M5000M, Wh | |
|---|---|---|---|---|---|---|---|
| Batteridrifttid | 59% | 179% | 462% | 89% | 47% | 54% | |
| Reader / Idle (h) | 3.9 | 7.1 82% | 16.4 321% | 26.4 577% | 12.1 210% | 6.4 64% | 6.9 77% |
| WiFi v1.3 (h) | 2.9 | 4.7 62% | 6.9 138% | 11.9 310% | 4.2 45% | 3.9 34% | 4.1 41% |
| Load (h) | 0.9 | 1.2 33% | 1.6 78% | 5.4 500% | 1 11% | 1.3 44% | 1.3 44% |
För
Emot
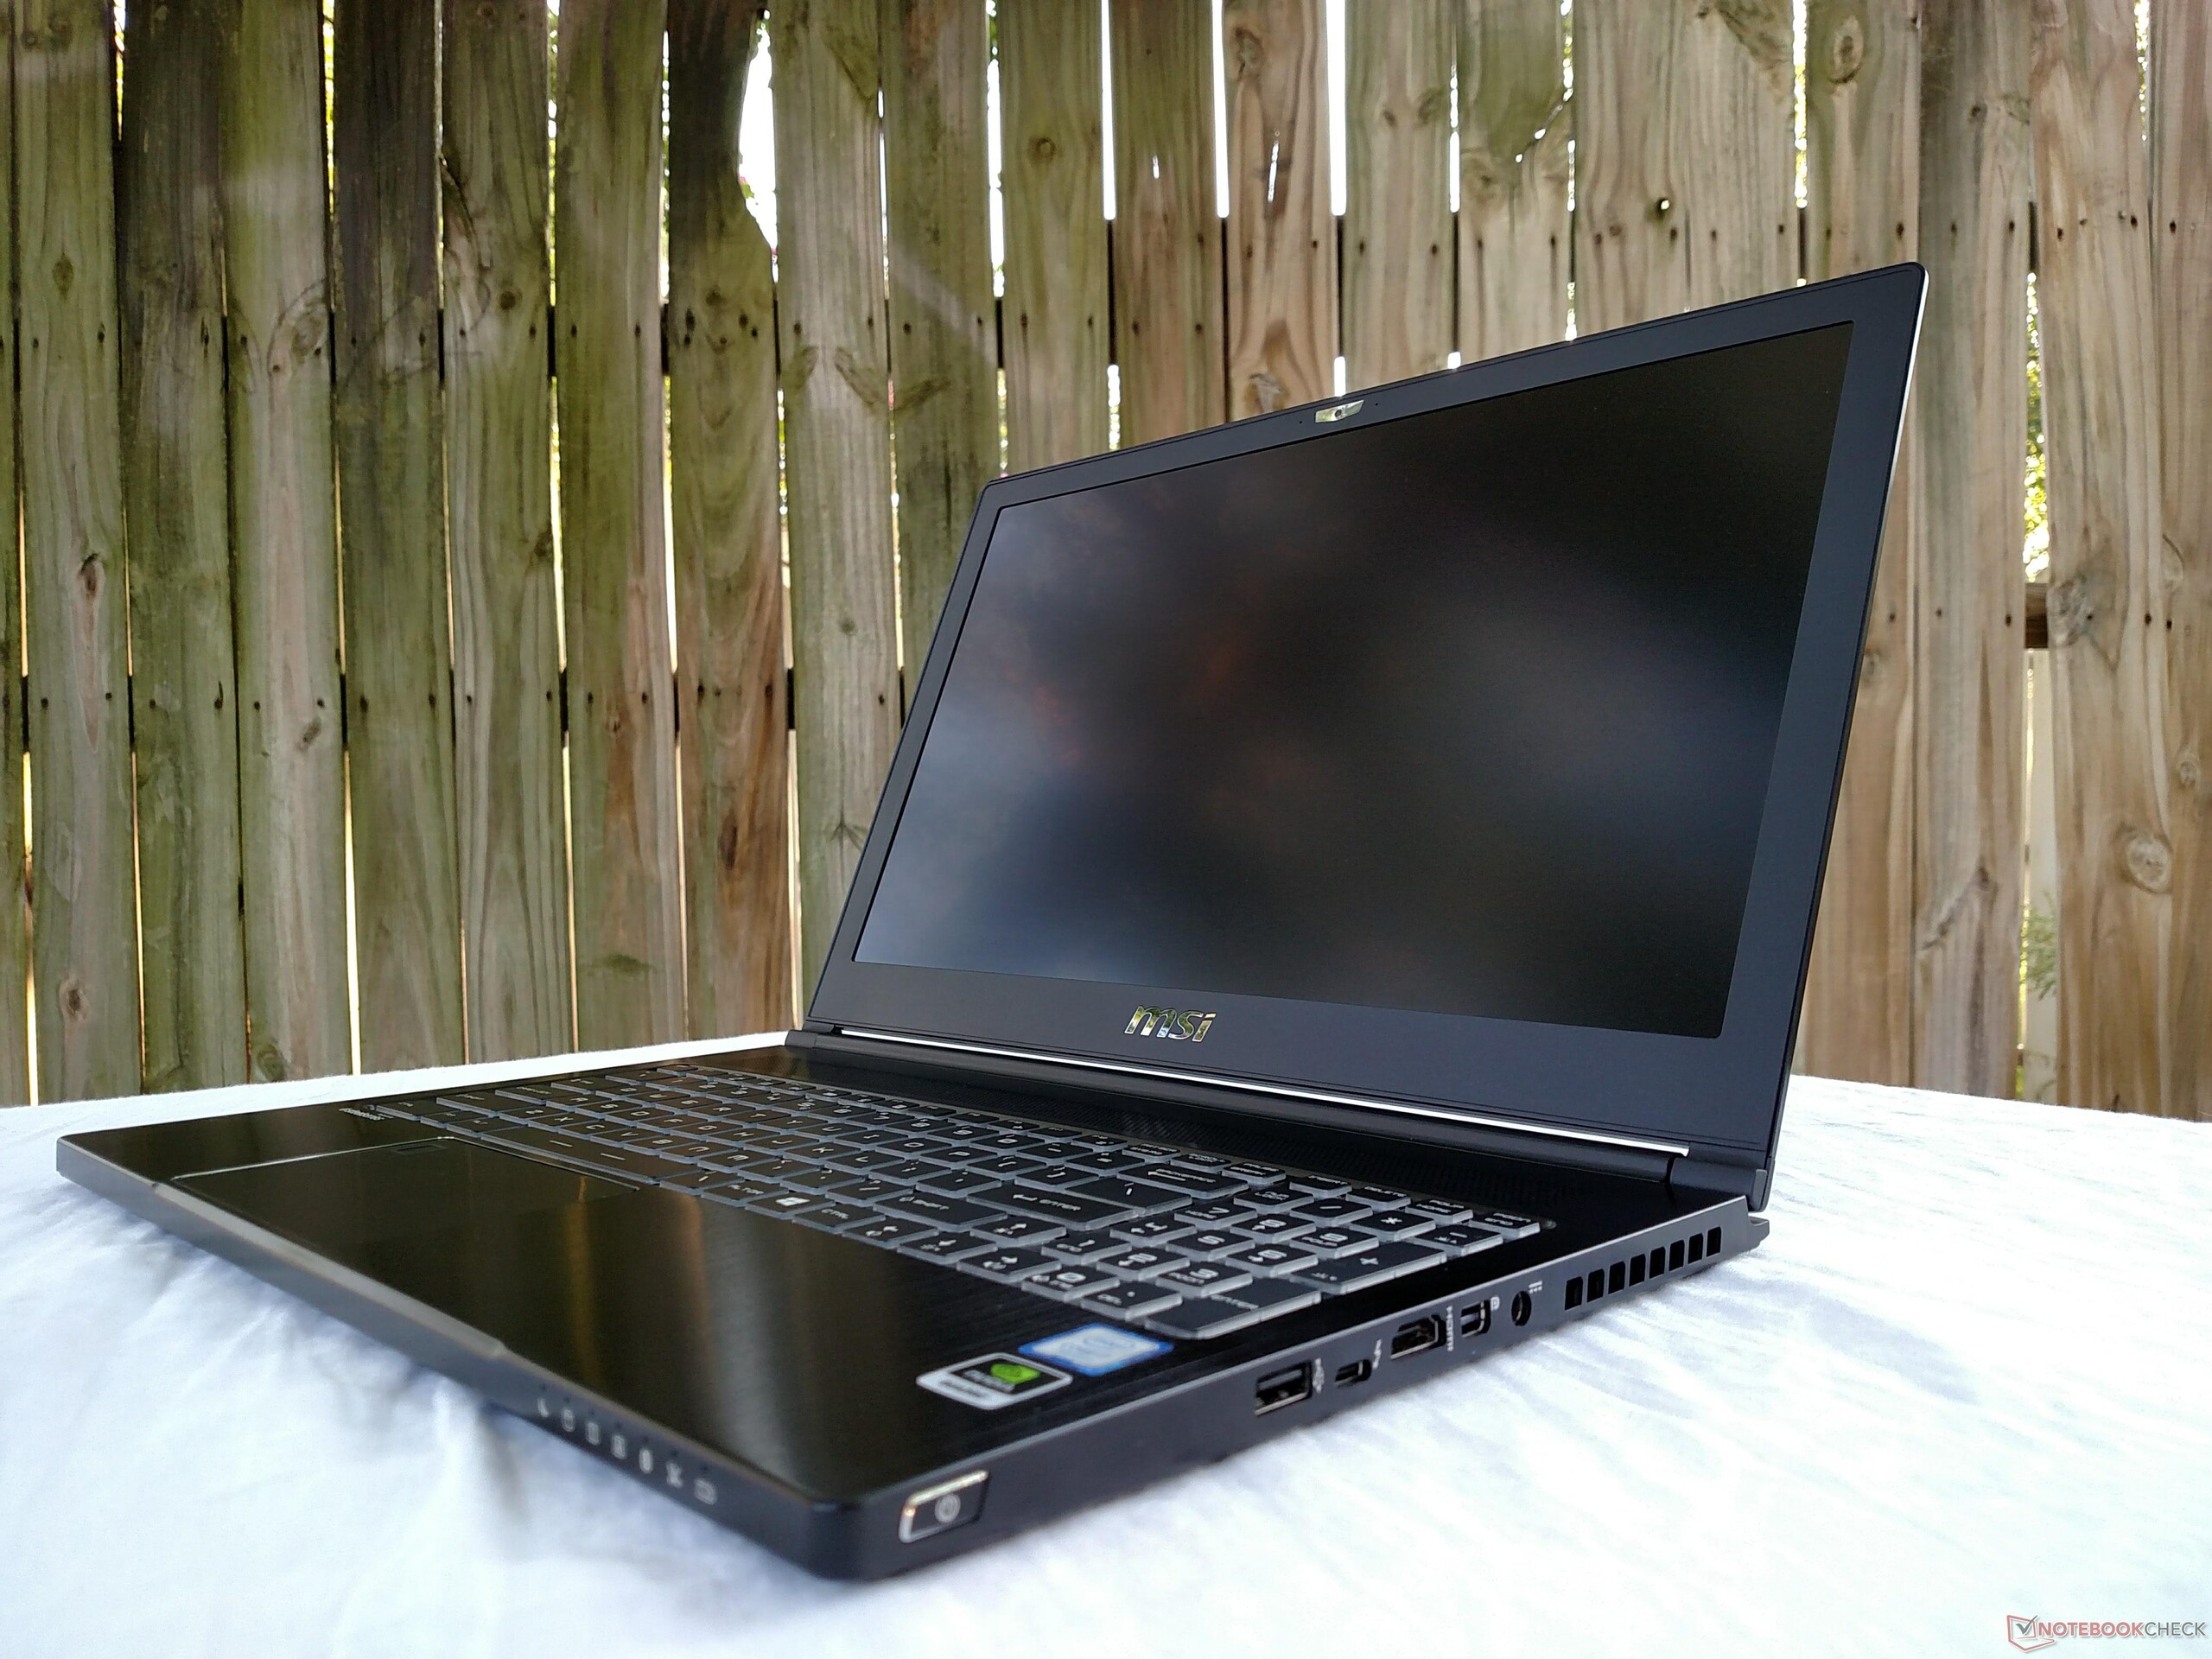
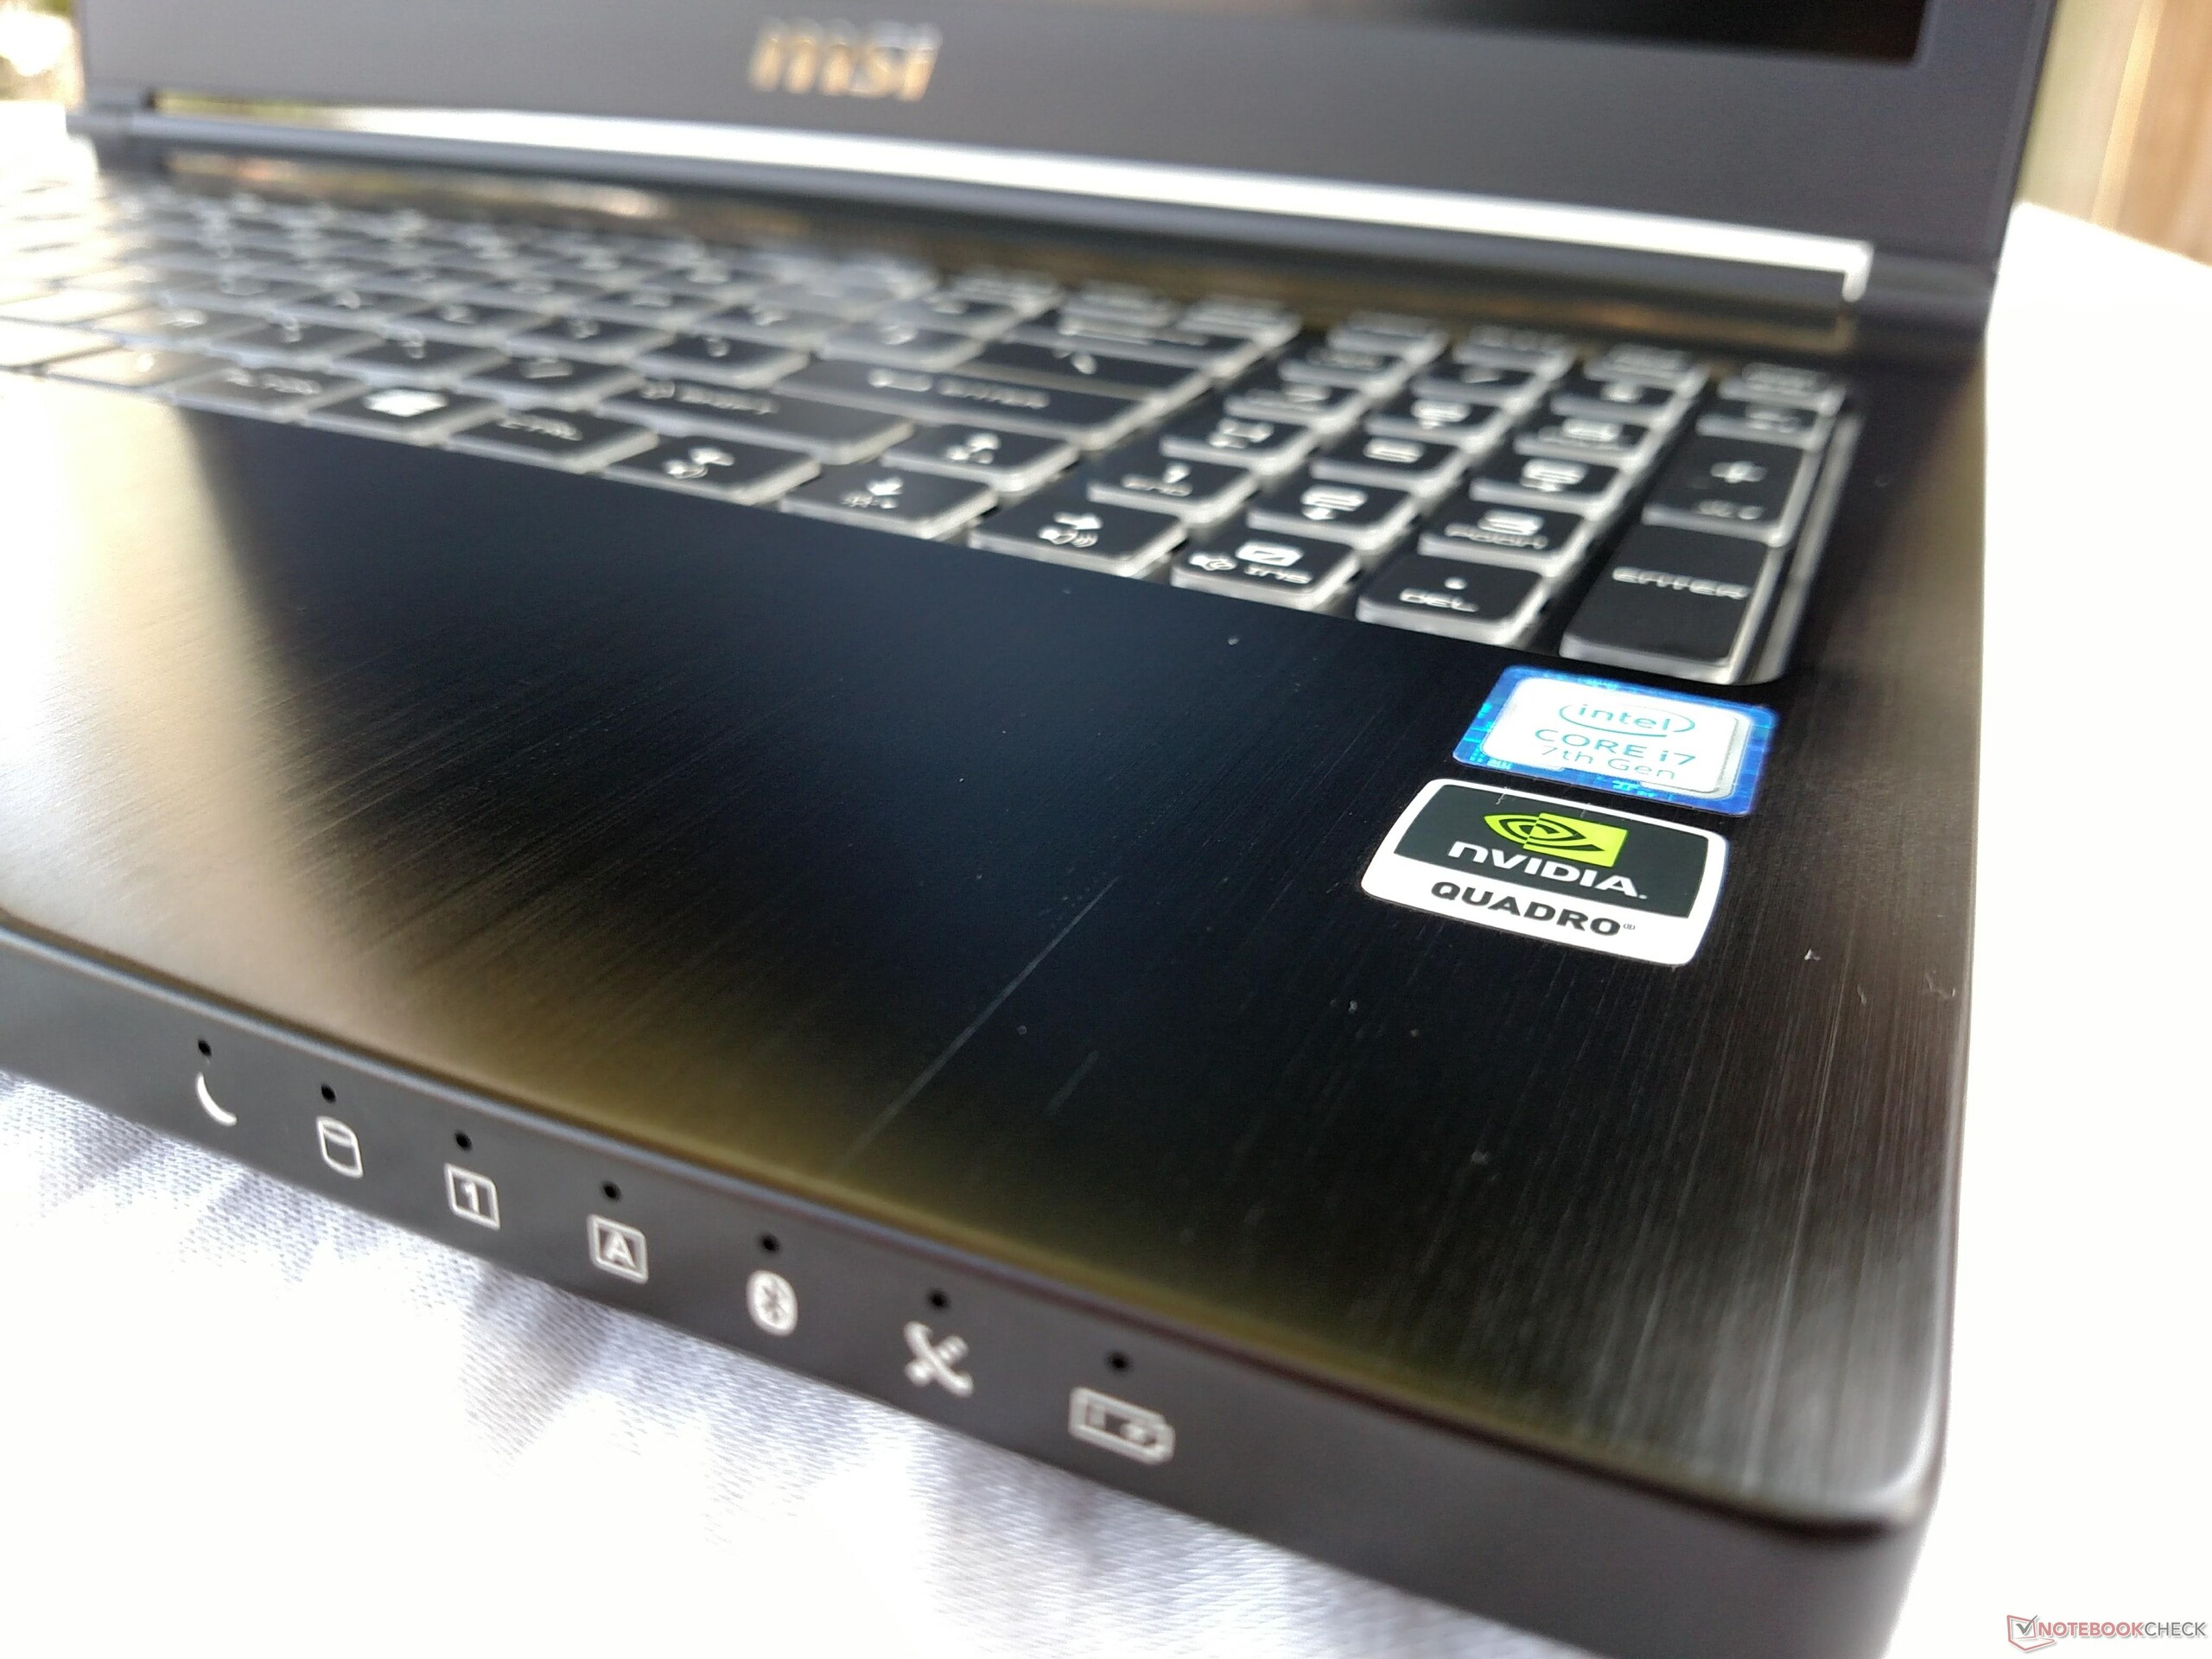
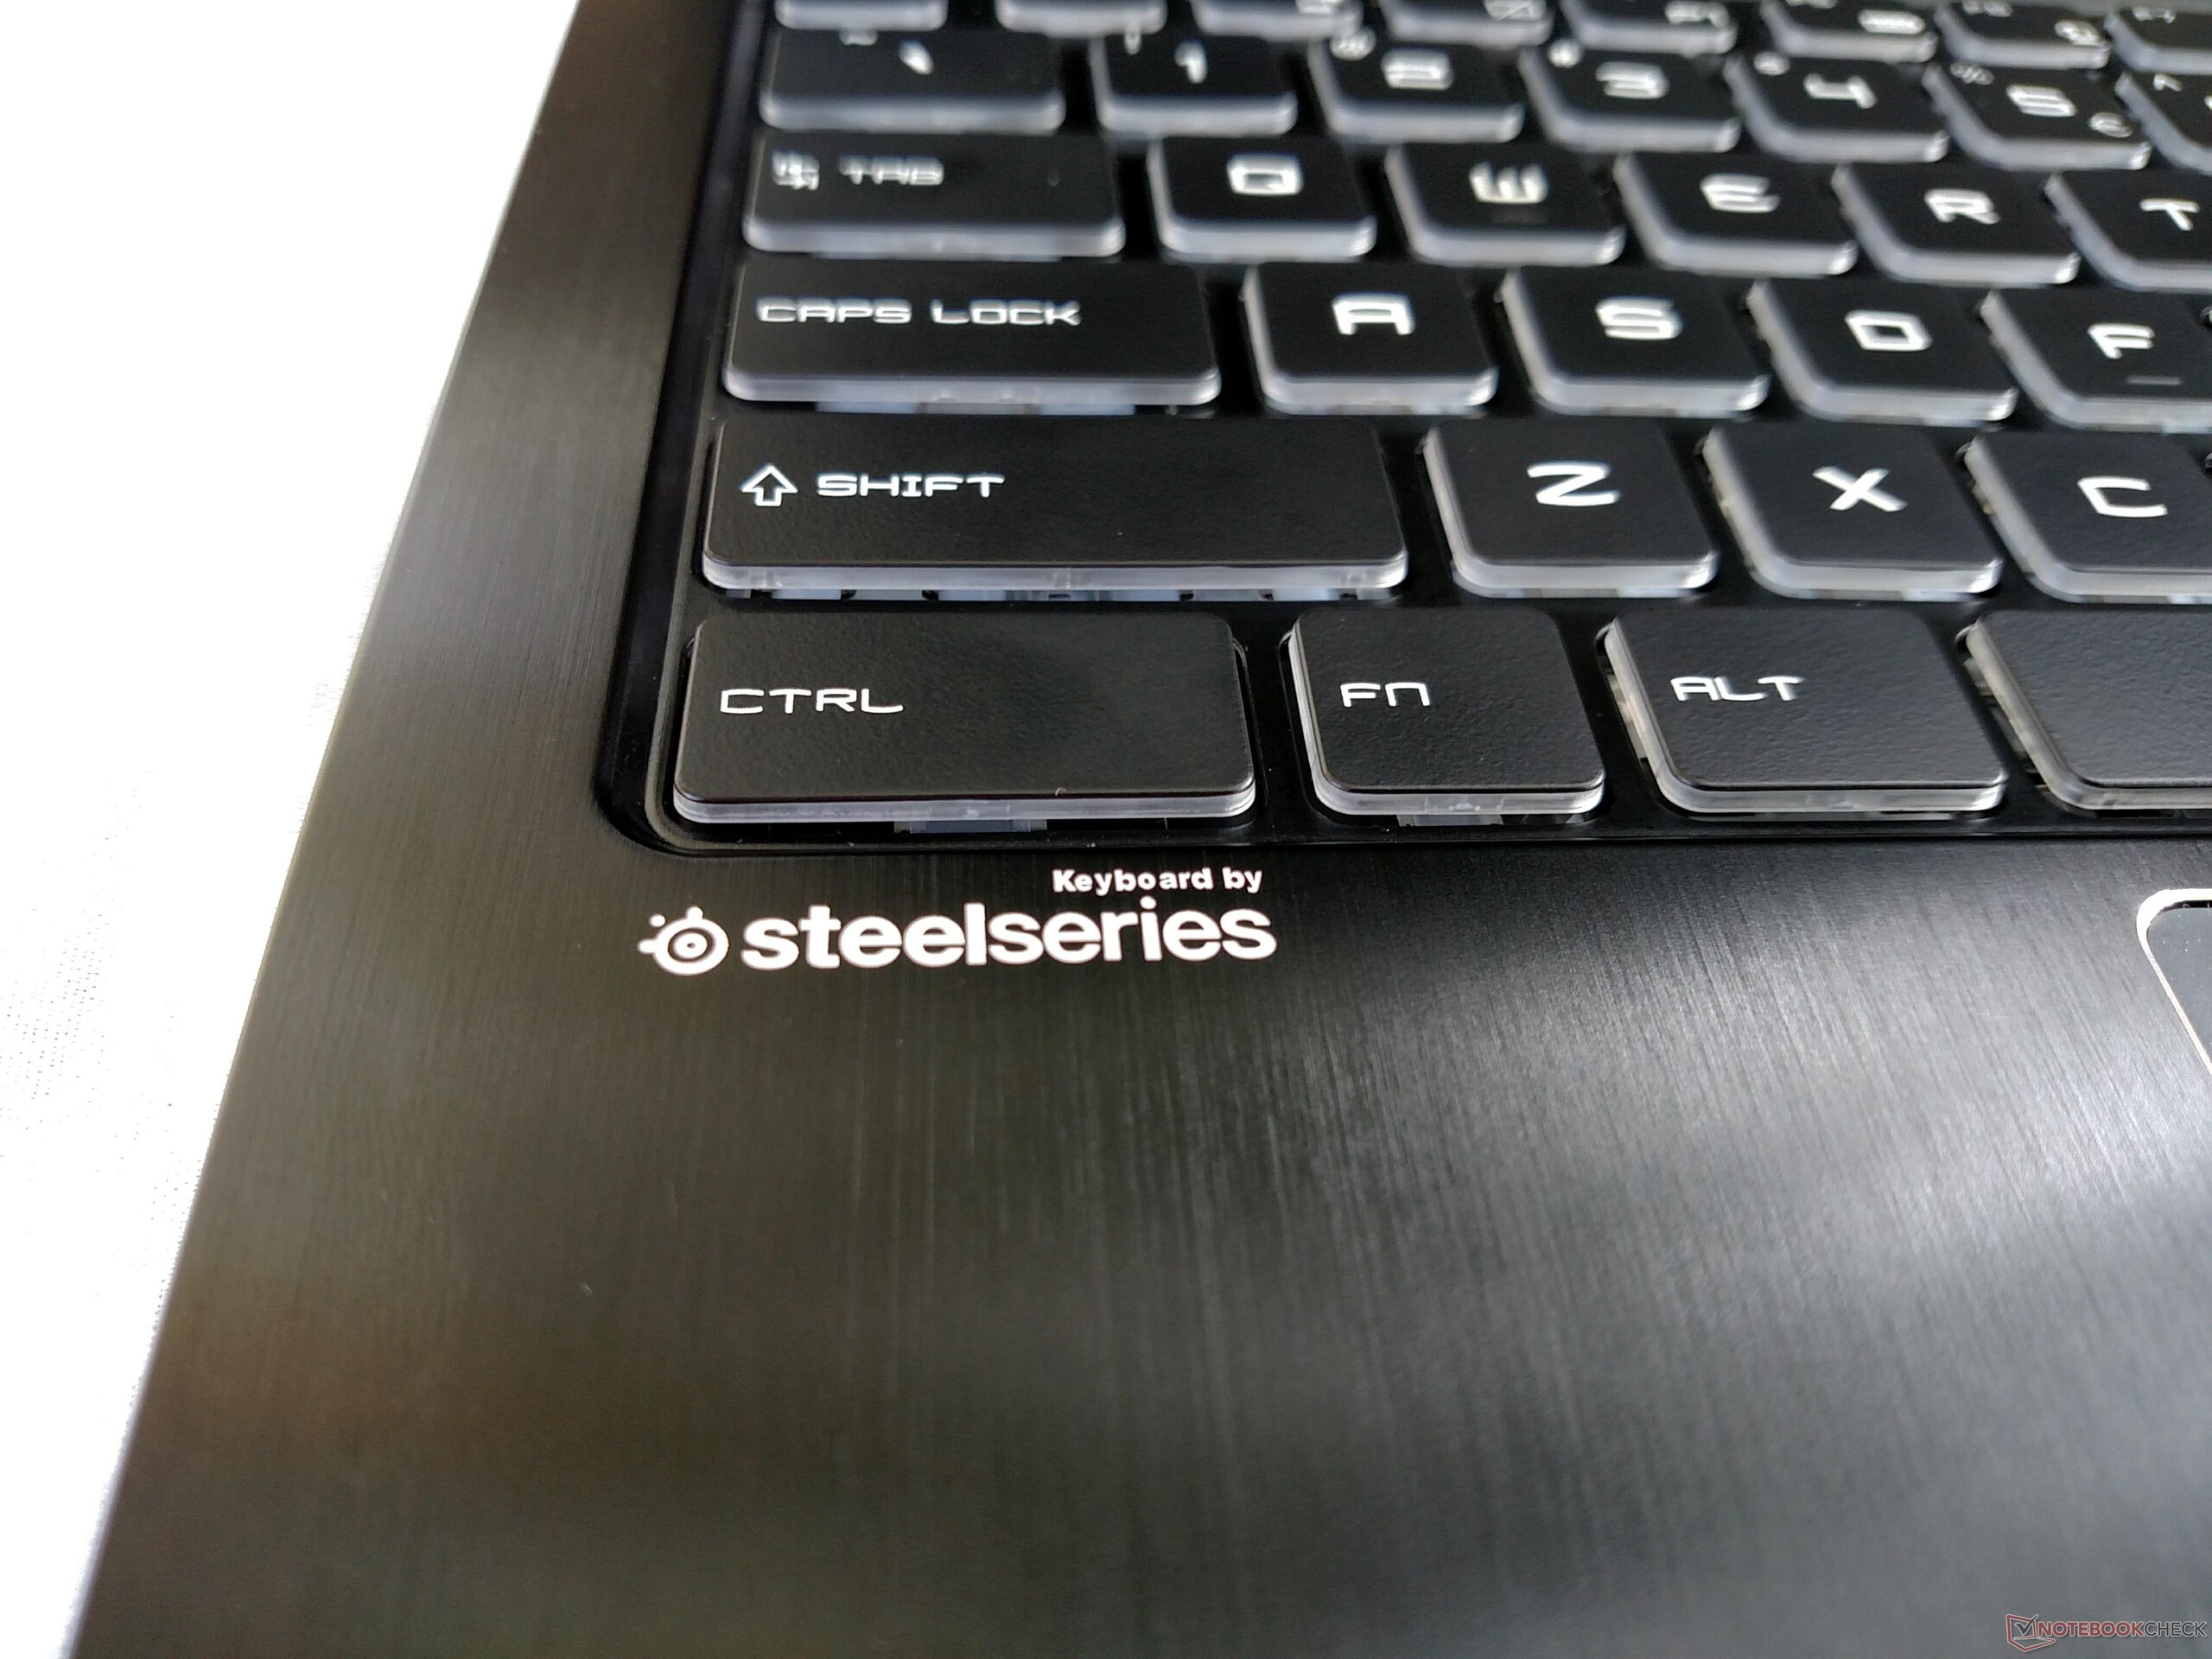
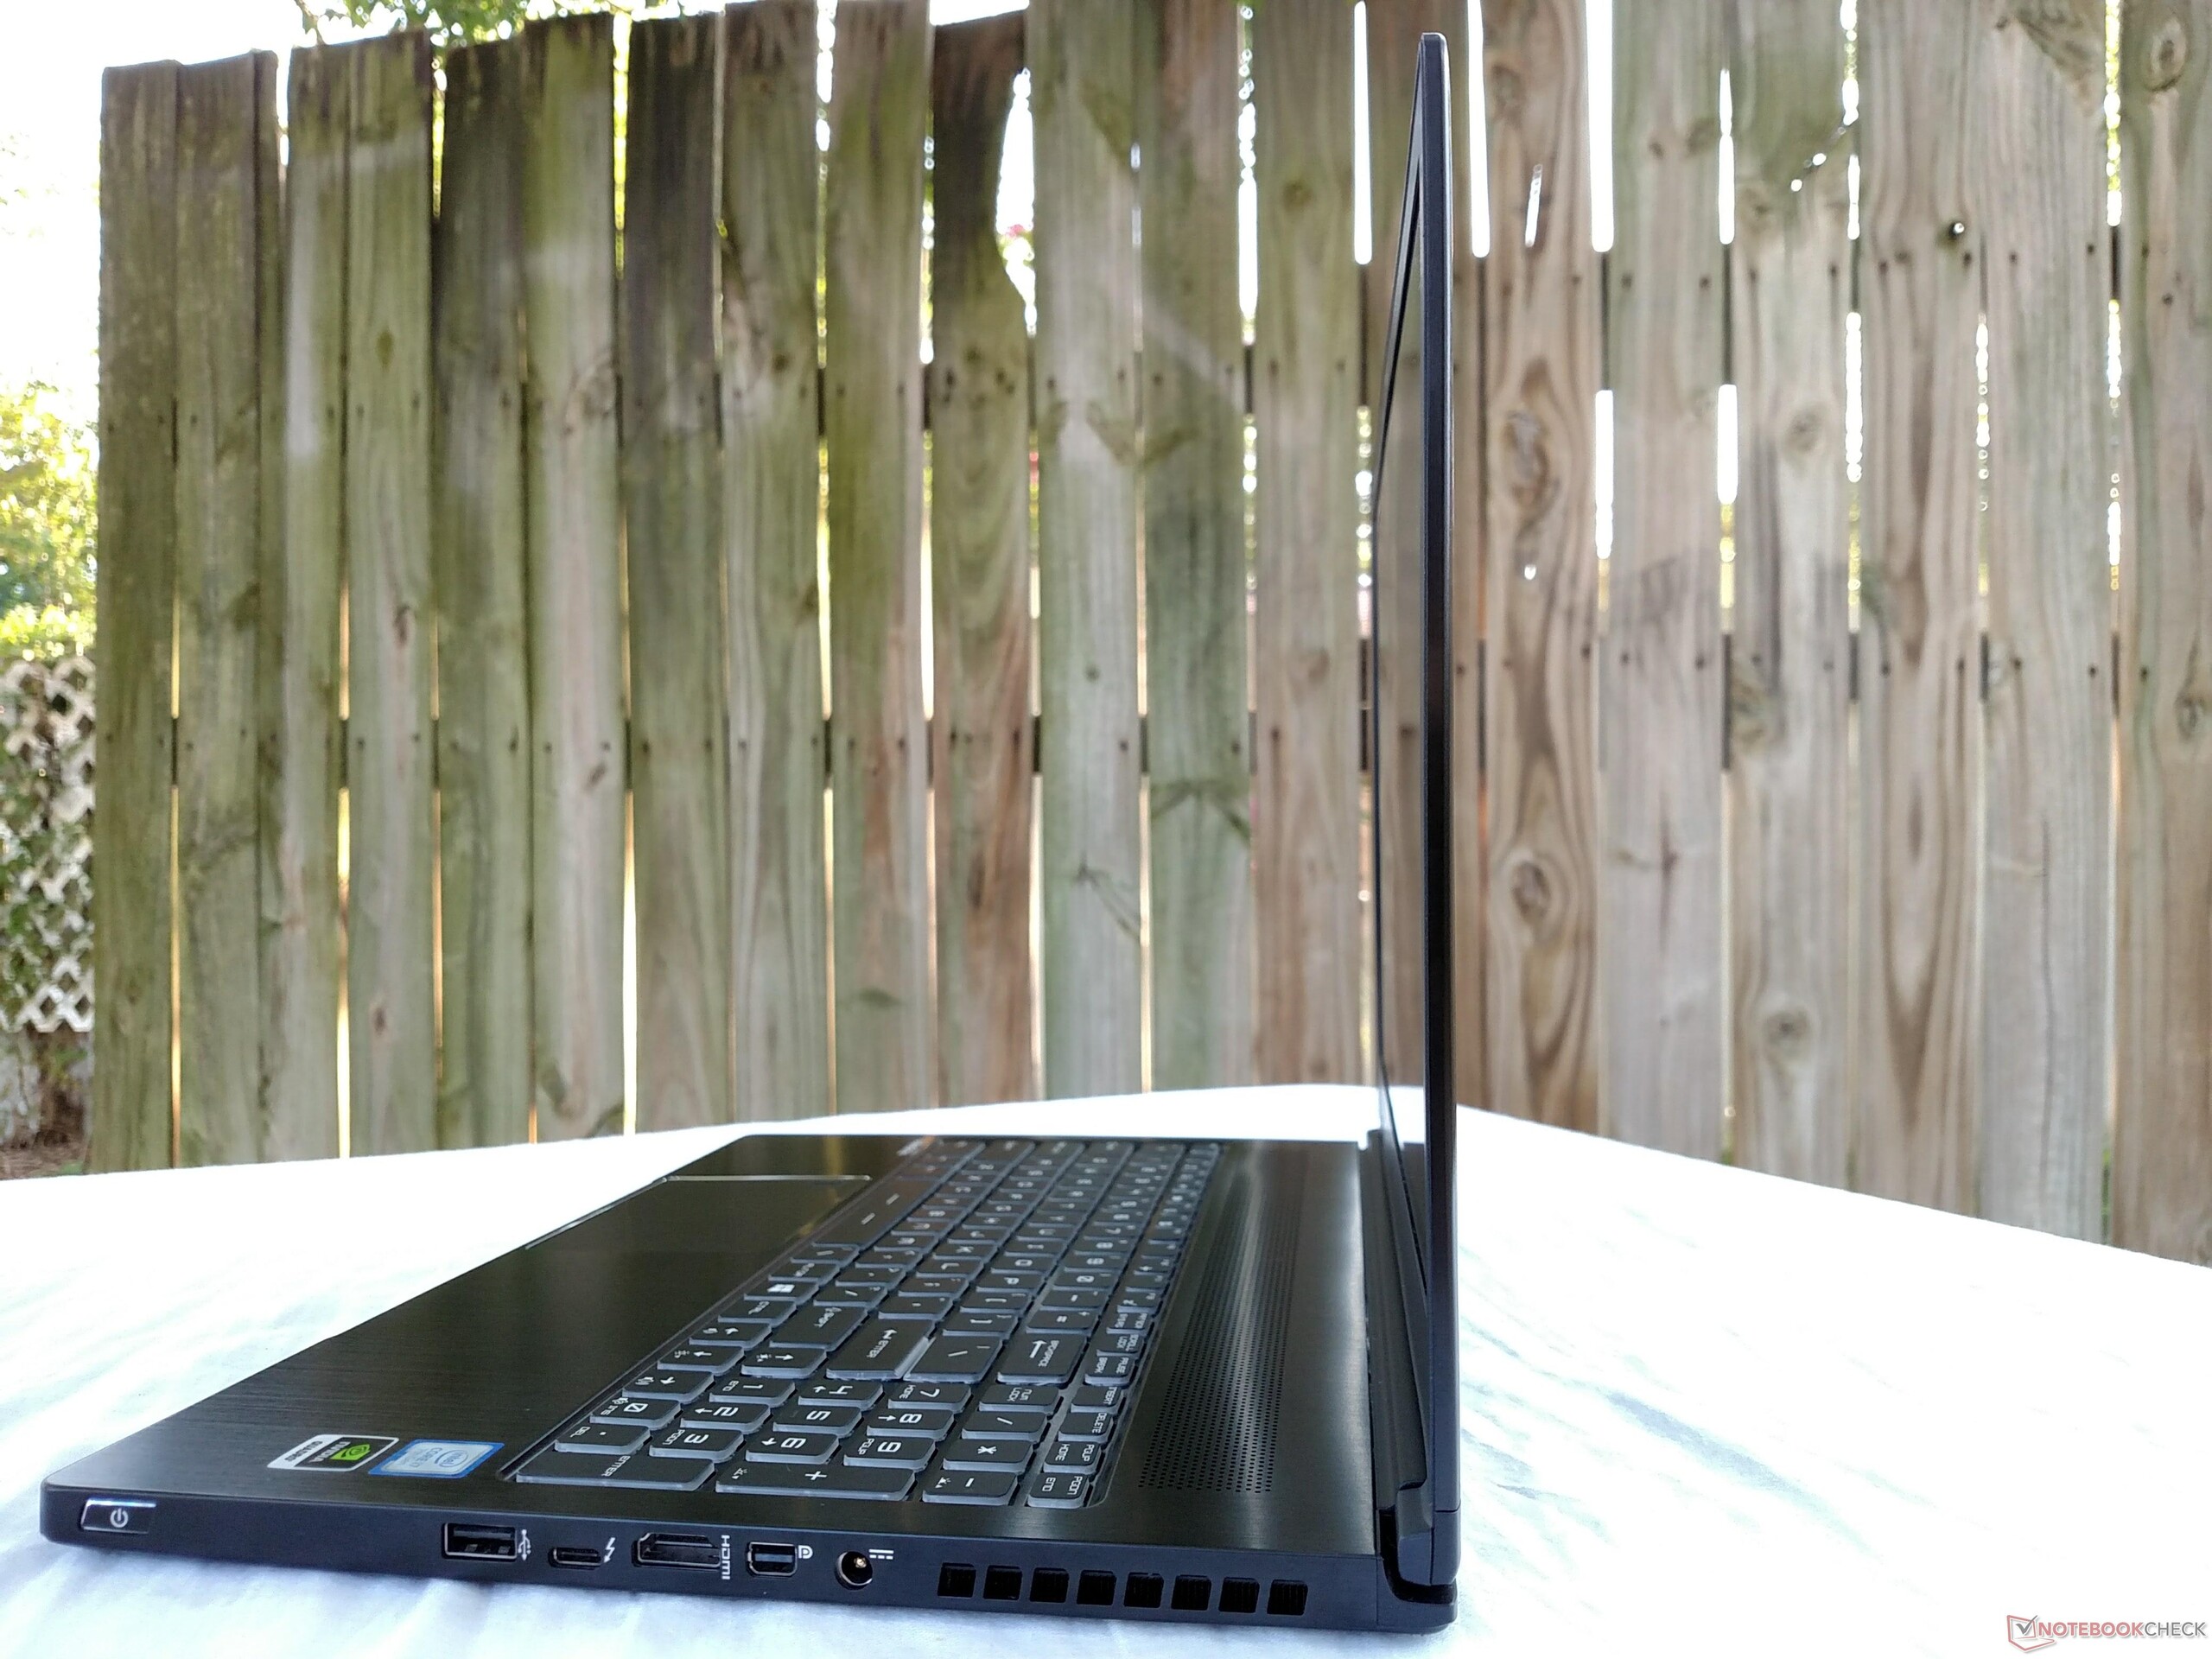
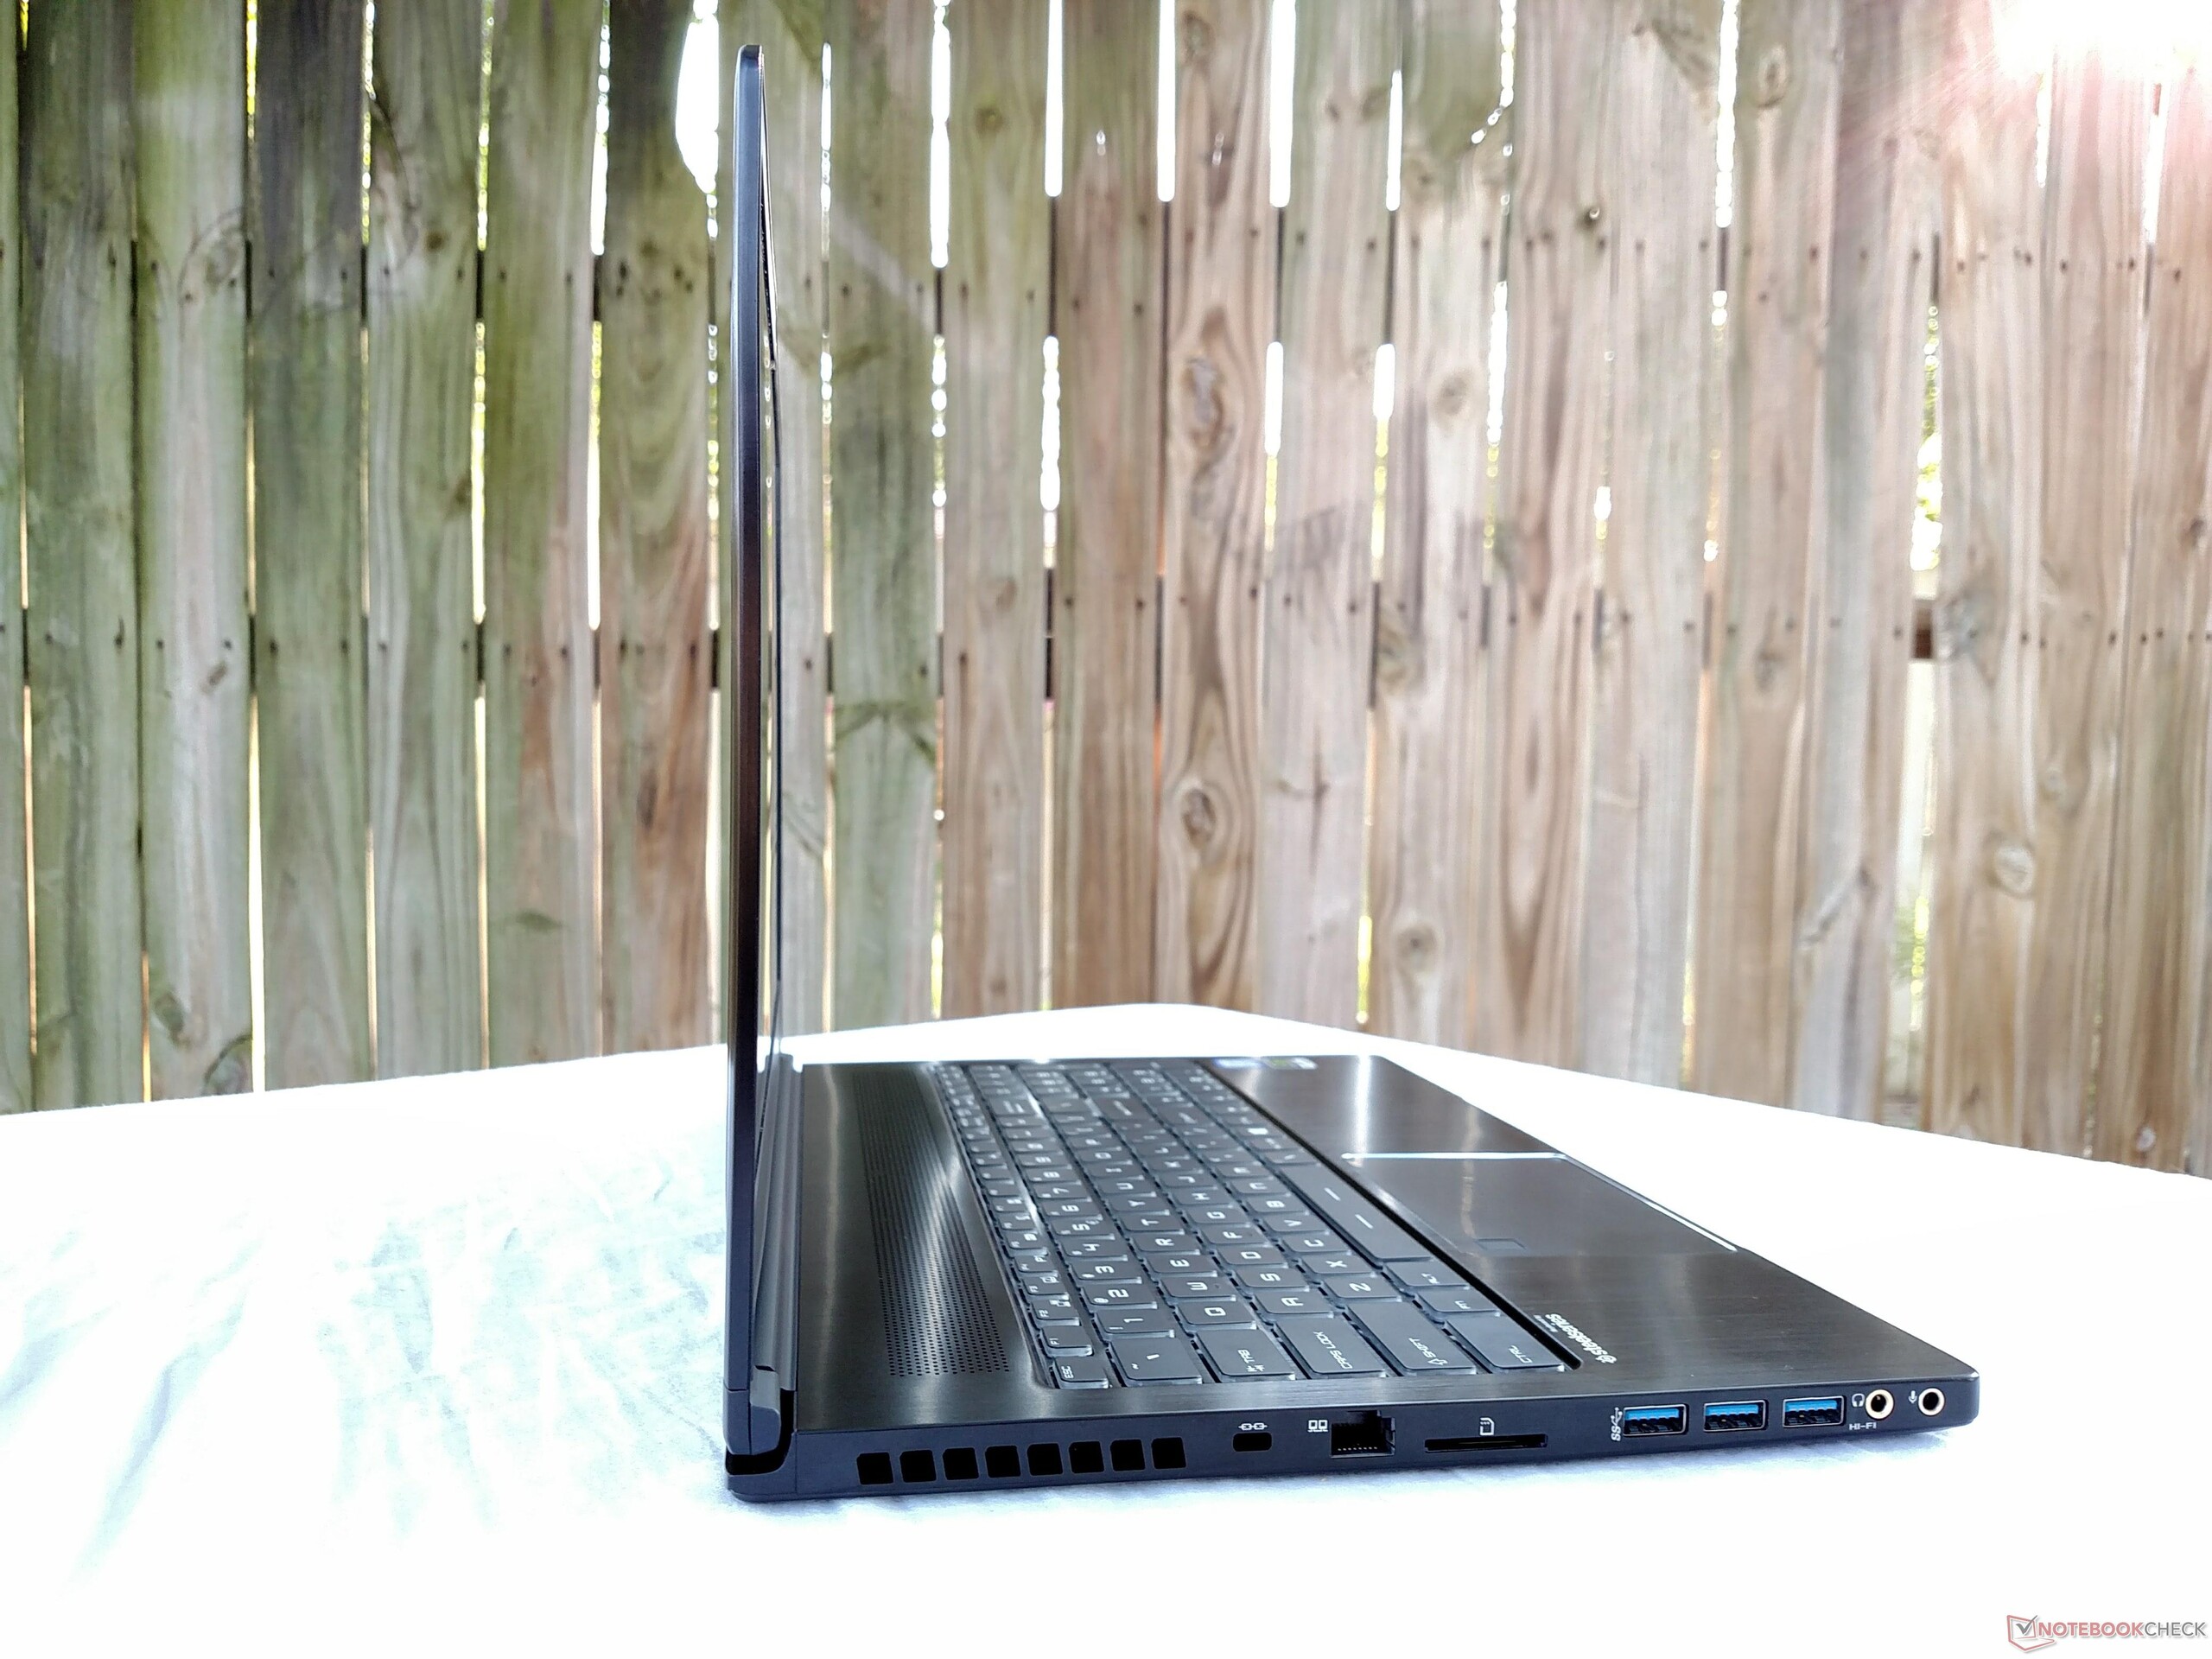
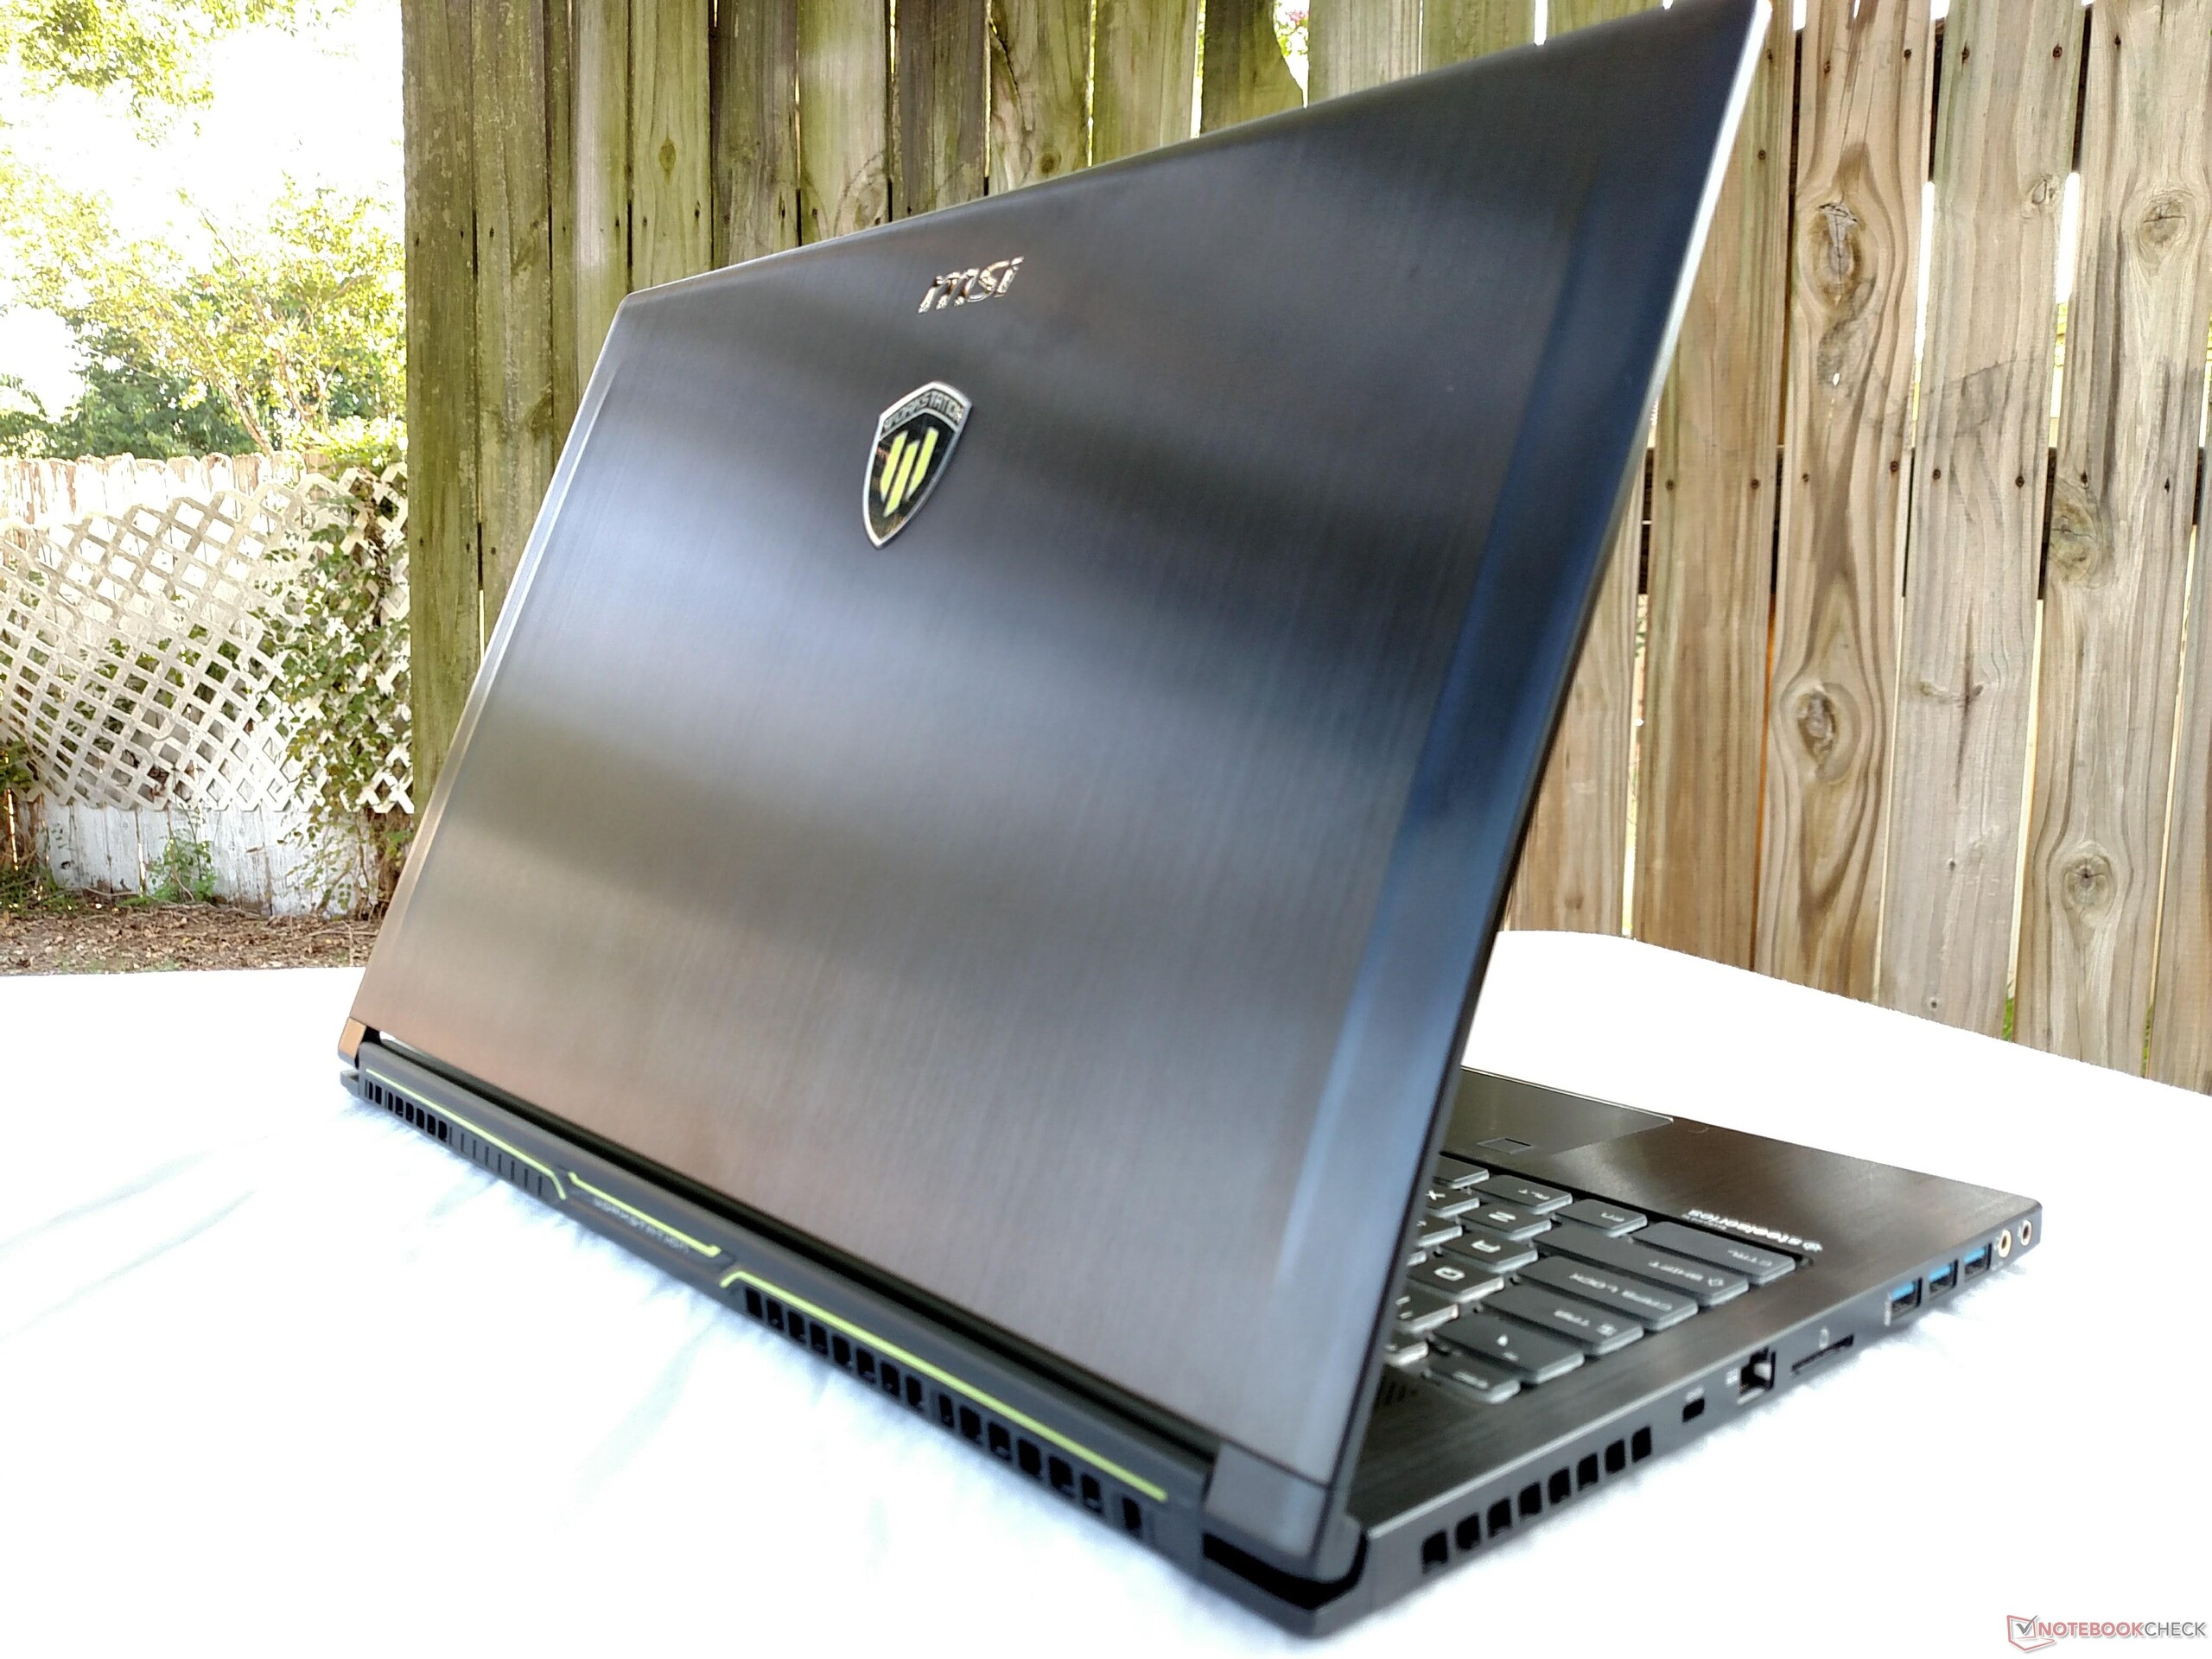
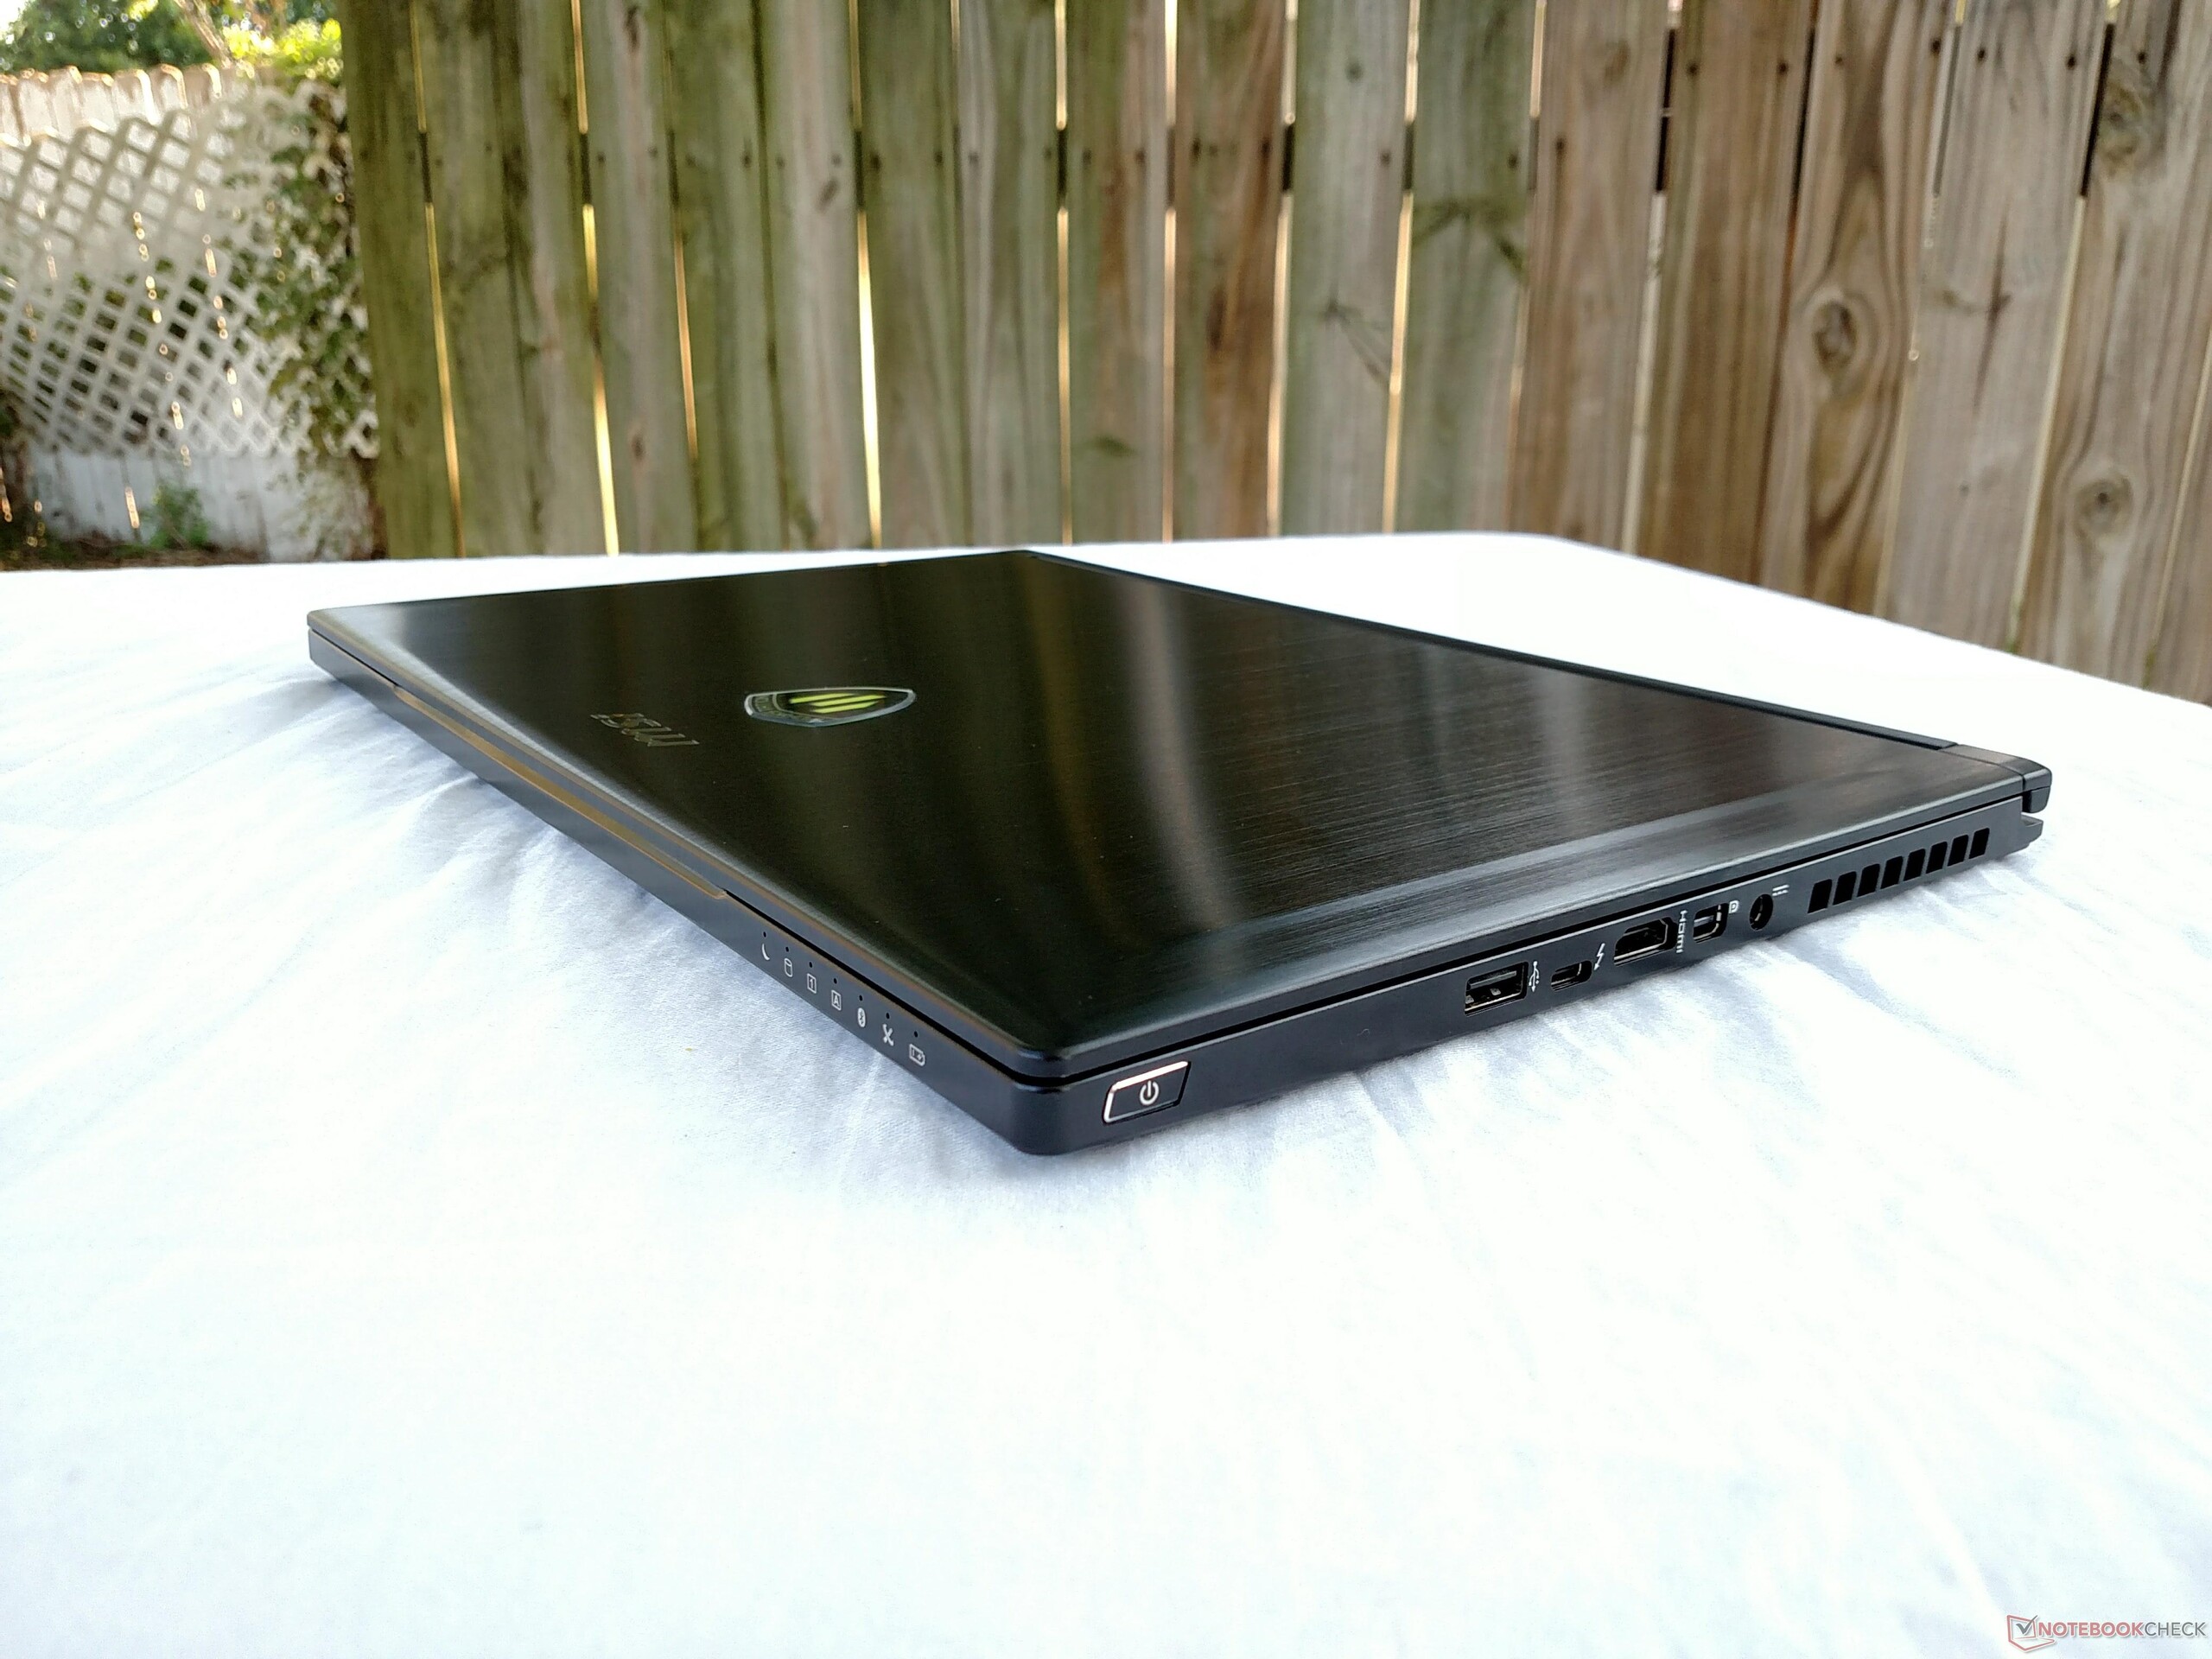
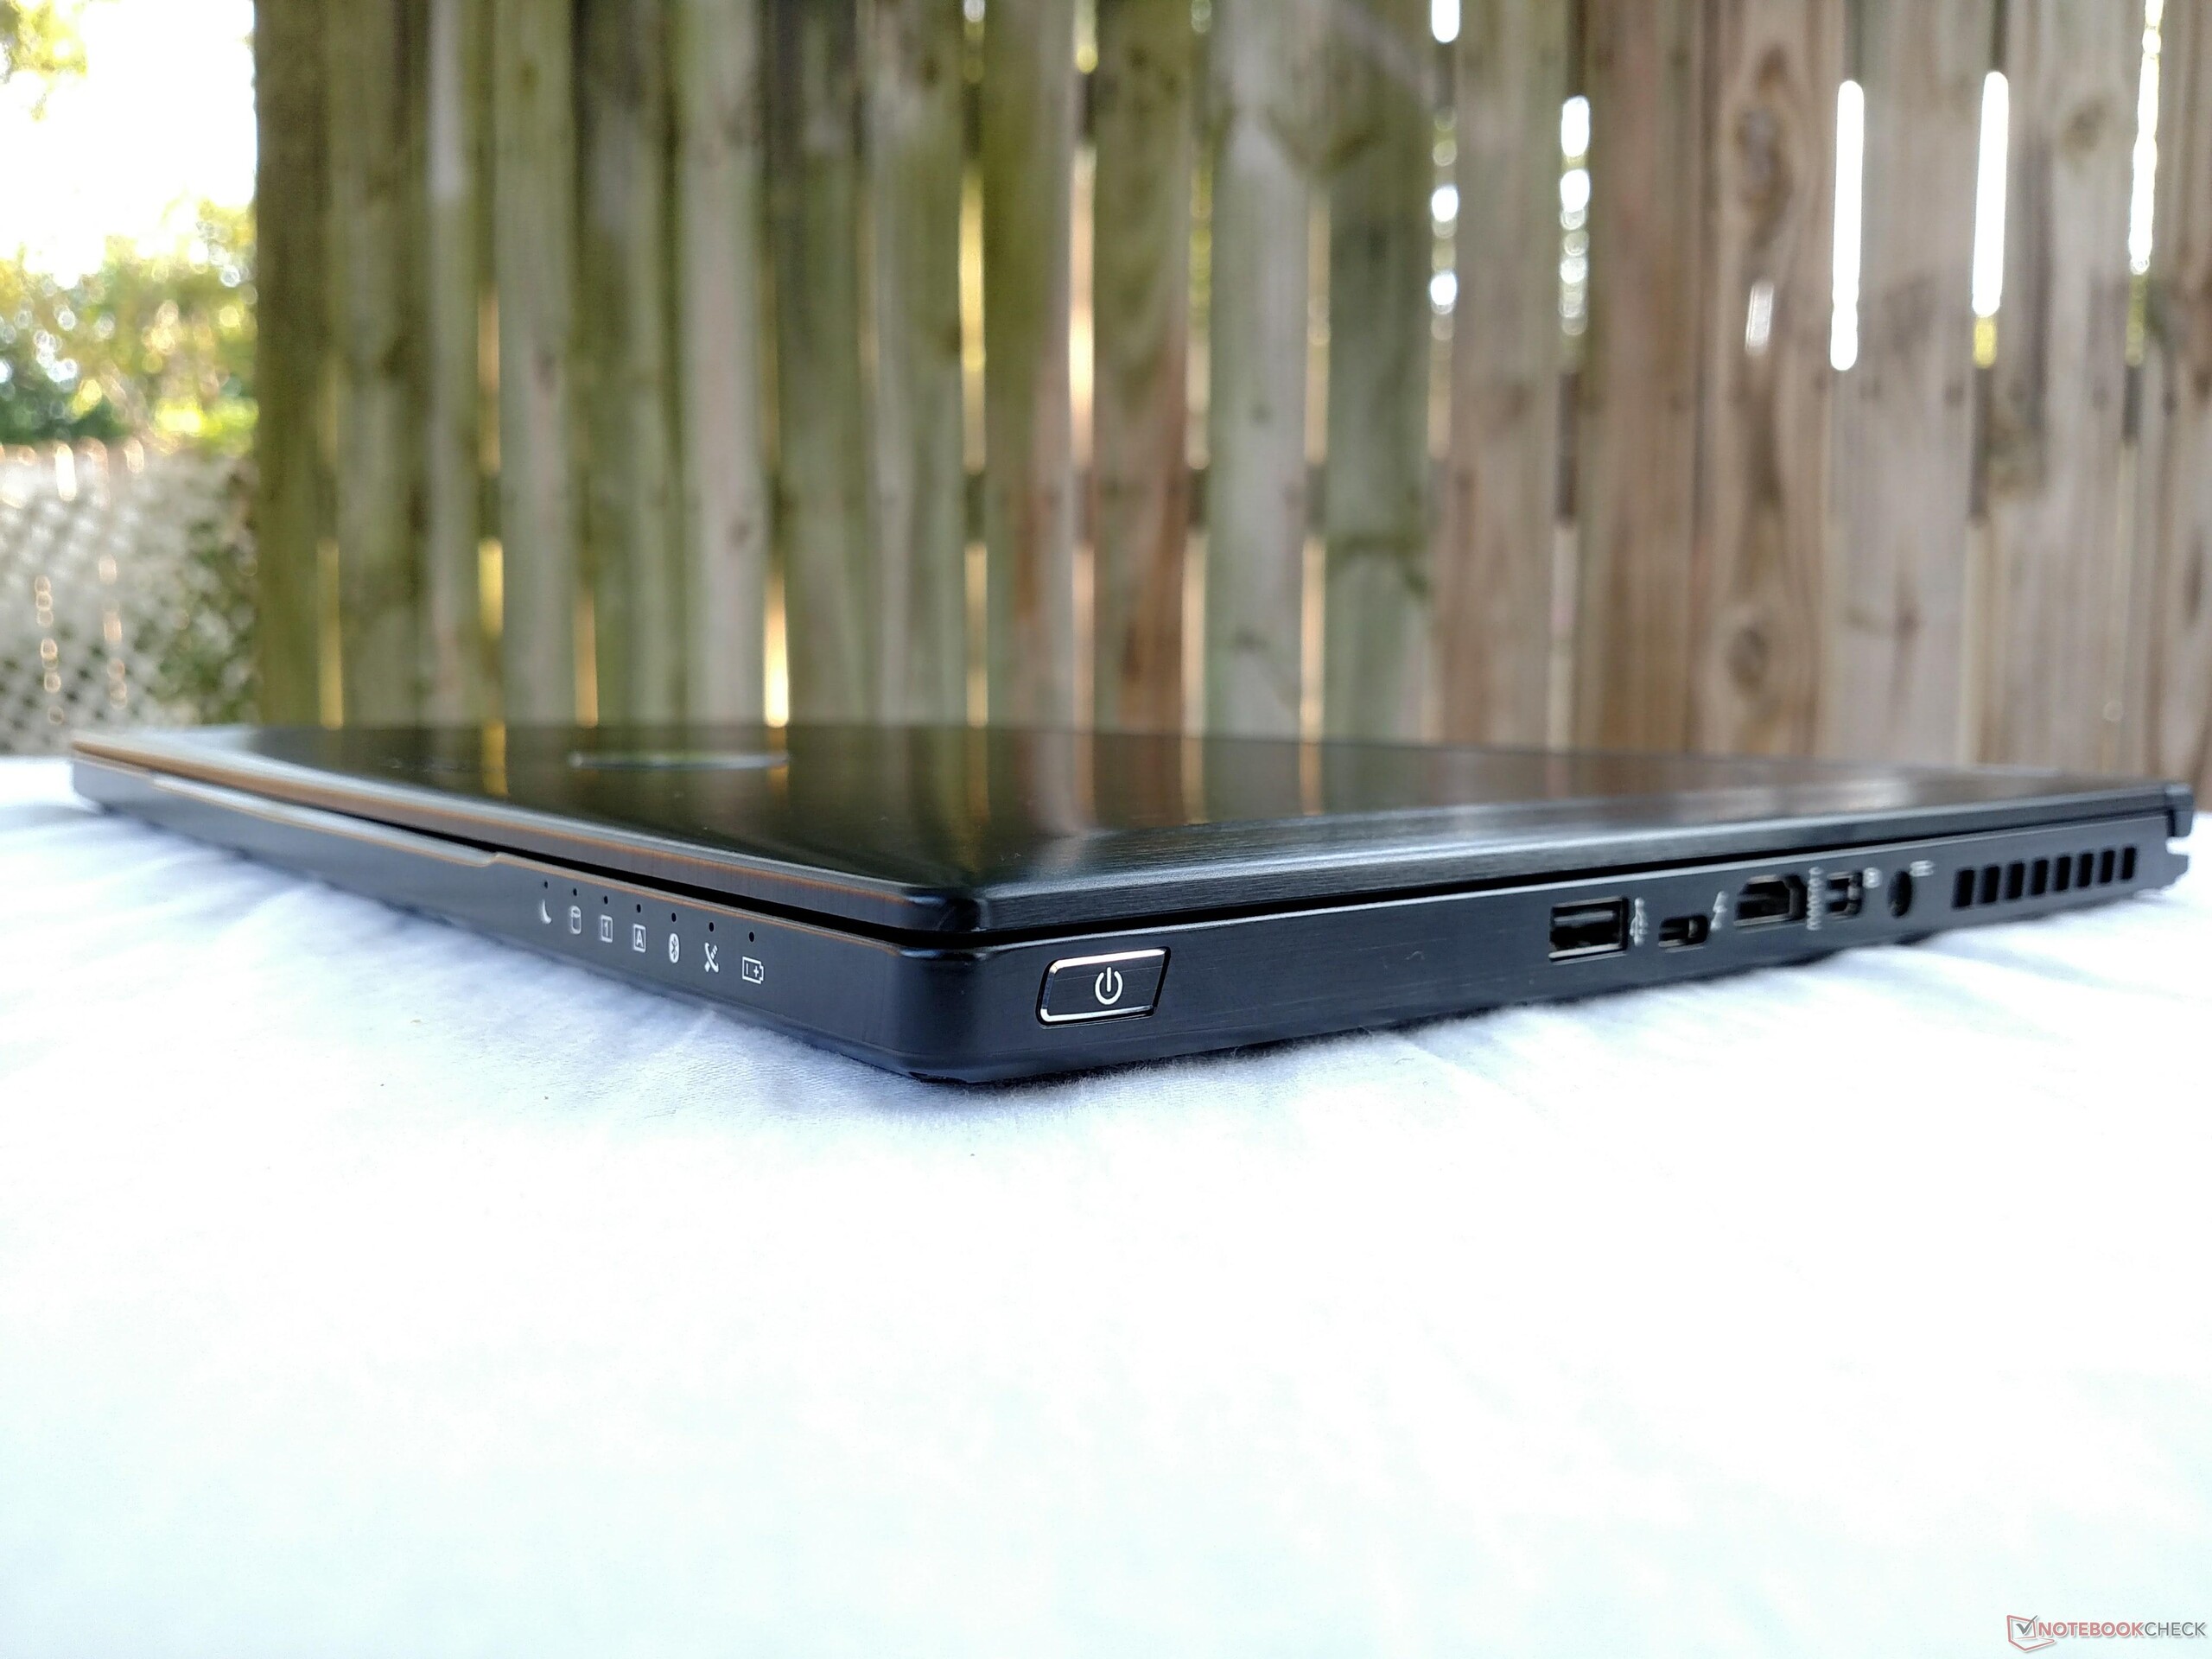
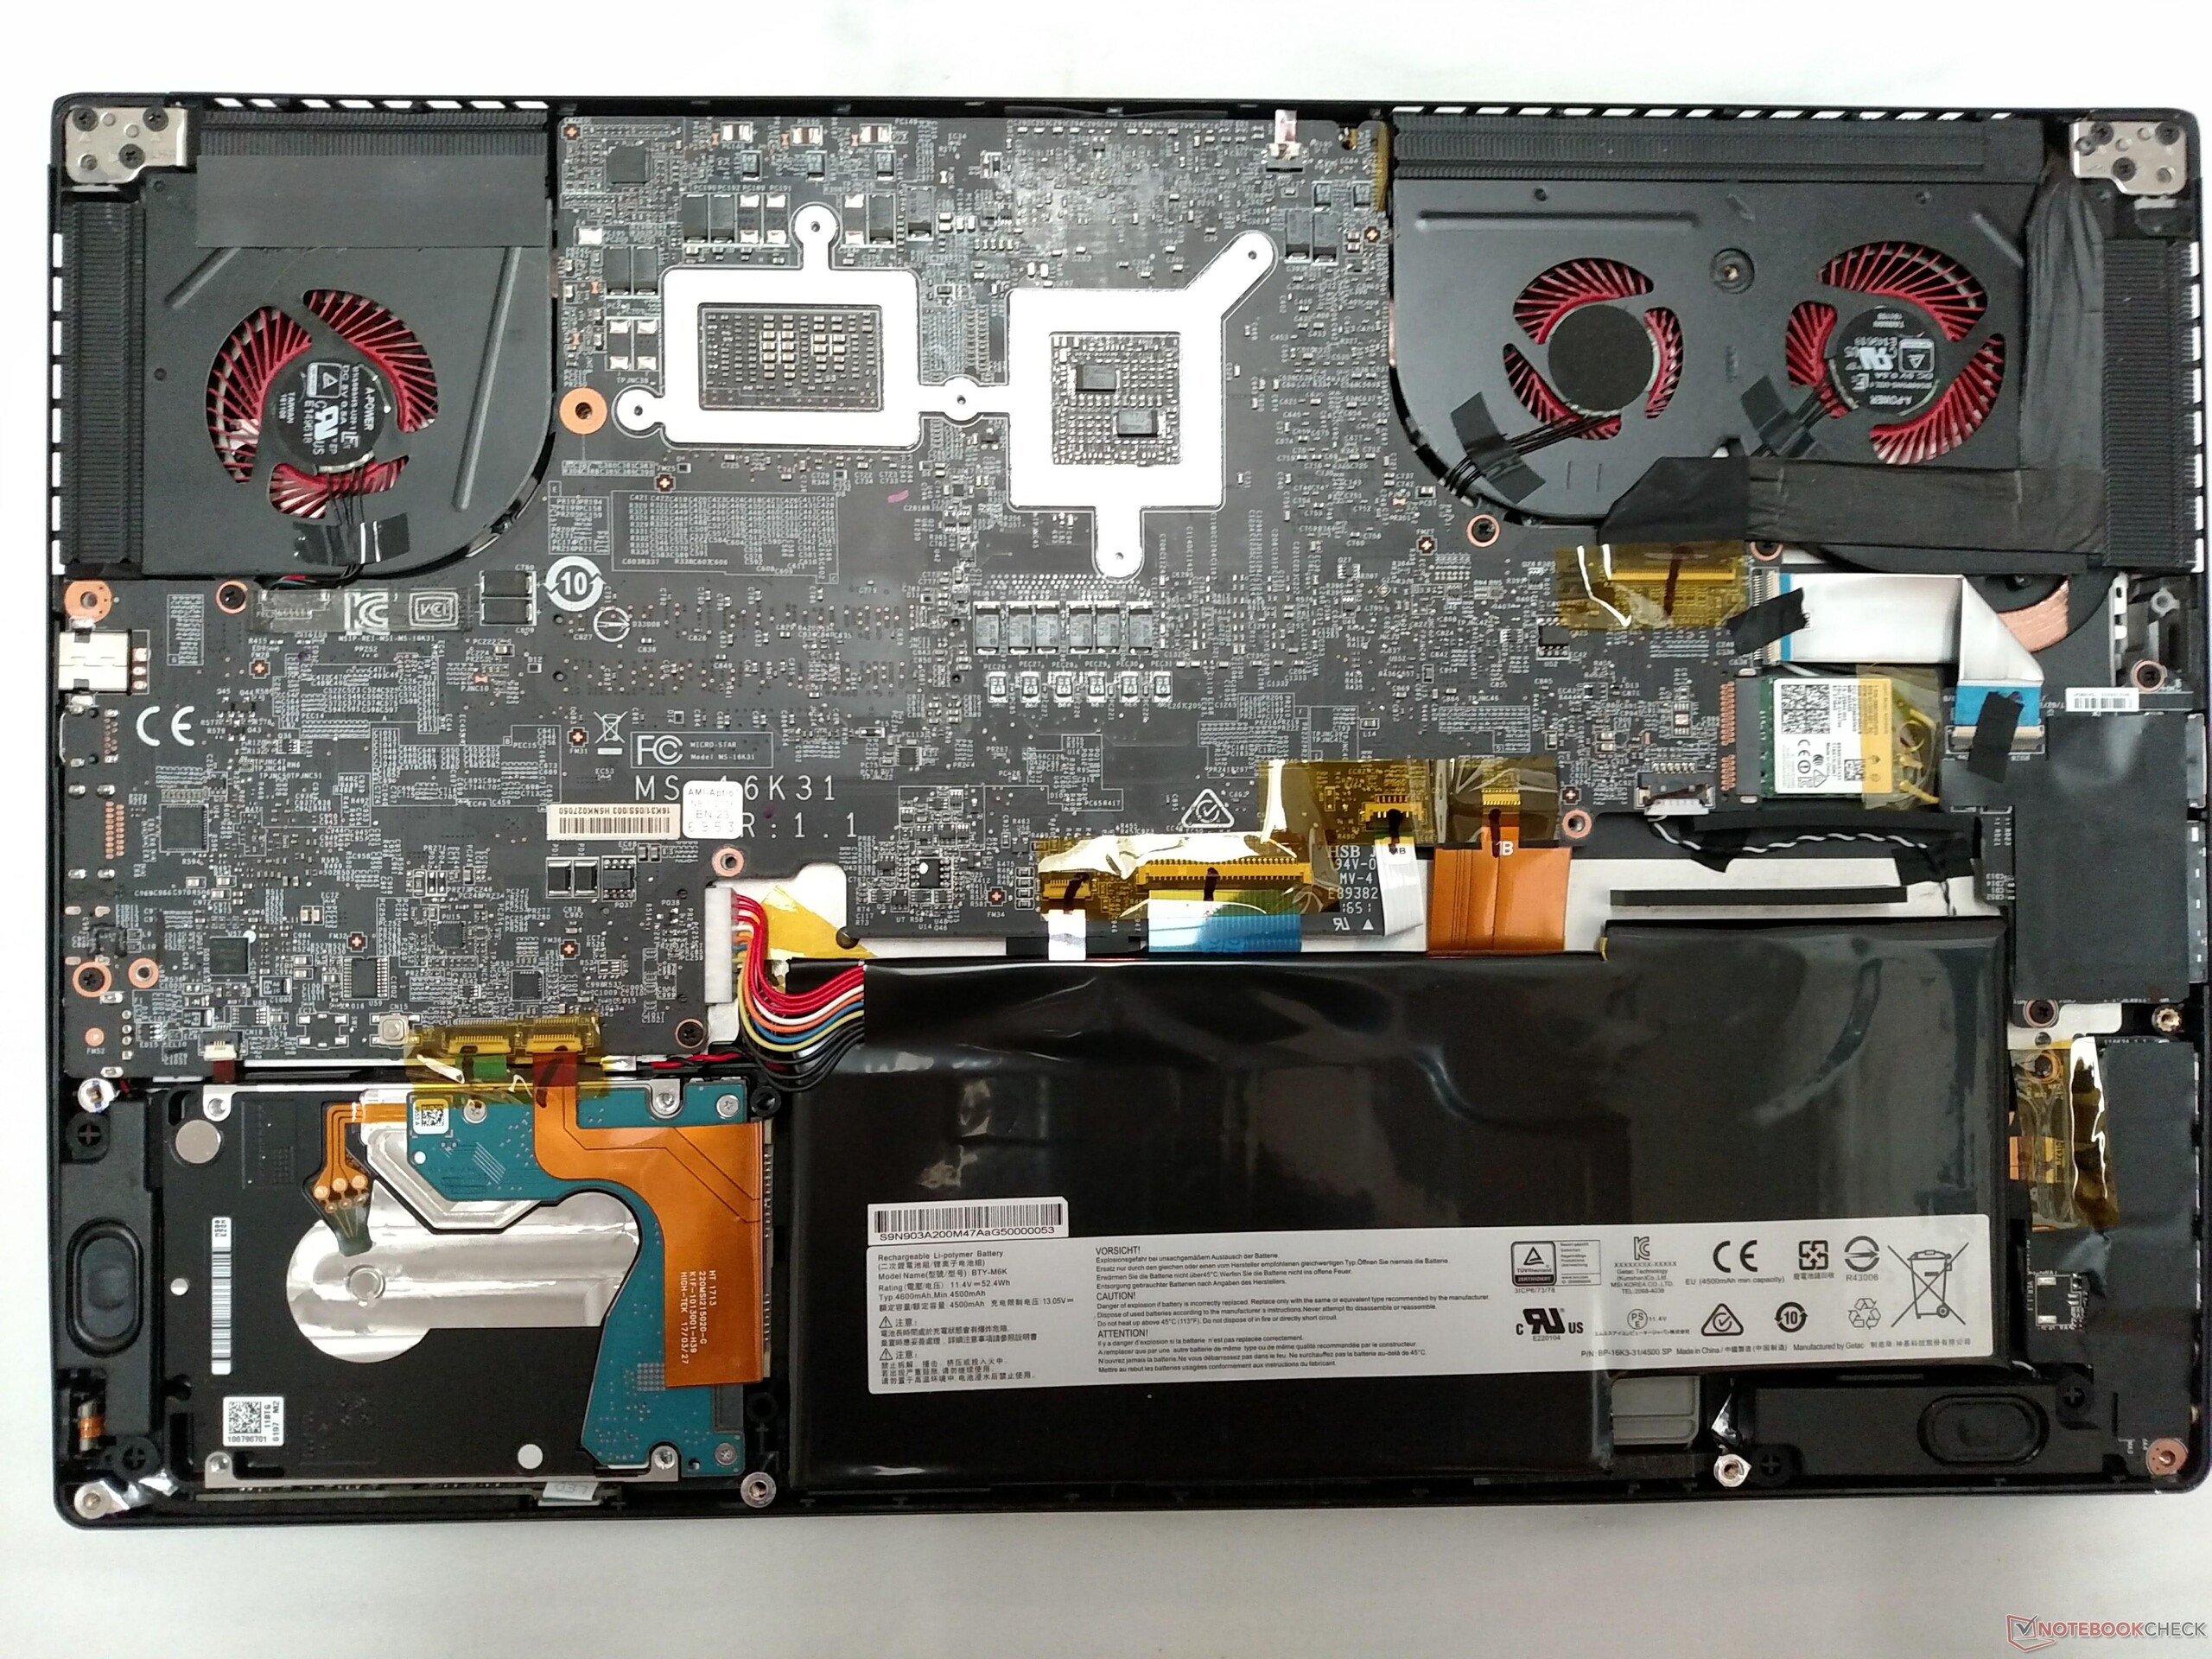
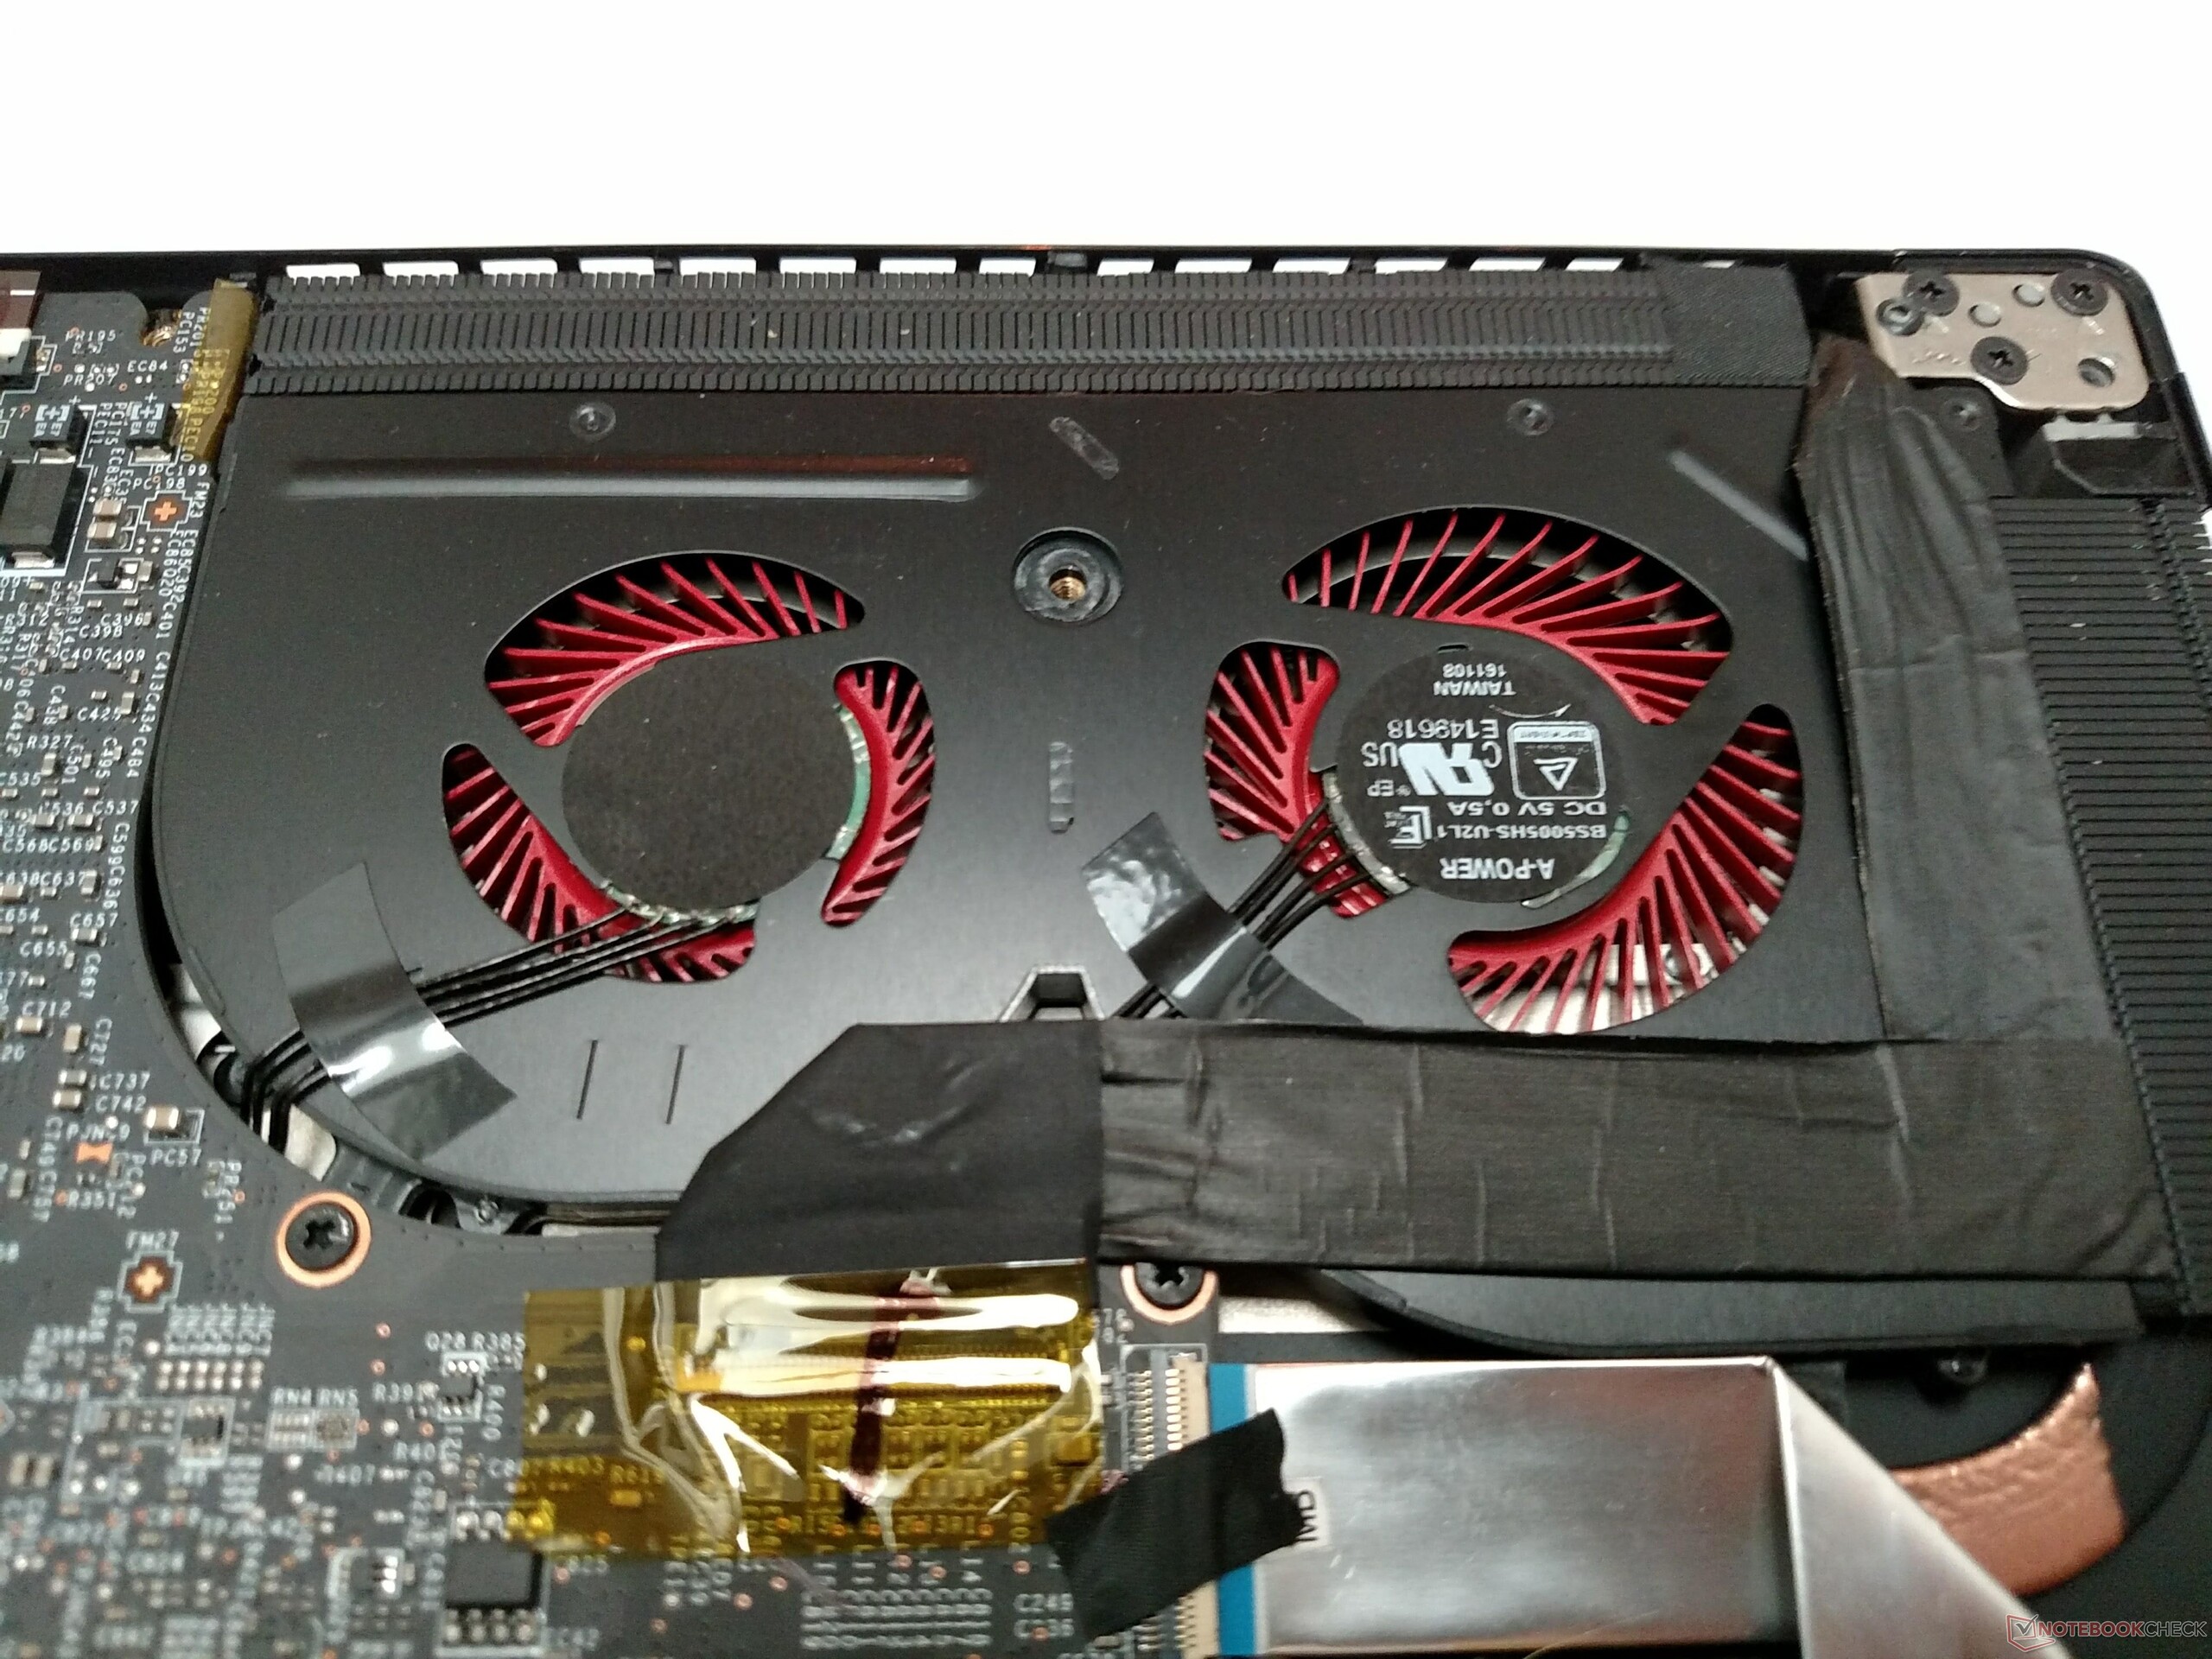
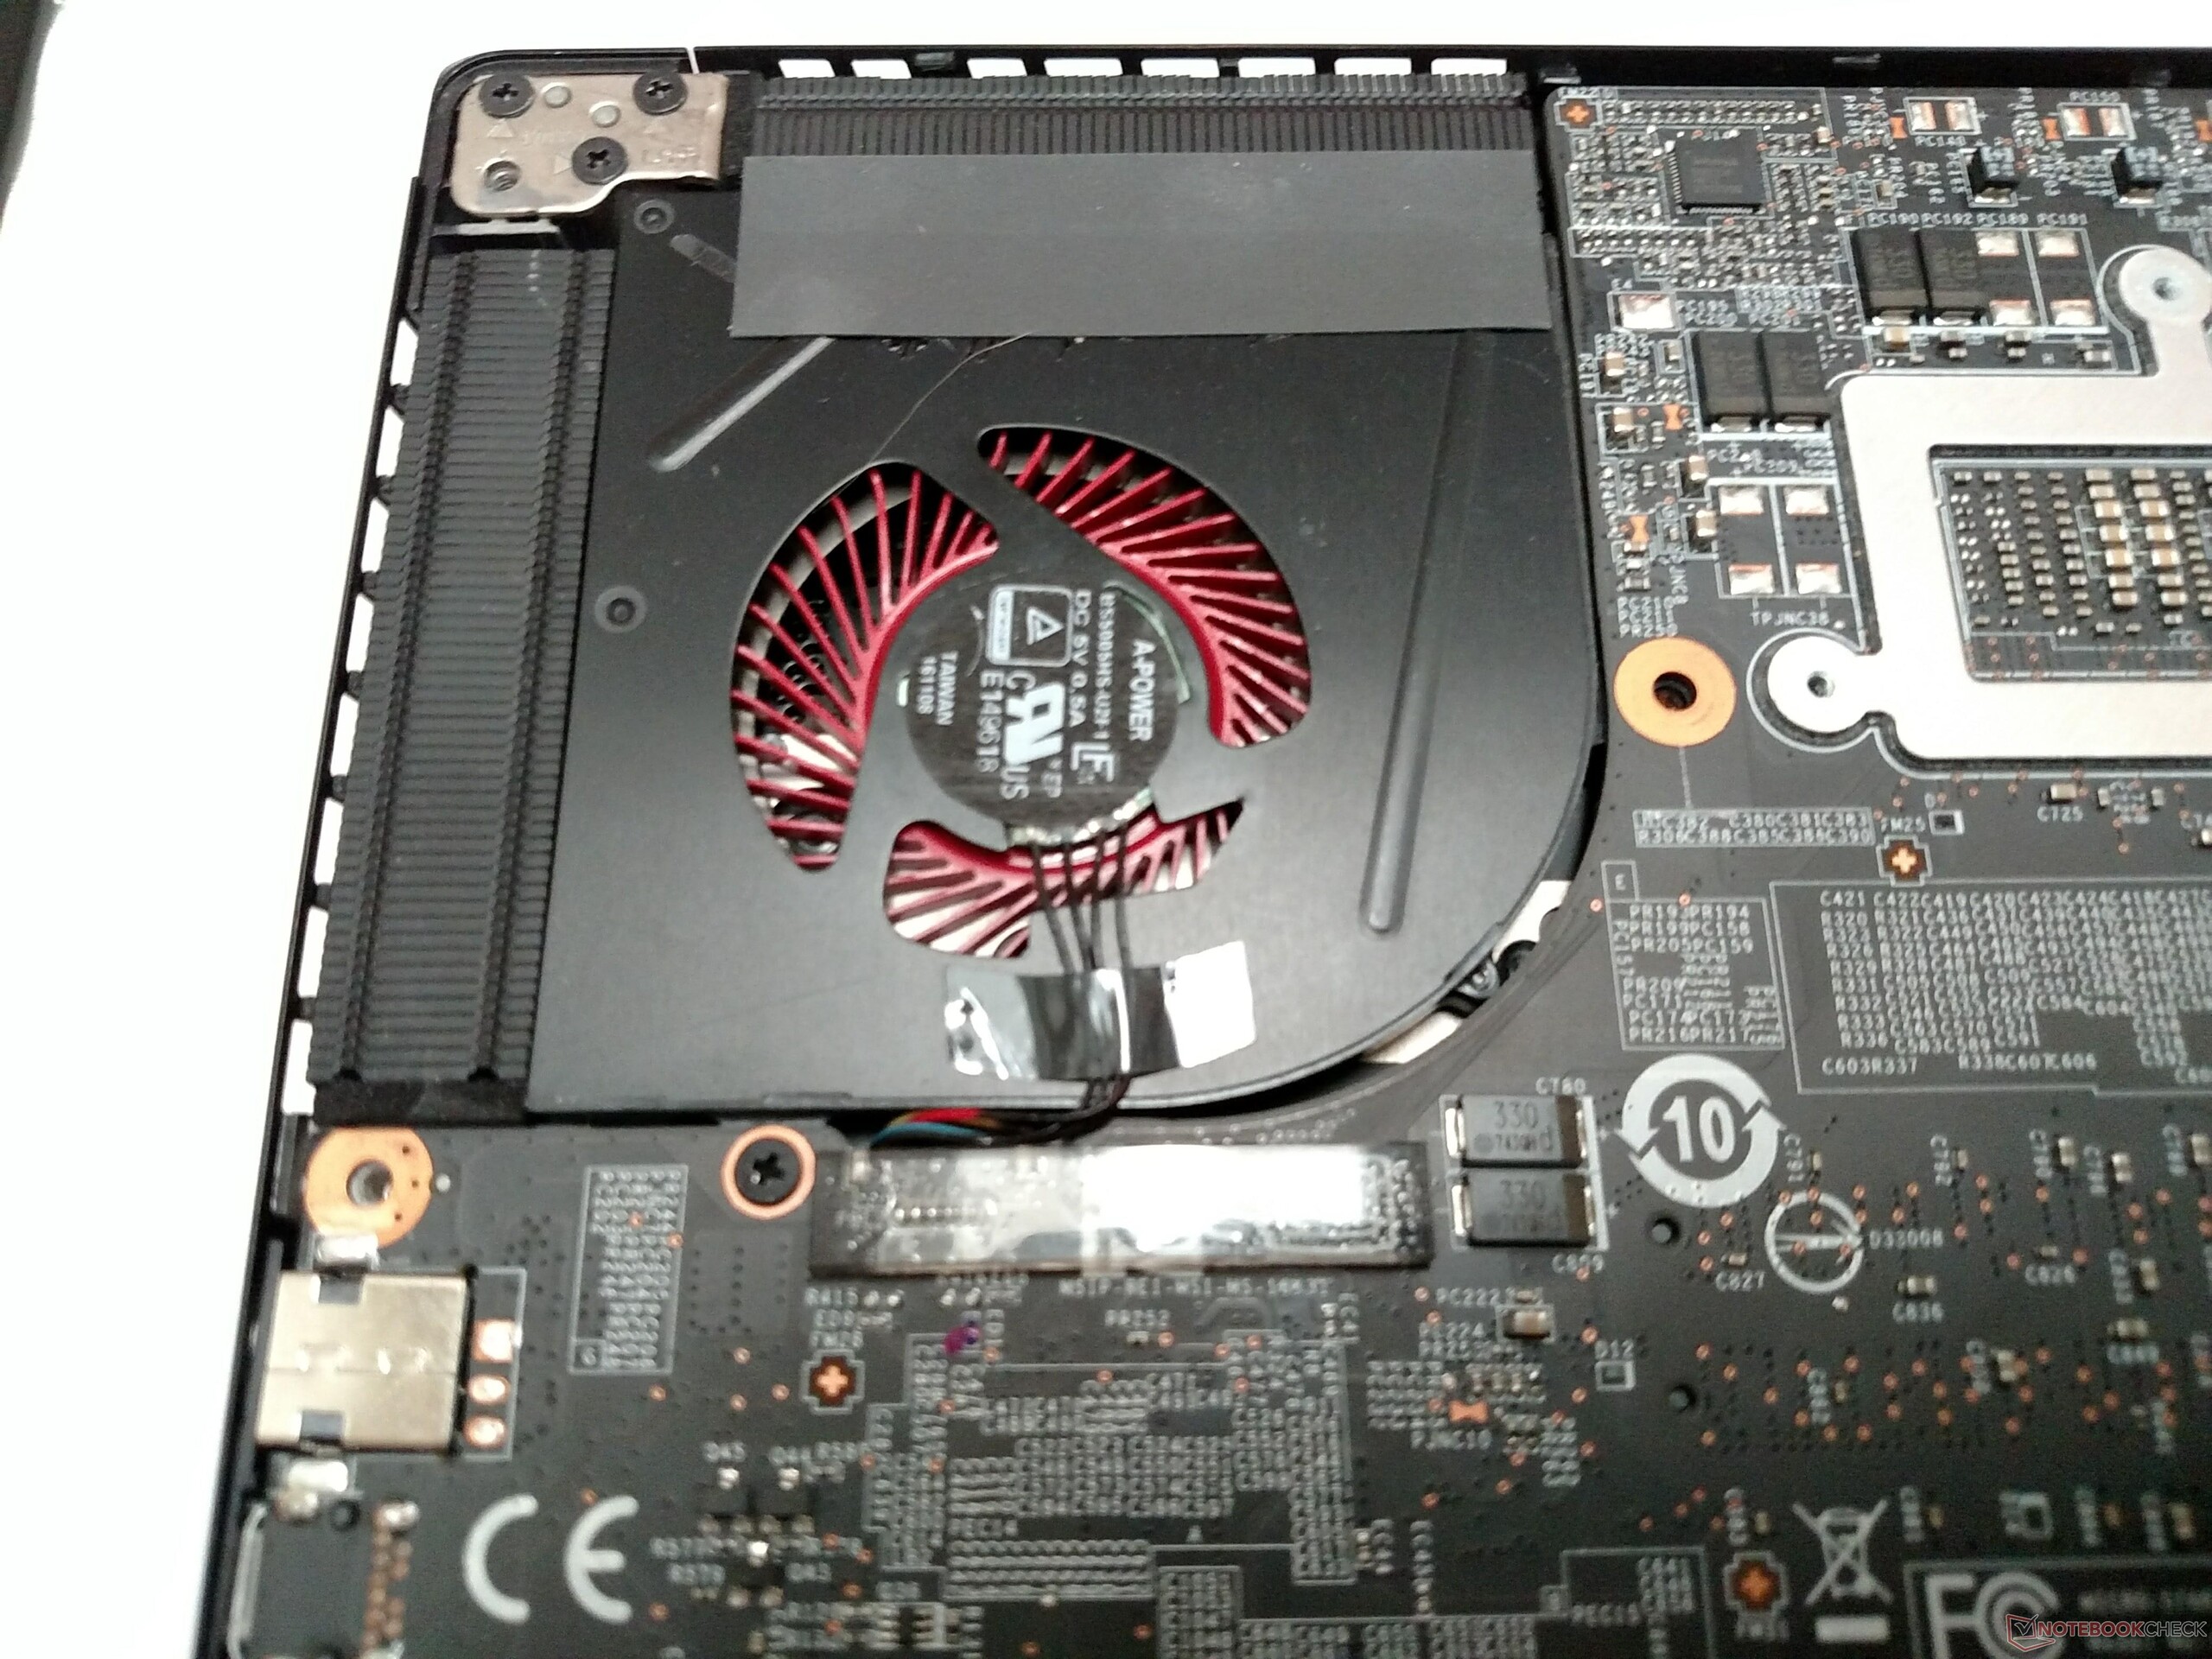
MSI's WS63VR är ett utmärkt exempel på vad Max-Q har att erbjuda proffs-segmentet. Nvidia Quadro P4000 Max-Q erbjuder otrolig prestanda med tanke på den låga värmeutvecklingen och 80 Watts TDP; prestandan är jämlik en ordinarie P4000 och flera mil framför förra årets Quadro M5000M. Värmen är också väldigt bra hanterad, vilket är en bedrift i ett så tunt och lätt chassi. Kombinera den prestandan med ett utmärkt tangentbord, nästan varje typ av anslutning som kan tänkas och ett mobilt, vackert designat skal och MSI har en säker vinnare här.
Dom stora nackdelarna finns kvar från andra MSI-modeller: Den medelmåttiga styrplattan är irriterande och kommer få användare att sträcka sig efter en extern mus, skärmen är mörk och saknar den färg-elegans som andra modeller har och batteritiden är nästan oförlåtlig. Profesionella fotografer som förlitar sig på en korrekt och vid färgrymd och lång batteritid för fältarbete vill nog överväga andra modeller framför WS63VR, särskilt Lenovo ThinkPad P51. Tappet i prestanda kan vara ett värdigt utbyte för förbättrad batteritid och en otroligt exakt skärm.
Kontorsarbetare däremot kan tänkas vilja överväga MSI. På den här prisnivån (~28 000 SEK) blir det en rejäl investering att välja en mobil arbetsstation. Ingengörer, forskare, läkare eller andra som har behov av en pålitlig och kraftig GPU med bra support har aldrig haft ett svårare val framför sig. MSI har utvecklat en tuff rival till dom härskande kämparna från Lenovo, Dell och HP och kommer säkert att ta marknadsandelar. Potentiella köpare vill eventuellt överväga att spara lite pengar och välja en Full HD-skärm; en lägre upplösning på skärmen kommer troligen att spara en del batteritid och avlasta GPU:n något. De som vill spela kan tänkas vilja titta närmare på MSI GS63VR, som troligen snart kommer att uppdateras med en Max-Q GPU. Asus Zephyrus GX501 är en annan lockande tunn-och-lätt som också kommer med en GPU designad för Max-Q.
MSI WS63VR är ett praktexempel på fördelar som Nvidias nya Max-Q design för med sig. I utbyte mot en liten minskning i prestanda kan grafikchippen bättre hantera temperaturer och använder märkbart mindre ström. Om du kan kompromissa med en aningen mörkare skärm, en lite mindre precis styrplatta och sitter i närheten av ett eluttag majoritet av dagen så är WS63VR en arbetsstation värd att överväga. Det är spännande tider för tunna och lätta datorer och Max-Q kan vara det första steget mot att göra den formfaktorn till ett fullvärdigt alternativ som ersättning för en skrivbordsdator.
MSI WS63VR 7RL-023US
- 09/18/2017 v6 (old)
Sam Medley
Price comparison
