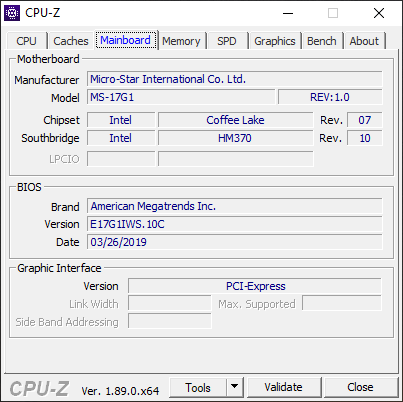
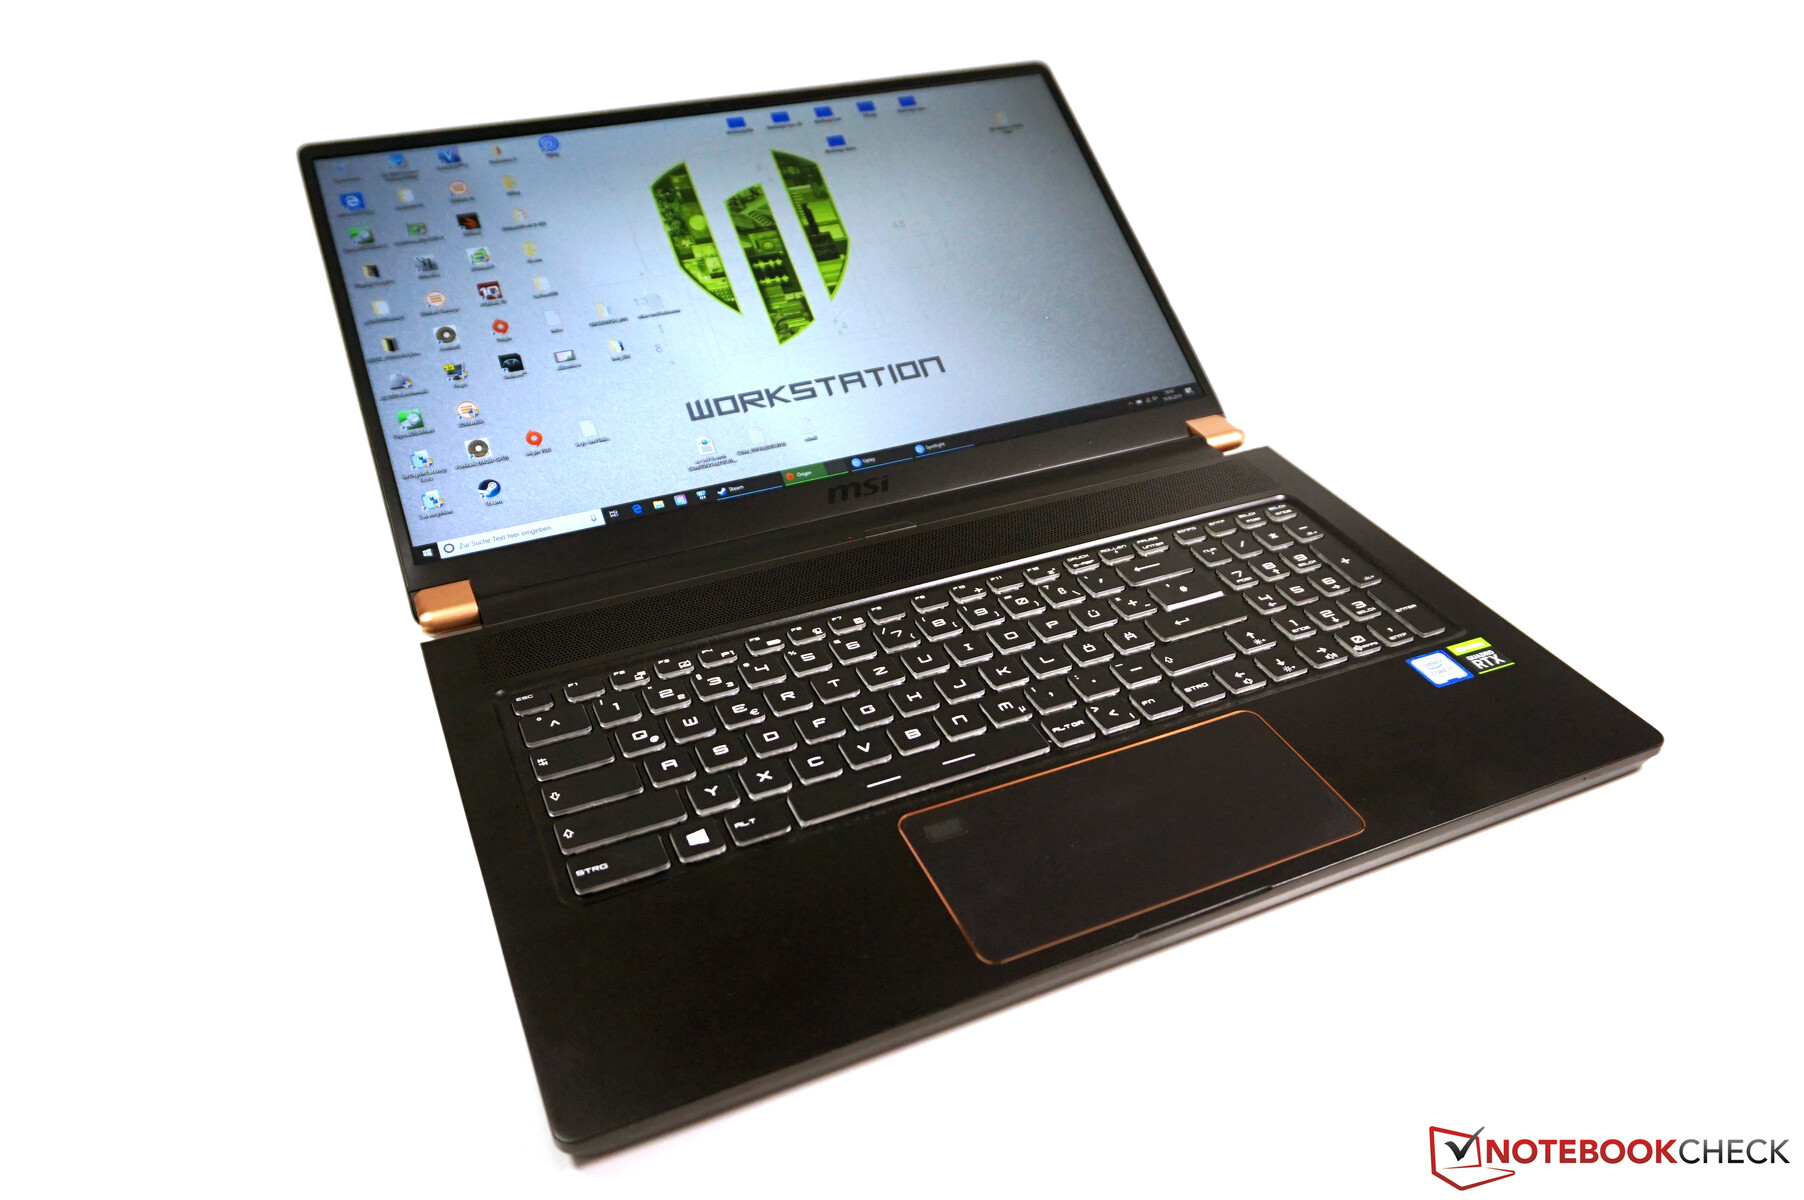
Test: MSI WS75 - Tunn arbetsstation på 17 tum med en kraftfull GPU
| SD Card Reader | |
| average JPG Copy Test (av. of 3 runs) | |
| Dell Precision 7730 (Toshiba Exceria Pro SDXC 64 GB UHS-II) | |
| MSI WS75 9TL-636 (Toshiba Exceria Pro M501 64 GB UHS-II) | |
| HP ZBook 17 G5-2ZC48EA (Toshiba Exceria Pro SDXC 64 GB UHS-II) | |
| Lenovo ThinkPad P72-20MB000EGE (Toshiba Exceria Pro SDXC 64 GB UHS-II) | |
| Fujitsu Celsius H980 (Toshiba Exceria Pro SDXC 64 GB UHS-II) | |
| Genomsnitt av klass Workstation (49.6 - 681, n=14, senaste 2 åren) | |
| maximum AS SSD Seq Read Test (1GB) | |
| Genomsnitt av klass Workstation (87.6 - 1455, n=14, senaste 2 åren) | |
| Dell Precision 7730 (Toshiba Exceria Pro SDXC 64 GB UHS-II) | |
| MSI WS75 9TL-636 (Toshiba Exceria Pro M501 64 GB UHS-II) | |
| Lenovo ThinkPad P72-20MB000EGE (Toshiba Exceria Pro SDXC 64 GB UHS-II) | |
| HP ZBook 17 G5-2ZC48EA (Toshiba Exceria Pro SDXC 64 GB UHS-II) | |
| Fujitsu Celsius H980 (Toshiba Exceria Pro SDXC 64 GB UHS-II) | |
| Networking | |
| iperf3 transmit AX12 | |
| Dell Precision 7730 | |
| HP ZBook 17 G5-2ZC48EA | |
| Lenovo ThinkPad P72-20MB000EGE | |
| MSI WS75 9TL-636 | |
| iperf3 receive AX12 | |
| Lenovo ThinkPad P72-20MB000EGE | |
| HP ZBook 17 G5-2ZC48EA | |
| MSI WS75 9TL-636 | |
| Dell Precision 7730 | |
| |||||||||||||||||||||||||
Distribution av ljusstyrkan: 86 %
Mitt på batteriet: 301 cd/m²
Kontrast: 1200:1 (Svärta: 0.25 cd/m²)
ΔE ColorChecker Calman: 3.9 | ∀{0.5-29.43 Ø4.73}
calibrated: 2.3
ΔE Greyscale Calman: 4.3 | ∀{0.09-98 Ø4.97}
91% sRGB (Argyll 1.6.3 3D)
59.2% AdobeRGB 1998 (Argyll 1.6.3 3D)
65.8% AdobeRGB 1998 (Argyll 3D)
91.1% sRGB (Argyll 3D)
64.5% Display P3 (Argyll 3D)
Gamma: 2.2
CCT: 7391 K
| MSI WS75 9TL-636 B173HAN04.2, , 1920x1080, 17.3" | Lenovo ThinkPad P72-20MB000EGE LP173WF4_SPF7, , 1920x1080, 17.3" | HP ZBook 17 G5-2ZC48EA AUO B173HW01 V0, , 1920x1080, 17.3" | Dell Precision 7730 B173HAN01.3, , 1920x1080, 17.3" | Fujitsu Celsius H980 LG Philips, LP173WF4-SPF5, , 1920x1080, 17.3" | |
|---|---|---|---|---|---|
| Display | -3% | 1% | 2% | -3% | |
| Display P3 Coverage (%) | 64.5 | 67.4 4% | 66.3 3% | 65 1% | 67.3 4% |
| sRGB Coverage (%) | 91.1 | 85 -7% | 89.9 -1% | 93.4 3% | 85 -7% |
| AdobeRGB 1998 Coverage (%) | 65.8 | 62.2 -5% | 66.3 1% | 62.2 -5% | |
| Response Times | -3% | -4% | -20% | 11% | |
| Response Time Grey 50% / Grey 80% * (ms) | 39.2 ? | 40.8 ? -4% | 42.4 ? -8% | 48.8 ? -24% | 38 ? 3% |
| Response Time Black / White * (ms) | 28.4 ? | 28.8 ? -1% | 28.4 ? -0% | 32.8 ? -15% | 23.2 ? 18% |
| PWM Frequency (Hz) | 120500 ? | ||||
| Screen | -8% | -6% | 17% | -24% | |
| Brightness middle (cd/m²) | 300 | 338 13% | 335 12% | 322 7% | 400 33% |
| Brightness (cd/m²) | 288 | 317 10% | 326 13% | 316 10% | 394 37% |
| Brightness Distribution (%) | 86 | 86 0% | 92 7% | 84 -2% | 92 7% |
| Black Level * (cd/m²) | 0.25 | 0.28 -12% | 0.22 12% | 0.24 4% | 0.51 -104% |
| Contrast (:1) | 1200 | 1207 1% | 1523 27% | 1342 12% | 784 -35% |
| Colorchecker dE 2000 * | 3.9 | 4.3 -10% | 4.7 -21% | 2.2 44% | 5.3 -36% |
| Colorchecker dE 2000 max. * | 6 | 10.2 -70% | 8.7 -45% | 4.6 23% | 9.3 -55% |
| Colorchecker dE 2000 calibrated * | 2.3 | 3.7 -61% | 2.7 -17% | 1.9 17% | 3.8 -65% |
| Greyscale dE 2000 * | 4.3 | 2.2 49% | 6.5 -51% | 1.6 63% | 5.5 -28% |
| Gamma | 2.2 100% | 2.17 101% | 2.23 99% | 2.19 100% | 2.17 101% |
| CCT | 7391 88% | 6621 98% | 6108 106% | 6621 98% | 6686 97% |
| Color Space (Percent of AdobeRGB 1998) (%) | 59.2 | 55.8 -6% | 58.7 -1% | 60.4 2% | 55.8 -6% |
| Color Space (Percent of sRGB) (%) | 91 | 84.7 -7% | 89.7 -1% | 93.3 3% | 84.9 -7% |
| Totalt genomsnitt (program/inställningar) | -5% /
-7% | -3% /
-5% | -0% /
9% | -5% /
-15% |
* ... mindre är bättre
Visa svarstider
| ↔ Svarstid svart till vitt | ||
|---|---|---|
| 28.4 ms ... stiga ↗ och falla ↘ kombinerat | ↗ 15.6 ms stiga | 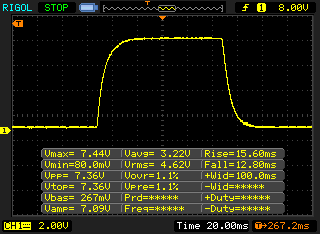 |
| ↘ 12.8 ms hösten | ||
| Skärmen visar relativt långsamma svarsfrekvenser i våra tester och kan vara för långsam för spelare. I jämförelse sträcker sig alla testade enheter från 0.1 (minst) till 240 (maximalt) ms. » 75 % av alla enheter är bättre. Detta innebär att den uppmätta svarstiden är sämre än genomsnittet av alla testade enheter (19.9 ms). | ||
| ↔ Svarstid 50 % grått till 80 % grått | ||
| 39.2 ms ... stiga ↗ och falla ↘ kombinerat | ↗ 19.6 ms stiga | 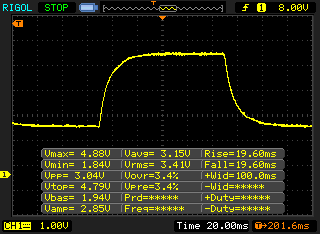 |
| ↘ 19.6 ms hösten | ||
| Skärmen visar långsamma svarsfrekvenser i våra tester och kommer att vara otillfredsställande för spelare. I jämförelse sträcker sig alla testade enheter från 0.165 (minst) till 636 (maximalt) ms. » 60 % av alla enheter är bättre. Detta innebär att den uppmätta svarstiden är sämre än genomsnittet av alla testade enheter (31.1 ms). | ||
Skärmflimmer / PWM (Puls-Width Modulation)
| Skärmflimmer / PWM upptäcktes inte | 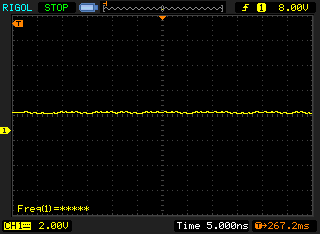 | ||
Som jämförelse: 52 % av alla testade enheter använder inte PWM för att dämpa skärmen. Om PWM upptäcktes mättes ett medelvärde av 7801 (minst: 5 - maximum: 343500) Hz. | |||

| Cinebench R15 | |
| CPU Single 64Bit | |
| Genomsnitt av klass Workstation (191.4 - 328, n=25, senaste 2 åren) | |
| MSI WS75 9TL-636 | |
| Lenovo ThinkPad P1-20MD002LUS | |
| Lenovo ThinkPad P72-20MB000EGE | |
| Genomsnitt Intel Core i7-9750H (170 - 194, n=82) | |
| Dell Precision 7730 | |
| HP ZBook 17 G5-2ZC48EA | |
| HP ZBook Studio G5-4QH10EA | |
| Fujitsu Celsius H980 | |
| CPU Multi 64Bit | |
| Genomsnitt av klass Workstation (2489 - 5810, n=25, senaste 2 åren) | |
| Dell Precision 7730 | |
| Lenovo ThinkPad P72-20MB000EGE (Undervolting) | |
| Lenovo ThinkPad P72-20MB000EGE (Default) | |
| HP ZBook 17 G5-2ZC48EA | |
| MSI WS75 9TL-636 | |
| Genomsnitt Intel Core i7-9750H (952 - 1306, n=85) | |
| HP ZBook Studio G5-4QH10EA | |
| Lenovo ThinkPad P1-20MD002LUS | |
| Fujitsu Celsius H980 | |
| PCMark 8 | |
| Home Score Accelerated v2 | |
| MSI WS75 9TL-636 | |
| Genomsnitt Intel Core i7-9750H, NVIDIA Quadro RTX 4000 (Laptop) (n=1) | |
| Dell Precision 7730 | |
| Lenovo ThinkPad P72-20MB000EGE | |
| Fujitsu Celsius H980 | |
| HP ZBook 17 G5-2ZC48EA | |
| Lenovo ThinkPad P1-20MD002LUS | |
| HP ZBook Studio G5-4QH10EA | |
| Work Score Accelerated v2 | |
| Lenovo ThinkPad P72-20MB000EGE | |
| Dell Precision 7730 | |
| MSI WS75 9TL-636 | |
| Genomsnitt Intel Core i7-9750H, NVIDIA Quadro RTX 4000 (Laptop) (n=1) | |
| HP ZBook 17 G5-2ZC48EA | |
| Fujitsu Celsius H980 | |
| HP ZBook Studio G5-4QH10EA | |
| Lenovo ThinkPad P1-20MD002LUS | |
| Creative Score Accelerated v2 | |
| MSI WS75 9TL-636 | |
| Genomsnitt Intel Core i7-9750H, NVIDIA Quadro RTX 4000 (Laptop) (n=1) | |
| HP ZBook 17 G5-2ZC48EA | |
| Lenovo ThinkPad P72-20MB000EGE | |
| Lenovo ThinkPad P1-20MD002LUS | |
| PCMark 8 Home Score Accelerated v2 | 4732 poäng | |
| PCMark 8 Creative Score Accelerated v2 | 7933 poäng | |
| PCMark 8 Work Score Accelerated v2 | 5323 poäng | |
| PCMark 10 Score | 5875 poäng | |
Hjälp | ||
| MSI WS75 9TL-636 Samsung SSD PM981 MZVLB1T0HALR | Lenovo ThinkPad P72-20MB000EGE Lenovo LENSE20256GMSP34MEAT2TA | Dell Precision 7730 Samsung SSD PM981 MZVLB512HAJQ | Lenovo ThinkPad P1-20MD002LUS Samsung SSD PM981 MZVLB2T0HMLB | HP ZBook Studio G5-4QH10EA Samsung SSD PM981 MZVLB512HAJQ | Fujitsu Celsius H980 Samsung SSD PM981 MZVLB512HAJQ | Genomsnitt Samsung SSD PM981 MZVLB1T0HALR | |
|---|---|---|---|---|---|---|---|
| CrystalDiskMark 5.2 / 6 | -7% | -2% | -9% | -15% | -14% | 11% | |
| Write 4K (MB/s) | 103.5 | 101 -2% | 103.2 0% | 108 4% | 102.7 -1% | 111.8 8% | 165.7 ? 60% |
| Read 4K (MB/s) | 41.88 | 45.37 8% | 41.39 -1% | 37.24 -11% | 38.32 -9% | 32.02 -24% | 44.6 ? 6% |
| Write Seq (MB/s) | 1931 | 1409 -27% | 1880 -3% | 1476 -24% | 1417 -27% | 1539 -20% | 1982 ? 3% |
| Read Seq (MB/s) | 1286 | 2129 66% | 2350 83% | 1367 6% | 1289 0% | 1252 -3% | 1764 ? 37% |
| Write 4K Q32T1 (MB/s) | 414.3 | 320.3 -23% | 282.3 -32% | 302.4 -27% | 278.9 -33% | 355.4 -14% | 395 ? -5% |
| Read 4K Q32T1 (MB/s) | 470.2 | 348.3 -26% | 314.3 -33% | 375 -20% | 348.8 -26% | 408.7 -13% | 434 ? -8% |
| Write Seq Q32T1 (MB/s) | 2393 | 1529 -36% | 1881 -21% | 2433 2% | 1895 -21% | 1913 -20% | 2351 ? -2% |
| Read Seq Q32T1 (MB/s) | 3425 | 2957 -14% | 3216 -6% | 3493 2% | 3352 -2% | 2530 -26% | 3234 ? -6% |
| Write 4K Q8T8 (MB/s) | 1484 | 1575 | 1772 | 1408 ? | |||
| Read 4K Q8T8 (MB/s) | 1536 | 1607 | 1022 | 1449 ? |

| LuxMark v2.0 64Bit | |
| Room GPUs-only | |
| MSI WS75 9TL-636 | |
| Dell Precision 7720 | |
| MSI WS63VR 7RL-023US | |
| HP ZBook 17 G4-Y3J82AV | |
| Dell Precision 7730 | |
| Fujitsu Celsius H980 | |
| Lenovo ThinkPad P72-20MB000EGE | |
| HP ZBook 17 G5-2ZC48EA | |
| Lenovo ThinkPad P1-20MD002LUS | |
| HP ZBook Studio G5-4QH10EA | |
| Sala GPUs-only | |
| MSI WS75 9TL-636 | |
| Fujitsu Celsius H980 | |
| MSI WS63VR 7RL-023US | |
| Dell Precision 7730 | |
| Dell Precision 7720 | |
| HP ZBook 17 G4-Y3J82AV | |
| Lenovo ThinkPad P72-20MB000EGE | |
| HP ZBook 17 G5-2ZC48EA | |
| Lenovo ThinkPad P1-20MD002LUS | |
| HP ZBook Studio G5-4QH10EA | |
| SiSoft Sandra 2016 | |
| Image Processing | |
| MSI WS75 9TL-636 | |
| Dell Precision 7730 | |
| Fujitsu Celsius H980 | |
| Lenovo ThinkPad P72-20MB000EGE | |
| Dell Precision 7720 | |
| HP ZBook 17 G4-Y3J82AV | |
| HP ZBook 17 G5-2ZC48EA | |
| HP ZBook Studio G5-4QH10EA | |
| GP Cryptography (Higher Security AES256+SHA2-512) | |
| MSI WS75 9TL-636 | |
| HP ZBook 17 G4-Y3J82AV | |
| Dell Precision 7720 | |
| Lenovo ThinkPad P72-20MB000EGE | |
| Fujitsu Celsius H980 | |
| Dell Precision 7730 | |
| HP ZBook 17 G5-2ZC48EA | |
| HP ZBook Studio G5-4QH10EA | |
| GP Financial Analysis (FP High/Double Precision) | |
| MSI WS75 9TL-636 | |
| Dell Precision 7720 | |
| HP ZBook 17 G4-Y3J82AV | |
| Dell Precision 7730 | |
| Fujitsu Celsius H980 | |
| Lenovo ThinkPad P72-20MB000EGE | |
| HP ZBook 17 G5-2ZC48EA | |
| HP ZBook Studio G5-4QH10EA | |
| SPECviewperf 13 | |
| Solidworks (sw-04) | |
| MSI WT75 8SM | |
| Lenovo ThinkPad P72-20MB000EGE | |
| Fujitsu Celsius H980 | |
| MSI WS75 9TL-636 | |
| Dell Precision 7730 | |
| HP ZBook 17 G5-2ZC48EA | |
| HP ZBook Studio G5-4QH10EA | |
| Lenovo ThinkPad P1-20MD002LUS | |
| Siemens NX (snx-03) | |
| MSI WT75 8SM | |
| MSI WS75 9TL-636 | |
| Fujitsu Celsius H980 | |
| Lenovo ThinkPad P72-20MB000EGE | |
| HP ZBook 17 G5-2ZC48EA | |
| Dell Precision 7730 | |
| Lenovo ThinkPad P1-20MD002LUS | |
| HP ZBook Studio G5-4QH10EA | |
| Showcase (showcase-02) | |
| MSI WS75 9TL-636 | |
| MSI WT75 8SM | |
| HP ZBook 17 G5-2ZC48EA | |
| Fujitsu Celsius H980 | |
| Dell Precision 7730 | |
| Lenovo ThinkPad P72-20MB000EGE | |
| Lenovo ThinkPad P1-20MD002LUS | |
| HP ZBook Studio G5-4QH10EA | |
| Medical (medical-02) | |
| MSI WS75 9TL-636 | |
| MSI WT75 8SM | |
| Dell Precision 7730 | |
| Fujitsu Celsius H980 | |
| Lenovo ThinkPad P72-20MB000EGE | |
| HP ZBook 17 G5-2ZC48EA | |
| Lenovo ThinkPad P1-20MD002LUS | |
| HP ZBook Studio G5-4QH10EA | |
| Maya (maya-05) | |
| MSI WT75 8SM | |
| MSI WS75 9TL-636 | |
| Fujitsu Celsius H980 | |
| Lenovo ThinkPad P72-20MB000EGE | |
| HP ZBook 17 G5-2ZC48EA | |
| Dell Precision 7730 | |
| Lenovo ThinkPad P1-20MD002LUS | |
| HP ZBook Studio G5-4QH10EA | |
| Energy (energy-02) | |
| MSI WS75 9TL-636 | |
| Dell Precision 7730 | |
| MSI WT75 8SM | |
| Fujitsu Celsius H980 | |
| Lenovo ThinkPad P72-20MB000EGE | |
| HP ZBook 17 G5-2ZC48EA | |
| Lenovo ThinkPad P1-20MD002LUS | |
| HP ZBook Studio G5-4QH10EA | |
| Creo (creo-02) | |
| MSI WT75 8SM | |
| MSI WS75 9TL-636 | |
| Lenovo ThinkPad P72-20MB000EGE | |
| Fujitsu Celsius H980 | |
| Dell Precision 7730 | |
| HP ZBook 17 G5-2ZC48EA | |
| Lenovo ThinkPad P1-20MD002LUS | |
| HP ZBook Studio G5-4QH10EA | |
| Catia (catia-05) | |
| MSI WT75 8SM | |
| MSI WS75 9TL-636 | |
| Lenovo ThinkPad P72-20MB000EGE | |
| Fujitsu Celsius H980 | |
| Dell Precision 7730 | |
| HP ZBook 17 G5-2ZC48EA | |
| Lenovo ThinkPad P1-20MD002LUS | |
| HP ZBook Studio G5-4QH10EA | |
| 3ds Max (3dsmax-06) | |
| MSI WS75 9TL-636 | |
| MSI WT75 8SM | |
| Dell Precision 7730 | |
| Fujitsu Celsius H980 | |
| Lenovo ThinkPad P72-20MB000EGE | |
| HP ZBook 17 G5-2ZC48EA | |
| Lenovo ThinkPad P1-20MD002LUS | |
| HP ZBook Studio G5-4QH10EA | |
| 3DMark 11 - 1280x720 Performance GPU | |
| Genomsnitt av klass Workstation (10888 - 69594, n=25, senaste 2 åren) | |
| Genomsnitt NVIDIA Quadro RTX 4000 (Laptop) (23739 - 27002, n=2) | |
| MSI WT75 8SM | |
| MSI WS75 9TL-636 | |
| HP ZBook 17 G4-Y3J82AV | |
| Dell Precision 7720 | |
| Lenovo ThinkPad P72-20MB000EGE | |
| Fujitsu Celsius H980 | |
| Dell Precision 7730 | |
| MSI WS63VR 7RL-023US | |
| Lenovo ThinkPad P1-20MD002LUS | |
| HP ZBook Studio G5-4QH10EA | |
| 3DMark | |
| 1920x1080 Fire Strike Graphics | |
| Genomsnitt av klass Workstation (7578 - 52560, n=25, senaste 2 åren) | |
| Genomsnitt NVIDIA Quadro RTX 4000 (Laptop) (17619 - 20079, n=2) | |
| MSI WT75 8SM | |
| MSI WS75 9TL-636 | |
| Dell Precision 7720 | |
| HP ZBook 17 G4-Y3J82AV | |
| Dell Precision 7730 | |
| Lenovo ThinkPad P72-20MB000EGE | |
| Fujitsu Celsius H980 | |
| MSI WS63VR 7RL-023US | |
| Lenovo ThinkPad P1-20MD002LUS | |
| HP ZBook Studio G5-4QH10EA | |
| 2560x1440 Time Spy Graphics | |
| Genomsnitt av klass Workstation (2725 - 24806, n=25, senaste 2 åren) | |
| Genomsnitt NVIDIA Quadro RTX 4000 (Laptop) (6851 - 7717, n=2) | |
| MSI WS75 9TL-636 | |
| MSI WT75 8SM | |
| HP ZBook 17 G4-Y3J82AV | |
| Lenovo ThinkPad P72-20MB000EGE | |
| Fujitsu Celsius H980 | |
| Dell Precision 7720 | |
| Lenovo ThinkPad P1-20MD002LUS | |
| HP ZBook Studio G5-4QH10EA | |
| Unigine Heaven 4.0 | |
| Extreme Preset OpenGL | |
| Genomsnitt av klass Workstation (72.4 - 185.3, n=4, senaste 2 åren) | |
| MSI WS75 9TL-636 | |
| Genomsnitt NVIDIA Quadro RTX 4000 (Laptop) (n=1) | |
| Dell Precision 7720 | |
| HP ZBook 17 G4-Y3J82AV | |
| Fujitsu Celsius H980 | |
| Lenovo ThinkPad P72-20MB000EGE | |
| HP ZBook 17 G5-2ZC48EA | |
| HP ZBook Studio G5-4QH10EA | |
| Extreme Preset DX11 | |
| Genomsnitt av klass Workstation (77.7 - 222, n=4, senaste 2 åren) | |
| MSI WS75 9TL-636 | |
| Genomsnitt NVIDIA Quadro RTX 4000 (Laptop) (n=1) | |
| Dell Precision 7720 | |
| HP ZBook 17 G4-Y3J82AV | |
| Fujitsu Celsius H980 | |
| HP ZBook 17 G5-2ZC48EA | |
| Lenovo ThinkPad P72-20MB000EGE | |
| Lenovo ThinkPad P1-20MD002LUS | |
| HP ZBook Studio G5-4QH10EA | |
| Unigine Valley 1.0 | |
| 1920x1080 Extreme HD DirectX AA:x8 | |
| MSI WS75 9TL-636 | |
| Genomsnitt NVIDIA Quadro RTX 4000 (Laptop) (n=1) | |
| HP ZBook 17 G4-Y3J82AV | |
| Dell Precision 7720 | |
| Lenovo ThinkPad P72-20MB000EGE | |
| Fujitsu Celsius H980 | |
| Genomsnitt av klass Workstation (n=1senaste 2 åren) | |
| HP ZBook 17 G5-2ZC48EA | |
| HP ZBook Studio G5-4QH10EA | |
| 1920x1080 Extreme HD Preset OpenGL AA:x8 | |
| MSI WS75 9TL-636 | |
| Genomsnitt NVIDIA Quadro RTX 4000 (Laptop) (n=1) | |
| HP ZBook 17 G4-Y3J82AV | |
| Dell Precision 7720 | |
| Fujitsu Celsius H980 | |
| Genomsnitt av klass Workstation (n=1senaste 2 åren) | |
| HP ZBook 17 G5-2ZC48EA | |
| Lenovo ThinkPad P72-20MB000EGE | |
| HP ZBook Studio G5-4QH10EA | |
| 3DMark Vantage P Result | 56250 poäng | |
| 3DMark 11 Performance | 19880 poäng | |
| 3DMark Cloud Gate Standard Score | 38830 poäng | |
| 3DMark Fire Strike Score | 15912 poäng | |
| 3DMark Time Spy Score | 6823 poäng | |
Hjälp | ||
| The Witcher 3 | |
| 1920x1080 High Graphics & Postprocessing (Nvidia HairWorks Off) | |
| MSI GT76 Titan DT 9SG | |
| Genomsnitt NVIDIA Quadro RTX 4000 (Laptop) (132 - 153, n=2) | |
| MSI WS75 9TL-636 | |
| Asus Zephyrus S GX502GW | |
| Gigabyte Aero 15 Classic-XA | |
| Medion Erazer X15805 | |
| Dell G5 15 5590 | |
| Genomsnitt av klass Workstation (53.4 - 156.4, n=3, senaste 2 åren) | |
| 1920x1080 Ultra Graphics & Postprocessing (HBAO+) | |
| MSI GT76 Titan DT 9SG | |
| Genomsnitt NVIDIA Quadro RTX 4000 (Laptop) (70 - 79, n=2) | |
| Asus Zephyrus S GX502GW | |
| MSI WS75 9TL-636 | |
| Gigabyte Aero 15 Classic-XA | |
| Medion Erazer X15805 | |
| Dell G5 15 5590 | |
| Genomsnitt av klass Workstation (26.3 - 91.7, n=3, senaste 2 åren) | |
| Anno 1800 | |
| 1920x1080 Ultra Graphics Quality (DX11) | |
| MSI GT76 Titan DT 9SG | |
| MSI WS75 9TL-636 | |
| Genomsnitt NVIDIA Quadro RTX 4000 (Laptop) (n=1) | |
| Asus Zephyrus S GX502GW | |
| Medion Erazer X15805 | |
| Dell G5 15 5590 | |
| Gigabyte Aero 15 Classic-XA | |
| 1920x1080 High Graphics Quality (DX11) | |
| MSI GT76 Titan DT 9SG | |
| MSI WS75 9TL-636 | |
| Genomsnitt NVIDIA Quadro RTX 4000 (Laptop) (n=1) | |
| Asus Zephyrus S GX502GW | |
| Medion Erazer X15805 | |
| Gigabyte Aero 15 Classic-XA | |
| Dell G5 15 5590 | |
| låg | med. | hög | ultra | QHD | 4K | |
|---|---|---|---|---|---|---|
| The Witcher 3 (2015) | 303 | 215 | 132 | 70 | 46 | |
| Dota 2 Reborn (2015) | 152 | 140 | 133 | 129 | 100 | |
| Rise of the Tomb Raider (2016) | 199.6 | 127.8 | 104.9 | 45.1 | ||
| For Honor (2017) | 289 | 148 | 141 | 109 | 45.7 | |
| Ghost Recon Wildlands (2017) | 139.9 | 98 | 90.8 | 52.9 | 35 | |
| X-Plane 11.11 (2018) | 119 | 107 | 88 | |||
| Far Cry 5 (2018) | 129 | 106 | 100 | 96 | 69 | 36 |
| F1 2018 (2018) | 241 | 180 | 142 | 95 | 76 | 48 |
| Shadow of the Tomb Raider (2018) | 138.6 | 105.2 | 81.6 | 85 | 57.1 | 29.7 |
| Assassin´s Creed Odyssey (2018) | 99 | 87 | 75 | 54 | 41 | 28 |
| Hitman 2 (2018) | 95.4 | 93.6 | 85.8 | 81.1 | 72.9 | 39.4 |
| Battlefield V (2018) | 116.7 | 100.6 | 86.6 | 81 | 65.5 | 41.8 |
| Darksiders III (2018) | 143.8 | 119.2 | 105.2 | 69.1 | 34.2 | |
| Just Cause 4 (2018) | 150 | 125 | 93 | 86 | 60 | 33 |
| Far Cry New Dawn (2019) | 124 | 102 | 99 | 88 | 72 | 39 |
| Dirt Rally 2.0 (2019) | 267 | 180.7 | 151 | 85.6 | 63.3 | |
| The Division 2 (2019) | 180 | 122 | 96 | 70 | 47 | 25 |
| Anno 1800 (2019) | 98 | 77.5 | 42.6 | 37.7 | 22.4 |
Ljudnivå
| Låg belastning |
| 29.4 / 30.1 / 30.9 dB(A) |
| Hög belastning |
| 40.7 / 42.7 dB(A) |
 | ||
30 dB tyst 40 dB(A) hörbar 50 dB(A) högt ljud |
||
min: | ||
| MSI WS75 9TL-636 Quadro RTX 4000 (Laptop), i7-9750H, Samsung SSD PM981 MZVLB1T0HALR | Lenovo ThinkPad P72-20MB000EGE Quadro P3200, i7-8850H, Lenovo LENSE20256GMSP34MEAT2TA | HP ZBook 17 G5-2ZC48EA Quadro P3200, i7-8850H, Toshiba XG5 KXG50ZNV256G | Dell Precision 7730 Quadro P3200, i7-8850H, Samsung SSD PM981 MZVLB512HAJQ | Lenovo ThinkPad P1-20MD002LUS Quadro P2000 Max-Q, E-2176M, Samsung SSD PM981 MZVLB2T0HMLB | HP ZBook Studio G5-4QH10EA Quadro P1000, i7-8750H, Samsung SSD PM981 MZVLB512HAJQ | Fujitsu Celsius H980 Quadro P3200, i7-8750H, Samsung SSD PM981 MZVLB512HAJQ | |
|---|---|---|---|---|---|---|---|
| Noise | 10% | 3% | 5% | 4% | 5% | -3% | |
| av / miljö * (dB) | 29.4 | 28.6 3% | 28.7 2% | 29.7 -1% | 28.3 4% | 28.6 3% | 29.6 -1% |
| Idle Minimum * (dB) | 29.4 | 28.6 3% | 28.7 2% | 29.7 -1% | 28.4 3% | 28.6 3% | 29.6 -1% |
| Idle Average * (dB) | 30.1 | 28.6 5% | 28.7 5% | 29.7 1% | 28.4 6% | 28.6 5% | 32.5 -8% |
| Idle Maximum * (dB) | 30.9 | 28.6 7% | 30.9 -0% | 29.7 4% | 29.2 6% | 30 3% | 32.5 -5% |
| Load Average * (dB) | 40.7 | 31.9 22% | 37.3 8% | 31.4 23% | 41.8 -3% | 38.1 6% | 34.9 14% |
| Witcher 3 ultra * (dB) | 41.9 | 35.7 15% | 41.1 2% | 37.9 10% | 39.1 7% | 35 16% | |
| Load Maximum * (dB) | 42.7 | 37.7 12% | 41.4 3% | 44.2 -4% | 41.8 2% | 42.5 -0% | 49.1 -15% |
* ... mindre är bättre
(-) Den maximala temperaturen på ovansidan är 47.4 °C / 117 F, jämfört med genomsnittet av 38.2 °C / 101 F , allt från 22.2 till 69.8 °C för klassen Workstation.
(-) Botten värms upp till maximalt 55.6 °C / 132 F, jämfört med genomsnittet av 41.1 °C / 106 F
(+) Vid tomgångsbruk är medeltemperaturen för ovansidan 22.6 °C / 73 F, jämfört med enhetsgenomsnittet på 32 °C / ### class_avg_f### F.
(±) När du spelar The Witcher 3 är medeltemperaturen för ovansidan 36.4 °C / 98 F, jämfört med enhetsgenomsnittet på 32 °C / ## #class_avg_f### F.
(+) Handledsstöden och pekplattan är kallare än hudtemperaturen med maximalt 31.9 °C / 89.4 F och är därför svala att ta på.
(-) Medeltemperaturen för handledsstödsområdet på liknande enheter var 27.8 °C / 82 F (-4.1 °C / -7.4 F).
MSI WS75 9TL-636 ljudanalys
(±) | högtalarljudstyrkan är genomsnittlig men bra (75.4 dB)
Bas 100 - 315 Hz
(-) | nästan ingen bas - i genomsnitt 25.9% lägre än medianen
(±) | linjäriteten för basen är genomsnittlig (7.8% delta till föregående frekvens)
Mellan 400 - 2000 Hz
(±) | högre mellan - i genomsnitt 5.2% högre än median
(±) | linjäriteten för mids är genomsnittlig (8.1% delta till föregående frekvens)
Högsta 2 - 16 kHz
(+) | balanserade toppar - endast 3.3% från medianen
(±) | linjäriteten för toppar är genomsnittlig (9.3% delta till föregående frekvens)
Totalt 100 - 16 000 Hz
(±) | linjäriteten för det totala ljudet är genomsnittlig (27.5% skillnad mot median)
Jämfört med samma klass
» 94% av alla testade enheter i den här klassen var bättre, 2% liknande, 4% sämre
» Den bästa hade ett delta på 7%, genomsnittet var 17%, sämst var 35%
Jämfört med alla testade enheter
» 84% av alla testade enheter var bättre, 3% liknande, 13% sämre
» Den bästa hade ett delta på 4%, genomsnittet var 24%, sämst var 134%
Lenovo ThinkPad P72-20MB000EGE ljudanalys
(-) | inte särskilt höga högtalare (69.6 dB)
Bas 100 - 315 Hz
(-) | nästan ingen bas - i genomsnitt 17.4% lägre än medianen
(±) | linjäriteten för basen är genomsnittlig (13.5% delta till föregående frekvens)
Mellan 400 - 2000 Hz
(±) | högre mellan - i genomsnitt 7.2% högre än median
(±) | linjäriteten för mids är genomsnittlig (8.7% delta till föregående frekvens)
Högsta 2 - 16 kHz
(+) | balanserade toppar - endast 4.4% från medianen
(±) | linjäriteten för toppar är genomsnittlig (12.7% delta till föregående frekvens)
Totalt 100 - 16 000 Hz
(-) | det totala ljudet är inte linjärt (30.7% skillnad mot median)
Jämfört med samma klass
» 97% av alla testade enheter i den här klassen var bättre, 1% liknande, 1% sämre
» Den bästa hade ett delta på 7%, genomsnittet var 17%, sämst var 35%
Jämfört med alla testade enheter
» 89% av alla testade enheter var bättre, 3% liknande, 8% sämre
» Den bästa hade ett delta på 4%, genomsnittet var 24%, sämst var 134%
HP ZBook 17 G5-2ZC48EA ljudanalys
(±) | högtalarljudstyrkan är genomsnittlig men bra (75.8 dB)
Bas 100 - 315 Hz
(±) | reducerad bas - i genomsnitt 9.3% lägre än medianen
(±) | linjäriteten för basen är genomsnittlig (8.5% delta till föregående frekvens)
Mellan 400 - 2000 Hz
(+) | balanserad mellan - endast 3.1% från medianen
(+) | mids är linjära (3.9% delta till föregående frekvens)
Högsta 2 - 16 kHz
(+) | balanserade toppar - endast 2.6% från medianen
(+) | toppar är linjära (3.4% delta till föregående frekvens)
Totalt 100 - 16 000 Hz
(+) | det totala ljudet är linjärt (14.3% skillnad mot median)
Jämfört med samma klass
» 30% av alla testade enheter i den här klassen var bättre, 4% liknande, 67% sämre
» Den bästa hade ett delta på 7%, genomsnittet var 17%, sämst var 35%
Jämfört med alla testade enheter
» 17% av alla testade enheter var bättre, 4% liknande, 79% sämre
» Den bästa hade ett delta på 4%, genomsnittet var 24%, sämst var 134%
Dell Precision 7730 ljudanalys
(±) | högtalarljudstyrkan är genomsnittlig men bra (81.1 dB)
Bas 100 - 315 Hz
(-) | nästan ingen bas - i genomsnitt 16.7% lägre än medianen
(±) | linjäriteten för basen är genomsnittlig (11.6% delta till föregående frekvens)
Mellan 400 - 2000 Hz
(±) | reducerade mids - i genomsnitt 5.4% lägre än median
(+) | mids är linjära (5.4% delta till föregående frekvens)
Högsta 2 - 16 kHz
(+) | balanserade toppar - endast 4% från medianen
(+) | toppar är linjära (5.8% delta till föregående frekvens)
Totalt 100 - 16 000 Hz
(±) | linjäriteten för det totala ljudet är genomsnittlig (17% skillnad mot median)
Jämfört med samma klass
» 49% av alla testade enheter i den här klassen var bättre, 10% liknande, 41% sämre
» Den bästa hade ett delta på 7%, genomsnittet var 17%, sämst var 35%
Jämfört med alla testade enheter
» 30% av alla testade enheter var bättre, 8% liknande, 62% sämre
» Den bästa hade ett delta på 4%, genomsnittet var 24%, sämst var 134%
| Av/Standby | |
| Låg belastning | |
| Hög belastning |
|
Förklaring:
min: | |
| MSI WS75 9TL-636 i7-9750H, Quadro RTX 4000 (Laptop), Samsung SSD PM981 MZVLB1T0HALR, IPS, 1920x1080, 17.3" | Lenovo ThinkPad P72-20MB000EGE i7-8850H, Quadro P3200, Lenovo LENSE20256GMSP34MEAT2TA, IPS, 1920x1080, 17.3" | HP ZBook 17 G5-2ZC48EA i7-8850H, Quadro P3200, Toshiba XG5 KXG50ZNV256G, , 1920x1080, 17.3" | Dell Precision 7730 i7-8850H, Quadro P3200, Samsung SSD PM981 MZVLB512HAJQ, IPS LED, 1920x1080, 17.3" | Lenovo ThinkPad P1-20MD002LUS E-2176M, Quadro P2000 Max-Q, Samsung SSD PM981 MZVLB2T0HMLB, IPS, 3840x2160, 15.6" | HP ZBook Studio G5-4QH10EA i7-8750H, Quadro P1000, Samsung SSD PM981 MZVLB512HAJQ, IPS LED, 3840x2160, 15.6" | Fujitsu Celsius H980 i7-8750H, Quadro P3200, Samsung SSD PM981 MZVLB512HAJQ, IPS, 1920x1080, 17.3" | Genomsnitt NVIDIA Quadro RTX 4000 (Laptop) | Genomsnitt av klass Workstation | |
|---|---|---|---|---|---|---|---|---|---|
| Power Consumption | 34% | 20% | 11% | 36% | 41% | -0% | -16% | 21% | |
| Idle Minimum * (Watt) | 16.4 | 4.6 72% | 9.3 43% | 10.1 38% | 7.1 57% | 6.8 59% | 14.8 10% | 18.7 ? -14% | 8.94 ? 45% |
| Idle Average * (Watt) | 21.6 | 12.2 44% | 14.4 33% | 18 17% | 14.4 33% | 11.3 48% | 20.4 6% | 26 ? -20% | 13.8 ? 36% |
| Idle Maximum * (Watt) | 22.9 | 15.4 33% | 15.8 31% | 19.7 14% | 14.6 36% | 14.3 38% | 21.5 6% | 29.3 ? -28% | 17.5 ? 24% |
| Load Average * (Watt) | 88 | 79.6 10% | 89.2 -1% | 89.6 -2% | 93.9 -7% | 78 11% | 98.4 -12% | 99 ? -13% | 95 ? -8% |
| Witcher 3 ultra * (Watt) | 137 | 86 37% | 123 10% | 134 2% | 77.9 43% | 64 53% | |||
| Load Maximum * (Watt) | 193 | 176 9% | 189 2% | 204 -6% | 88.3 54% | 126 35% | 213.5 -11% | 204 ? -6% | 175.2 ? 9% |
* ... mindre är bättre
| MSI WS75 9TL-636 i7-9750H, Quadro RTX 4000 (Laptop), 82 Wh | Lenovo ThinkPad P72-20MB000EGE i7-8850H, Quadro P3200, 99 Wh | HP ZBook 17 G5-2ZC48EA i7-8850H, Quadro P3200, Wh | Dell Precision 7730 i7-8850H, Quadro P3200, 92 Wh | Lenovo ThinkPad P1-20MD002LUS E-2176M, Quadro P2000 Max-Q, 80 Wh | HP ZBook Studio G5-4QH10EA i7-8750H, Quadro P1000, 97 Wh | Fujitsu Celsius H980 i7-8750H, Quadro P3200, 96 Wh | Genomsnitt av klass Workstation | |
|---|---|---|---|---|---|---|---|---|
| Batteridrifttid | 63% | 54% | -6% | -20% | 45% | 6% | 43% | |
| Reader / Idle (h) | 12.6 | 28.3 125% | 21.9 74% | 17.3 37% | 13.5 7% | 26.1 ? 107% | ||
| H.264 (h) | 8.2 | 12.3 50% | 9.2 12% | 5.8 -29% | 9.1 11% | 5.9 -28% | 9.51 ? 16% | |
| WiFi v1.3 (h) | 6.6 | 11.2 70% | 5.6 -15% | 5.3 -20% | 9.7 47% | 8.3 26% | 8.53 ? 29% | |
| Load (h) | 1.2 | 1.3 8% | 2.1 75% | 1.5 25% | 2.2 83% | 1.4 17% | 1.429 ? 19% |
För
Emot
Läs den fullständiga versionen av den här recensionen på engelska här.
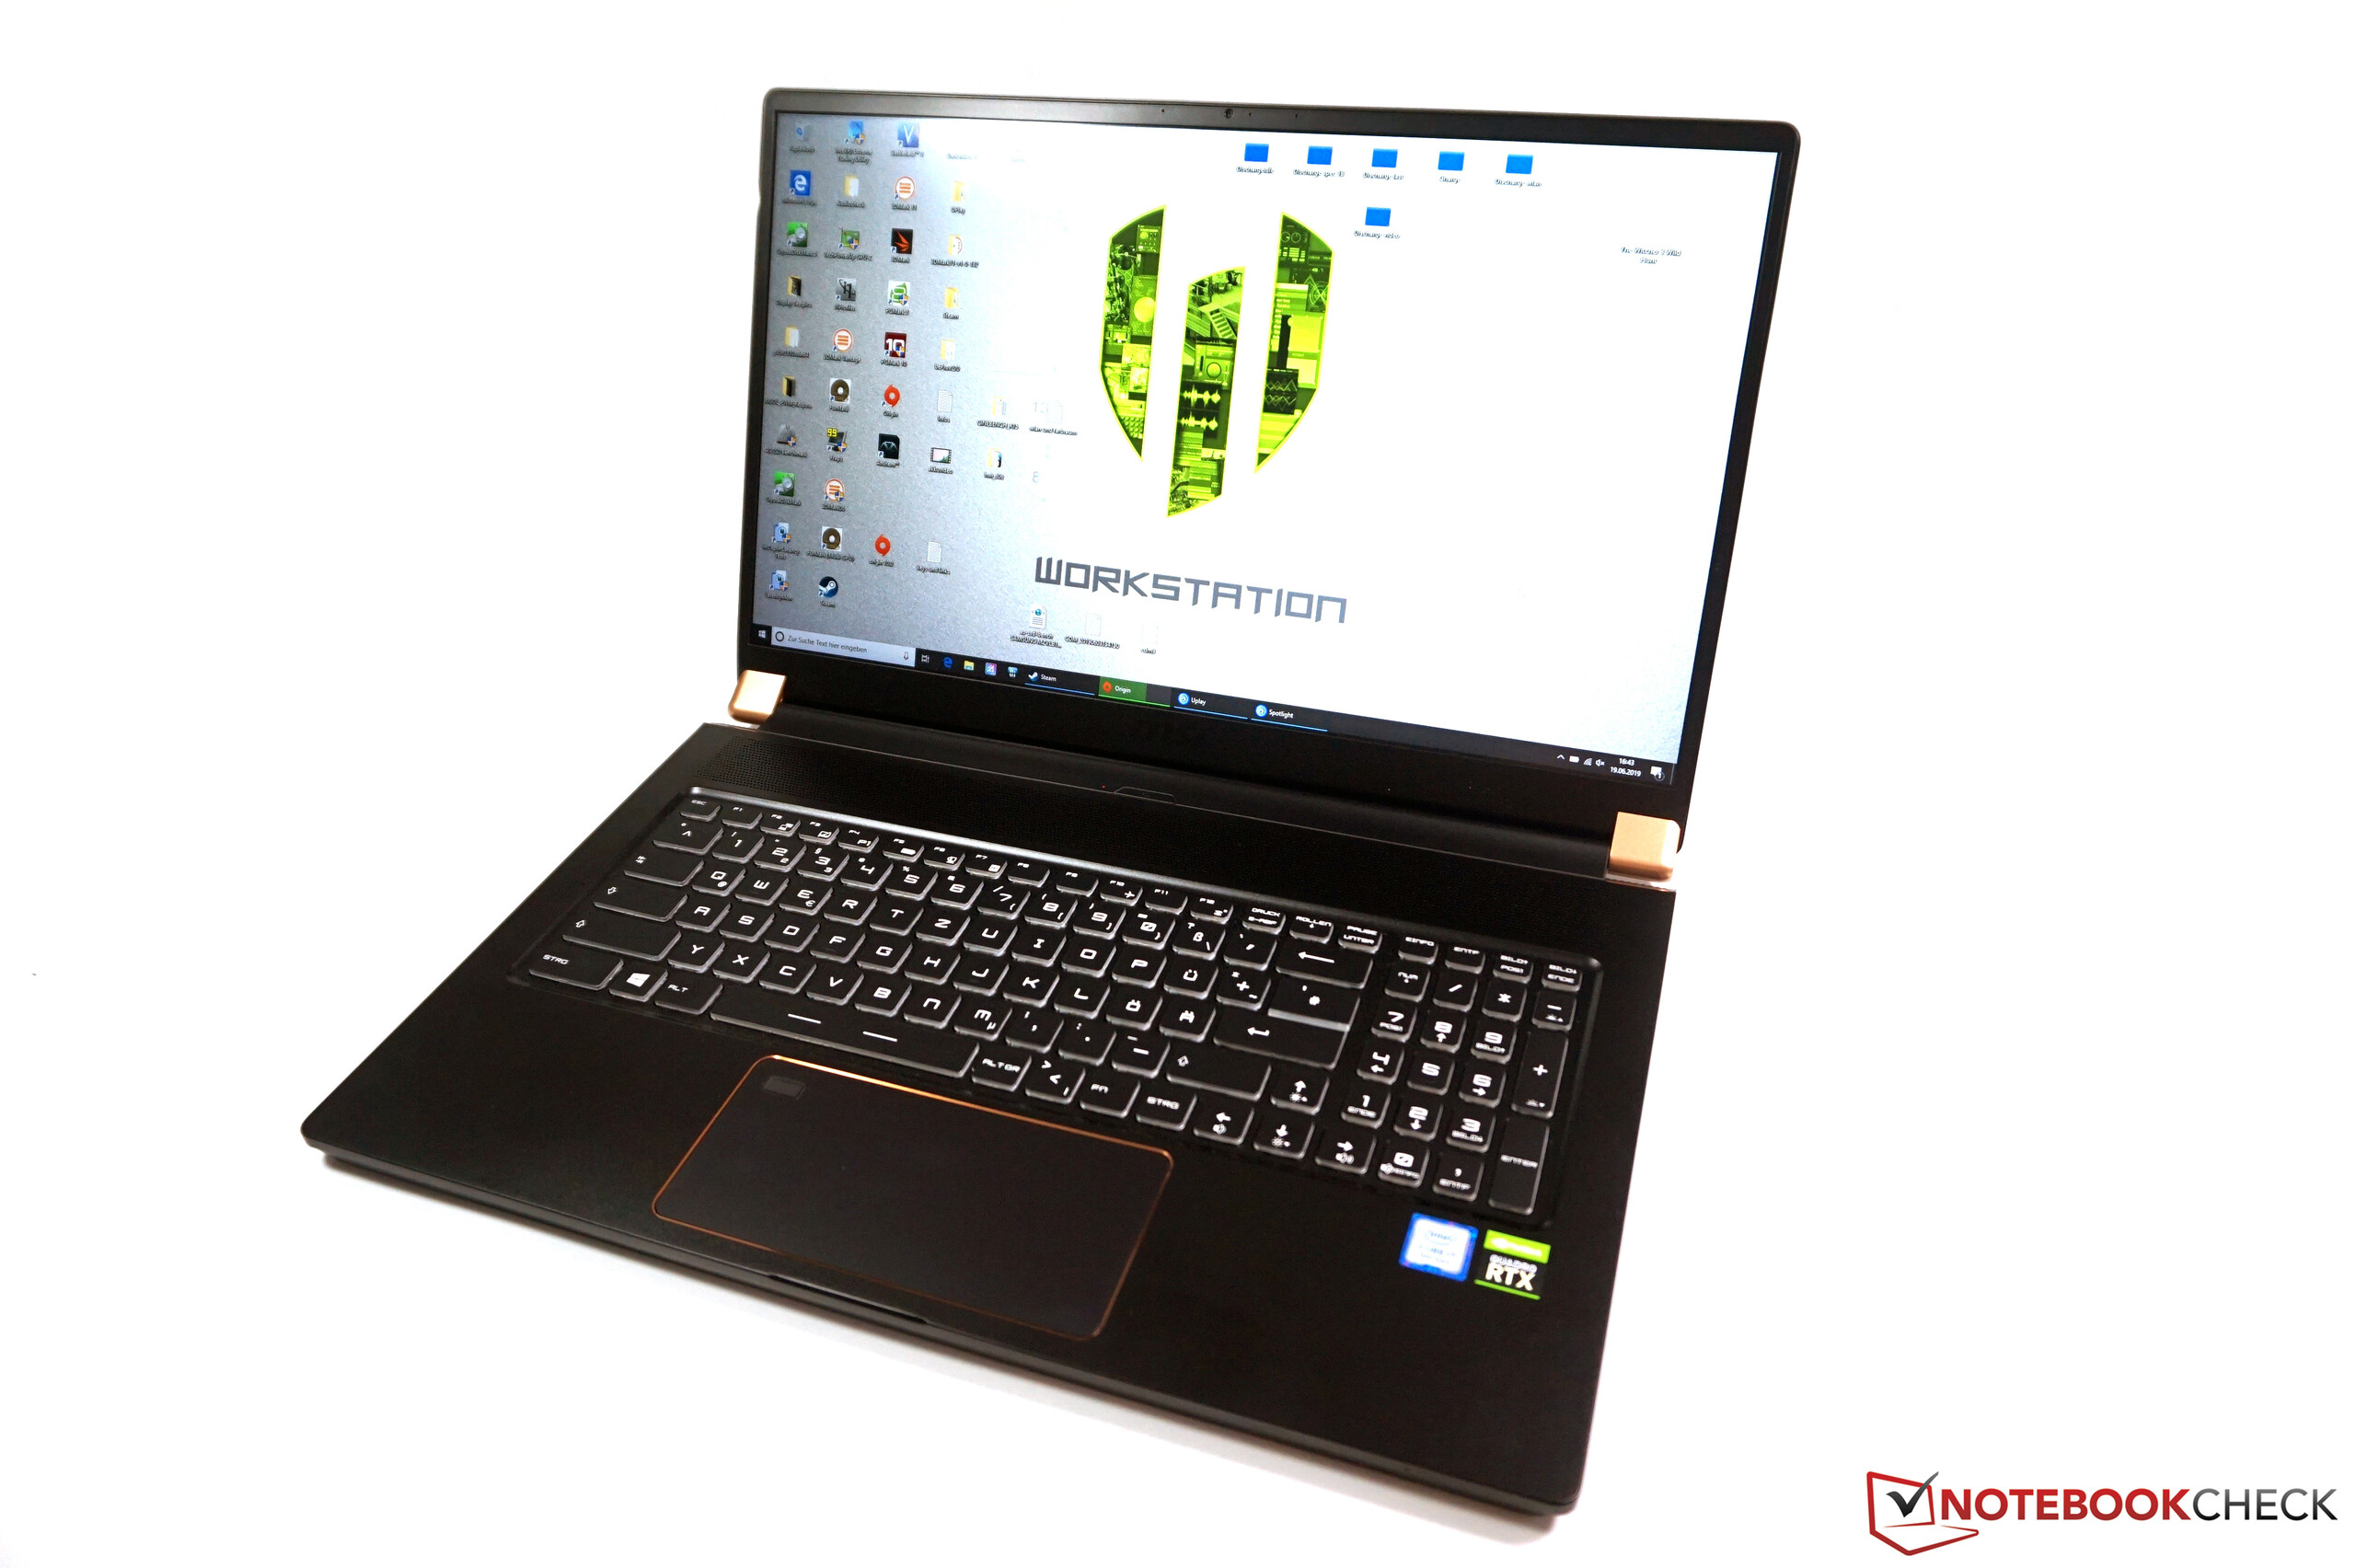
MSI presenterar en riktigt intressant mobil arbetsstation i form av WS75. Omvandlingen från speldatorn GS75 har gått riktigt bra och den tunna enheten kan för många användare vara ett gångbart alternativ till mer välkända modeller på 17.3 tum som, vid jämförelse, är extremt klumpiga.
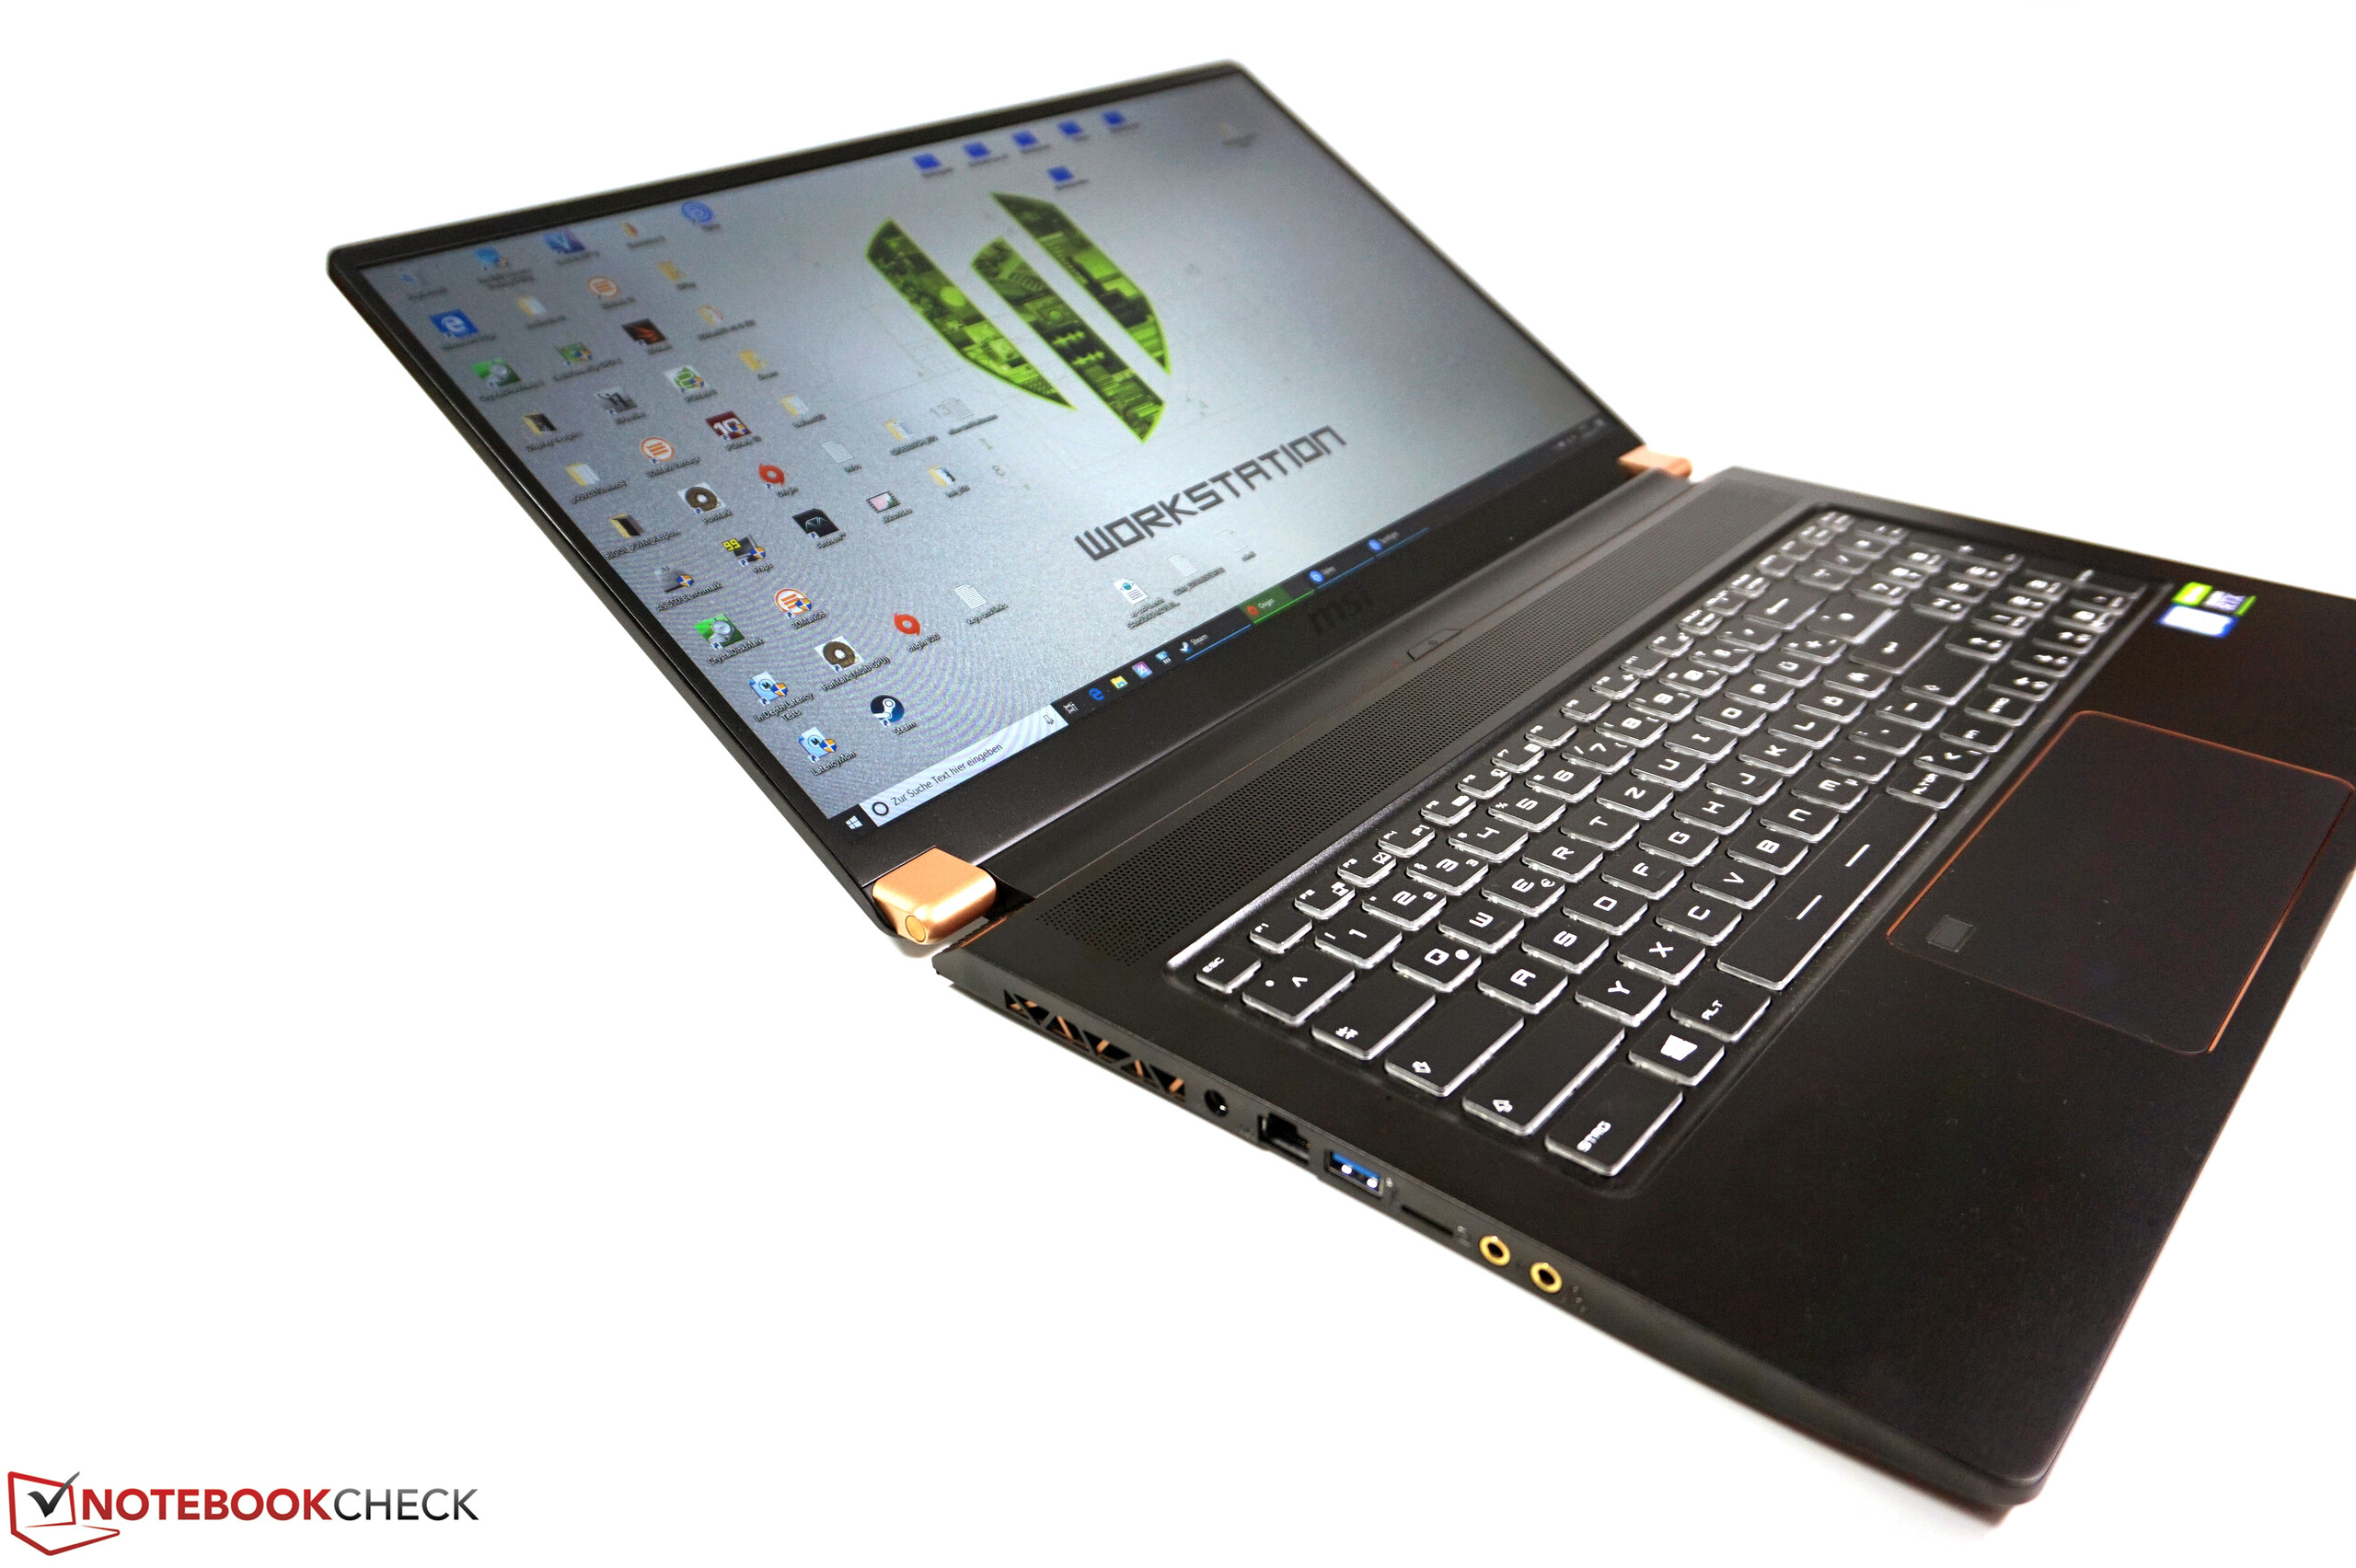
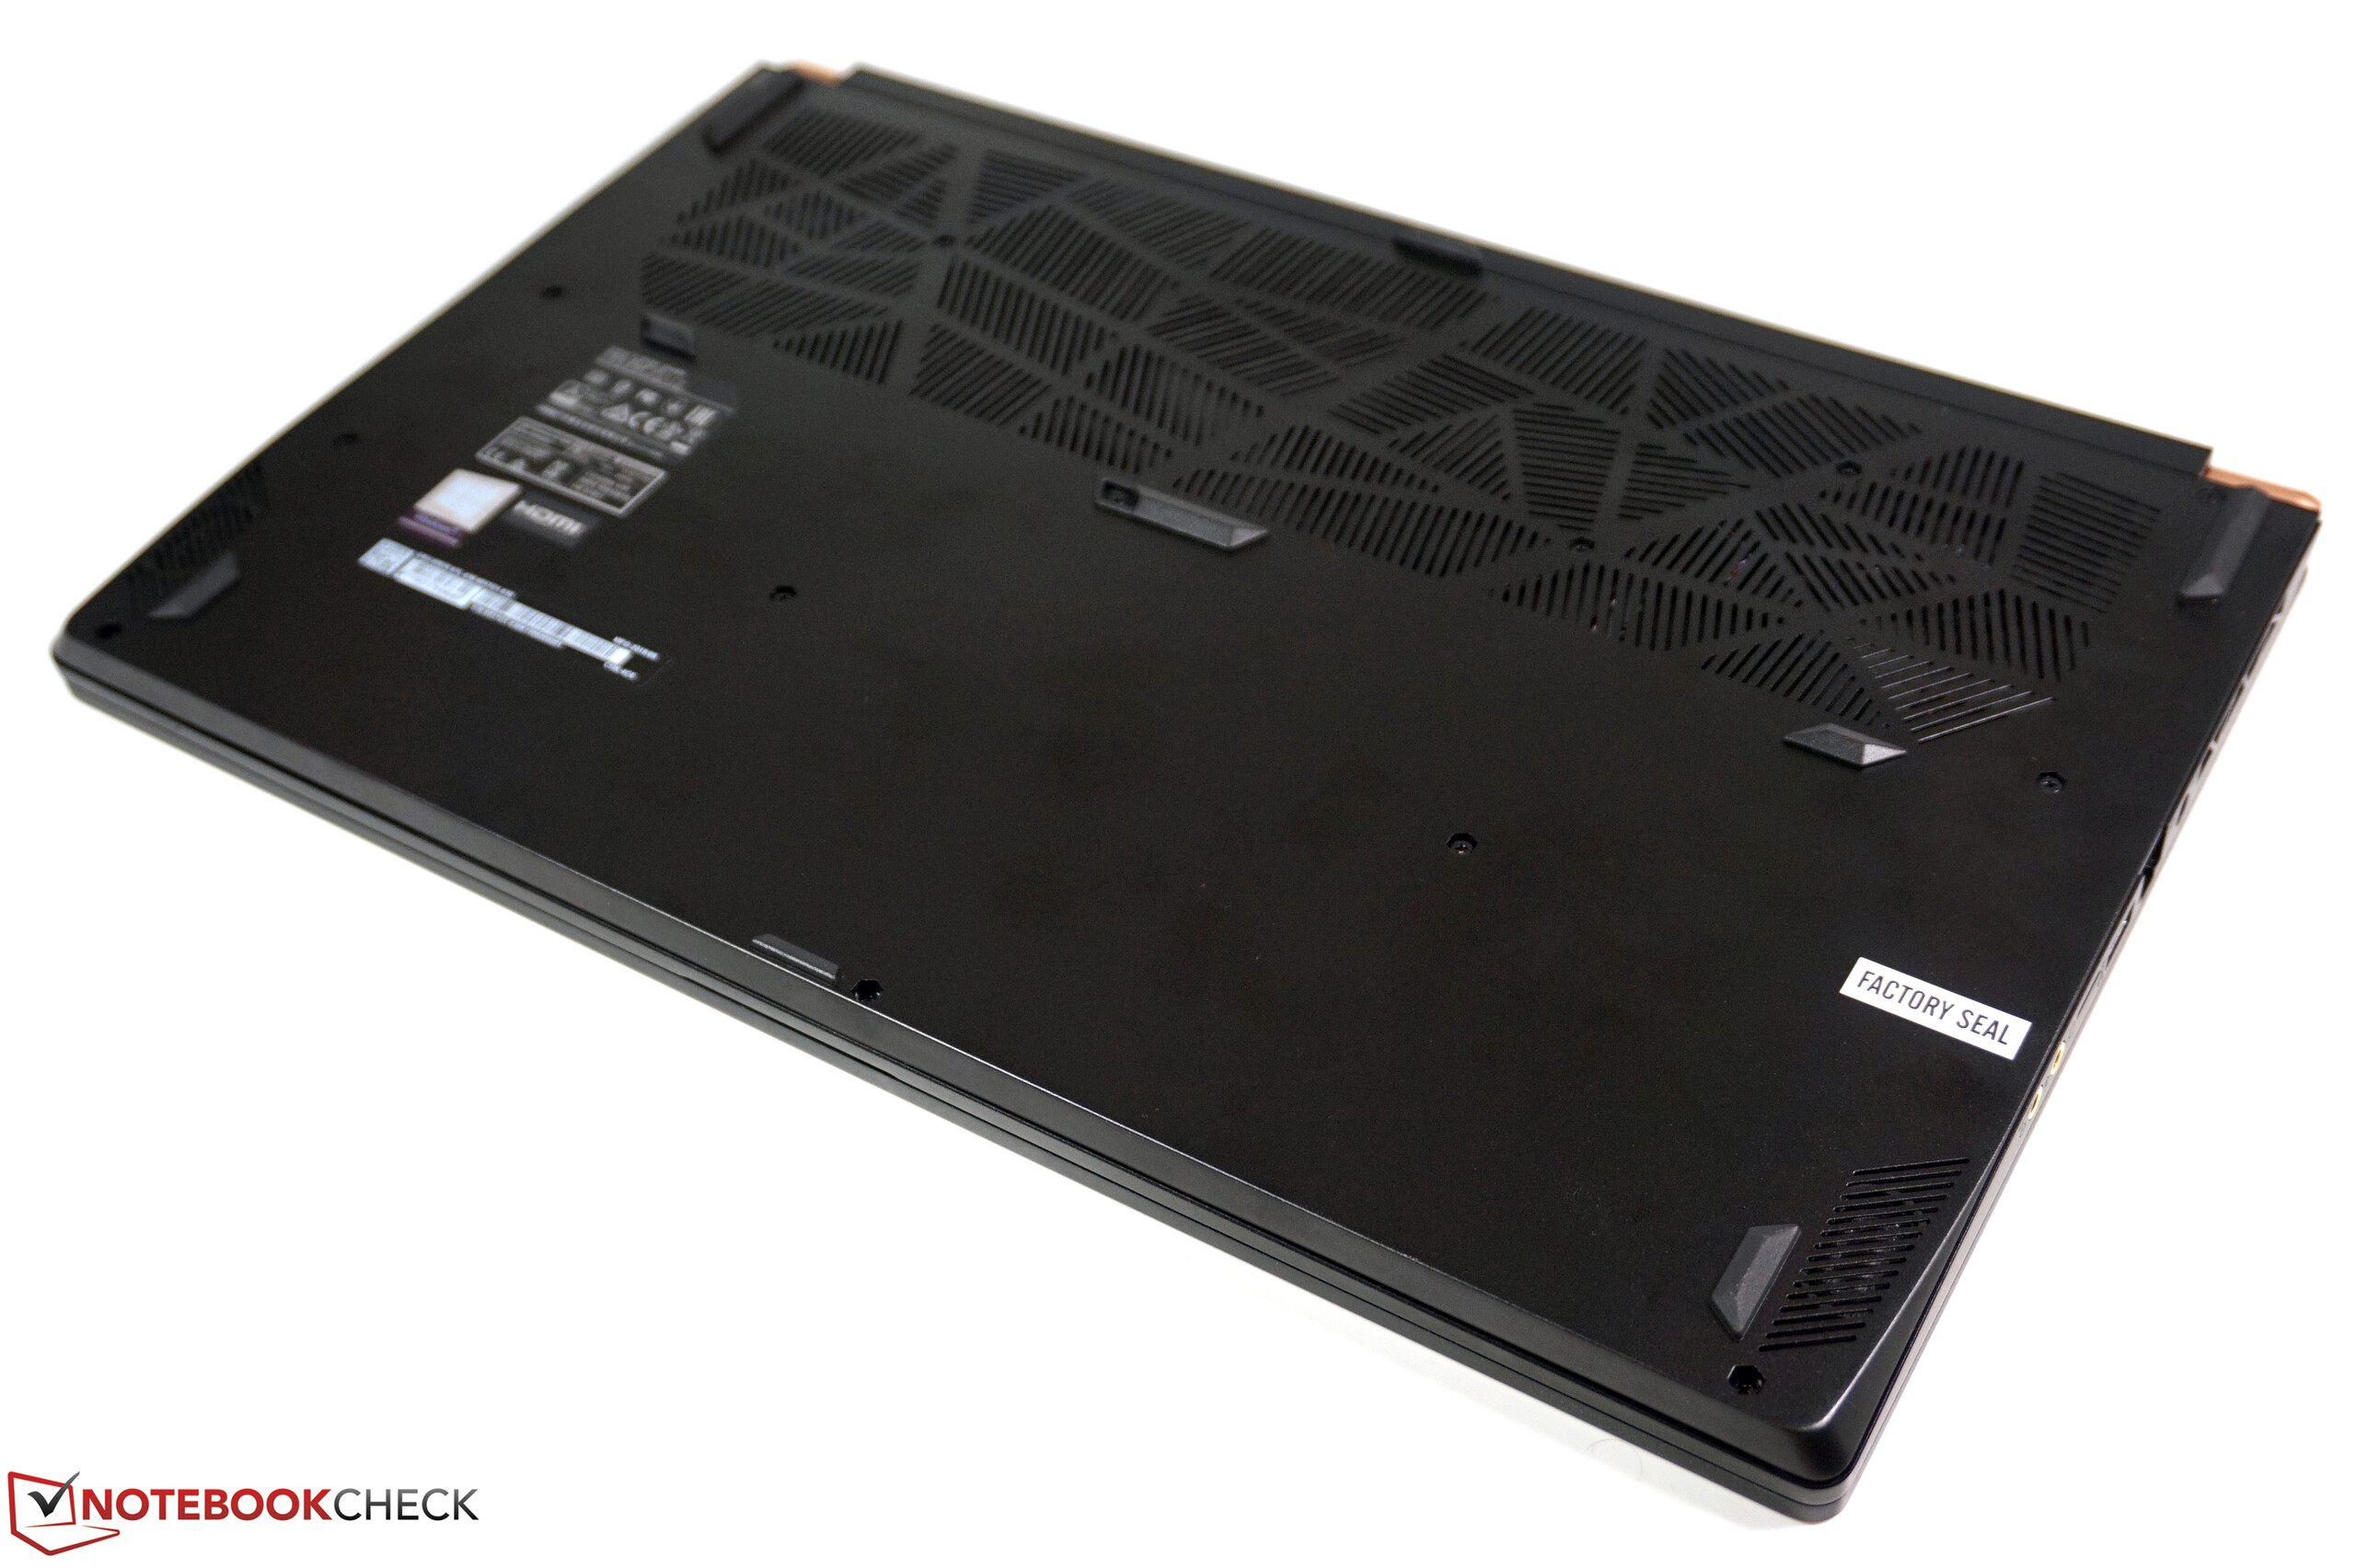
En sådan minskning i storlek och vikt har förstås fått göras på bekostnad av konstruktionen. Basen och locket är en aningen lättare att böja och datorn knarrar lite när man hanterar den.
Den matta 1080p-skärmen är inte direkt överväldigande, men den gör sitt jobb och konkurrenternas grundskärmar är inte bättre. 4K-skärmen som finns som tillval hade levererat bättre bildkvalitet.
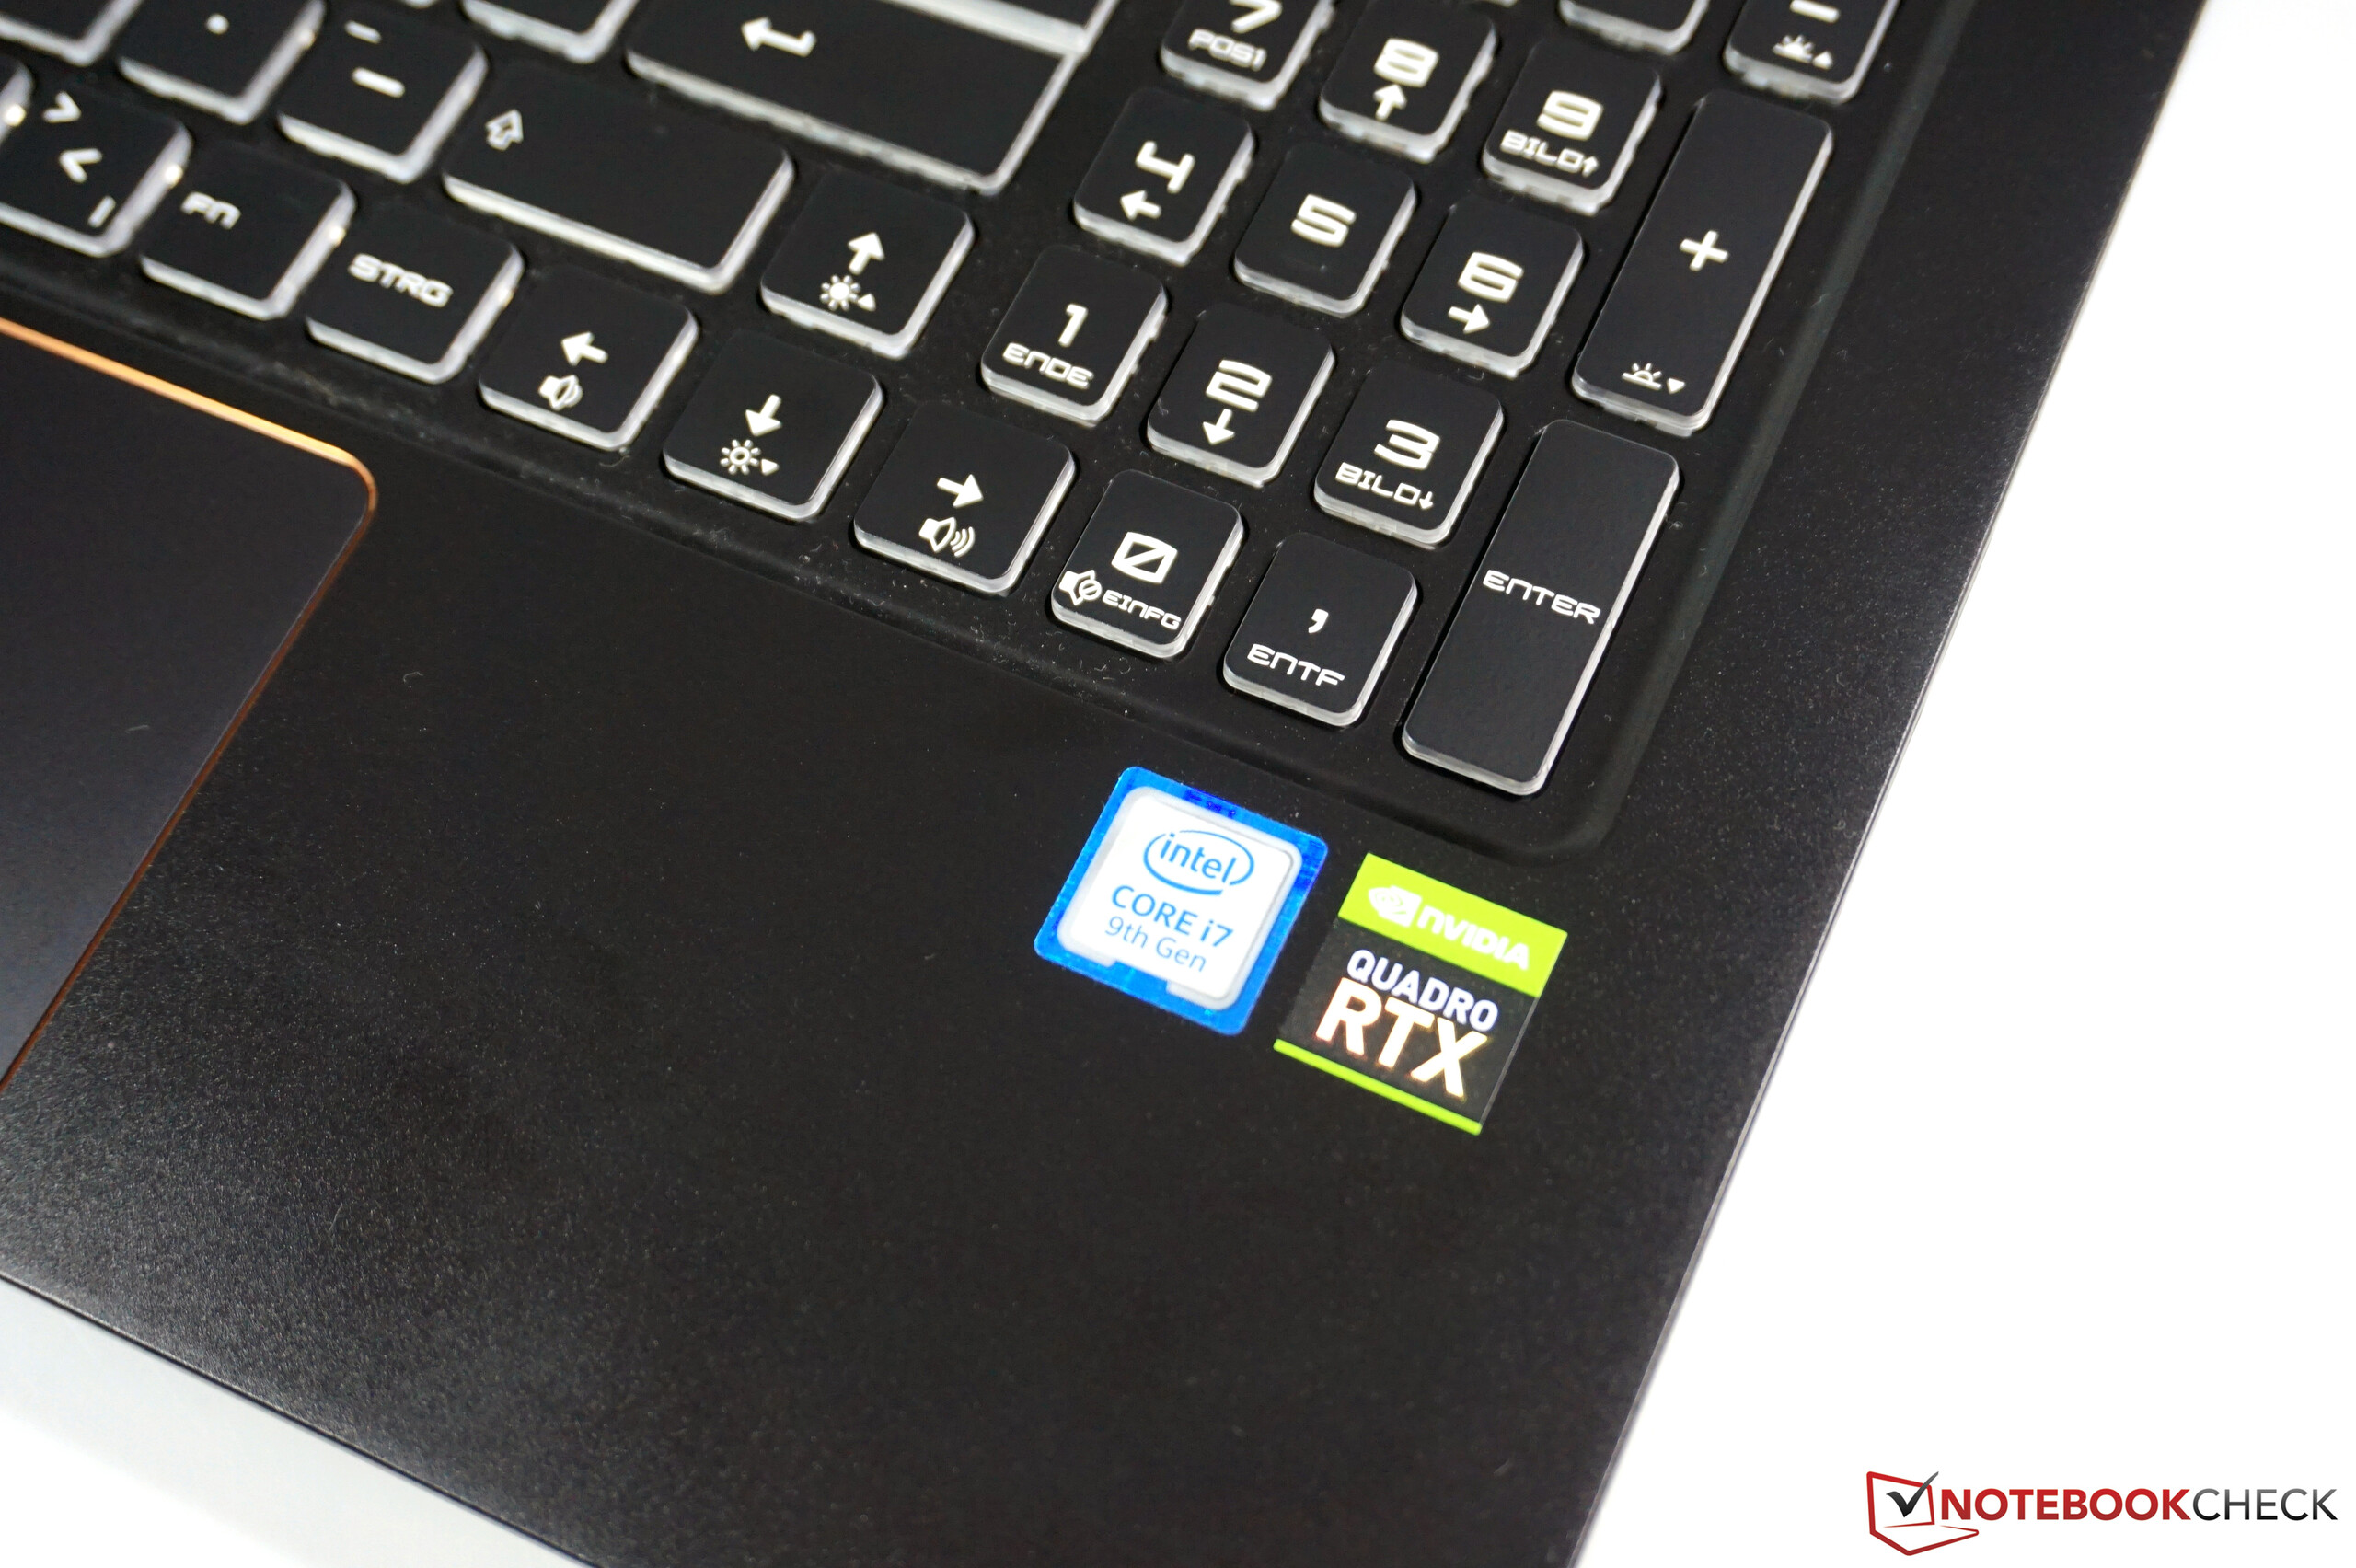
Då kommer vi tillslut till den viktigaste aspekten - hur WS75 presterar. På grund av de tunna och smala dimensionerna var vi en aning skeptiska till valet av en vanlig icke-Max-Q version av Quadro RTX 4000. Men i våra tester kunde GPU:n i princip alltid köras med sin maximala klockfrekvens, inklusive turbo, vilket resulterade i utmärkt grafikprestanda. Processorn hamnade heller inte efter och i en del extrema scenarier kunde den köras i endast 45 Watt. Temperatur och ljudnivå var också godtagbara - vilket definitivt inte är en självklarhet när det kommer till tunna och lätta enheter.
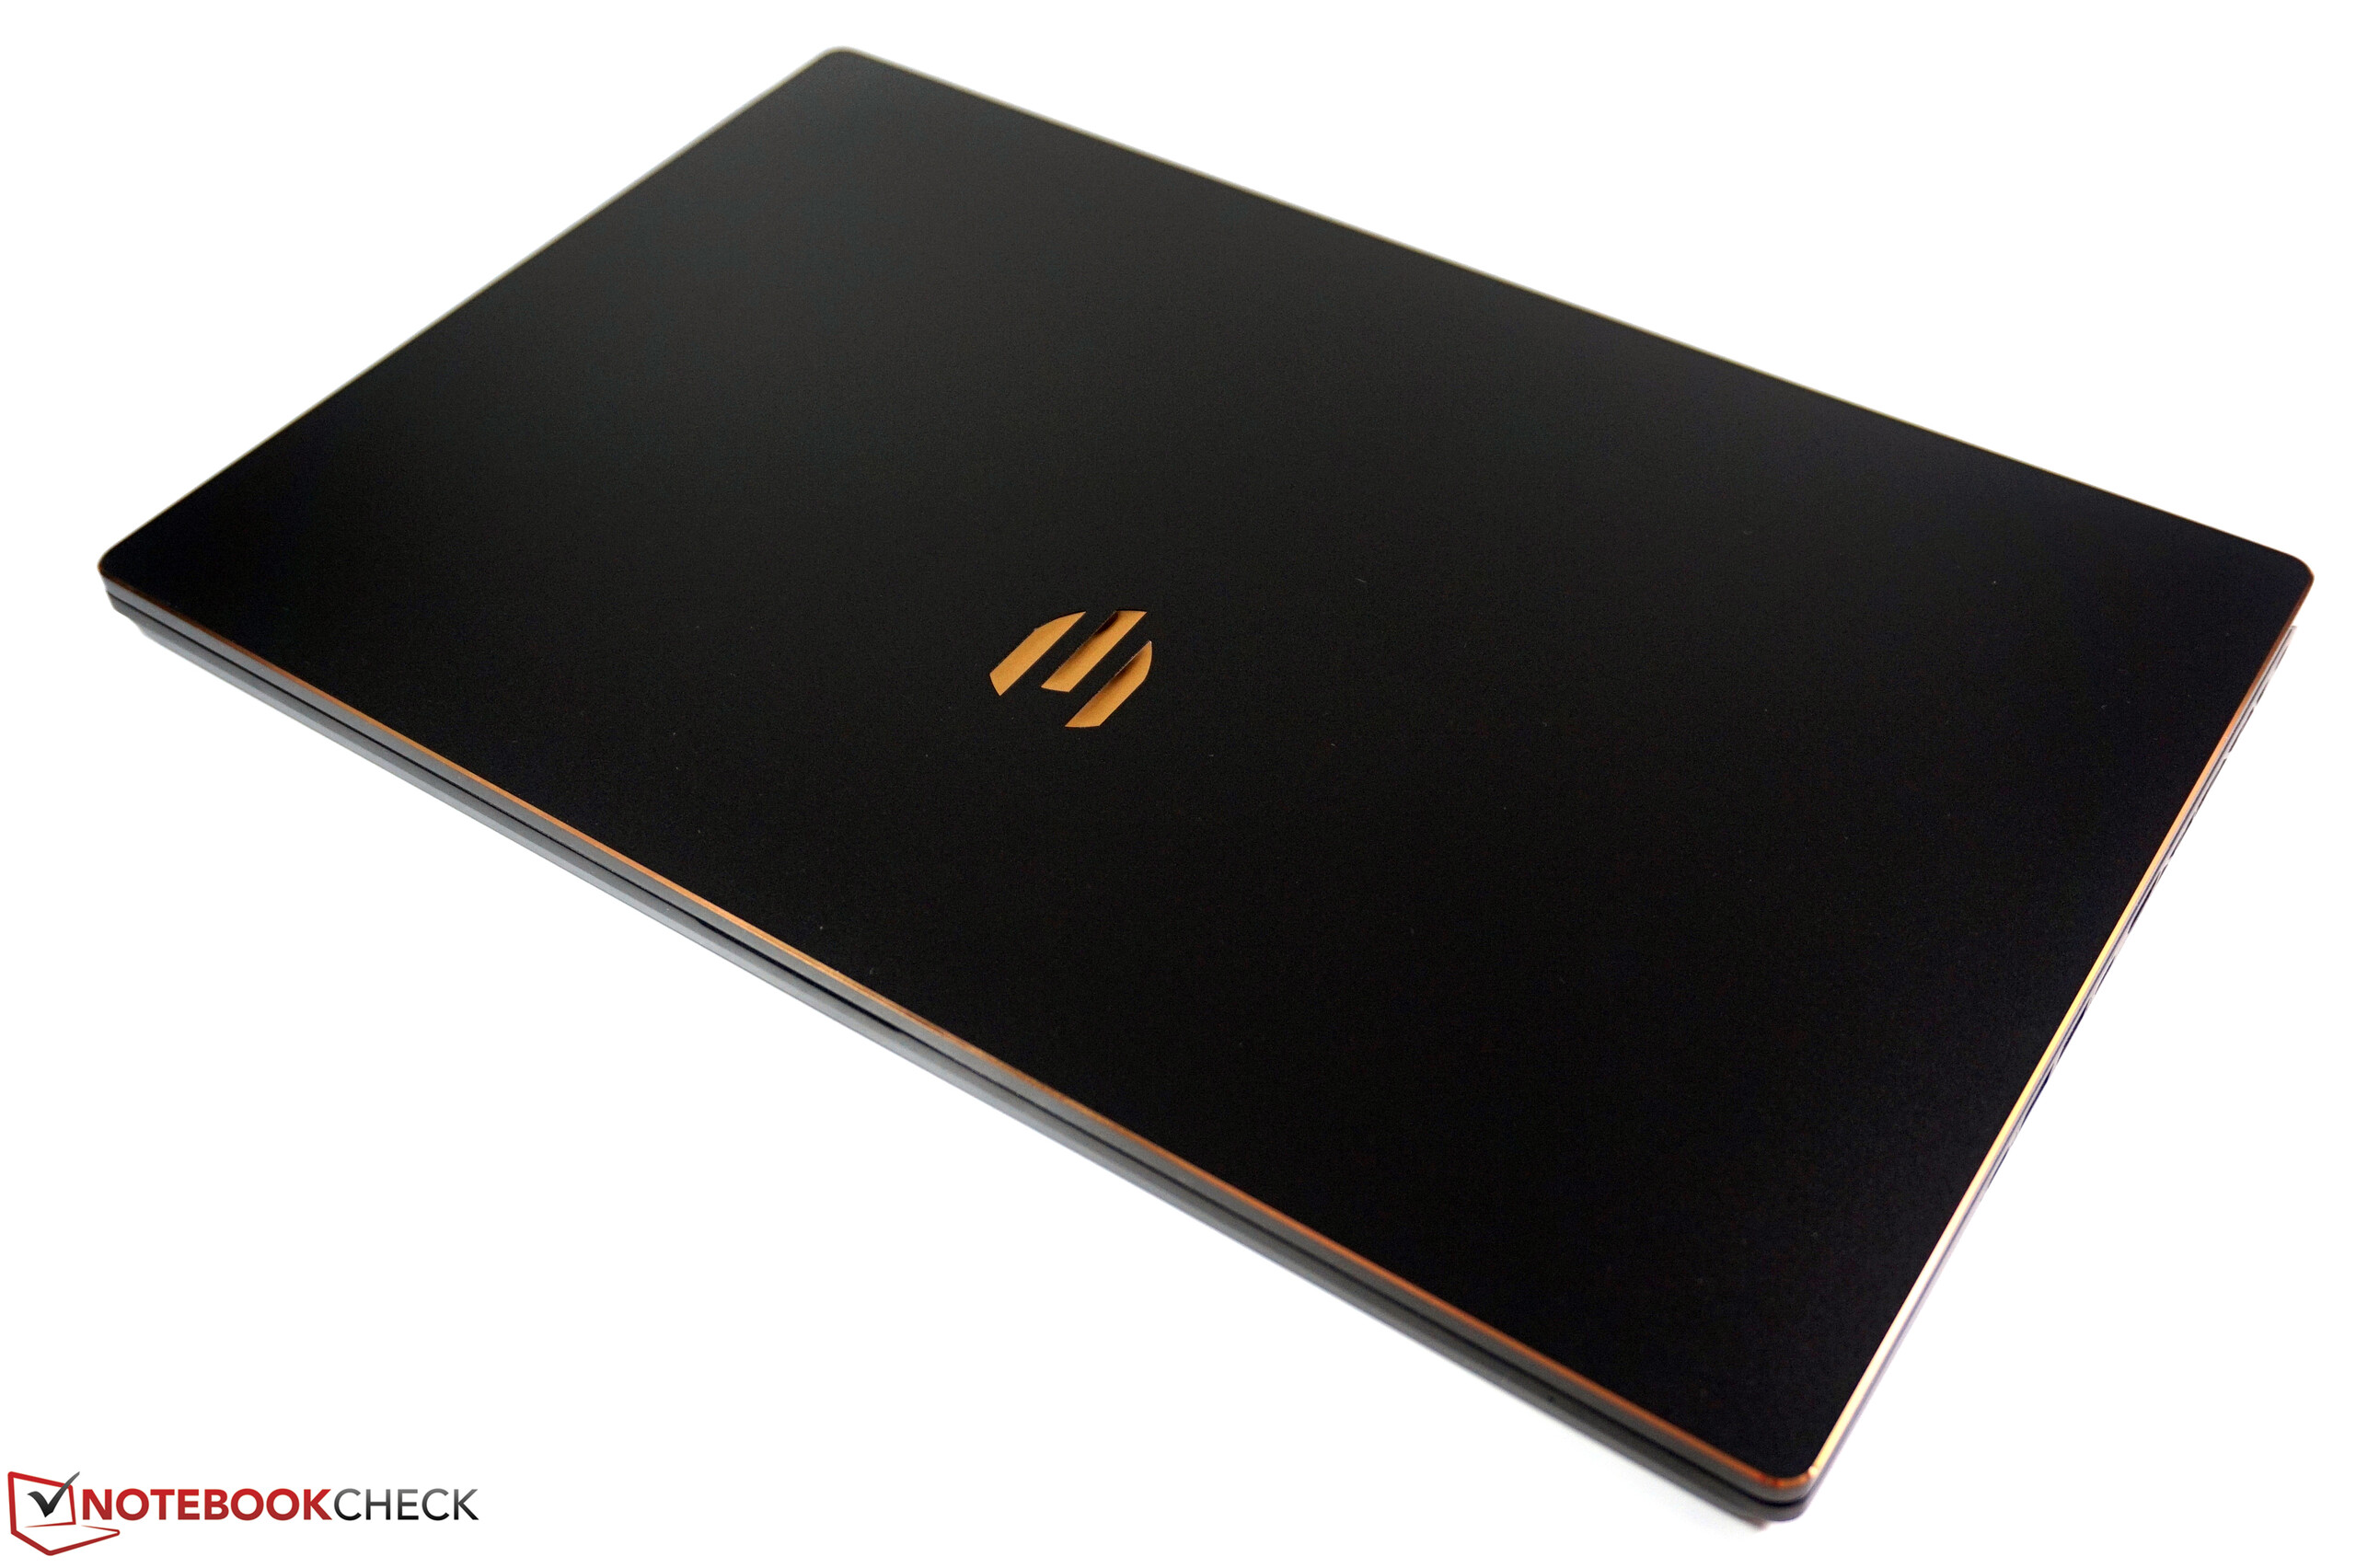
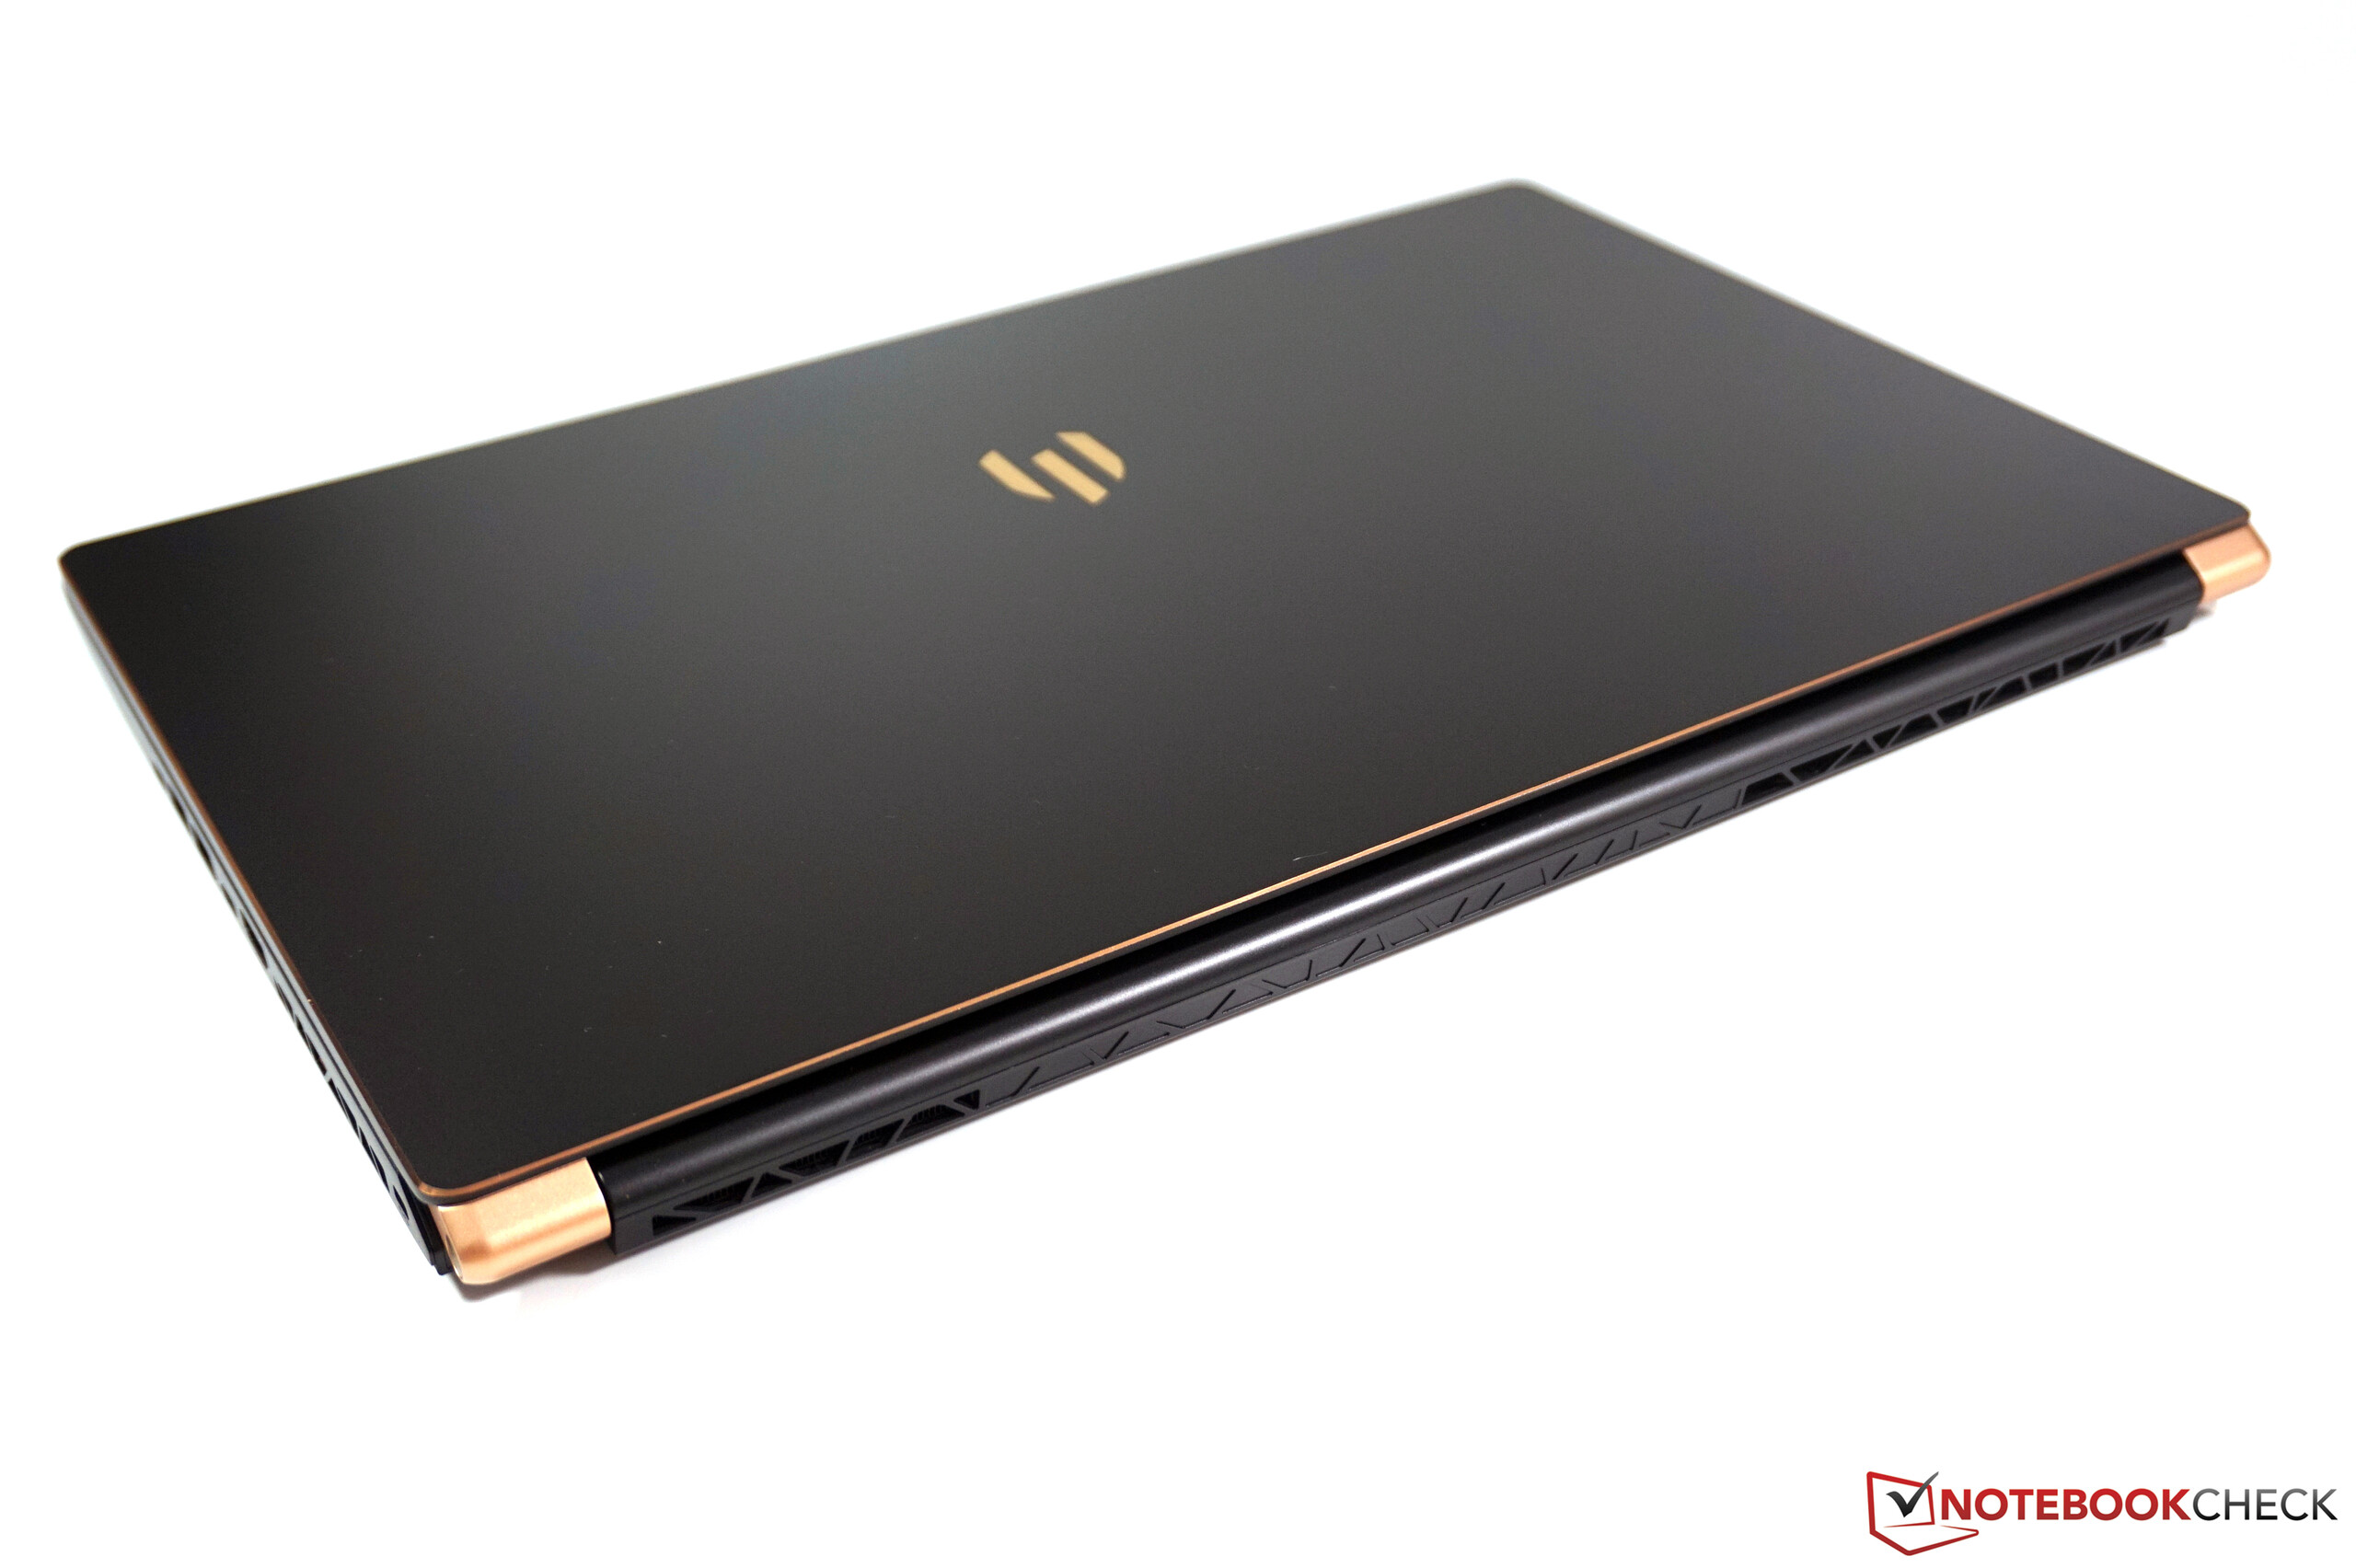
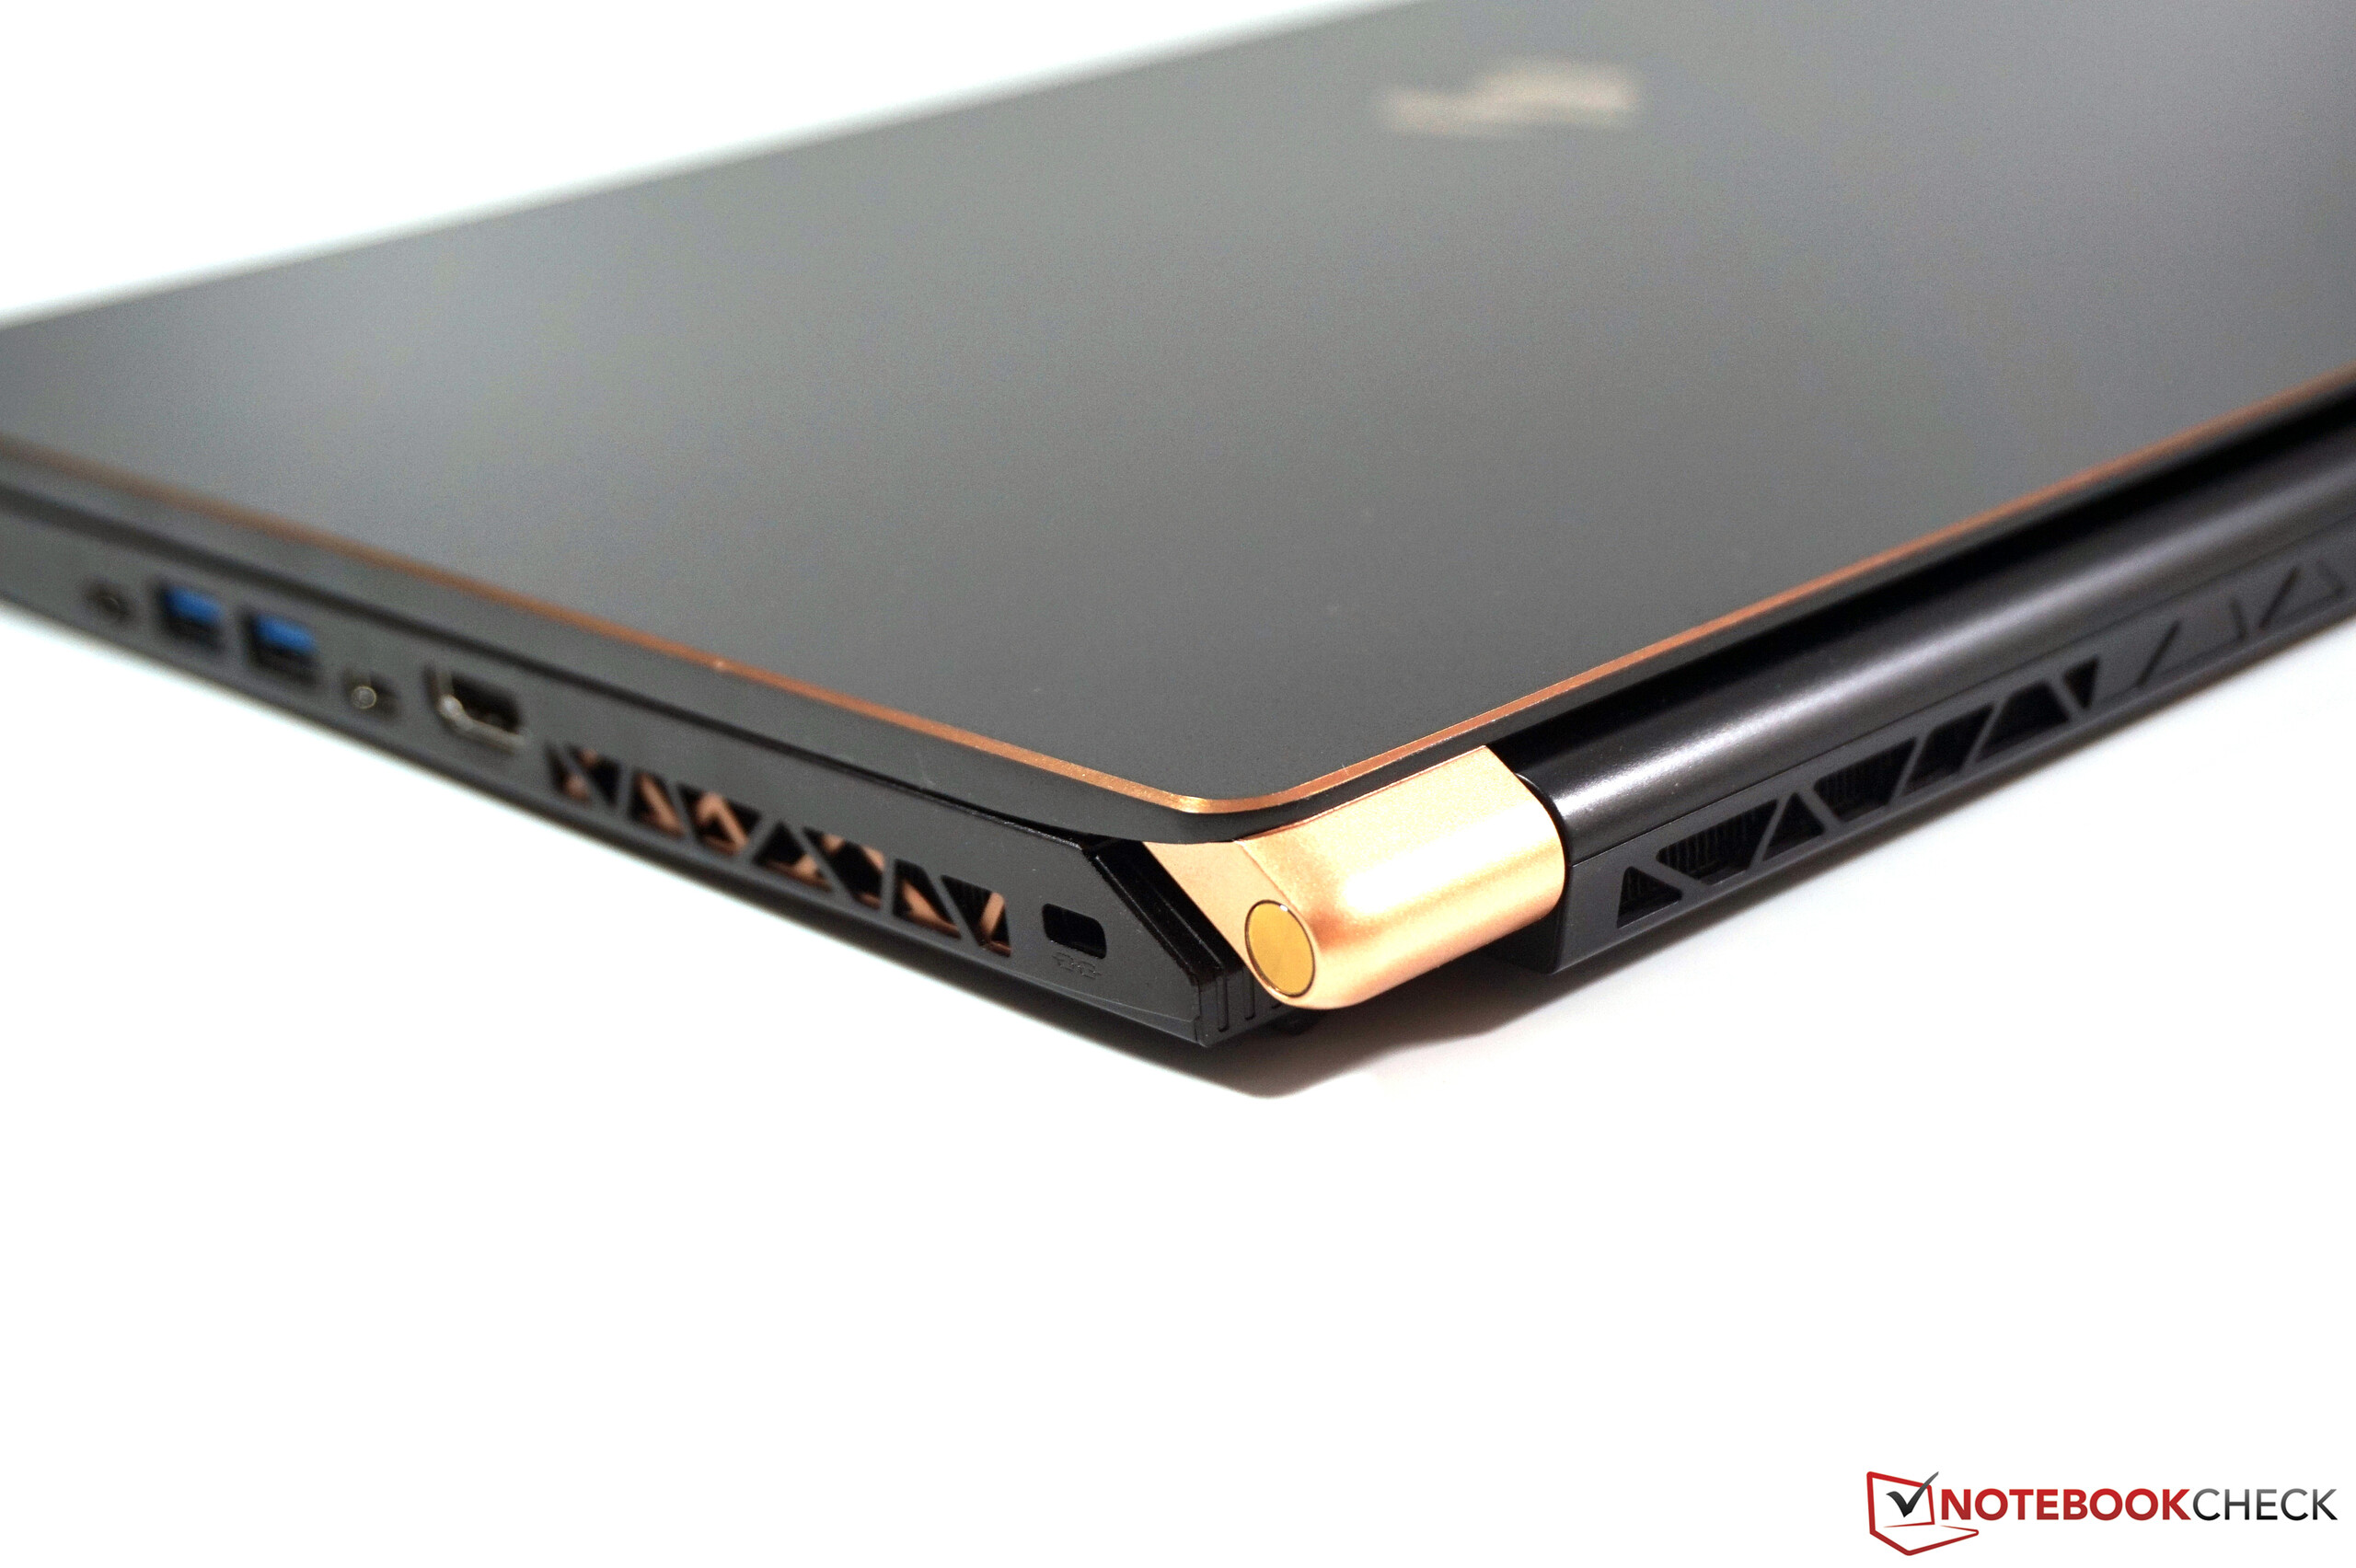
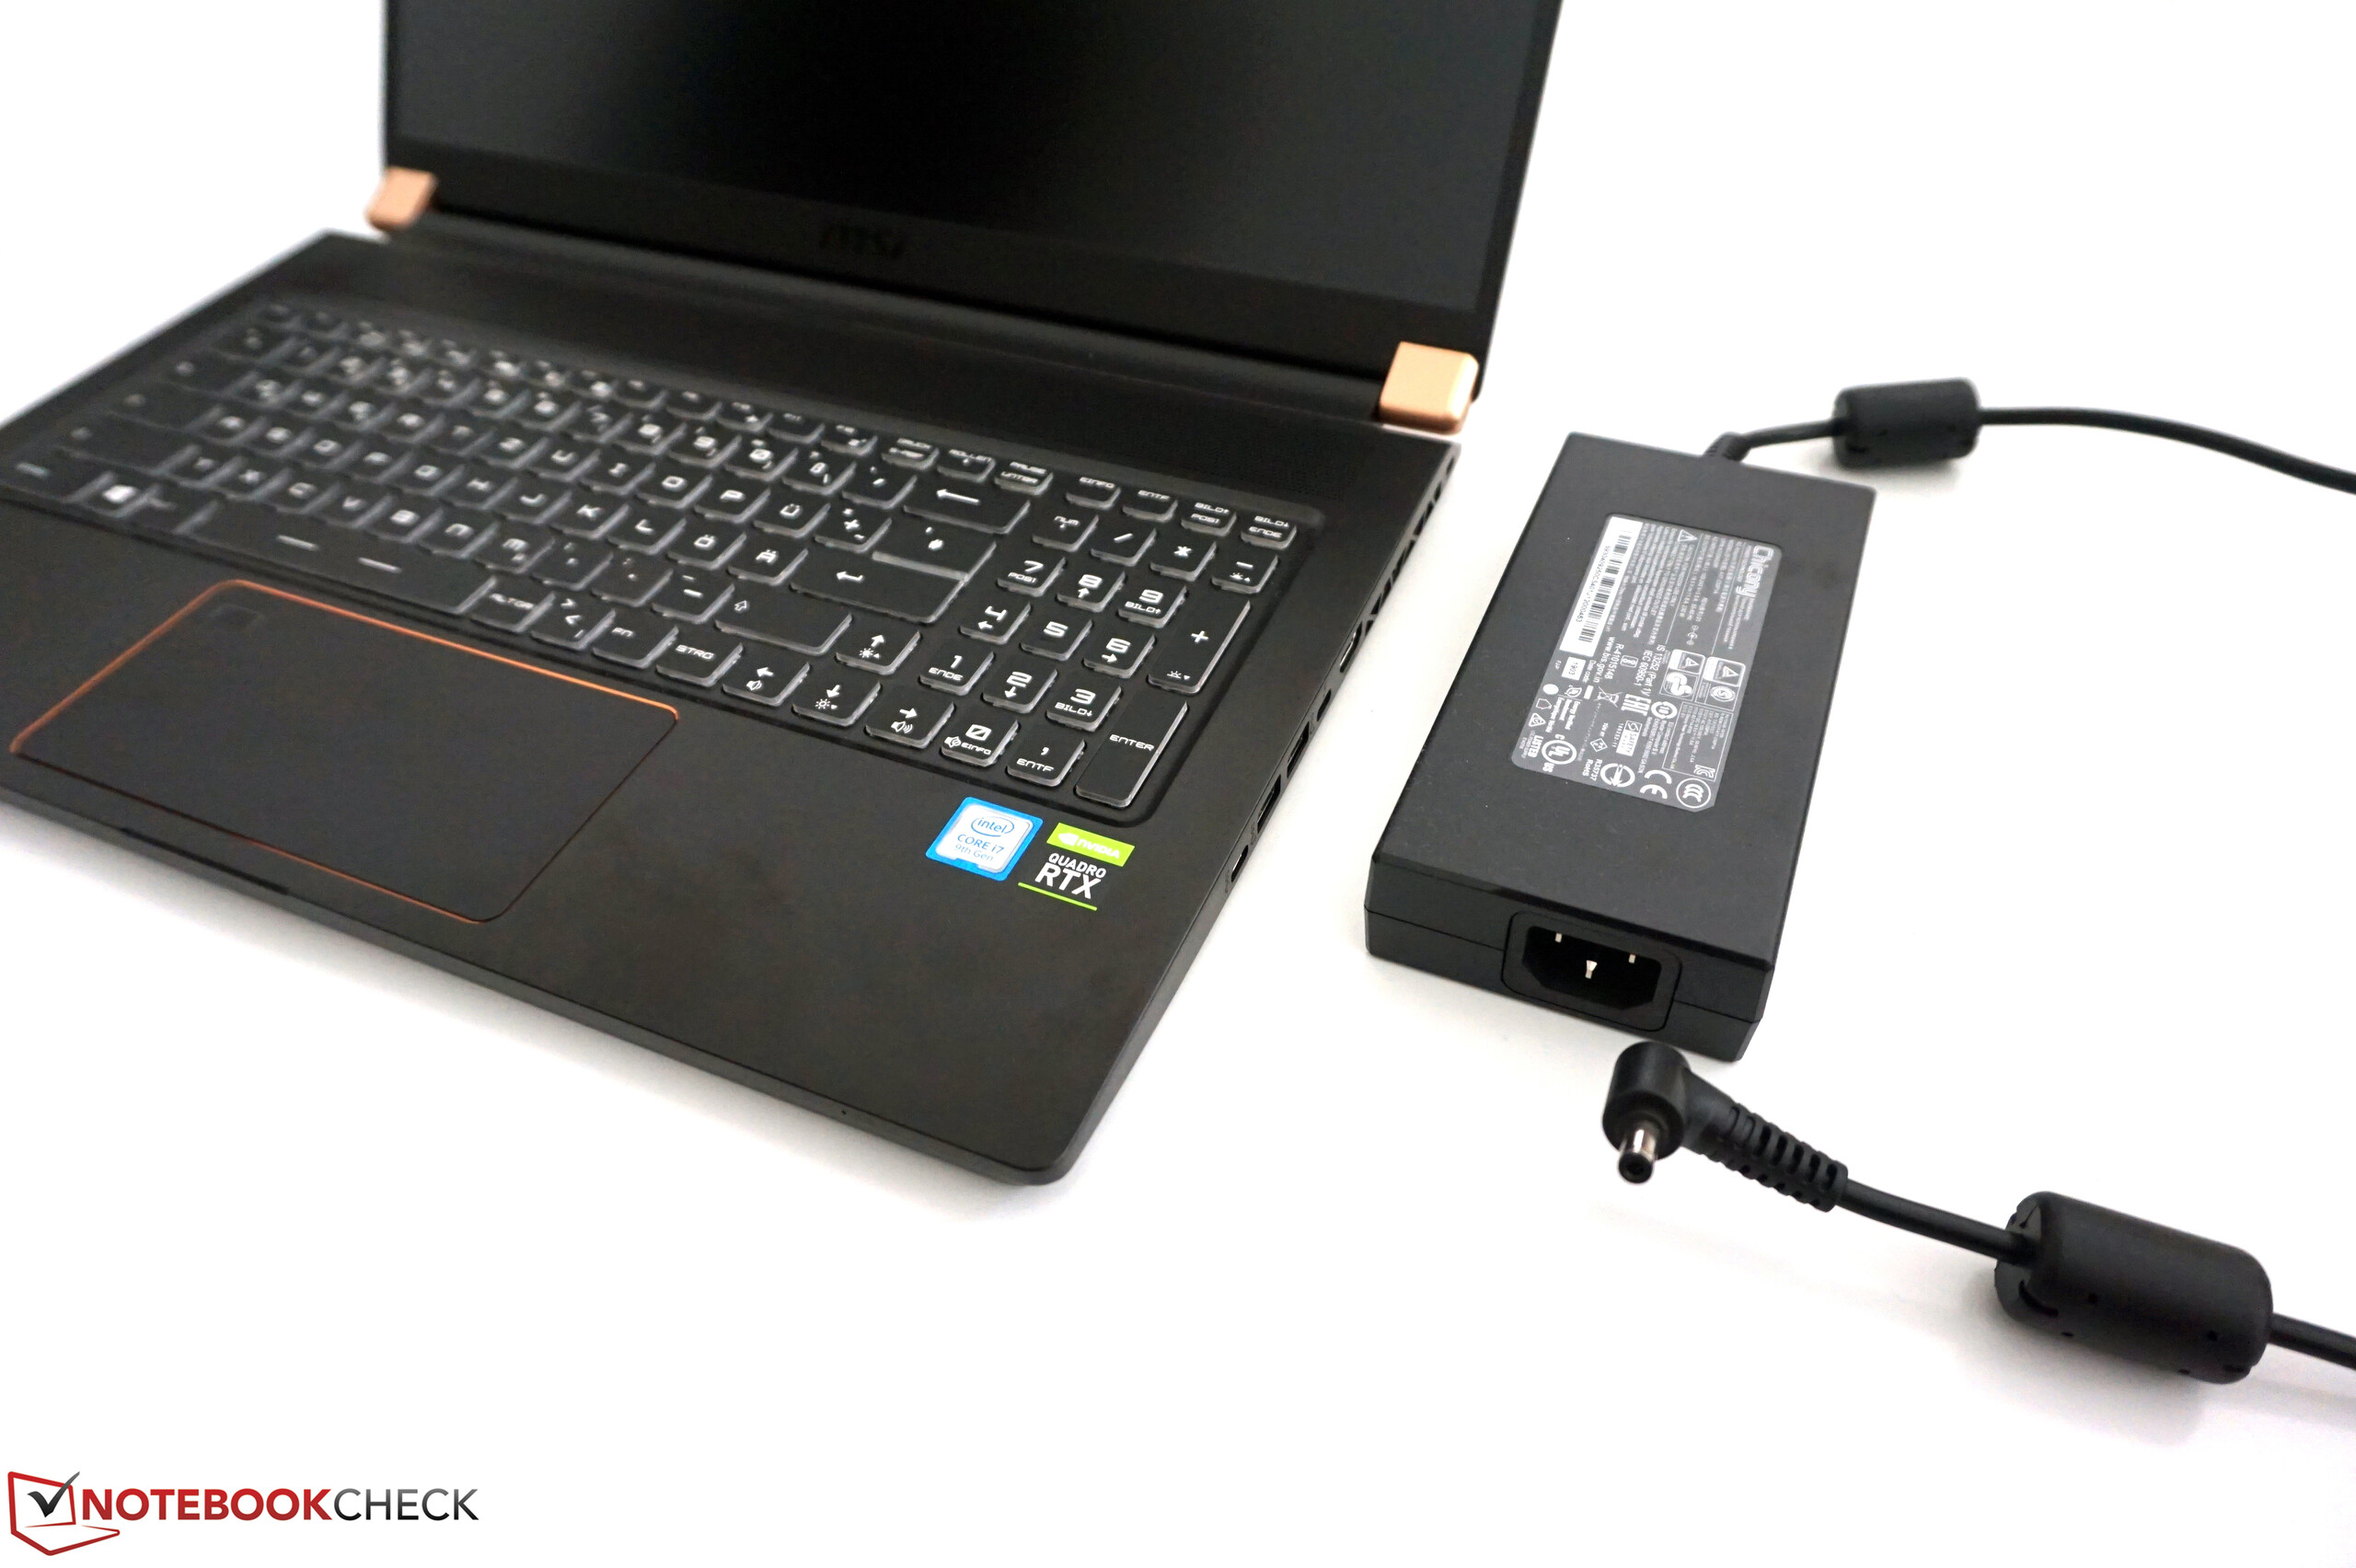
Kompakt, lätt och tjusig: MSI WS75 imponerar med en extremt tjusig design, anslutbarhet i överflöd och ett bra tangentbord. En del kompromisser har gjorts när det kommer till hållfastheten, men denna tunna arbetsstation kan utan problem ändå hålla jämna steg med de etablerade "tyngre" modellerna.
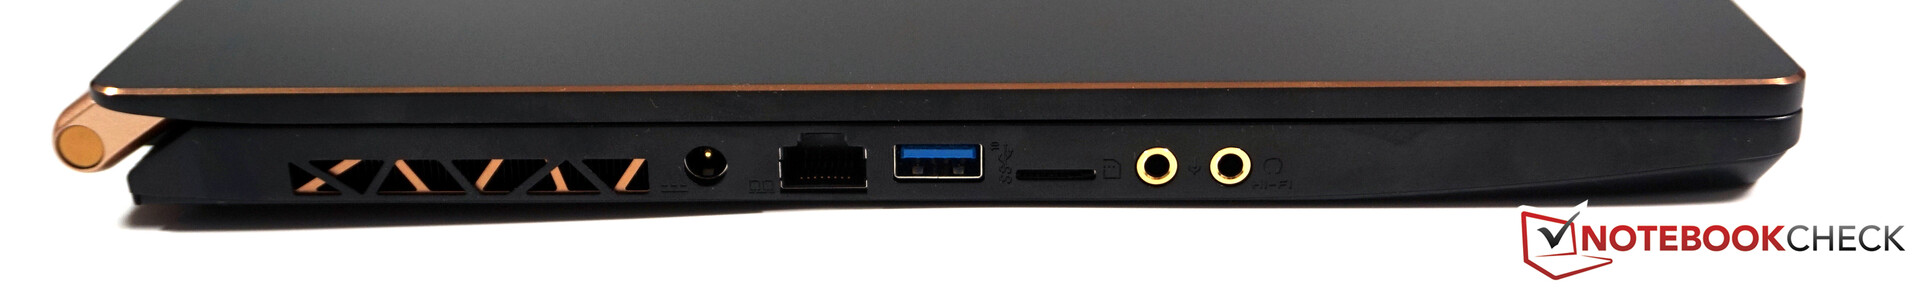
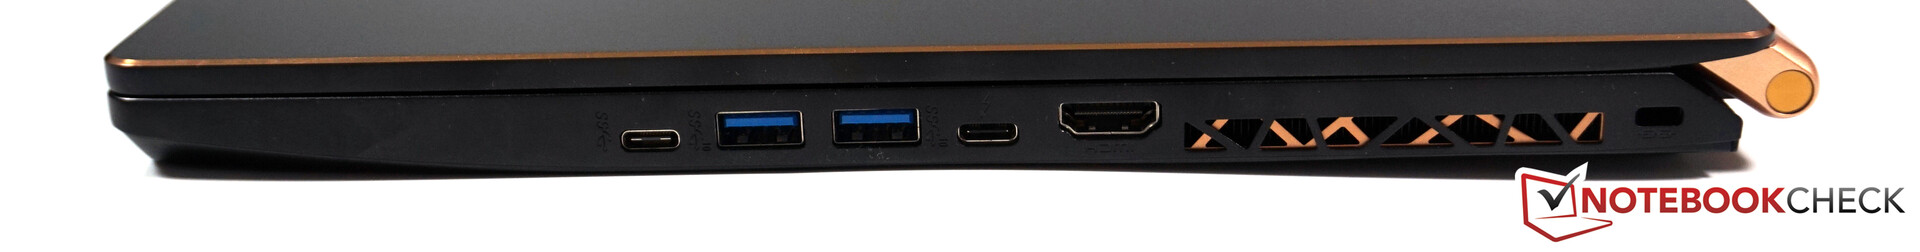
Det finns definitivt några andra svaga punkter, som dåliga högtalare, hög energiförbrukning vid belastning och portarnas placering. Men för den som letar efter en enhet att använda både hemma och på jobbet och som vill ha så mycket prestanda som möjligt i en kompakt formfaktor är WS75 definitivt ett intressant alternativ.
MSI WS75 9TL-636
- 01/08/2020 v7 (old)
Andreas Osthoff