Test: Lenovo ThinkPad P51 (Xeon, 4K) (sammanfattning)
| SD Card Reader | |
| average JPG Copy Test (av. of 3 runs) | |
| Dell Precision 5520 UHD | |
| Lenovo ThinkPad P51 20HH0016GE | |
| HP ZBook 15 G3 | |
| Dell Precision 7510 (4K IGZO) | |
| Lenovo ThinkPad P50 | |
| Fujitsu Celsius H760 | |
| Lenovo ThinkPad P51s 20HB000SGE | |
| maximum AS SSD Seq Read Test (1GB) | |
| Dell Precision 5520 UHD | |
| Lenovo ThinkPad P51 20HH0016GE | |
| HP ZBook 15 G3 | |
| Lenovo ThinkPad P50 | |
| Fujitsu Celsius H760 | |
| Lenovo ThinkPad P51s 20HB000SGE | |
| Networking | |
| iperf3 transmit AX12 | |
| Lenovo ThinkPad P51s 20HB000SGE | |
| Lenovo ThinkPad P51 20HH0016GE | |
| Dell Precision 5520 UHD | |
| iperf3 receive AX12 | |
| Lenovo ThinkPad P51s 20HB000SGE | |
| Lenovo ThinkPad P51 20HH0016GE | |
| Dell Precision 5520 UHD | |
| |||||||||||||||||||||||||
Distribution av ljusstyrkan: 89 %
Mitt på batteriet: 313 cd/m²
Kontrast: 881:1 (Svärta: 0.36 cd/m²)
ΔE ColorChecker Calman: 2.7 | ∀{0.5-29.43 Ø4.72}
ΔE Greyscale Calman: 3 | ∀{0.09-98 Ø4.97}
99.5% sRGB (Argyll 1.6.3 3D)
87.6% AdobeRGB 1998 (Argyll 1.6.3 3D)
99.3% AdobeRGB 1998 (Argyll 3D)
99.5% sRGB (Argyll 3D)
86.3% Display P3 (Argyll 3D)
Gamma: 2.27
CCT: 6077 K
| Lenovo ThinkPad P51 20HH0016GE LEN40BD, B156ZAN02.1, , 3840x2160, 15.6" | Lenovo ThinkPad P50 LQ156D1JW05, , 3840x2160, 15.6" | Lenovo ThinkPad P50 LP156WF6-SPK1, , 1920x1080, 15.6" | Lenovo ThinkPad P51s 20HB000SGE BOE NV156QUM-N44, , 3840x2160, 15.6" | HP ZBook 15 G3 Samsung SDC5344, , 1920x1080, 15.6" | Dell Precision 7510 (4K IGZO) Sharp LQ156D1, , 3840x2160, 15.6" | Dell Precision 5520 UHD SHP1476, , 3840x2160, 15.6" | Fujitsu Celsius H760 LGD046F LP156WF6-SPP1, , 1920x1080, 15.6" | |
|---|---|---|---|---|---|---|---|---|
| Display | -1% | -52% | -20% | -19% | 0% | -18% | -27% | |
| Display P3 Coverage (%) | 86.3 | 85.8 -1% | 39.13 -55% | 69.7 -19% | 66.8 -23% | 86.2 0% | 67.4 -22% | 63.9 -26% |
| sRGB Coverage (%) | 99.5 | 98.6 -1% | 58.5 -41% | 91.2 -8% | 95.5 -4% | 99.7 0% | 98.5 -1% | 82.4 -17% |
| AdobeRGB 1998 Coverage (%) | 99.3 | 98.2 -1% | 40.45 -59% | 66.8 -33% | 69 -31% | 99 0% | 68.9 -31% | 60.3 -39% |
| Response Times | 9% | -8% | 4% | -37% | -5% | -55% | 2% | |
| Response Time Grey 50% / Grey 80% * (ms) | 40.8 ? | 39.2 ? 4% | 46 ? -13% | 38.4 ? 6% | 54 ? -32% | 40.4 ? 1% | 59.2 ? -45% | 38 ? 7% |
| Response Time Black / White * (ms) | 25.2 ? | 22 ? 13% | 26 ? -3% | 24.8 ? 2% | 35.6 ? -41% | 27.6 ? -10% | 41.6 ? -65% | 26 ? -3% |
| PWM Frequency (Hz) | 217 | 980 ? | 198 ? | 198.4 ? | ||||
| Screen | -38% | -17% | -16% | -42% | -11% | -9% | -21% | |
| Brightness middle (cd/m²) | 317 | 250 -21% | 263 -17% | 317 0% | 306 -3% | 279.2 -12% | 372.4 17% | 341 8% |
| Brightness (cd/m²) | 309 | 250 -19% | 236 -24% | 290 -6% | 289 -6% | 271 -12% | 368 19% | 310 0% |
| Brightness Distribution (%) | 89 | 86 -3% | 78 -12% | 85 -4% | 85 -4% | 83 -7% | 90 1% | 82 -8% |
| Black Level * (cd/m²) | 0.36 | 0.31 14% | 0.34 6% | 0.32 11% | 0.34 6% | 0.266 26% | 0.48 -33% | 0.34 6% |
| Contrast (:1) | 881 | 806 -9% | 774 -12% | 991 12% | 900 2% | 1050 19% | 776 -12% | 1003 14% |
| Colorchecker dE 2000 * | 2.7 | 4.5 -67% | 2.35 13% | 3.6 -33% | 5.1 -89% | 4.14 -53% | 2.6 4% | 3.8 -41% |
| Colorchecker dE 2000 max. * | 4.1 | 9.3 -127% | 6.6 -61% | 9.9 -141% | 6.56 -60% | 5.6 -37% | 10.8 -163% | |
| Greyscale dE 2000 * | 3 | 7.2 -140% | 3.33 -11% | 4.2 -40% | 7.4 -147% | 3.26 -9% | 3.7 -23% | 2 33% |
| Gamma | 2.27 97% | 2.31 95% | 2.38 92% | 2.24 98% | 2.37 93% | 2.19 100% | 2.14 103% | 2.17 101% |
| CCT | 6077 107% | 6399 102% | 6917 94% | 6740 96% | 7263 89% | 6375 102% | 7096 92% | 6581 99% |
| Color Space (Percent of AdobeRGB 1998) (%) | 87.6 | 85 -3% | 37 -58% | 59.5 -32% | 63 -28% | 85.68 -2% | 63 -28% | 54 -38% |
| Color Space (Percent of sRGB) (%) | 99.5 | 98.6 -1% | 58 -42% | 91.1 -8% | 95 -5% | 99.72 0% | 99 -1% | 82.2 -17% |
| Totalt genomsnitt (program/inställningar) | -10% /
-24% | -26% /
-23% | -11% /
-14% | -33% /
-36% | -5% /
-8% | -27% /
-17% | -15% /
-19% |
* ... mindre är bättre
Visa svarstider
| ↔ Svarstid svart till vitt | ||
|---|---|---|
| 25.2 ms ... stiga ↗ och falla ↘ kombinerat | ↗ 14 ms stiga | 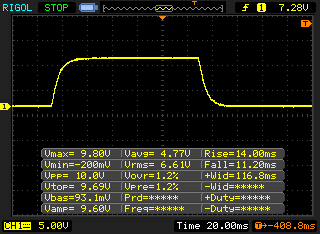 |
| ↘ 11.2 ms hösten | ||
| Skärmen visar relativt långsamma svarsfrekvenser i våra tester och kan vara för långsam för spelare. I jämförelse sträcker sig alla testade enheter från 0.1 (minst) till 240 (maximalt) ms. » 60 % av alla enheter är bättre. Detta innebär att den uppmätta svarstiden är sämre än genomsnittet av alla testade enheter (19.8 ms). | ||
| ↔ Svarstid 50 % grått till 80 % grått | ||
| 40.8 ms ... stiga ↗ och falla ↘ kombinerat | ↗ 20.8 ms stiga | 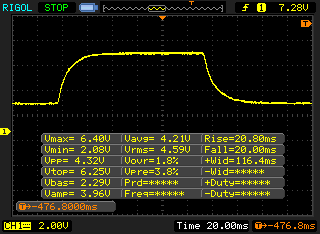 |
| ↘ 20 ms hösten | ||
| Skärmen visar långsamma svarsfrekvenser i våra tester och kommer att vara otillfredsställande för spelare. I jämförelse sträcker sig alla testade enheter från 0.165 (minst) till 636 (maximalt) ms. » 64 % av alla enheter är bättre. Detta innebär att den uppmätta svarstiden är sämre än genomsnittet av alla testade enheter (31 ms). | ||
Skärmflimmer / PWM (Puls-Width Modulation)
| Skärmflimmer / PWM upptäcktes inte | 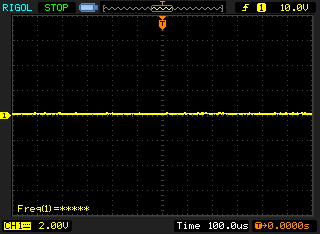 | ||
Som jämförelse: 52 % av alla testade enheter använder inte PWM för att dämpa skärmen. Om PWM upptäcktes mättes ett medelvärde av 7778 (minst: 5 - maximum: 343500) Hz. | |||
| PCMark 7 - Score | |
| Lenovo ThinkPad P51 20HH0016GE | |
| Lenovo ThinkPad P51s 20HB000SGE | |
| HP ZBook 15 G3 | |
| Lenovo ThinkPad P50 | |
| PCMark 7 Score | 6440 poäng | |
| PCMark 8 Home Score Accelerated v2 | 3641 poäng | |
| PCMark 8 Creative Score Accelerated v2 | 6301 poäng | |
| PCMark 8 Work Score Accelerated v2 | 4256 poäng | |
Hjälp | ||
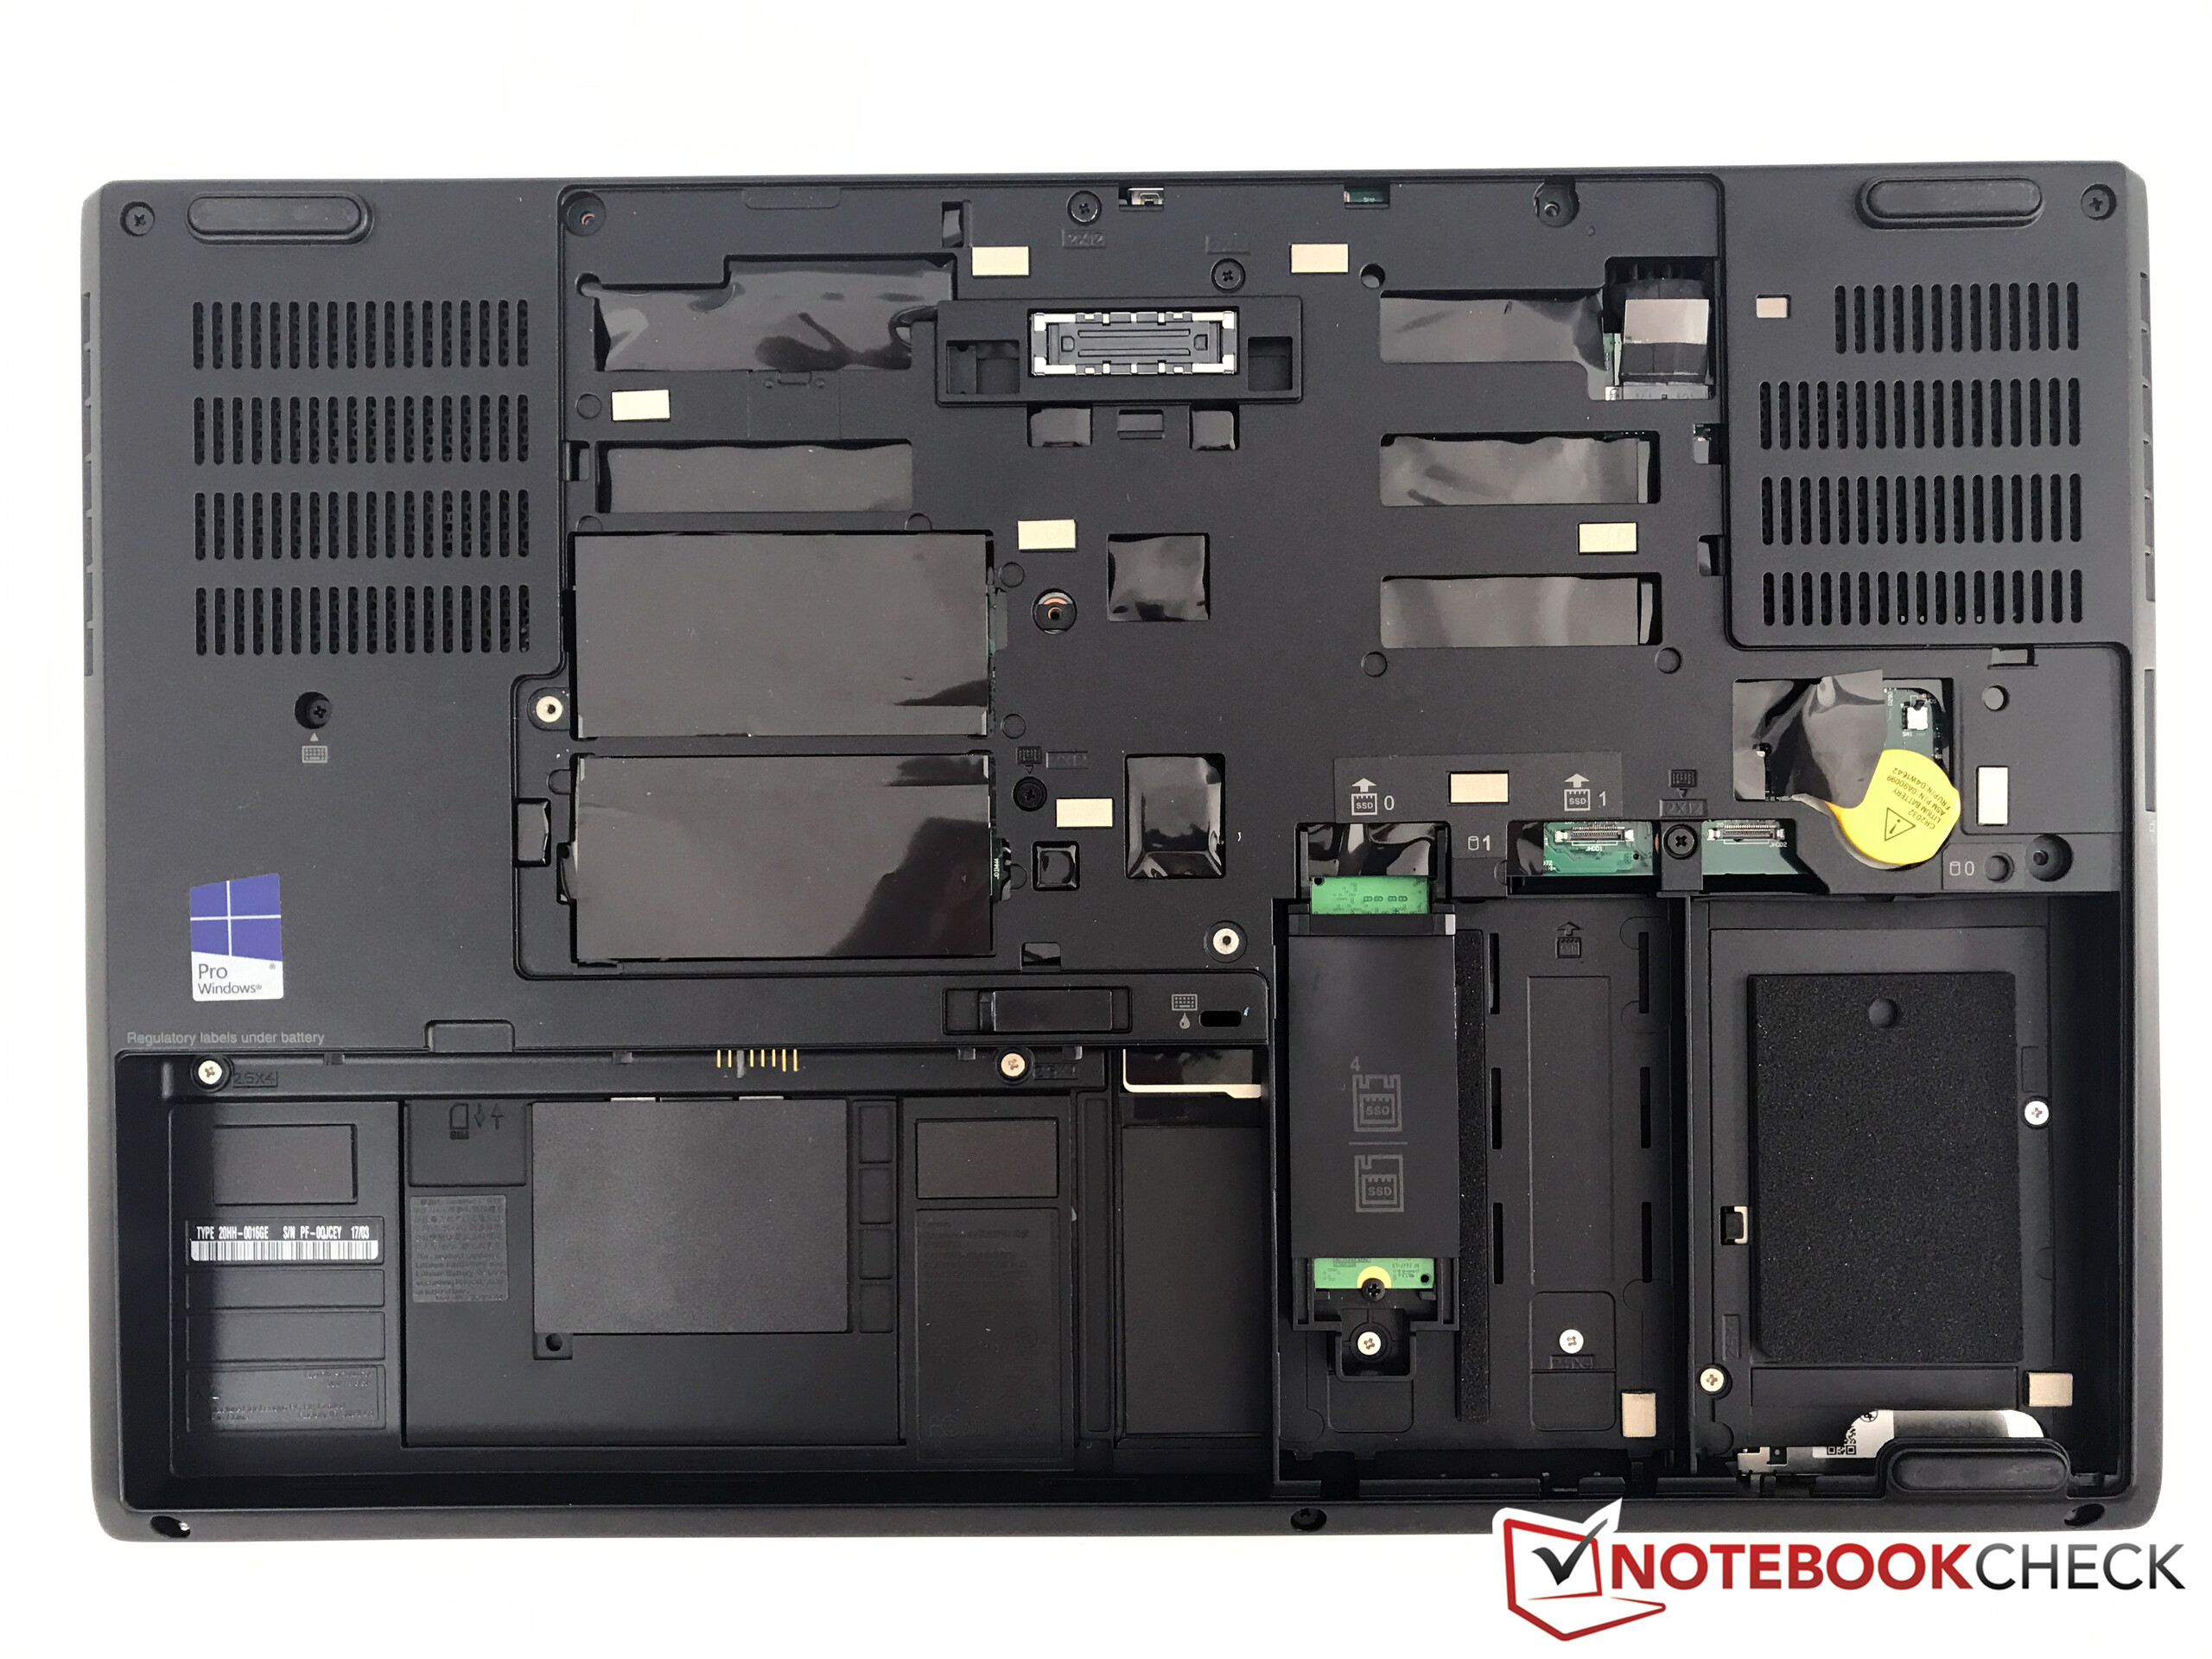
| Lenovo ThinkPad P51 20HH0016GE Samsung PM961 NVMe MZVLW512HMJP | Lenovo ThinkPad P51s 20HB000SGE Samsung SSD PM961 1TB M.2 PCIe 3.0 x4 NVMe (MZVLW1T0) | Lenovo ThinkPad P50 Samsung SM951 MZVPV256HDGL m.2 PCI-e | HP ZBook 15 G3 Samsung SM951 MZVPV512HDGL m.2 PCI-e | Dell Precision 7510 (4K IGZO) Samsung SSD SM951a 512GB M.2 PCIe 3.0 x4 NVMe (MZVKV512) | Dell Precision 5520 UHD Samsung SM961 MZVKW512HMJP m.2 PCI-e | |
|---|---|---|---|---|---|---|
| CrystalDiskMark 3.0 | -15% | 11% | 4% | -1% | -1% | |
| Read Seq (MB/s) | 1705 | 1189 -30% | 1771 4% | 1502 -12% | 1648 -3% | 2253 32% |
| Write Seq (MB/s) | 1541 | 1138 -26% | 1304 -15% | 1538 0% | 1575 2% | 1662 8% |
| Read 512 (MB/s) | 1038 | 782 -25% | 1364 31% | 1164 12% | 1155 11% | 459.1 -56% |
| Write 512 (MB/s) | 1157 | 959 -17% | 1291 12% | 1432 24% | 1561 35% | 1611 39% |
| Read 4k (MB/s) | 61.3 | 54.8 -11% | 60.2 -2% | 59.1 -4% | 53 -14% | 56.1 -8% |
| Write 4k (MB/s) | 176 | 161.4 -8% | 256.7 46% | 207.3 18% | 158.9 -10% | 169.4 -4% |
| Read 4k QD32 (MB/s) | 664 | 642 -3% | 953 44% | 798 20% | 623 -6% | 633 -5% |
| Write 4k QD32 (MB/s) | 560 | 549 -2% | 389.6 -30% | 393.8 -30% | 423 -24% | 506 -10% |

| 3DMark 11 - 1280x720 Performance GPU | |
| MSI GE72VR-6RF16H21 | |
| Lenovo ThinkPad P71-20HK0004GE | |
| Nexoc G739 | |
| MSI GE72 965M Ti | |
| HP ZBook 17 G3 TZV66eA | |
| MSI GL62M 7RD-077 | |
| HP Omen 15-ax007ng | |
| Lenovo ThinkPad P51 20HH0016GE | |
| MSI WE72 7RJ | |
| Lenovo ThinkPad P50 | |
| Lenovo ThinkPad P50 | |
| Dell Precision 5520 UHD | |
| Dell Precision 7510 (4K IGZO) | |
| HP ZBook 15 G3 | |
| Lenovo ThinkPad P51s 20HB000SGE | |
| 3DMark | |
| 1280x720 Cloud Gate Standard Graphics | |
| MSI GE72VR-6RF16H21 | |
| Lenovo ThinkPad P71-20HK0004GE | |
| Nexoc G739 | |
| HP ZBook 17 G3 TZV66eA | |
| MSI GL62M 7RD-077 | |
| MSI GE72 965M Ti | |
| MSI WE72 7RJ | |
| Lenovo ThinkPad P51 20HH0016GE | |
| HP Omen 15-ax007ng | |
| Lenovo ThinkPad P50 | |
| HP ZBook 15 G3 | |
| Dell Precision 5520 UHD | |
| Dell Precision 7510 (4K IGZO) | |
| Lenovo ThinkPad P50 | |
| Lenovo ThinkPad P51s 20HB000SGE | |
| 1920x1080 Fire Strike Graphics | |
| MSI GE72VR-6RF16H21 | |
| Lenovo ThinkPad P71-20HK0004GE | |
| Nexoc G739 | |
| HP ZBook 17 G3 TZV66eA | |
| MSI GL62M 7RD-077 | |
| MSI GE72 965M Ti | |
| HP Omen 15-ax007ng | |
| MSI WE72 7RJ | |
| Lenovo ThinkPad P51 20HH0016GE | |
| Dell Precision 7510 (4K IGZO) | |
| Dell Precision 5520 UHD | |
| Lenovo ThinkPad P50 | |
| HP ZBook 15 G3 | |
| Lenovo ThinkPad P50 | |
| Lenovo ThinkPad P51s 20HB000SGE | |
| Unigine Heaven 4.0 | |
| Extreme Preset OpenGL | |
| Lenovo ThinkPad P71-20HK0004GE | |
| Nexoc G739 | |
| Lenovo ThinkPad P51 20HH0016GE | |
| MSI WE72 7RJ | |
| Lenovo ThinkPad P51s 20HB000SGE | |
| Extreme Preset DX11 | |
| MSI GE72VR-6RF16H21 | |
| Lenovo ThinkPad P71-20HK0004GE | |
| Nexoc G739 | |
| MSI GL62M 7RD-077 | |
| MSI WE72 7RJ | |
| Lenovo ThinkPad P51 20HH0016GE | |
| MSI GE72 965M Ti | |
| HP Omen 15-ax007ng | |
| Lenovo ThinkPad P51s 20HB000SGE | |
| Unigine Valley 1.0 | |
| 1920x1080 Extreme HD DirectX AA:x8 | |
| MSI GE72VR-6RF16H21 | |
| Lenovo ThinkPad P71-20HK0004GE | |
| HP ZBook 17 G3 TZV66eA | |
| MSI WE72 7RJ | |
| MSI GE72 965M Ti | |
| Lenovo ThinkPad P51 20HH0016GE | |
| Lenovo ThinkPad P50 | |
| Lenovo ThinkPad P50 | |
| HP ZBook 15 G3 | |
| Lenovo ThinkPad P51s 20HB000SGE | |
| 1920x1080 Extreme HD Preset OpenGL AA:x8 | |
| Lenovo ThinkPad P71-20HK0004GE | |
| HP ZBook 17 G3 TZV66eA | |
| Lenovo ThinkPad P51 20HH0016GE | |
| MSI WE72 7RJ | |
| HP ZBook 15 G3 | |
| Lenovo ThinkPad P50 | |
| Lenovo ThinkPad P50 | |
| Lenovo ThinkPad P51s 20HB000SGE | |
| SiSoft Sandra 2016 | |
| Image Processing | |
| Lenovo ThinkPad P71-20HK0004GE | |
| HP ZBook 17 G3 TZV66eA | |
| Lenovo ThinkPad P51 20HH0016GE | |
| HP ZBook 15 G3 | |
| Lenovo ThinkPad P50 | |
| Lenovo ThinkPad P50 | |
| Lenovo ThinkPad P51s 20HB000SGE | |
| GP Cryptography (Higher Security AES256+SHA2-512) | |
| Lenovo ThinkPad P71-20HK0004GE | |
| HP ZBook 17 G3 TZV66eA | |
| Lenovo ThinkPad P50 | |
| Lenovo ThinkPad P51 20HH0016GE | |
| HP ZBook 15 G3 | |
| Lenovo ThinkPad P50 | |
| Lenovo ThinkPad P51s 20HB000SGE | |
| GP Financial Analysis (FP High/Double Precision) | |
| Lenovo ThinkPad P71-20HK0004GE | |
| HP ZBook 17 G3 TZV66eA | |
| Lenovo ThinkPad P51 20HH0016GE | |
| HP ZBook 15 G3 | |
| Lenovo ThinkPad P50 | |
| Lenovo ThinkPad P50 | |
| Lenovo ThinkPad P51s 20HB000SGE | |
| 3DMark 06 Standard Score | 29465 poäng | |
| 3DMark 11 Performance | 7709 poäng | |
| 3DMark Cloud Gate Standard Score | 20644 poäng | |
| 3DMark Fire Strike Score | 5275 poäng | |
| 3DMark Fire Strike Extreme Score | 2665 poäng | |
| 3DMark Time Spy Score | 1920 poäng | |
Hjälp | ||
| låg | med. | hög | ultra | 4K | |
|---|---|---|---|---|---|
| The Witcher 3 (2015) | 66.6 | 37.2 | 20 | 12.7 | |
| Rise of the Tomb Raider (2016) | 71.6 | 41.6 | 35.2 | 13.7 | |
| For Honor (2017) | 54.8 | 51.9 | 37.5 | 14.6 |
Ljudnivå
| Låg belastning |
| 29.6 / 29.6 / 29.6 dB(A) |
| Hög belastning |
| 32.2 / 36.6 dB(A) |
 | ||
30 dB tyst 40 dB(A) hörbar 50 dB(A) högt ljud |
||
min: | ||
| Lenovo ThinkPad P51 20HH0016GE Quadro M2200, E3-1505M v6, Samsung PM961 NVMe MZVLW512HMJP | Lenovo ThinkPad P51s 20HB000SGE Quadro M520, i7-7600U, Samsung SSD PM961 1TB M.2 PCIe 3.0 x4 NVMe (MZVLW1T0) | Lenovo ThinkPad P50 Quadro M2000M, E3-1505M v5, Samsung SM951 MZVPV256HDGL m.2 PCI-e | HP ZBook 15 G3 Quadro M2000M, E3-1505M v5, Samsung SM951 MZVPV512HDGL m.2 PCI-e | Dell Precision 7510 (4K IGZO) Quadro M2000M, E3-1535M v5, Samsung SSD SM951a 512GB M.2 PCIe 3.0 x4 NVMe (MZVKV512) | Dell Precision 5520 UHD Quadro M1200, E3-1505M v6, Samsung SM961 MZVKW512HMJP m.2 PCI-e | Fujitsu Celsius H760 Quadro M2000M, E3-1505M v5, Samsung SM951 MZVPV512 m.2 PCI-e | |
|---|---|---|---|---|---|---|---|
| Noise | -4% | -8% | -14% | -9% | -10% | -10% | |
| av / miljö * (dB) | 29.6 | 29.2 1% | 30 -1% | 30 -1% | 28.2 5% | 28.7 3% | 29 2% |
| Idle Minimum * (dB) | 29.6 | 29.2 1% | 30 -1% | 30 -1% | 29.8 -1% | 28.7 3% | 29 2% |
| Idle Average * (dB) | 29.6 | 29.2 1% | 30 -1% | 30 -1% | 29.8 -1% | 32.1 -8% | 29 2% |
| Idle Maximum * (dB) | 29.6 | 31.1 -5% | 30 -1% | 30 -1% | 31.2 -5% | 32.1 -8% | 29 2% |
| Load Average * (dB) | 32.2 | 36.7 -14% | 42.1 -31% | 45.3 -41% | 37.2 -16% | 41.3 -28% | 43.1 -34% |
| Load Maximum * (dB) | 36.6 | 39.4 -8% | 42.1 -15% | 49.7 -36% | 49.4 -35% | 45.5 -24% | 49.2 -34% |
| Witcher 3 ultra * (dB) | 45.5 |
* ... mindre är bättre
(±) Den maximala temperaturen på ovansidan är 43 °C / 109 F, jämfört med genomsnittet av 38.2 °C / 101 F , allt från 22.2 till 69.8 °C för klassen Workstation.
(-) Botten värms upp till maximalt 52.2 °C / 126 F, jämfört med genomsnittet av 41.1 °C / 106 F
(+) Vid tomgångsbruk är medeltemperaturen för ovansidan 26.2 °C / 79 F, jämfört med enhetsgenomsnittet på 32 °C / ### class_avg_f### F.
(±) Handledsstöden och pekplattan kan bli väldigt varma vid beröring med maximalt 36.1 °C / 97 F.
(-) Medeltemperaturen för handledsstödsområdet på liknande enheter var 27.8 °C / 82 F (-8.3 °C / -15 F).
Lenovo ThinkPad P51 20HH0016GE ljudanalys
(-) | inte särskilt höga högtalare (64.5 dB)
Bas 100 - 315 Hz
(±) | reducerad bas - i genomsnitt 12.3% lägre än medianen
(±) | linjäriteten för basen är genomsnittlig (10.4% delta till föregående frekvens)
Mellan 400 - 2000 Hz
(+) | balanserad mellan - endast 3.9% från medianen
(+) | mids är linjära (6.4% delta till föregående frekvens)
Högsta 2 - 16 kHz
(+) | balanserade toppar - endast 2.7% från medianen
(±) | linjäriteten för toppar är genomsnittlig (13.3% delta till föregående frekvens)
Totalt 100 - 16 000 Hz
(±) | linjäriteten för det totala ljudet är genomsnittlig (24.7% skillnad mot median)
Jämfört med samma klass
» 86% av alla testade enheter i den här klassen var bättre, 2% liknande, 12% sämre
» Den bästa hade ett delta på 7%, genomsnittet var 17%, sämst var 35%
Jämfört med alla testade enheter
» 75% av alla testade enheter var bättre, 5% liknande, 20% sämre
» Den bästa hade ett delta på 4%, genomsnittet var 24%, sämst var 134%
Lenovo ThinkPad P51s 20HB000SGE ljudanalys
(±) | högtalarljudstyrkan är genomsnittlig men bra (75.2 dB)
Bas 100 - 315 Hz
(±) | reducerad bas - i genomsnitt 10.7% lägre än medianen
(±) | linjäriteten för basen är genomsnittlig (11% delta till föregående frekvens)
Mellan 400 - 2000 Hz
(+) | balanserad mellan - endast 3.9% från medianen
(±) | linjäriteten för mids är genomsnittlig (10.5% delta till föregående frekvens)
Högsta 2 - 16 kHz
(+) | balanserade toppar - endast 3.1% från medianen
(±) | linjäriteten för toppar är genomsnittlig (7.1% delta till föregående frekvens)
Totalt 100 - 16 000 Hz
(±) | linjäriteten för det totala ljudet är genomsnittlig (15.6% skillnad mot median)
Jämfört med samma klass
» 35% av alla testade enheter i den här klassen var bättre, 11% liknande, 54% sämre
» Den bästa hade ett delta på 7%, genomsnittet var 17%, sämst var 35%
Jämfört med alla testade enheter
» 23% av alla testade enheter var bättre, 5% liknande, 72% sämre
» Den bästa hade ett delta på 4%, genomsnittet var 24%, sämst var 134%
| Av/Standby | |
| Låg belastning | |
| Hög belastning |
|
Förklaring:
min: | |
| Lenovo ThinkPad P51 20HH0016GE E3-1505M v6, Quadro M2200, Samsung PM961 NVMe MZVLW512HMJP, IPS, 3840x2160, 15.6" | Lenovo ThinkPad P51s 20HB000SGE i7-7600U, Quadro M520, Samsung SSD PM961 1TB M.2 PCIe 3.0 x4 NVMe (MZVLW1T0), IPS, 3840x2160, 15.6" | Lenovo ThinkPad P50 E3-1505M v5, Quadro M2000M, Samsung SM951 MZVPV256HDGL m.2 PCI-e, IPS, 3840x2160, 15.6" | HP ZBook 15 G3 E3-1505M v5, Quadro M2000M, Samsung SM951 MZVPV512HDGL m.2 PCI-e, UWVA-IPS, 1920x1080, 15.6" | Dell Precision 7510 (4K IGZO) E3-1535M v5, Quadro M2000M, Samsung SSD SM951a 512GB M.2 PCIe 3.0 x4 NVMe (MZVKV512), IGZO IPS, 3840x2160, 15.6" | Dell Precision 5520 UHD E3-1505M v6, Quadro M1200, Samsung SM961 MZVKW512HMJP m.2 PCI-e, IPS, 3840x2160, 15.6" | |
|---|---|---|---|---|---|---|
| Power Consumption | 35% | 0% | 19% | -66% | 6% | |
| Idle Minimum * (Watt) | 8.6 | 5.8 33% | 10.2 -19% | 5.7 34% | 23.9 -178% | 8.9 -3% |
| Idle Average * (Watt) | 15.9 | 10.4 35% | 17.8 -12% | 12.2 23% | 28.9 -82% | 13.6 14% |
| Idle Maximum * (Watt) | 22.1 | 13.5 39% | 18.3 17% | 12.6 43% | 30 -36% | 14.1 36% |
| Load Average * (Watt) | 84.4 | 62.4 26% | 76.9 9% | 83.1 2% | 95.2 -13% | 100.3 -19% |
| Load Maximum * (Watt) | 130.6 | 73.1 44% | 123.5 5% | 138.2 -6% | 157.1 -20% | 126.3 3% |
| Witcher 3 ultra * (Watt) | 100.2 |
* ... mindre är bättre
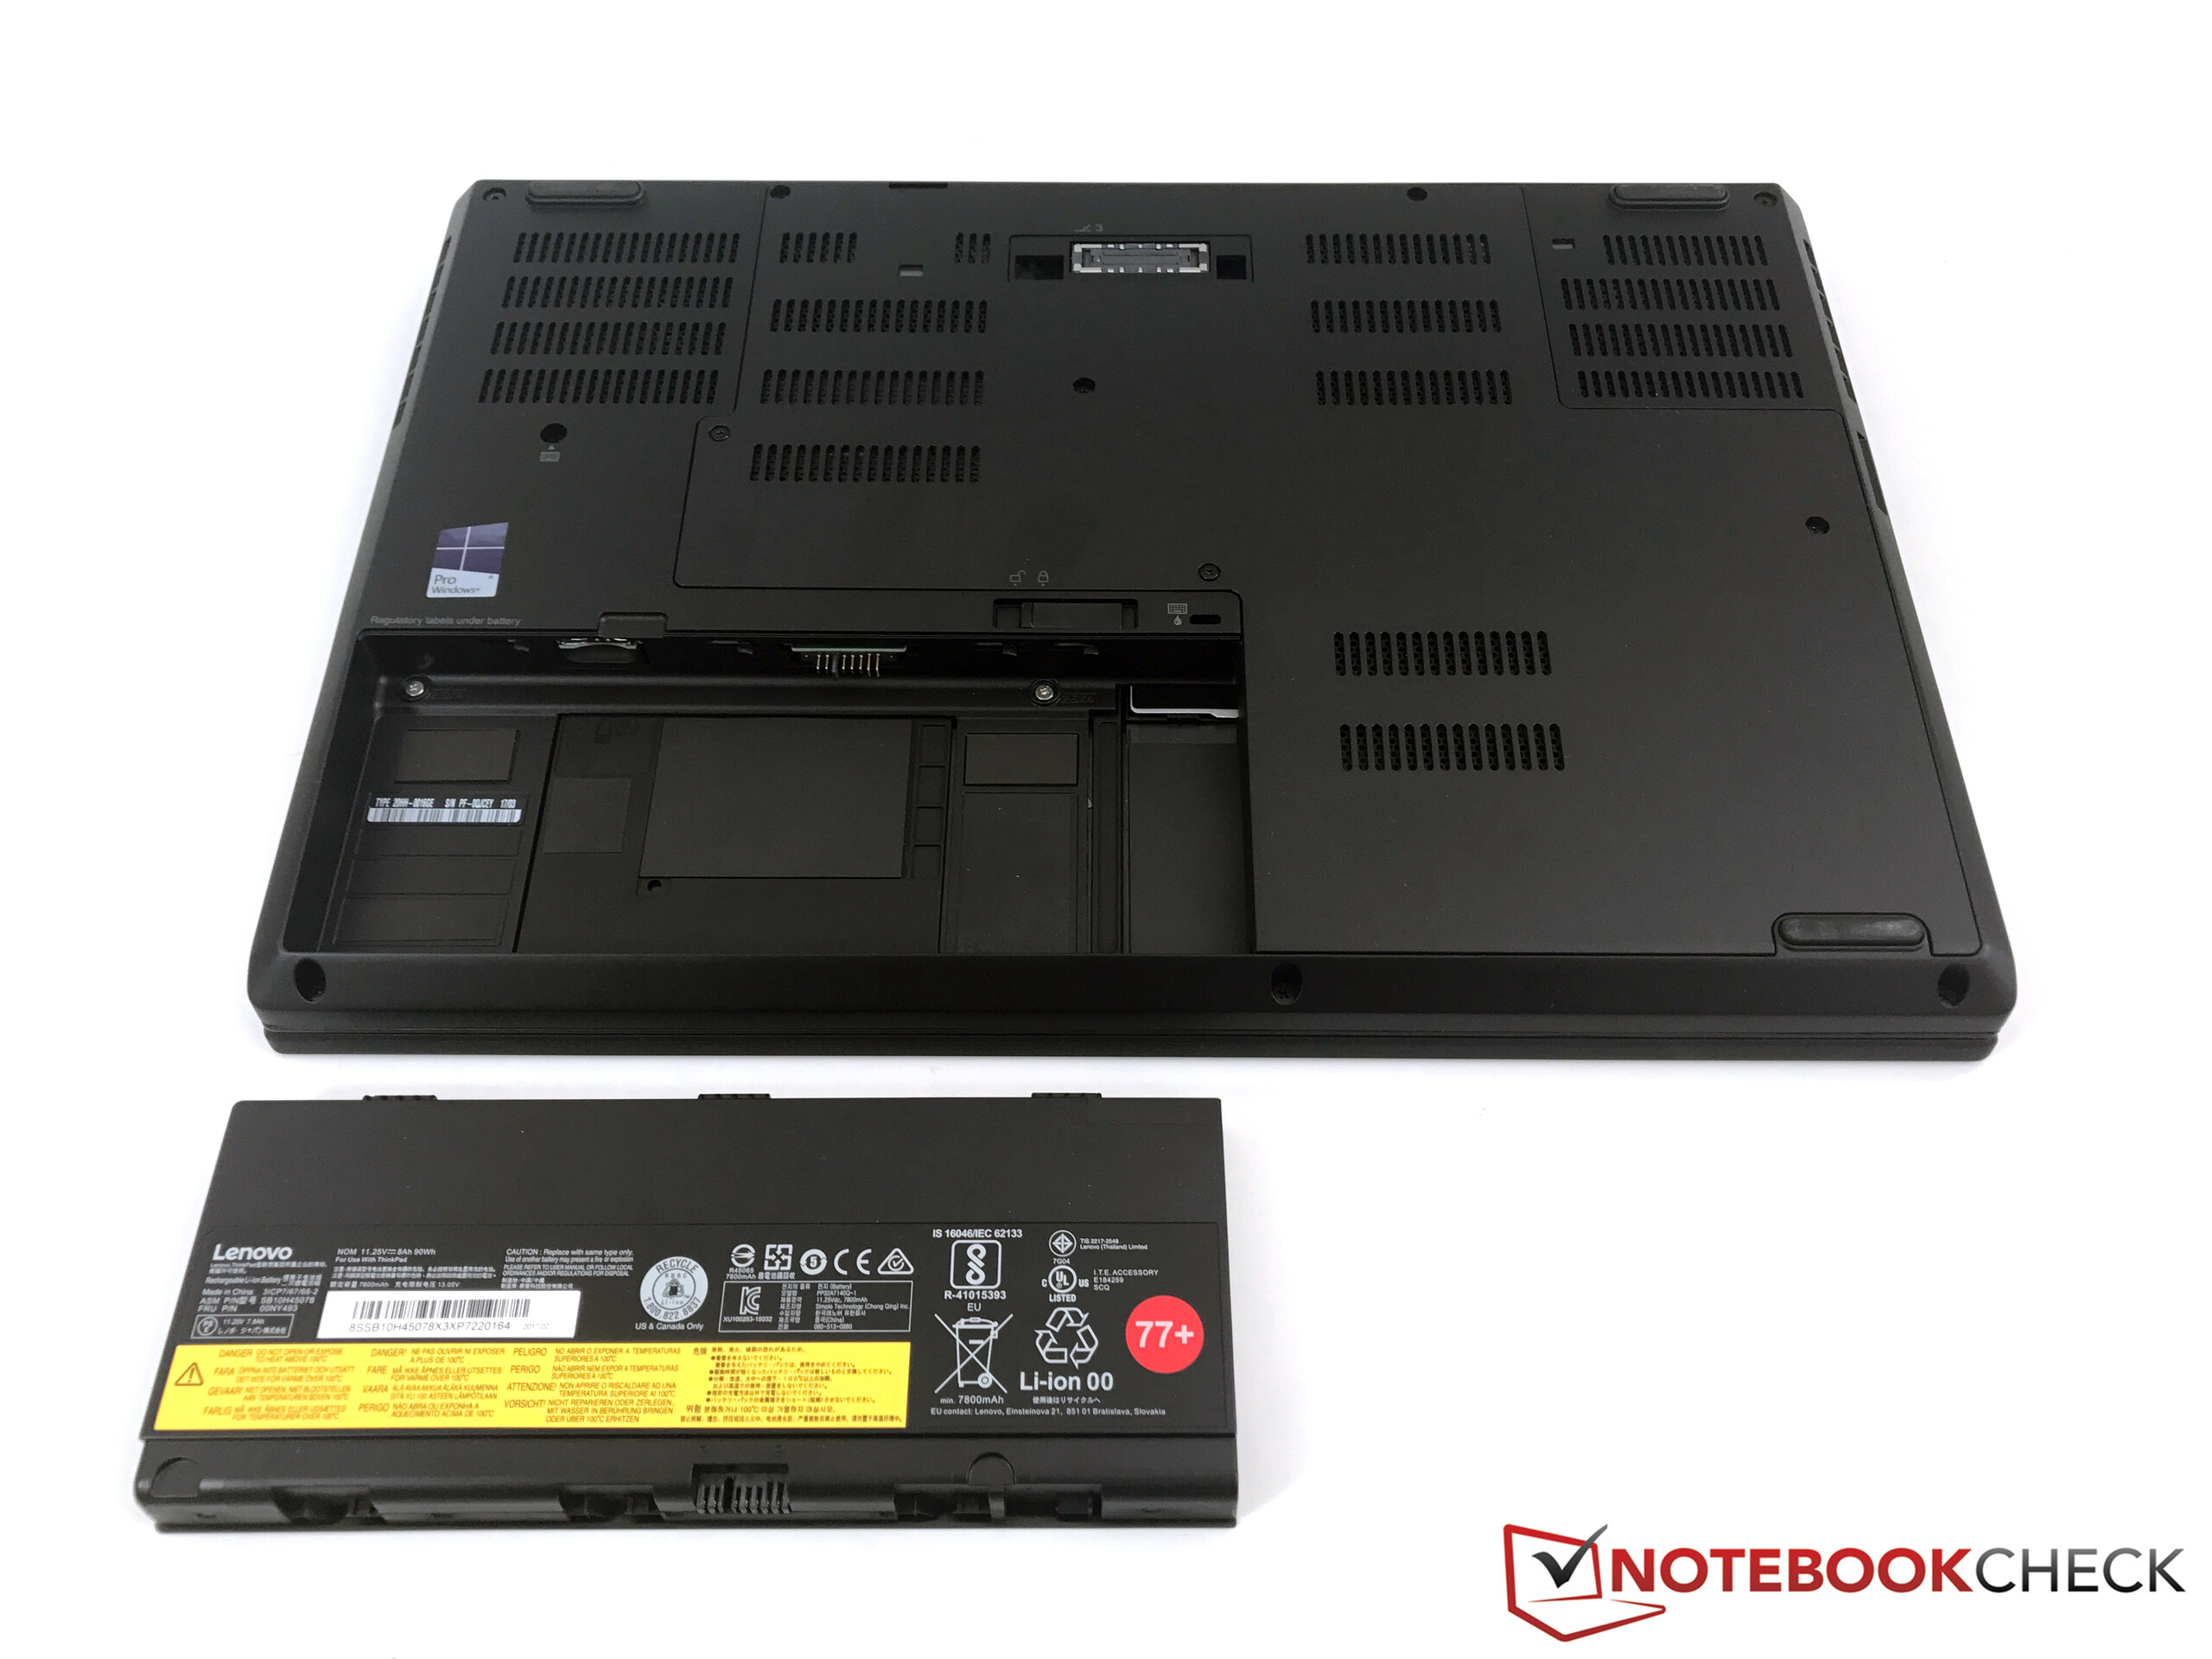
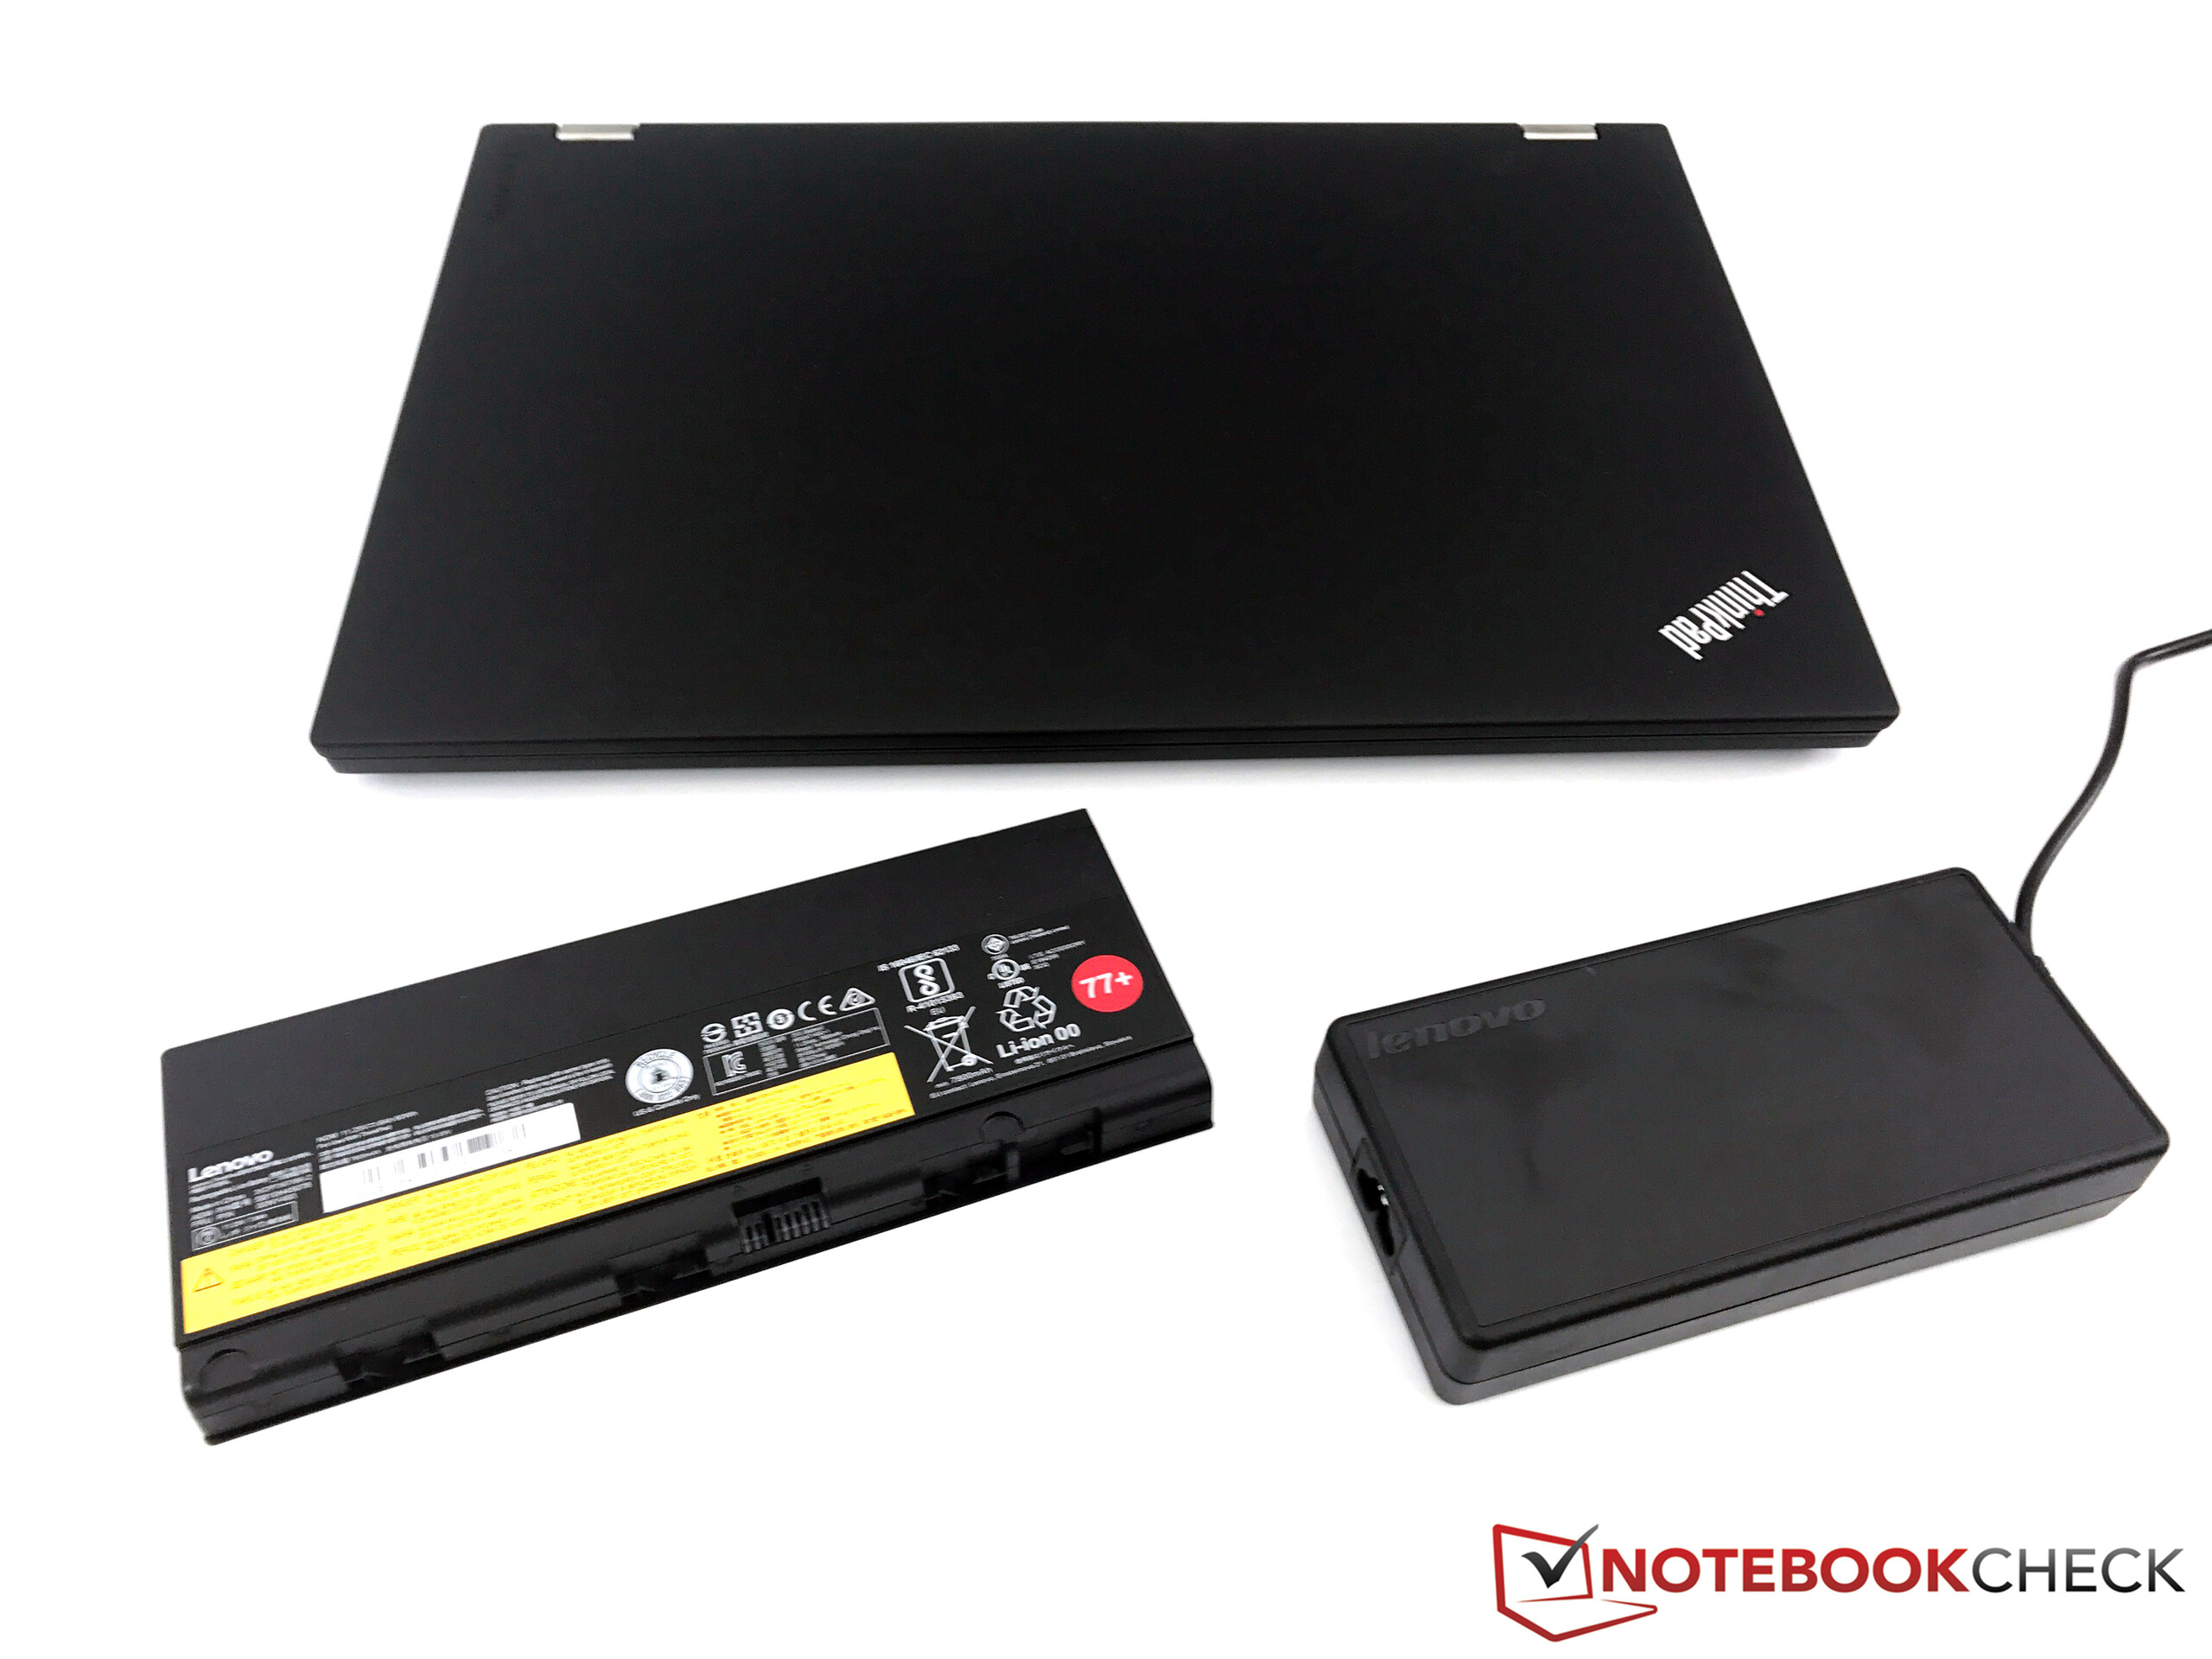
| Lenovo ThinkPad P51 20HH0016GE E3-1505M v6, Quadro M2200, 90 Wh | Lenovo ThinkPad P51s 20HB000SGE i7-7600U, Quadro M520, 104 Wh | Lenovo ThinkPad P50 E3-1505M v5, Quadro M2000M, 90 Wh | HP ZBook 15 G3 E3-1505M v5, Quadro M2000M, 90 Wh | Dell Precision 7510 (4K IGZO) E3-1535M v5, Quadro M2000M, 91 Wh | Dell Precision 5520 UHD E3-1505M v6, Quadro M1200, 97 Wh | Fujitsu Celsius H760 E3-1505M v5, Quadro M2000M, 72 Wh | |
|---|---|---|---|---|---|---|---|
| Batteridrifttid | 106% | -26% | -3% | -47% | -34% | -22% | |
| Reader / Idle (h) | 16.4 | 26.4 61% | 9 -45% | 13.7 -16% | 4.5 -73% | 12.1 -26% | 9.3 -43% |
| H.264 (h) | 7.6 | 11.7 54% | 5.5 -28% | 7.5 -1% | 4.6 -39% | ||
| WiFi v1.3 (h) | 6.9 | 11.9 72% | 4.8 -30% | 6.4 -7% | 4 -42% | 4.2 -39% | 5.6 -19% |
| Load (h) | 1.6 | 5.4 238% | 1.6 0% | 1.8 13% | 1.2 -25% | 1 -37% | 1.8 13% |
För
Emot
Läs originaltestet på engelska här.
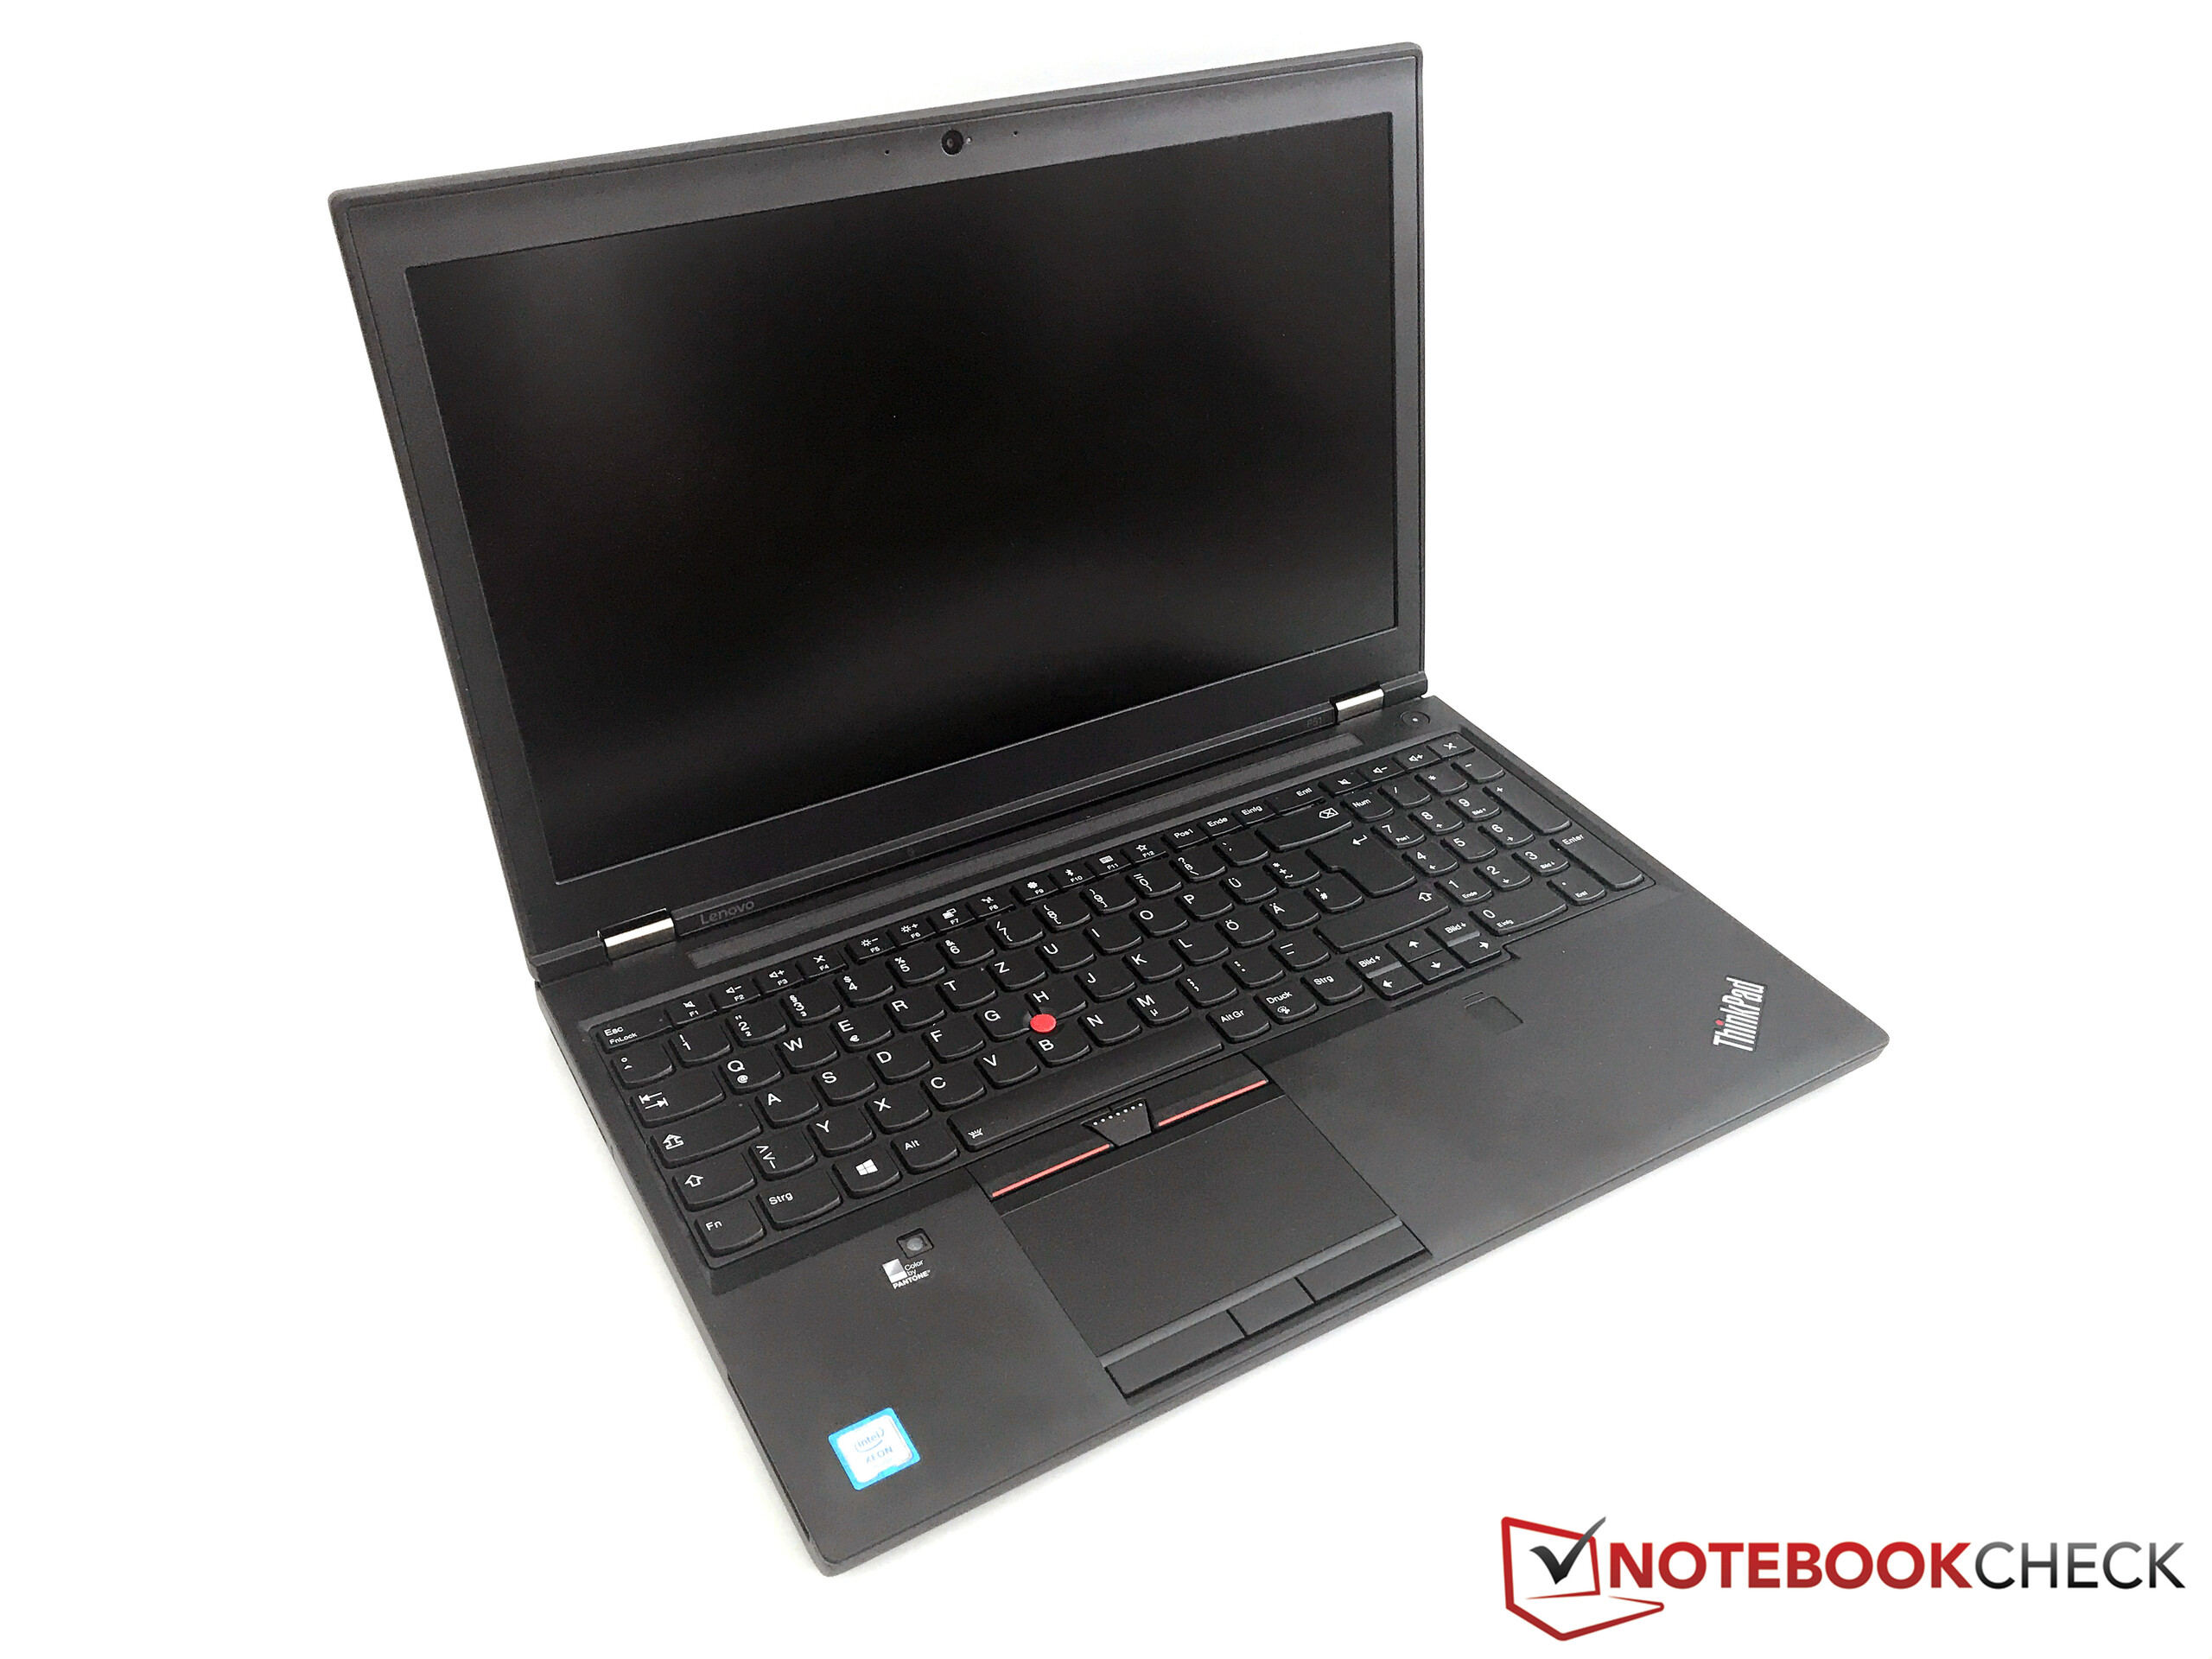
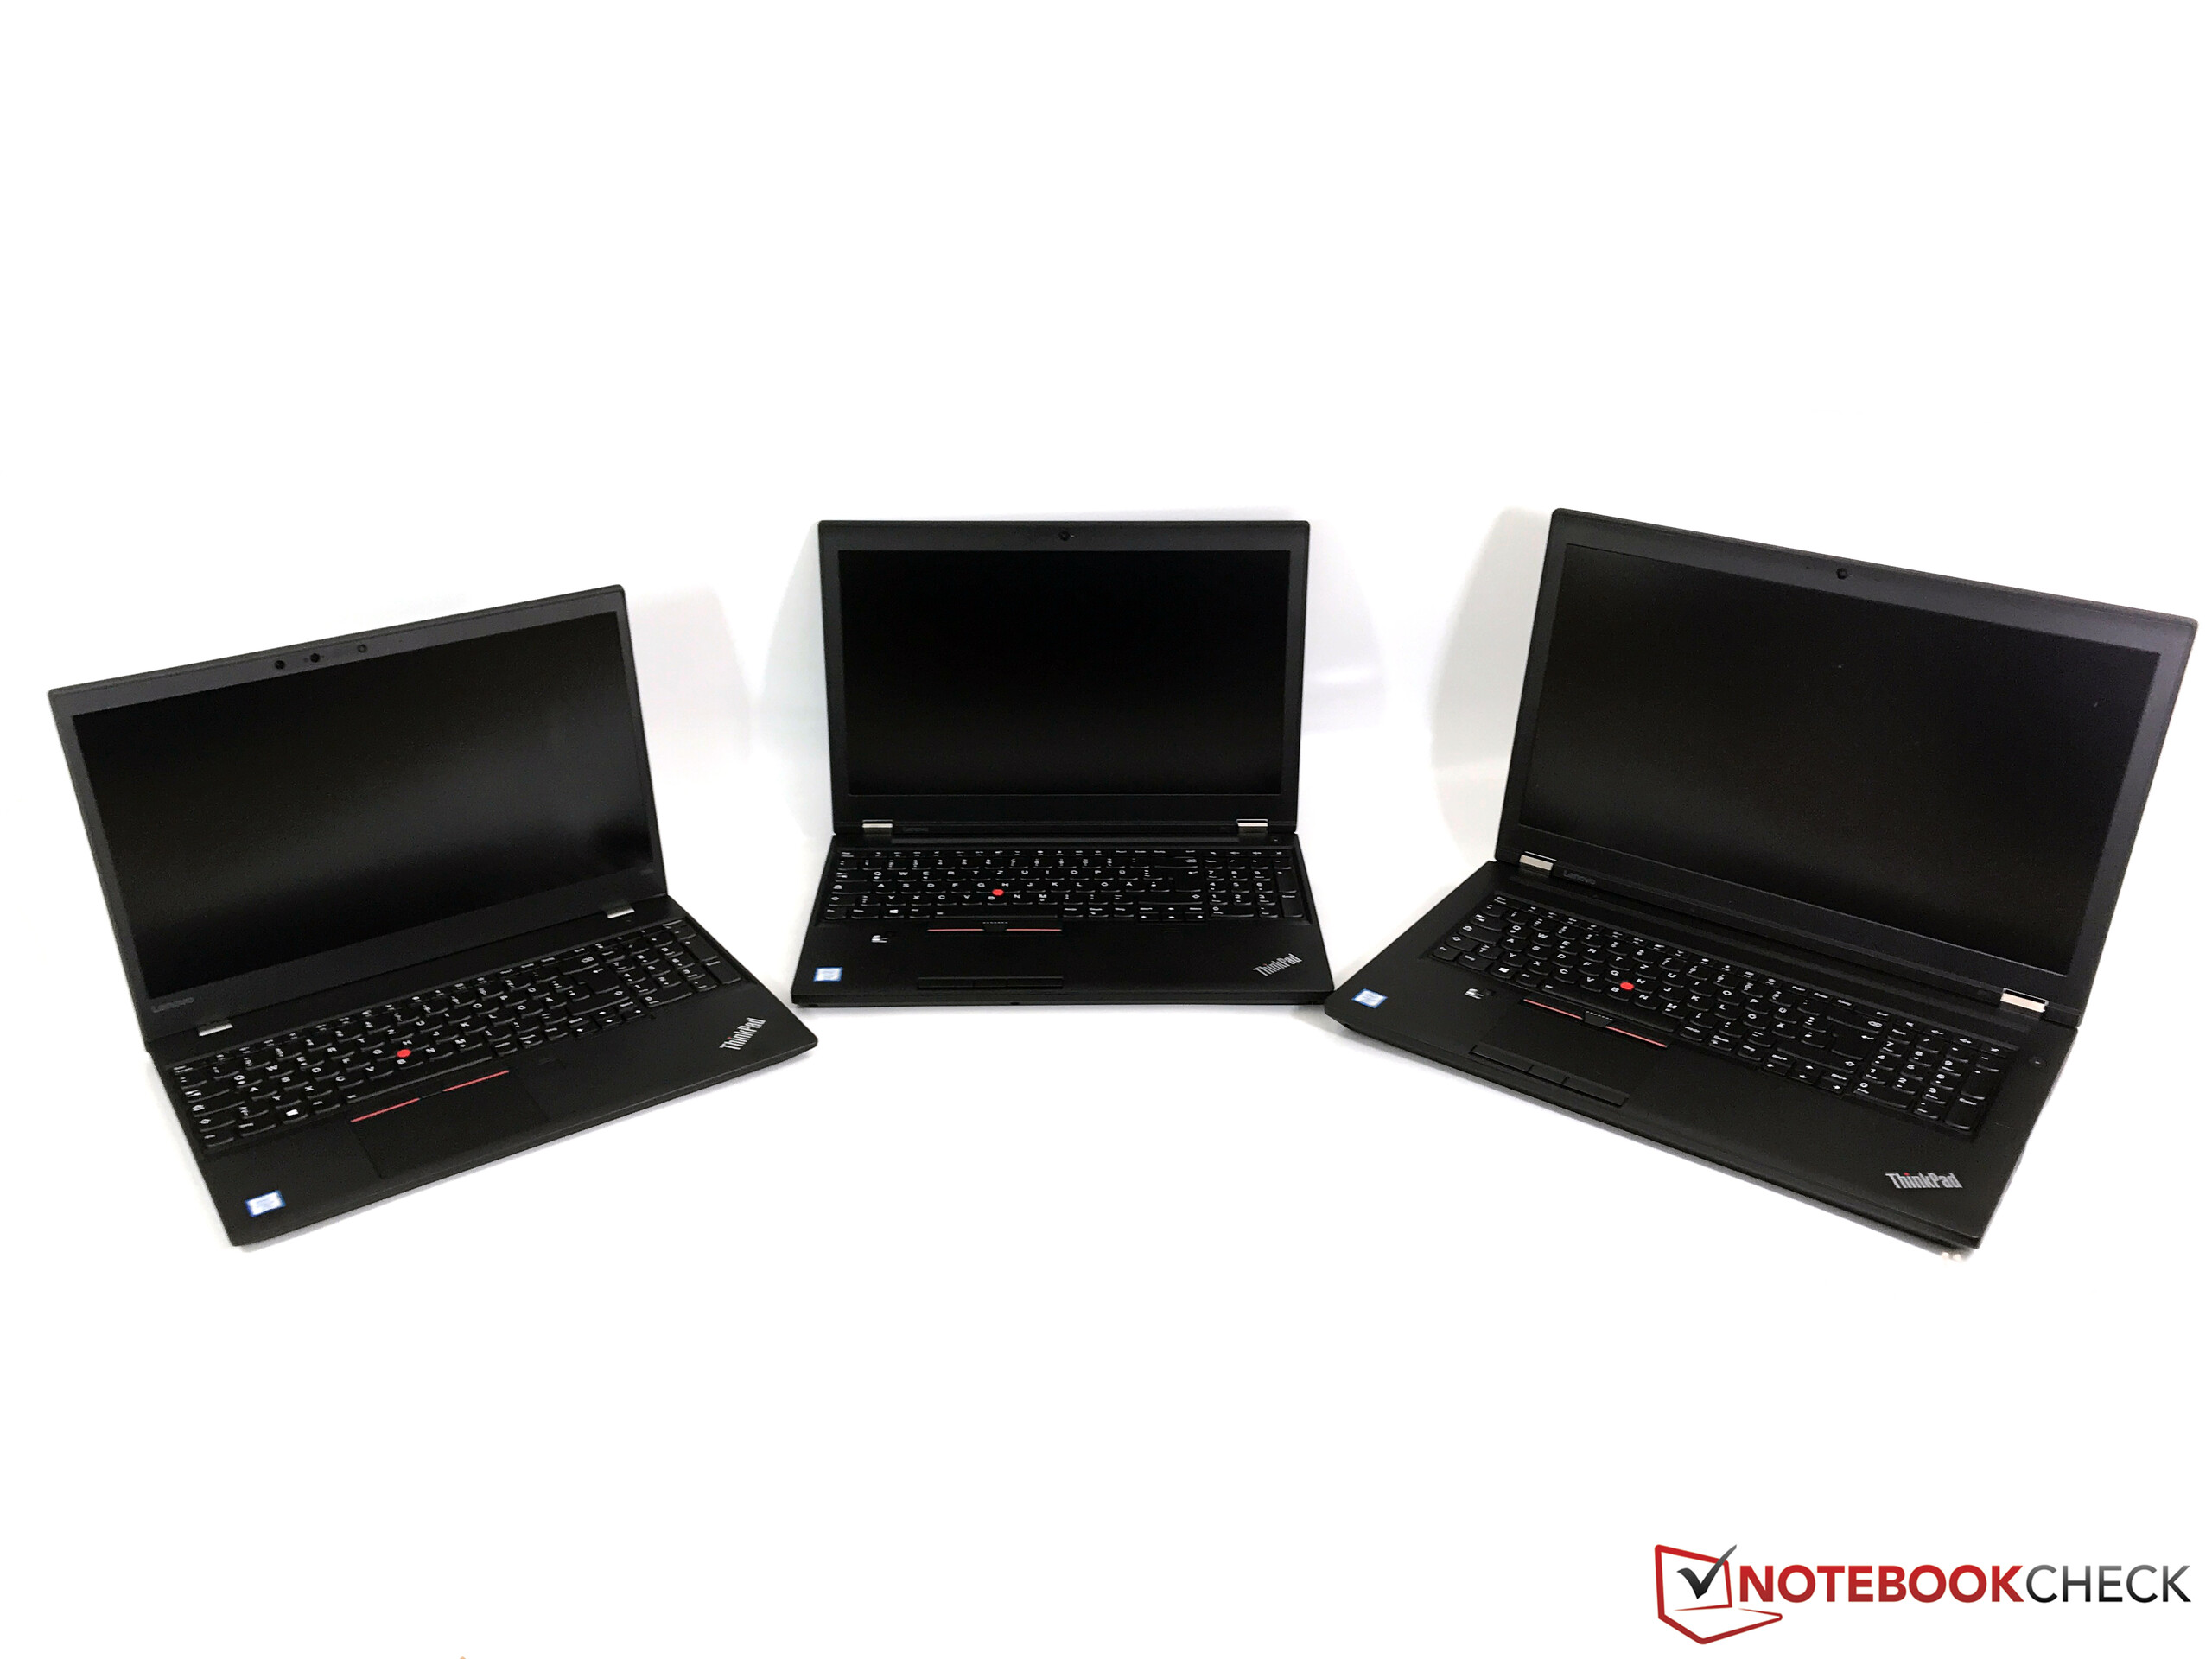
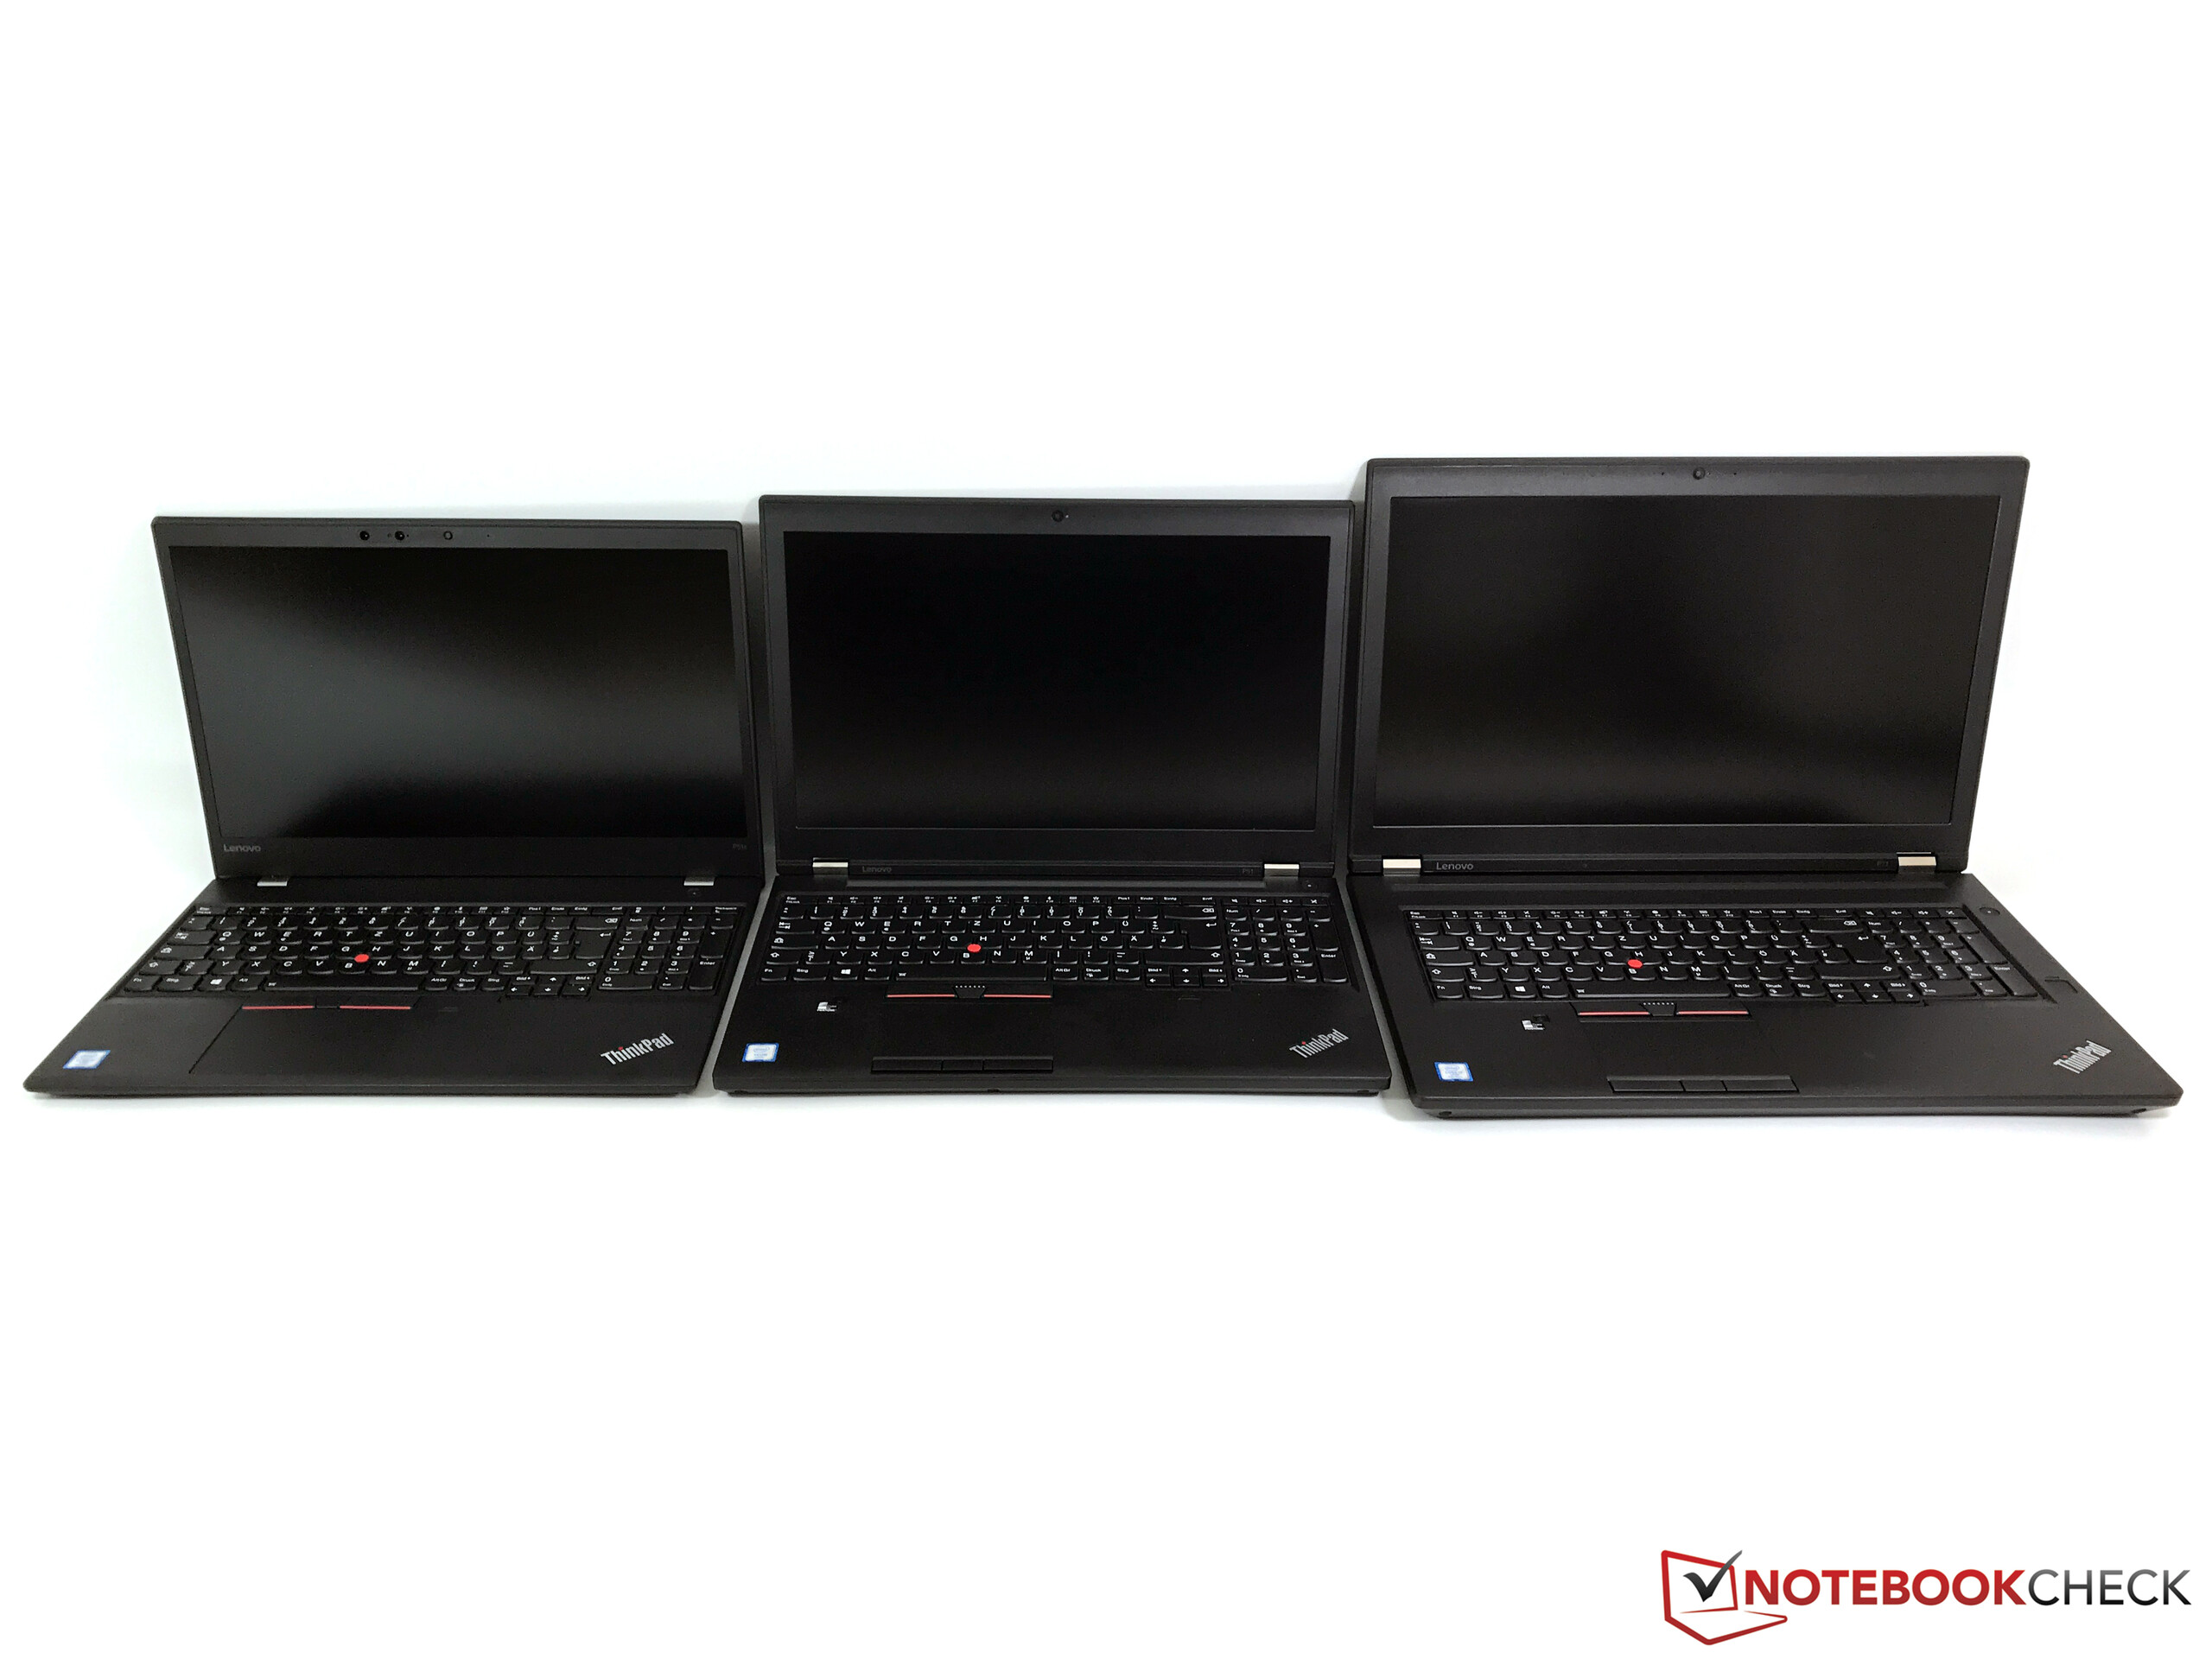
Lenovos ThinkPad P50 var ett bra alternativ i kategorin förra året, men den hade några problem – bland annat de två skärmalternativen, som inte kunde uppfylla våra förväntningar vad gällde ljusstyrka eller PWM-brister (4K-modellen). Årets ThinkPad P51 är Kaby Lake-uppdateringen som använder samma basenhet.
Återigen handlar det om ett mycket robust system med bra inmatningsenheter och tyst kylning. Prestandan är högre tack vare de nya komponenterna, och Lenovo använder äntligen en mycket bra 4K-skärm med imponerande färgskala. Andra problem med P50, som WWAN-problem och kraftigt minskad CPU-prestanda under batteridrift, har också åtgärdats.
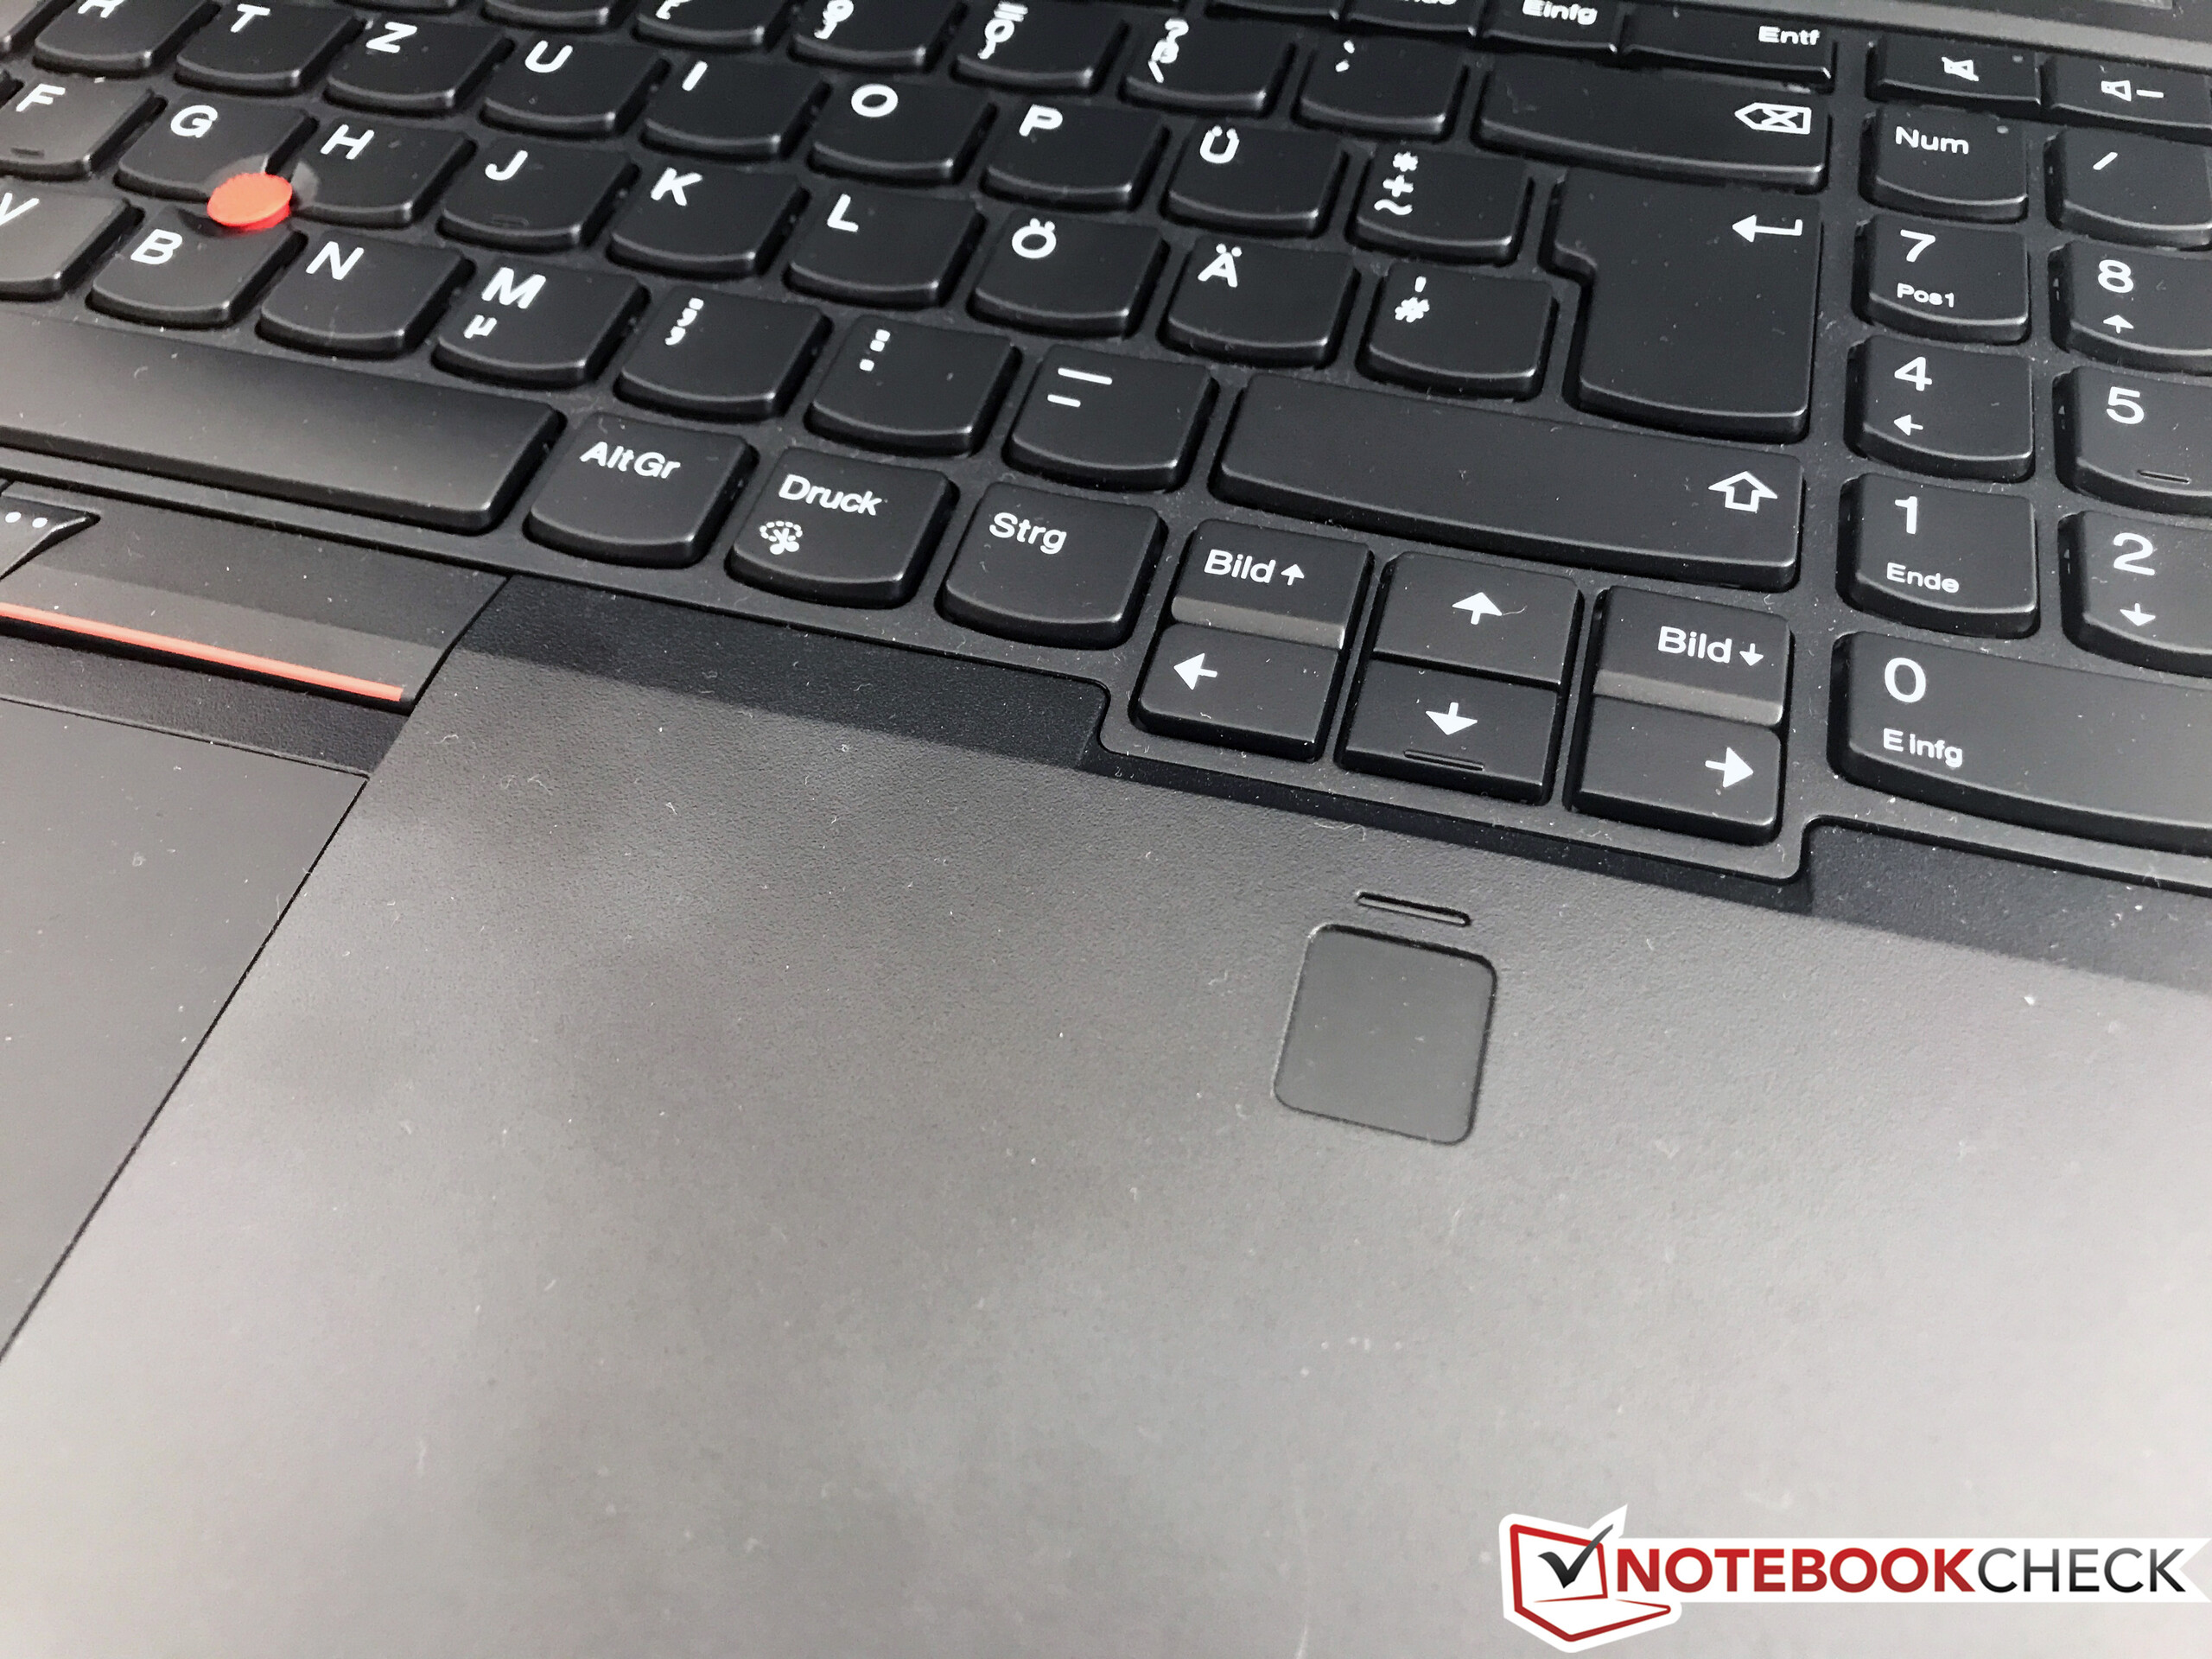
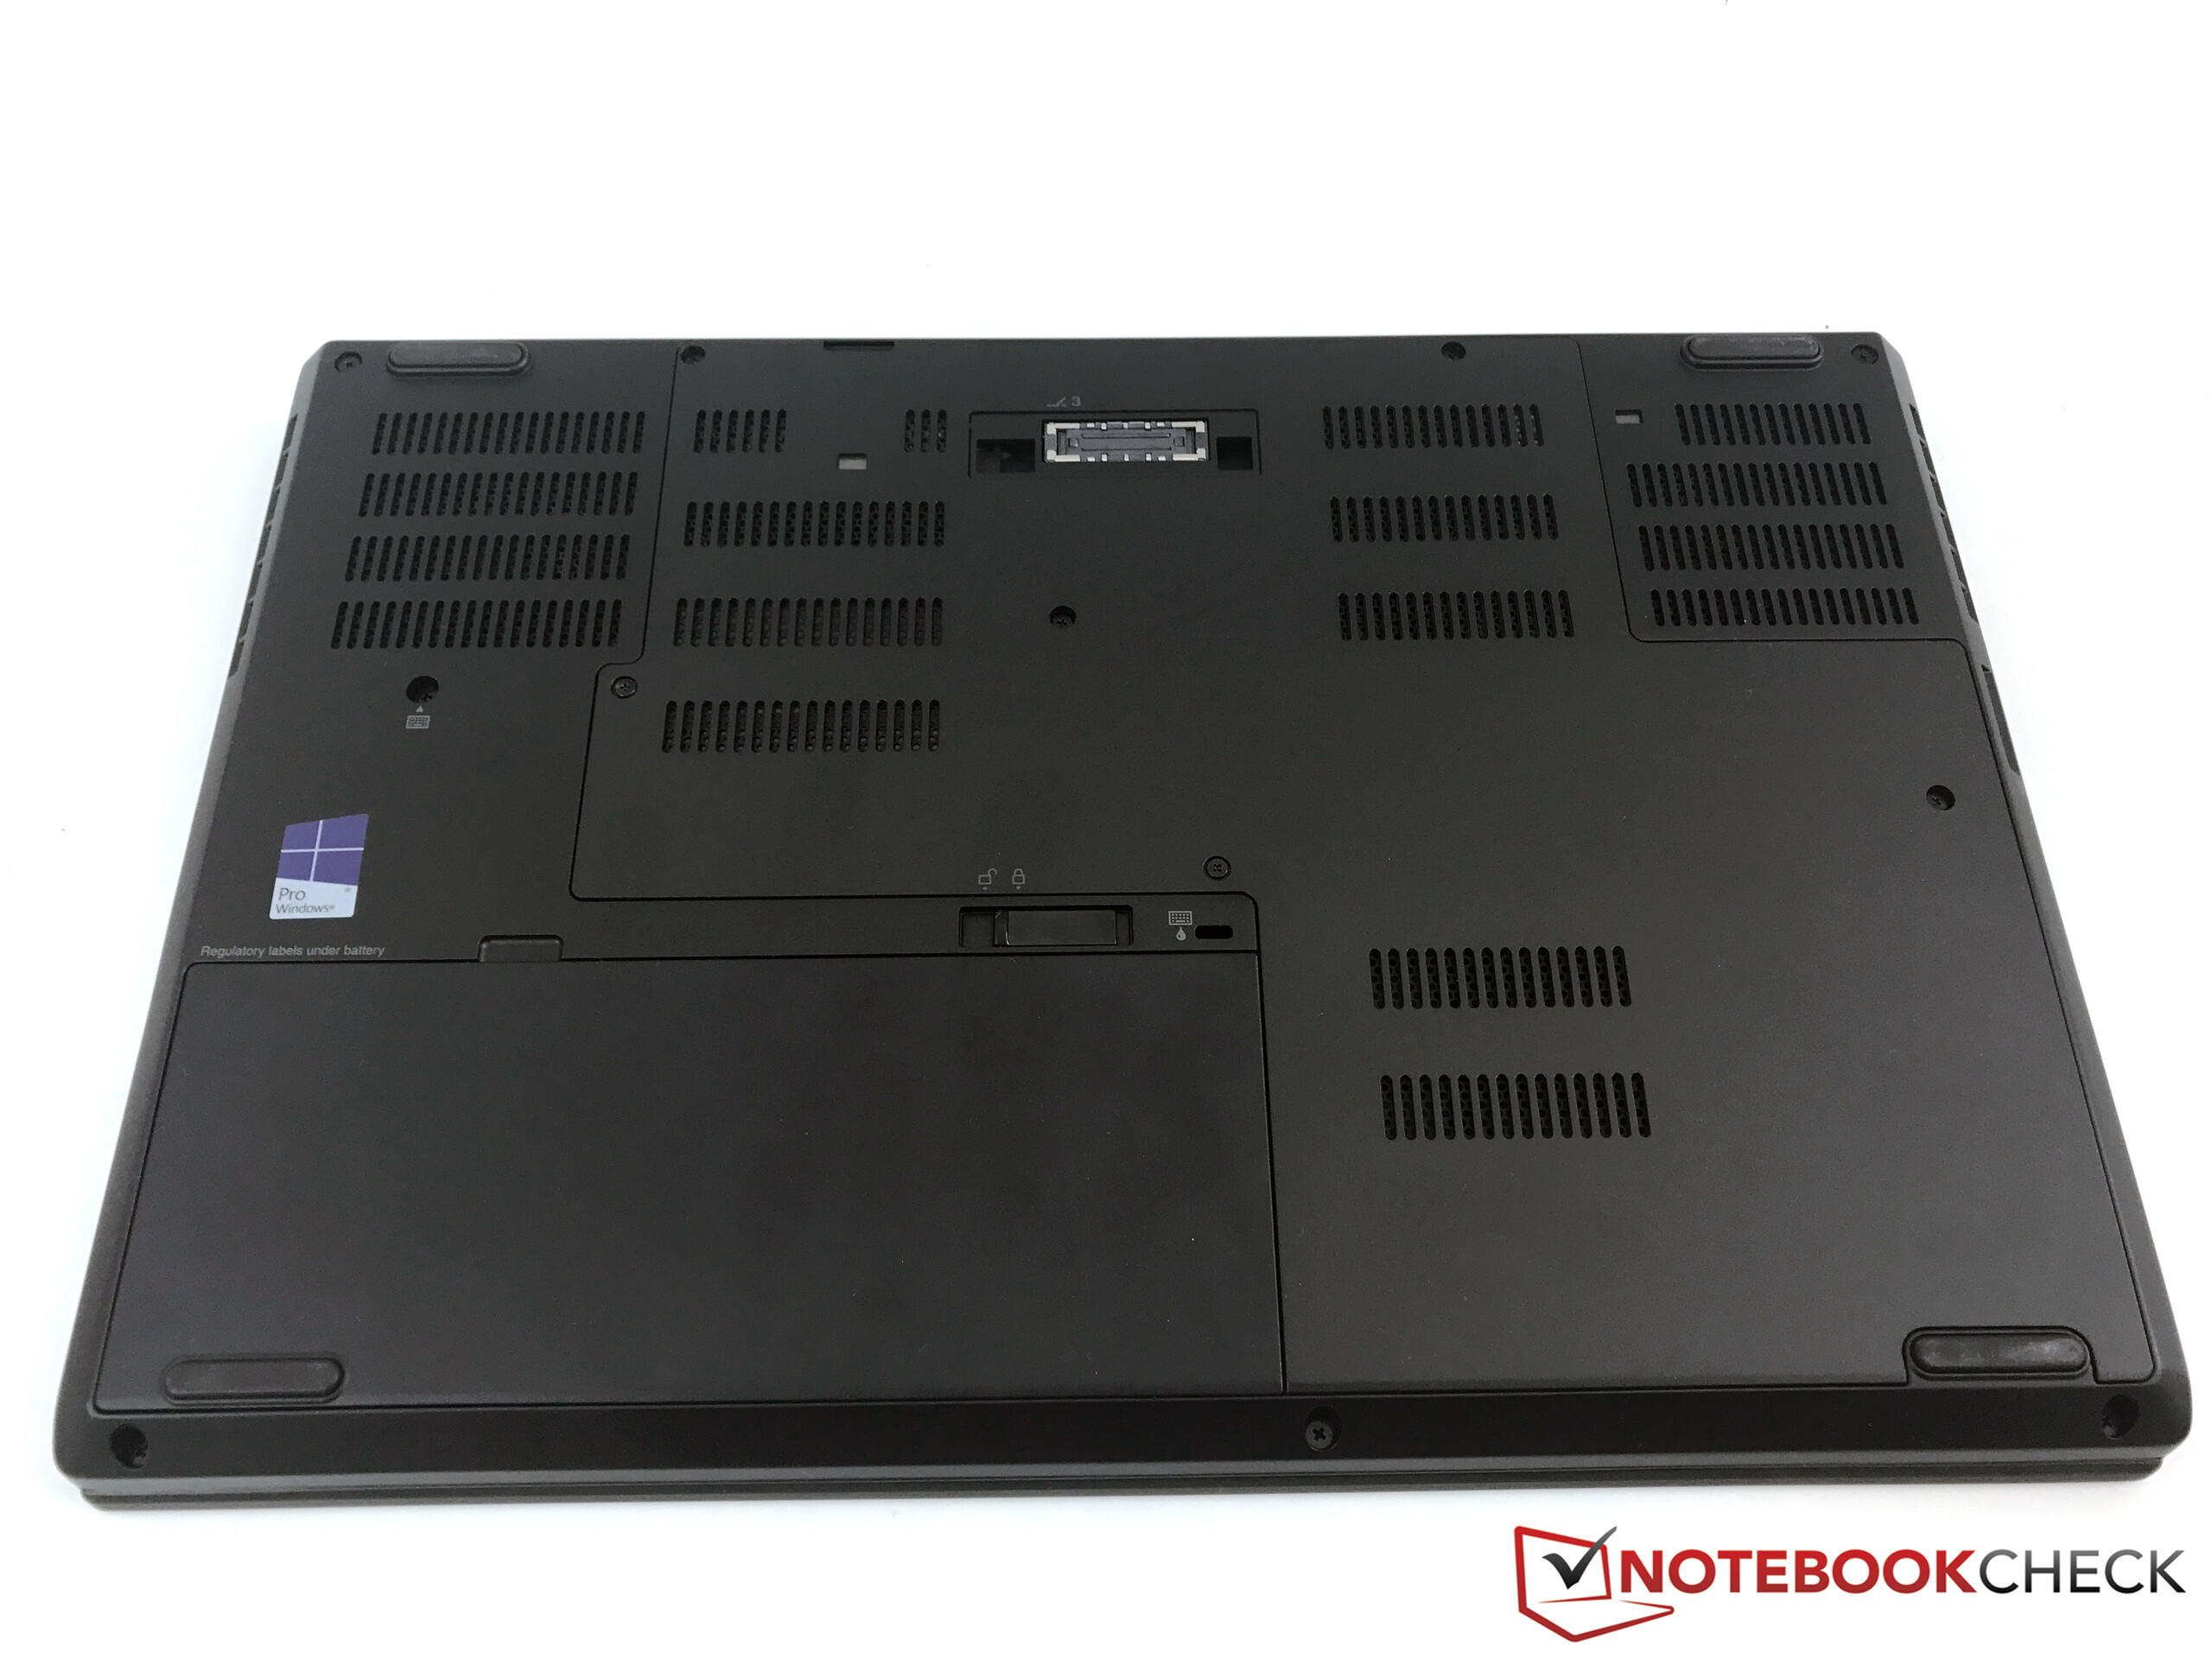
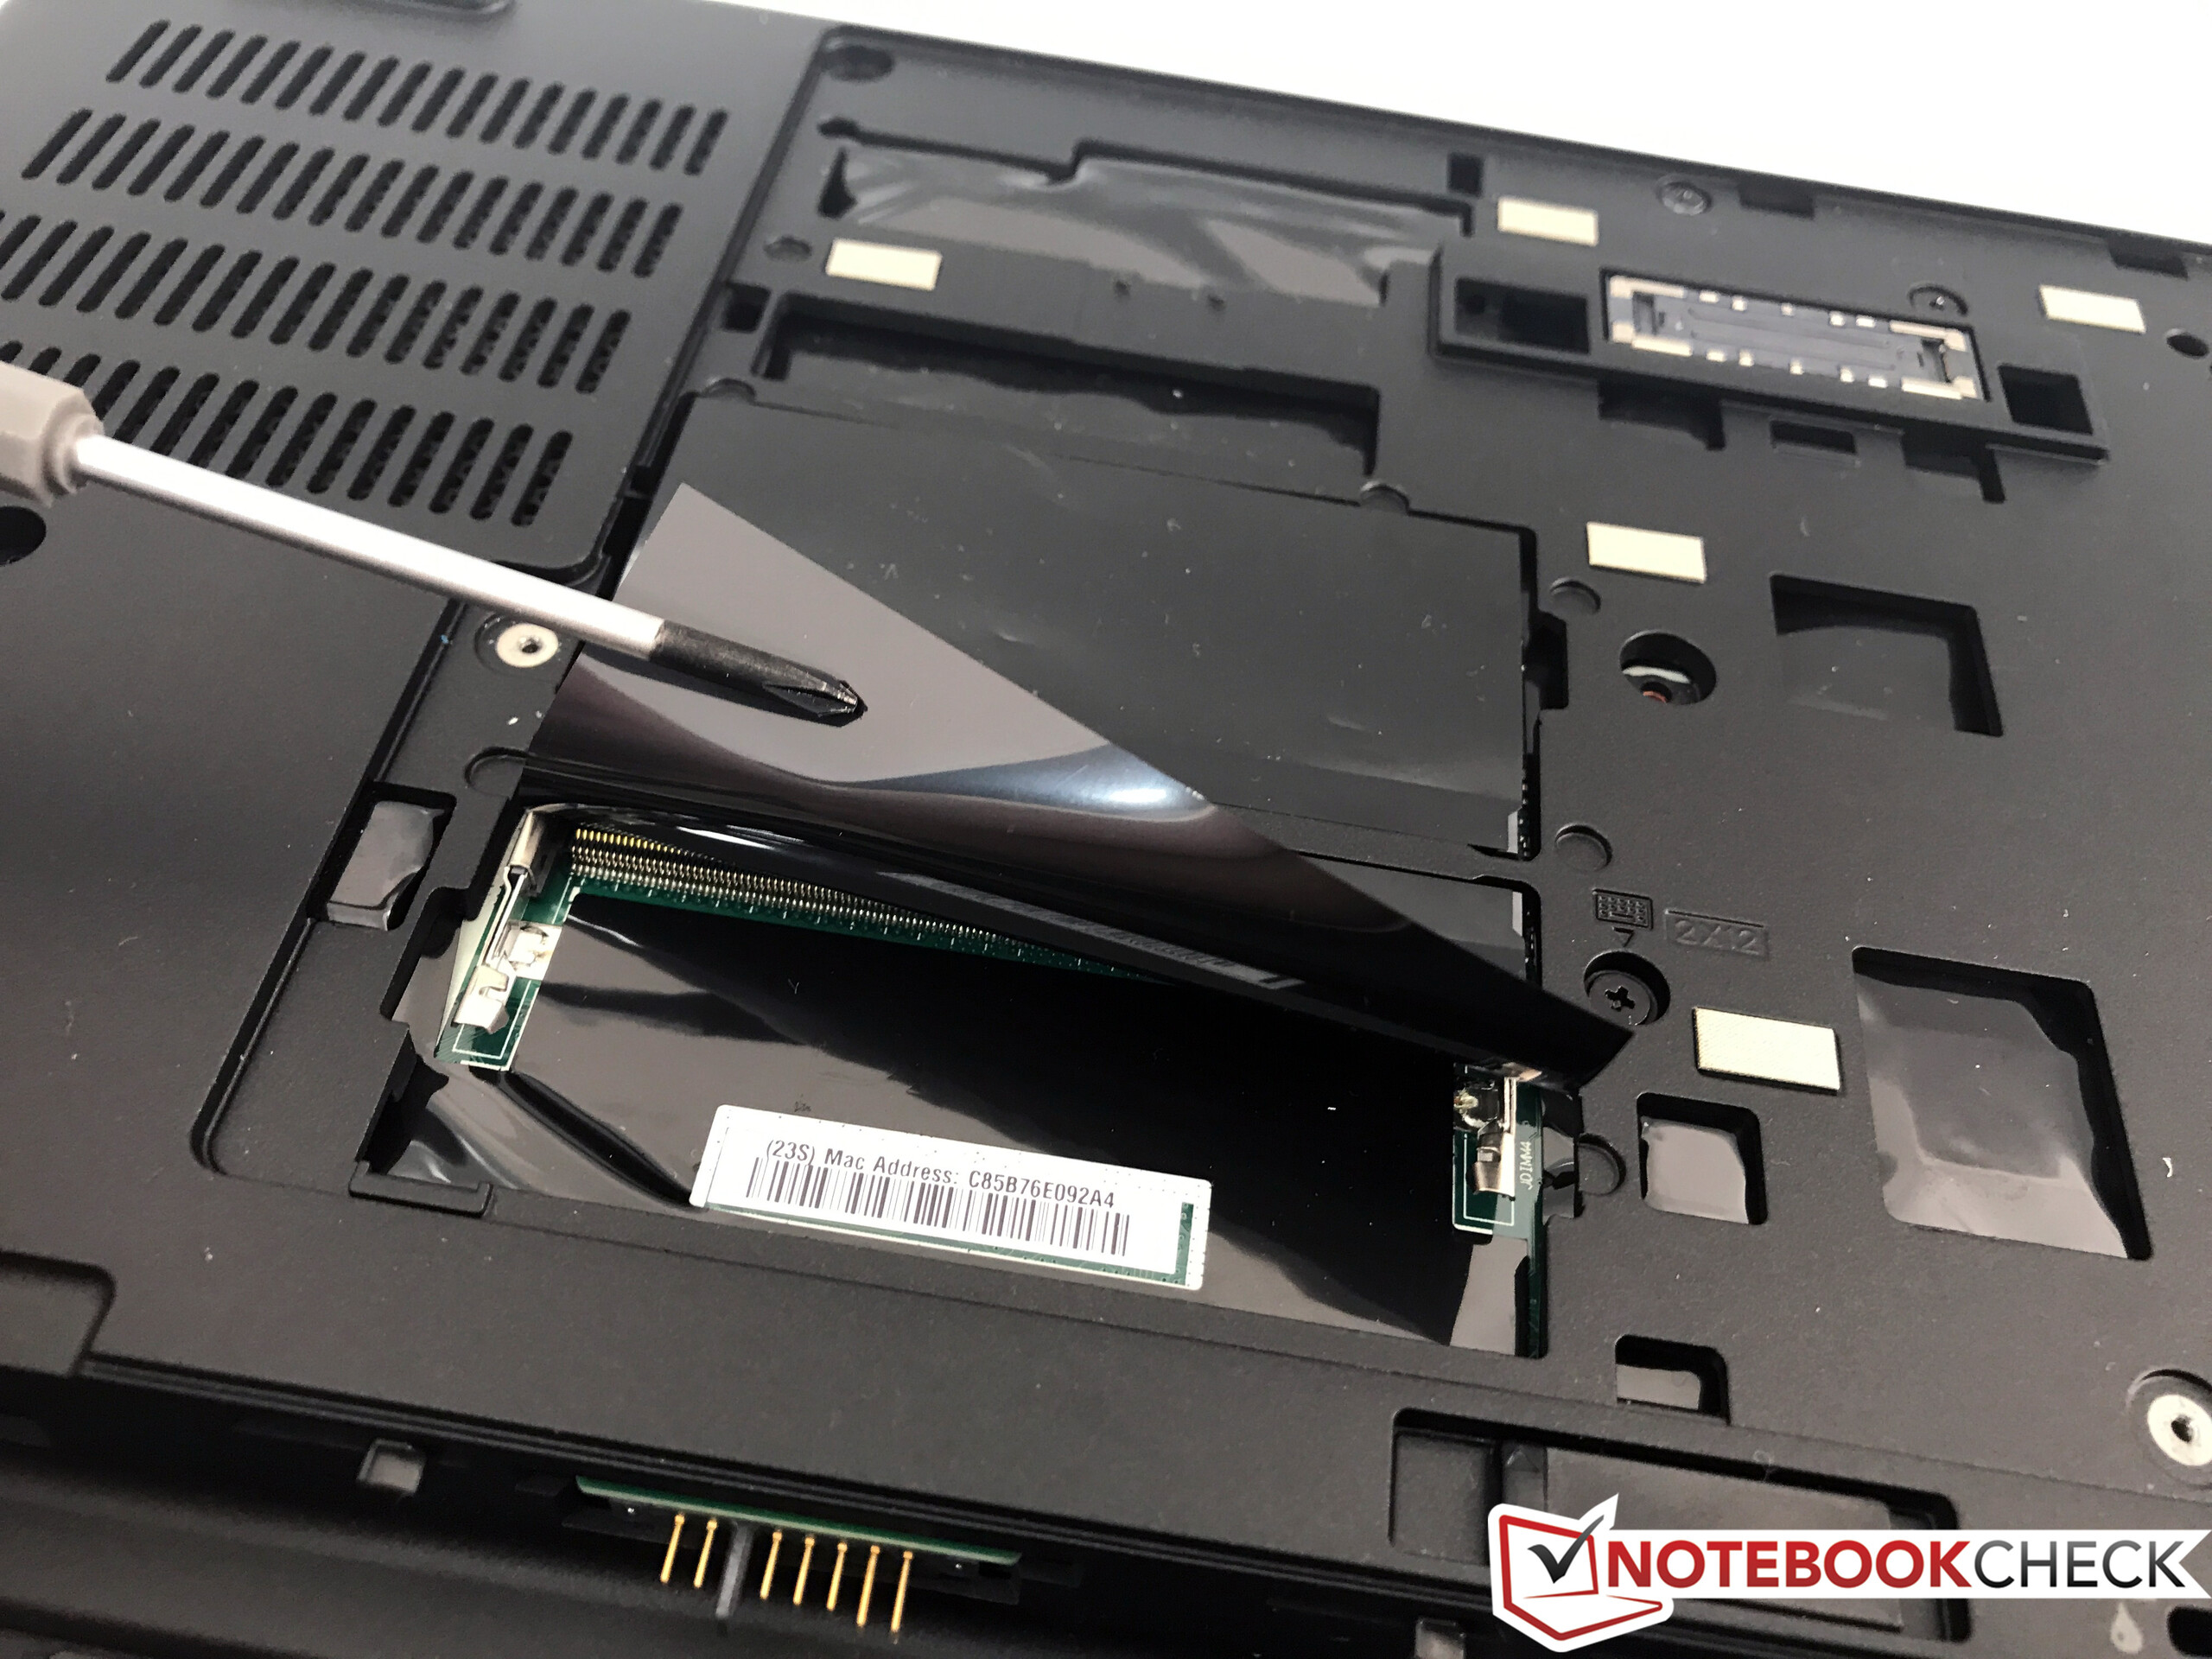
ThinkPad P51 är ändå inte perfekt. Förutom några detaljer – inklusive problem med högra TrackPoint-knappen på vår testmodell, dåliga talare och knepigt underhåll – fungerade inte den integrerade kalibreringen nu heller. Kylsystemet är också på gränsen när du påfrestar båda komponenterna samtidigt, och du kan inte utnyttja Xeon-processorns maximala prestanda. Datorns spoltjut (coil whine) märks också eftersom fläktarna ofta är avaktiverade.
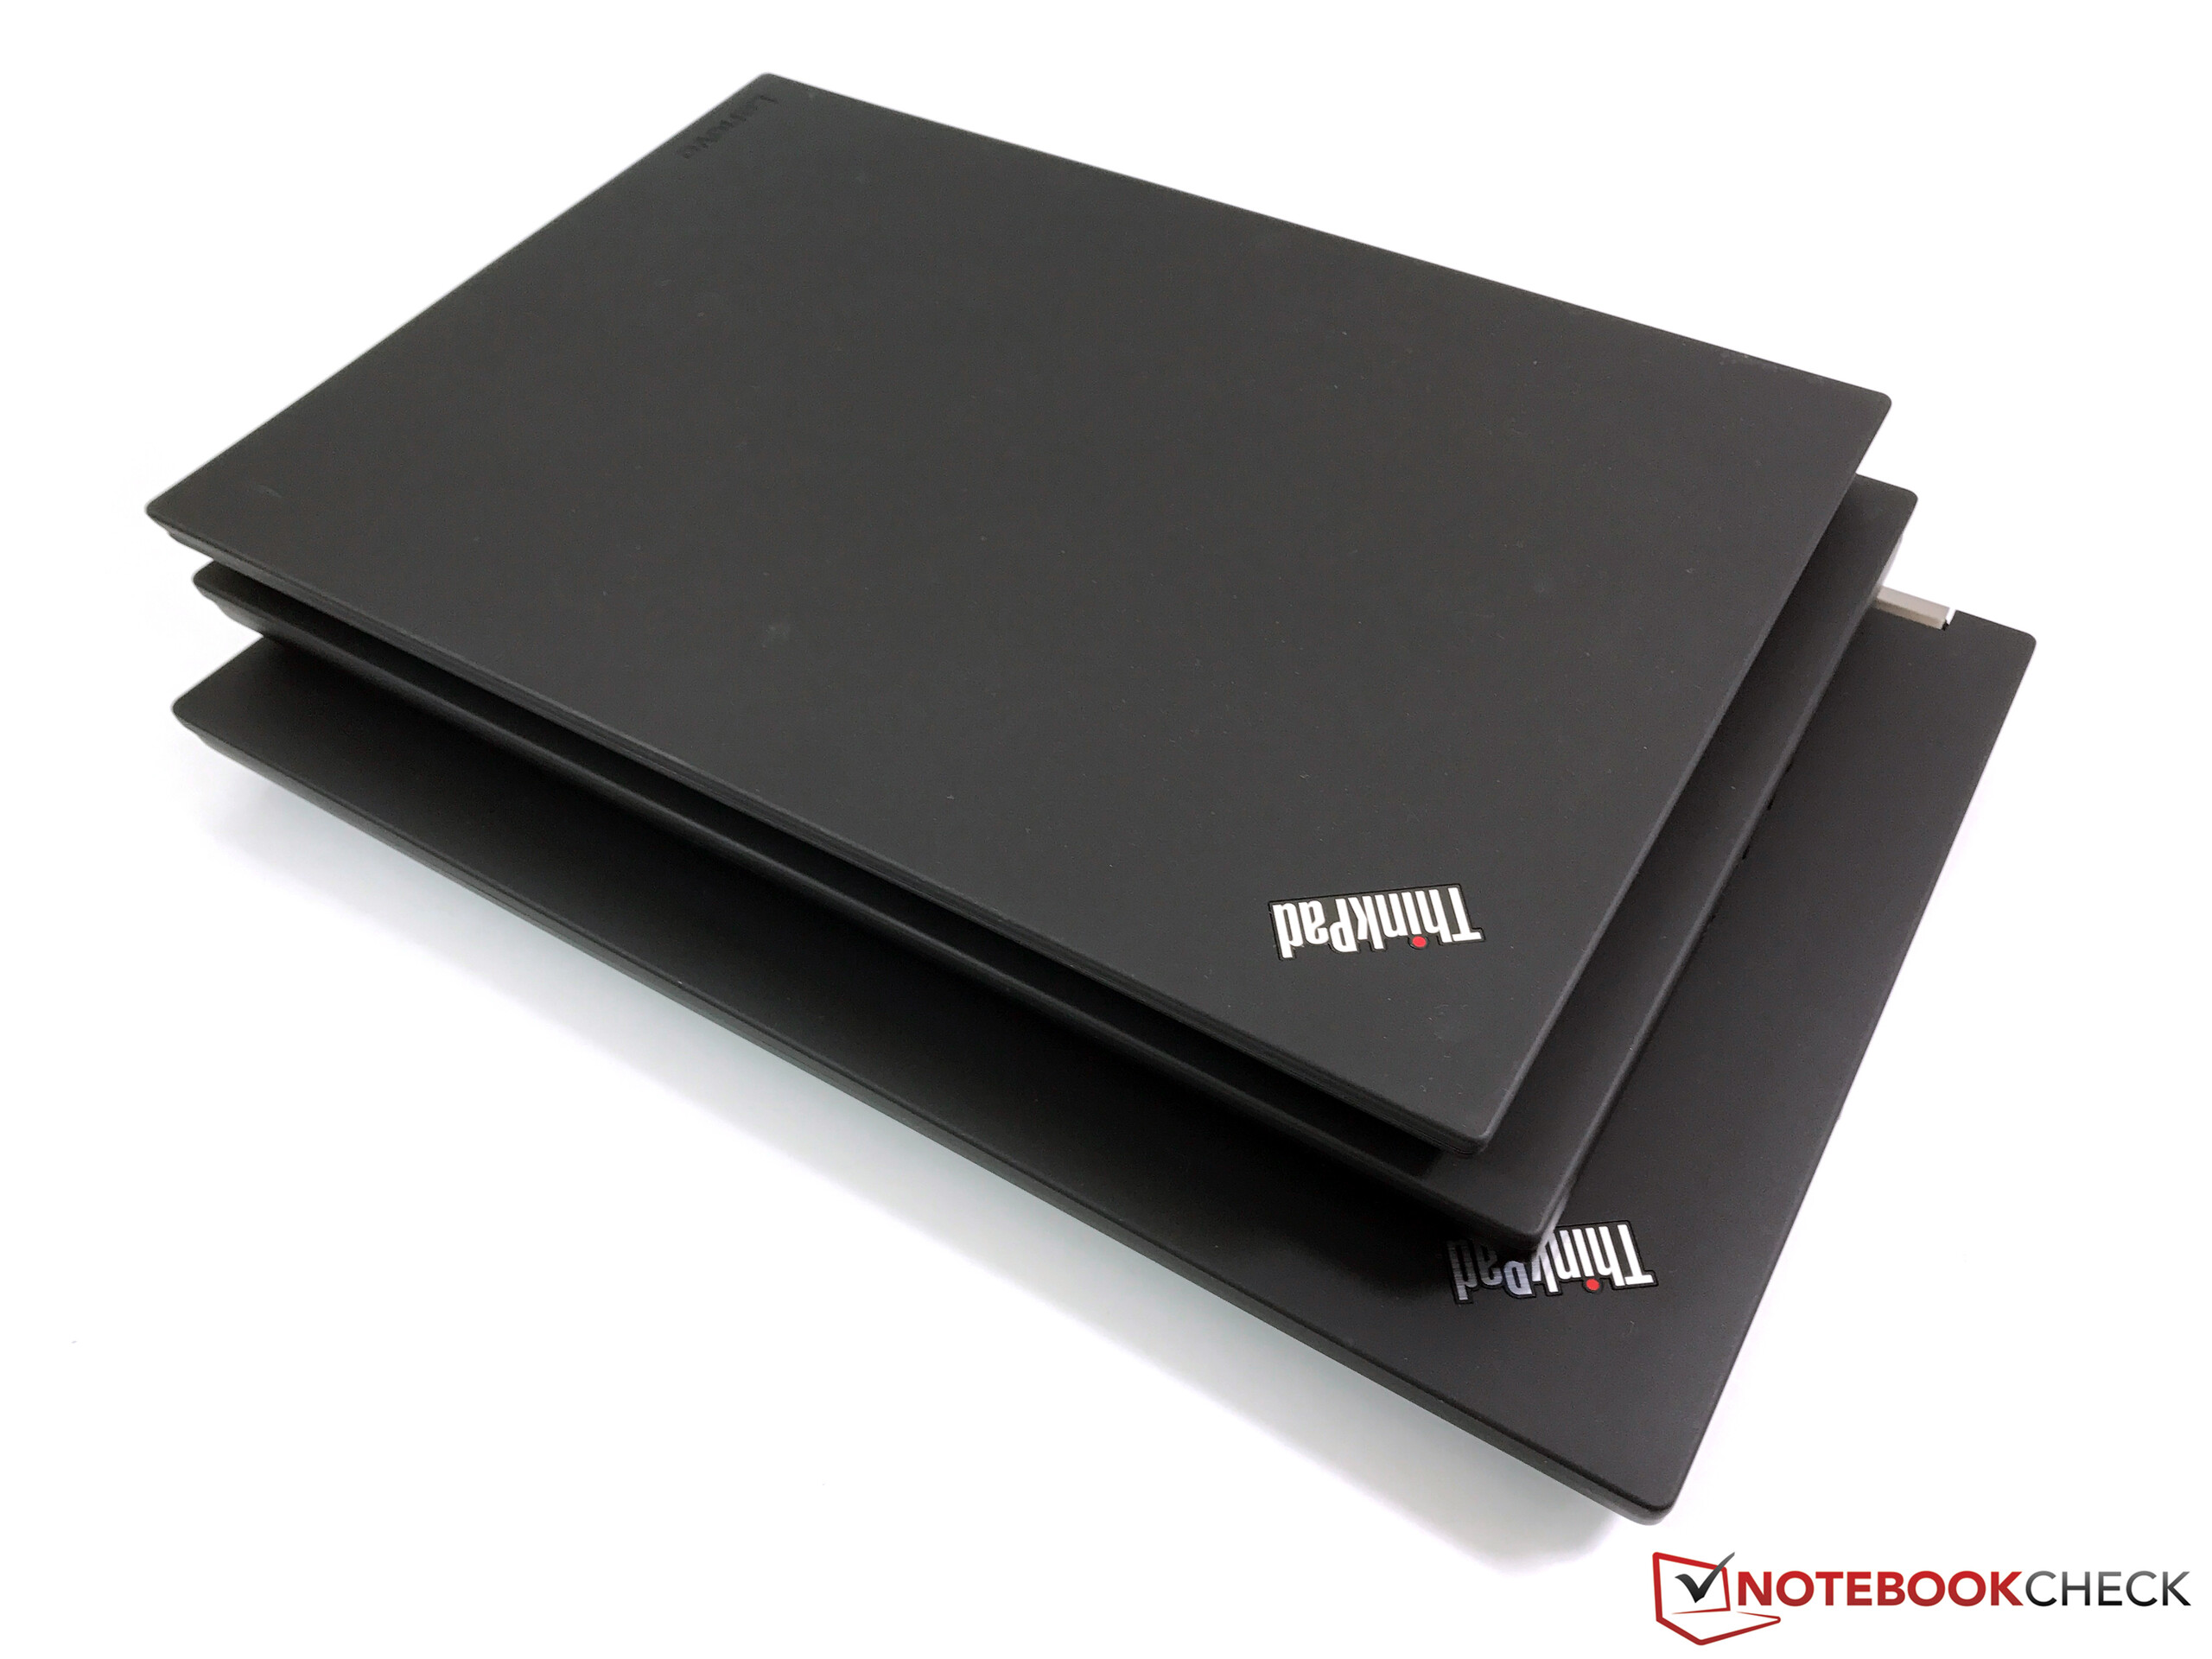
Sammantaget levererar Lenovo ändå en mycket bra maskin som de kommande konkurrenterna från Dell & HP kommer att få anstränga sig för att utmana.
Lenovo ThinkPad P51 20HH0016GE
- 06/18/2017 v6 (old)
Andreas Osthoff
Price comparison
