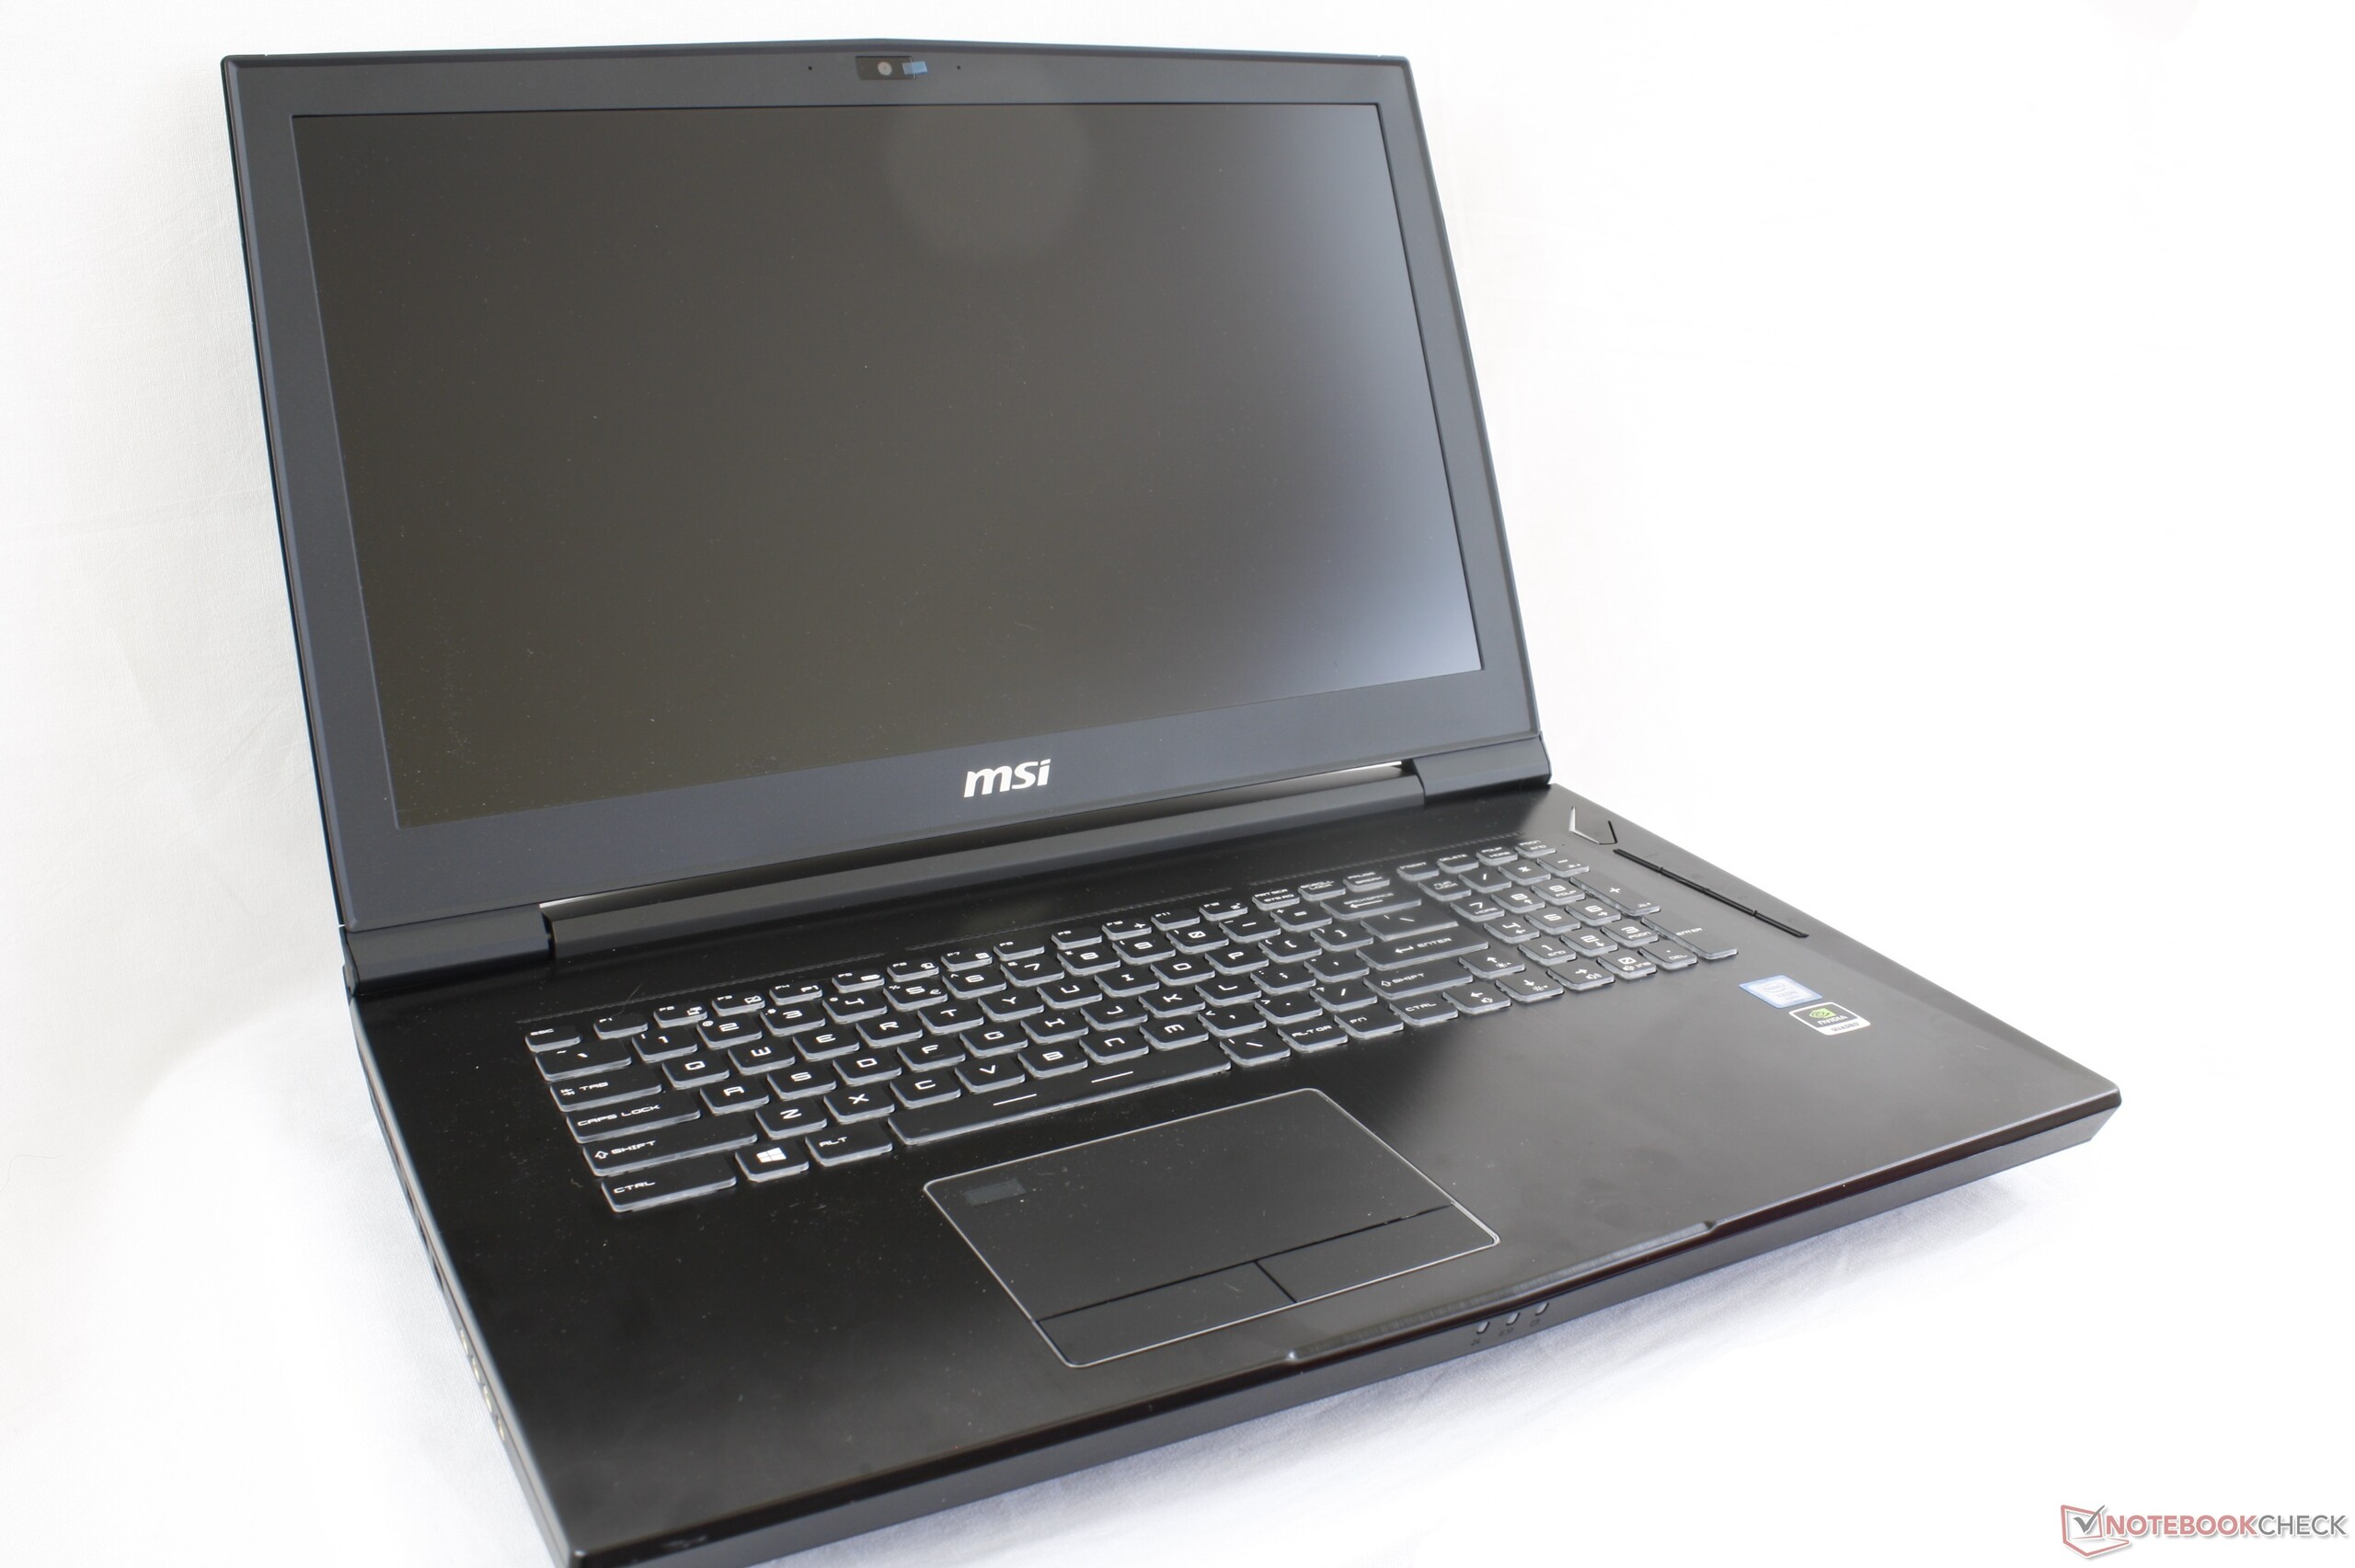
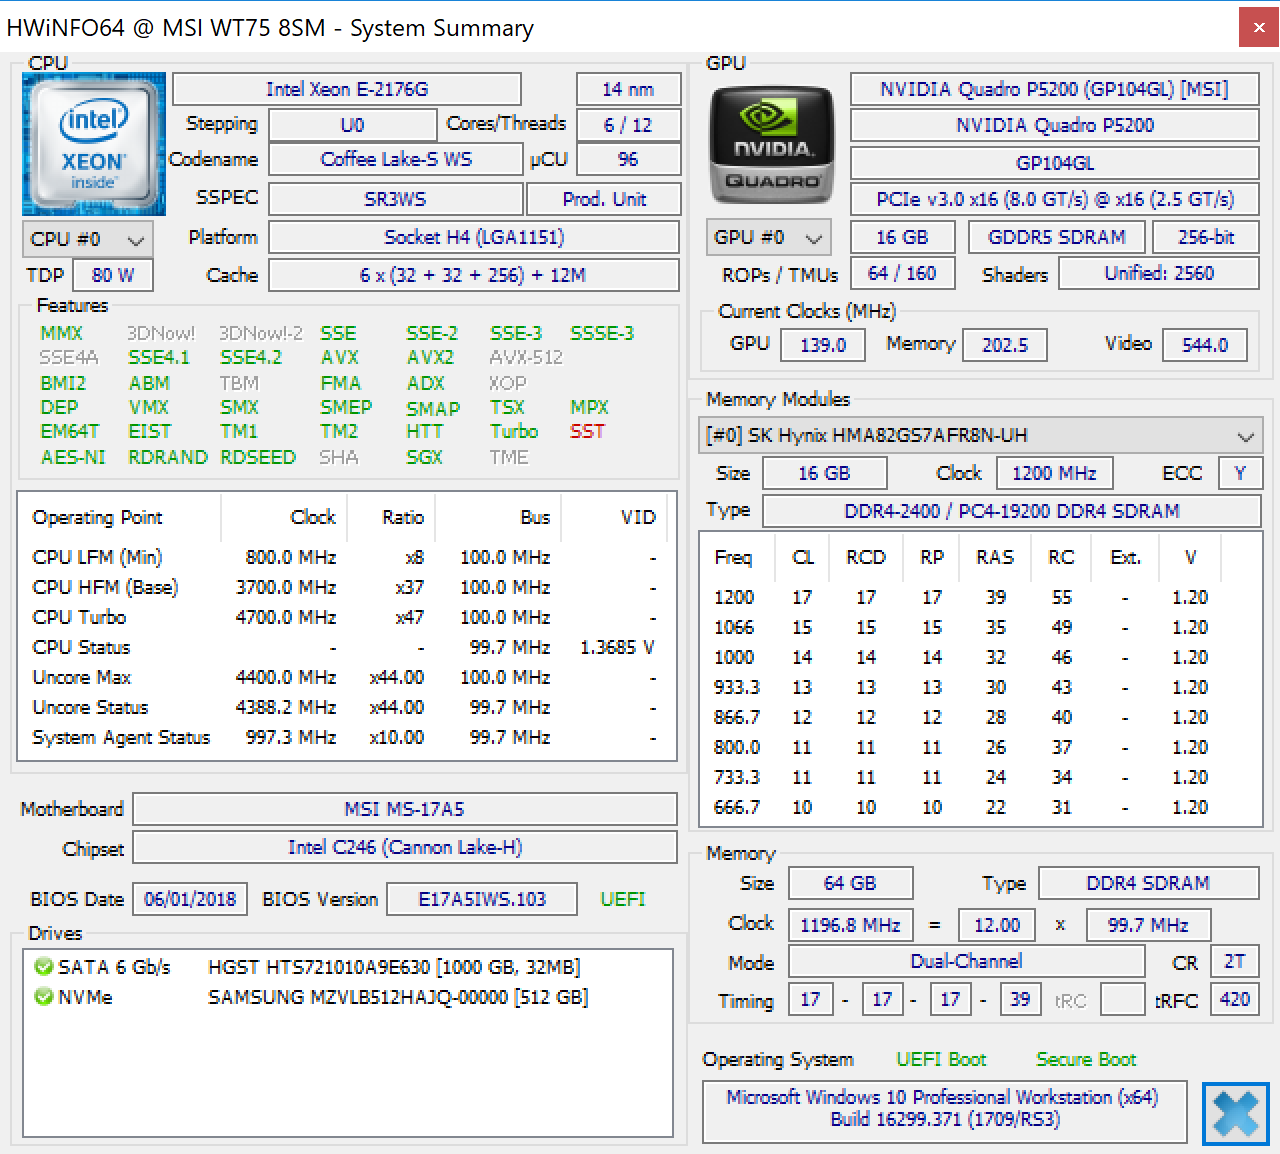
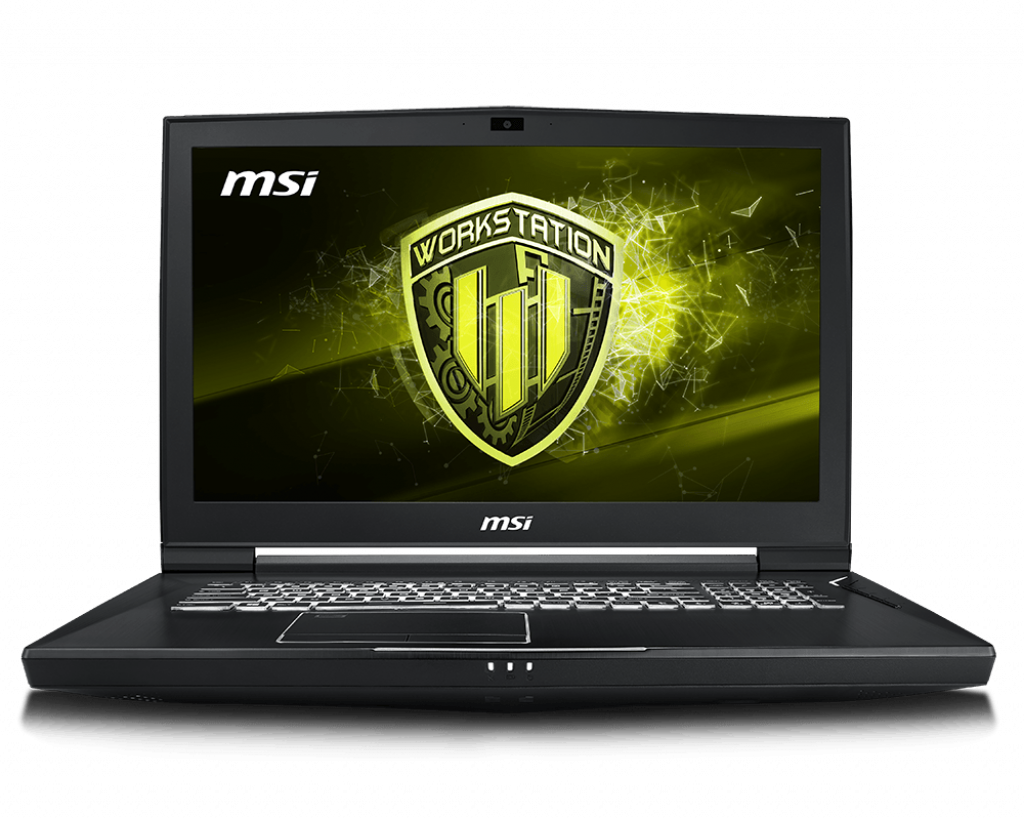
Test: MSI WT75 8SM (Xeon E-2176G, Quadro P5200) Arbetsstation (Sammanfattning)
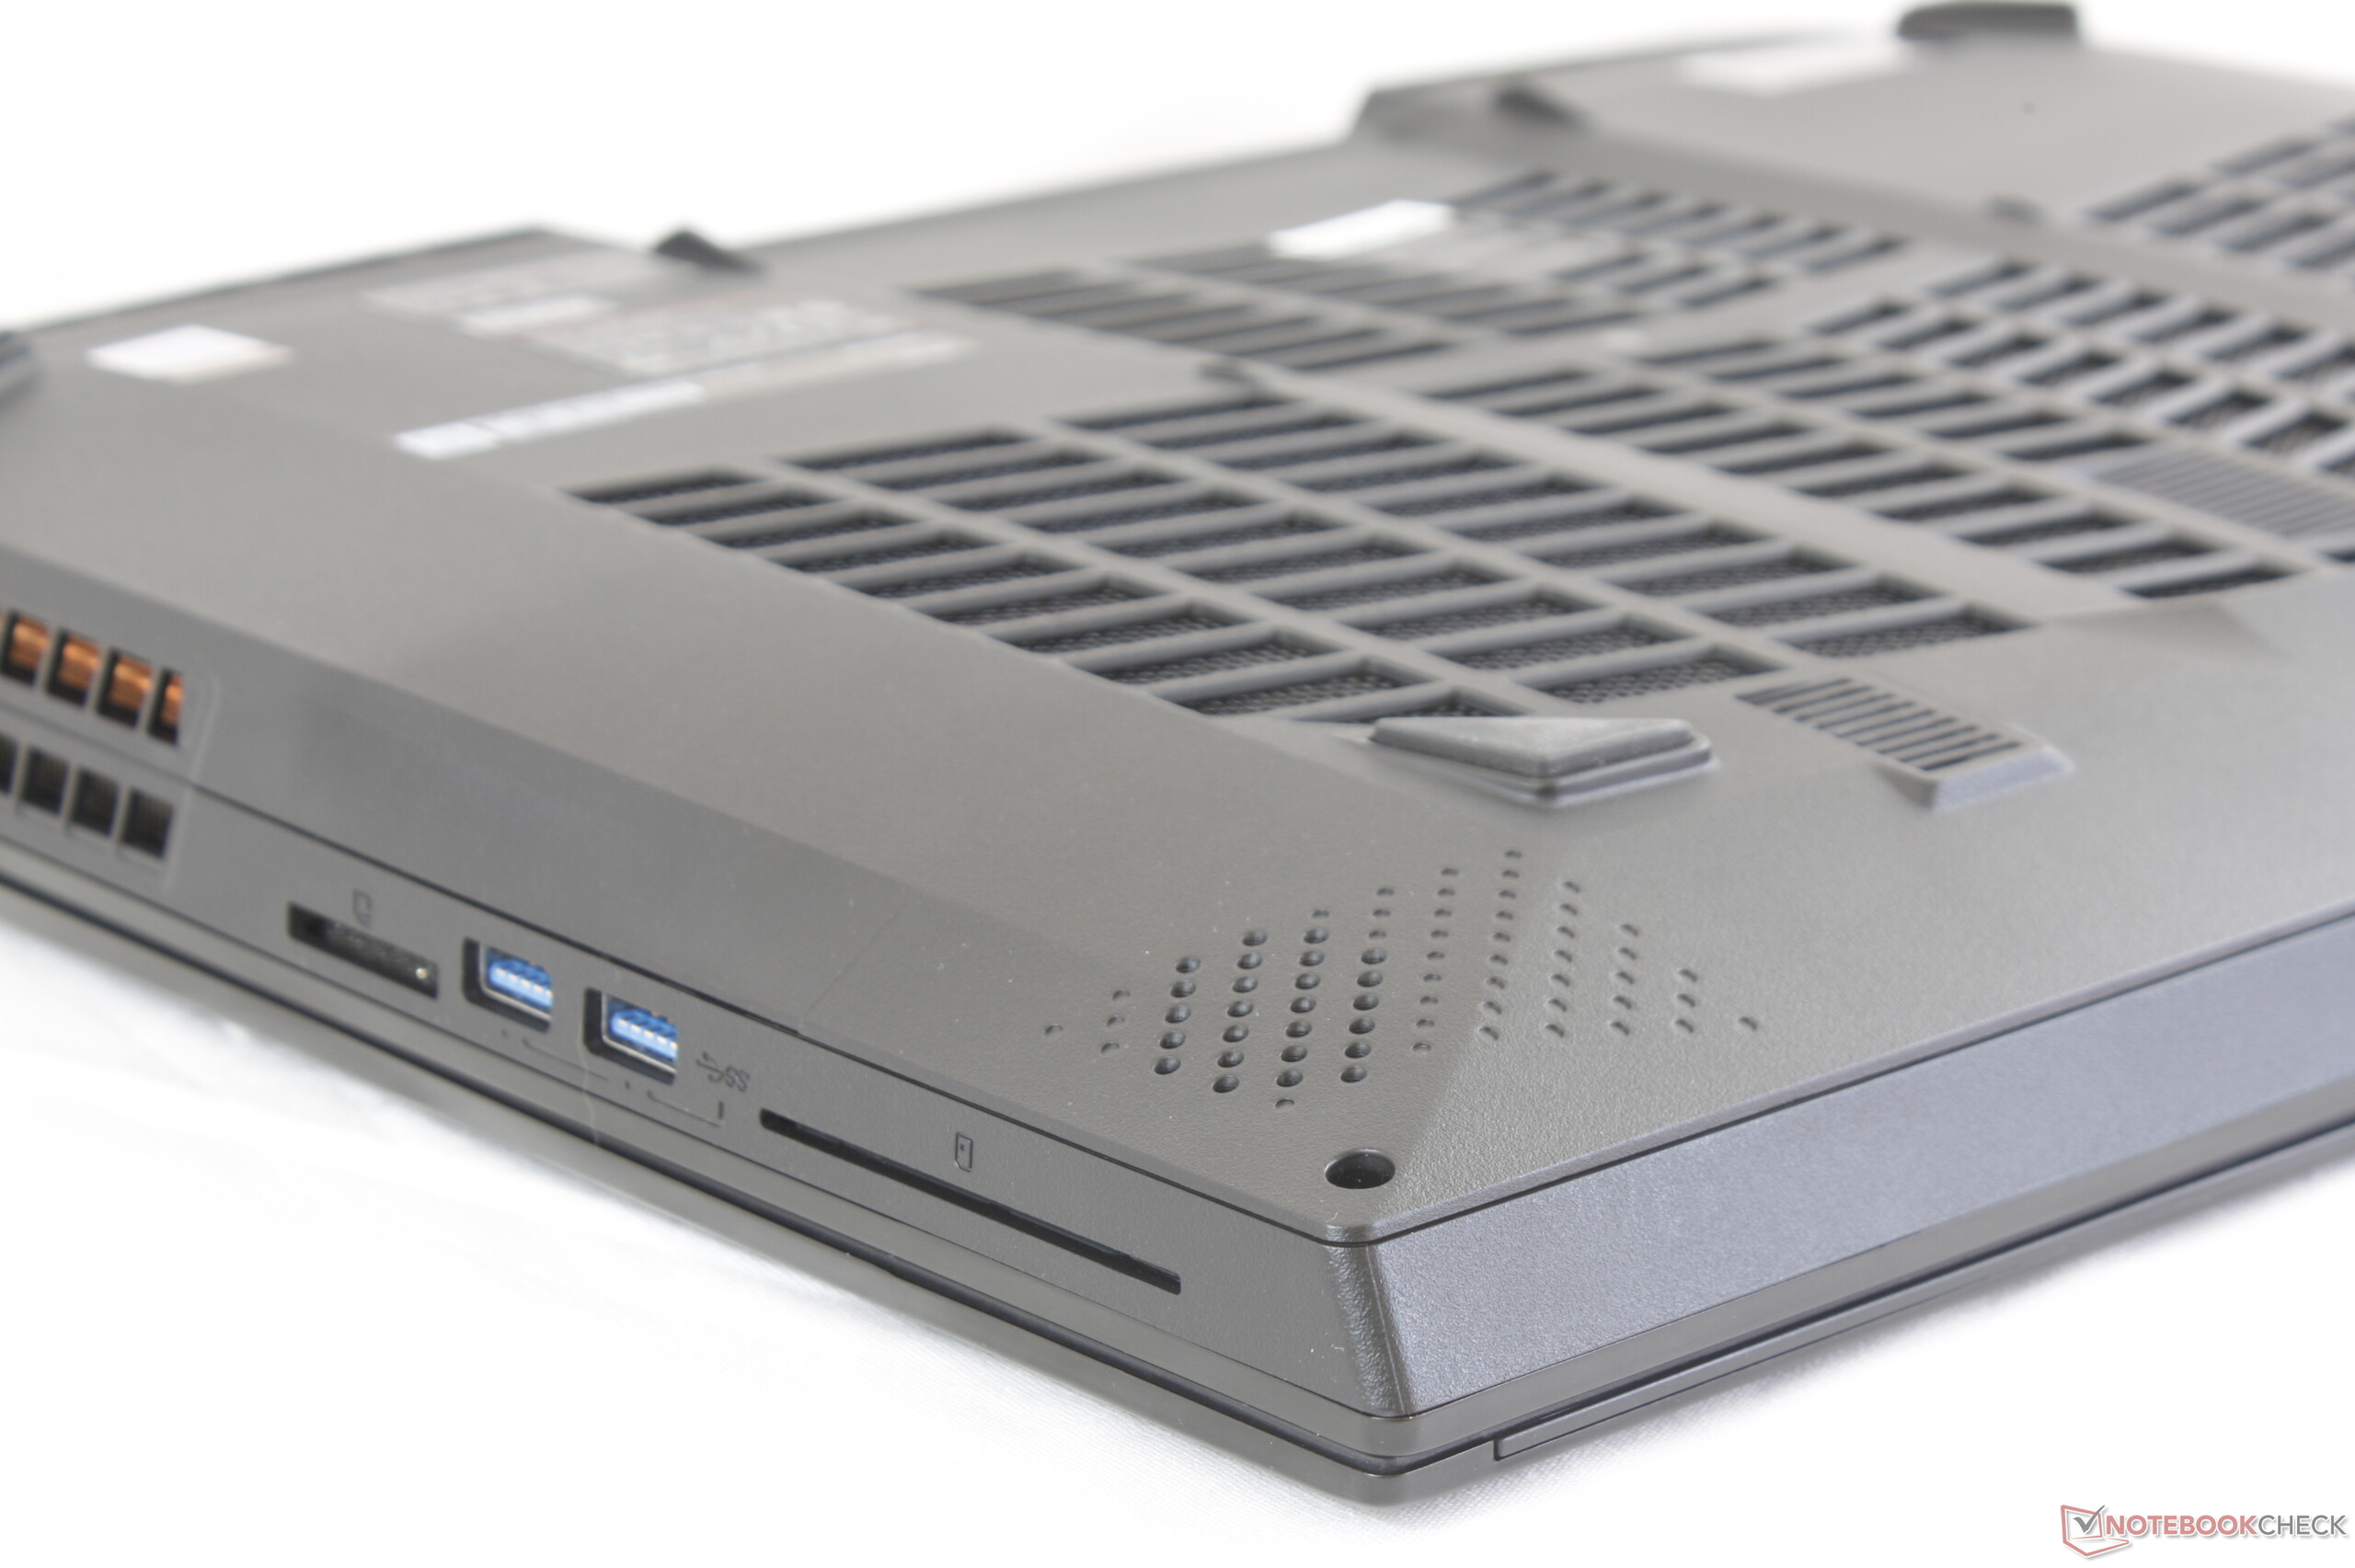
| SD Card Reader | |
| average JPG Copy Test (av. of 3 runs) | |
| Gigabyte Aero 15-Y9 (Toshiba Exceria Pro SDXC 64 GB UHS-II) | |
| Eurocom Tornado F7W (Toshiba Exceria Pro SDXC 64 GB UHS-II) | |
| MSI WT75 8SM (Toshiba Exceria Pro SDXC 64 GB UHS-II) | |
| Lenovo ThinkPad P72-20MB000EGE (Toshiba Exceria Pro SDXC 64 GB UHS-II) | |
| Fujitsu Celsius H980 (Toshiba Exceria Pro SDXC 64 GB UHS-II) | |
| maximum AS SSD Seq Read Test (1GB) | |
| Gigabyte Aero 15-Y9 (Toshiba Exceria Pro SDXC 64 GB UHS-II) | |
| Lenovo ThinkPad P72-20MB000EGE (Toshiba Exceria Pro SDXC 64 GB UHS-II) | |
| Eurocom Tornado F7W (Toshiba Exceria Pro SDXC 64 GB UHS-II) | |
| MSI WT75 8SM (Toshiba Exceria Pro SDXC 64 GB UHS-II) | |
| Fujitsu Celsius H980 (Toshiba Exceria Pro SDXC 64 GB UHS-II) | |
| Networking | |
| iperf3 transmit AX12 | |
| Fujitsu Celsius H980 | |
| Lenovo ThinkPad P72-20MB000EGE | |
| Dell Precision 7720 | |
| MSI WT75 8SM | |
| iperf3 receive AX12 | |
| Fujitsu Celsius H980 | |
| Lenovo ThinkPad P72-20MB000EGE | |
| MSI WT75 8SM | |
| Dell Precision 7720 | |
| |||||||||||||||||||||||||
Distribution av ljusstyrkan: 88 %
Mitt på batteriet: 327.9 cd/m²
Kontrast: 763:1 (Svärta: 0.43 cd/m²)
ΔE ColorChecker Calman: 4.41 | ∀{0.5-29.43 Ø4.72}
calibrated: 1.43
ΔE Greyscale Calman: 2.9 | ∀{0.09-98 Ø4.97}
99% sRGB (Argyll 1.6.3 3D)
84.2% AdobeRGB 1998 (Argyll 1.6.3 3D)
95.3% AdobeRGB 1998 (Argyll 3D)
98.3% sRGB (Argyll 3D)
80.8% Display P3 (Argyll 3D)
Gamma: 2.17
CCT: 6916 K
| MSI WT75 8SM AU Optronics B173ZAN01.0, IPS, 17.3", 3840x2160 | Fujitsu Celsius H980 LG Philips, LP173WF4-SPF5, IPS, 17.3", 1920x1080 | Eurocom Tornado F7W AU Optronics B173ZAN01.0, IPS, 17.3", 3840x2160 | Dell Precision 7720 SHP1446 (LQ173D1), IGZO, 17.3", 3840x2160 | Lenovo ThinkPad P72-20MB000EGE LP173WF4_SPF7, IPS, 17.3", 1920x1080 | MSI WT72-6QM LG Philips LP173WF4-SPF1, IPS, 17.3", 1920x1080 | |
|---|---|---|---|---|---|---|
| Display | -22% | 4% | 5% | -22% | -21% | |
| Display P3 Coverage (%) | 80.8 | 67.3 -17% | 85.9 6% | 87.6 8% | 67.4 -17% | 67.3 -17% |
| sRGB Coverage (%) | 98.3 | 85 -14% | 100 2% | 100 2% | 85 -14% | 85.4 -13% |
| AdobeRGB 1998 Coverage (%) | 95.3 | 62.2 -35% | 98.3 3% | 99.2 4% | 62.2 -35% | 62.5 -34% |
| Response Times | 0% | -19% | -77% | -15% | -11% | |
| Response Time Grey 50% / Grey 80% * (ms) | 36 ? | 38 ? -6% | 40 ? -11% | 60 ? -67% | 40.8 ? -13% | 42 ? -17% |
| Response Time Black / White * (ms) | 24.8 ? | 23.2 ? 6% | 31.6 ? -27% | 46.4 ? -87% | 28.8 ? -16% | 26 ? -5% |
| PWM Frequency (Hz) | 120500 ? | 1020 ? | 86 ? | |||
| Screen | -25% | -28% | 14% | -8% | -19% | |
| Brightness middle (cd/m²) | 327.9 | 400 22% | 328.2 0% | 464 42% | 338 3% | 303 -8% |
| Brightness (cd/m²) | 311 | 394 27% | 310 0% | 441 42% | 317 2% | 298 -4% |
| Brightness Distribution (%) | 88 | 92 5% | 92 5% | 89 1% | 86 -2% | 94 7% |
| Black Level * (cd/m²) | 0.43 | 0.51 -19% | 0.37 14% | 0.45 -5% | 0.28 35% | 0.46 -7% |
| Contrast (:1) | 763 | 784 3% | 887 16% | 1031 35% | 1207 58% | 659 -14% |
| Colorchecker dE 2000 * | 4.41 | 5.3 -20% | 6.62 -50% | 3.2 27% | 4.3 2% | 5.77 -31% |
| Colorchecker dE 2000 max. * | 10.07 | 9.3 8% | 9.49 6% | 6.1 39% | 10.2 -1% | |
| Colorchecker dE 2000 calibrated * | 1.43 | 3.8 -166% | 3.93 -175% | 3.7 -159% | ||
| Greyscale dE 2000 * | 2.9 | 5.5 -90% | 6.7 -131% | 4.2 -45% | 2.2 24% | 4.87 -68% |
| Gamma | 2.17 101% | 2.17 101% | 2.44 90% | 2.01 109% | 2.17 101% | 1.99 111% |
| CCT | 6916 94% | 6686 97% | 6462 101% | 6736 96% | 6621 98% | 7363 88% |
| Color Space (Percent of AdobeRGB 1998) (%) | 84.2 | 55.8 -34% | 87.9 4% | 88.1 5% | 55.8 -34% | 56.04 -33% |
| Color Space (Percent of sRGB) (%) | 99 | 84.9 -14% | 100 1% | 100 1% | 84.7 -14% | 85.27 -14% |
| Totalt genomsnitt (program/inställningar) | -16% /
-22% | -14% /
-21% | -19% /
0% | -15% /
-11% | -17% /
-18% |
* ... mindre är bättre
Visa svarstider
| ↔ Svarstid svart till vitt | ||
|---|---|---|
| 24.8 ms ... stiga ↗ och falla ↘ kombinerat | ↗ 14.8 ms stiga | 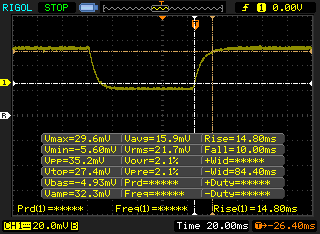 |
| ↘ 10 ms hösten | ||
| Skärmen visar bra svarsfrekvens i våra tester, men kan vara för långsam för konkurrenskraftiga spelare. I jämförelse sträcker sig alla testade enheter från 0.1 (minst) till 240 (maximalt) ms. » 58 % av alla enheter är bättre. Detta innebär att den uppmätta svarstiden är sämre än genomsnittet av alla testade enheter (19.8 ms). | ||
| ↔ Svarstid 50 % grått till 80 % grått | ||
| 36 ms ... stiga ↗ och falla ↘ kombinerat | ↗ 18.8 ms stiga | 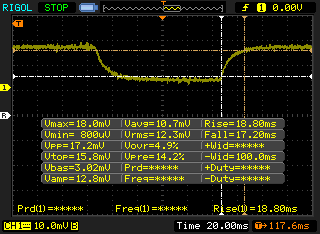 |
| ↘ 17.2 ms hösten | ||
| Skärmen visar långsamma svarsfrekvenser i våra tester och kommer att vara otillfredsställande för spelare. I jämförelse sträcker sig alla testade enheter från 0.165 (minst) till 636 (maximalt) ms. » 51 % av alla enheter är bättre. Detta innebär att den uppmätta svarstiden är sämre än genomsnittet av alla testade enheter (31 ms). | ||
Skärmflimmer / PWM (Puls-Width Modulation)
| Skärmflimmer / PWM upptäcktes inte | 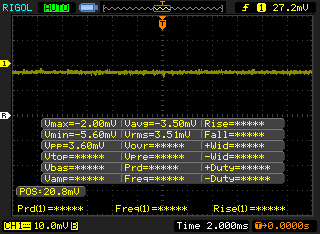 | ||
Som jämförelse: 52 % av alla testade enheter använder inte PWM för att dämpa skärmen. Om PWM upptäcktes mättes ett medelvärde av 7763 (minst: 5 - maximum: 343500) Hz. | |||
| Cinebench R15 | |
| CPU Single 64Bit | |
| Eurocom Tornado F7W | |
| Alienware Area-51m i9-9900K RTX 2080 | |
| MSI WT75 8SM | |
| Eurocom Sky X9C | |
| Schenker XMG Ultra 17 | |
| Lenovo ThinkPad P1-20MD002LUS | |
| Dell Precision 7720 | |
| Fujitsu Celsius H980 | |
| AMD Threadripper 2970WX, AMD Radeon RX Vega 64 | |
| NVIDIA Titan X Pascal | |
| MSI WT72-6QM | |
| CPU Multi 64Bit | |
| AMD Threadripper 2970WX, AMD Radeon RX Vega 64 | |
| NVIDIA Titan X Pascal | |
| Alienware Area-51m i9-9900K RTX 2080 | |
| Eurocom Tornado F7W | |
| Eurocom Sky X9C | |
| MSI WT75 8SM | |
| Schenker XMG Ultra 17 | |
| Lenovo ThinkPad P1-20MD002LUS | |
| Fujitsu Celsius H980 | |
| Dell Precision 7720 | |
| MSI WT72-6QM | |
| Cinebench R11.5 | |
| CPU Single 64Bit | |
| Eurocom Tornado F7W | |
| Eurocom Sky X9C | |
| MSI WT75 8SM | |
| Schenker XMG Ultra 17 | |
| Lenovo ThinkPad P1-20MD002LUS | |
| Fujitsu Celsius H980 | |
| AMD Threadripper 2970WX, AMD Radeon RX Vega 64 | |
| MSI WT72-6QM | |
| NVIDIA Titan X Pascal | |
| CPU Multi 64Bit | |
| NVIDIA Titan X Pascal | |
| AMD Threadripper 2970WX, AMD Radeon RX Vega 64 | |
| Eurocom Tornado F7W | |
| Eurocom Sky X9C | |
| MSI WT75 8SM | |
| Schenker XMG Ultra 17 | |
| Fujitsu Celsius H980 | |
| Lenovo ThinkPad P1-20MD002LUS | |
| MSI WT72-6QM | |
| Cinebench R10 | |
| Rendering Multiple CPUs 32Bit | |
| Lenovo ThinkPad P1-20MD002LUS | |
| NVIDIA Titan X Pascal | |
| Eurocom Sky X9C | |
| MSI WT75 8SM | |
| AMD Threadripper 2970WX, AMD Radeon RX Vega 64 | |
| Eurocom Tornado F7W | |
| Fujitsu Celsius H980 | |
| Schenker XMG Ultra 17 | |
| MSI WT72-6QM | |
| Rendering Single 32Bit | |
| Lenovo ThinkPad P1-20MD002LUS | |
| Eurocom Tornado F7W | |
| Eurocom Sky X9C | |
| MSI WT75 8SM | |
| Schenker XMG Ultra 17 | |
| Fujitsu Celsius H980 | |
| MSI WT72-6QM | |
| AMD Threadripper 2970WX, AMD Radeon RX Vega 64 | |
| NVIDIA Titan X Pascal | |
| wPrime 2.10 - 1024m | |
| MSI WT75 8SM | |
| Eurocom Sky X9C | |
| Eurocom Tornado F7W | |
| NVIDIA Titan X Pascal | |
| AMD Threadripper 2970WX, AMD Radeon RX Vega 64 | |
* ... mindre är bättre
| PCMark 10 | |
| Score | |
| Alienware Area-51m i9-9900K RTX 2080 | |
| MSI WT75 8SM | |
| Lenovo ThinkPad P72-20MB000EGE | |
| Dell Precision 7720 | |
| Fujitsu Celsius H980 | |
| Essentials | |
| Alienware Area-51m i9-9900K RTX 2080 | |
| MSI WT75 8SM | |
| Lenovo ThinkPad P72-20MB000EGE | |
| Dell Precision 7720 | |
| Fujitsu Celsius H980 | |
| Productivity | |
| Alienware Area-51m i9-9900K RTX 2080 | |
| MSI WT75 8SM | |
| Dell Precision 7720 | |
| Lenovo ThinkPad P72-20MB000EGE | |
| Fujitsu Celsius H980 | |
| Digital Content Creation | |
| Alienware Area-51m i9-9900K RTX 2080 | |
| MSI WT75 8SM | |
| Fujitsu Celsius H980 | |
| Dell Precision 7720 | |
| Lenovo ThinkPad P72-20MB000EGE | |
| PCMark 8 | |
| Home Score Accelerated v2 | |
| Alienware Area-51m i9-9900K RTX 2080 | |
| MSI WT75 8SM | |
| Lenovo ThinkPad P72-20MB000EGE | |
| Fujitsu Celsius H980 | |
| Dell Precision 7720 | |
| Work Score Accelerated v2 | |
| Alienware Area-51m i9-9900K RTX 2080 | |
| Lenovo ThinkPad P72-20MB000EGE | |
| Fujitsu Celsius H980 | |
| MSI WT75 8SM | |
| Dell Precision 7720 | |
| PCMark 8 Home Score Accelerated v2 | 5006 poäng | |
| PCMark 8 Work Score Accelerated v2 | 4930 poäng | |
| PCMark 10 Score | 6208 poäng | |
Hjälp | ||
| MSI WT75 8SM Samsung SSD PM981 MZVLB512HAJQ | Alienware Area-51m i9-9900K RTX 2080 2x SK Hynix PC400 512GB (RAID 0) | Fujitsu Celsius H980 Samsung SSD PM981 MZVLB512HAJQ | Eurocom Tornado F7W 3x Samsung SSD 970 Pro 512GB (RAID 0) | MSI WT72-6QM Toshiba NVMe THNSN5256GPU7 | |
|---|---|---|---|---|---|
| AS SSD | -11% | -6% | 0% | -30% | |
| Seq Read (MB/s) | 1839 | 2082 13% | 1082 -41% | 2139 16% | 2638 43% |
| Seq Write (MB/s) | 1831 | 2335 28% | 1781 -3% | 2447 34% | 810 -56% |
| 4K Read (MB/s) | 47.89 | 24.14 -50% | 46.09 -4% | 29.7 -38% | 37.5 -22% |
| 4K Write (MB/s) | 105.8 | 91.8 -13% | 100.4 -5% | 102.5 -3% | 96.4 -9% |
| 4K-64 Read (MB/s) | 1162 | 1561 34% | 1209 4% | 1299 12% | 935 -20% |
| 4K-64 Write (MB/s) | 1743 | 1350 -23% | 1622 -7% | 1236 -29% | 473.5 -73% |
| Access Time Read * (ms) | 0.057 | 0.121 -112% | 0.053 7% | 0.045 21% | 0.092 -61% |
| Access Time Write * (ms) | 0.035 | 0.039 -11% | 0.037 -6% | 0.033 6% | 0.04 -14% |
| Score Read (Points) | 1394 | 1793 29% | 1363 -2% | 1543 11% | 1237 -11% |
| Score Write (Points) | 2032 | 1675 -18% | 1901 -6% | 1583 -22% | 651 -68% |
| Score Total (Points) | 4146 | 4390 6% | 4003 -3% | 3928 -5% | 2433 -41% |
| Copy ISO MB/s (MB/s) | 2175 | 1396 | 2320 | 1777 | |
| Copy Program MB/s (MB/s) | 582 | 354.3 | 621 | 554 | |
| Copy Game MB/s (MB/s) | 1479 | 691 | 1585 | 1025 |
* ... mindre är bättre

| 3DMark 11 | |
| 1280x720 Performance GPU | |
| Alienware Area-51m i9-9900K RTX 2080 | |
| MSI GT75VR 7RF-012 Titan Pro | |
| AMD Threadripper 2970WX, AMD Radeon RX Vega 64 | |
| NVIDIA Titan X Pascal | |
| MSI GS75 8SG Stealth | |
| MSI WT75 8SM | |
| Eurocom Tornado F7W | |
| Dell Precision 7720 | |
| Fujitsu Celsius H980 | |
| MSI WT72-6QM | |
| Dell Precision 5530 2-in-1 | |
| Lenovo ThinkPad P1-20MD002LUS | |
| 1280x720 Performance Combined | |
| Alienware Area-51m i9-9900K RTX 2080 | |
| Eurocom Tornado F7W | |
| MSI WT75 8SM | |
| NVIDIA Titan X Pascal | |
| Fujitsu Celsius H980 | |
| MSI GS75 8SG Stealth | |
| Dell Precision 7720 | |
| MSI GT75VR 7RF-012 Titan Pro | |
| AMD Threadripper 2970WX, AMD Radeon RX Vega 64 | |
| MSI WT72-6QM | |
| Dell Precision 5530 2-in-1 | |
| Lenovo ThinkPad P1-20MD002LUS | |
| 3DMark 11 Performance | 21204 poäng | |
| 3DMark Cloud Gate Standard Score | 39077 poäng | |
| 3DMark Fire Strike Score | 16528 poäng | |
| 3DMark Time Spy Score | 6580 poäng | |
Hjälp | ||
| The Witcher 3 - 1920x1080 Ultra Graphics & Postprocessing (HBAO+) | |
| Eurocom Sky X9C | |
| Alienware Area-51m i9-9900K RTX 2080 | |
| AMD Threadripper 2970WX, AMD Radeon RX Vega 64 | |
| MSI GT75VR 7RF-012 Titan Pro | |
| MSI GS75 8SG Stealth | |
| MSI WT75 8SM | |
| Eurocom Tornado F7W | |
| Dell Precision 7720 | |
| Lenovo ThinkPad P72-20MB000EGE | |
| Lenovo ThinkPad P1-20MD002LUS | |
| Dell Precision 5530 2-in-1 | |
| MSI WT72-6QJ | |
| låg | med. | hög | ultra | 4K | |
|---|---|---|---|---|---|
| BioShock Infinite (2013) | 395 | 341.6 | 315.1 | ||
| The Witcher 3 (2015) | 327.2 | 228.7 | 120.2 | 66.7 | 47.2 |
| Rise of the Tomb Raider (2016) | 289 | 220.6 | 125.5 | 105.2 | 46.6 |
| MSI WT75 8SM Quadro P5200, E-2176G, Samsung SSD PM981 MZVLB512HAJQ | Alienware Area-51m i9-9900K RTX 2080 GeForce RTX 2080 Mobile, i9-9900K, 2x SK Hynix PC400 512GB (RAID 0) | Fujitsu Celsius H980 Quadro P3200, i7-8750H, Samsung SSD PM981 MZVLB512HAJQ | Eurocom Tornado F7W Quadro P5200, i9-9900K, 3x Samsung SSD 970 Pro 512GB (RAID 0) | Dell Precision 7720 Quadro P5000, E3-1535M v6, Toshiba NVMe THNSN5512GPU7 | MSI WT72-6QM Quadro M5000M, E3-1505M v5, Toshiba NVMe THNSN5256GPU7 | |
|---|---|---|---|---|---|---|
| Noise | -7% | 6% | -5% | 11% | 4% | |
| av / miljö * (dB) | 28.6 | 28.1 2% | 29.6 -3% | 28.2 1% | 29.5 -3% | |
| Idle Minimum * (dB) | 33.4 | 28.1 16% | 29.6 11% | 33.2 1% | 29.5 12% | 33.3 -0% |
| Idle Average * (dB) | 33.4 | 28.6 14% | 32.5 3% | 33.2 1% | 29.5 12% | 33.4 -0% |
| Idle Maximum * (dB) | 33.4 | 51 -53% | 32.5 3% | 33.2 1% | 29.5 12% | 33.5 -0% |
| Load Average * (dB) | 33.5 | 51 -52% | 34.9 -4% | 47 -40% | 35 -4% | 38.8 -16% |
| Witcher 3 ultra * (dB) | 51.4 | 51 1% | 52.2 -2% | 41 20% | ||
| Load Maximum * (dB) | 64 | 51 20% | 49.1 23% | 64 -0% | 47.8 25% | 40.2 37% |
* ... mindre är bättre
Ljudnivå
| Låg belastning |
| 33.4 / 33.4 / 33.4 dB(A) |
| Hög belastning |
| 33.5 / 64 dB(A) |
 | ||
30 dB tyst 40 dB(A) hörbar 50 dB(A) högt ljud |
||
min: | ||
(+) Den maximala temperaturen på ovansidan är 39.2 °C / 103 F, jämfört med genomsnittet av 38.2 °C / 101 F , allt från 22.2 till 69.8 °C för klassen Workstation.
(-) Botten värms upp till maximalt 49.2 °C / 121 F, jämfört med genomsnittet av 41.1 °C / 106 F
(+) Vid tomgångsbruk är medeltemperaturen för ovansidan 28.9 °C / 84 F, jämfört med enhetsgenomsnittet på 32 °C / ### class_avg_f### F.
(+) När du spelar The Witcher 3 är medeltemperaturen för ovansidan 28.1 °C / 83 F, jämfört med enhetsgenomsnittet på 32 °C / ## #class_avg_f### F.
(+) Handledsstöden och pekplattan är kallare än hudtemperaturen med maximalt 27.4 °C / 81.3 F och är därför svala att ta på.
(±) Medeltemperaturen för handledsstödsområdet på liknande enheter var 27.8 °C / 82 F (+0.4 °C / 0.7 F).
MSI WT75 8SM ljudanalys
(±) | högtalarljudstyrkan är genomsnittlig men bra (81.3 dB)
Bas 100 - 315 Hz
(±) | reducerad bas - i genomsnitt 11.7% lägre än medianen
(±) | linjäriteten för basen är genomsnittlig (10.1% delta till föregående frekvens)
Mellan 400 - 2000 Hz
(+) | balanserad mellan - endast 4% från medianen
(±) | linjäriteten för mids är genomsnittlig (7.8% delta till föregående frekvens)
Högsta 2 - 16 kHz
(±) | högre toppar - i genomsnitt 6.1% högre än medianen
(±) | linjäriteten för toppar är genomsnittlig (7.6% delta till föregående frekvens)
Totalt 100 - 16 000 Hz
(±) | linjäriteten för det totala ljudet är genomsnittlig (18.3% skillnad mot median)
Jämfört med samma klass
» 60% av alla testade enheter i den här klassen var bättre, 10% liknande, 30% sämre
» Den bästa hade ett delta på 7%, genomsnittet var 17%, sämst var 35%
Jämfört med alla testade enheter
» 40% av alla testade enheter var bättre, 8% liknande, 52% sämre
» Den bästa hade ett delta på 4%, genomsnittet var 23%, sämst var 134%
Apple MacBook 12 (Early 2016) 1.1 GHz ljudanalys
(+) | högtalare kan spela relativt högt (83.6 dB)
Bas 100 - 315 Hz
(±) | reducerad bas - i genomsnitt 11.3% lägre än medianen
(±) | linjäriteten för basen är genomsnittlig (14.2% delta till föregående frekvens)
Mellan 400 - 2000 Hz
(+) | balanserad mellan - endast 2.4% från medianen
(+) | mids är linjära (5.5% delta till föregående frekvens)
Högsta 2 - 16 kHz
(+) | balanserade toppar - endast 2% från medianen
(+) | toppar är linjära (4.5% delta till föregående frekvens)
Totalt 100 - 16 000 Hz
(+) | det totala ljudet är linjärt (10.2% skillnad mot median)
Jämfört med samma klass
» 7% av alla testade enheter i den här klassen var bättre, 2% liknande, 91% sämre
» Den bästa hade ett delta på 5%, genomsnittet var 18%, sämst var 53%
Jämfört med alla testade enheter
» 5% av alla testade enheter var bättre, 1% liknande, 94% sämre
» Den bästa hade ett delta på 4%, genomsnittet var 23%, sämst var 134%
| Av/Standby | |
| Låg belastning | |
| Hög belastning |
|
Förklaring:
min: | |
| MSI WT75 8SM E-2176G, Quadro P5200, Samsung SSD PM981 MZVLB512HAJQ, IPS, 3840x2160, 17.3" | Alienware Area-51m i9-9900K RTX 2080 i9-9900K, GeForce RTX 2080 Mobile, 2x SK Hynix PC400 512GB (RAID 0), IPS, 1920x1080, 17.3" | Fujitsu Celsius H980 i7-8750H, Quadro P3200, Samsung SSD PM981 MZVLB512HAJQ, IPS, 1920x1080, 17.3" | Eurocom Tornado F7W i9-9900K, Quadro P5200, 3x Samsung SSD 970 Pro 512GB (RAID 0), IPS, 3840x2160, 17.3" | Dell Precision 7720 E3-1535M v6, Quadro P5000, Toshiba NVMe THNSN5512GPU7, IGZO, 3840x2160, 17.3" | MSI WT72-6QM E3-1505M v5, Quadro M5000M, Toshiba NVMe THNSN5256GPU7, IPS, 1920x1080, 17.3" | |
|---|---|---|---|---|---|---|
| Power Consumption | -9% | 39% | -0% | 43% | 23% | |
| Idle Minimum * (Watt) | 29 | 23.3 20% | 14.8 49% | 28.5 2% | 9.6 67% | 24.8 14% |
| Idle Average * (Watt) | 37.1 | 33.5 10% | 20.4 45% | 36.7 1% | 20.5 45% | 29.7 20% |
| Idle Maximum * (Watt) | 39.5 | 38.4 3% | 21.5 46% | 37.8 4% | 22.9 42% | 30.1 24% |
| Load Average * (Watt) | 133.6 | 114.1 15% | 98.4 26% | 144.6 -8% | 96.8 28% | 105.2 21% |
| Witcher 3 ultra * (Watt) | 236.3 | 339.5 -44% | 218.9 7% | |||
| Load Maximum * (Watt) | 310 | 485.1 -56% | 213.5 31% | 336 -8% | 202.1 35% | 192.2 38% |
* ... mindre är bättre
| MSI WT75 8SM E-2176G, Quadro P5200, 90 Wh | Alienware Area-51m i9-9900K RTX 2080 i9-9900K, GeForce RTX 2080 Mobile, 90 Wh | Fujitsu Celsius H980 i7-8750H, Quadro P3200, 96 Wh | Eurocom Tornado F7W i9-9900K, Quadro P5200, 90 Wh | Dell Precision 7720 E3-1535M v6, Quadro P5000, 91 Wh | MSI WT72-6QM E3-1505M v5, Quadro M5000M, Wh | |
|---|---|---|---|---|---|---|
| Batteridrifttid | -29% | 126% | -19% | 85% | 31% | |
| Reader / Idle (h) | 4 | 2.6 -35% | 13.5 238% | 11.4 185% | 6.9 73% | |
| WiFi v1.3 (h) | 3.7 | 2.1 -43% | 8.3 124% | 3 -19% | 6.3 70% | 4.1 11% |
| Load (h) | 1.2 | 1.1 -8% | 1.4 17% | 1.2 0% | 1.3 8% |
För
Emot
Läs den fullständiga versionen av den här recensionen på engelska här.
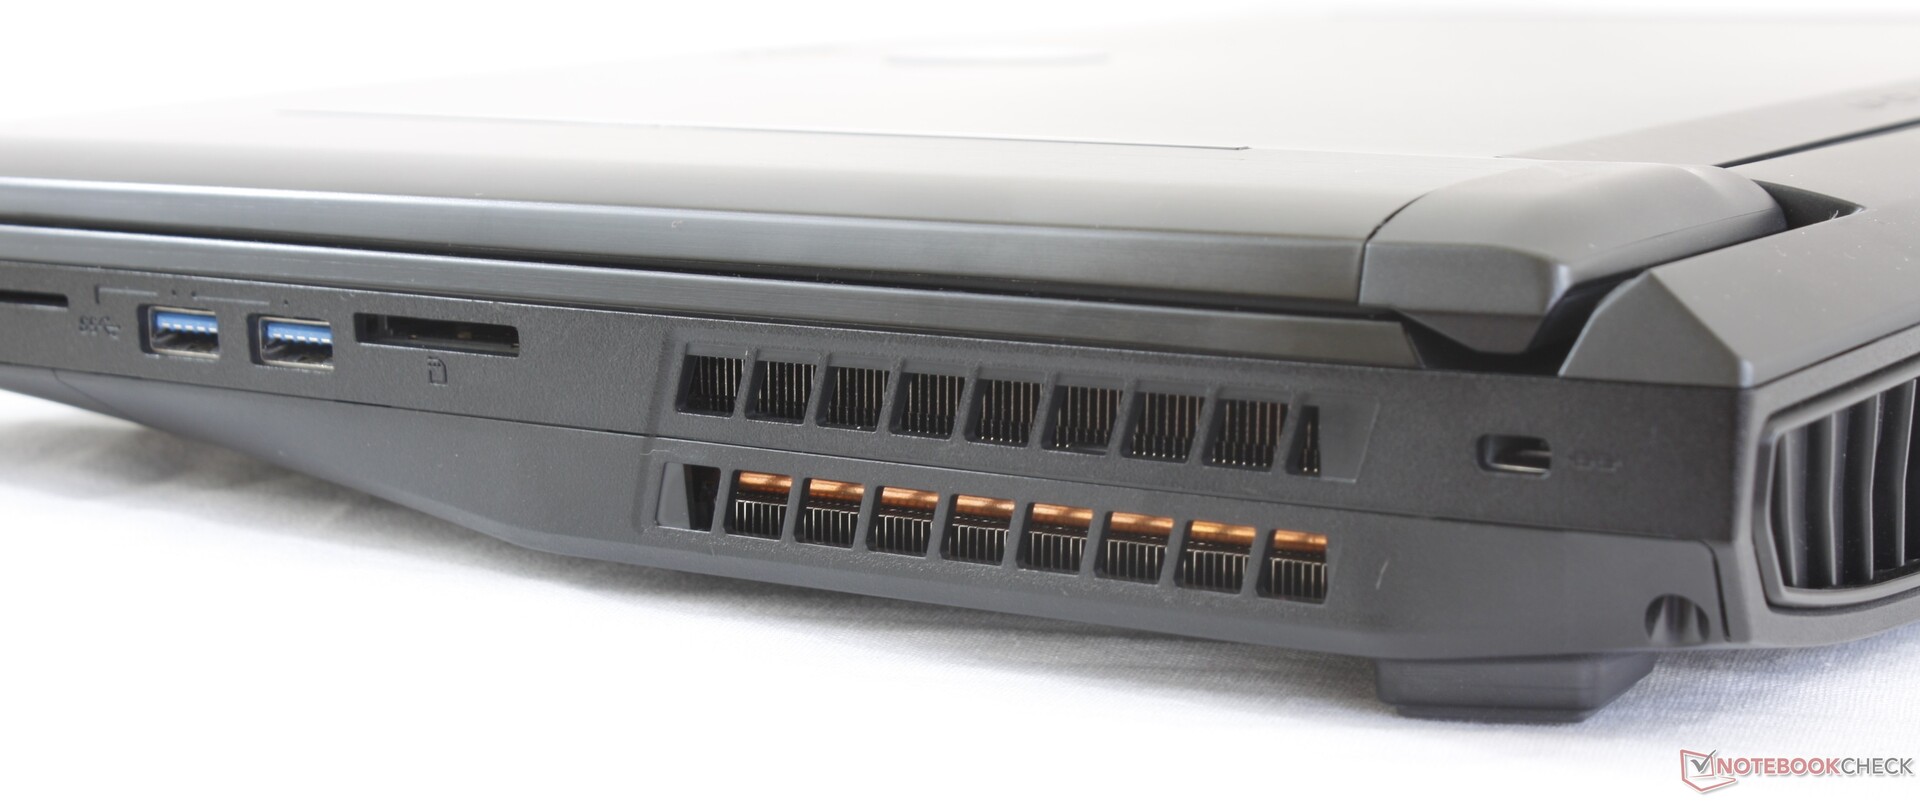
Den största anledningen att ha en MSI WT75 istället för någon annan bärbar arbetsstation är att den är lätt att utföra service på. Fem lagringsplatser, fyra SODIMM-platser och löstagbar CPU och GPU gör den mer uthållig jämfört med den "fastare" naturen hos Lenovos, HP:s och Dells lösningar. Om du planerar att mecka en del med din arbetsstation så kommer WT75 att passa bra.
Prestandan är bra med resonabla kärntemperaturer på ~80 C och ingen strypning sker när den ligger under 100 procent belastning. Det är dock synd att Xeon-processorn inte kan köras i Turbo Boost-klockfrekvenser under längre stunder. Utgå från att processorn bara kommer att ligga en aning över sin basklockfrekvens vid extrem beräkningsstress.
Garantin är ytterligare en faktor som är värd att överväga. MSI kan inte riktigt matcha det breda utbudet av garanti- och servicealternativ som erbjuds av Lenovos ThinkPad P-serie, HP ZBook eller Dell Precision, då dessa har en fördel tack vare sin stora ekonomiska skala. Återigen, du bör känna dig bekväm med att utföra din egen service på WT75 om så krävs.
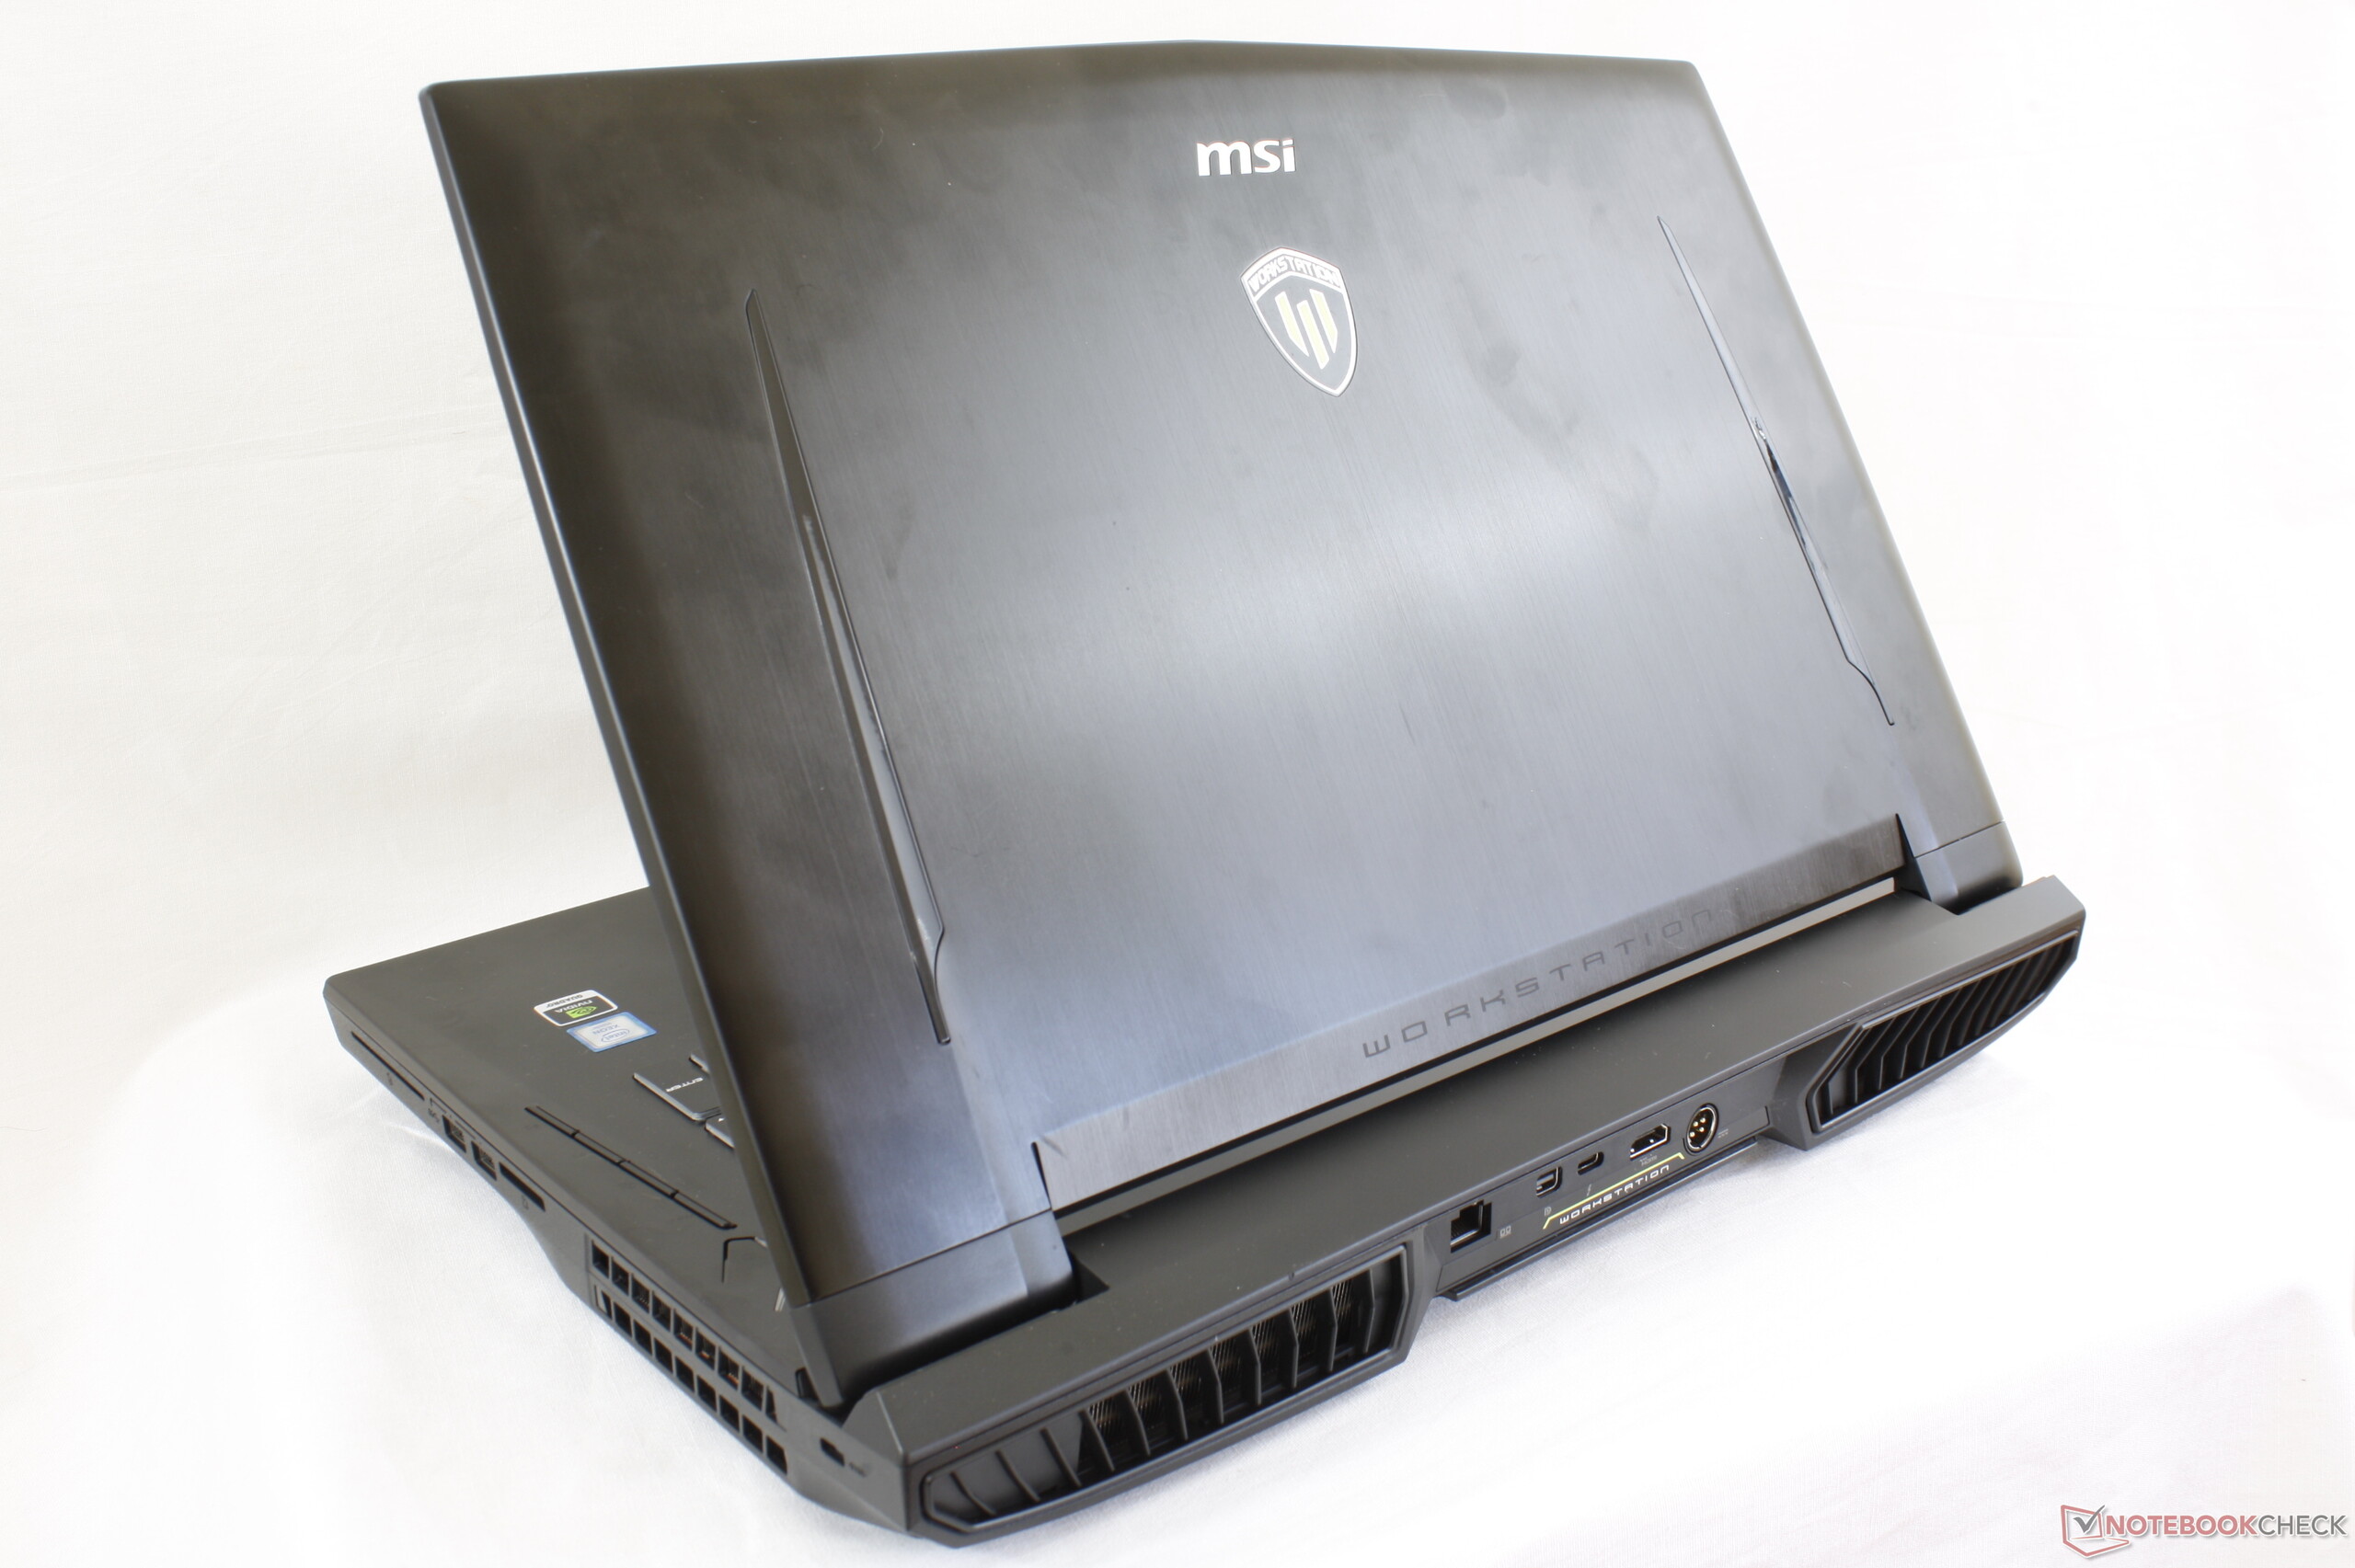
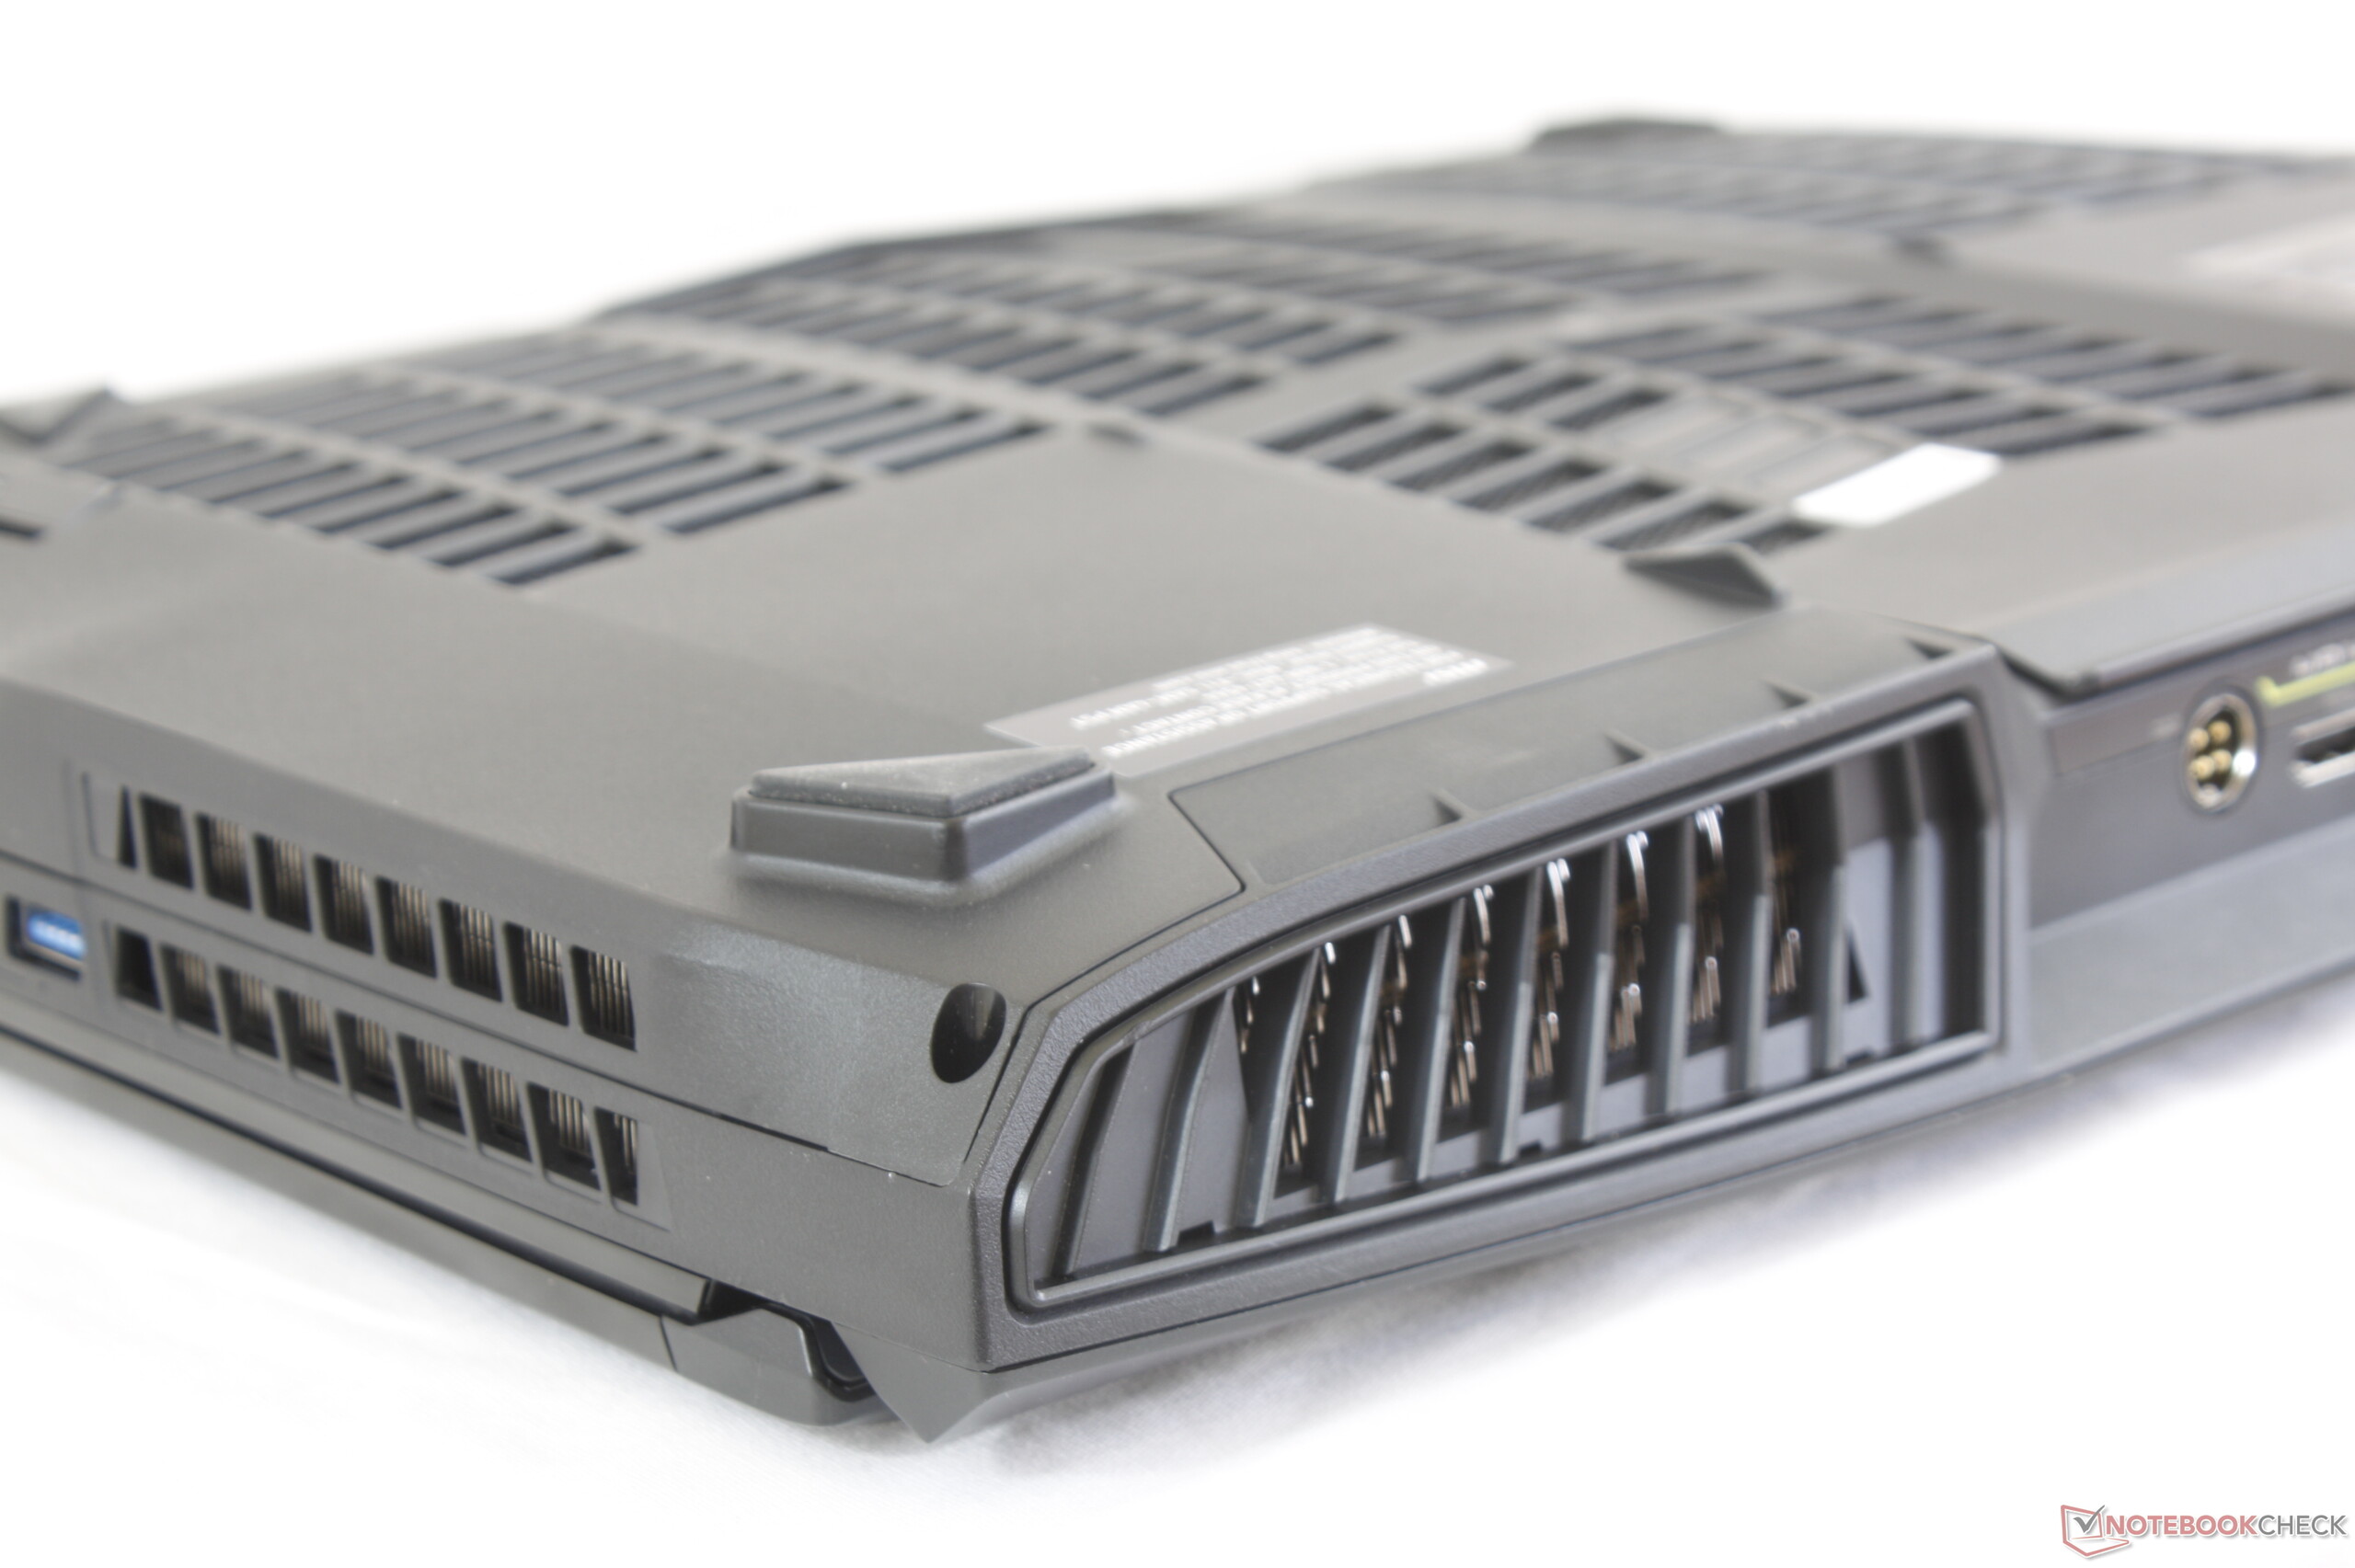
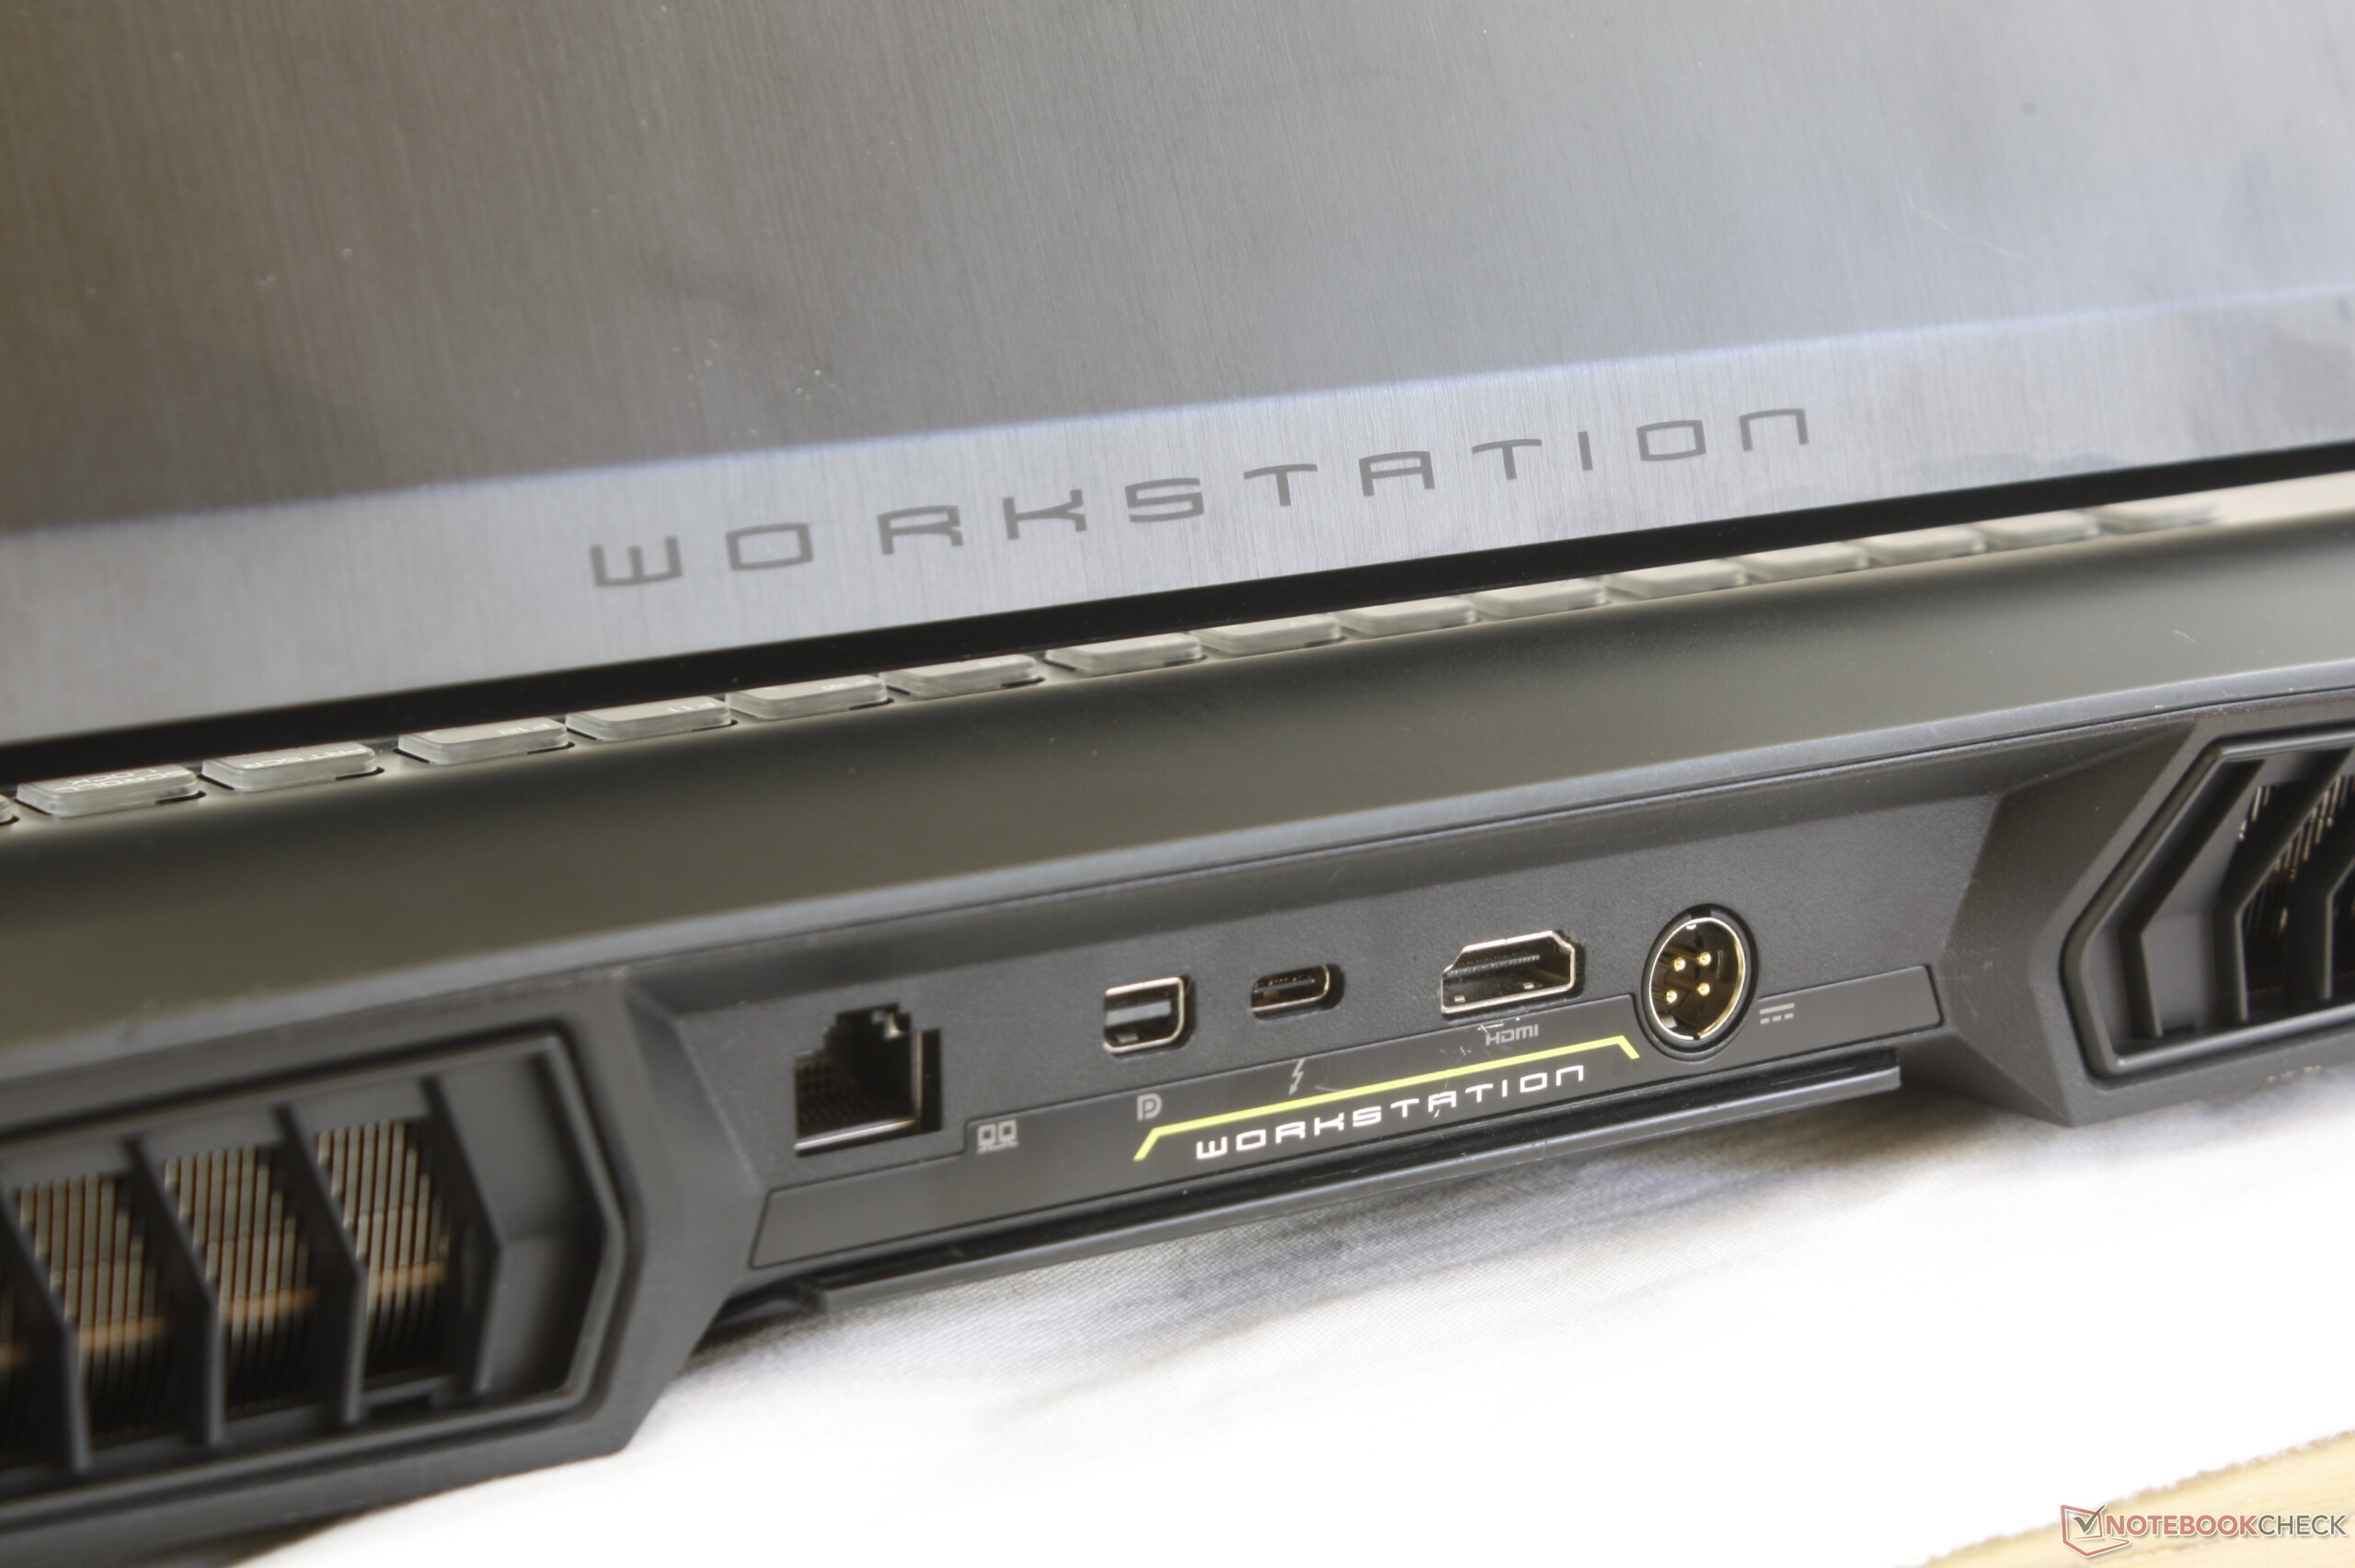
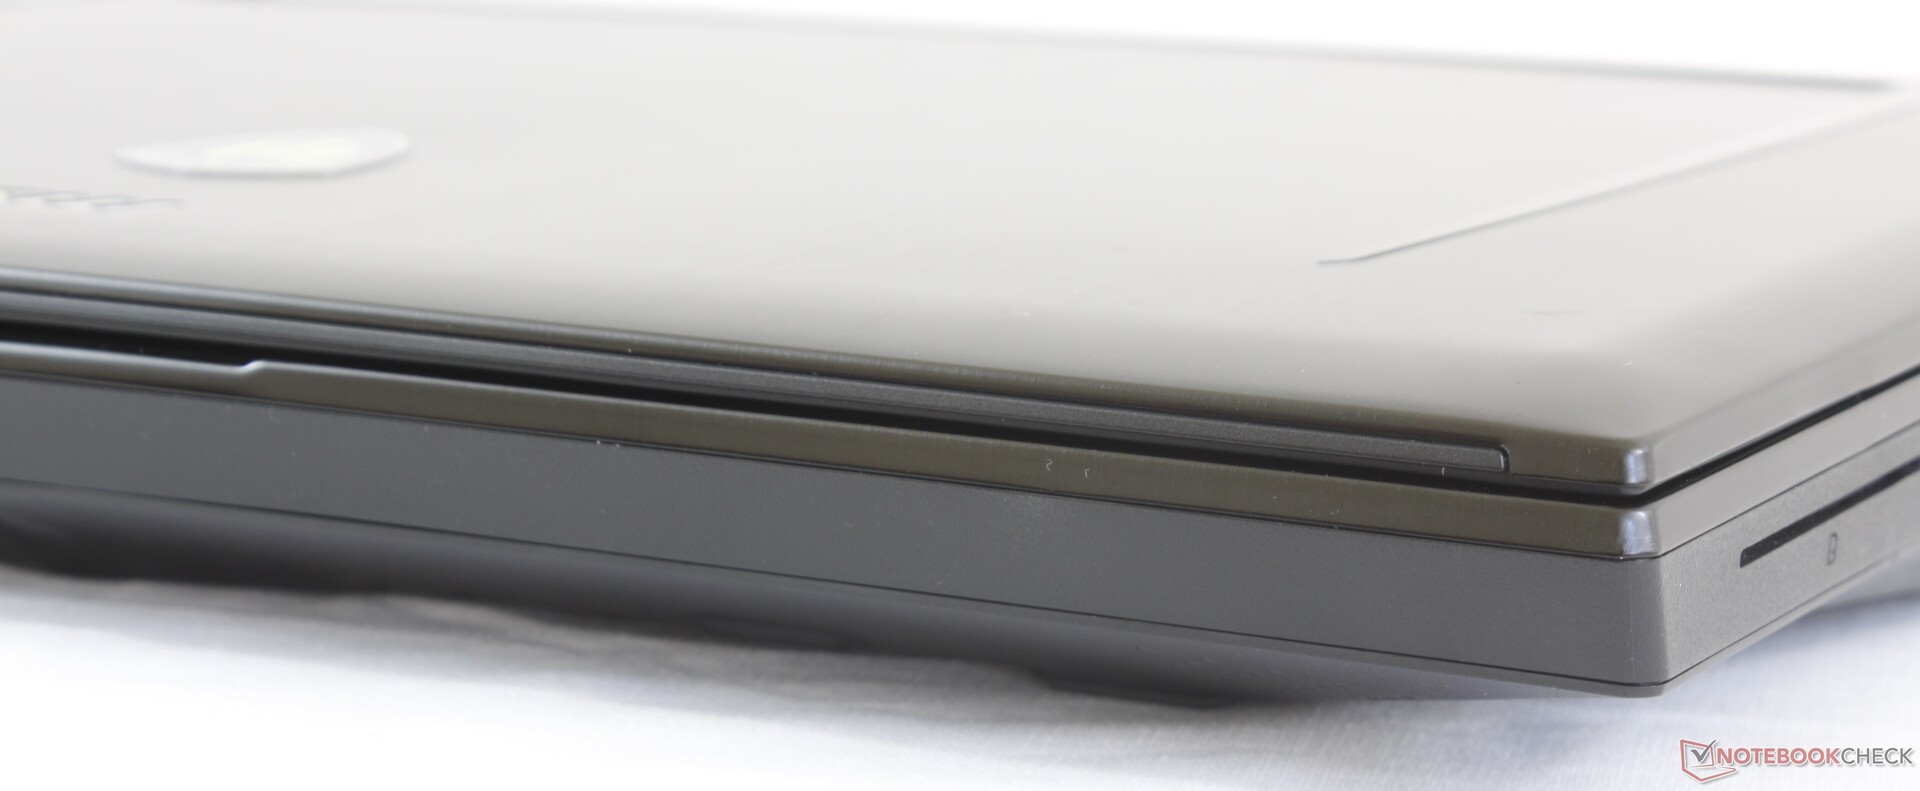
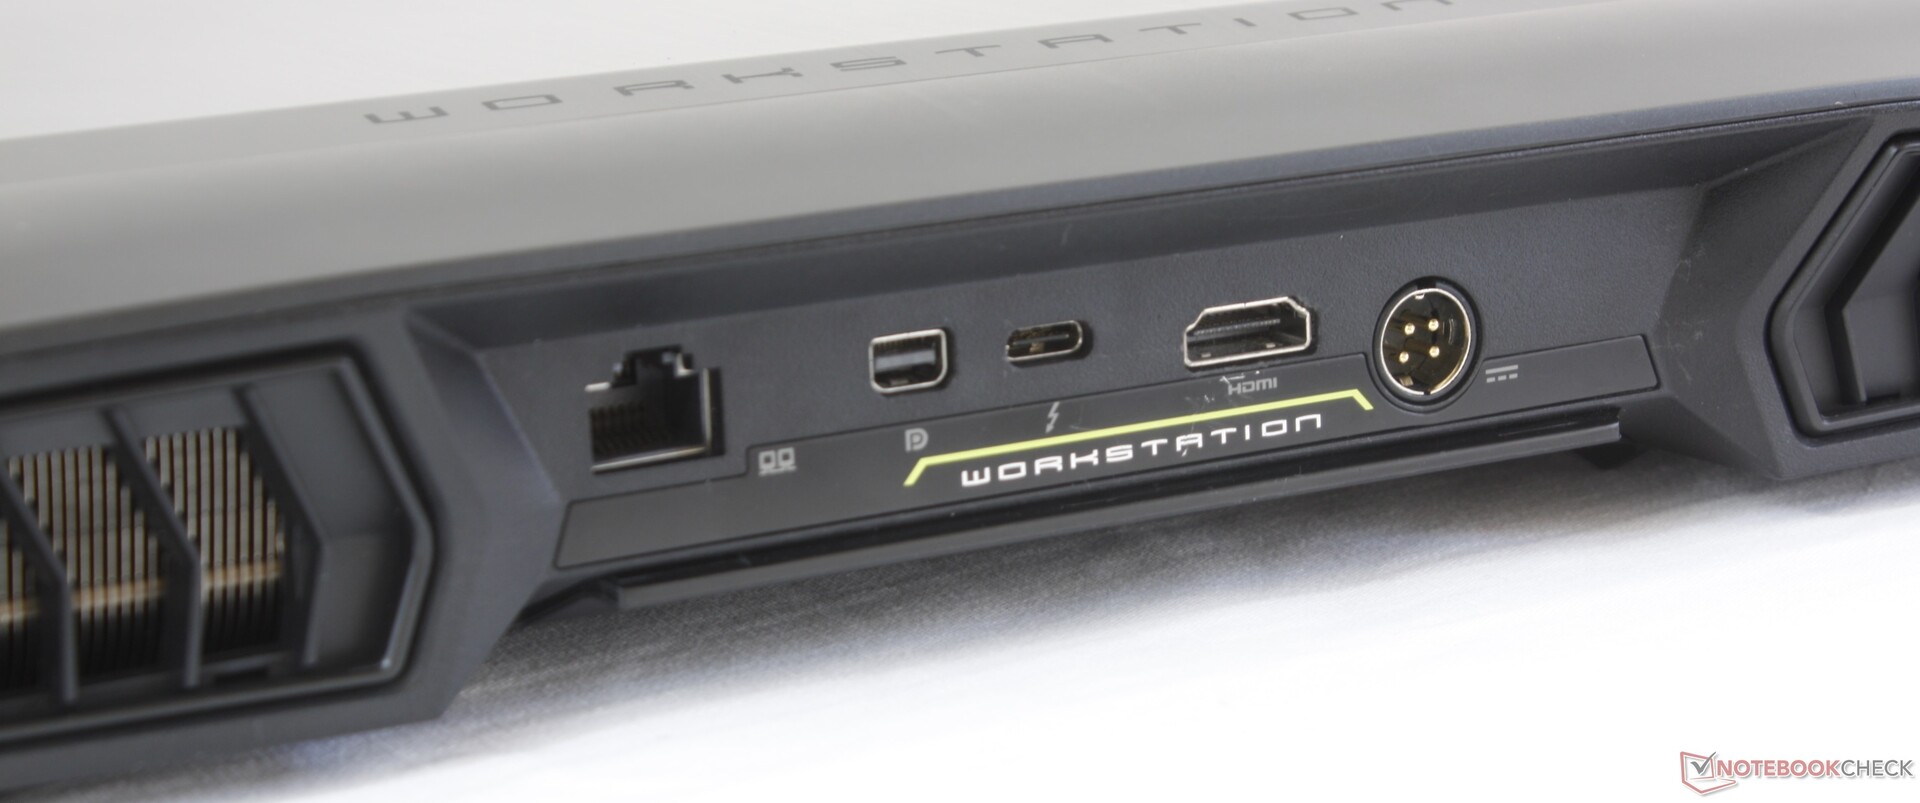
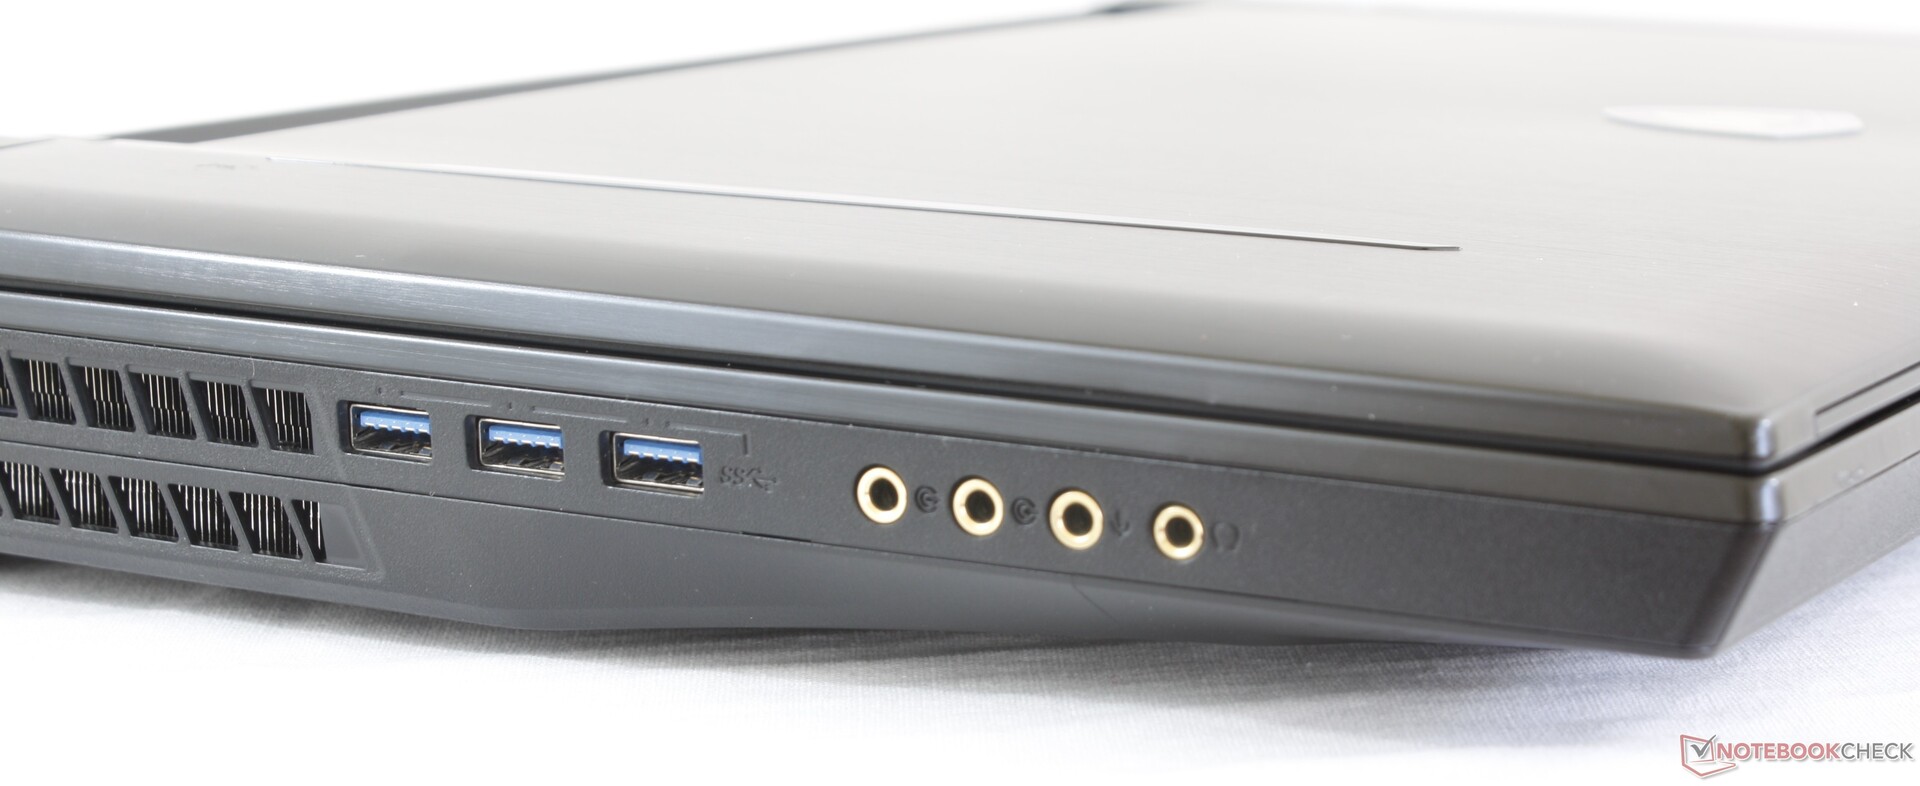
De övriga klagomålen är små. Ljudet är antagligen av bättre kvalitet än vad de flesta arbetsstationsanvändare behöver och detsamma gäller de extra ljudanslutningarna. 4K UHD-skärmen ser en aning grynig ut, de bakre portarna är svåra att se, lock och gångjärn kunde varit fastare och systemet är ganska stort, till och med för en laptop på 17 tum. I övrigt är kärnprestandan och servicemöjligheterna överlägsna det du får från de större tillverkarna.
Kraftfull, uppgraderingsbar och oförlåtligt tjock - Monstret MSI WT75 passar bäst åt den som vill ha frihet att lätt kunna utföra service på så många delar av sin mobila arbetsstation som möjligt.
MSI WT75 8SM
- 01/08/2020 v7 (old)
Allen Ngo
Price comparison
