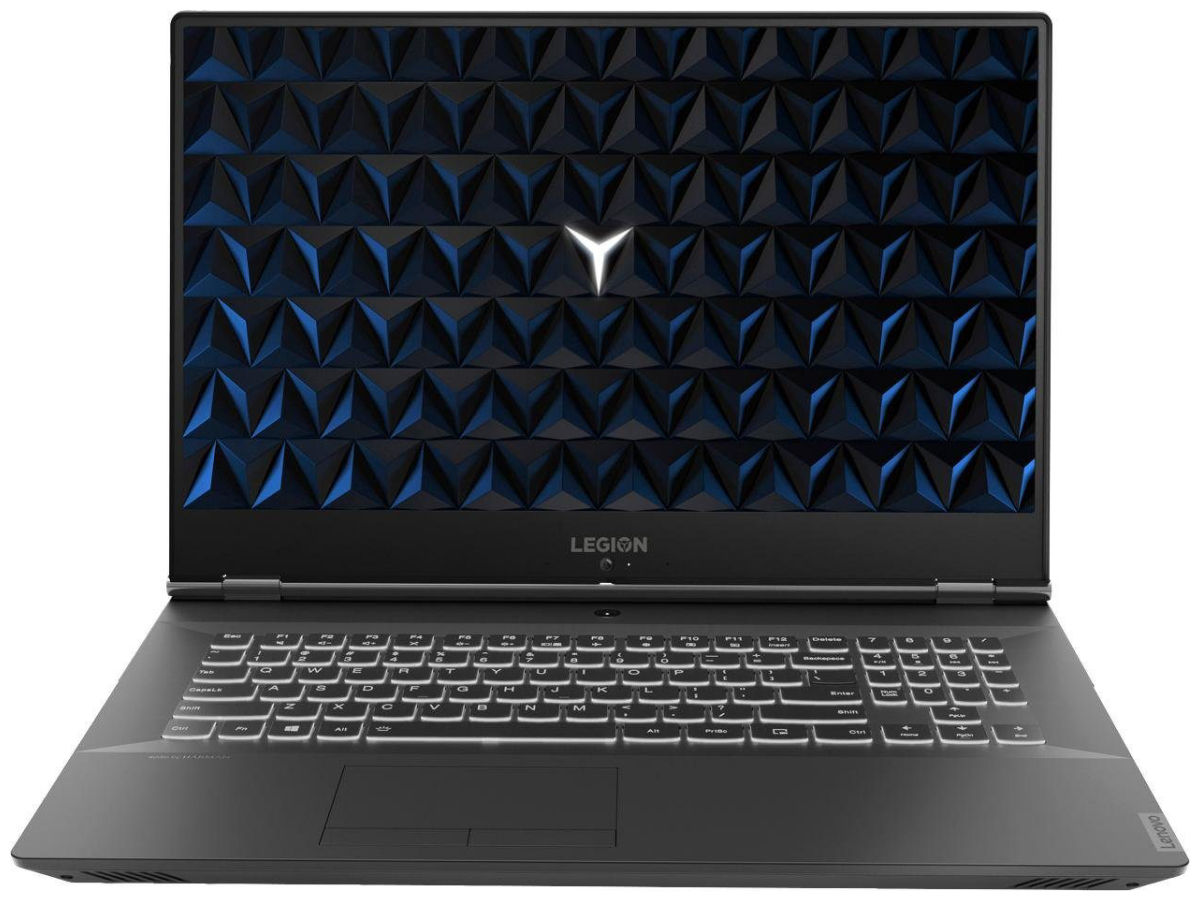
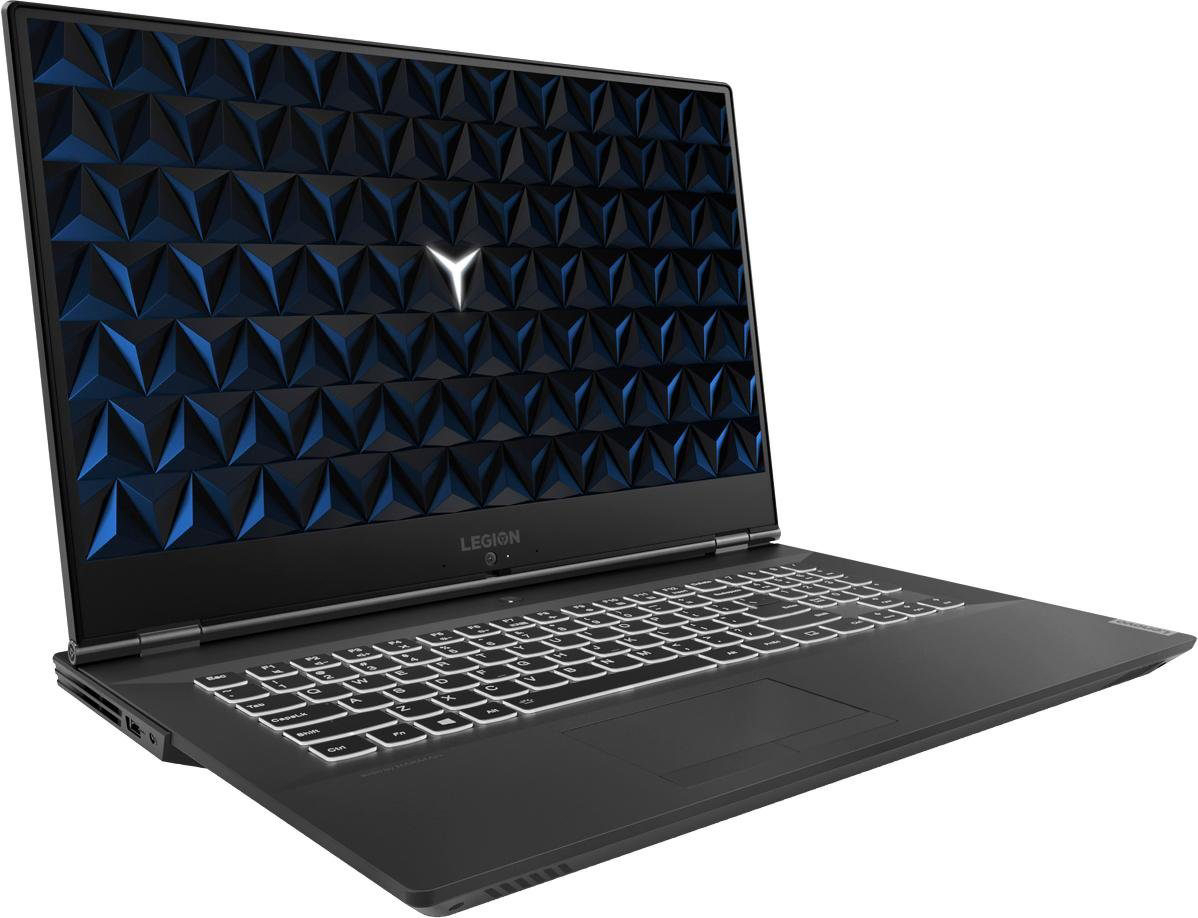
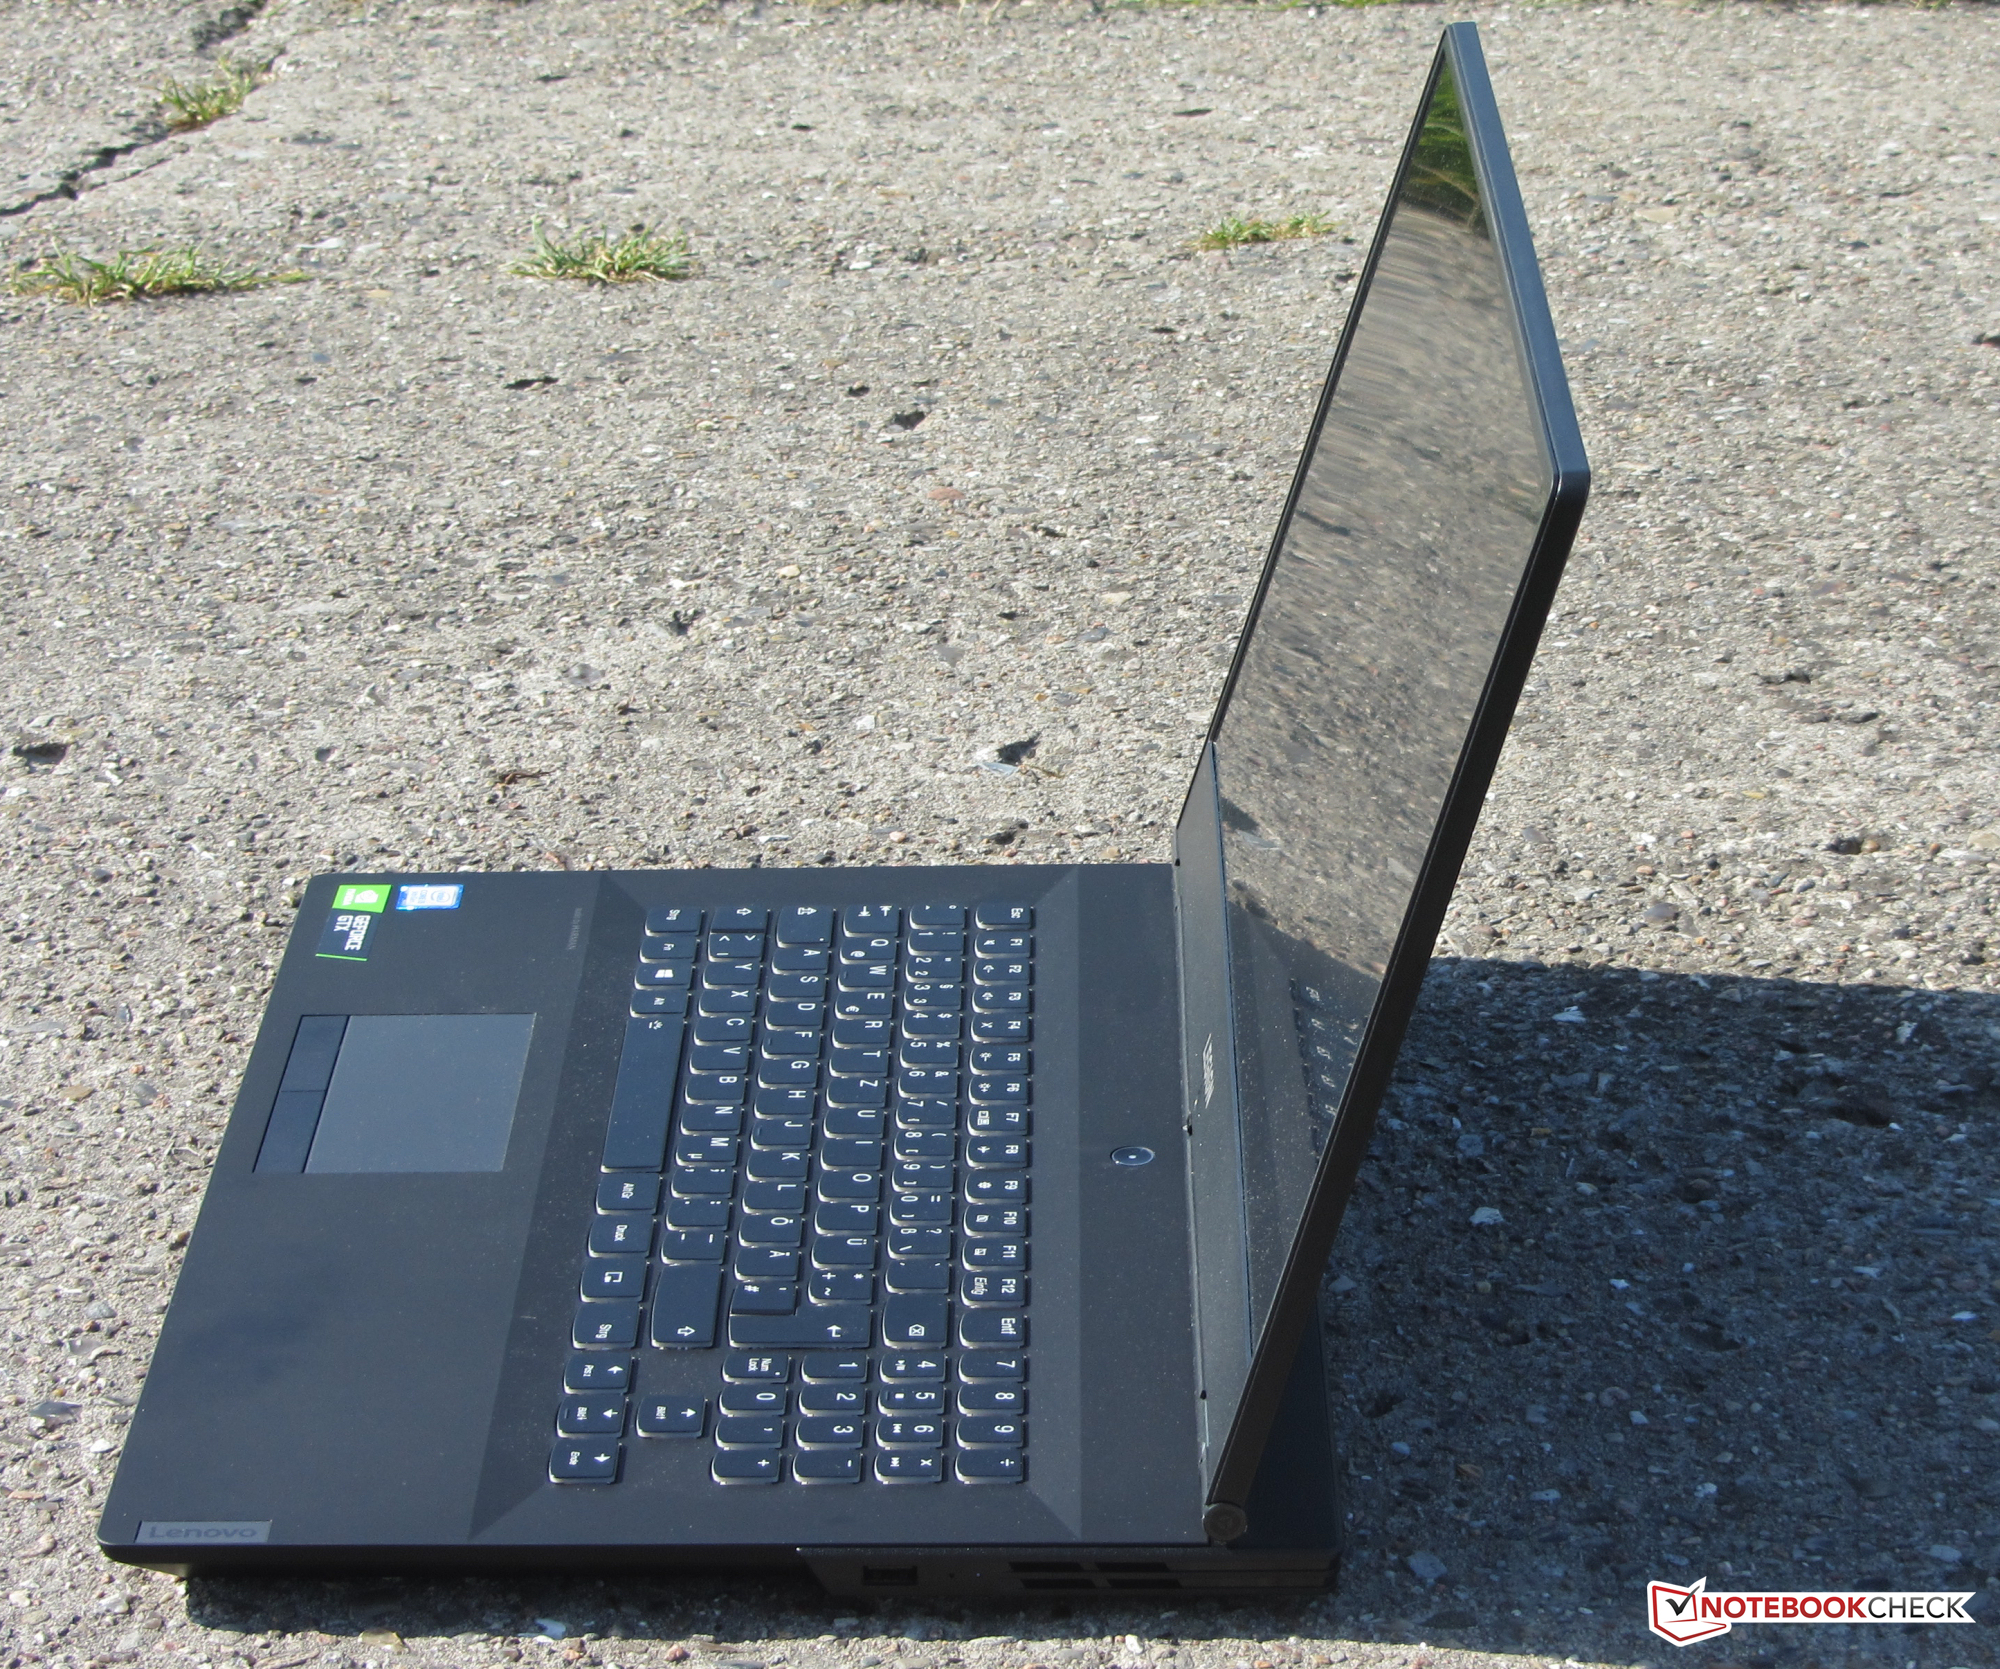
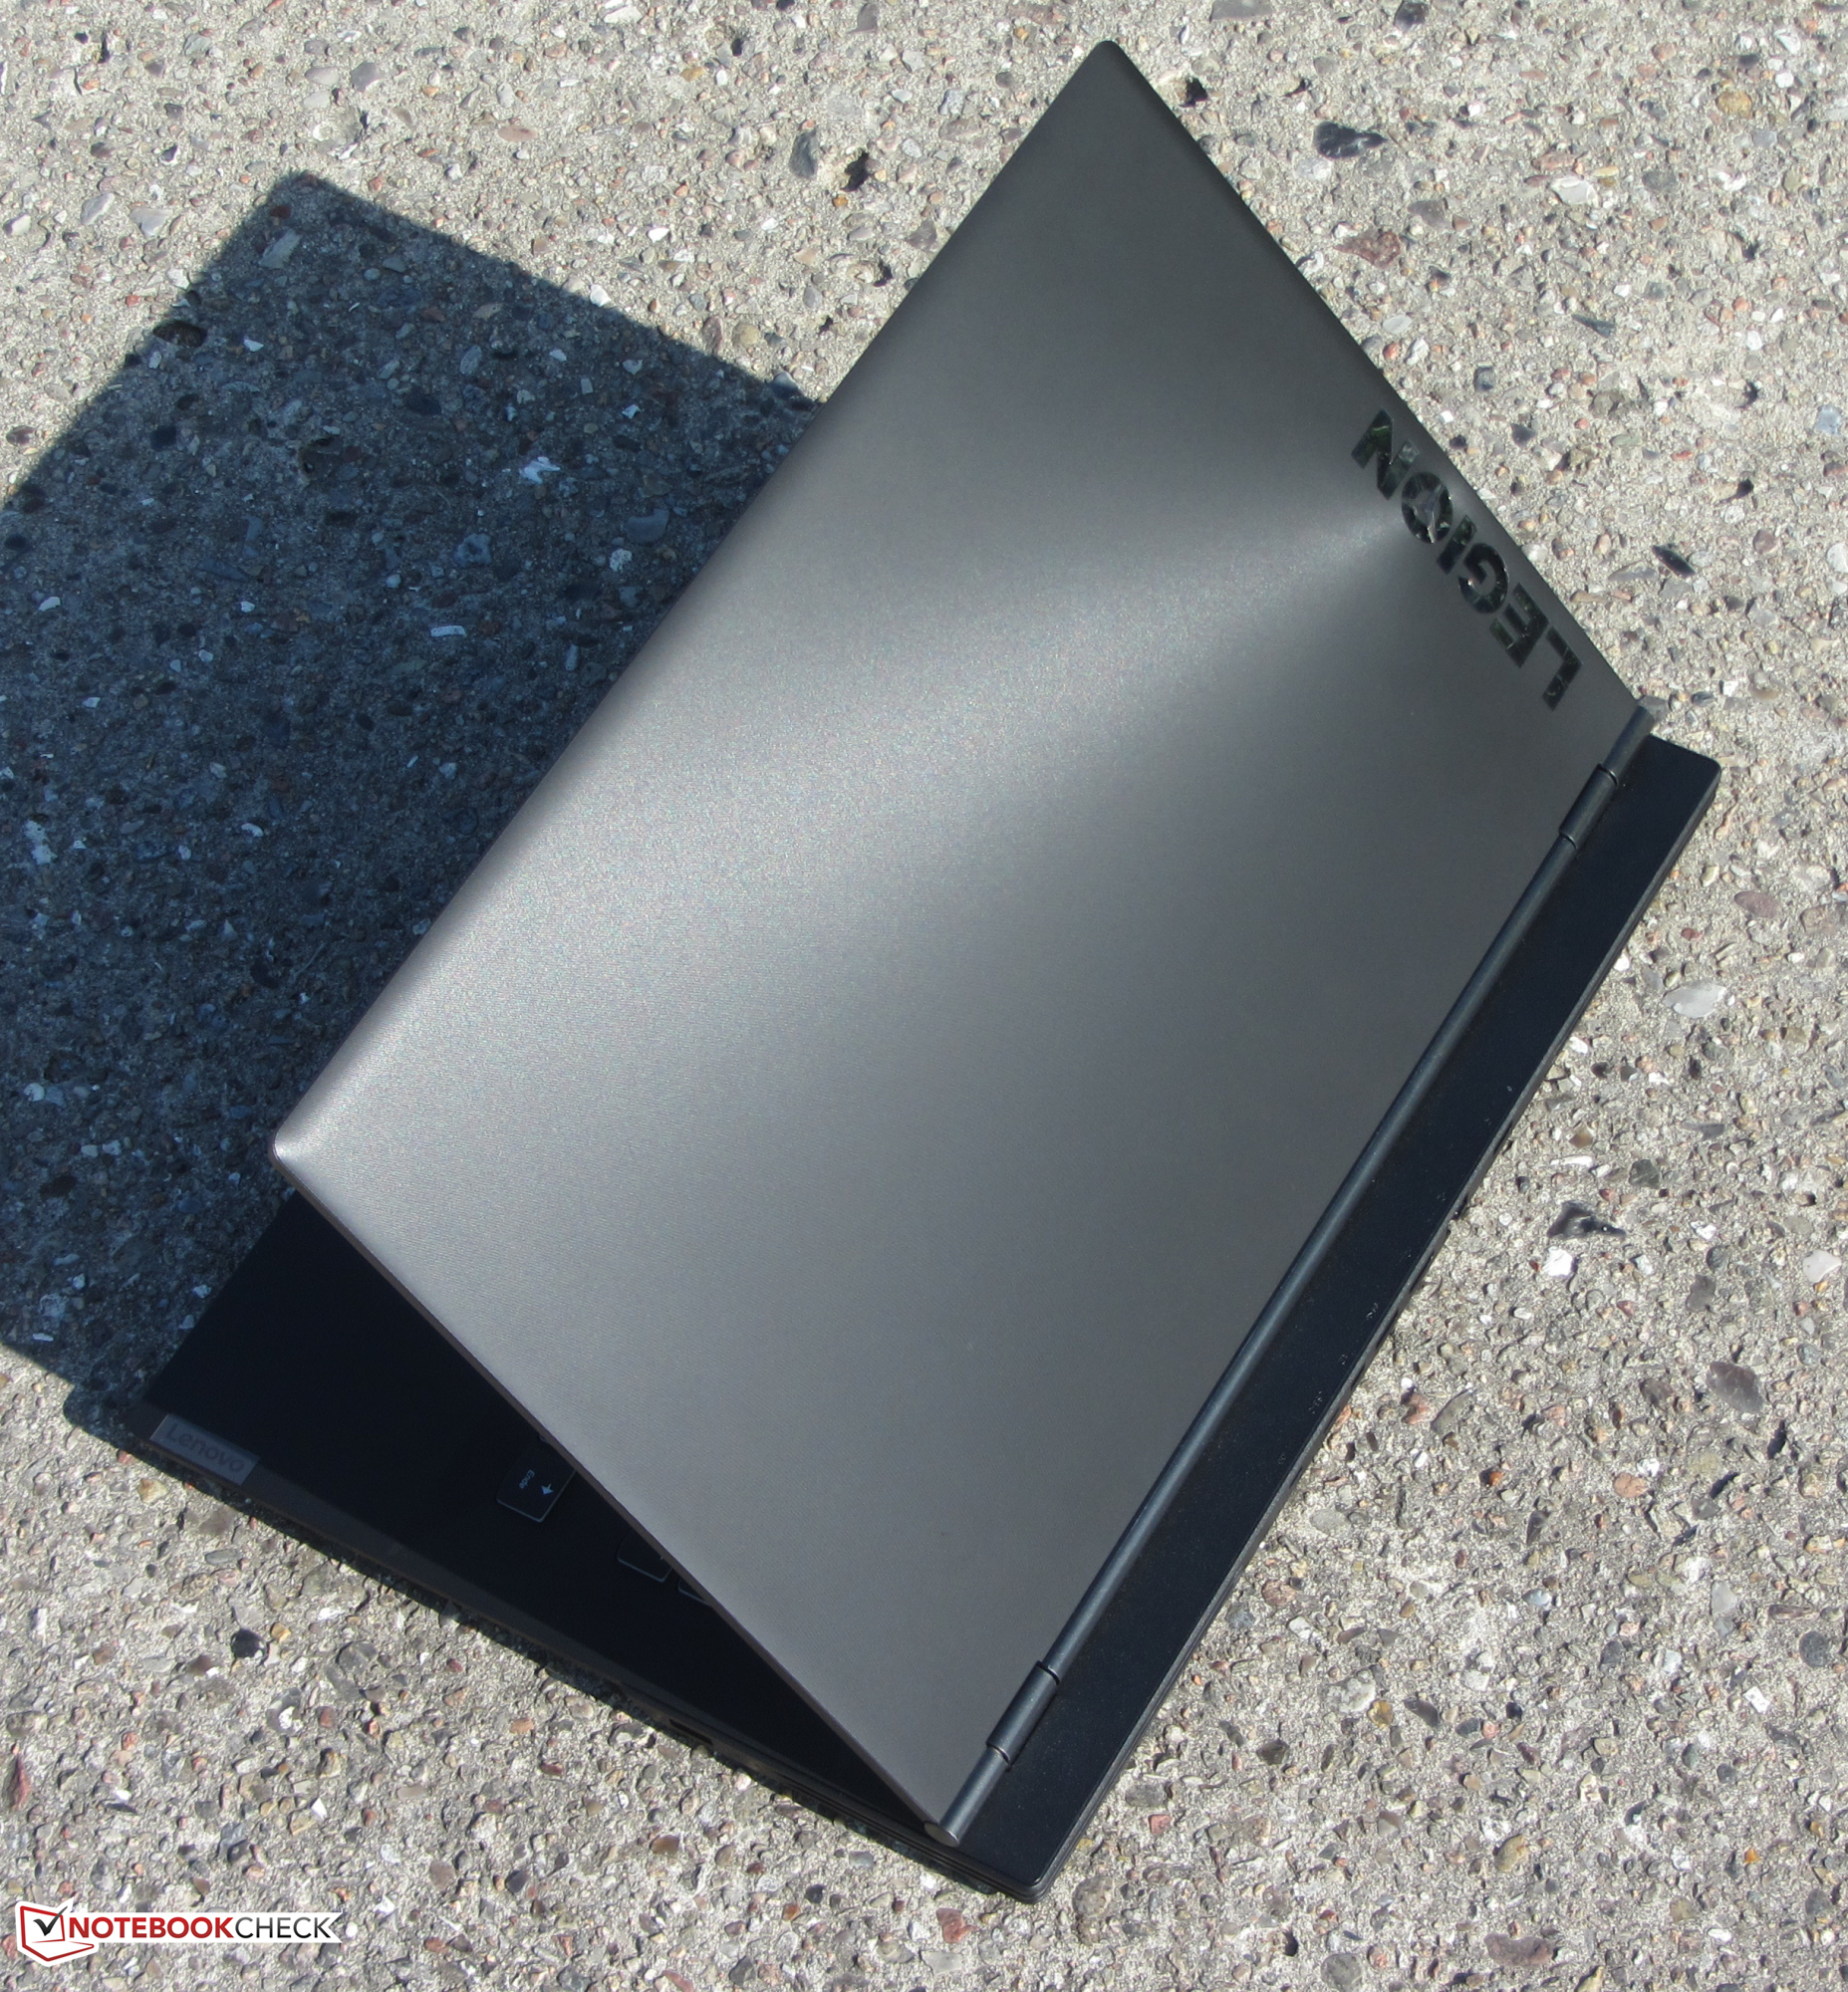
Test: Lenovo Legion Y540-17IRH - Mittenskiktsgamer som använder sin Core i5 fullt ut
| Networking | |
| iperf3 transmit AX12 | |
| Lenovo Legion Y540-17IRH | |
| Dell G7 17 7790 | |
| MSI GP75 Leopard 9SD | |
| Schenker XMG Core 17 | |
| Lenovo Legion Y740-17ICH | |
| Gigabyte Sabre 17-W8 | |
| iperf3 receive AX12 | |
| MSI GP75 Leopard 9SD | |
| Schenker XMG Core 17 | |
| Lenovo Legion Y540-17IRH | |
| Dell G7 17 7790 | |
| Lenovo Legion Y740-17ICH | |
| Gigabyte Sabre 17-W8 | |
| |||||||||||||||||||||||||
Distribution av ljusstyrkan: 87 %
Mitt på batteriet: 286 cd/m²
Kontrast: 1505:1 (Svärta: 0.19 cd/m²)
ΔE ColorChecker Calman: 3.57 | ∀{0.5-29.43 Ø4.73}
calibrated: 1.31
ΔE Greyscale Calman: 4.51 | ∀{0.09-98 Ø4.97}
98% sRGB (Argyll 1.6.3 3D)
64% AdobeRGB 1998 (Argyll 1.6.3 3D)
70.7% AdobeRGB 1998 (Argyll 3D)
98.3% sRGB (Argyll 3D)
69% Display P3 (Argyll 3D)
Gamma: 2.36
CCT: 7411 K
| Lenovo Legion Y540-17IRH AU Optronics B173HAN04.4 (AUO449D), IPS, 1920x1080 | Schenker XMG Core 17 LG Philips LP173WFG-SPB1 (LGD0615), IPS, 1920x1080 | Lenovo Legion Y740-17ICH AU Optronics B173HAN03.2, IPS, 1920x1080 | MSI GP75 Leopard 9SD Chi Mei N173HCE-G33 (CMN175C), IPS, 1920x1080 | Dell G7 17 7790 AU Optronics AUO409D, B173HAN, IPS, 1920x1080 | Gigabyte Sabre 17-W8 Chi Mei CMN1747, TN, 1920x1080 | |
|---|---|---|---|---|---|---|
| Display | -6% | -8% | -6% | -10% | 17% | |
| Display P3 Coverage (%) | 69 | 64.4 -7% | 64 -7% | 63.4 -8% | 61.9 -10% | 89.9 30% |
| sRGB Coverage (%) | 98.3 | 95.6 -3% | 90.4 -8% | 94.9 -3% | 89.6 -9% | 100 2% |
| AdobeRGB 1998 Coverage (%) | 70.7 | 65.6 -7% | 64.8 -8% | 65.1 -8% | 63.2 -11% | 85.1 20% |
| Response Times | 23% | 7% | 44% | 5% | 44% | |
| Response Time Grey 50% / Grey 80% * (ms) | 18 ? | 14.4 ? 20% | 15.6 ? 13% | 8 ? 56% | 17.2 ? 4% | 9 ? 50% |
| Response Time Black / White * (ms) | 12.8 ? | 9.6 ? 25% | 12.8 ? -0% | 8.8 ? 31% | 12 ? 6% | 8 ? 37% |
| PWM Frequency (Hz) | 25510 ? | 25000 ? | ||||
| Screen | -1% | -34% | 6% | -22% | -47% | |
| Brightness middle (cd/m²) | 286 | 329 15% | 299.1 5% | 420 47% | 308.6 8% | 326 14% |
| Brightness (cd/m²) | 282 | 286 1% | 273 -3% | 393 39% | 299 6% | 309 10% |
| Brightness Distribution (%) | 87 | 79 -9% | 81 -7% | 91 5% | 92 6% | 82 -6% |
| Black Level * (cd/m²) | 0.19 | 0.3 -58% | 0.27 -42% | 0.32 -68% | 0.29 -53% | 0.27 -42% |
| Contrast (:1) | 1505 | 1097 -27% | 1108 -26% | 1313 -13% | 1064 -29% | 1207 -20% |
| Colorchecker dE 2000 * | 3.57 | 2.52 29% | 5.07 -42% | 3.04 15% | 4.26 -19% | 9.11 -155% |
| Colorchecker dE 2000 max. * | 7.5 | 6.9 8% | 10.55 -41% | 7.22 4% | 7.83 -4% | 14.14 -89% |
| Colorchecker dE 2000 calibrated * | 1.31 | 1.31 -0% | 3.31 -153% | 0.89 32% | 2.93 -124% | 2.62 -100% |
| Greyscale dE 2000 * | 4.51 | 2.98 34% | 6.8 -51% | 3.91 13% | 5 -11% | 11.17 -148% |
| Gamma | 2.36 93% | 2.38 92% | 2.46 89% | 2.26 97% | 2.07 106% | 2.28 96% |
| CCT | 7411 88% | 6738 96% | 7805 83% | 7138 91% | 7488 87% | 12475 52% |
| Color Space (Percent of AdobeRGB 1998) (%) | 64 | 60 -6% | 58.5 -9% | 60 -6% | 57.8 -10% | 76 19% |
| Color Space (Percent of sRGB) (%) | 98 | 95 -3% | 89.9 -8% | 95 -3% | 89.2 -9% | 100 2% |
| Totalt genomsnitt (program/inställningar) | 5% /
1% | -12% /
-24% | 15% /
8% | -9% /
-16% | 5% /
-24% |
* ... mindre är bättre
Visa svarstider
| ↔ Svarstid svart till vitt | ||
|---|---|---|
| 12.8 ms ... stiga ↗ och falla ↘ kombinerat | ↗ 7.6 ms stiga | 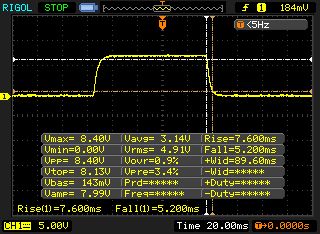 |
| ↘ 5.2 ms hösten | ||
| Skärmen visar bra svarsfrekvens i våra tester, men kan vara för långsam för konkurrenskraftiga spelare. I jämförelse sträcker sig alla testade enheter från 0.1 (minst) till 240 (maximalt) ms. » 33 % av alla enheter är bättre. Det betyder att den uppmätta svarstiden är bättre än genomsnittet av alla testade enheter (19.9 ms). | ||
| ↔ Svarstid 50 % grått till 80 % grått | ||
| 18 ms ... stiga ↗ och falla ↘ kombinerat | ↗ 8.4 ms stiga | 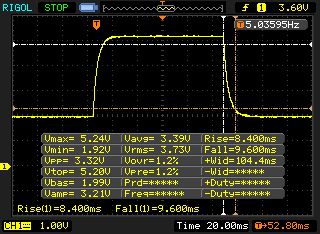 |
| ↘ 9.6 ms hösten | ||
| Skärmen visar bra svarsfrekvens i våra tester, men kan vara för långsam för konkurrenskraftiga spelare. I jämförelse sträcker sig alla testade enheter från 0.165 (minst) till 636 (maximalt) ms. » 32 % av alla enheter är bättre. Det betyder att den uppmätta svarstiden är bättre än genomsnittet av alla testade enheter (31.1 ms). | ||
Skärmflimmer / PWM (Puls-Width Modulation)
| Skärmflimmer / PWM upptäcktes inte | 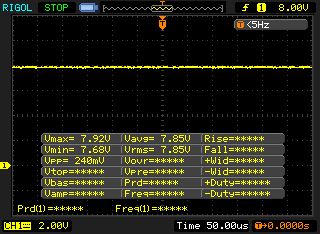 | ||
Som jämförelse: 52 % av alla testade enheter använder inte PWM för att dämpa skärmen. Om PWM upptäcktes mättes ett medelvärde av 7801 (minst: 5 - maximum: 343500) Hz. | |||
| Cinebench R15 | |
| CPU Single 64Bit | |
| Genomsnitt av klass Gaming (188.8 - 343, n=112, senaste 2 åren) | |
| MSI GP75 Leopard 9SD | |
| Schenker XMG Core 17 | |
| Lenovo Legion Y540-17IRH | |
| Gigabyte Sabre 17-W8 | |
| Lenovo Legion Y740-17ICH | |
| Dell G7 17 7790 | |
| CPU Multi 64Bit | |
| Genomsnitt av klass Gaming (1578 - 6271, n=113, senaste 2 åren) | |
| Lenovo Legion Y740-17ICH | |
| Gigabyte Sabre 17-W8 | |
| MSI GP75 Leopard 9SD | |
| Dell G7 17 7790 | |
| Schenker XMG Core 17 | |
| Lenovo Legion Y540-17IRH | |
| Cinebench R10 | |
| Rendering Single 32Bit | |
| Genomsnitt av klass Gaming (7457 - 11779, n=8, senaste 2 åren) | |
| Schenker XMG Core 17 | |
| Lenovo Legion Y540-17IRH | |
| Rendering Multiple CPUs 32Bit | |
| Genomsnitt av klass Gaming (42932 - 81339, n=8, senaste 2 åren) | |
| Schenker XMG Core 17 | |
| Lenovo Legion Y540-17IRH | |
| Cinebench R20 | |
| CPU (Single Core) | |
| Genomsnitt av klass Gaming (442 - 895, n=112, senaste 2 åren) | |
| Schenker XMG Core 17 | |
| Lenovo Legion Y540-17IRH | |
| CPU (Multi Core) | |
| Genomsnitt av klass Gaming (4029 - 16108, n=112, senaste 2 åren) | |
| Schenker XMG Core 17 | |
| Lenovo Legion Y540-17IRH | |
| Geekbench 3 | |
| 32 Bit Multi-Core Score | |
| Schenker XMG Core 17 | |
| Lenovo Legion Y540-17IRH | |
| 32 Bit Single-Core Score | |
| Schenker XMG Core 17 | |
| Lenovo Legion Y540-17IRH | |
| Geekbench 4.4 | |
| 64 Bit Multi-Core Score | |
| Genomsnitt av klass Gaming (89200 - 97490, n=2, senaste 2 åren) | |
| Schenker XMG Core 17 | |
| Lenovo Legion Y540-17IRH | |
| 64 Bit Single-Core Score | |
| Genomsnitt av klass Gaming (9335 - 9492, n=2, senaste 2 åren) | |
| Schenker XMG Core 17 | |
| Lenovo Legion Y540-17IRH | |
| Mozilla Kraken 1.1 - Total | |
| Lenovo Legion Y540-17IRH (Edge 44) | |
| Gigabyte Sabre 17-W8 | |
| Lenovo Legion Y740-17ICH (Edge 44.17763.1.0) | |
| MSI GP75 Leopard 9SD | |
| Schenker XMG Core 17 (Edge 44) | |
| Genomsnitt av klass Gaming (391 - 590, n=106, senaste 2 åren) | |
| Octane V2 - Total Score | |
| Genomsnitt av klass Gaming (87588 - 139447, n=31, senaste 2 åren) | |
| MSI GP75 Leopard 9SD | |
| Schenker XMG Core 17 (Edge 44) | |
| Lenovo Legion Y740-17ICH (Edge 44.17763.1.0) | |
| Gigabyte Sabre 17-W8 | |
| Lenovo Legion Y540-17IRH (Edge 44) | |
| JetStream 1.1 - 1.1 Total | |
| Genomsnitt av klass Gaming (518 - 647, n=6, senaste 2 åren) | |
| Schenker XMG Core 17 (Edge 44) | |
| MSI GP75 Leopard 9SD | |
| Lenovo Legion Y740-17ICH (Edge 44.17763.1.0) | |
| Gigabyte Sabre 17-W8 | |
| Lenovo Legion Y540-17IRH (Edge 44) | |
* ... mindre är bättre
| PCMark 7 Score | 7284 poäng | |
| PCMark 8 Home Score Accelerated v2 | 4818 poäng | |
| PCMark 8 Creative Score Accelerated v2 | 5506 poäng | |
| PCMark 8 Work Score Accelerated v2 | 5138 poäng | |
| PCMark 10 Score | 5613 poäng | |
Hjälp | ||
| PCMark 10 - Score | |
| Genomsnitt av klass Gaming (5828 - 11574, n=96, senaste 2 åren) | |
| Lenovo Legion Y740-17ICH | |
| Schenker XMG Core 17 | |
| Lenovo Legion Y540-17IRH | |
| MSI GP75 Leopard 9SD | |
| Dell G7 17 7790 | |
| Gigabyte Sabre 17-W8 | |
| PCMark 8 | |
| Home Score Accelerated v2 | |
| Genomsnitt av klass Gaming (n=1senaste 2 åren) | |
| Lenovo Legion Y740-17ICH | |
| Lenovo Legion Y540-17IRH | |
| Schenker XMG Core 17 | |
| Gigabyte Sabre 17-W8 | |
| Dell G7 17 7790 | |
| MSI GP75 Leopard 9SD | |
| Work Score Accelerated v2 | |
| Lenovo Legion Y740-17ICH | |
| Schenker XMG Core 17 | |
| MSI GP75 Leopard 9SD | |
| Gigabyte Sabre 17-W8 | |
| Dell G7 17 7790 | |
| Lenovo Legion Y540-17IRH | |
| Genomsnitt av klass Gaming (n=1senaste 2 åren) | |

| Lenovo Legion Y540-17IRH WDC PC SN520 SDAPNUW-512G | Schenker XMG Core 17 Samsung SSD 970 EVO Plus 500GB | Lenovo Legion Y740-17ICH Samsung SSD PM981 MZVLB256HAHQ | MSI GP75 Leopard 9SD Kingston RBUSNS8154P3256GJ1 | Dell G7 17 7790 Toshiba BG3 KBG30ZMS256G | Gigabyte Sabre 17-W8 Toshiba NVMe THNSN5256GPU7 | |
|---|---|---|---|---|---|---|
| CrystalDiskMark 5.2 / 6 | 42% | 39% | -22% | -32% | 4% | |
| Write 4K (MB/s) | 105.1 | 99.3 -6% | 99.8 -5% | 105.8 1% | 78.6 -25% | 104.7 0% |
| Read 4K (MB/s) | 34.41 | 38.47 12% | 40.81 19% | 27.89 -19% | 31.89 -7% | 37.39 9% |
| Write Seq (MB/s) | 1298 | 1449 12% | 1385 7% | 270.8 -79% | 230.4 -82% | 866 -33% |
| Read Seq (MB/s) | 1099 | 1237 13% | 2089 90% | 879 -20% | 925 -16% | 944 -14% |
| Write 4K Q32T1 (MB/s) | 335.7 | 364.4 9% | 380 13% | 273.3 -19% | 159.1 -53% | 293.3 -13% |
| Read 4K Q32T1 (MB/s) | 231.4 | 421.9 82% | 445.5 93% | 361.2 56% | 315.6 36% | 374.3 62% |
| Write Seq Q32T1 (MB/s) | 1454 | 3276 125% | 1380 -5% | 253 -83% | 230.7 -84% | 1064 -27% |
| Read Seq Q32T1 (MB/s) | 1740 | 3338 92% | 3471 99% | 1505 -14% | 1323 -24% | 2616 50% |
| 3DMark 06 Standard Score | 36563 poäng | |
| 3DMark 11 Performance | 16162 poäng | |
| 3DMark Ice Storm Standard Score | 139756 poäng | |
| 3DMark Cloud Gate Standard Score | 29390 poäng | |
| 3DMark Fire Strike Score | 12263 poäng | |
| 3DMark Time Spy Score | 5467 poäng | |
Hjälp | ||
| 3DMark | |
| 1920x1080 Fire Strike Graphics | |
| Genomsnitt av klass Gaming (12242 - 62849, n=121, senaste 2 åren) | |
| Lenovo Legion Y740-17ICH | |
| Dell G7 17 7790 | |
| MSI GP75 Leopard 9SD | |
| Schenker XMG Core 17 | |
| Lenovo Legion Y540-17IRH | |
| Gigabyte Sabre 17-W8 | |
| 2560x1440 Time Spy Graphics | |
| Genomsnitt av klass Gaming (5012 - 26212, n=120, senaste 2 åren) | |
| Lenovo Legion Y740-17ICH | |
| Dell G7 17 7790 | |
| MSI GP75 Leopard 9SD | |
| Lenovo Legion Y540-17IRH | |
| Schenker XMG Core 17 | |
| 3DMark 11 - 1280x720 Performance GPU | |
| Genomsnitt av klass Gaming (21841 - 80022, n=109, senaste 2 åren) | |
| Lenovo Legion Y740-17ICH | |
| Dell G7 17 7790 | |
| MSI GP75 Leopard 9SD | |
| Lenovo Legion Y540-17IRH | |
| Schenker XMG Core 17 | |
| Gigabyte Sabre 17-W8 | |
| The Witcher 3 - 1920x1080 Ultra Graphics & Postprocessing (HBAO+) | |
| Genomsnitt av klass Gaming (95 - 240, n=8, senaste 2 åren) | |
| Lenovo Legion Y740-17ICH | |
| Dell G7 17 7790 | |
| MSI GP75 Leopard 9SD | |
| Lenovo Legion Y540-17IRH | |
| Schenker XMG Core 17 | |
| Gigabyte Sabre 17-W8 | |
| BioShock Infinite - 1920x1080 Ultra Preset, DX11 (DDOF) | |
| Lenovo Legion Y740-17ICH | |
| MSI GP75 Leopard 9SD | |
| Lenovo Legion Y540-17IRH | |
| Schenker XMG Core 17 | |
| Dell G7 17 7790 | |
| For Honor - 1920x1080 Extreme Preset AA:T AF:16x | |
| Schenker XMG Core 17 | |
| Lenovo Legion Y540-17IRH | |
| Far Cry New Dawn - 1920x1080 Ultra Preset | |
| Schenker XMG Core 17 | |
| Lenovo Legion Y540-17IRH | |
| F1 2019 - 1920x1080 Ultra High Preset AA:T AF:16x | |
| Schenker XMG Core 17 | |
| Lenovo Legion Y540-17IRH | |
| Total War: Three Kingdoms - 1920x1080 Ultra (incl textures) | |
| Lenovo Legion Y540-17IRH | |
| låg | med. | hög | ultra | |
|---|---|---|---|---|
| BioShock Infinite (2013) | 313.9 | 284.2 | 265.6 | 138 |
| The Witcher 3 (2015) | 264 | 185 | 109.6 | 55.1 |
| For Honor (2017) | 245.1 | 126.1 | 120.4 | 92.6 |
| Ghost Recon Wildlands (2017) | 150.6 | 88.7 | 82.6 | 47.8 |
| Final Fantasy XV Benchmark (2018) | 129 | 78.1 | 55.4 | |
| X-Plane 11.11 (2018) | 91.5 | 83.6 | 71 | |
| Far Cry 5 (2018) | 117 | 90 | 84 | 83 |
| Far Cry New Dawn (2019) | 106 | 86 | 83 | 75 |
| Total War: Three Kingdoms (2019) | 202.9 | 101.5 | 63.9 | 46.1 |
| F1 2019 (2019) | 210 | 154 | 131 | 91 |
Ljudnivå
| Låg belastning |
| 30 / 32 / 34 dB(A) |
| Hög belastning |
| 44 / 52 dB(A) |
 | ||
30 dB tyst 40 dB(A) hörbar 50 dB(A) högt ljud |
||
min: | ||
| Lenovo Legion Y540-17IRH i5-9300H, GeForce GTX 1660 Ti Mobile | Schenker XMG Core 17 i7-9750H, GeForce GTX 1660 Ti Mobile | Lenovo Legion Y740-17ICH i7-8750H, GeForce RTX 2080 Max-Q | MSI GP75 Leopard 9SD i7-9750H, GeForce GTX 1660 Ti Mobile | Dell G7 17 7790 i7-8750H, GeForce RTX 2070 Max-Q | Gigabyte Sabre 17-W8 i7-8750H, GeForce GTX 1060 Mobile | Genomsnitt av klass Gaming | |
|---|---|---|---|---|---|---|---|
| Noise | -1% | 9% | -5% | 10% | 1% | 10% | |
| av / miljö * (dB) | 30 | 30 -0% | 28.3 6% | 29 3% | 28.2 6% | 30.5 -2% | 24.1 ? 20% |
| Idle Minimum * (dB) | 30 | 30 -0% | 31.5 -5% | 29 3% | 28.6 5% | 32.1 -7% | 25.8 ? 14% |
| Idle Average * (dB) | 32 | 32 -0% | 31.6 1% | 34 -6% | 28.6 11% | 32.1 -0% | 27.5 ? 14% |
| Idle Maximum * (dB) | 34 | 35 -3% | 31.6 7% | 37 -9% | 28.6 16% | 32.3 5% | 30 ? 12% |
| Load Average * (dB) | 44 | 47 -7% | 32.3 27% | 53 -20% | 31.8 28% | 42.9 2% | 43.1 ? 2% |
| Witcher 3 ultra * (dB) | 50 | 48 4% | 43 14% | 51 -2% | 50.6 -1% | ||
| Load Maximum * (dB) | 52 | 51 2% | 45.5 12% | 55 -6% | 50.8 2% | 48.8 6% | 54 ? -4% |
* ... mindre är bättre
(-) Den maximala temperaturen på ovansidan är 48 °C / 118 F, jämfört med genomsnittet av 40.4 °C / 105 F , allt från 21.2 till 68.8 °C för klassen Gaming.
(-) Botten värms upp till maximalt 56 °C / 133 F, jämfört med genomsnittet av 43.2 °C / 110 F
(+) Vid tomgångsbruk är medeltemperaturen för ovansidan 31.6 °C / 89 F, jämfört med enhetsgenomsnittet på 33.9 °C / ### class_avg_f### F.
(-) När du spelar The Witcher 3 är medeltemperaturen för ovansidan 39.8 °C / 104 F, jämfört med enhetsgenomsnittet på 33.9 °C / ## #class_avg_f### F.
(-) Handledsstöden och pekplattan kan bli väldigt varma vid beröring med maximalt 40 °C / 104 F.
(-) Medeltemperaturen för handledsstödsområdet på liknande enheter var 28.8 °C / 83.8 F (-11.2 °C / -20.2 F).
| Lenovo Legion Y540-17IRH i5-9300H, GeForce GTX 1660 Ti Mobile | Schenker XMG Core 17 i7-9750H, GeForce GTX 1660 Ti Mobile | Lenovo Legion Y740-17ICH i7-8750H, GeForce RTX 2080 Max-Q | MSI GP75 Leopard 9SD i7-9750H, GeForce GTX 1660 Ti Mobile | Dell G7 17 7790 i7-8750H, GeForce RTX 2070 Max-Q | Gigabyte Sabre 17-W8 i7-8750H, GeForce GTX 1060 Mobile | Genomsnitt av klass Gaming | |
|---|---|---|---|---|---|---|---|
| Heat | 9% | 17% | 16% | 4% | 26% | 11% | |
| Maximum Upper Side * (°C) | 48 | 47 2% | 38.6 20% | 45 6% | 46.6 3% | 35 27% | 45.2 ? 6% |
| Maximum Bottom * (°C) | 56 | 50 11% | 43.6 22% | 42 25% | 57 -2% | 34.3 39% | 48.2 ? 14% |
| Idle Upper Side * (°C) | 36 | 34 6% | 30.2 16% | 30 17% | 34.4 4% | 30.1 16% | 31.1 ? 14% |
| Idle Bottom * (°C) | 38 | 32 16% | 35 8% | 32 16% | 34.6 9% | 30.5 20% | 34.3 ? 10% |
* ... mindre är bättre
Lenovo Legion Y540-17IRH ljudanalys
(+) | högtalare kan spela relativt högt (84 dB)
Bas 100 - 315 Hz
(-) | nästan ingen bas - i genomsnitt 16.1% lägre än medianen
(±) | linjäriteten för basen är genomsnittlig (13% delta till föregående frekvens)
Mellan 400 - 2000 Hz
(±) | högre mellan - i genomsnitt 5% högre än median
(+) | mids är linjära (3.6% delta till föregående frekvens)
Högsta 2 - 16 kHz
(+) | balanserade toppar - endast 3.5% från medianen
(+) | toppar är linjära (5.9% delta till föregående frekvens)
Totalt 100 - 16 000 Hz
(±) | linjäriteten för det totala ljudet är genomsnittlig (15.7% skillnad mot median)
Jämfört med samma klass
» 36% av alla testade enheter i den här klassen var bättre, 7% liknande, 57% sämre
» Den bästa hade ett delta på 6%, genomsnittet var 18%, sämst var 132%
Jämfört med alla testade enheter
» 24% av alla testade enheter var bättre, 5% liknande, 71% sämre
» Den bästa hade ett delta på 4%, genomsnittet var 24%, sämst var 134%
Lenovo Legion Y740-17ICH ljudanalys
(±) | högtalarljudstyrkan är genomsnittlig men bra (74.3 dB)
Bas 100 - 315 Hz
(-) | nästan ingen bas - i genomsnitt 21.1% lägre än medianen
(-) | basen är inte linjär (16.5% delta till föregående frekvens)
Mellan 400 - 2000 Hz
(+) | balanserad mellan - endast 3.3% från medianen
(±) | linjäriteten för mids är genomsnittlig (9.7% delta till föregående frekvens)
Högsta 2 - 16 kHz
(+) | balanserade toppar - endast 1.7% från medianen
(+) | toppar är linjära (4.6% delta till föregående frekvens)
Totalt 100 - 16 000 Hz
(±) | linjäriteten för det totala ljudet är genomsnittlig (23.4% skillnad mot median)
Jämfört med samma klass
» 85% av alla testade enheter i den här klassen var bättre, 5% liknande, 11% sämre
» Den bästa hade ett delta på 6%, genomsnittet var 18%, sämst var 132%
Jämfört med alla testade enheter
» 70% av alla testade enheter var bättre, 6% liknande, 24% sämre
» Den bästa hade ett delta på 4%, genomsnittet var 24%, sämst var 134%
| Av/Standby | |
| Låg belastning | |
| Hög belastning |
|
Förklaring:
min: | |
| Lenovo Legion Y540-17IRH i5-9300H, GeForce GTX 1660 Ti Mobile | Schenker XMG Core 17 i7-9750H, GeForce GTX 1660 Ti Mobile | Lenovo Legion Y740-17ICH i7-8750H, GeForce RTX 2080 Max-Q | MSI GP75 Leopard 9SD i7-9750H, GeForce GTX 1660 Ti Mobile | Dell G7 17 7790 i7-8750H, GeForce RTX 2070 Max-Q | Gigabyte Sabre 17-W8 i7-8750H, GeForce GTX 1060 Mobile | Genomsnitt av klass Gaming | |
|---|---|---|---|---|---|---|---|
| Power Consumption | 20% | -6% | 12% | 11% | 28% | -0% | |
| Idle Minimum * (Watt) | 19 | 10 47% | 20.2 -6% | 10 47% | 9.5 50% | 9.3 51% | 13.3 ? 30% |
| Idle Average * (Watt) | 22 | 13 41% | 27.2 -24% | 15 32% | 16.2 26% | 14.8 33% | 19 ? 14% |
| Idle Maximum * (Watt) | 30 | 21 30% | 28.7 4% | 22 27% | 23.8 21% | 22 27% | 24.5 ? 18% |
| Load Average * (Watt) | 79 | 89 -13% | 90.8 -15% | 92 -16% | 101.7 -29% | 63 20% | 108.1 ? -37% |
| Witcher 3 ultra * (Watt) | 134 | 128 4% | 152.1 -14% | 153 -14% | 155 -16% | ||
| Load Maximum * (Watt) | 201 | 177 12% | 165.4 18% | 216 -7% | 172.2 14% | 187 7% | 254 ? -26% |
* ... mindre är bättre
| Lenovo Legion Y540-17IRH i5-9300H, GeForce GTX 1660 Ti Mobile, 57 Wh | Schenker XMG Core 17 i7-9750H, GeForce GTX 1660 Ti Mobile, 46.74 Wh | Lenovo Legion Y740-17ICH i7-8750H, GeForce RTX 2080 Max-Q, 76 Wh | MSI GP75 Leopard 9SD i7-9750H, GeForce GTX 1660 Ti Mobile, 51 Wh | Dell G7 17 7790 i7-8750H, GeForce RTX 2070 Max-Q, 60 Wh | Gigabyte Sabre 17-W8 i7-8750H, GeForce GTX 1060 Mobile, 62 Wh | Genomsnitt av klass Gaming | |
|---|---|---|---|---|---|---|---|
| Batteridrifttid | 39% | -14% | -22% | 50% | 41% | 84% | |
| Reader / Idle (h) | 5.2 | 8.1 56% | 4.8 -8% | 8.5 63% | 6.9 33% | 8.71 ? 68% | |
| H.264 (h) | 3.4 | 5.3 56% | 5.3 56% | 8.26 ? 143% | |||
| WiFi v1.3 (h) | 3.7 | 4.7 27% | 3.2 -14% | 3.2 -14% | 3.9 5% | 5.4 46% | 7.01 ? 89% |
| Load (h) | 1.1 | 1.3 18% | 0.6 -45% | 2 82% | 1.4 27% | 1.47 ? 34% |
För
Emot
Läs den fullständiga versionen av den här recensionen på engelska här.
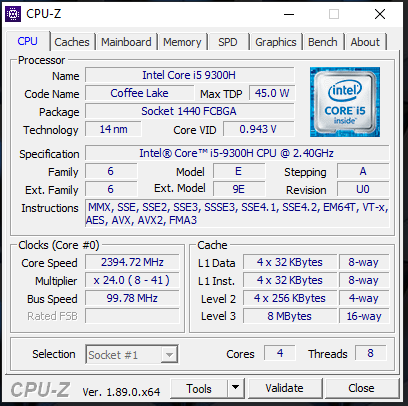
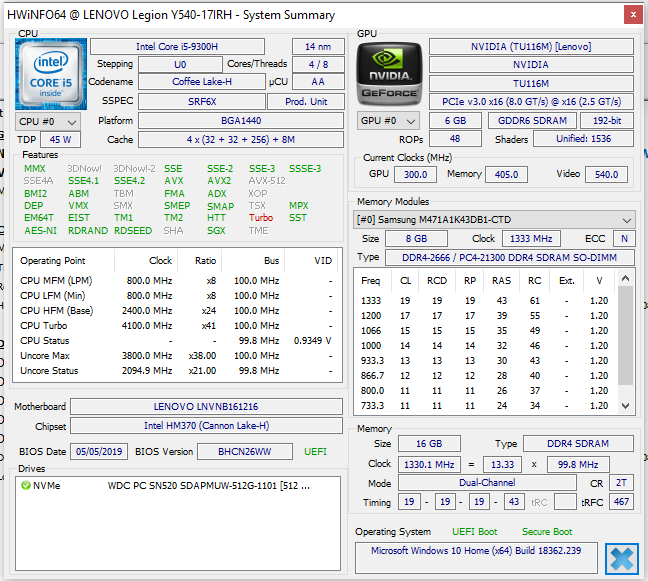
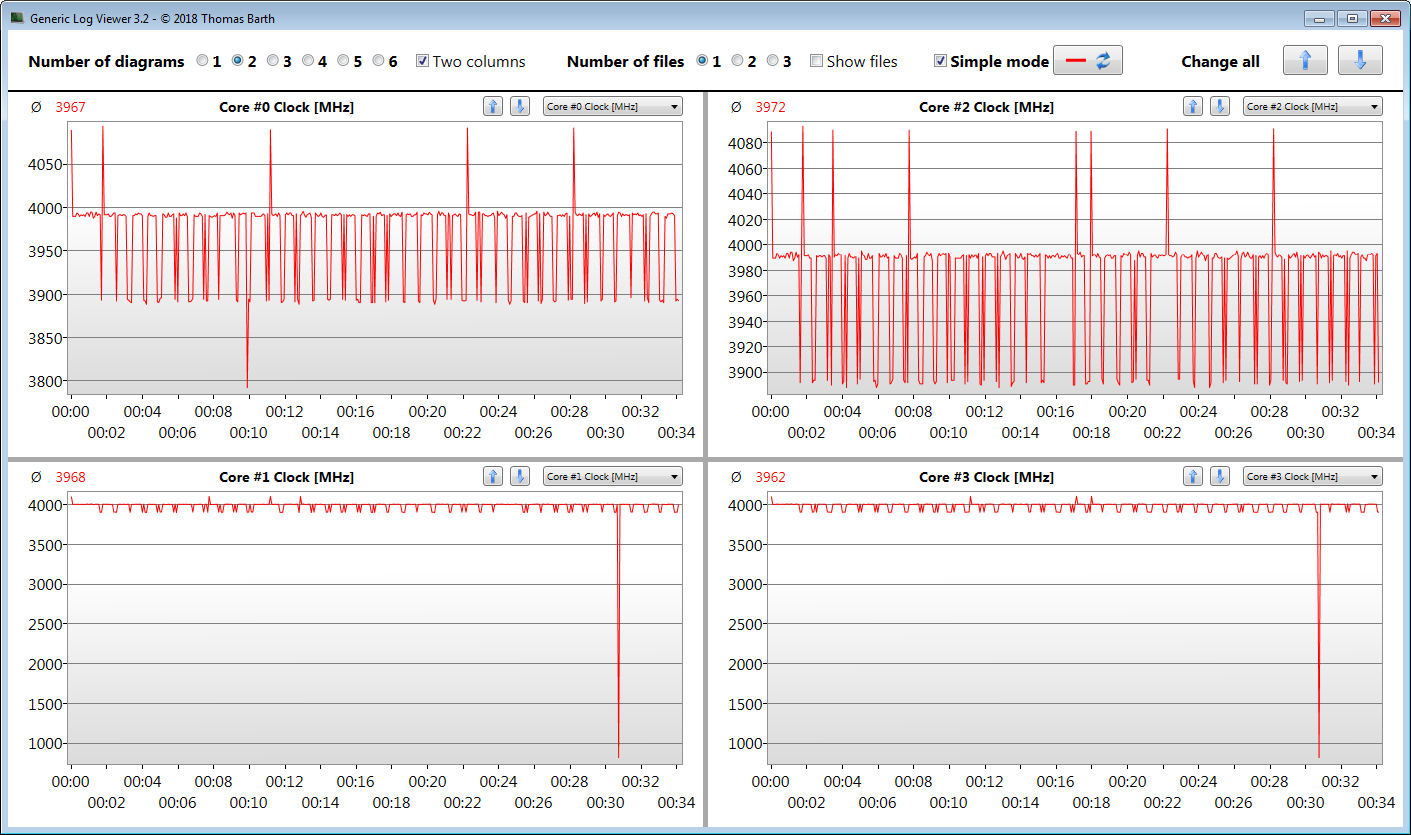
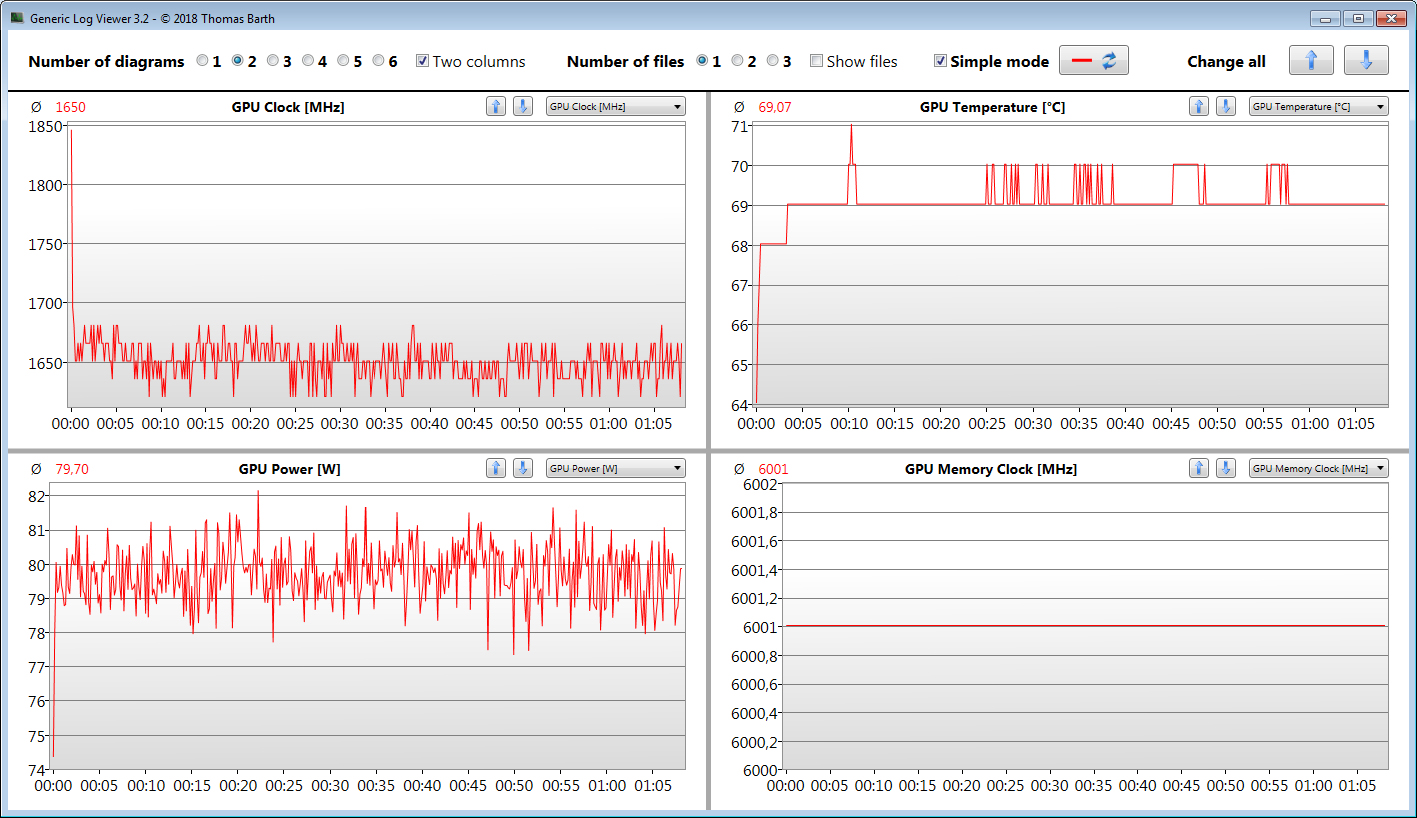
Med sin Legion Y540-17IRH levererar Lenovo en spelfokuserad mittenskiktslaptop på 17.3 tum. Den installerade kombinationen av en Core i5-9300H CPU och en GeForce GTX 1660 Ti GPU är mer än tillräcklig för att visa aktuella spel smidigt. I de flesta spel går det att välja Full HD-upplösning och maximala grafikinställningar. Processorn imponerar särskilt då den kan upprätthålla maximal Turbo Boost utan begränsning.
Tack vare en NVMe SSD körs systemet snabbt och smidigt. Men det är inte den snabbaste modellen vi testat då den använder ett PCI Express x2-interface. Eftersom datorn har en lättanvänd servicelucka är det enkelt att utan problem byta ut SSD-enheten mot en snabbare modell. Vidare finns möjligheten att installera en extra 2.5-tumsenhet.
Praktiskt: Den inbyggda GPU:n kan aktiveras och deaktiveras med ett enda klick.
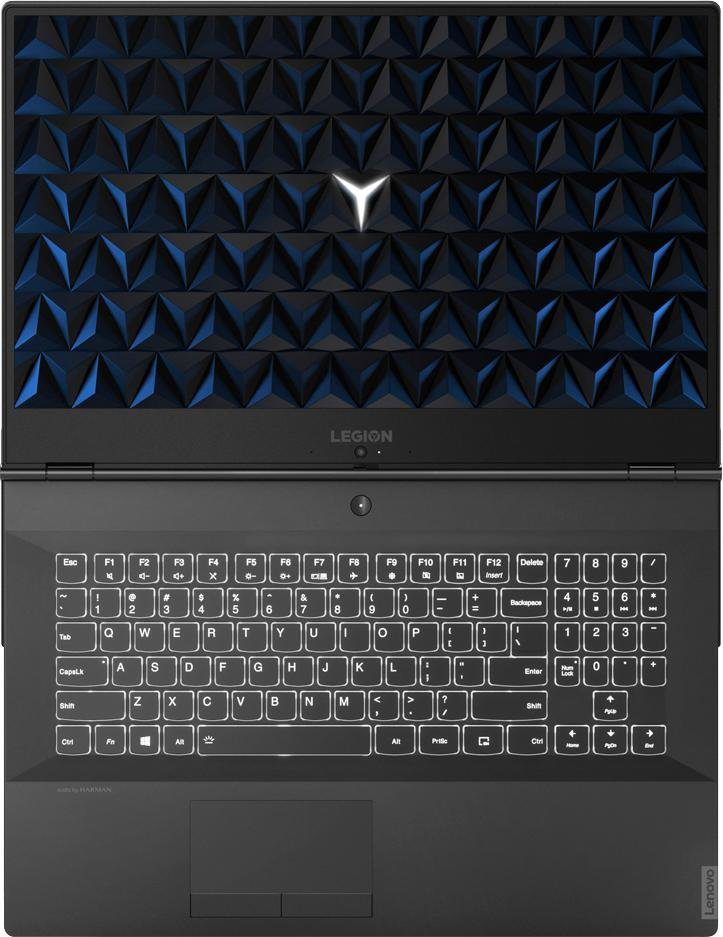
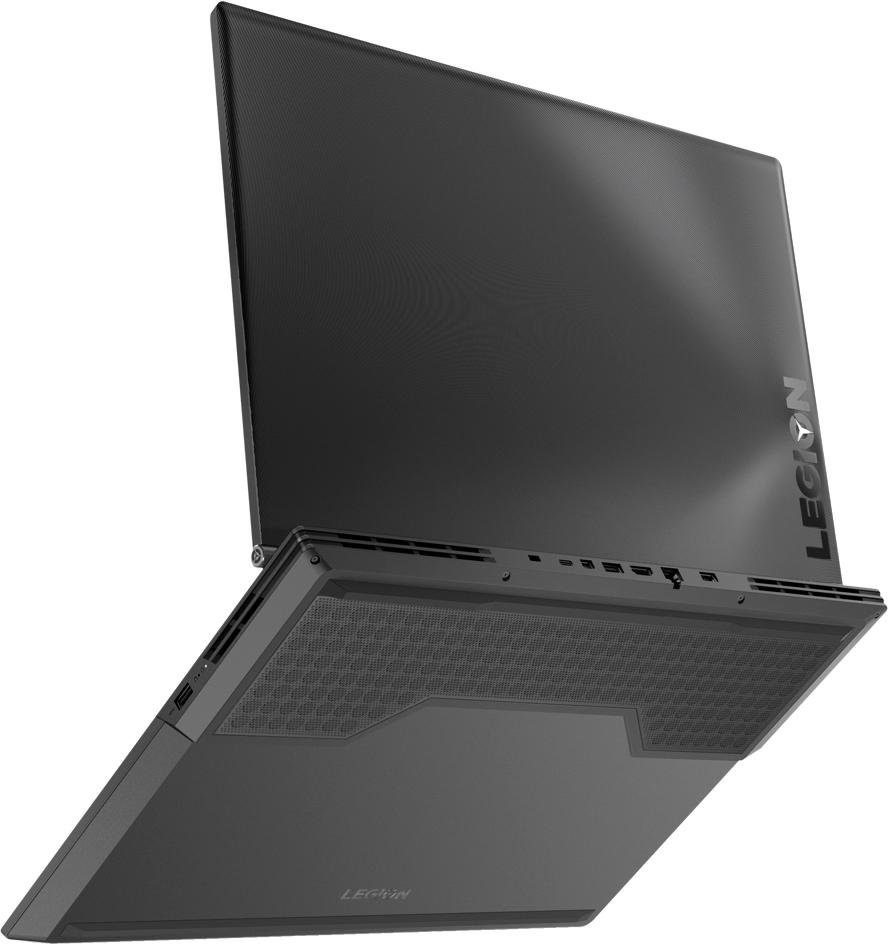
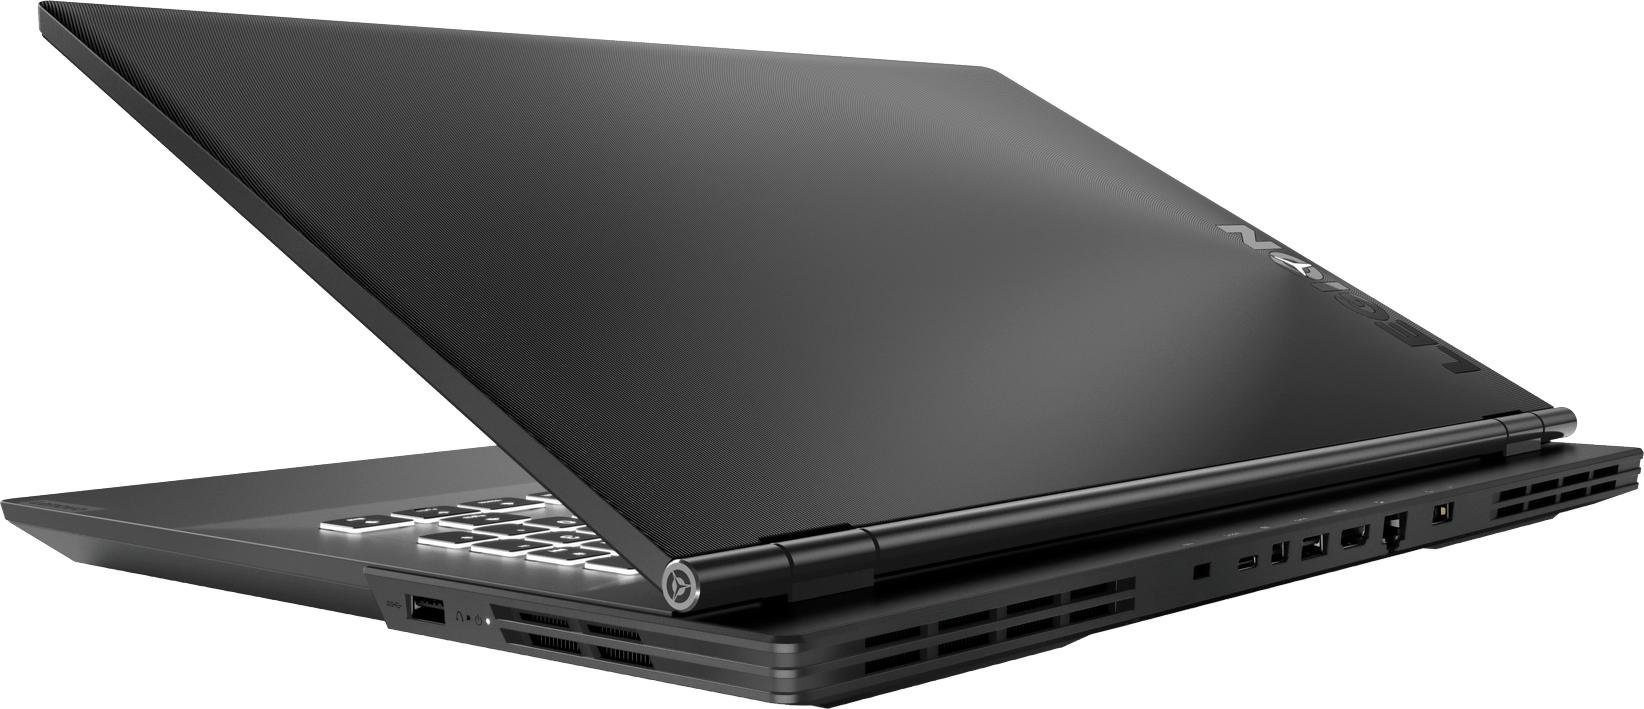
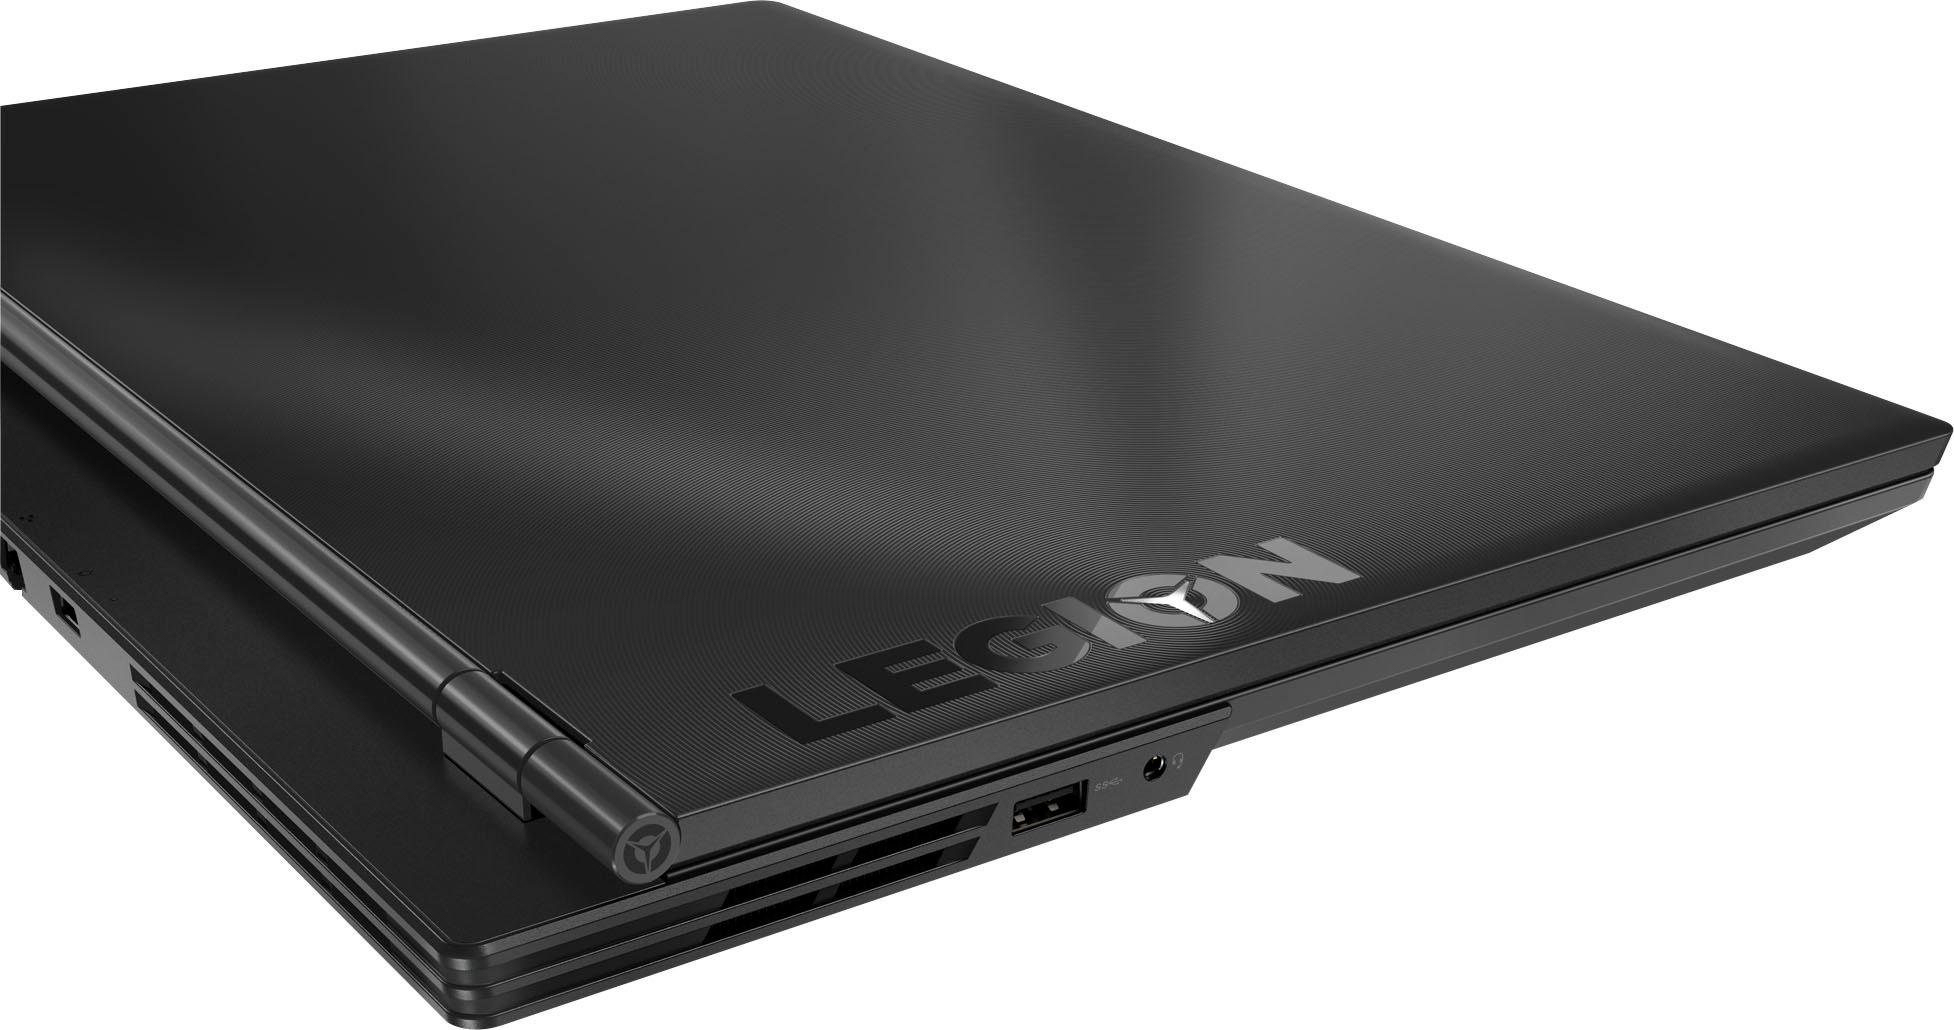
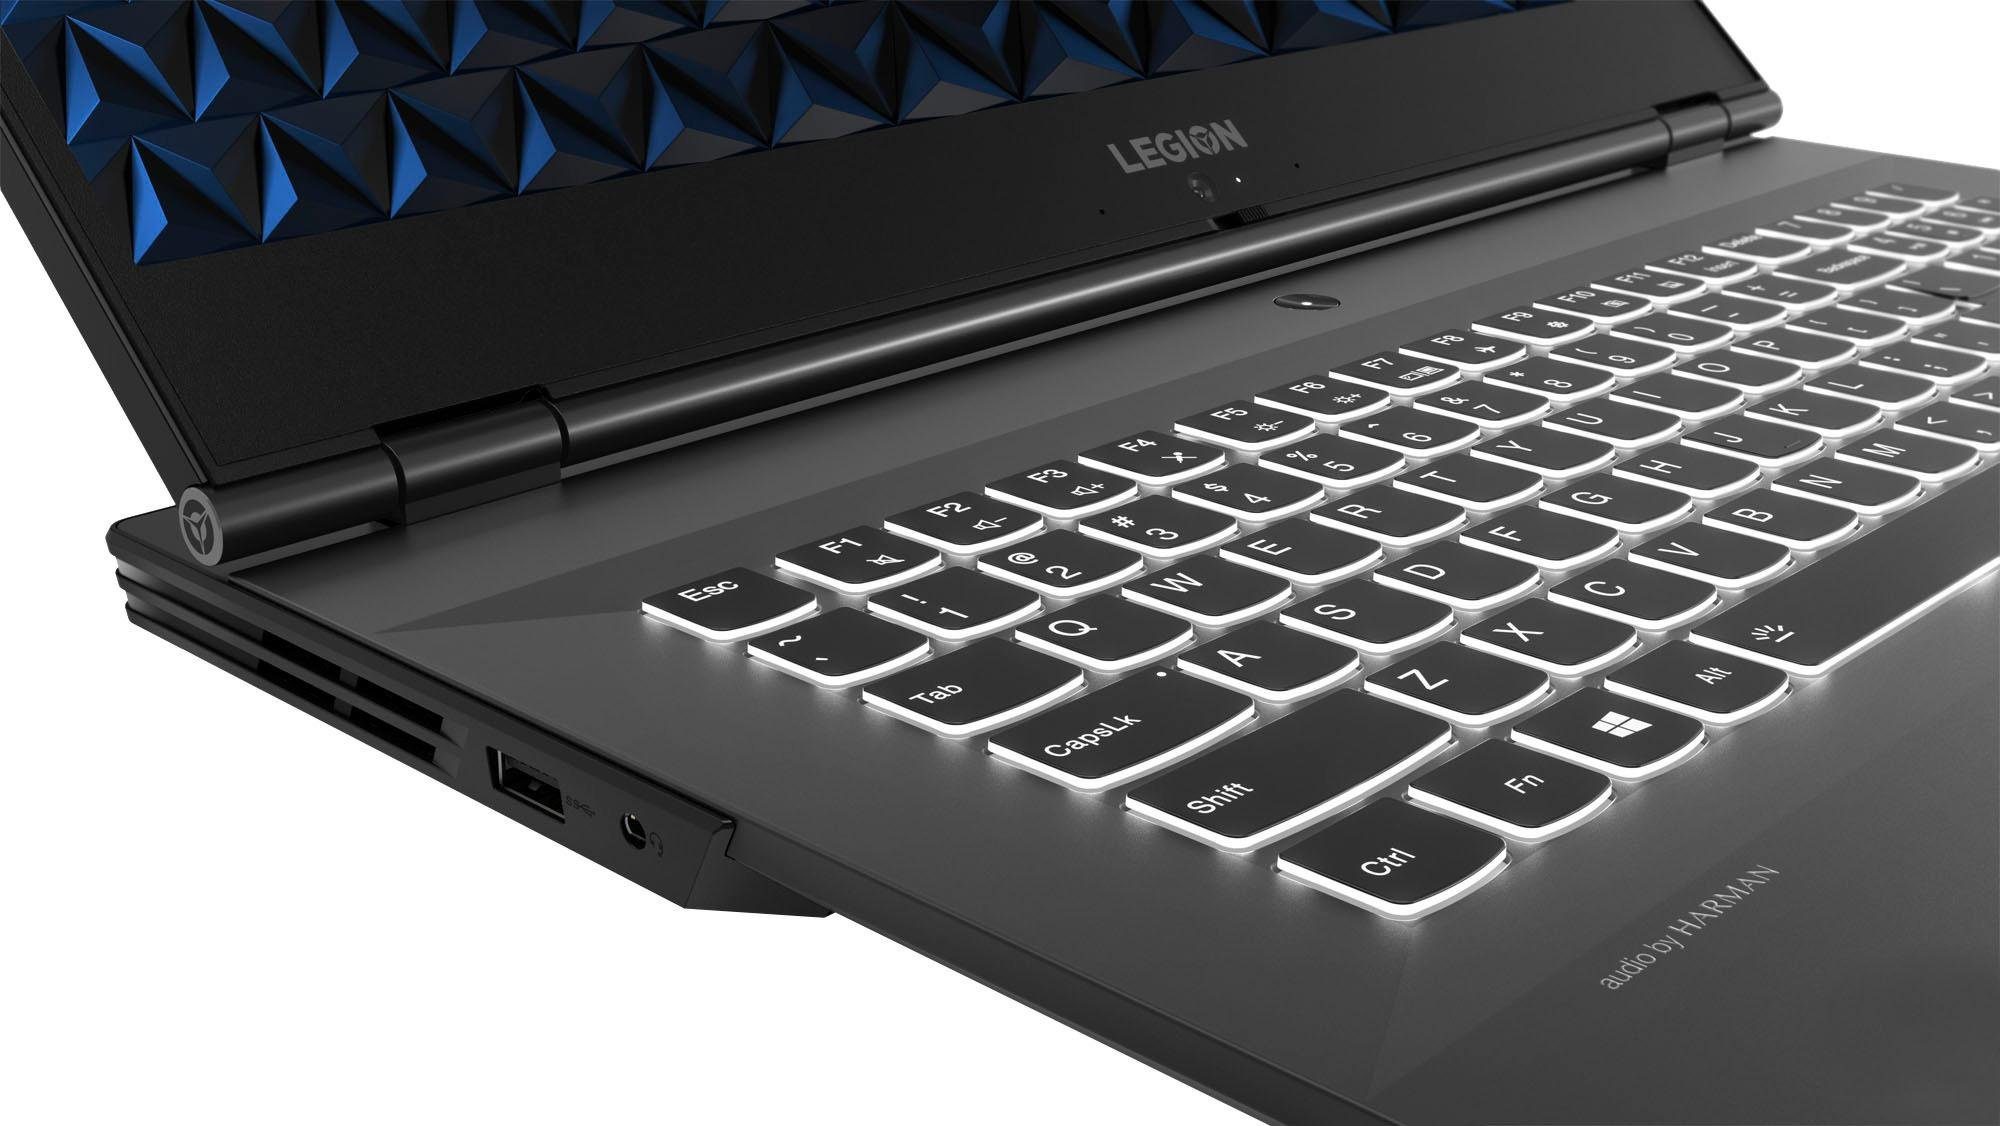
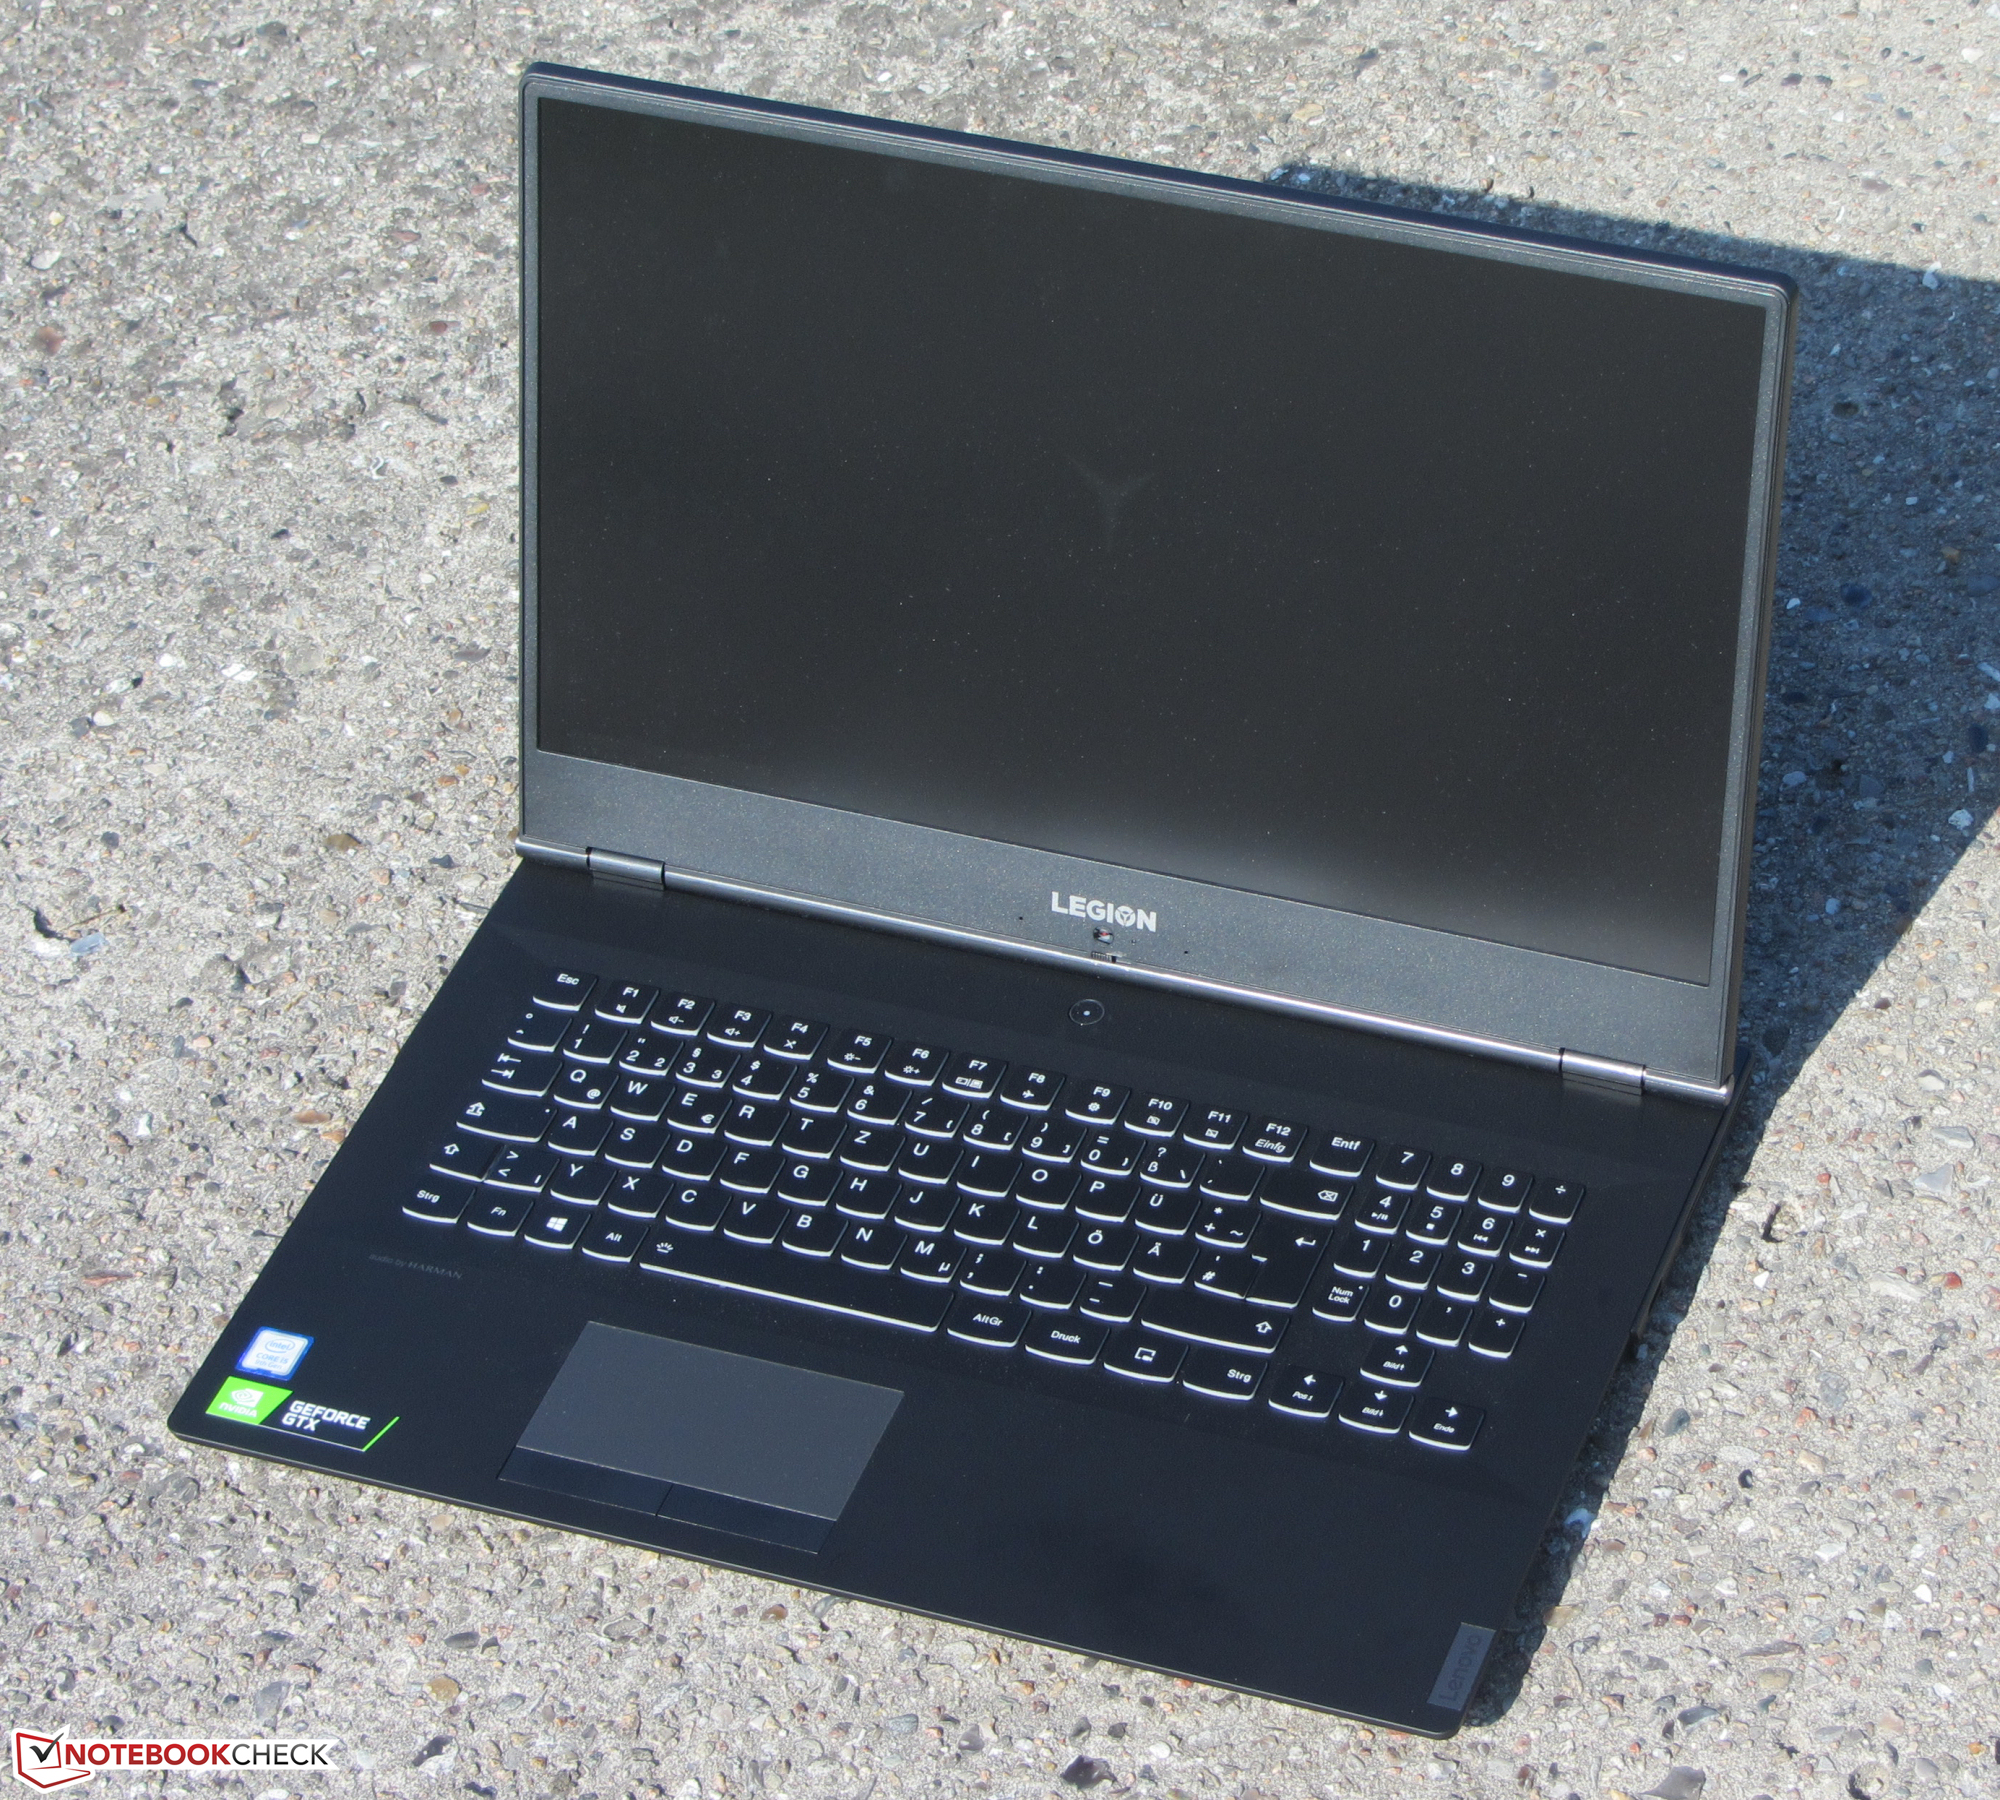
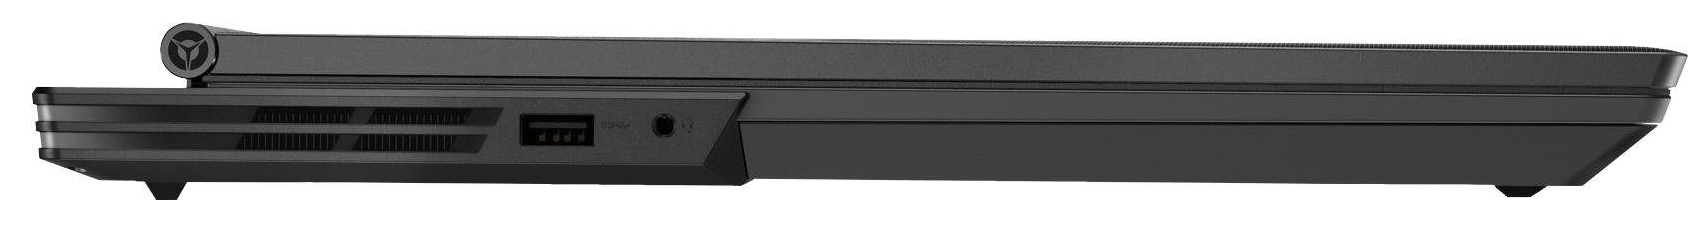
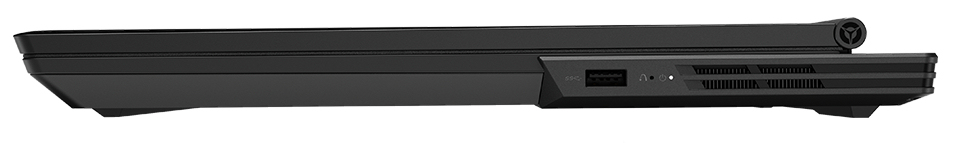
IPS-skärmen med 144 Hz bilduppdatering briljerar i våra tester tack vare korta responstider, breda betraktningsvinklar, bra kontrast och god färgåtergivning. Även om skärmens ljusstyrka är skaplig kunde den varit högre med tanke på datorns pris. Chiclet-tangentbordet passar bra för dagligt bruk. Bra: tangentbordet är bakgrundsbelyst trots att det inte har någon RGB-belysning. Portutbudet är ganska stort. Vi sörjer dock bristen på en Thunderbolt 3-port.
Batteritiden är inte märkvärdig vid leverans. Men den kan ökas rejält genom att slå på den inbyggda GPU:n som är mer ekonomisk. Detta kan göras genom Lenovos förinstallerade Vantage-mjukvara eller i BIOS. I vårt WiFi-test kunde vi öka batteritiden från 3:40 timmar till 5:22 timmar.
Lenovo Legion Y540-17IRH
- 05/14/2020 v7 (old)
Sascha Mölck
Price comparison
