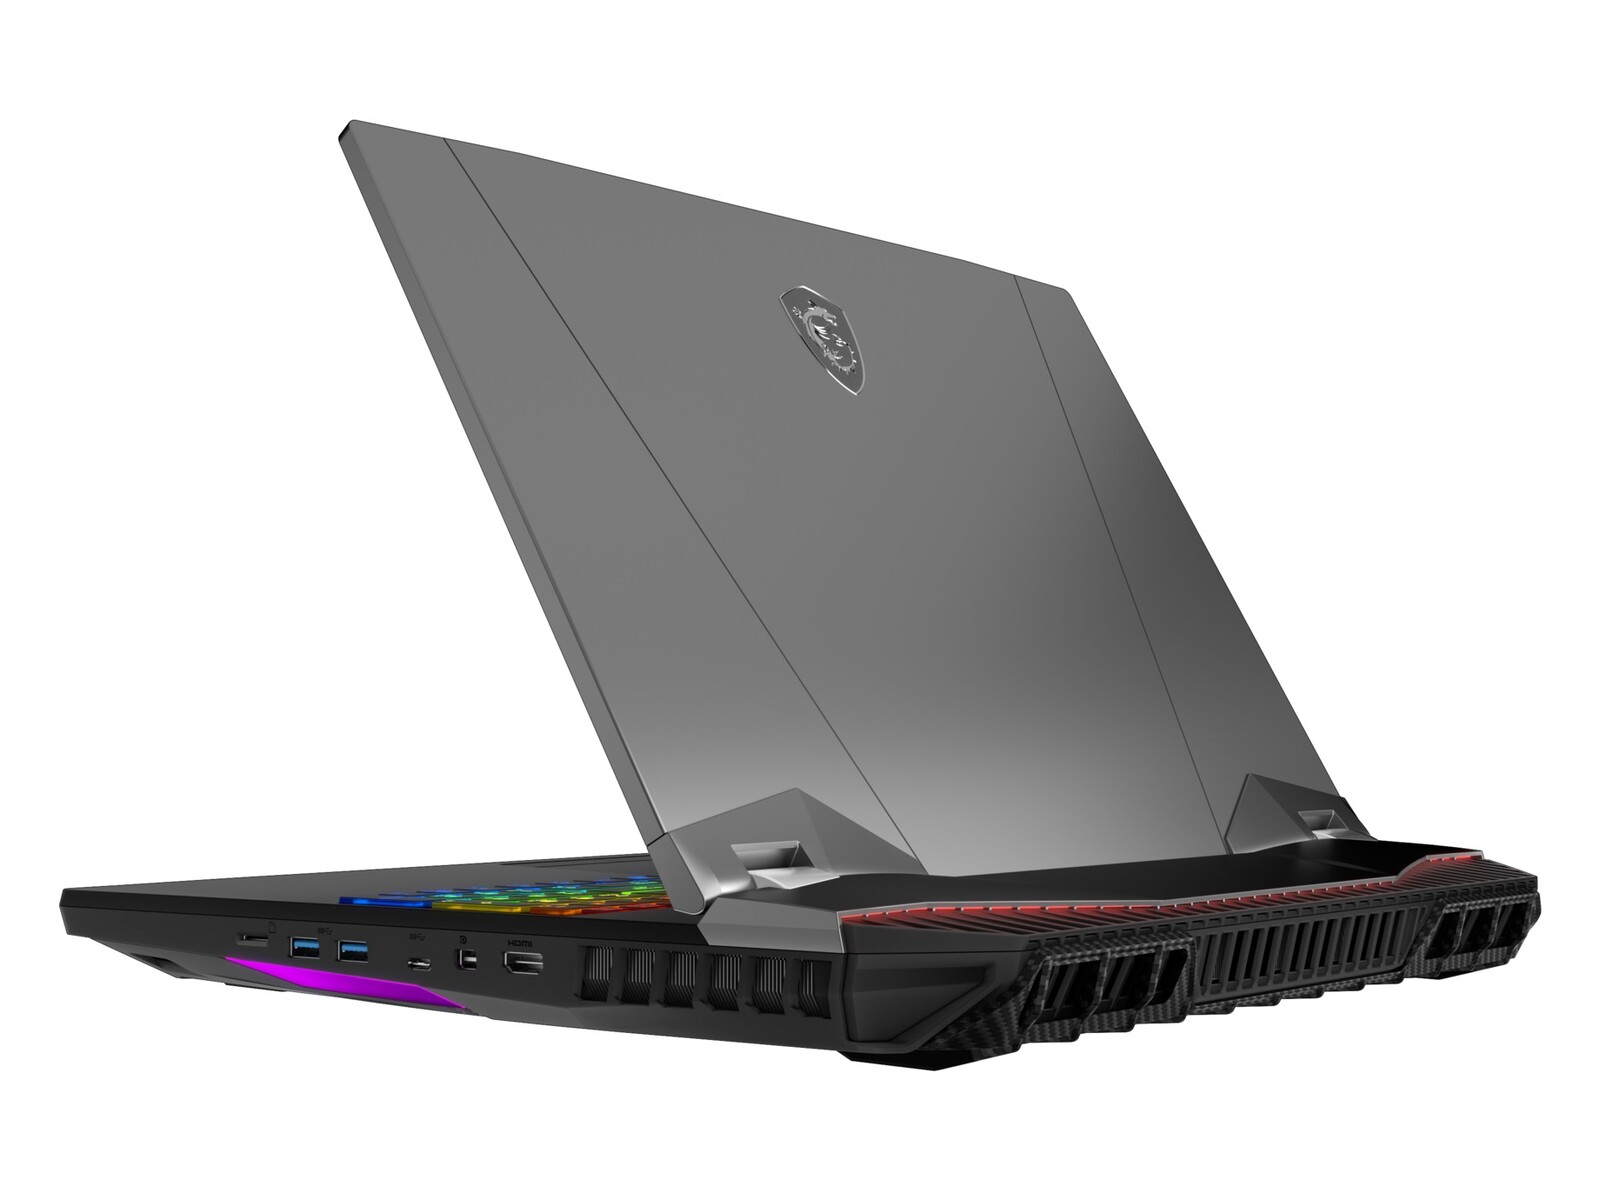
Test: MSI GT76 9SG - En Titan bland bärbara speldatorer
| |||||||||||||||||||||||||
Distribution av ljusstyrkan: 89 %
Mitt på batteriet: 396 cd/m²
Kontrast: 1200:1 (Svärta: 0.33 cd/m²)
ΔE ColorChecker Calman: 2.04 | ∀{0.5-29.43 Ø4.73}
calibrated: 0.82
ΔE Greyscale Calman: 2.83 | ∀{0.09-98 Ø4.97}
94% sRGB (Argyll 1.6.3 3D)
59% AdobeRGB 1998 (Argyll 1.6.3 3D)
64.3% AdobeRGB 1998 (Argyll 3D)
93.4% sRGB (Argyll 3D)
62.3% Display P3 (Argyll 3D)
Gamma: 2.49
CCT: 7113 K
| MSI GT76 Titan DT 9SG Chi Mei N173HCE-G33 (CMN175C), IPS, 1920x1080 | Alienware Area-51m i9-9900K RTX 2080 LG Philips 173WFG, IPS, 1920x1080 | Schenker XMG Ultra 17 Turing AU Optronics B173ZAN01.0 (AUO109B), IPS, 3840x2160 | MSI GE75 9SG Chi Mei N173HCE-G33, AHVA, 1920x1080 | Asus ROG G703GX AU Optronics B173HAN03.2 (AUO329D), IPS, 1920x1080 | |
|---|---|---|---|---|---|
| Display | 4% | 33% | -1% | 2% | |
| Display P3 Coverage (%) | 62.3 | 66.3 6% | 86.3 39% | 61.5 -1% | 64.1 3% |
| sRGB Coverage (%) | 93.4 | 96.9 4% | 100 7% | 92 -1% | 93.3 0% |
| AdobeRGB 1998 Coverage (%) | 64.3 | 66.5 3% | 99.1 54% | 63.5 -1% | 65.6 2% |
| Response Times | -37% | -268% | 22% | 7% | |
| Response Time Grey 50% / Grey 80% * (ms) | 8 ? | 13.2 ? -65% | 41.6 ? -420% | 7.2 ? 10% | 7.2 ? 10% |
| Response Time Black / White * (ms) | 10 ? | 10.8 ? -8% | 21.6 ? -116% | 6.6 ? 34% | 9.6 ? 4% |
| PWM Frequency (Hz) | 26040 ? | 26040 ? | |||
| Screen | -31% | -33% | 2% | -44% | |
| Brightness middle (cd/m²) | 396 | 335.2 -15% | 343 -13% | 400.7 1% | 296 -25% |
| Brightness (cd/m²) | 373 | 297 -20% | 328 -12% | 372 0% | 279 -25% |
| Brightness Distribution (%) | 89 | 82 -8% | 82 -8% | 89 0% | 85 -4% |
| Black Level * (cd/m²) | 0.33 | 0.66 -100% | 0.31 6% | 0.34 -3% | 0.25 24% |
| Contrast (:1) | 1200 | 508 -58% | 1106 -8% | 1179 -2% | 1184 -1% |
| Colorchecker dE 2000 * | 2.04 | 2.02 1% | 5.03 -147% | 1.33 35% | 4.77 -134% |
| Colorchecker dE 2000 max. * | 3.85 | 7.23 -88% | 7.91 -105% | 3.51 9% | 9.08 -136% |
| Colorchecker dE 2000 calibrated * | 0.82 | 1.17 -43% | 0.86 -5% | 1.39 -70% | 1.46 -78% |
| Greyscale dE 2000 * | 2.83 | 3.2 -13% | 6.29 -122% | 1.3 54% | 5.83 -106% |
| Gamma | 2.49 88% | 2.16 102% | 2.38 92% | 2.24 98% | 2.47 89% |
| CCT | 7113 91% | 6746 96% | 6389 102% | 6735 97% | 8076 80% |
| Color Space (Percent of AdobeRGB 1998) (%) | 59 | 61.3 4% | 88 49% | 58.2 -1% | 60 2% |
| Color Space (Percent of sRGB) (%) | 94 | 96.9 3% | 100 6% | 92.1 -2% | 93 -1% |
| Totalt genomsnitt (program/inställningar) | -21% /
-25% | -89% /
-50% | 8% /
4% | -12% /
-29% |
* ... mindre är bättre
Visa svarstider
| ↔ Svarstid svart till vitt | ||
|---|---|---|
| 10 ms ... stiga ↗ och falla ↘ kombinerat | ↗ 5.2 ms stiga | 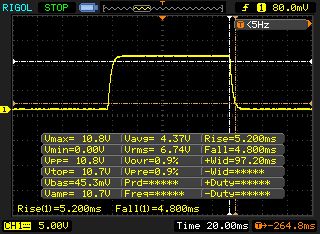 |
| ↘ 4.8 ms hösten | ||
| Skärmen visar bra svarsfrekvens i våra tester, men kan vara för långsam för konkurrenskraftiga spelare. I jämförelse sträcker sig alla testade enheter från 0.1 (minst) till 240 (maximalt) ms. » 27 % av alla enheter är bättre. Det betyder att den uppmätta svarstiden är bättre än genomsnittet av alla testade enheter (19.9 ms). | ||
| ↔ Svarstid 50 % grått till 80 % grått | ||
| 8 ms ... stiga ↗ och falla ↘ kombinerat | ↗ 4.4 ms stiga | 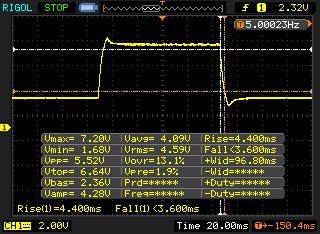 |
| ↘ 3.6 ms hösten | ||
| Skärmen visar snabba svarsfrekvenser i våra tester och bör passa för spel. I jämförelse sträcker sig alla testade enheter från 0.165 (minst) till 636 (maximalt) ms. » 21 % av alla enheter är bättre. Det betyder att den uppmätta svarstiden är bättre än genomsnittet av alla testade enheter (31.1 ms). | ||
Skärmflimmer / PWM (Puls-Width Modulation)
| Skärmflimmer / PWM upptäckt | 26040 Hz | ≤ 20 % ljusstyrka inställning | 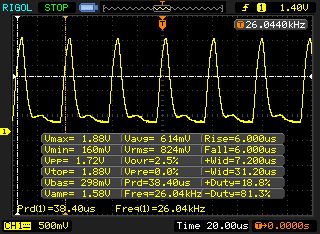 |
Displayens bakgrundsbelysning flimrar vid 26040 Hz (i värsta fall, t.ex. med PWM) Flimrande upptäckt vid en ljusstyrkeinställning på 20 % och lägre. Det ska inte finnas något flimmer eller PWM över denna ljusstyrkeinställning. Frekvensen för 26040 Hz är ganska hög, så de flesta användare som är känsliga för PWM bör inte märka något flimmer. Som jämförelse: 52 % av alla testade enheter använder inte PWM för att dämpa skärmen. Om PWM upptäcktes mättes ett medelvärde av 7784 (minst: 5 - maximum: 343500) Hz. | |||
| Cinebench R20 | |
| CPU (Single Core) | |
| Genomsnitt av klass Gaming (442 - 895, n=109, senaste 2 åren) | |
| MSI GT76 Titan DT 9SG | |
| MSI GE75 9SG | |
| CPU (Multi Core) | |
| Genomsnitt av klass Gaming (4029 - 16108, n=109, senaste 2 åren) | |
| MSI GT76 Titan DT 9SG | |
| MSI GE75 9SG | |
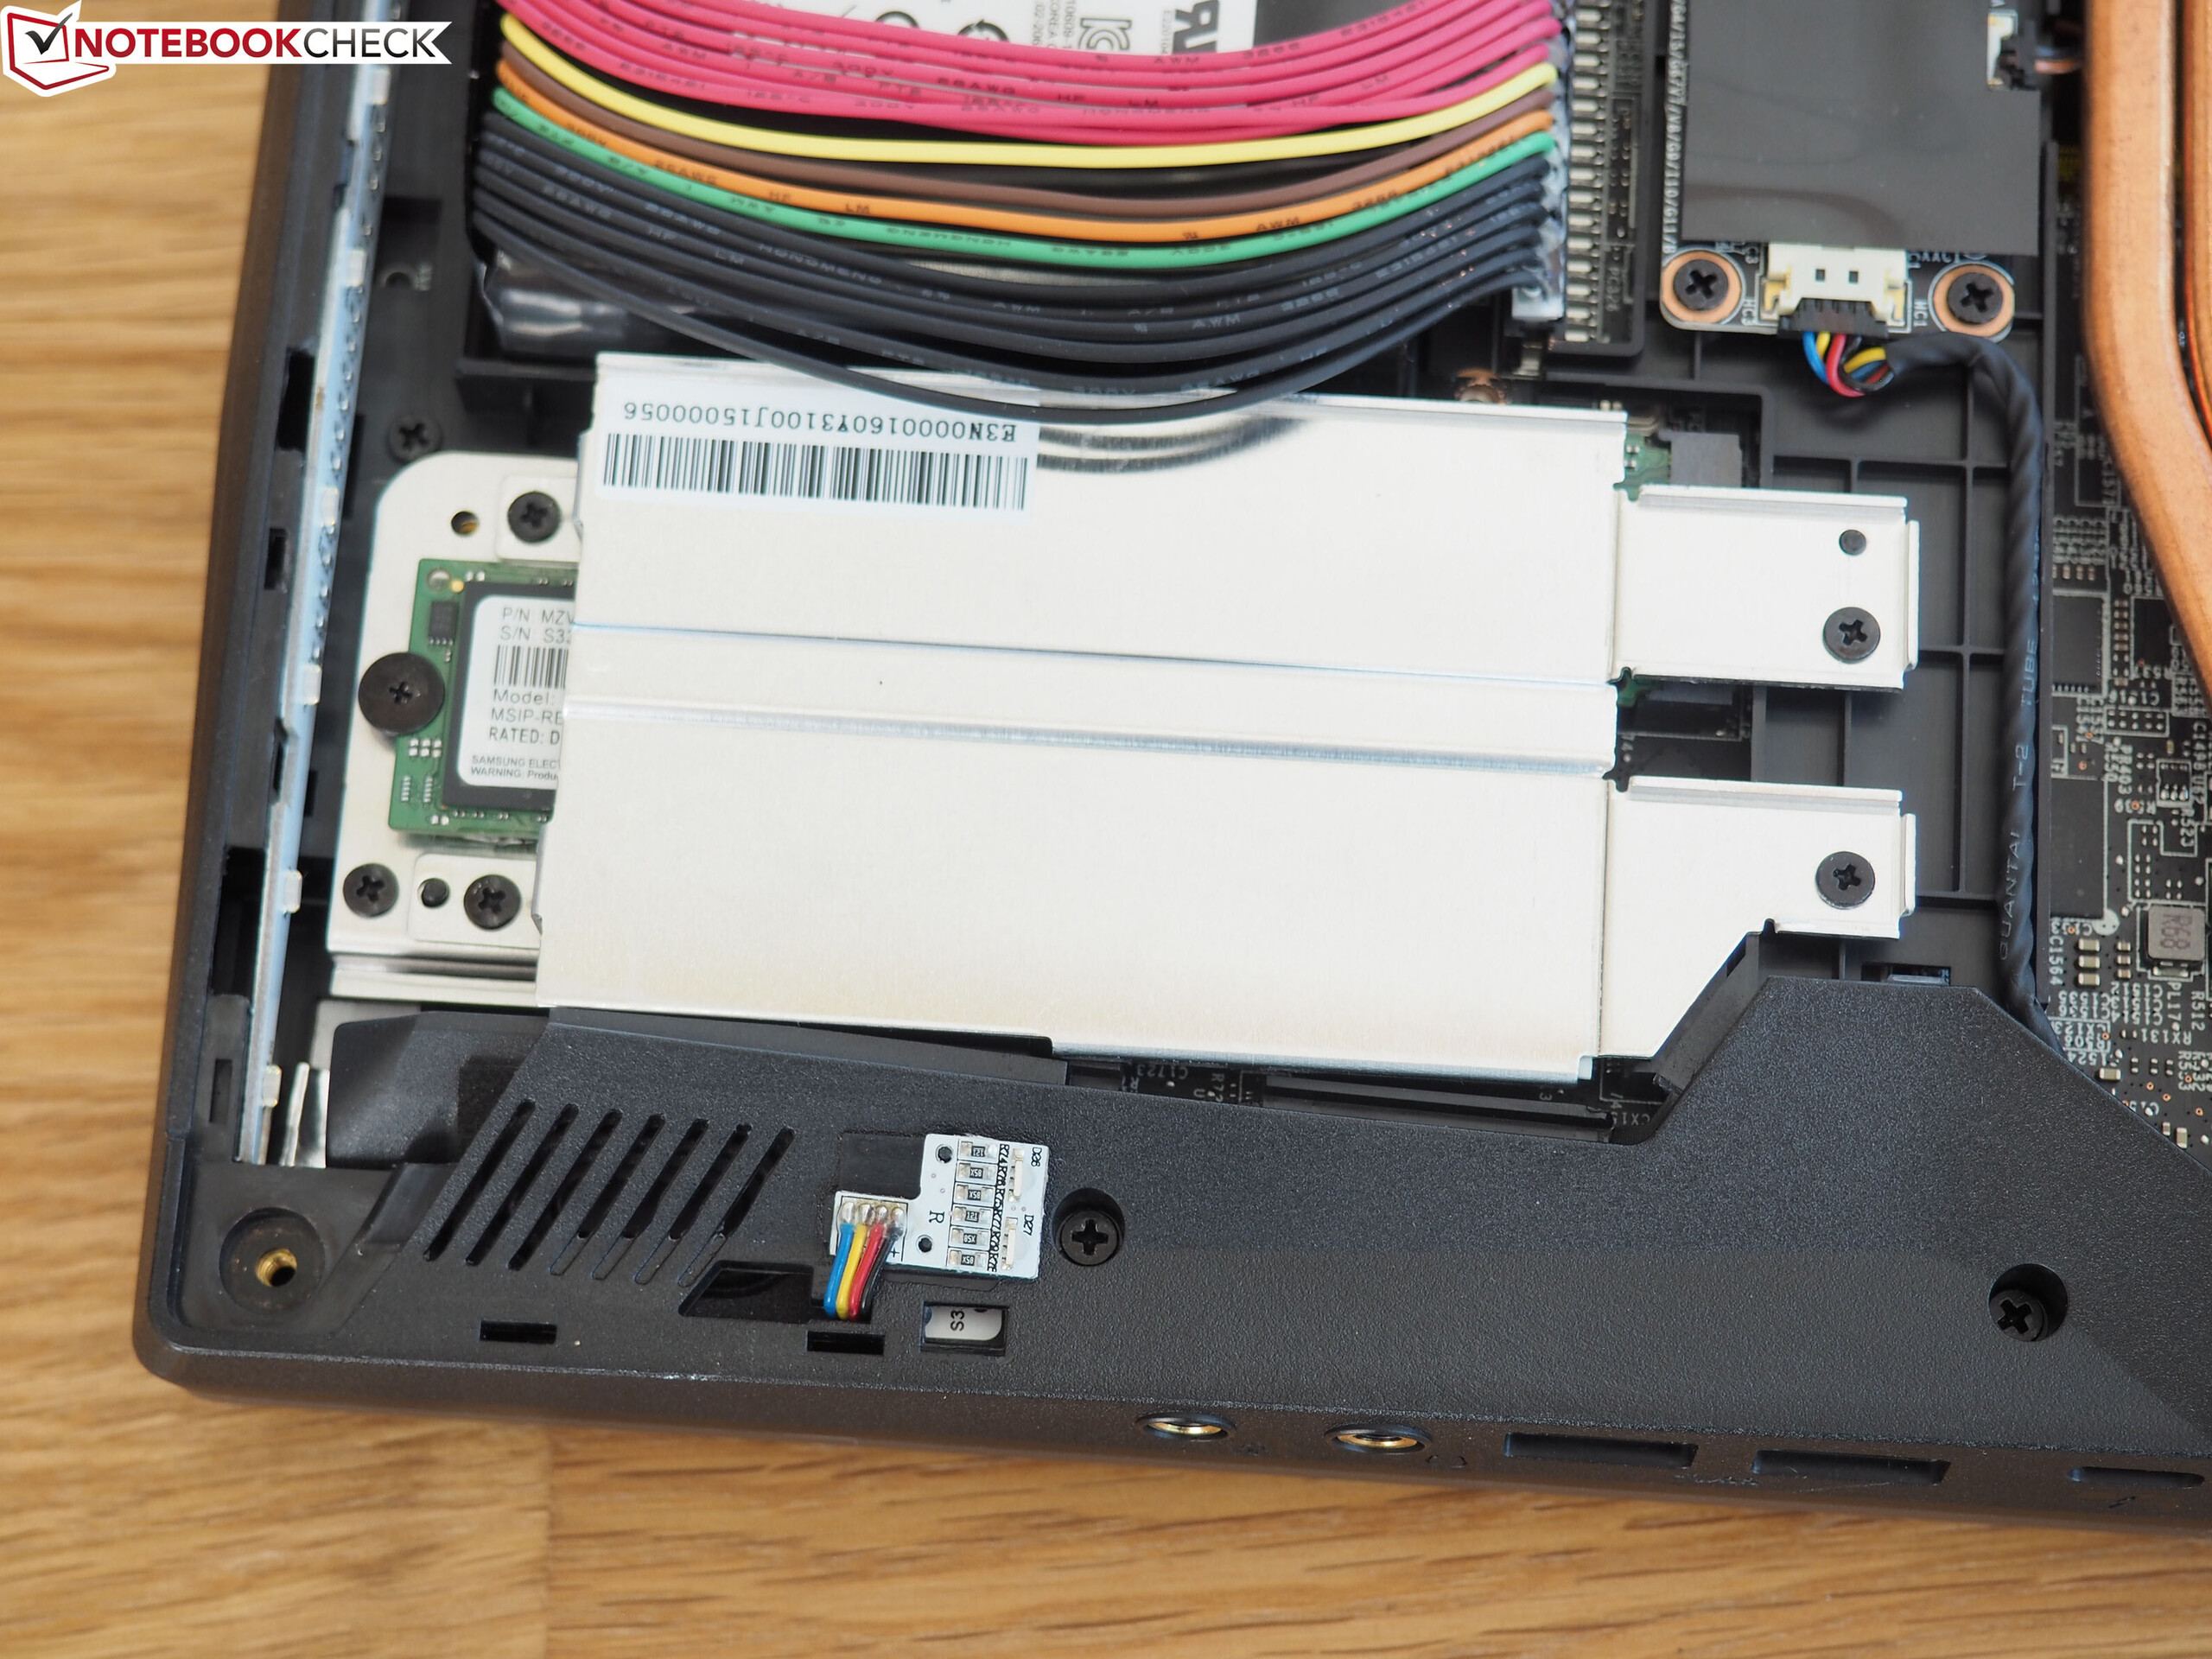
| MSI GT76 Titan DT 9SG 2x Samsung PM961 MZVLW256HEHP (RAID 0) | Alienware Area-51m i9-9900K RTX 2080 2x SK Hynix PC400 512GB (RAID 0) | Schenker XMG Ultra 17 Turing Samsung SSD 970 EVO Plus 500GB | MSI GE75 9SG Samsung SSD PM981 MZVLB1T0HALR | Asus ROG G703GX Samsung SSD PM981 MZVLB512HAJQ | |
|---|---|---|---|---|---|
| CrystalDiskMark 5.2 / 6 | 20% | 25% | -3% | -15% | |
| Write 4K (MB/s) | 101.4 | 111.1 10% | 183.2 81% | 116.1 14% | 90.4 -11% |
| Read 4K (MB/s) | 40.57 | 45.47 12% | 52.4 29% | 44.98 11% | 39.19 -3% |
| Write Seq (MB/s) | 2229 | 2454 10% | 1790 -20% | 2370 6% | 1863 -16% |
| Read Seq (MB/s) | 2528 | 2212 -12% | 1743 -31% | 1465 -42% | 2100 -17% |
| Write 4K Q32T1 (MB/s) | 379.6 | 622 64% | 550 45% | 337.5 -11% | 260.2 -31% |
| Read 4K Q32T1 (MB/s) | 421.9 | 695 65% | 648 54% | 453.6 8% | 297 -30% |
| Write Seq Q32T1 (MB/s) | 2439 | 2675 10% | 3236 33% | 2399 -2% | 1870 -23% |
| Read Seq Q32T1 (MB/s) | 3199 | 3184 0% | 3538 11% | 3087 -4% | 3471 9% |
| 3DMark Cloud Gate Standard Score | 58737 poäng | |
| 3DMark Fire Strike Score | 21988 poäng | |
| 3DMark Time Spy Score | 10290 poäng | |
Hjälp | ||
| The Witcher 3 - 1920x1080 Ultra Graphics & Postprocessing (HBAO+) | |
| Genomsnitt av klass Gaming (95 - 240, n=8, senaste 2 åren) | |
| Alienware Area-51m i9-9900K RTX 2080 | |
| MSI GT76 Titan DT 9SG | |
| Asus ROG G703GX | |
| MSI GE75 9SG | |
| Schenker XMG Ultra 17 Turing | |
| låg | med. | hög | ultra | QHD | 4K | |
|---|---|---|---|---|---|---|
| The Witcher 3 (2015) | 186 | 100 | 66.9 | |||
| Apex Legends (2019) | 144 | 144 | 144 | 128 | 75 | |
| Far Cry New Dawn (2019) | 128 | 121 | 108 | 96 | 57 | |
| Metro Exodus (2019) | 109 | 82.2 | 68.3 | 54.4 | 35.6 | |
| Anthem (2019) | 130 | 120 | 112 | 83.7 | 48.6 | |
| Dirt Rally 2.0 (2019) | 212 | 171 | 101 | 79.2 | ||
| The Division 2 (2019) | 169 | 136 | 103 | 72 | 40 | |
| Anno 1800 (2019) | 115 | 92.2 | 54.3 | 47.8 | 34.9 | |
| Rage 2 (2019) | 144 | 122 | 119 | 78.1 | 39.1 |
Ljudnivå
| Låg belastning |
| 33 / 34 / 44 dB(A) |
| Hög belastning |
| 47 / 59 dB(A) |
 | ||
30 dB tyst 40 dB(A) hörbar 50 dB(A) högt ljud |
||
min: | ||
| MSI GT76 Titan DT 9SG i9-9900K, GeForce RTX 2080 Mobile | Alienware Area-51m i9-9900K RTX 2080 i9-9900K, GeForce RTX 2080 Mobile | Schenker XMG Ultra 17 Turing i9-9900K, GeForce RTX 2080 Mobile | MSI GE75 9SG i9-9880H, GeForce RTX 2080 Mobile | Asus ROG G703GX i7-8750H, GeForce RTX 2080 Mobile | Genomsnitt av klass Gaming | |
|---|---|---|---|---|---|---|
| Noise | 4% | 5% | 10% | 5% | 18% | |
| av / miljö * (dB) | 30 | 28.1 6% | 30 -0% | 28.2 6% | 30 -0% | 24.1 ? 20% |
| Idle Minimum * (dB) | 33 | 28.1 15% | 30 9% | 30.4 8% | 30 9% | 25.8 ? 22% |
| Idle Average * (dB) | 34 | 28.6 16% | 33 3% | 30.4 11% | 35 -3% | 27.4 ? 19% |
| Idle Maximum * (dB) | 44 | 51 -16% | 35 20% | 33.4 24% | 41 7% | 29.9 ? 32% |
| Load Average * (dB) | 47 | 51 -9% | 44 6% | 37.1 21% | 44 6% | 43 ? 9% |
| Witcher 3 ultra * (dB) | 53 | 51 4% | 55 -4% | 54.2 -2% | 51 4% | |
| Load Maximum * (dB) | 59 | 51 14% | 58 2% | 56.4 4% | 52 12% | 54 ? 8% |
* ... mindre är bättre
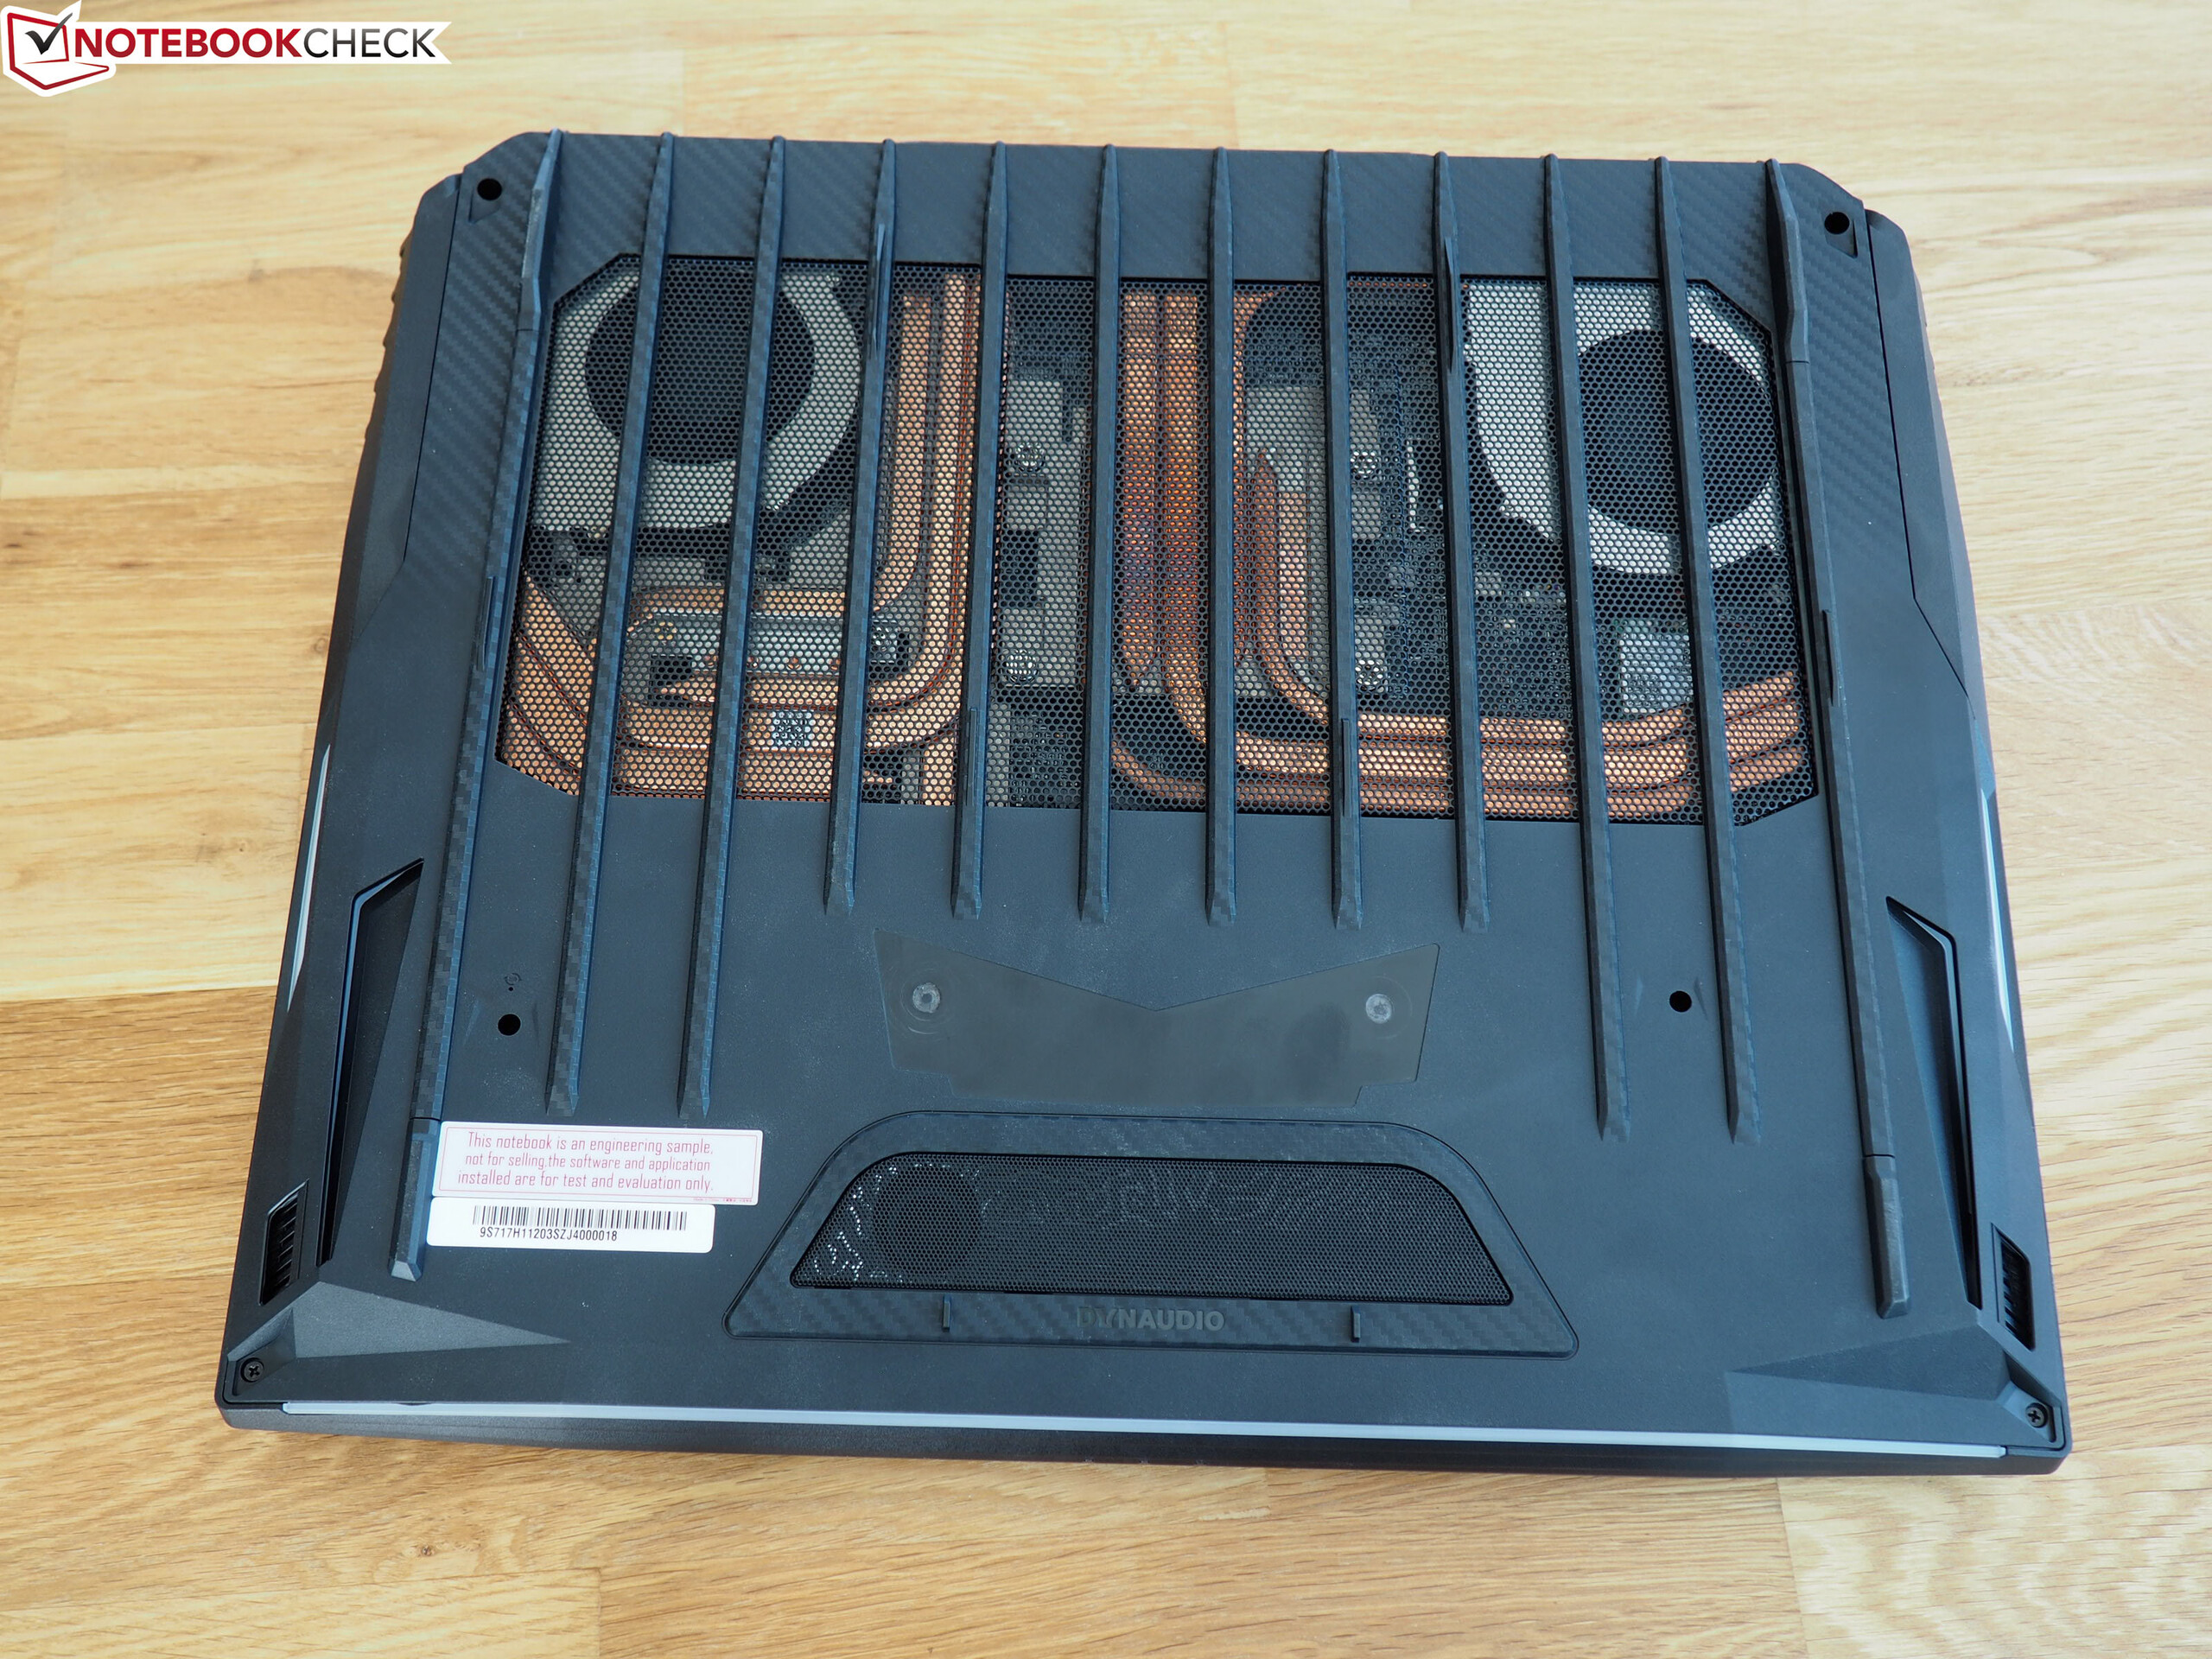
(-) Den maximala temperaturen på ovansidan är 51 °C / 124 F, jämfört med genomsnittet av 40.4 °C / 105 F , allt från 21.2 till 68.8 °C för klassen Gaming.
(-) Botten värms upp till maximalt 57 °C / 135 F, jämfört med genomsnittet av 43.2 °C / 110 F
(+) Vid tomgångsbruk är medeltemperaturen för ovansidan 25.3 °C / 78 F, jämfört med enhetsgenomsnittet på 33.9 °C / ### class_avg_f### F.
(-) När du spelar The Witcher 3 är medeltemperaturen för ovansidan 41.4 °C / 107 F, jämfört med enhetsgenomsnittet på 33.9 °C / ## #class_avg_f### F.
(±) Handledsstöden och pekplattan kan bli väldigt varma vid beröring med maximalt 37 °C / 98.6 F.
(-) Medeltemperaturen för handledsstödsområdet på liknande enheter var 28.8 °C / 83.8 F (-8.2 °C / -14.8 F).
| MSI GT76 Titan DT 9SG i9-9900K, GeForce RTX 2080 Mobile | Alienware Area-51m i9-9900K RTX 2080 i9-9900K, GeForce RTX 2080 Mobile | Schenker XMG Ultra 17 Turing i9-9900K, GeForce RTX 2080 Mobile | MSI GE75 9SG i9-9880H, GeForce RTX 2080 Mobile | Asus ROG G703GX i7-8750H, GeForce RTX 2080 Mobile | Genomsnitt av klass Gaming | |
|---|---|---|---|---|---|---|
| Heat | -10% | -6% | -21% | -5% | -4% | |
| Maximum Upper Side * (°C) | 51 | 47 8% | 45 12% | 48.8 4% | 50 2% | 45.2 ? 11% |
| Maximum Bottom * (°C) | 57 | 58.8 -3% | 45 21% | 52 9% | 50 12% | 47.9 ? 16% |
| Idle Upper Side * (°C) | 26 | 31 -19% | 36 -38% | 36.2 -39% | 30 -15% | 31.1 ? -20% |
| Idle Bottom * (°C) | 28 | 35 -25% | 33 -18% | 44.4 -59% | 33 -18% | 34.2 ? -22% |
* ... mindre är bättre
MSI GT76 Titan DT 9SG ljudanalys
(+) | högtalare kan spela relativt högt (90 dB)
Bas 100 - 315 Hz
(±) | reducerad bas - i genomsnitt 7.6% lägre än medianen
(±) | linjäriteten för basen är genomsnittlig (11% delta till föregående frekvens)
Mellan 400 - 2000 Hz
(±) | högre mellan - i genomsnitt 7% högre än median
(±) | linjäriteten för mids är genomsnittlig (7.2% delta till föregående frekvens)
Högsta 2 - 16 kHz
(+) | balanserade toppar - endast 3.8% från medianen
(+) | toppar är linjära (4.5% delta till föregående frekvens)
Totalt 100 - 16 000 Hz
(+) | det totala ljudet är linjärt (13.1% skillnad mot median)
Jämfört med samma klass
» 18% av alla testade enheter i den här klassen var bättre, 4% liknande, 78% sämre
» Den bästa hade ett delta på 6%, genomsnittet var 18%, sämst var 132%
Jämfört med alla testade enheter
» 13% av alla testade enheter var bättre, 3% liknande, 84% sämre
» Den bästa hade ett delta på 4%, genomsnittet var 24%, sämst var 134%
MSI GT75 8RG-090 Titan ljudanalys
(+) | högtalare kan spela relativt högt (94 dB)
Bas 100 - 315 Hz
(±) | reducerad bas - i genomsnitt 9.4% lägre än medianen
(±) | linjäriteten för basen är genomsnittlig (8.7% delta till föregående frekvens)
Mellan 400 - 2000 Hz
(±) | högre mellan - i genomsnitt 6.8% högre än median
(±) | linjäriteten för mids är genomsnittlig (8.4% delta till föregående frekvens)
Högsta 2 - 16 kHz
(±) | högre toppar - i genomsnitt 5% högre än medianen
(±) | linjäriteten för toppar är genomsnittlig (7.8% delta till föregående frekvens)
Totalt 100 - 16 000 Hz
(+) | det totala ljudet är linjärt (14.4% skillnad mot median)
Jämfört med samma klass
» 27% av alla testade enheter i den här klassen var bättre, 7% liknande, 66% sämre
» Den bästa hade ett delta på 6%, genomsnittet var 18%, sämst var 132%
Jämfört med alla testade enheter
» 18% av alla testade enheter var bättre, 4% liknande, 78% sämre
» Den bästa hade ett delta på 4%, genomsnittet var 24%, sämst var 134%
| Av/Standby | |
| Låg belastning | |
| Hög belastning |
|
Förklaring:
min: | |
| MSI GT76 Titan DT 9SG i9-9900K, GeForce RTX 2080 Mobile | Alienware Area-51m i9-9900K RTX 2080 i9-9900K, GeForce RTX 2080 Mobile | Schenker XMG Ultra 17 Turing i9-9900K, GeForce RTX 2080 Mobile | MSI GE75 9SG i9-9880H, GeForce RTX 2080 Mobile | Asus ROG G703GX i7-8750H, GeForce RTX 2080 Mobile | Genomsnitt av klass Gaming | |
|---|---|---|---|---|---|---|
| Power Consumption | -42% | -74% | 8% | -4% | 9% | |
| Idle Minimum * (Watt) | 14 | 23.3 -66% | 39 -179% | 13.9 1% | 5 64% | 13.2 ? 6% |
| Idle Average * (Watt) | 18 | 33.5 -86% | 45 -150% | 18.8 -4% | 24 -33% | 18.9 ? -5% |
| Idle Maximum * (Watt) | 23 | 38.4 -67% | 55 -139% | 23.1 -0% | 42 -83% | 24.3 ? -6% |
| Load Average * (Watt) | 114 | 114.1 -0% | 122 -7% | 112.3 1% | 112 2% | 108.3 ? 5% |
| Witcher 3 ultra * (Watt) | 283 | 339.5 -20% | 259 8% | 231 18% | 284 -0% | |
| Load Maximum * (Watt) | 443 | 485.1 -10% | 346 22% | 291.5 34% | 320 28% | 254 ? 43% |
* ... mindre är bättre
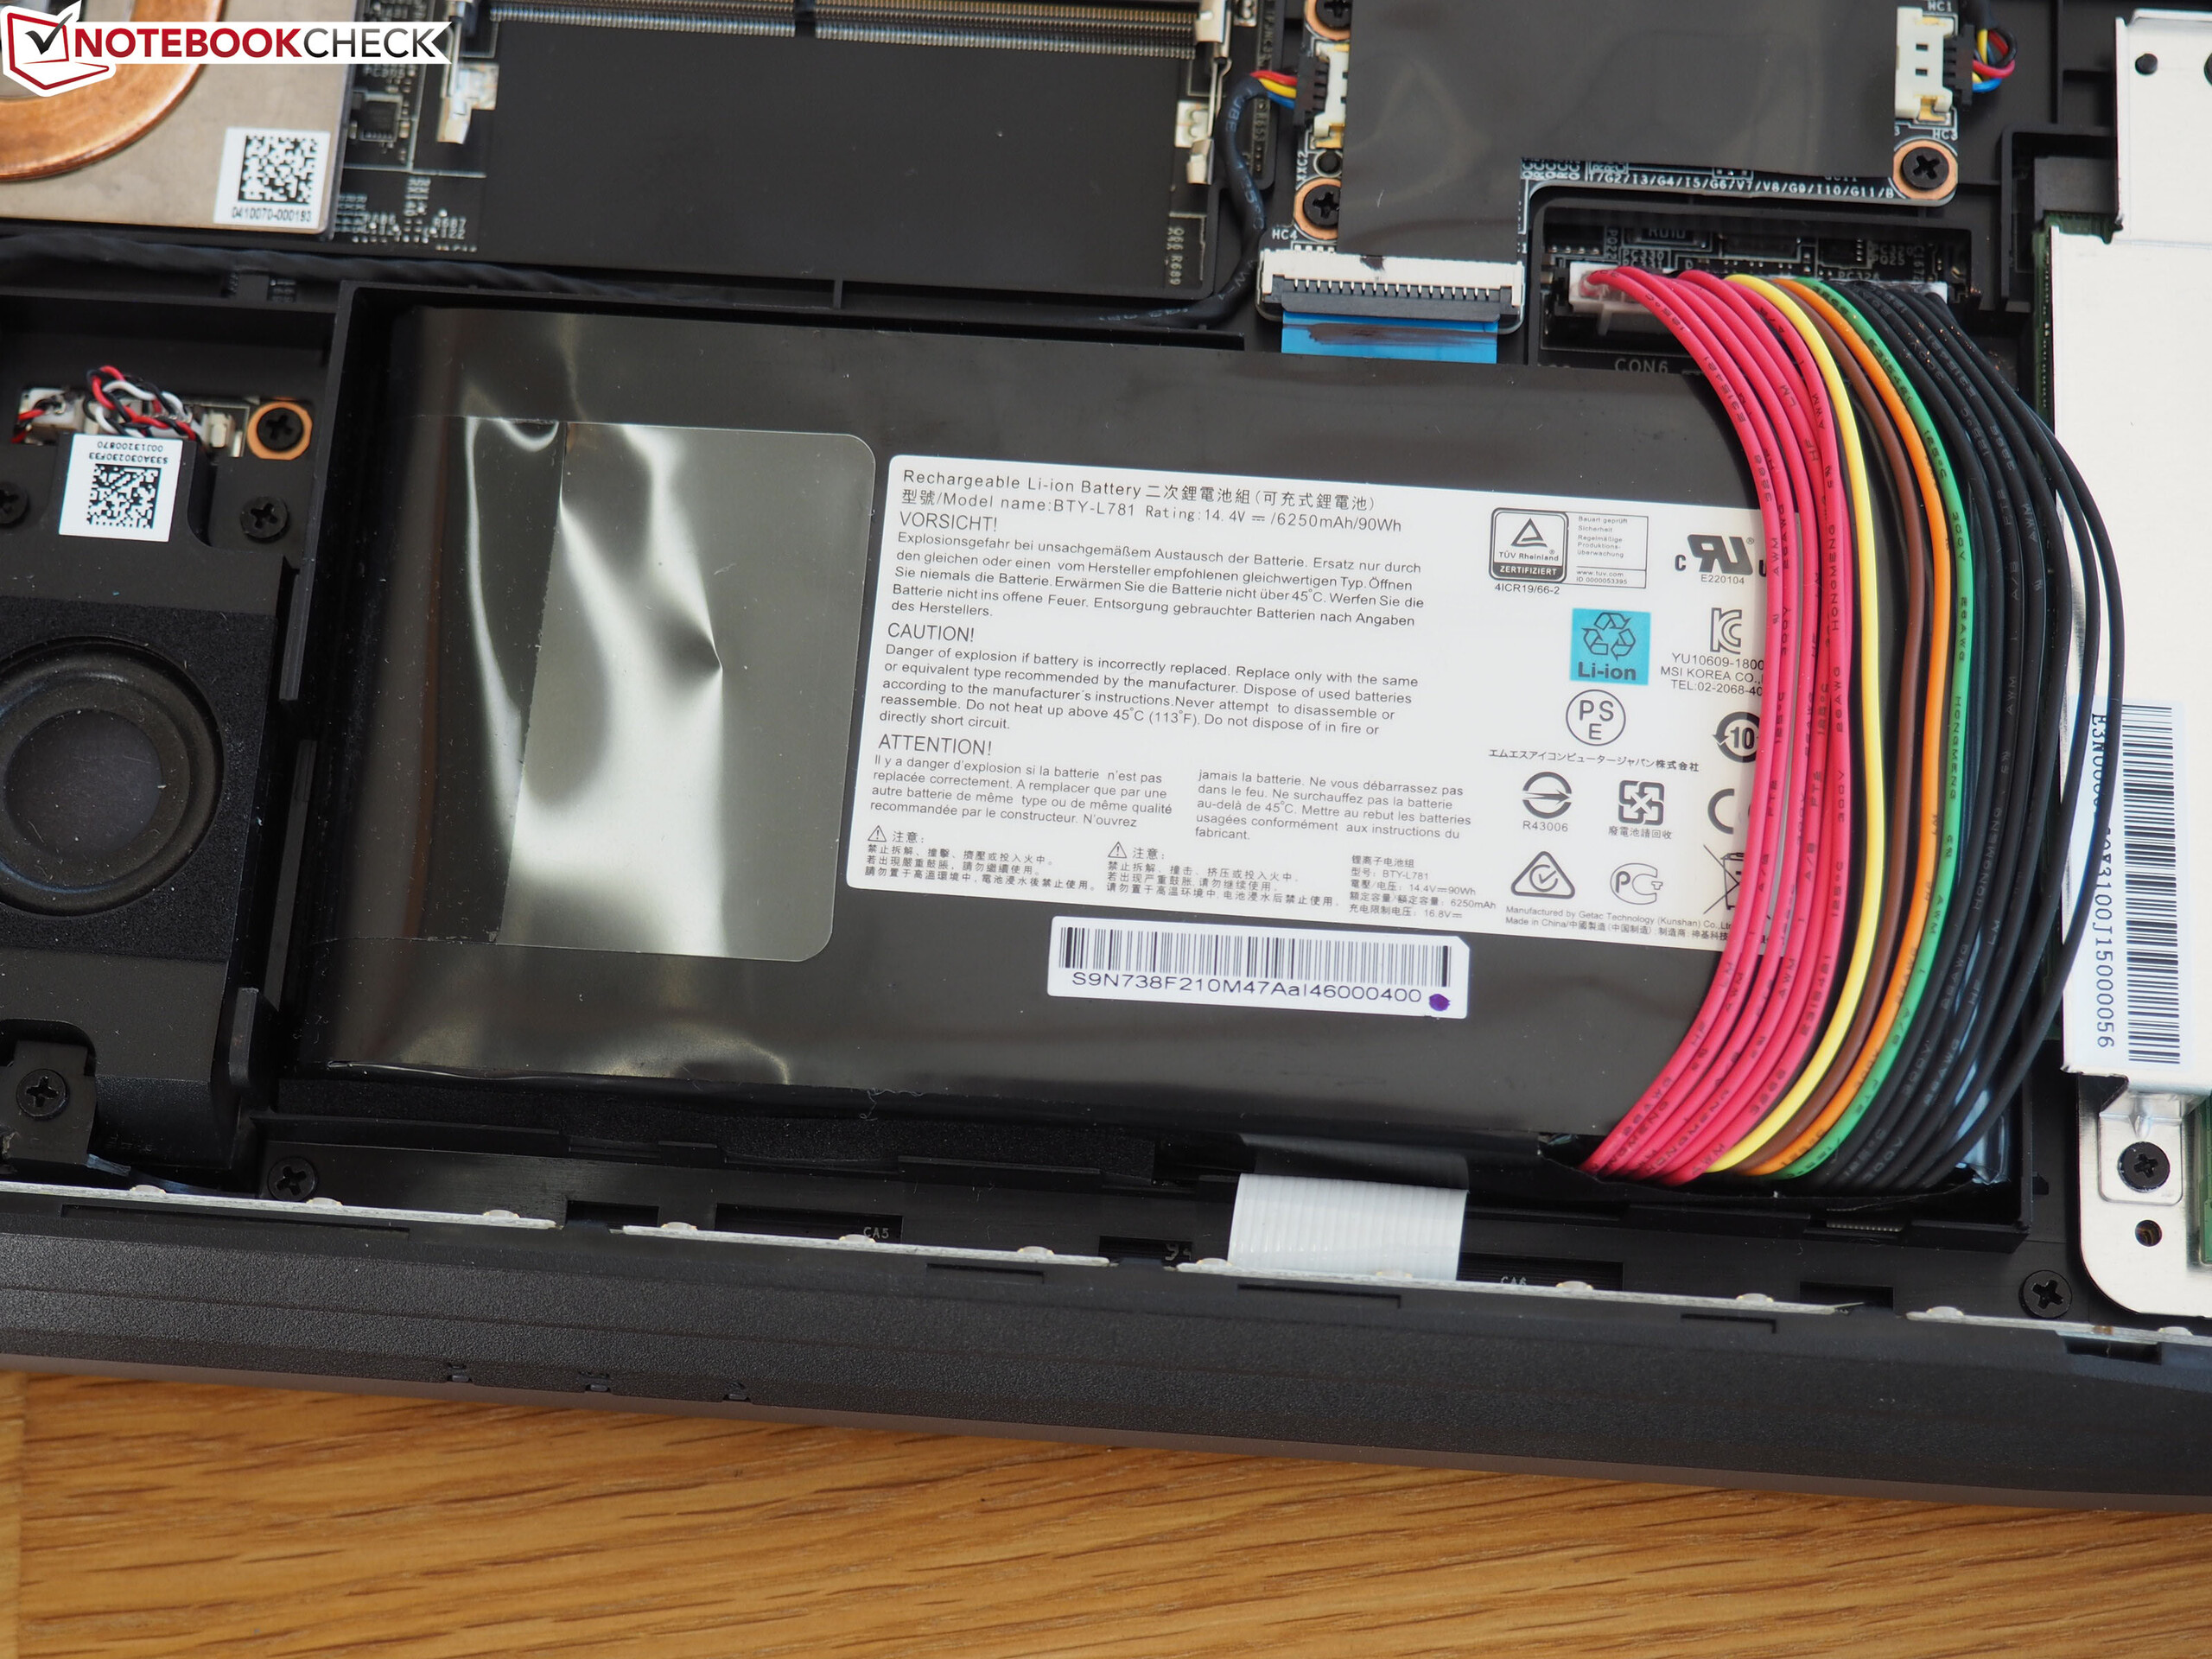
| MSI GT76 Titan DT 9SG i9-9900K, GeForce RTX 2080 Mobile, 90 Wh | Alienware Area-51m i9-9900K RTX 2080 i9-9900K, GeForce RTX 2080 Mobile, 90 Wh | Schenker XMG Ultra 17 Turing i9-9900K, GeForce RTX 2080 Mobile, 82 Wh | MSI GE75 9SG i9-9880H, GeForce RTX 2080 Mobile, 65 Wh | Asus ROG G703GX i7-8750H, GeForce RTX 2080 Mobile, 96 Wh | Genomsnitt av klass Gaming | |
|---|---|---|---|---|---|---|
| Batteridrifttid | -33% | -30% | -2% | -1% | 44% | |
| Reader / Idle (h) | 6.8 | 2.6 -62% | 2.8 -59% | 5 -26% | 8.71 ? 28% | |
| WiFi v1.3 (h) | 5 | 2.1 -58% | 2.3 -54% | 4.9 -2% | 4 -20% | 7.04 ? 41% |
| Load (h) | 0.9 | 1.1 22% | 1.1 22% | 1.3 44% | 1.47 ? 63% | |
| H.264 (h) | 2.3 | 3.8 | 8.26 ? |
För
Emot
Läs den fullständiga versionen av den här recensionen på engelska här.
GT76 9SG Titan DT är en extraordinär spellaptop, åtminstone så länge det gäller pris och prestanda. Den klarar av riktigt snabb bilduppdatering även i extremt krävande titlar.
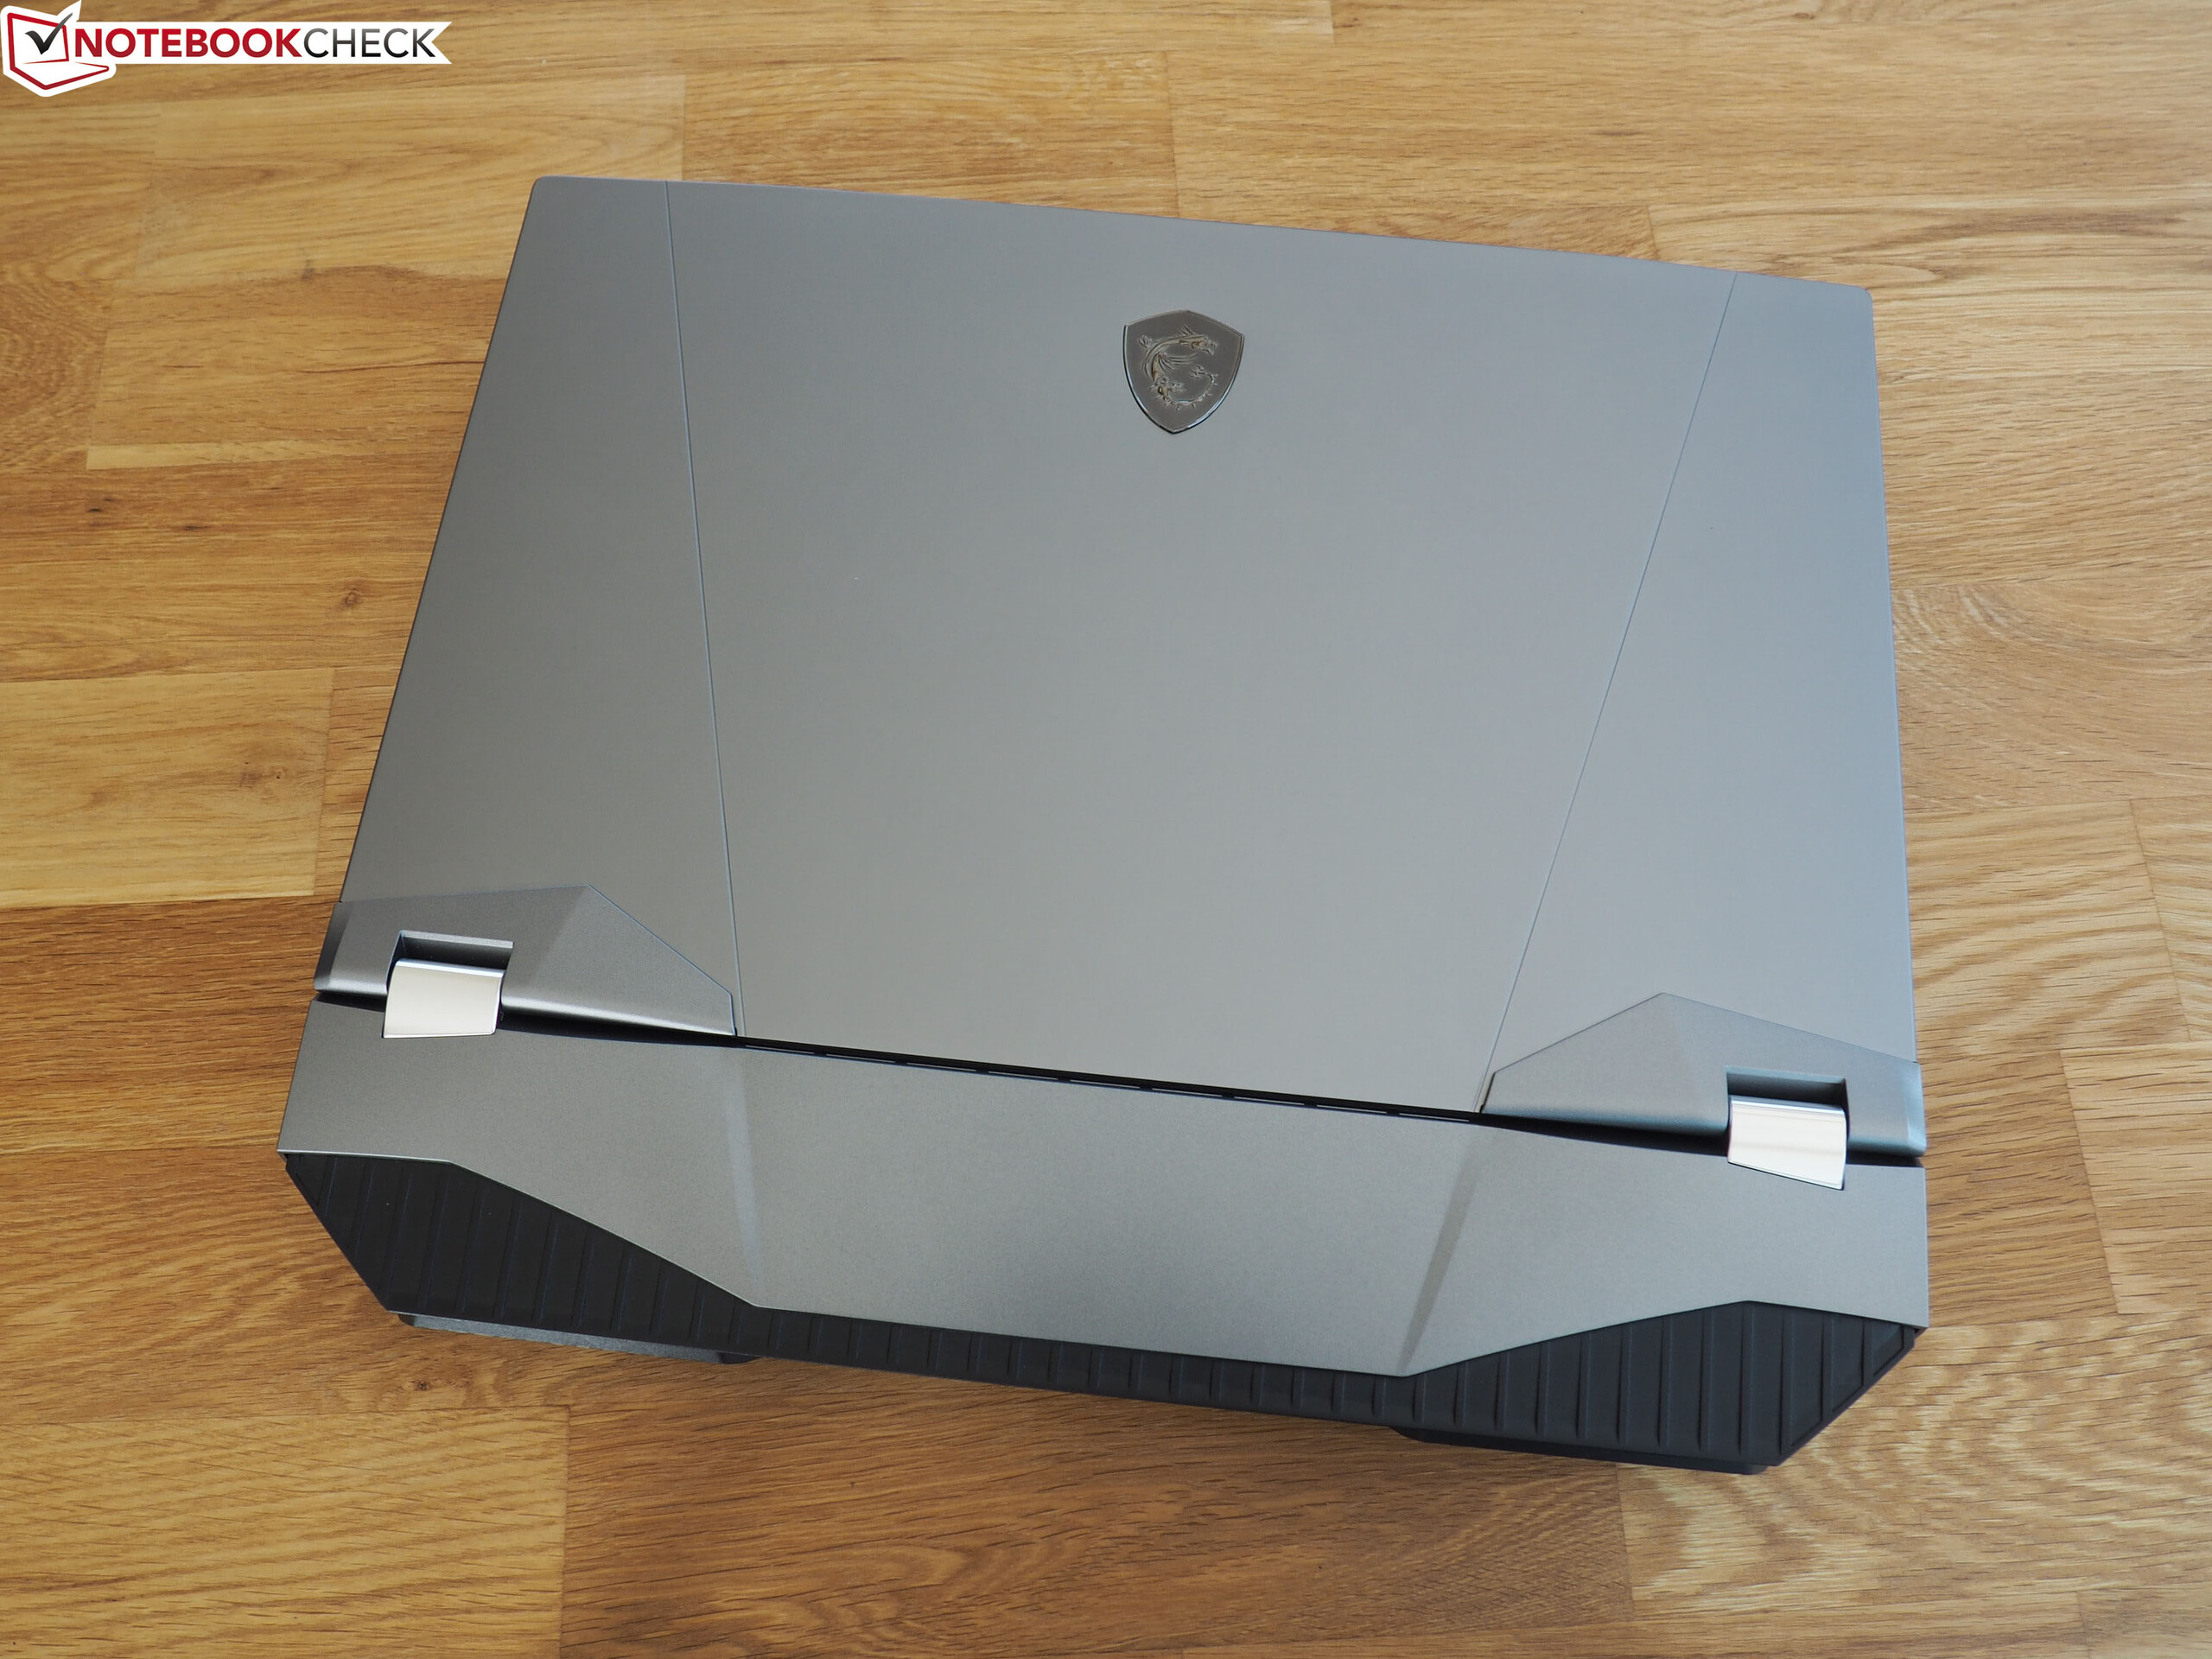
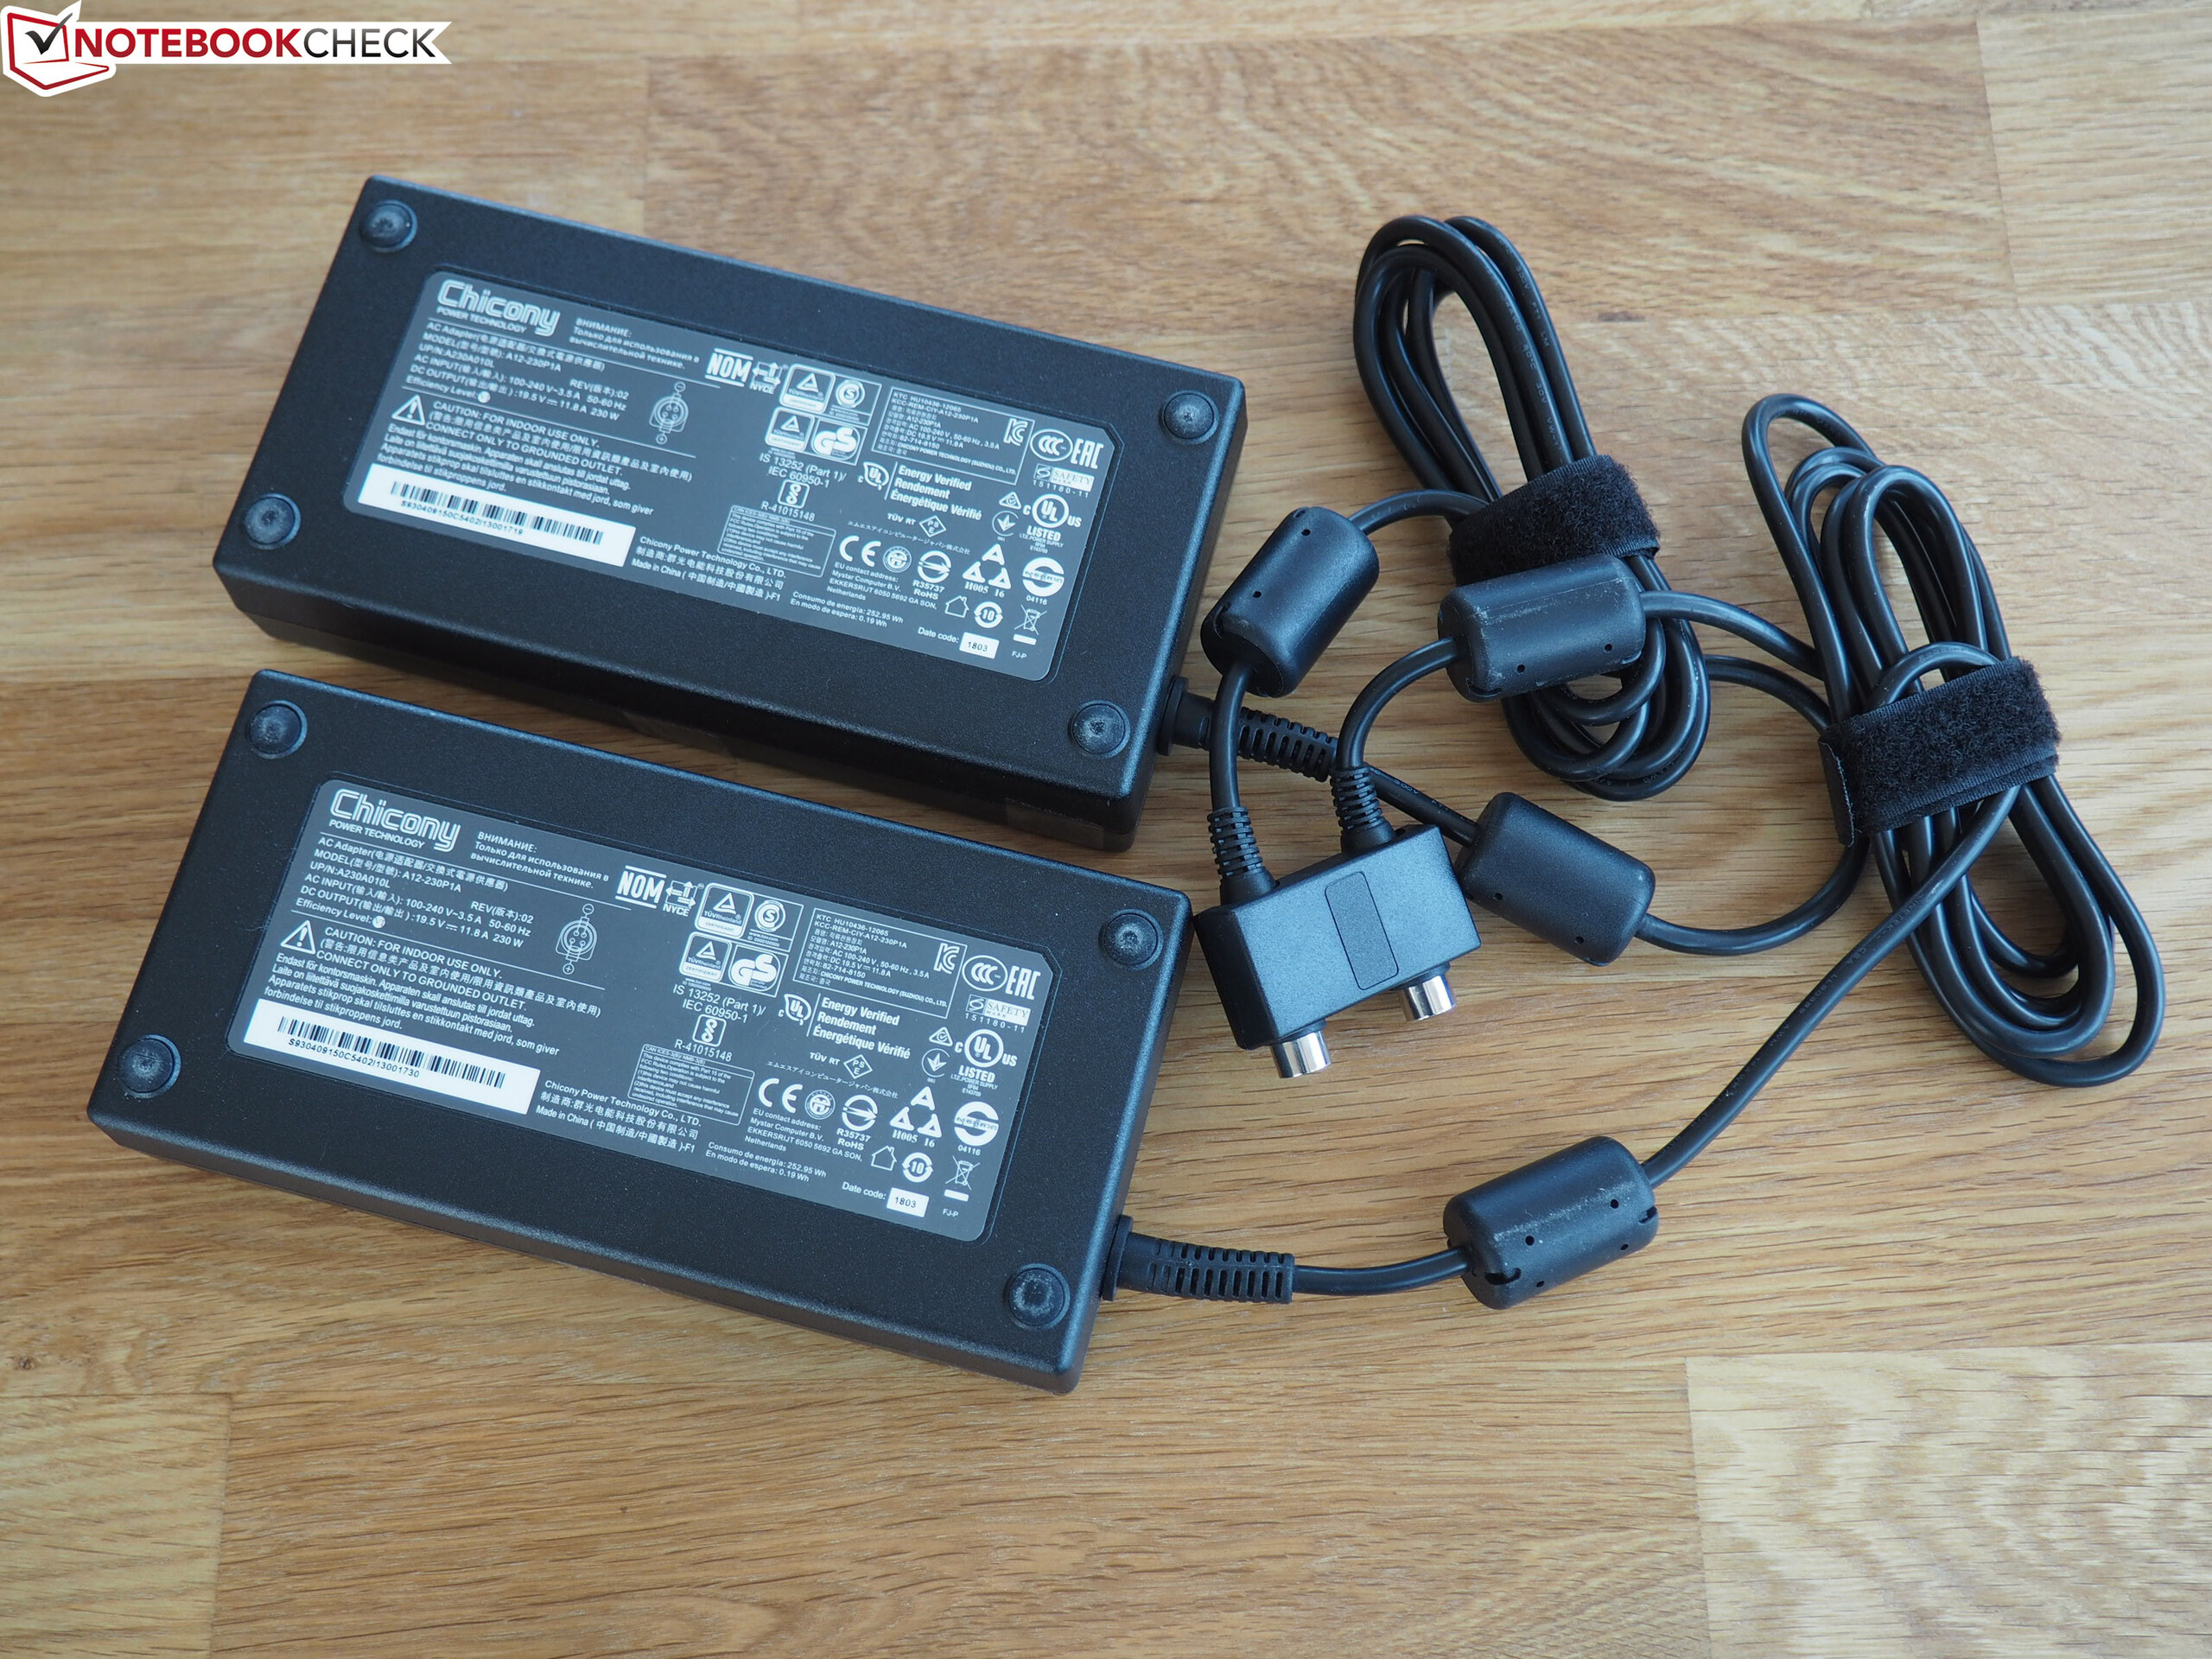
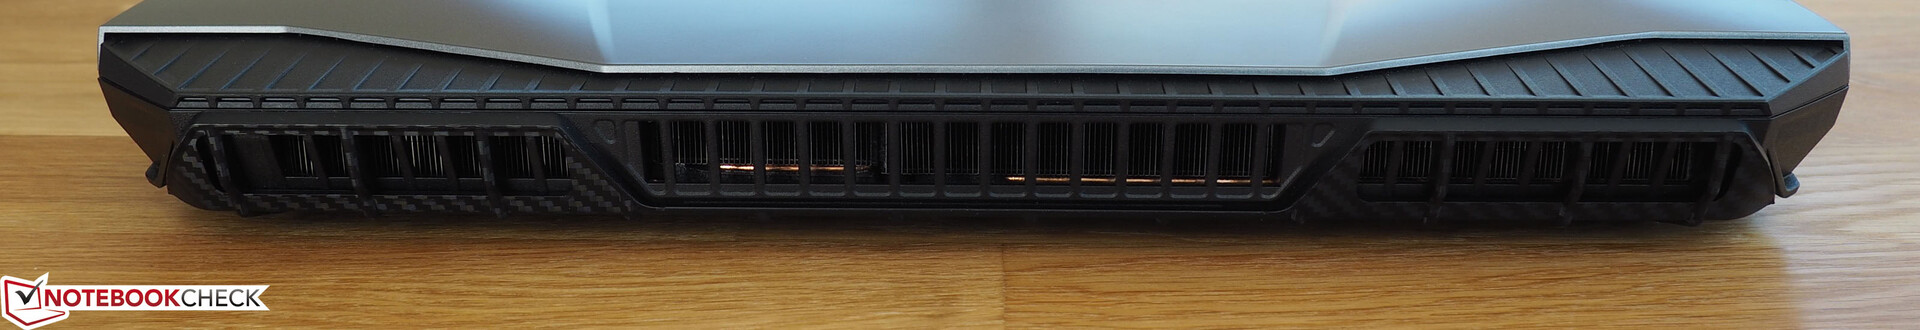
Den förstklassiga prestandan kommer på bekostnad av ljudnivån, vilket kan skrämma bort en del intresserade kunder (vi rekommenderar att använda hörlurar när man spelar på GT76). Men om du bortser från den rejäla vikten, den stora baksidan och de två nätadaptrarna så finns det inte mycket att klaga på.
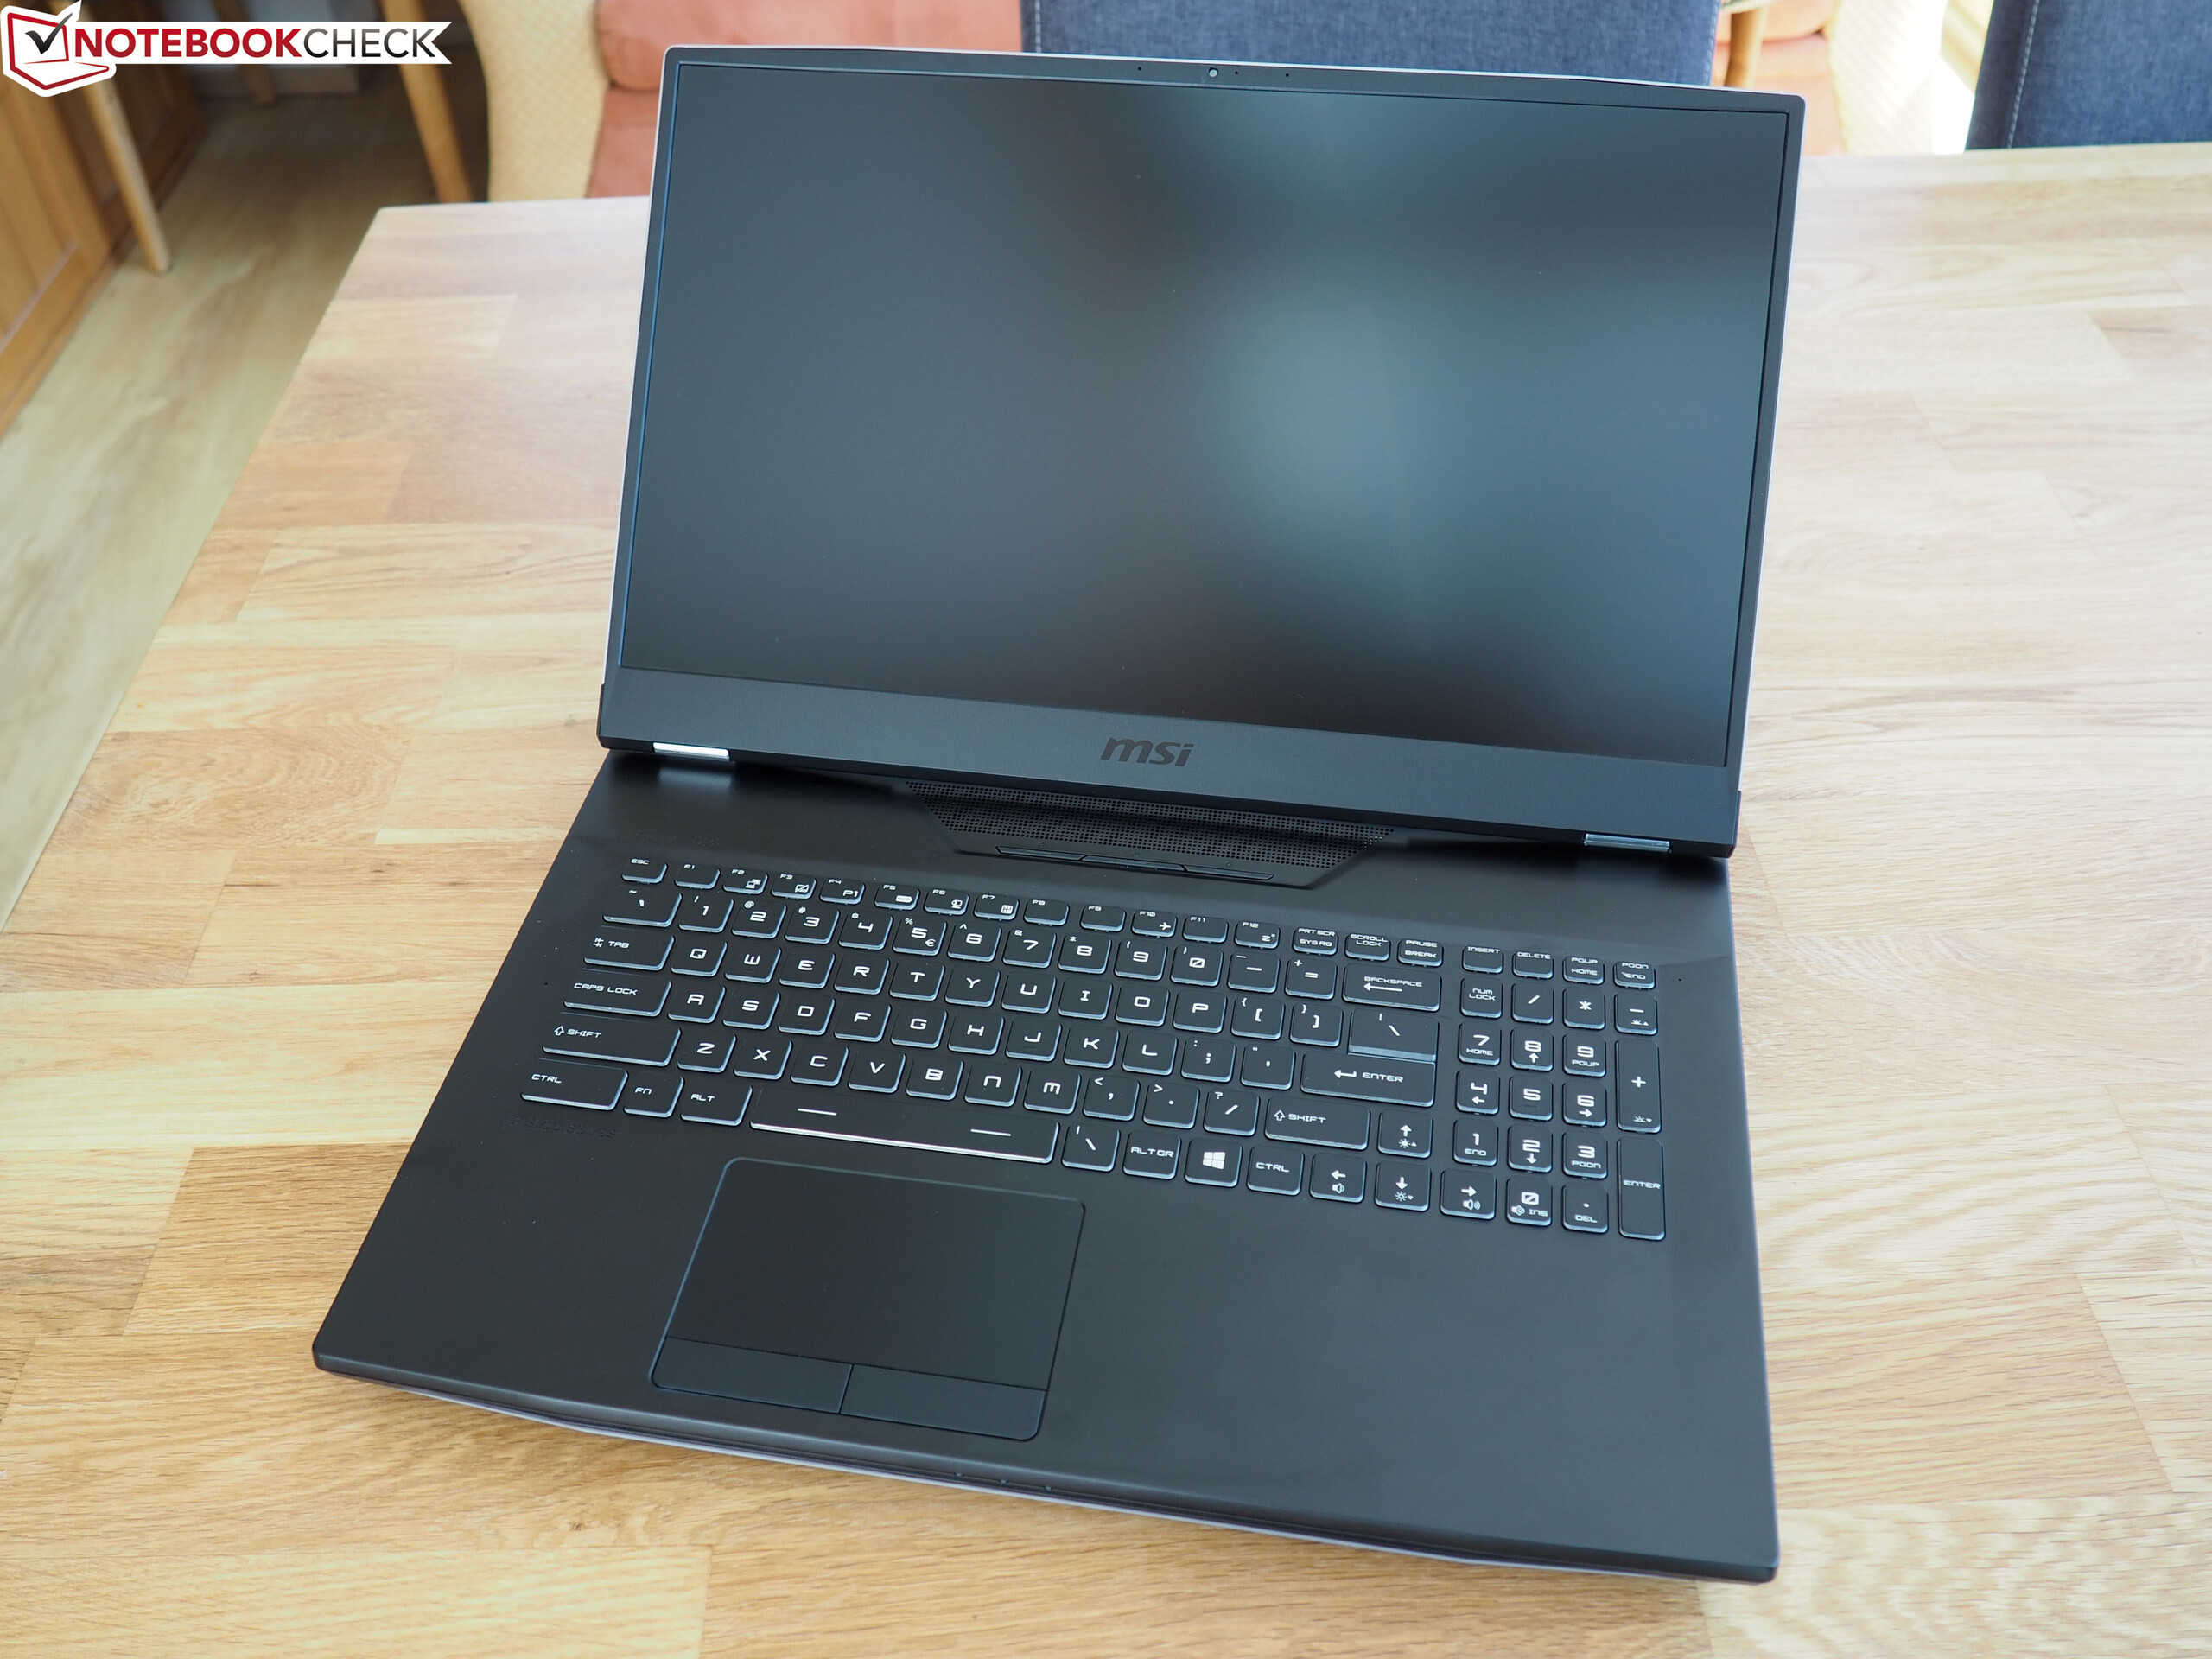
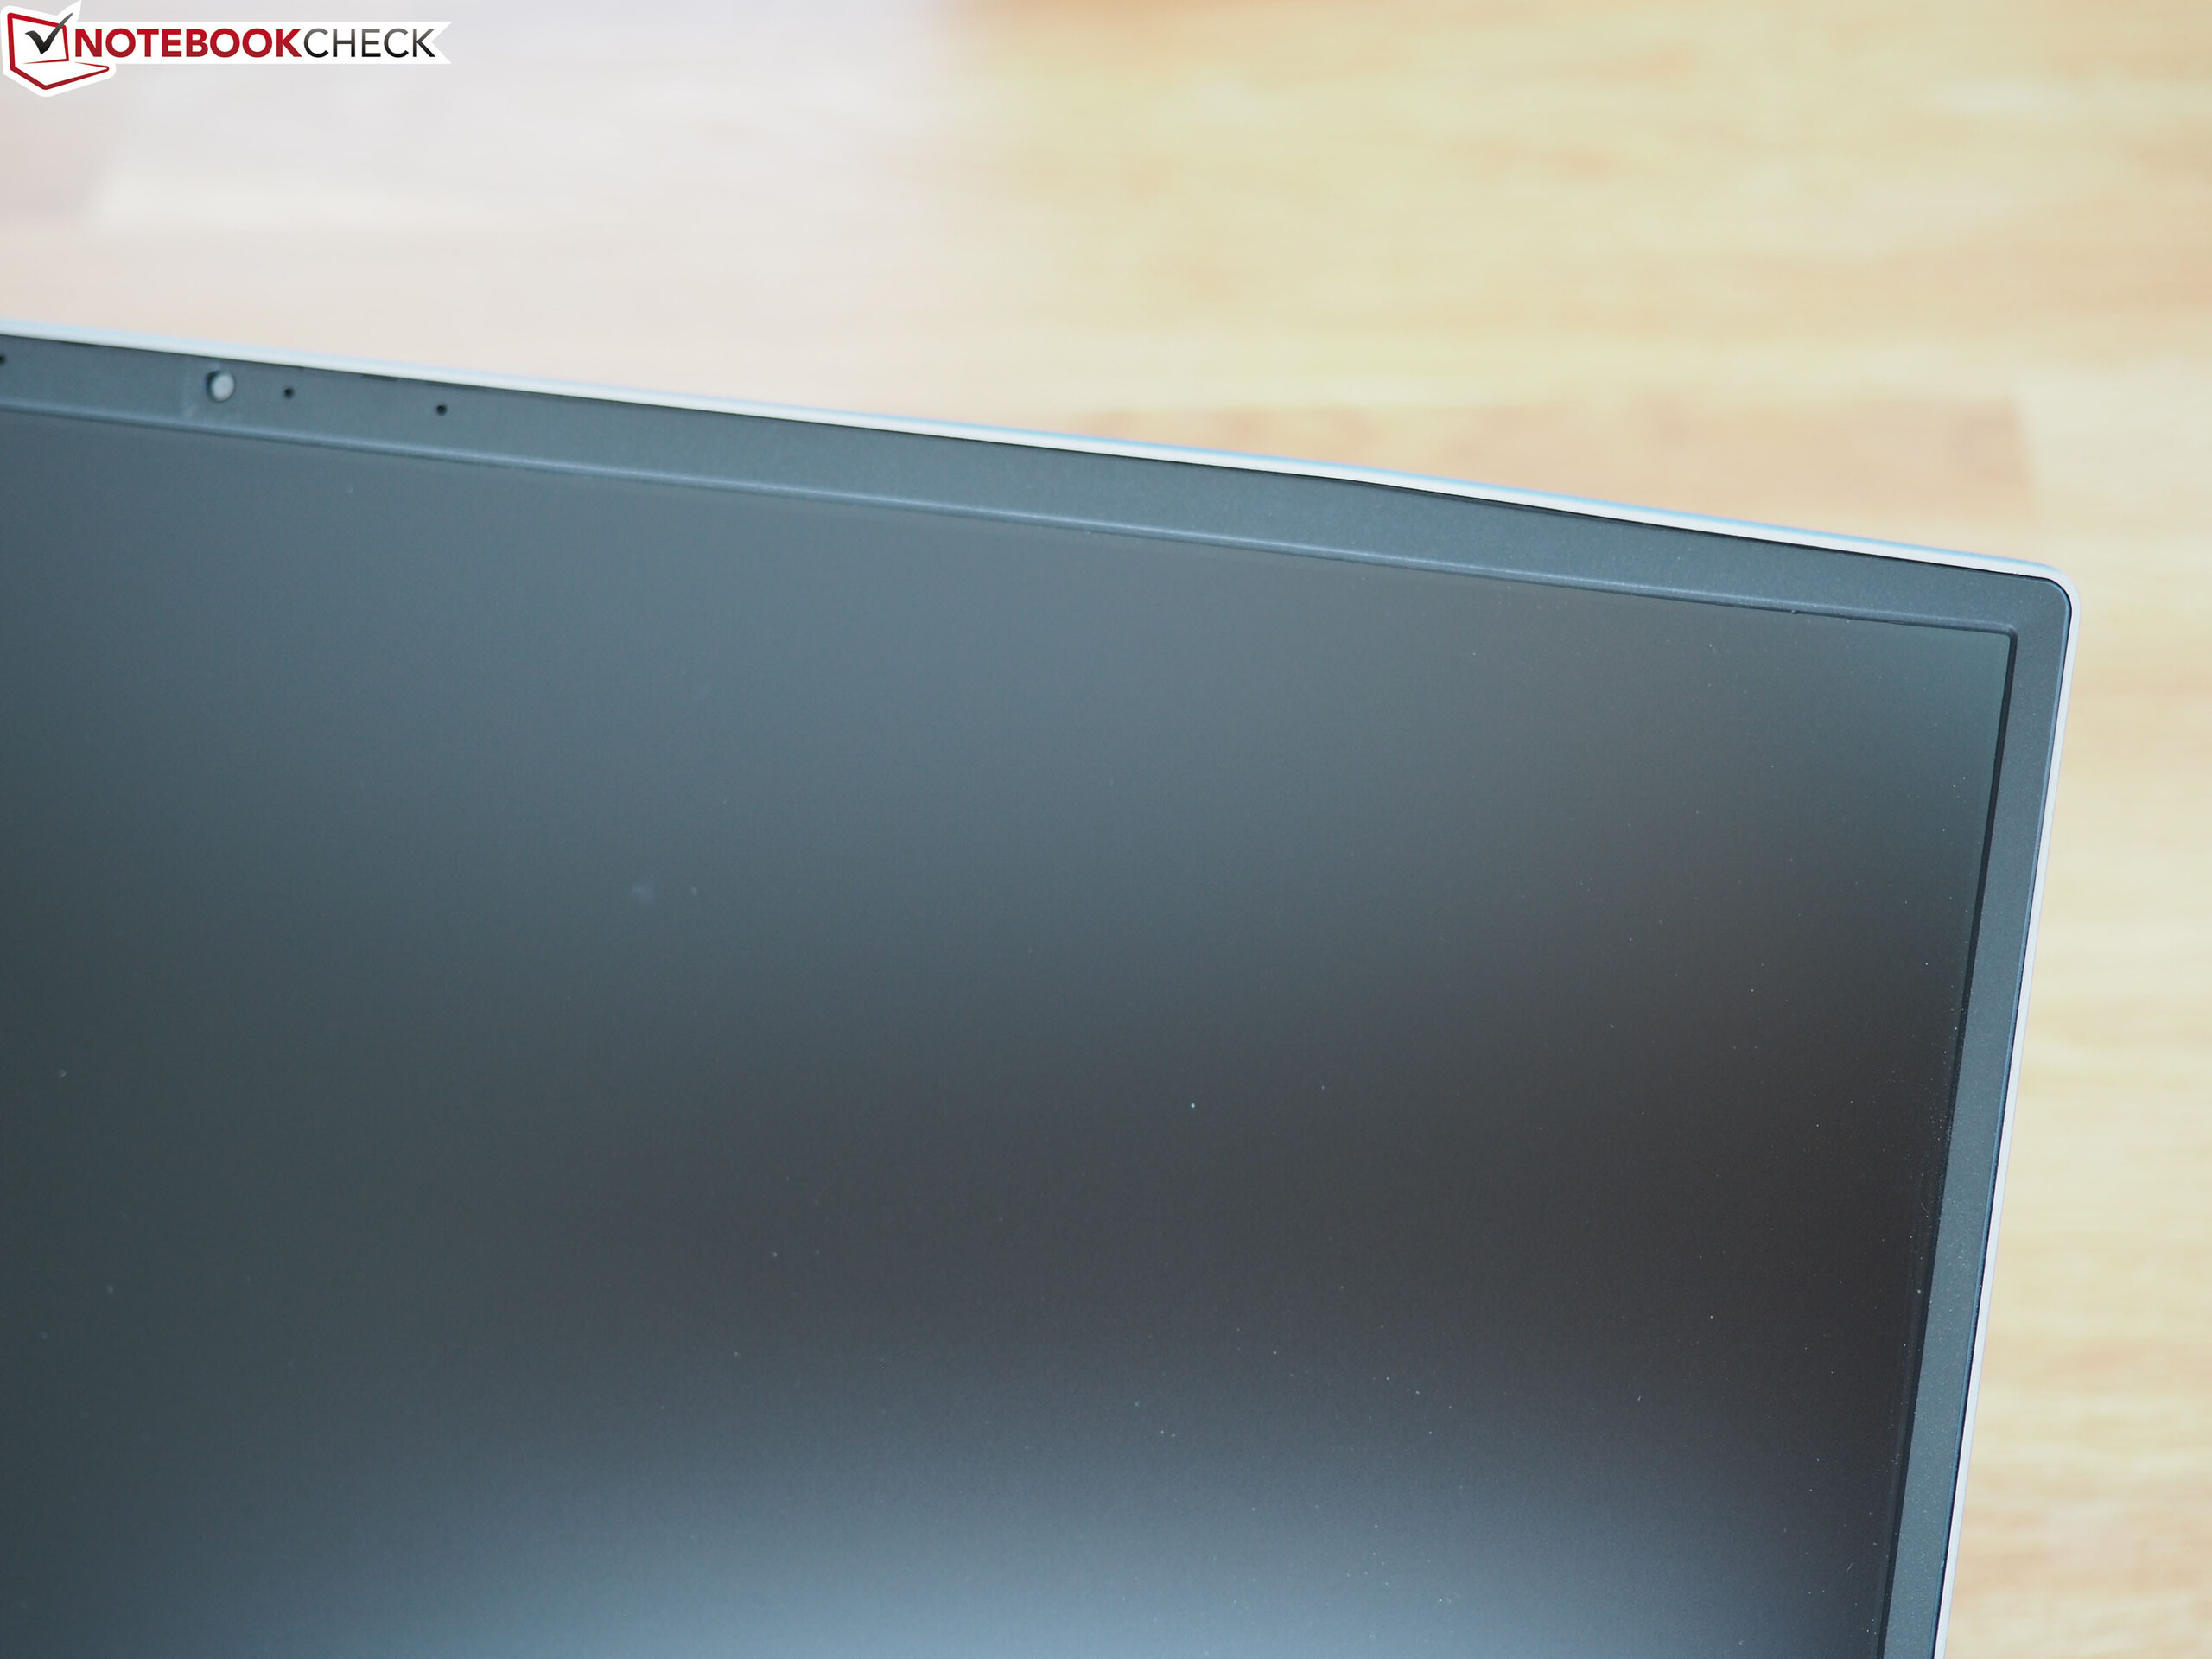
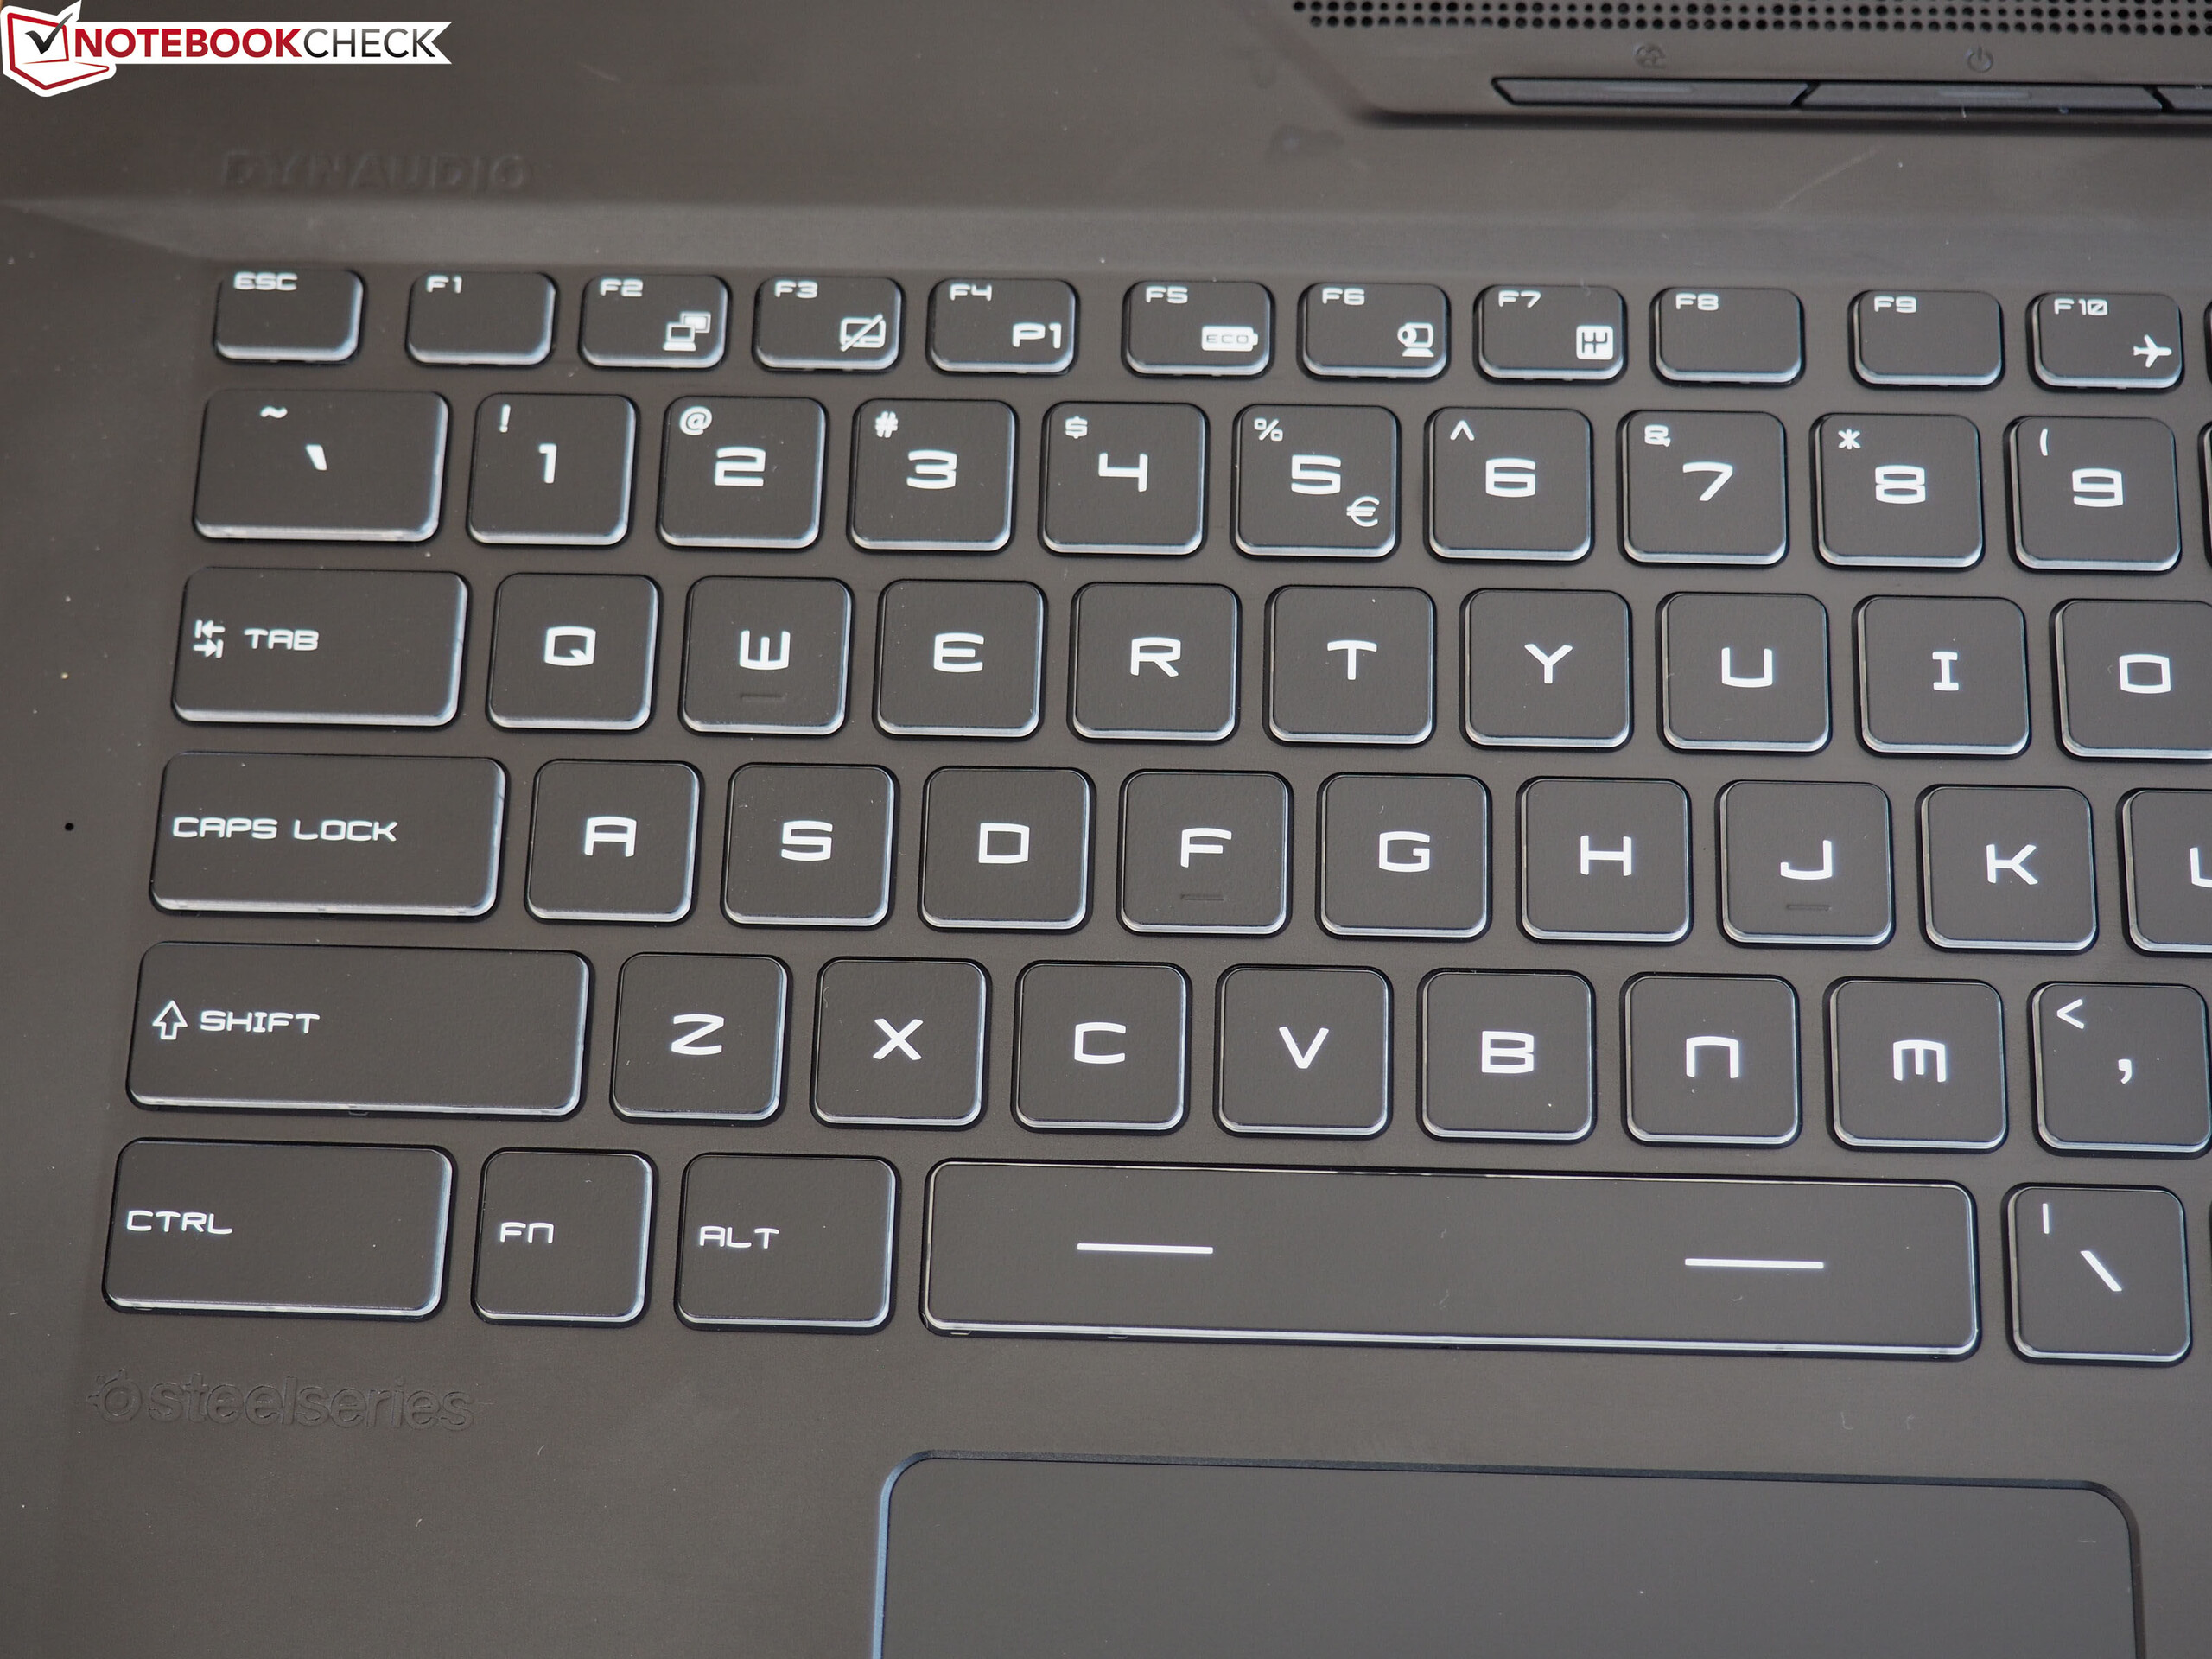
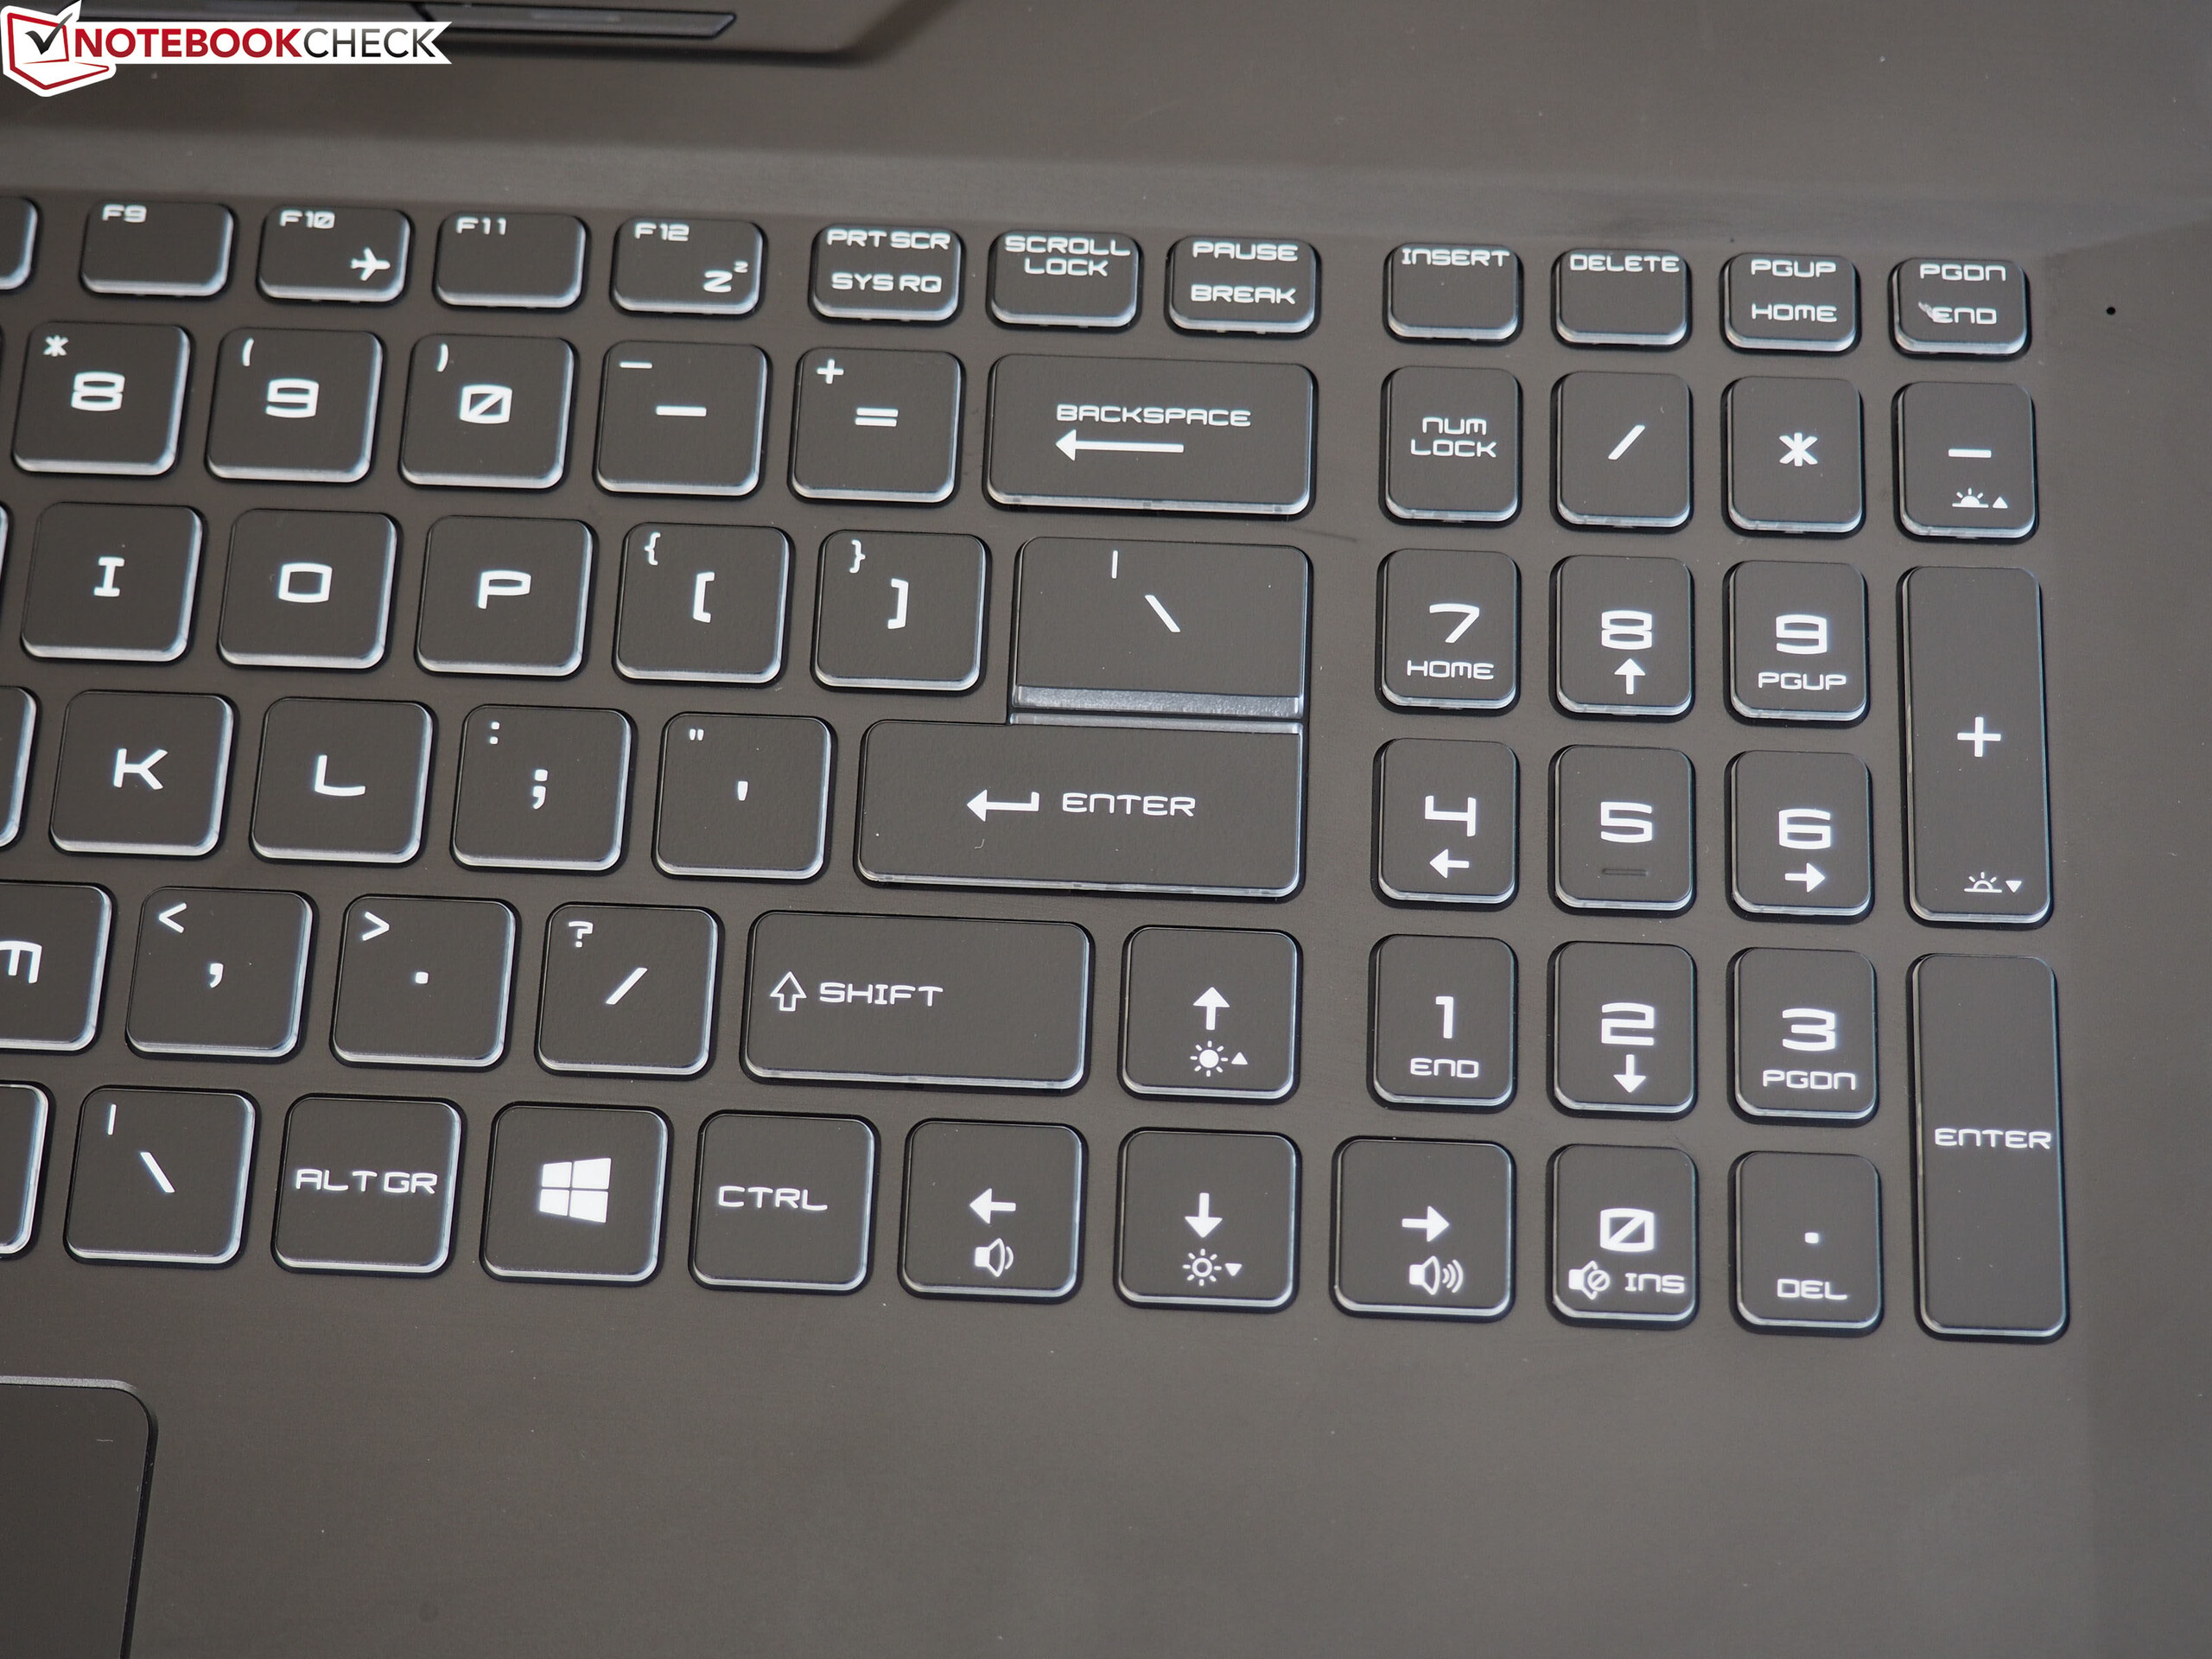
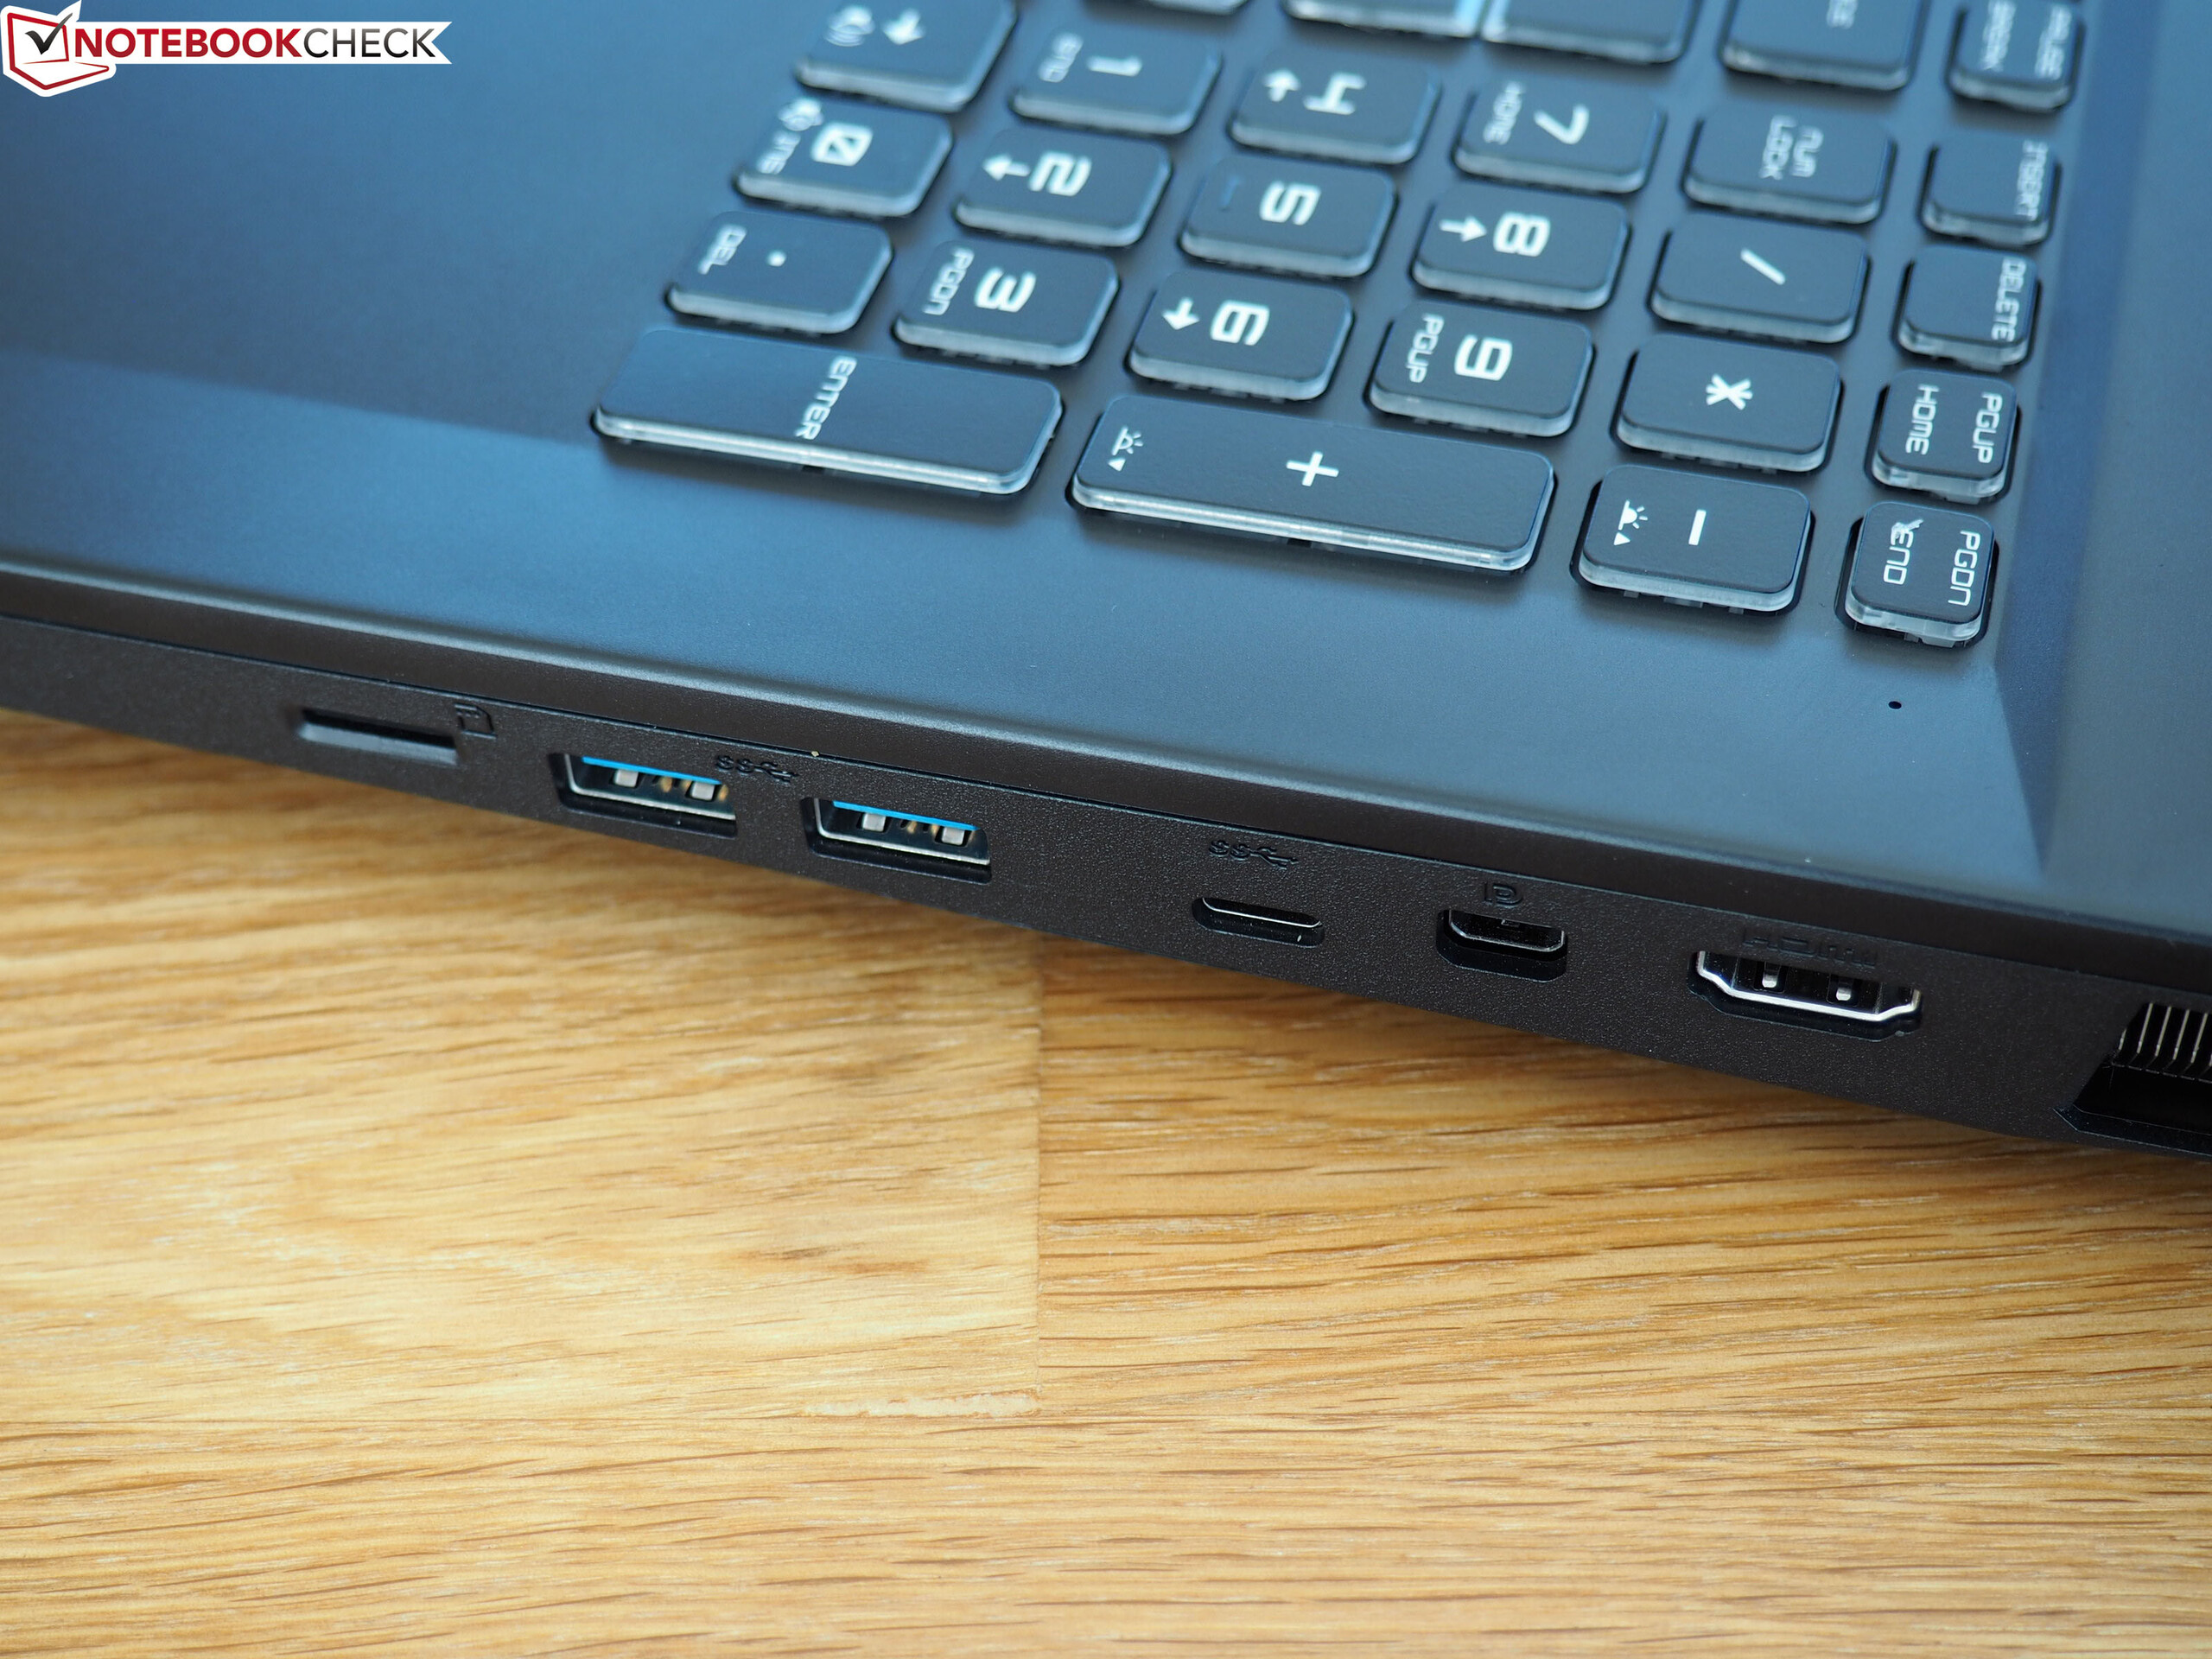
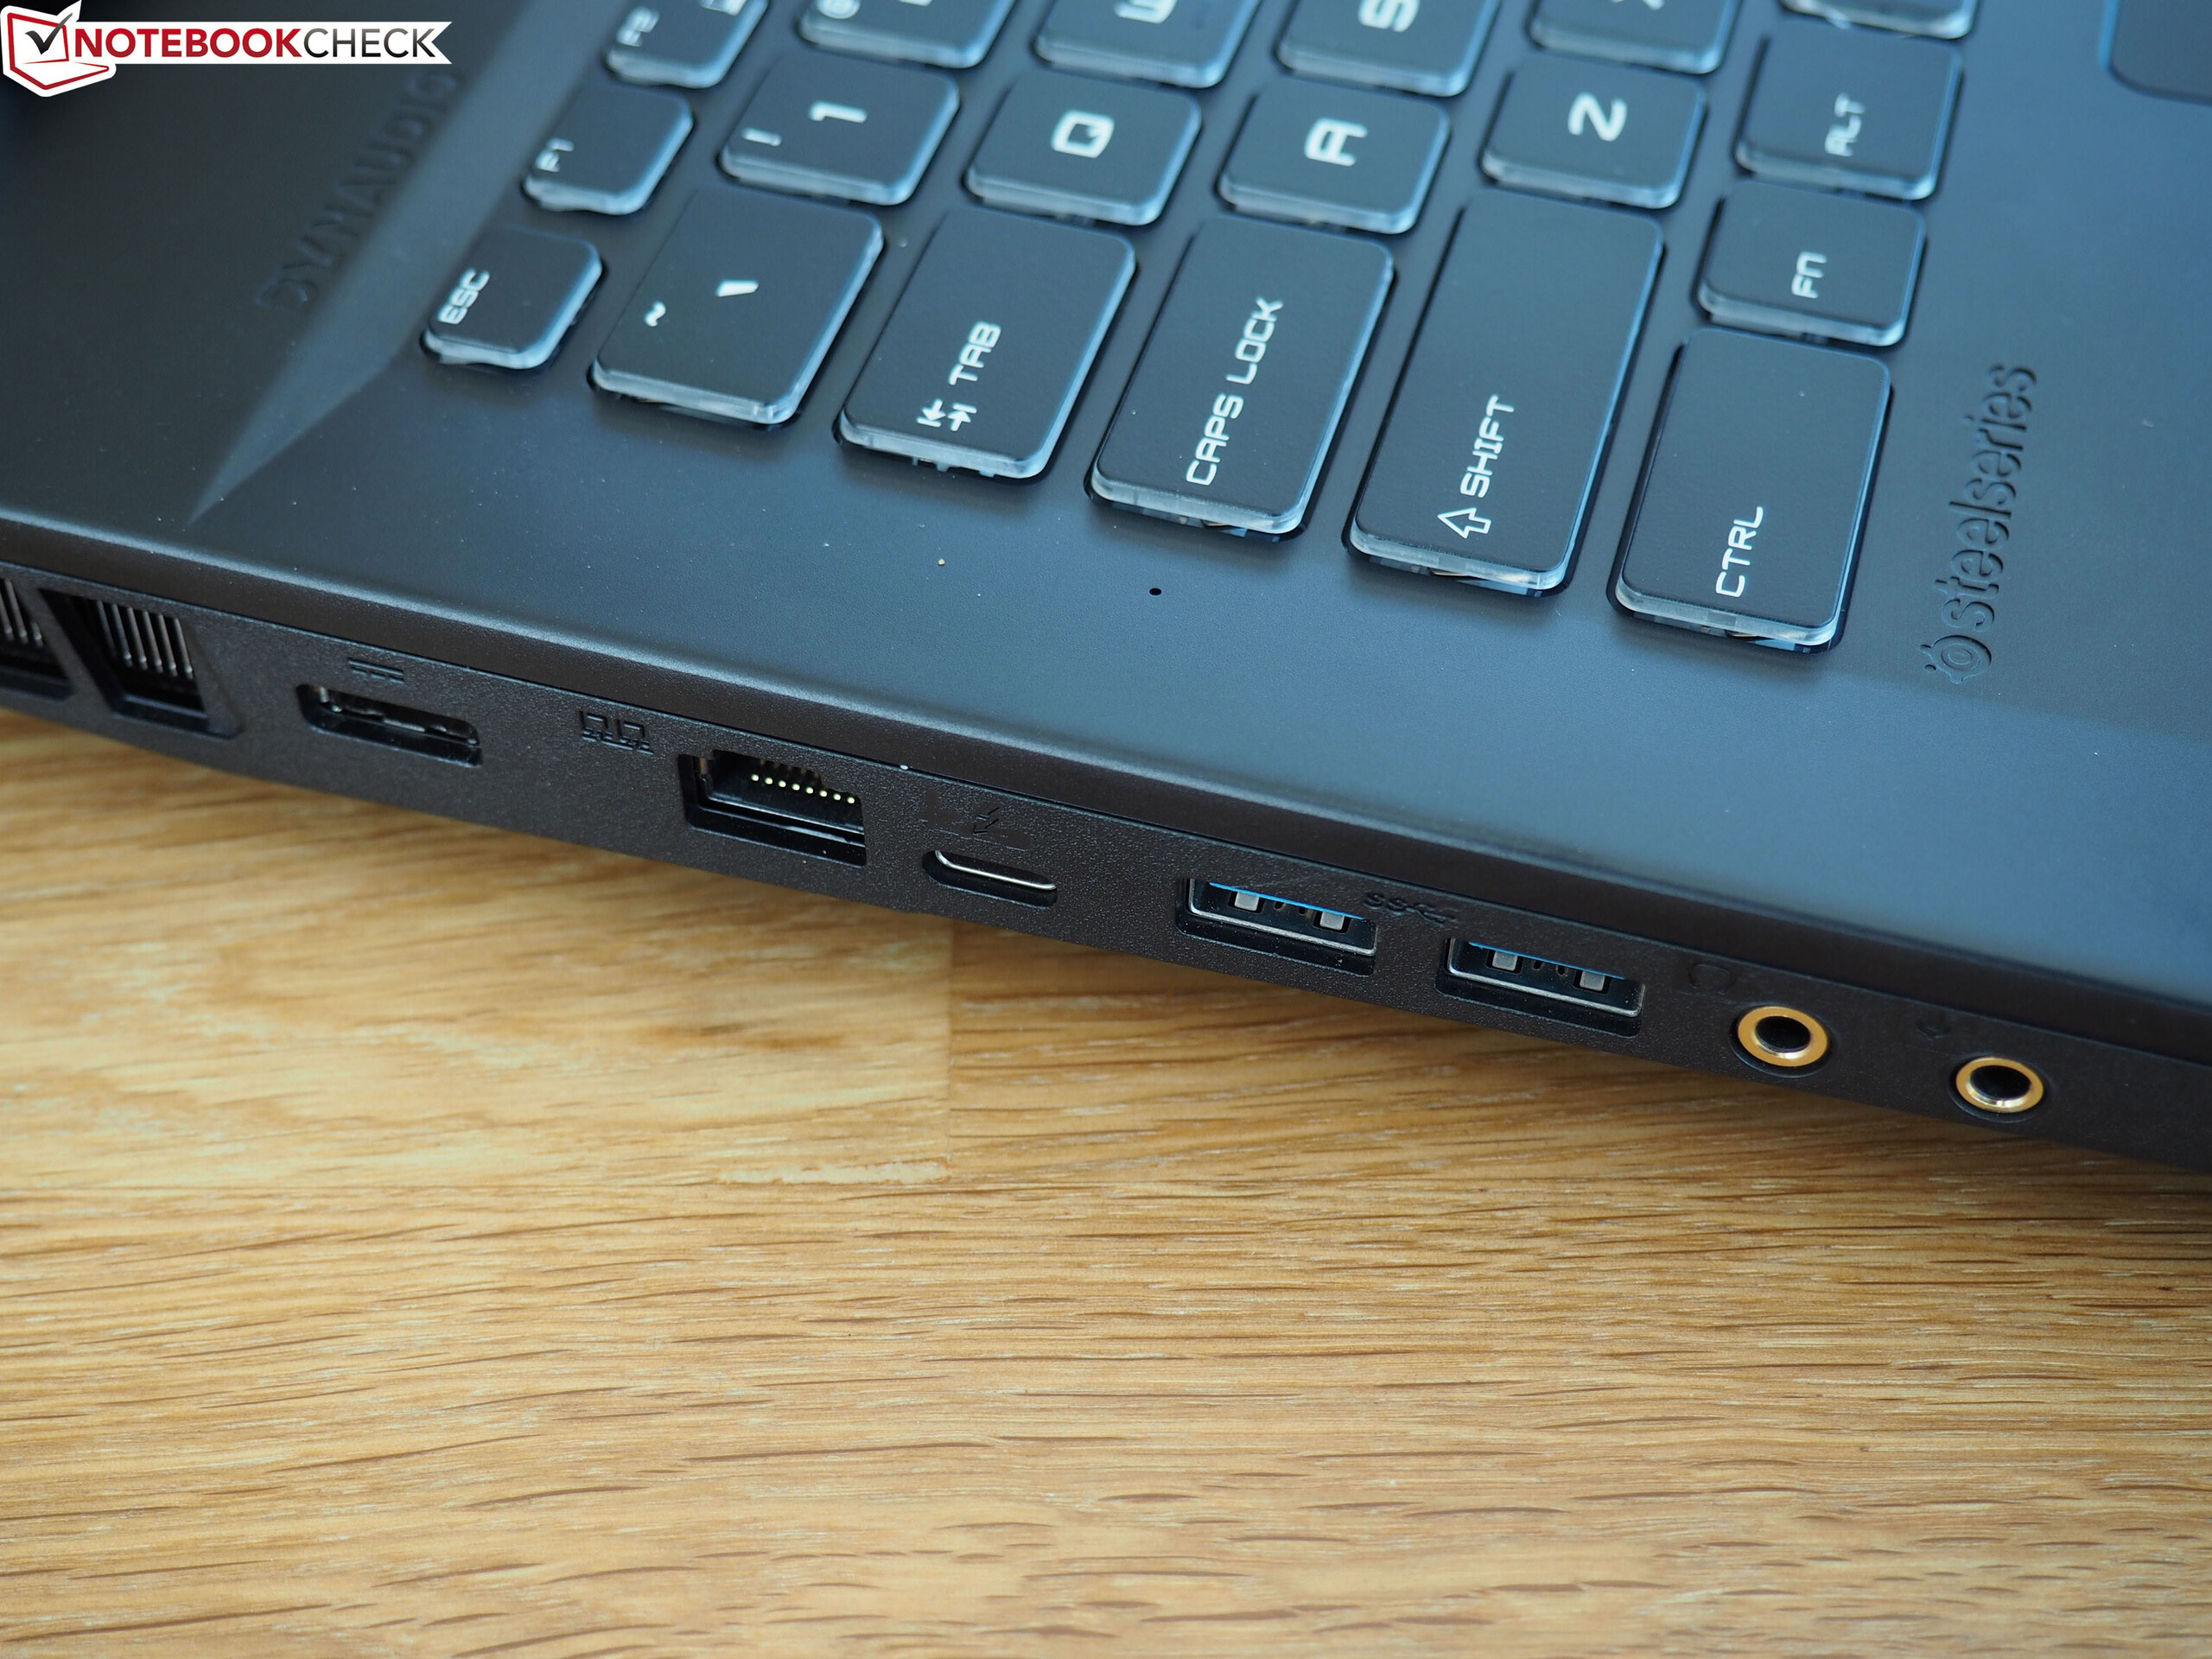
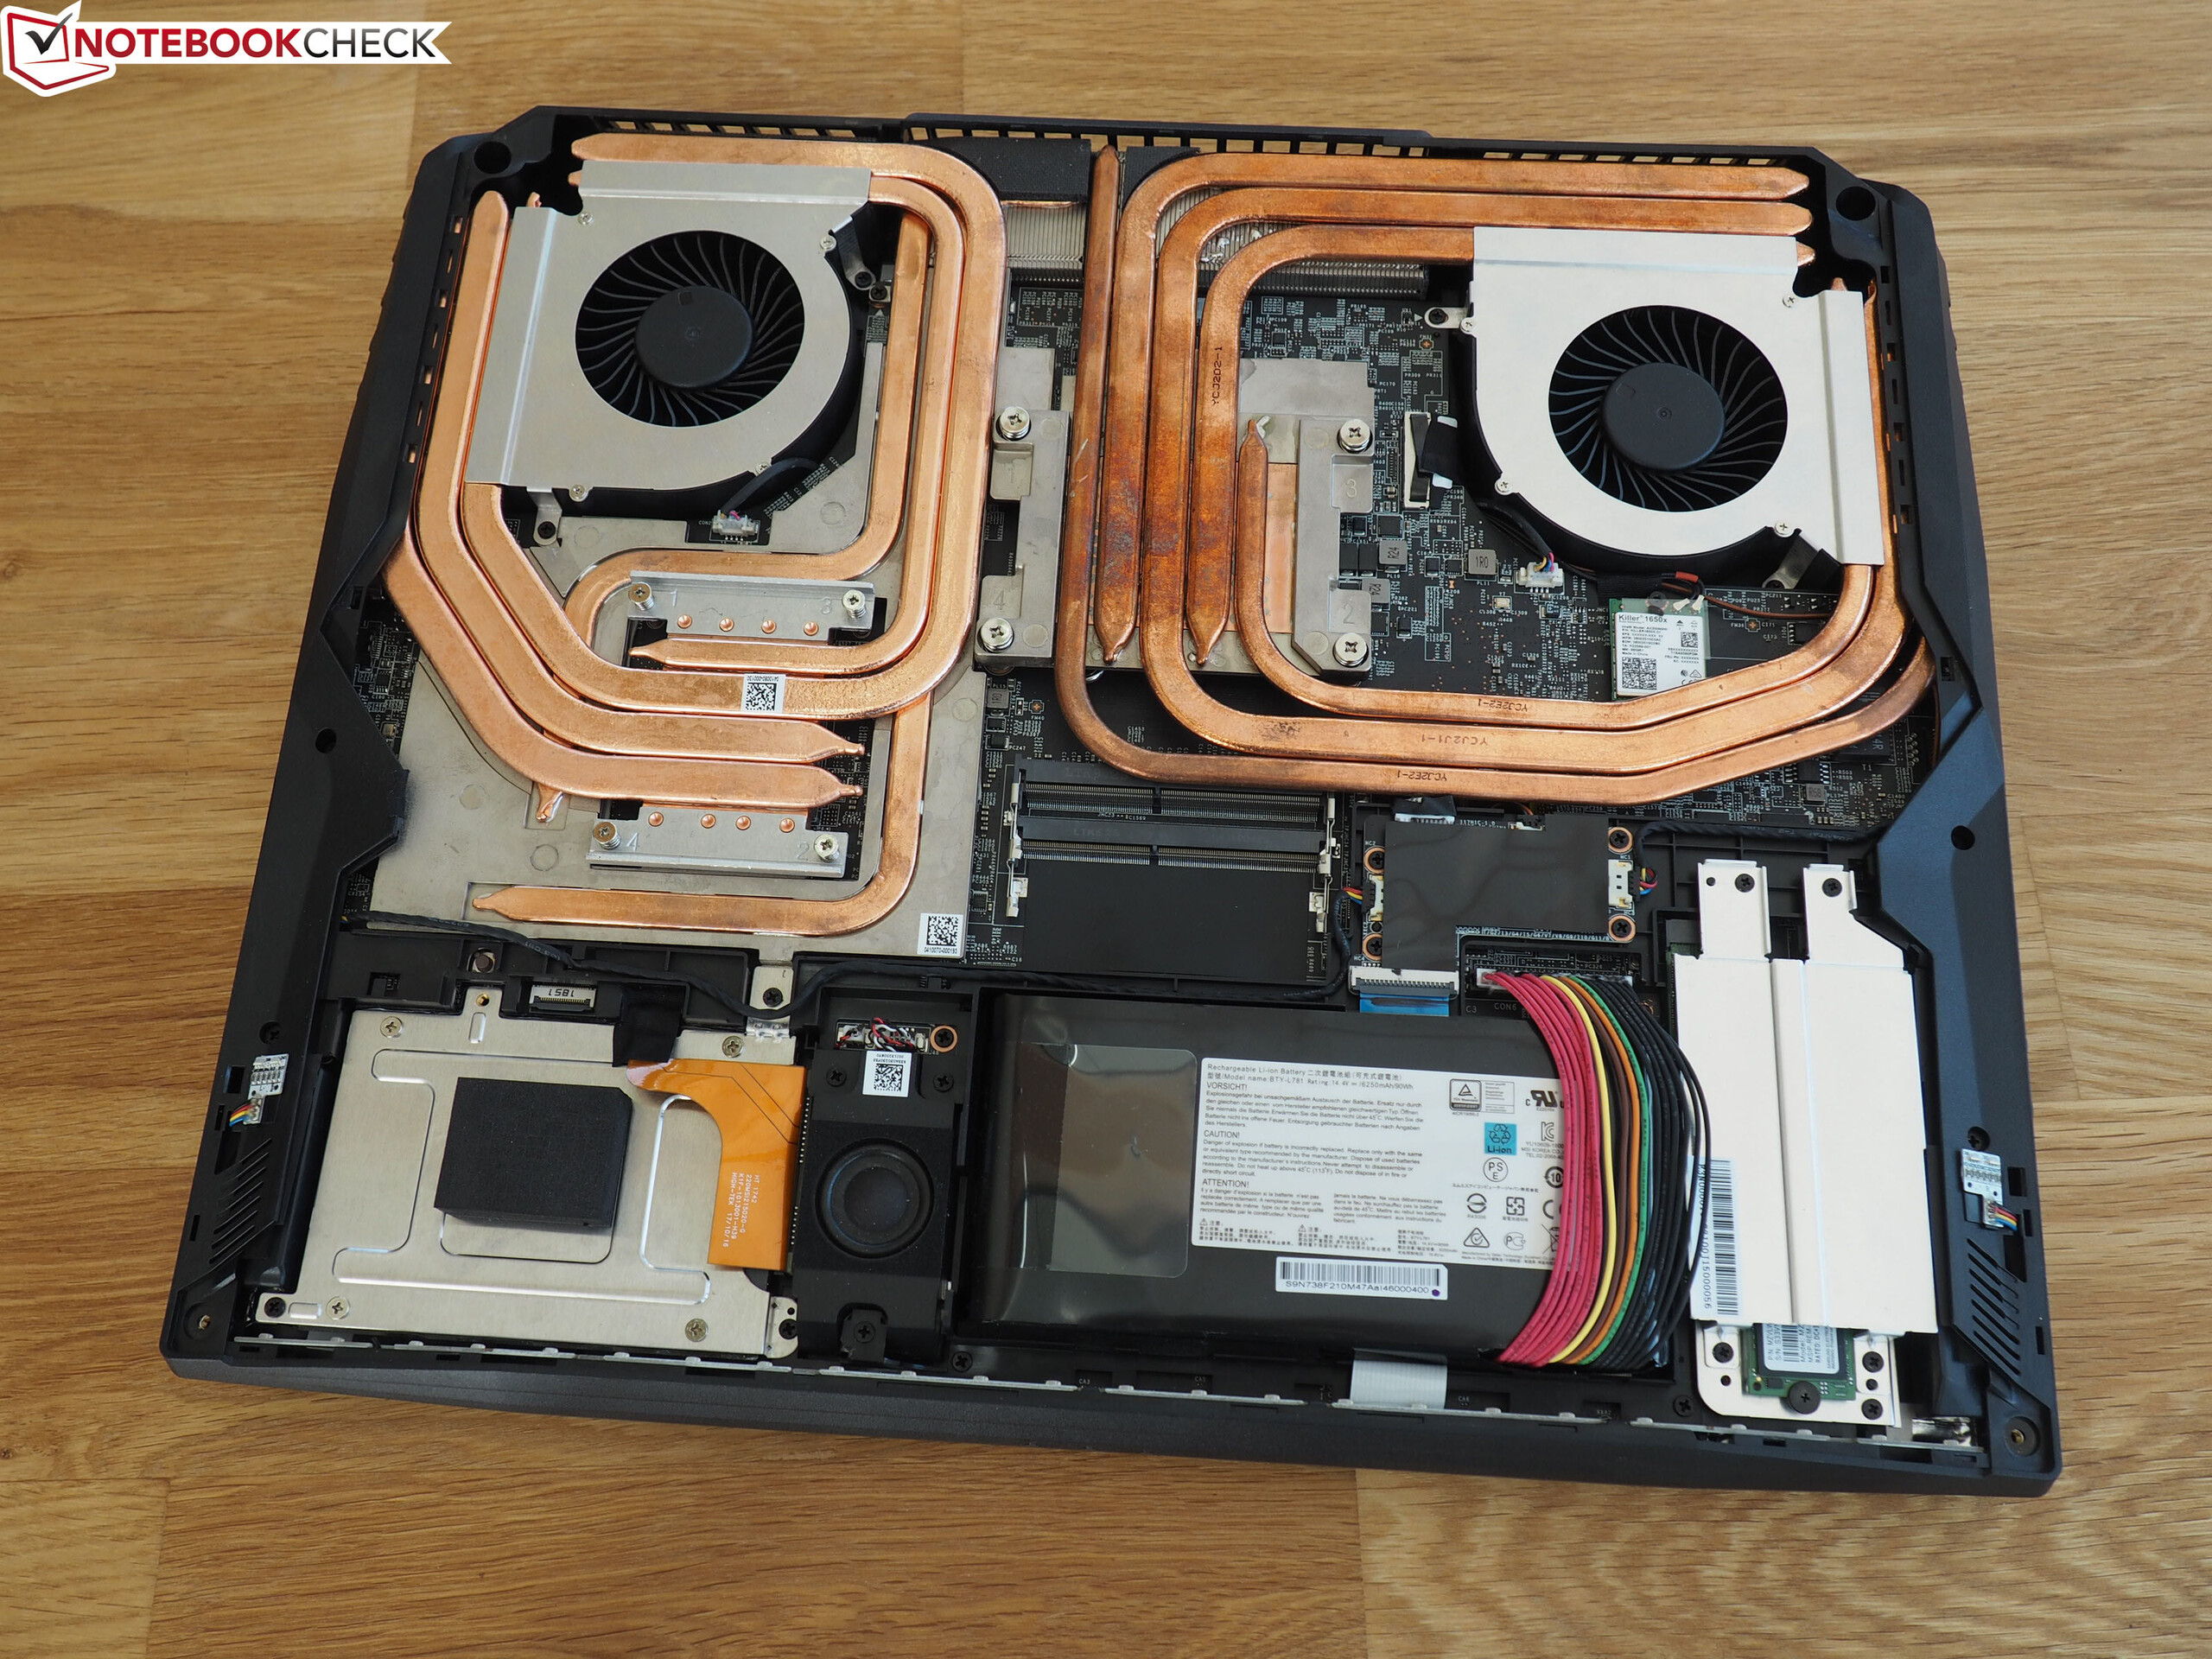
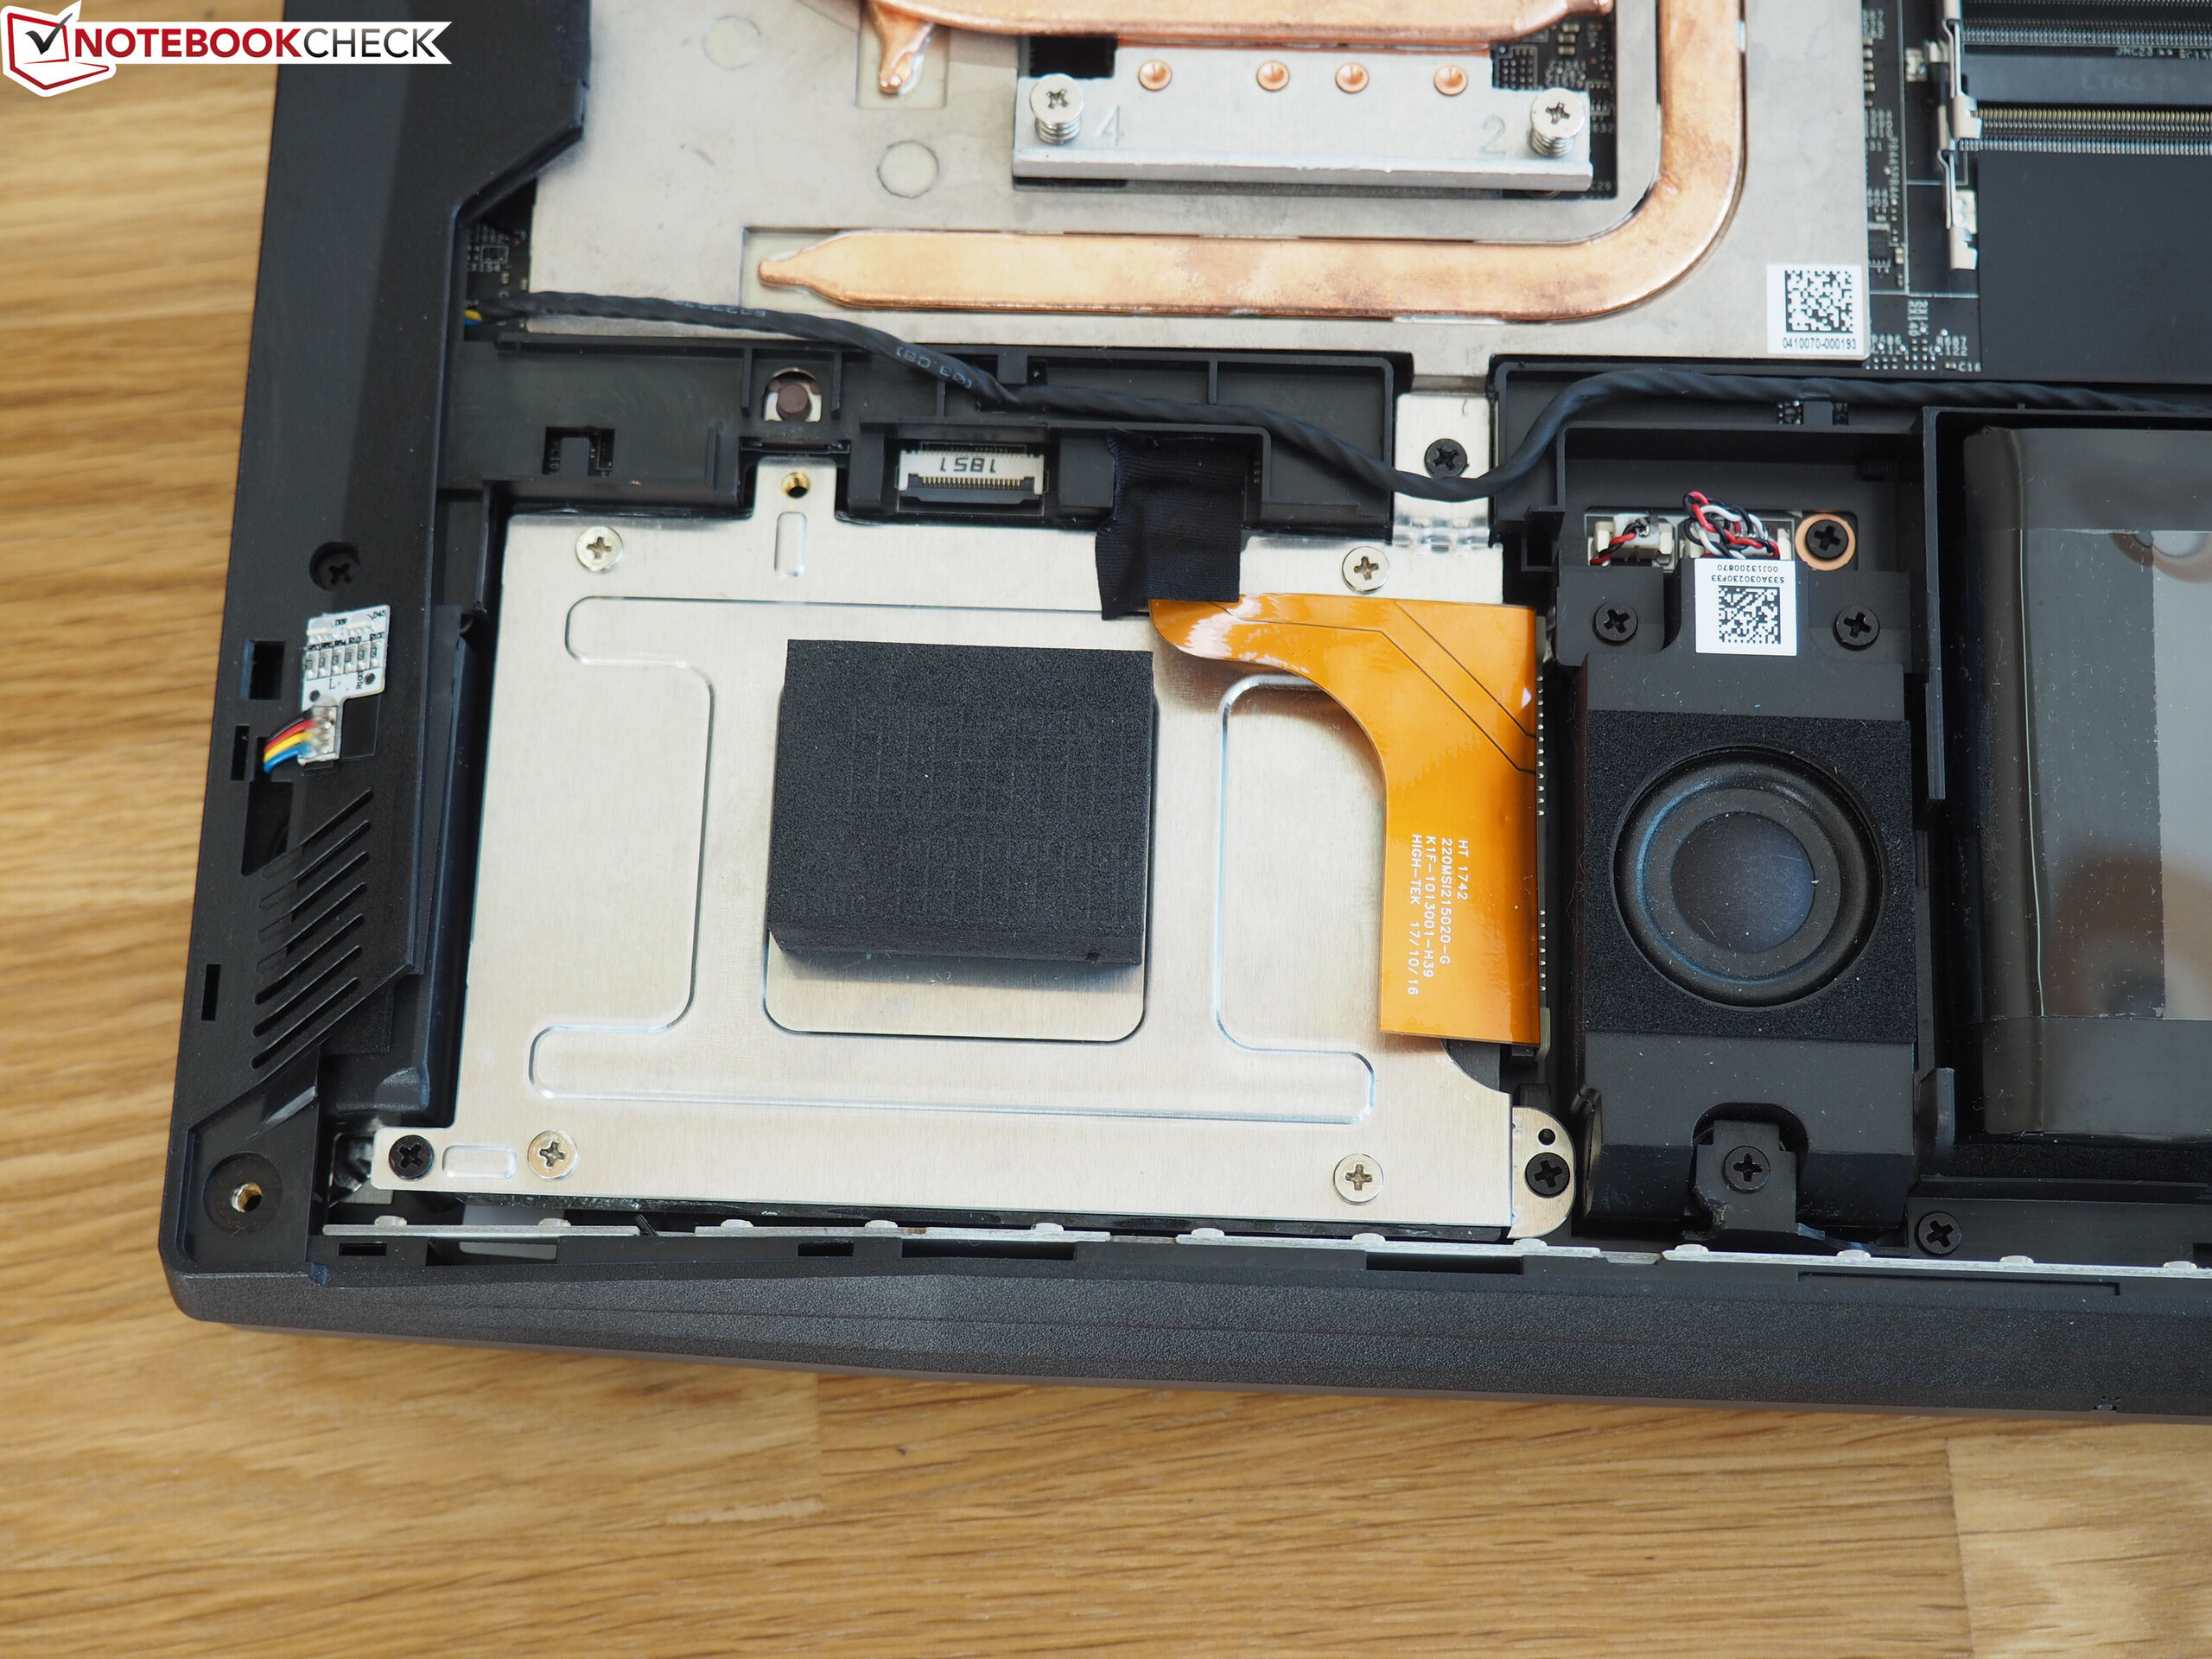
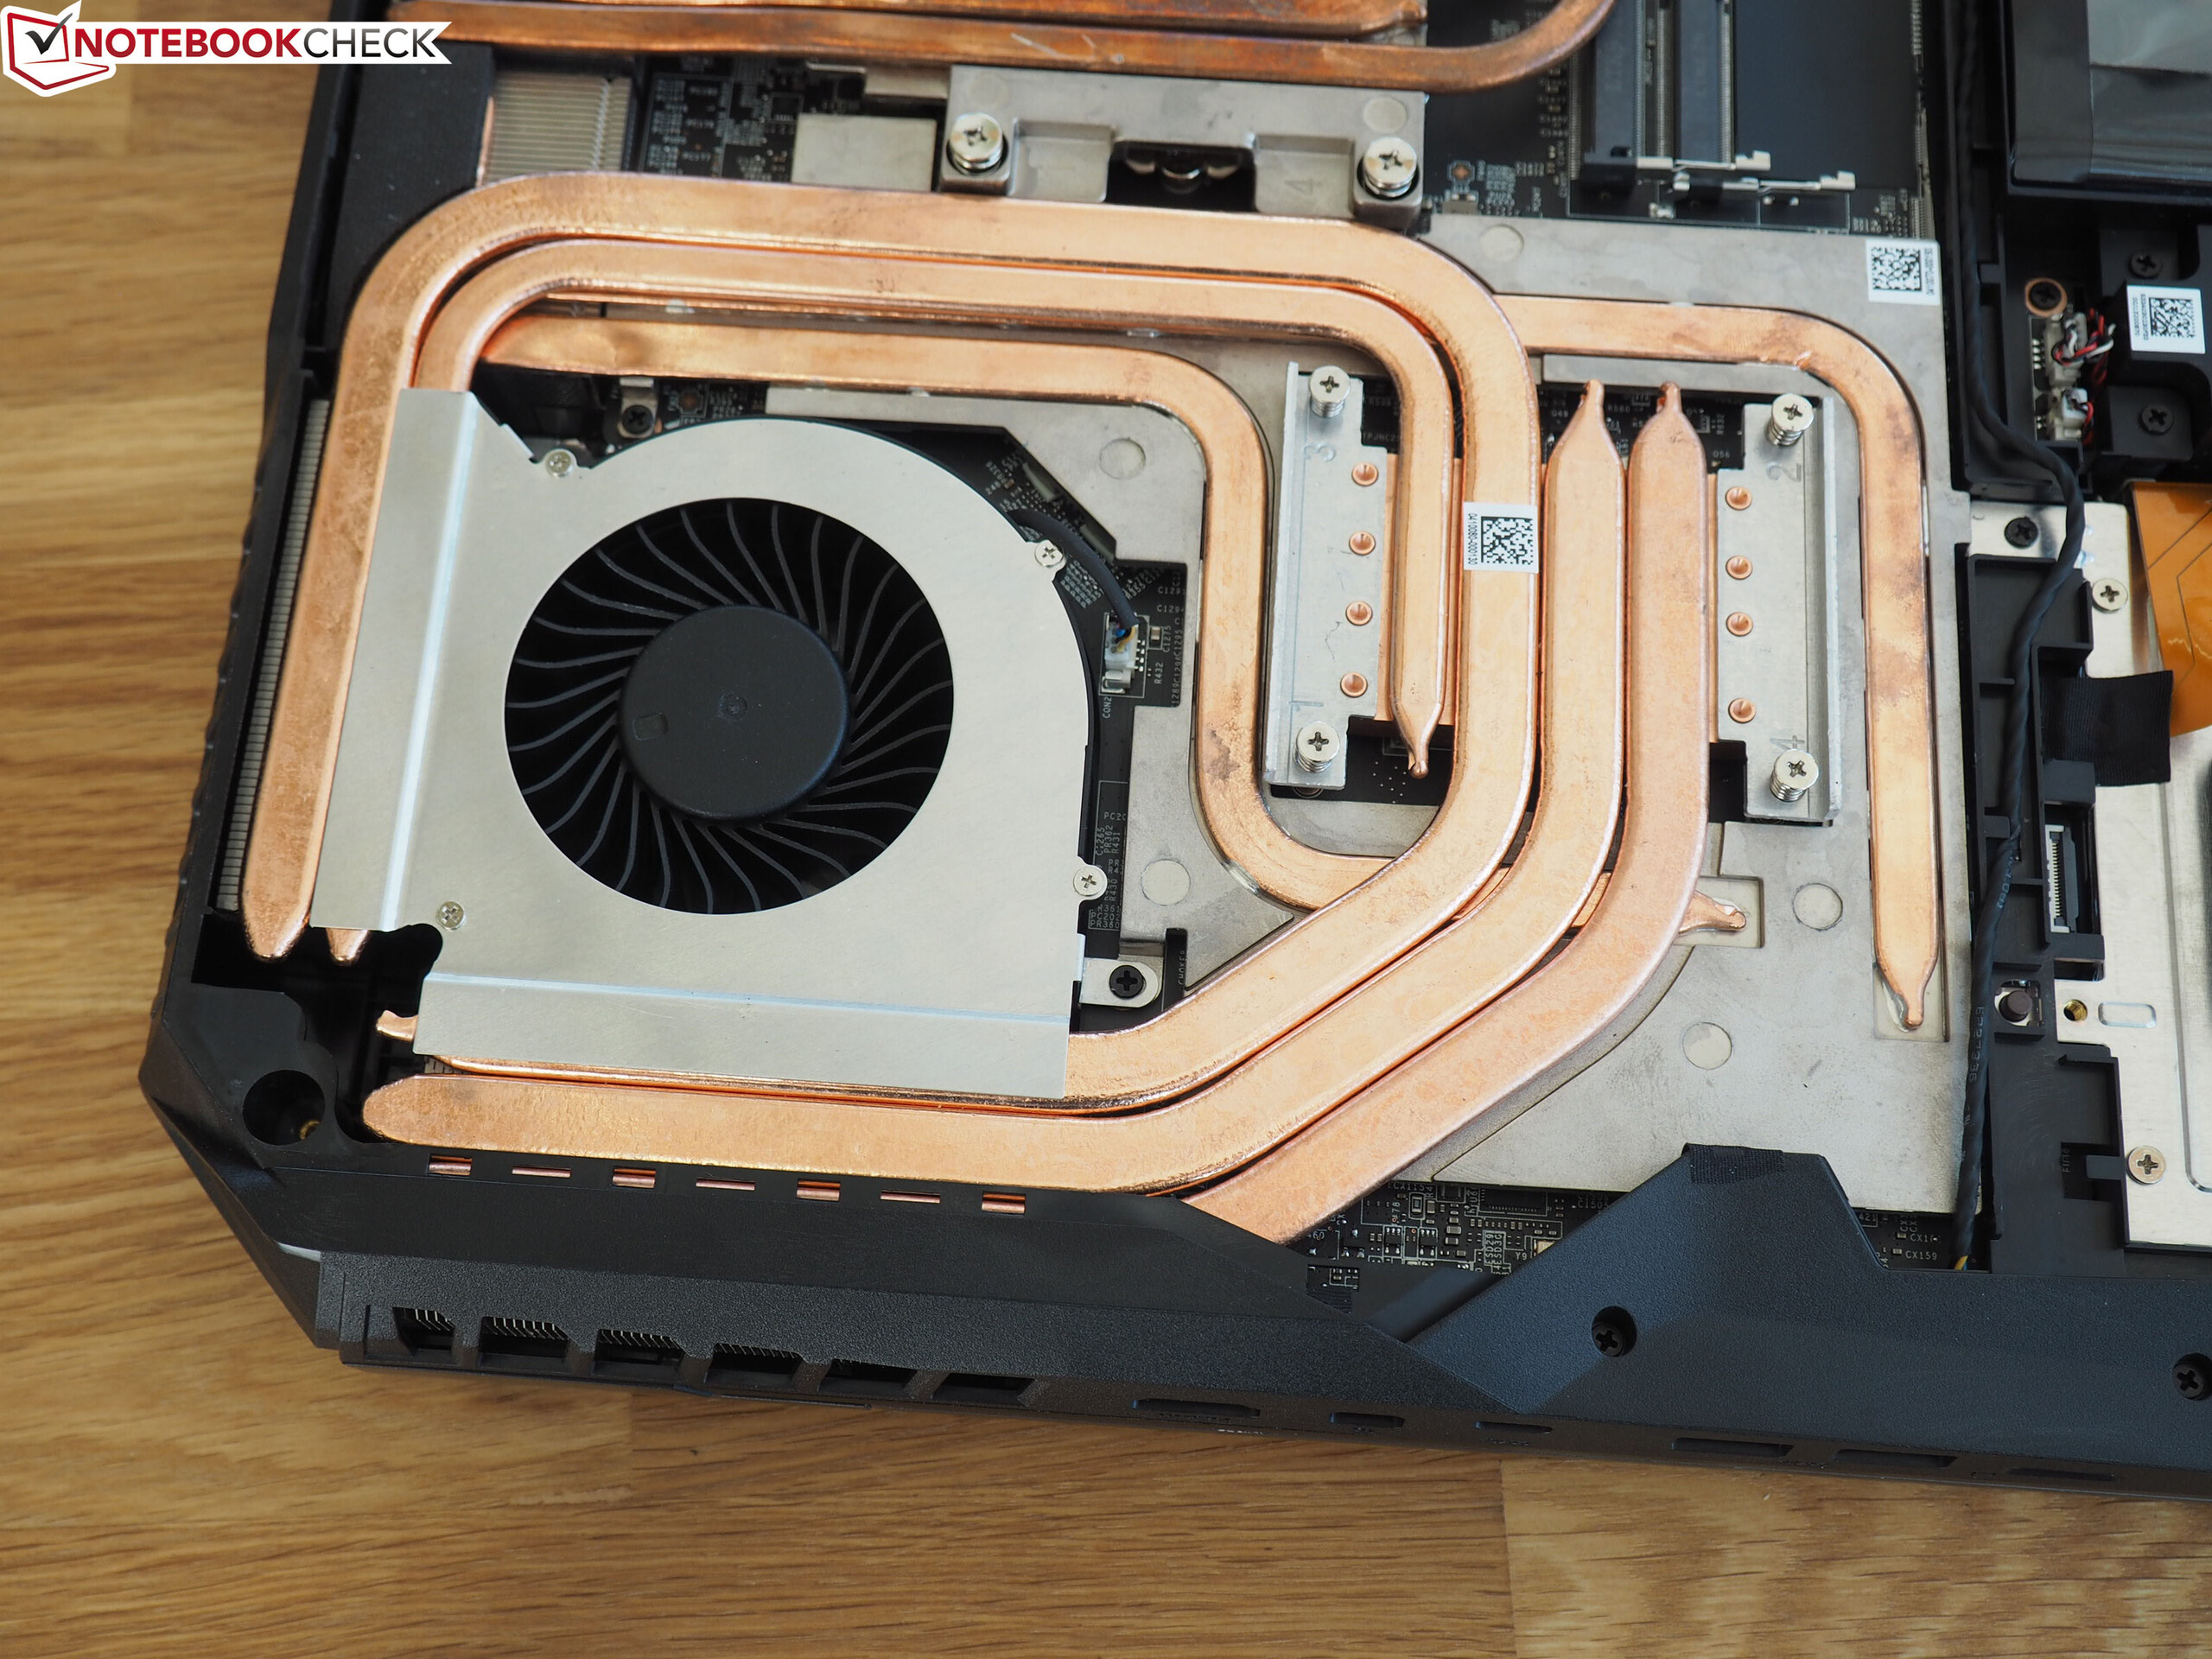
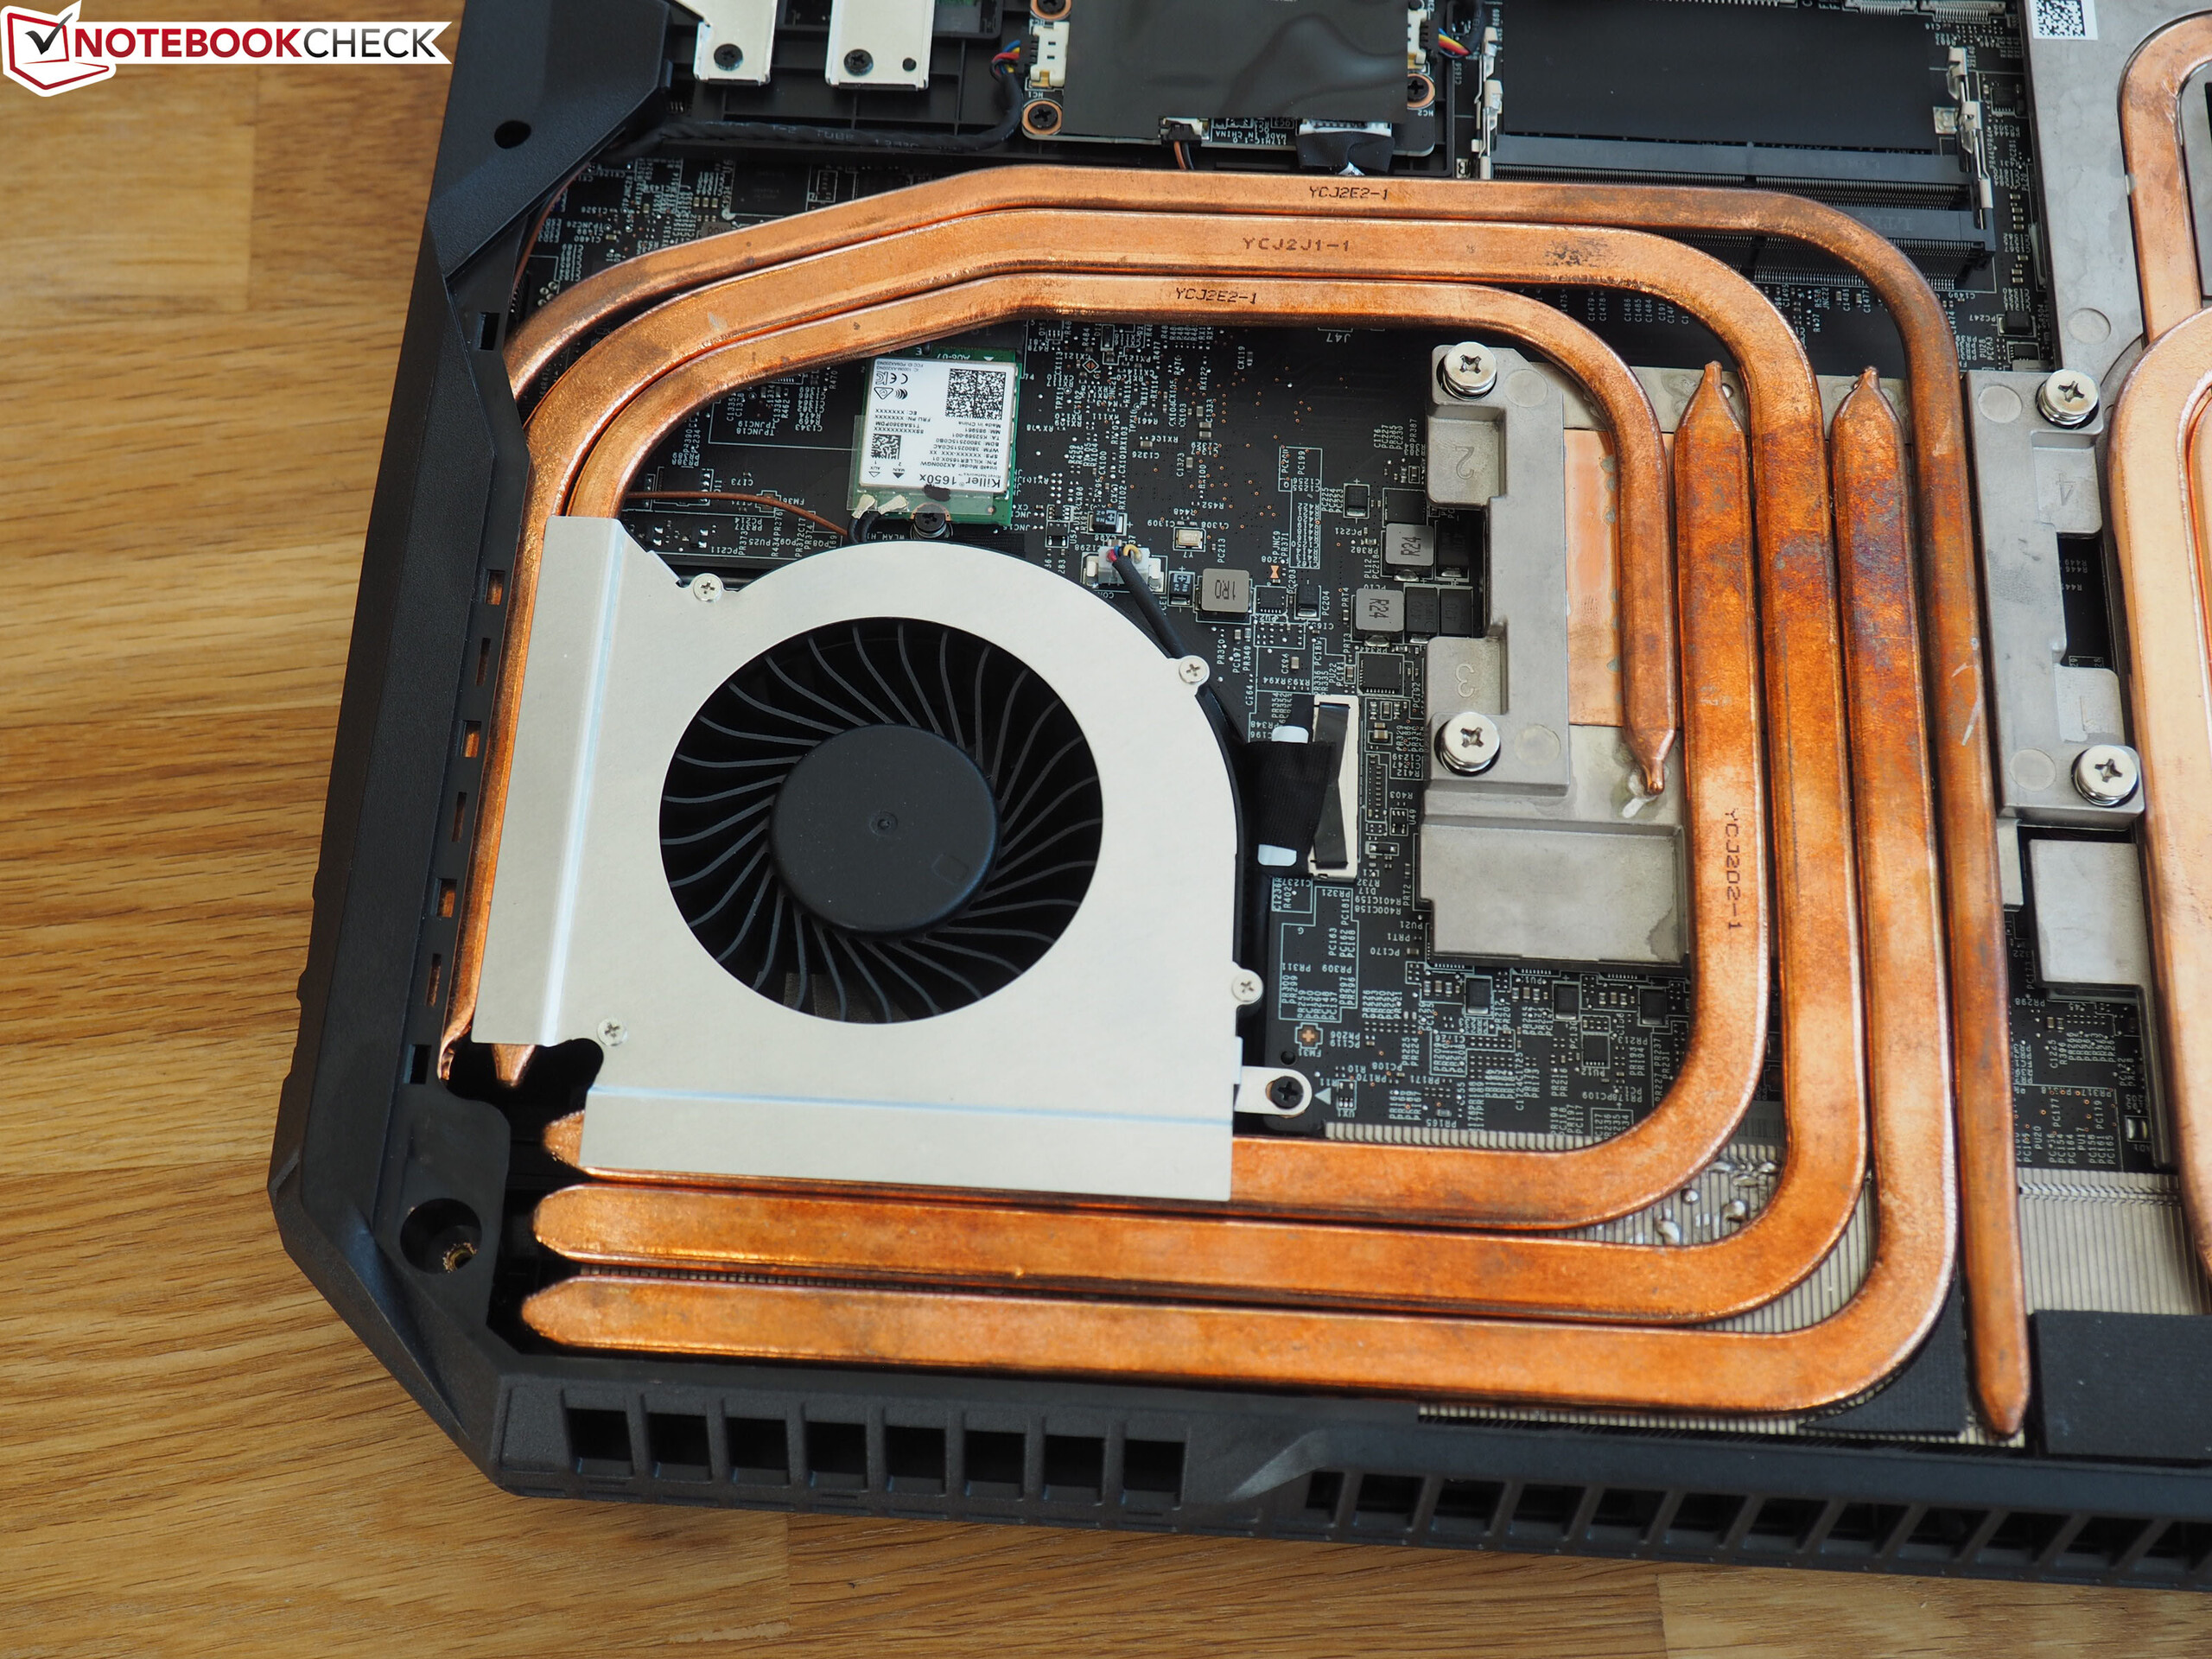
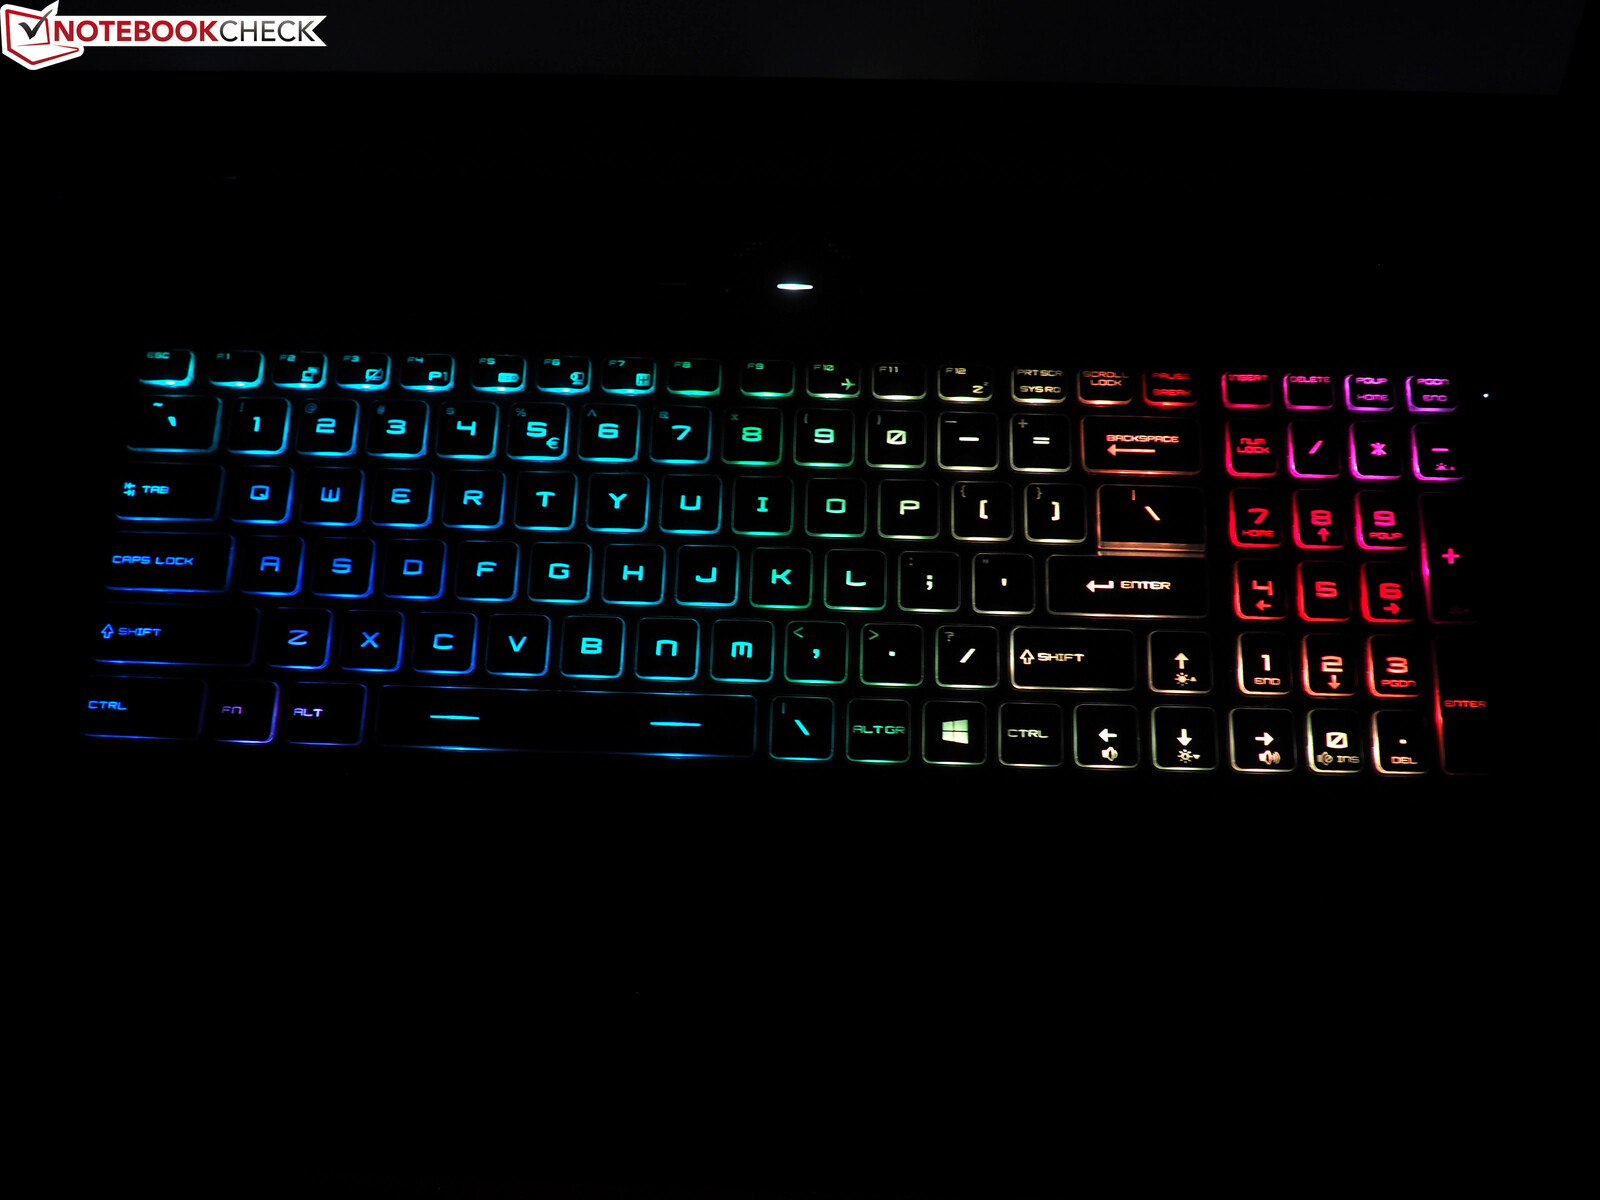
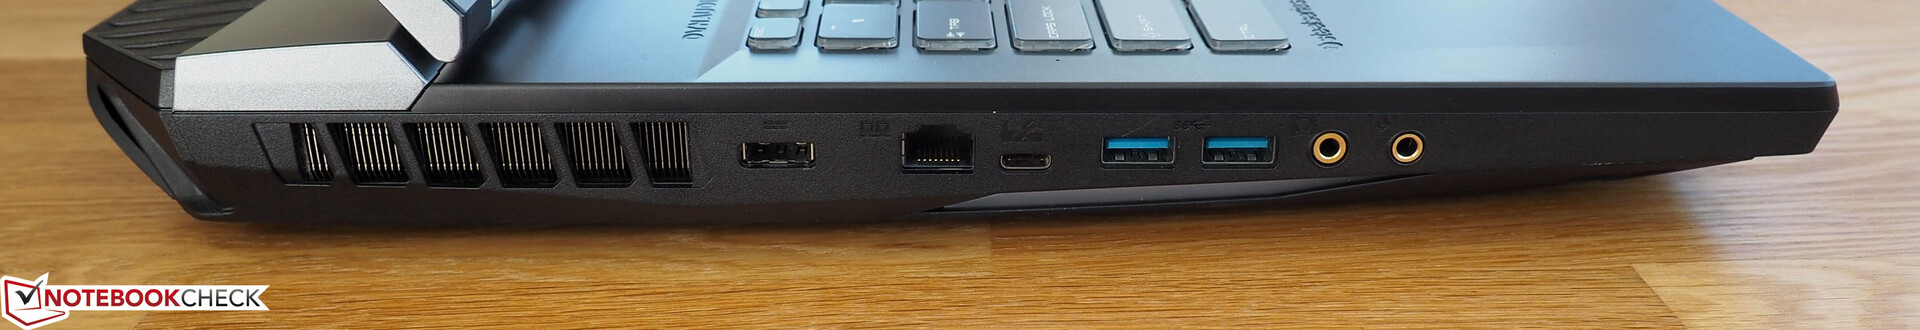
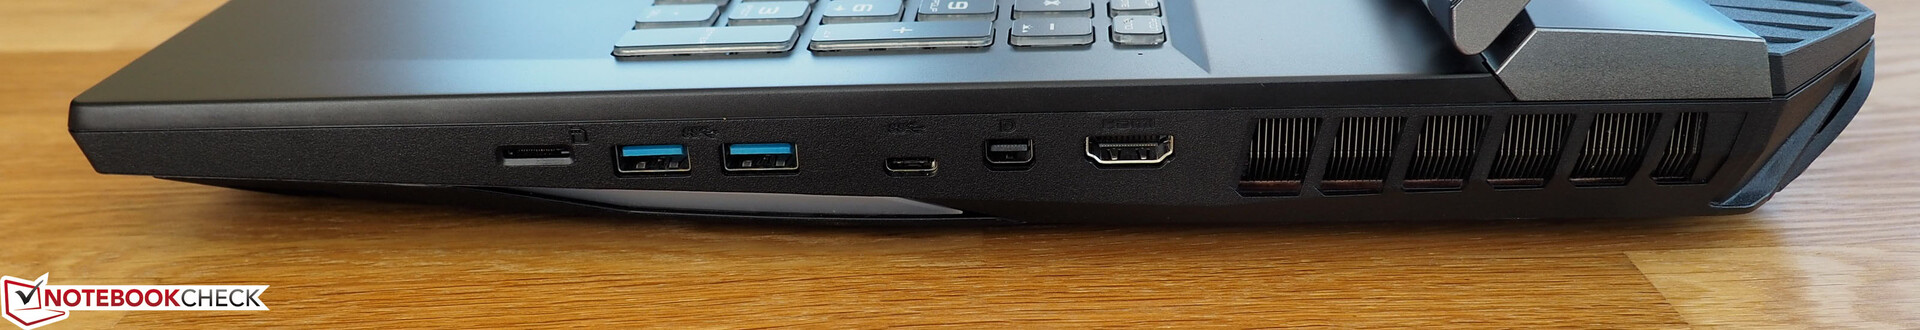
GT76 drar till sig din uppmärksamhet med massor av portar (Thunderbolt 3), bra inmatningsenheter och skaplig ljudkvalitet. Den tunt infattade 144 Hz-skärmen har bra bild och är mer än tillräcklig för en enhet med denna prislapp. Du får heller inte glömma de utförliga underhålls- och servicemöjligheterna.
Price comparison