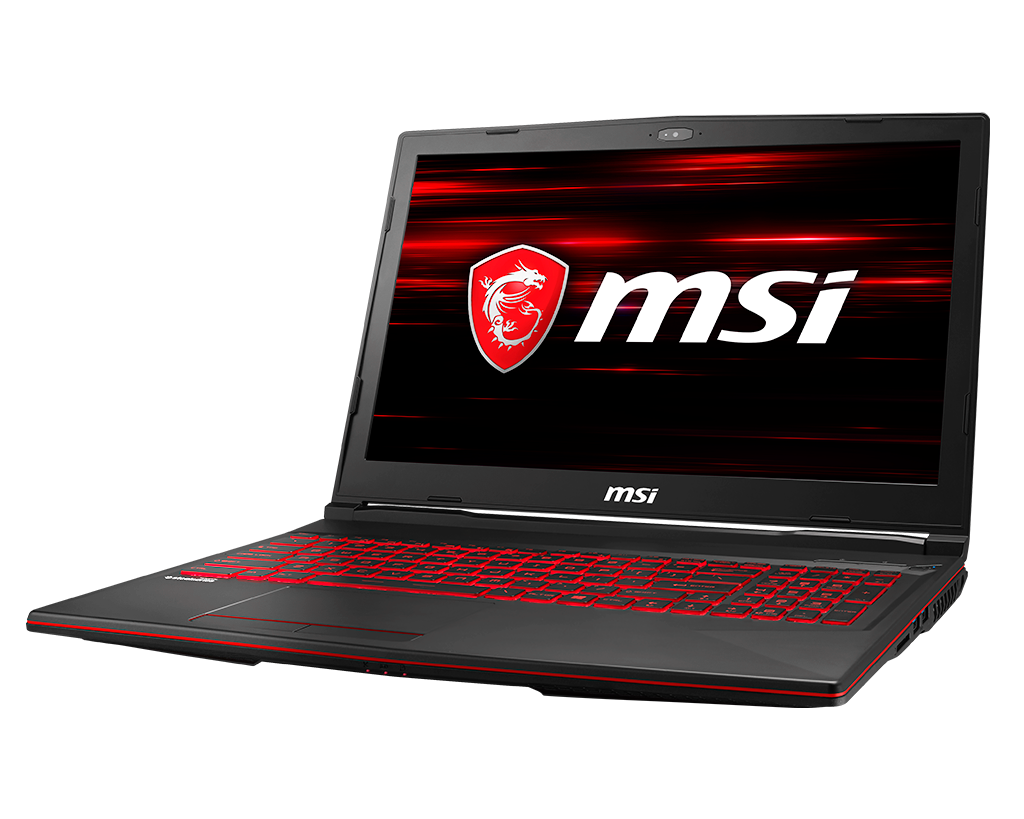
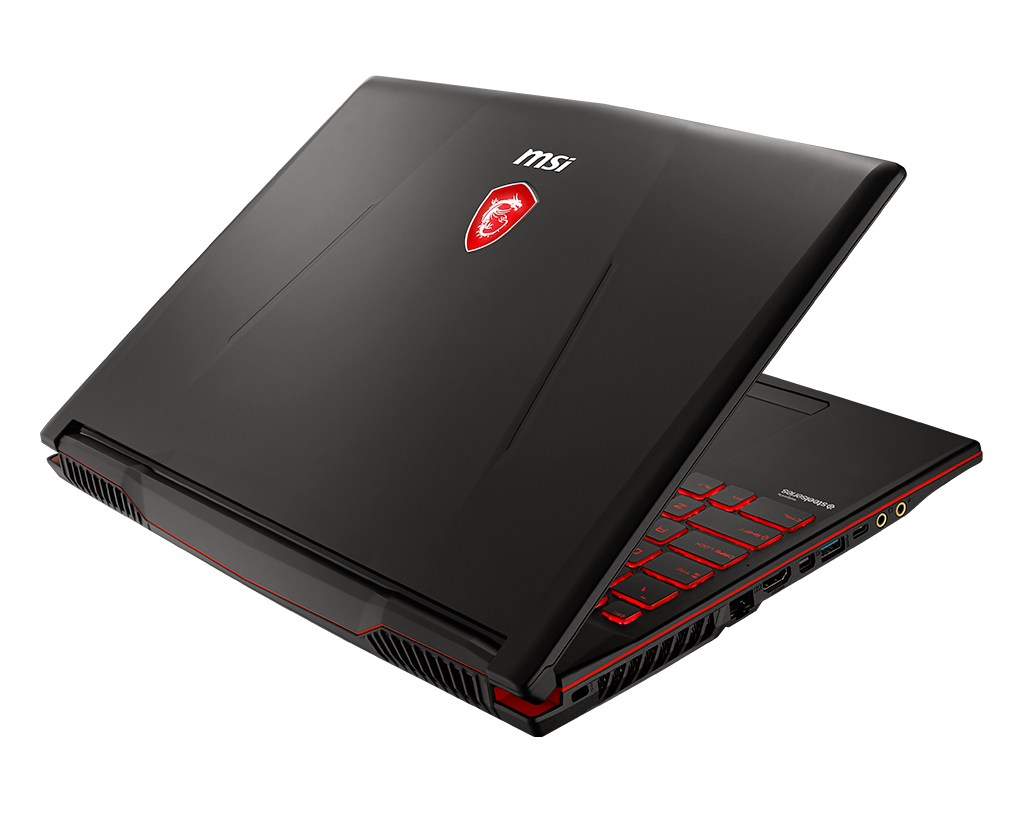
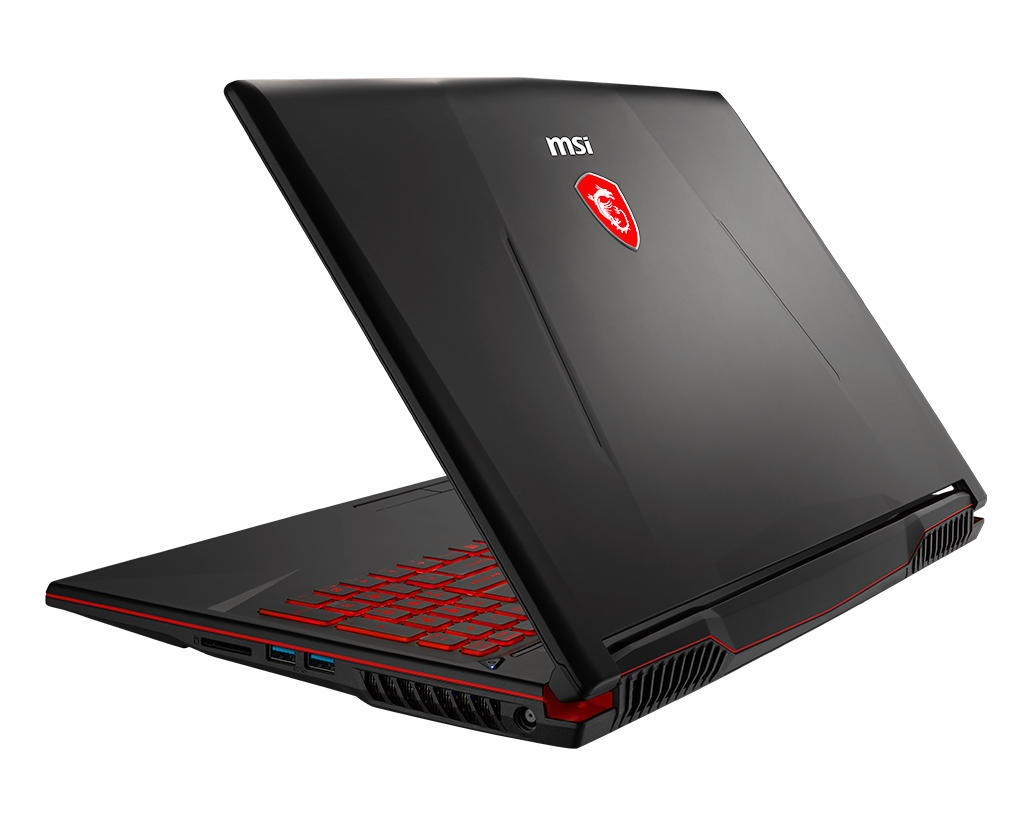
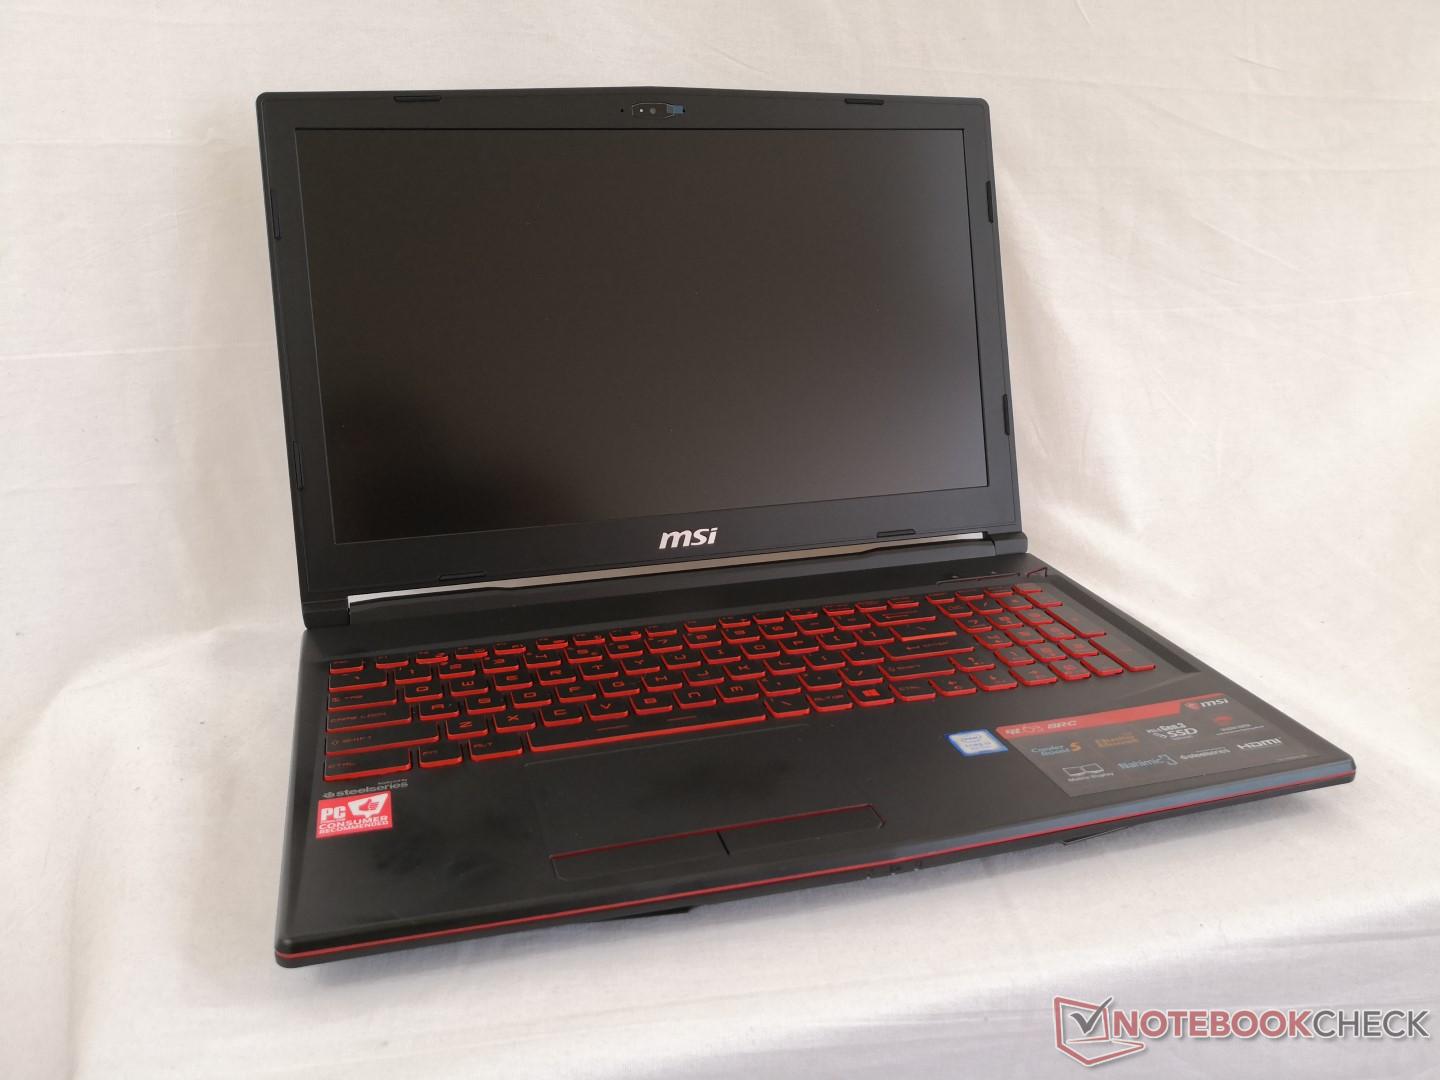
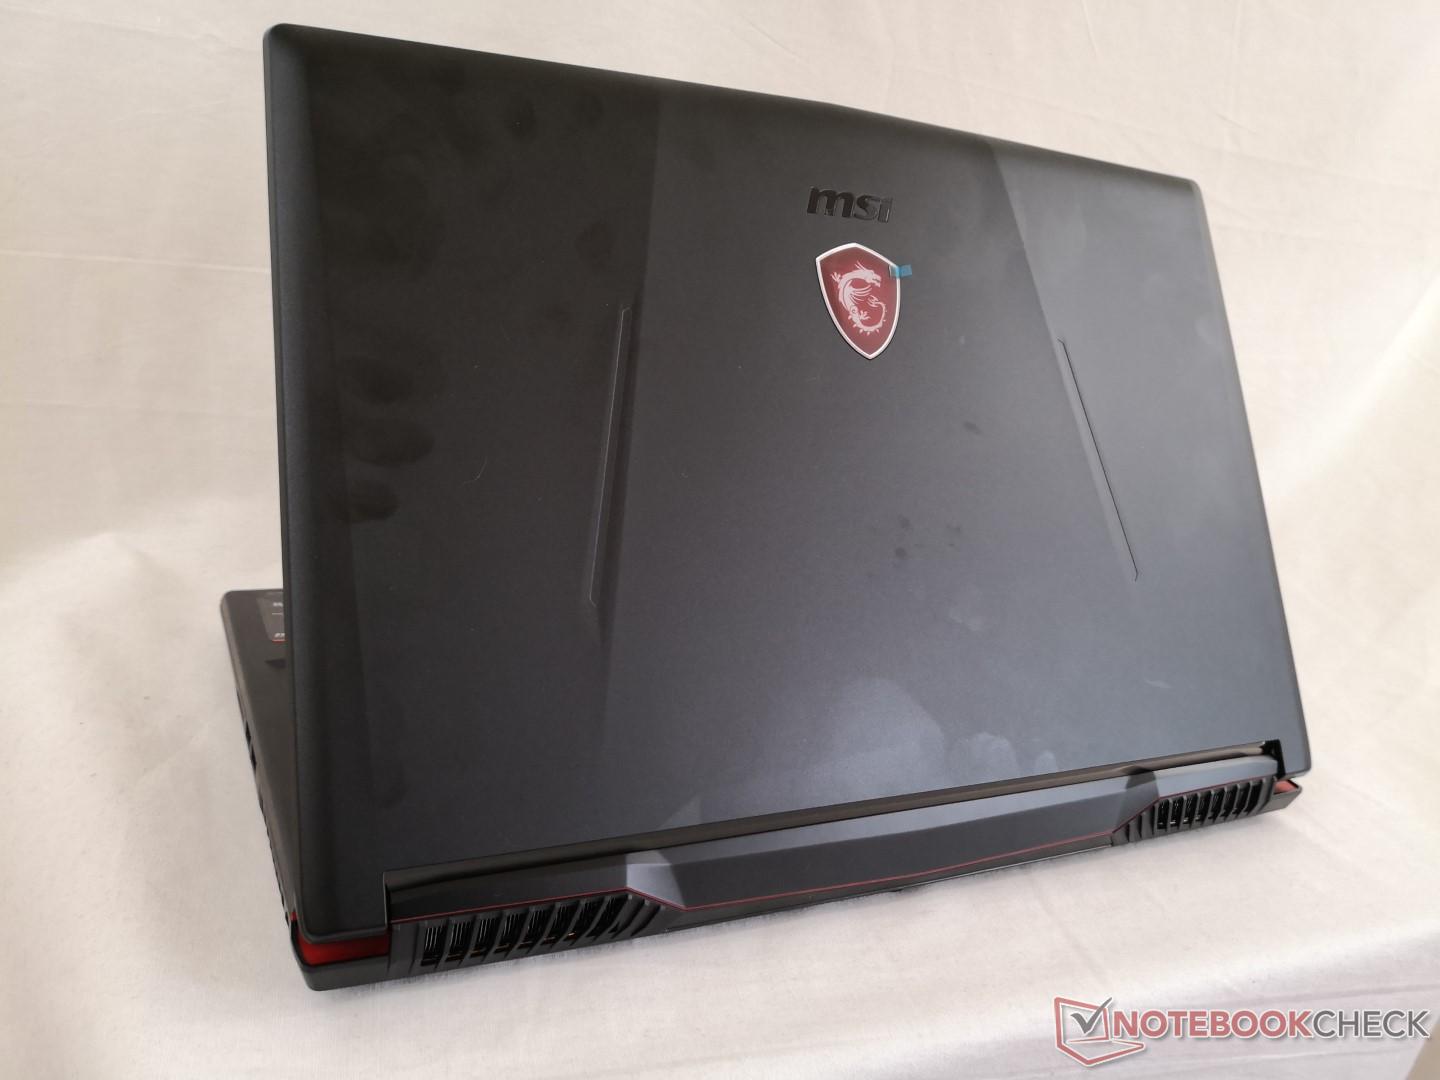
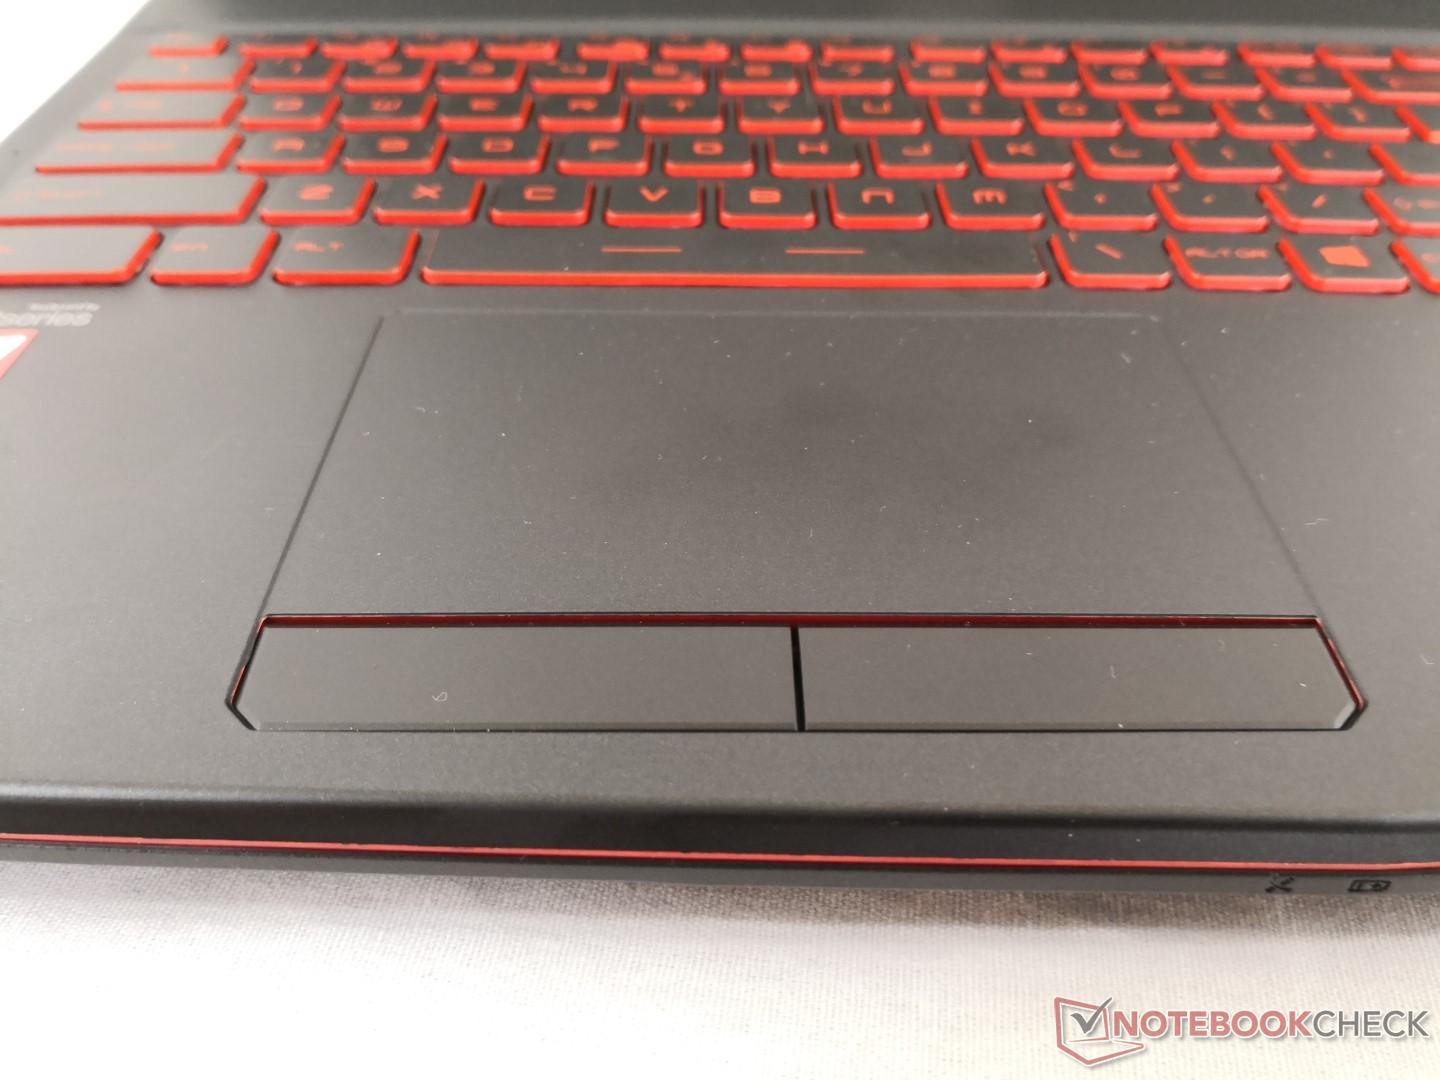
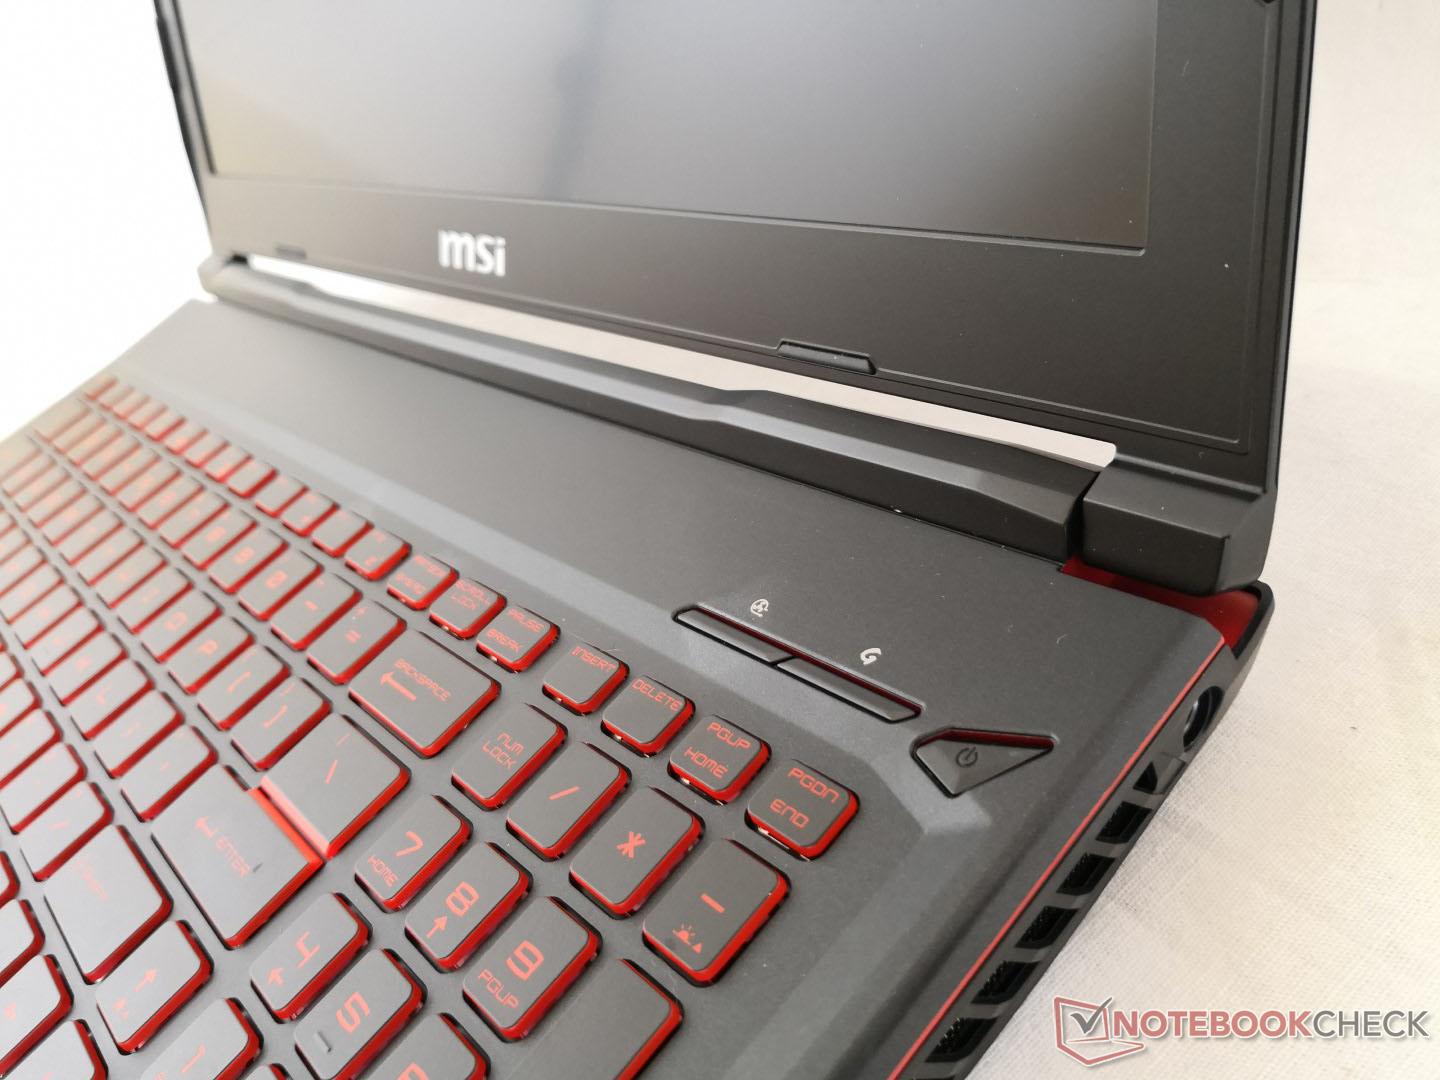
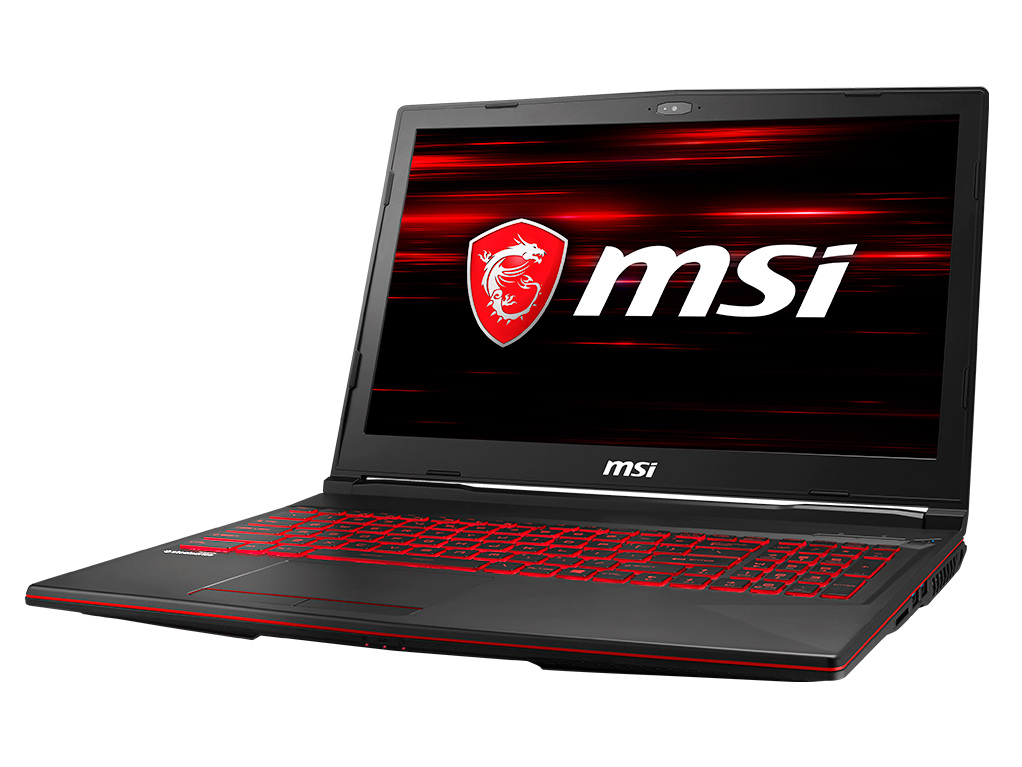
Test: MSI GL63 8RC (i5-8300H, GTX 1050) Laptop (Sammanfattning)
| SD Card Reader | |
| average JPG Copy Test (av. of 3 runs) | |
| Gigabyte Sabre 15G (Toshiba Exceria Pro SDXC 64 GB UHS-II) | |
| Dell G5 15 5587 (Toshiba Exceria Pro SDXC 64 GB UHS-II) | |
| MSI GL63 8RC-069US (Toshiba Exceria Pro SDXC 64 GB UHS-II) | |
| maximum AS SSD Seq Read Test (1GB) | |
| Gigabyte Sabre 15G (Toshiba Exceria Pro SDXC 64 GB UHS-II) | |
| Dell G5 15 5587 (Toshiba Exceria Pro SDXC 64 GB UHS-II) | |
| MSI GL63 8RC-069US (Toshiba Exceria Pro SDXC 64 GB UHS-II) | |
| Networking | |
| iperf3 transmit AX12 | |
| Dell G5 15 5587 | |
| Gigabyte Sabre 15G | |
| MSI GL63 8RC-069US | |
| iperf3 receive AX12 | |
| Dell G5 15 5587 | |
| MSI GL63 8RC-069US | |
| Gigabyte Sabre 15G | |
| |||||||||||||||||||||||||
Distribution av ljusstyrkan: 82 %
Mitt på batteriet: 286.5 cd/m²
Kontrast: 843:1 (Svärta: 0.34 cd/m²)
ΔE ColorChecker Calman: 5.57 | ∀{0.5-29.43 Ø4.71}
calibrated: 4.16
ΔE Greyscale Calman: 4.6 | ∀{0.09-98 Ø4.96}
58.9% sRGB (Argyll 1.6.3 3D)
37.4% AdobeRGB 1998 (Argyll 1.6.3 3D)
40.72% AdobeRGB 1998 (Argyll 3D)
59.2% sRGB (Argyll 3D)
39.4% Display P3 (Argyll 3D)
Gamma: 2.15
CCT: 7564 K
| MSI GL63 8RC-069US LG Philips LP156WF6-SPK6, IPS, 15.6", 1920x1080 | Dell G5 15 5587 LGD053F, 156WF6, IPS, 15.6", 1920x1080 | MSI GL62M 7RD-077 Chi Mei N156HGE-EAL, TN LED, 15.6", 1920x1080 | Lenovo Legion Y520-15IKBA-80WY001VGE LG Philips LGD0533, IPS, 15.6", 1920x1080 | HP Pavilion 15 Power 1GK62AV ID: AU Optronics AUO41ED, IPS, 15.6", 1920x1080 | Gigabyte Sabre 15G ID: LGD0533, Name: LG Display LP156WF6-SPK3, IPS, 15.6", 1920x1080 | |
|---|---|---|---|---|---|---|
| Display | -3% | 97% | 0% | -2% | -1% | |
| Display P3 Coverage (%) | 39.4 | 38.13 -3% | 85.4 117% | 39.53 0% | 38.81 -1% | 38.97 -1% |
| sRGB Coverage (%) | 59.2 | 56.8 -4% | 100 69% | 59.2 0% | 57.9 -2% | 58.2 -2% |
| AdobeRGB 1998 Coverage (%) | 40.72 | 39.47 -3% | 83.8 106% | 40.86 0% | 40.03 -2% | 40.3 -1% |
| Response Times | 1% | -26% | -19% | -16% | -1% | |
| Response Time Grey 50% / Grey 80% * (ms) | 33.6 ? | 33 ? 2% | 44 ? -31% | 42 ? -25% | 38.8 ? -15% | 32 ? 5% |
| Response Time Black / White * (ms) | 24 ? | 24 ? -0% | 29 ? -21% | 27 ? -13% | 28 ? -17% | 25.6 ? -7% |
| PWM Frequency (Hz) | 198 ? | 24900 ? | 20000 ? | |||
| Screen | -7% | -17% | -3% | 11% | -14% | |
| Brightness middle (cd/m²) | 286.5 | 229 -20% | 258 -10% | 243 -15% | 256.6 -10% | 248.4 -13% |
| Brightness (cd/m²) | 258 | 224 -13% | 234 -9% | 231 -10% | 243 -6% | 241 -7% |
| Brightness Distribution (%) | 82 | 87 6% | 79 -4% | 87 6% | 81 -1% | 84 2% |
| Black Level * (cd/m²) | 0.34 | 0.28 18% | 0.54 -59% | 0.24 29% | 0.19 44% | 0.3 12% |
| Contrast (:1) | 843 | 818 -3% | 478 -43% | 1013 20% | 1351 60% | 828 -2% |
| Colorchecker dE 2000 * | 5.57 | 6.1 -10% | 9.74 -75% | 6.36 -14% | 5 10% | 7.5 -35% |
| Colorchecker dE 2000 max. * | 16.8 | 12.2 27% | 14.6 13% | 12.76 24% | 20.1 -20% | 25.2 -50% |
| Colorchecker dE 2000 calibrated * | 4.16 | 6.12 -47% | 6.51 -56% | |||
| Greyscale dE 2000 * | 4.6 | 5.68 -23% | 11.59 -152% | 5.63 -22% | 2.7 41% | 6.5 -41% |
| Gamma | 2.15 102% | 2.4 92% | 2.19 100% | 2.47 89% | 2.32 95% | 2.19 100% |
| CCT | 7564 86% | 6989 93% | 11851 55% | 7411 88% | 6599 98% | 7852 83% |
| Color Space (Percent of AdobeRGB 1998) (%) | 37.4 | 36 -4% | 76 103% | 38 2% | 36.7 -2% | 37 -1% |
| Color Space (Percent of sRGB) (%) | 58.9 | 57 -3% | 100 70% | 59 0% | 57.7 -2% | 57.9 -2% |
| Totalt genomsnitt (program/inställningar) | -3% /
-5% | 18% /
5% | -7% /
-5% | -2% /
5% | -5% /
-10% |
* ... mindre är bättre
Visa svarstider
| ↔ Svarstid svart till vitt | ||
|---|---|---|
| 24 ms ... stiga ↗ och falla ↘ kombinerat | ↗ 13.2 ms stiga |  |
| ↘ 10.8 ms hösten | ||
| Skärmen visar bra svarsfrekvens i våra tester, men kan vara för långsam för konkurrenskraftiga spelare. I jämförelse sträcker sig alla testade enheter från 0.1 (minst) till 240 (maximalt) ms. » 54 % av alla enheter är bättre. Detta innebär att den uppmätta svarstiden är sämre än genomsnittet av alla testade enheter (19.8 ms). | ||
| ↔ Svarstid 50 % grått till 80 % grått | ||
| 33.6 ms ... stiga ↗ och falla ↘ kombinerat | ↗ 16.8 ms stiga | 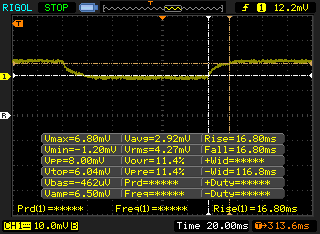 |
| ↘ 16.8 ms hösten | ||
| Skärmen visar långsamma svarsfrekvenser i våra tester och kommer att vara otillfredsställande för spelare. I jämförelse sträcker sig alla testade enheter från 0.165 (minst) till 636 (maximalt) ms. » 46 % av alla enheter är bättre. Det betyder att den uppmätta svarstiden liknar genomsnittet av alla testade enheter (31 ms). | ||
Skärmflimmer / PWM (Puls-Width Modulation)
| Skärmflimmer / PWM upptäcktes inte | 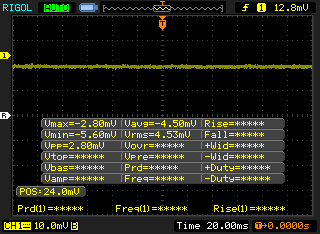 | ||
Som jämförelse: 52 % av alla testade enheter använder inte PWM för att dämpa skärmen. Om PWM upptäcktes mättes ett medelvärde av 7754 (minst: 5 - maximum: 343500) Hz. | |||
| Cinebench R10 | |
| Rendering Multiple CPUs 32Bit | |
| Eurocom Tornado F5 | |
| Asus ROG Strix GL702ZC-GC204T | |
| Genomsnitt Intel Core i5-8300H (20061 - 24718, n=4) | |
| MSI GF62VR 7RF-877 | |
| MSI GE72VR-6RF16H21 | |
| Acer Swift 3 SF315-41-R6J9 | |
| Rendering Single 32Bit | |
| Eurocom Tornado F5 | |
| Genomsnitt Intel Core i5-8300H (6115 - 6524, n=4) | |
| MSI GF62VR 7RF-877 | |
| MSI GE72VR-6RF16H21 | |
| Acer Swift 3 SF315-41-R6J9 | |
| Asus ROG Strix GL702ZC-GC204T | |
| wPrime 2.10 - 1024m | |
| Asus ROG Strix GL702ZC-GC204T | |
| Acer Swift 3 SF315-41-R6J9 | |
| Genomsnitt Intel Core i5-8300H (206 - 286, n=4) | |
| MSI GF62VR 7RF-877 | |
| Eurocom Tornado F5 | |
* ... mindre är bättre
| PCMark 10 - Score | |
| MSI GT63 Titan 8RG-046 | |
| Dell G5 15 5587 | |
| MSI GF62VR 7RF-877 | |
| Gigabyte Sabre 15G | |
| MSI GL63 8RC-069US | |
| PCMark 8 | |
| Home Score Accelerated v2 | |
| MSI GT63 Titan 8RG-046 | |
| Dell G5 15 5587 | |
| MSI GF62VR 7RF-877 | |
| MSI GL63 8RC-069US | |
| MSI GL62M 7RD-077 | |
| Gigabyte Sabre 15G | |
| Work Score Accelerated v2 | |
| MSI GT63 Titan 8RG-046 | |
| Dell G5 15 5587 | |
| MSI GL63 8RC-069US | |
| MSI GF62VR 7RF-877 | |
| Gigabyte Sabre 15G | |
| MSI GL62M 7RD-077 | |
| PCMark 8 Home Score Accelerated v2 | 3927 poäng | |
| PCMark 8 Work Score Accelerated v2 | 5270 poäng | |
| PCMark 10 Score | 3912 poäng | |
Hjälp | ||
| MSI GL63 8RC-069US Toshiba HG6 THNSNJ256G8NY | Dell G5 15 5587 SK hynix SC311 M.2 | Gigabyte Sabre 15G Liteonit CV3-8D128 | MSI GF62VR 7RF-877 Intel SSD 600p SSDPEKKW256G7 | HP Spectre x360 15-ch011nr SK hynix PC401 NVMe 500 GB | Lenovo Legion Y520-15IKBA-80WY001VGE Seagate Mobile HDD 1TB ST1000LM035 | |
|---|---|---|---|---|---|---|
| CrystalDiskMark 5.2 / 6 | -8% | 26% | 82% | 145% | -91% | |
| Write 4K (MB/s) | 60.2 | 67 11% | 66.3 10% | 132.7 120% | 108.5 80% | 0.296 -100% |
| Read 4K (MB/s) | 19.94 | 25.8 29% | 36.68 84% | 32.25 62% | 37.67 89% | 0.363 -98% |
| Write Seq (MB/s) | 443.1 | 238 -46% | 469.2 6% | 476.5 8% | 1120 153% | 102.3 -77% |
| Read Seq (MB/s) | 527 | 506 -4% | 536 2% | 867 65% | 1300 147% | 85.3 -84% |
| Write 4K Q32T1 (MB/s) | 140.5 | 155.2 10% | 182 30% | 400.9 185% | 243.9 74% | 0.403 -100% |
| Read 4K Q32T1 (MB/s) | 215.8 | 195.8 -9% | 357.9 66% | 281.5 30% | 311.6 44% | 0.822 -100% |
| Write Seq Q32T1 (MB/s) | 489 | 232.7 -52% | 507 4% | 474.9 -3% | 1395 185% | 79.8 -84% |
| Read Seq Q32T1 (MB/s) | 544 | 549 1% | 562 3% | 1558 186% | 2667 390% | 97 -82% |
| Write 4K Q8T8 (MB/s) | 214 | |||||
| Read 4K Q8T8 (MB/s) | 205 |

| 3DMark | |
| 1280x720 Cloud Gate Standard Graphics | |
| Aorus X5 v8 | |
| MSI GV62 8RE-016US | |
| Acer Predator Helios 300 PH317-52-51M6 | |
| Asus Strix GL502VT-DS74 | |
| Zotac GeForce GTX 1050 2GB | |
| MSI GL63 8RC-069US | |
| Genomsnitt NVIDIA GeForce GTX 1050 Mobile (14979 - 40201, n=40) | |
| Asus GL552VW-DH74 | |
| MSI PX60 6QD | |
| HP Spectre x360 15-ch011nr | |
| Acer Swift 3 SF315-41-R6J9 | |
| 1920x1080 Fire Strike Graphics | |
| Aorus X5 v8 | |
| MSI GV62 8RE-016US | |
| Acer Predator Helios 300 PH317-52-51M6 | |
| Asus Strix GL502VT-DS74 | |
| Zotac GeForce GTX 1050 2GB | |
| MSI GL63 8RC-069US | |
| Genomsnitt NVIDIA GeForce GTX 1050 Mobile (4935 - 6651, n=43) | |
| Asus GL552VW-DH74 | |
| MSI PX60 6QD | |
| HP Spectre x360 15-ch011nr | |
| Acer Swift 3 SF315-41-R6J9 | |
| 3DMark 11 Performance | 7709 poäng | |
| 3DMark Cloud Gate Standard Score | 20894 poäng | |
| 3DMark Fire Strike Score | 5594 poäng | |
Hjälp | ||
| låg | med. | hög | ultra | |
|---|---|---|---|---|
| BioShock Infinite (2013) | 192.7 | 160.8 | 155.5 | 64 |
| The Witcher 3 (2015) | 125.1 | 74.9 | 42.4 | 21.9 |
| Rise of the Tomb Raider (2016) | 121.9 | 74.9 | 40.1 | 33.2 |
Ljudnivå
| Låg belastning |
| 28.6 / 31.6 / 31.6 dB(A) |
| Hög belastning |
| 38.6 / 56.8 dB(A) |
 | ||
30 dB tyst 40 dB(A) hörbar 50 dB(A) högt ljud |
||
min: | ||
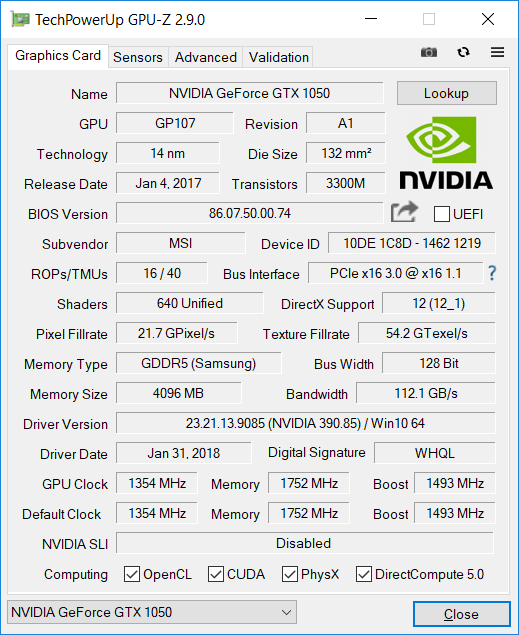
| MSI GL63 8RC-069US GeForce GTX 1050 Mobile, i5-8300H, Toshiba HG6 THNSNJ256G8NY | Dell G5 15 5587 GeForce GTX 1060 Max-Q, i5-8300H, SK hynix SC311 M.2 | Gigabyte Sabre 15G GeForce GTX 1050 Mobile, i7-7700HQ, Liteonit CV3-8D128 | MSI GV62 8RE-016US GeForce GTX 1060 Mobile, i5-8300H, Samsung PM871b MZNLN128HAHQ | Aorus X5 v8 GeForce GTX 1070 Mobile, i7-8850H, Toshiba NVMe THNSN5512GPU7 | Asus GL503VD-DB74 GeForce GTX 1050 Mobile, i7-7700HQ, ADATA SX7000NP 256 GB | |
|---|---|---|---|---|---|---|
| Noise | 1% | -8% | -8% | -14% | -2% | |
| av / miljö * (dB) | 28.6 | 30.3 -6% | 28.2 1% | 28.2 1% | 30 -5% | 28.3 1% |
| Idle Minimum * (dB) | 28.6 | 31.1 -9% | 33 -15% | 33.5 -17% | 33 -15% | 30.6 -7% |
| Idle Average * (dB) | 31.6 | 31.1 2% | 33.3 -5% | 33.5 -6% | 35 -11% | 30.8 3% |
| Idle Maximum * (dB) | 31.6 | 34.2 -8% | 34.7 -10% | 33.7 -7% | 40 -27% | 32.8 -4% |
| Load Average * (dB) | 38.6 | 34.9 10% | 44.5 -15% | 41 -6% | 45 -17% | 37.6 3% |
| Witcher 3 ultra * (dB) | 40.6 | 42.7 -5% | 49.2 -21% | 52.3 -29% | 50 -23% | 47 -16% |
| Load Maximum * (dB) | 56.8 | 44 23% | 52.8 7% | 52.3 8% | 55 3% | 53.5 6% |
* ... mindre är bättre
(-) Den maximala temperaturen på ovansidan är 47 °C / 117 F, jämfört med genomsnittet av 40.4 °C / 105 F , allt från 21.2 till 68.8 °C för klassen Gaming.
(-) Botten värms upp till maximalt 48 °C / 118 F, jämfört med genomsnittet av 43.2 °C / 110 F
(±) Vid tomgångsbruk är medeltemperaturen för ovansidan 32.1 °C / 90 F, jämfört med enhetsgenomsnittet på 33.9 °C / ### class_avg_f### F.
(±) När du spelar The Witcher 3 är medeltemperaturen för ovansidan 35.6 °C / 96 F, jämfört med enhetsgenomsnittet på 33.9 °C / ## #class_avg_f### F.
(+) Handledsstöden och pekplattan når maximal hudtemperatur (35 °C / 95 F) och är därför inte varma.
(-) Medeltemperaturen för handledsstödsområdet på liknande enheter var 28.8 °C / 83.8 F (-6.2 °C / -11.2 F).
MSI GL63 8RC-069US ljudanalys
(±) | högtalarljudstyrkan är genomsnittlig men bra (74.1 dB)
Bas 100 - 315 Hz
(±) | reducerad bas - i genomsnitt 12.8% lägre än medianen
(±) | linjäriteten för basen är genomsnittlig (11.6% delta till föregående frekvens)
Mellan 400 - 2000 Hz
(+) | balanserad mellan - endast 1.8% från medianen
(+) | mids är linjära (6.4% delta till föregående frekvens)
Högsta 2 - 16 kHz
(+) | balanserade toppar - endast 3.3% från medianen
(+) | toppar är linjära (5% delta till föregående frekvens)
Totalt 100 - 16 000 Hz
(+) | det totala ljudet är linjärt (13.8% skillnad mot median)
Jämfört med samma klass
» 21% av alla testade enheter i den här klassen var bättre, 7% liknande, 71% sämre
» Den bästa hade ett delta på 6%, genomsnittet var 18%, sämst var 132%
Jämfört med alla testade enheter
» 15% av alla testade enheter var bättre, 4% liknande, 81% sämre
» Den bästa hade ett delta på 4%, genomsnittet var 23%, sämst var 134%
Apple MacBook 12 (Early 2016) 1.1 GHz ljudanalys
(+) | högtalare kan spela relativt högt (83.6 dB)
Bas 100 - 315 Hz
(±) | reducerad bas - i genomsnitt 11.3% lägre än medianen
(±) | linjäriteten för basen är genomsnittlig (14.2% delta till föregående frekvens)
Mellan 400 - 2000 Hz
(+) | balanserad mellan - endast 2.4% från medianen
(+) | mids är linjära (5.5% delta till föregående frekvens)
Högsta 2 - 16 kHz
(+) | balanserade toppar - endast 2% från medianen
(+) | toppar är linjära (4.5% delta till föregående frekvens)
Totalt 100 - 16 000 Hz
(+) | det totala ljudet är linjärt (10.2% skillnad mot median)
Jämfört med samma klass
» 7% av alla testade enheter i den här klassen var bättre, 2% liknande, 90% sämre
» Den bästa hade ett delta på 5%, genomsnittet var 18%, sämst var 53%
Jämfört med alla testade enheter
» 5% av alla testade enheter var bättre, 1% liknande, 94% sämre
» Den bästa hade ett delta på 4%, genomsnittet var 23%, sämst var 134%
| Av/Standby | |
| Låg belastning | |
| Hög belastning |
|
Förklaring:
min: | |
| MSI GL63 8RC-069US i5-8300H, GeForce GTX 1050 Mobile, Toshiba HG6 THNSNJ256G8NY, IPS, 1920x1080, 15.6" | Dell G5 15 5587 i5-8300H, GeForce GTX 1060 Max-Q, SK hynix SC311 M.2, IPS, 1920x1080, 15.6" | Gigabyte Sabre 15G i7-7700HQ, GeForce GTX 1050 Mobile, Liteonit CV3-8D128, IPS, 1920x1080, 15.6" | Asus GL503VD-DB74 i7-7700HQ, GeForce GTX 1050 Mobile, ADATA SX7000NP 256 GB, IPS, 1920x1080, 15.6" | MSI GF62VR 7RF-877 i7-7700HQ, GeForce GTX 1060 Mobile, Intel SSD 600p SSDPEKKW256G7, TN LED, 1920x1080, 15.6" | Aorus X5 v8 i7-8850H, GeForce GTX 1070 Mobile, Toshiba NVMe THNSN5512GPU7, IPS, 1920x1080, 15.6" | |
|---|---|---|---|---|---|---|
| Power Consumption | 5% | 0% | -5% | -58% | -148% | |
| Idle Minimum * (Watt) | 7.1 | 4.9 31% | 8 -13% | 8.2 -15% | 16.2 -128% | 25 -252% |
| Idle Average * (Watt) | 9.8 | 8.5 13% | 10.9 -11% | 11.1 -13% | 18.2 -86% | 31 -216% |
| Idle Maximum * (Watt) | 10.4 | 9.1 13% | 11 -6% | 11.8 -13% | 18.9 -82% | 33 -217% |
| Load Average * (Watt) | 88.8 | 90.7 -2% | 76.7 14% | 81 9% | 82.7 7% | 102 -15% |
| Witcher 3 ultra * (Watt) | 93.3 | 110 -18% | 94.9 -2% | 95.1 -2% | 125.7 -35% | 194 -108% |
| Load Maximum * (Watt) | 132.5 | 144 -9% | 106.4 20% | 123.3 7% | 162.3 -22% | 239 -80% |
* ... mindre är bättre
| MSI GL63 8RC-069US i5-8300H, GeForce GTX 1050 Mobile, 41 Wh | Dell G5 15 5587 i5-8300H, GeForce GTX 1060 Max-Q, 56 Wh | Gigabyte Sabre 15G i7-7700HQ, GeForce GTX 1050 Mobile, 47 Wh | Asus GL503VD-DB74 i7-7700HQ, GeForce GTX 1050 Mobile, 64 Wh | MSI GF62VR 7RF-877 i7-7700HQ, GeForce GTX 1060 Mobile, 41 Wh | MSI GL62M 7RD-077 i7-7700HQ, GeForce GTX 1050 Mobile, 41 Wh | |
|---|---|---|---|---|---|---|
| Batteridrifttid | 109% | 33% | 51% | -39% | -8% | |
| Reader / Idle (h) | 7.3 | 11.8 62% | 8.2 12% | 10.8 48% | 2.8 -62% | 6.5 -11% |
| WiFi v1.3 (h) | 4.3 | 6.5 51% | 4.4 2% | 5.8 35% | 1.9 -56% | 3.8 -12% |
| Load (h) | 0.7 | 2.2 214% | 1.3 86% | 1.2 71% | 0.7 0% | 0.7 0% |
För
Emot
Läs den fullständiga versionen av den här recensionen på engelska här.
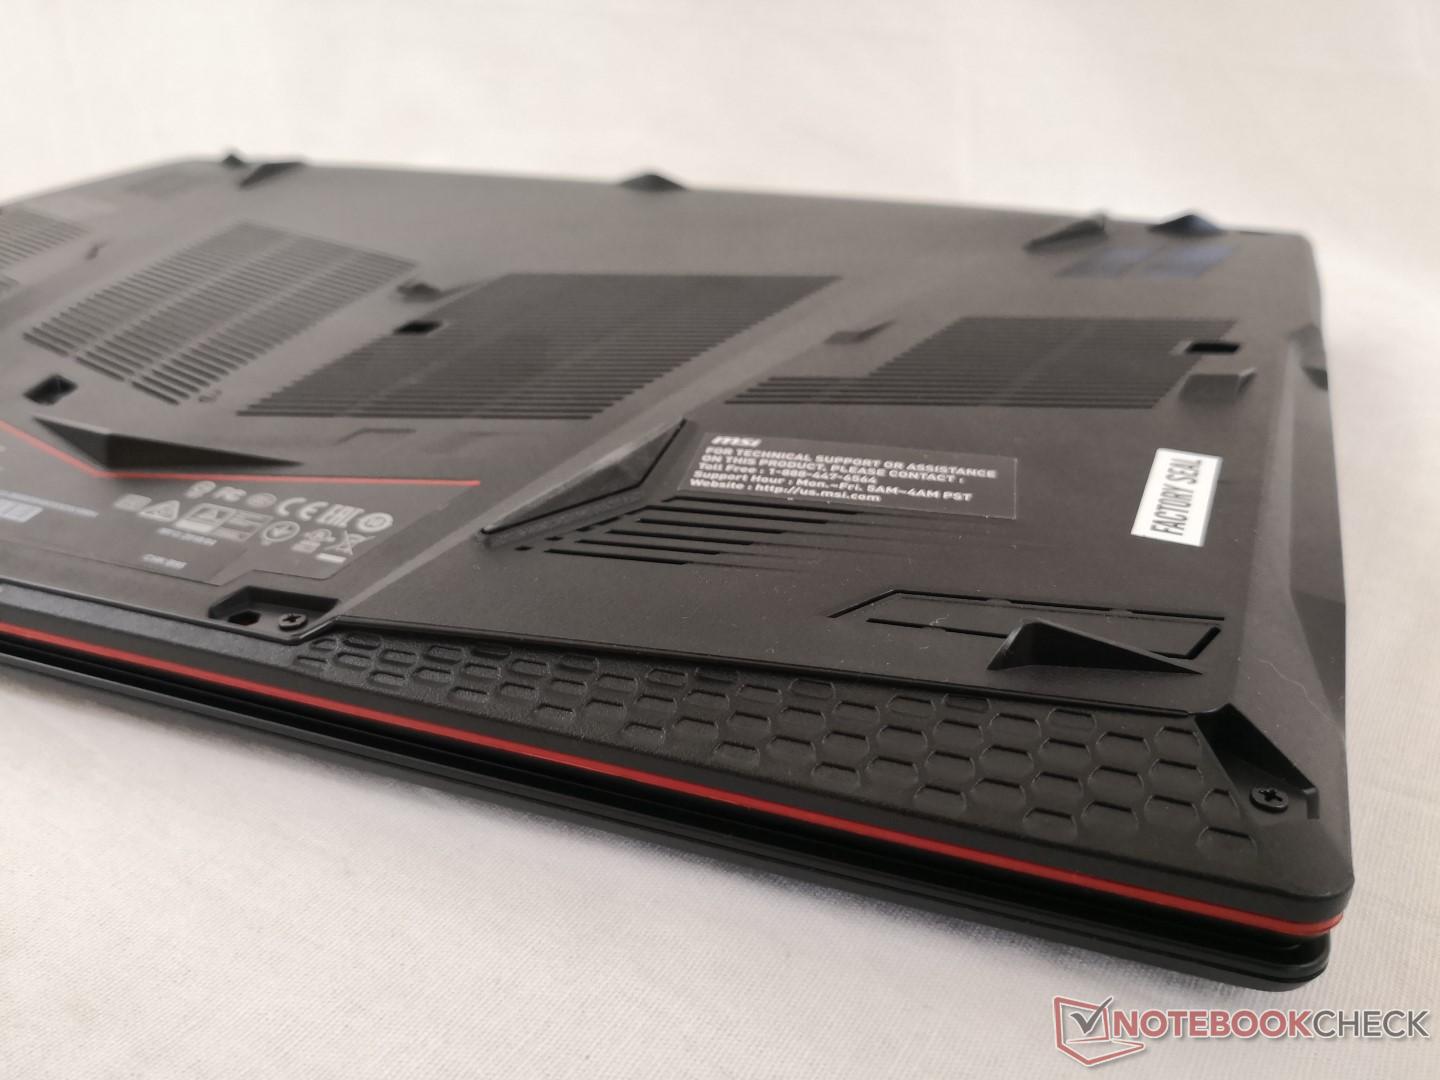
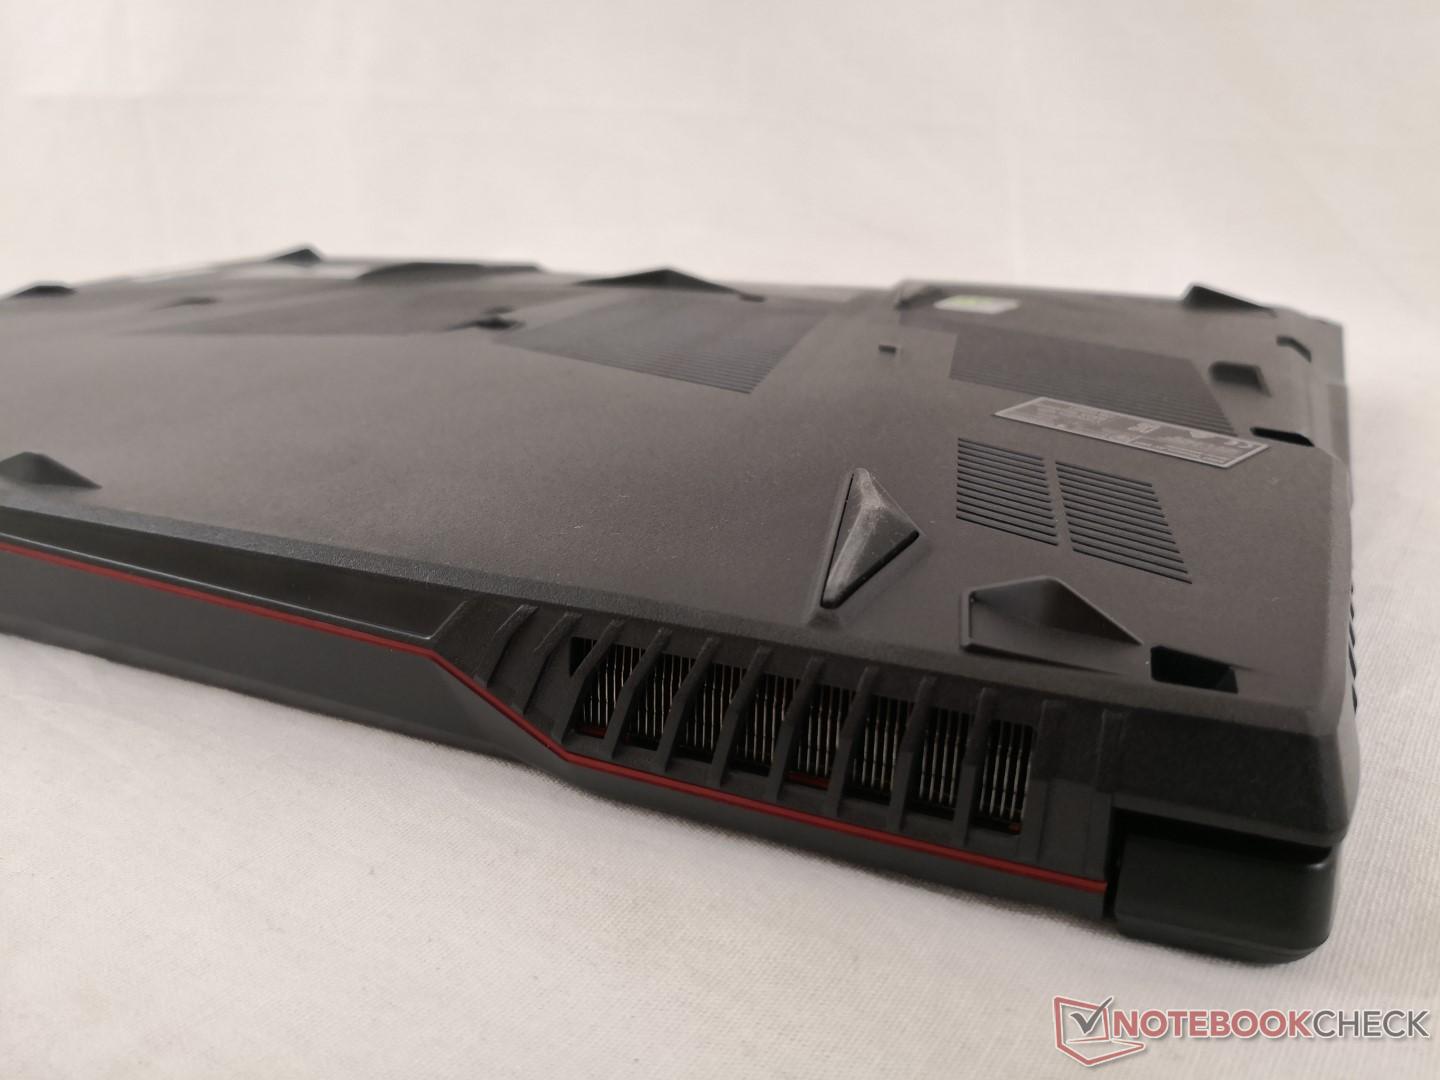
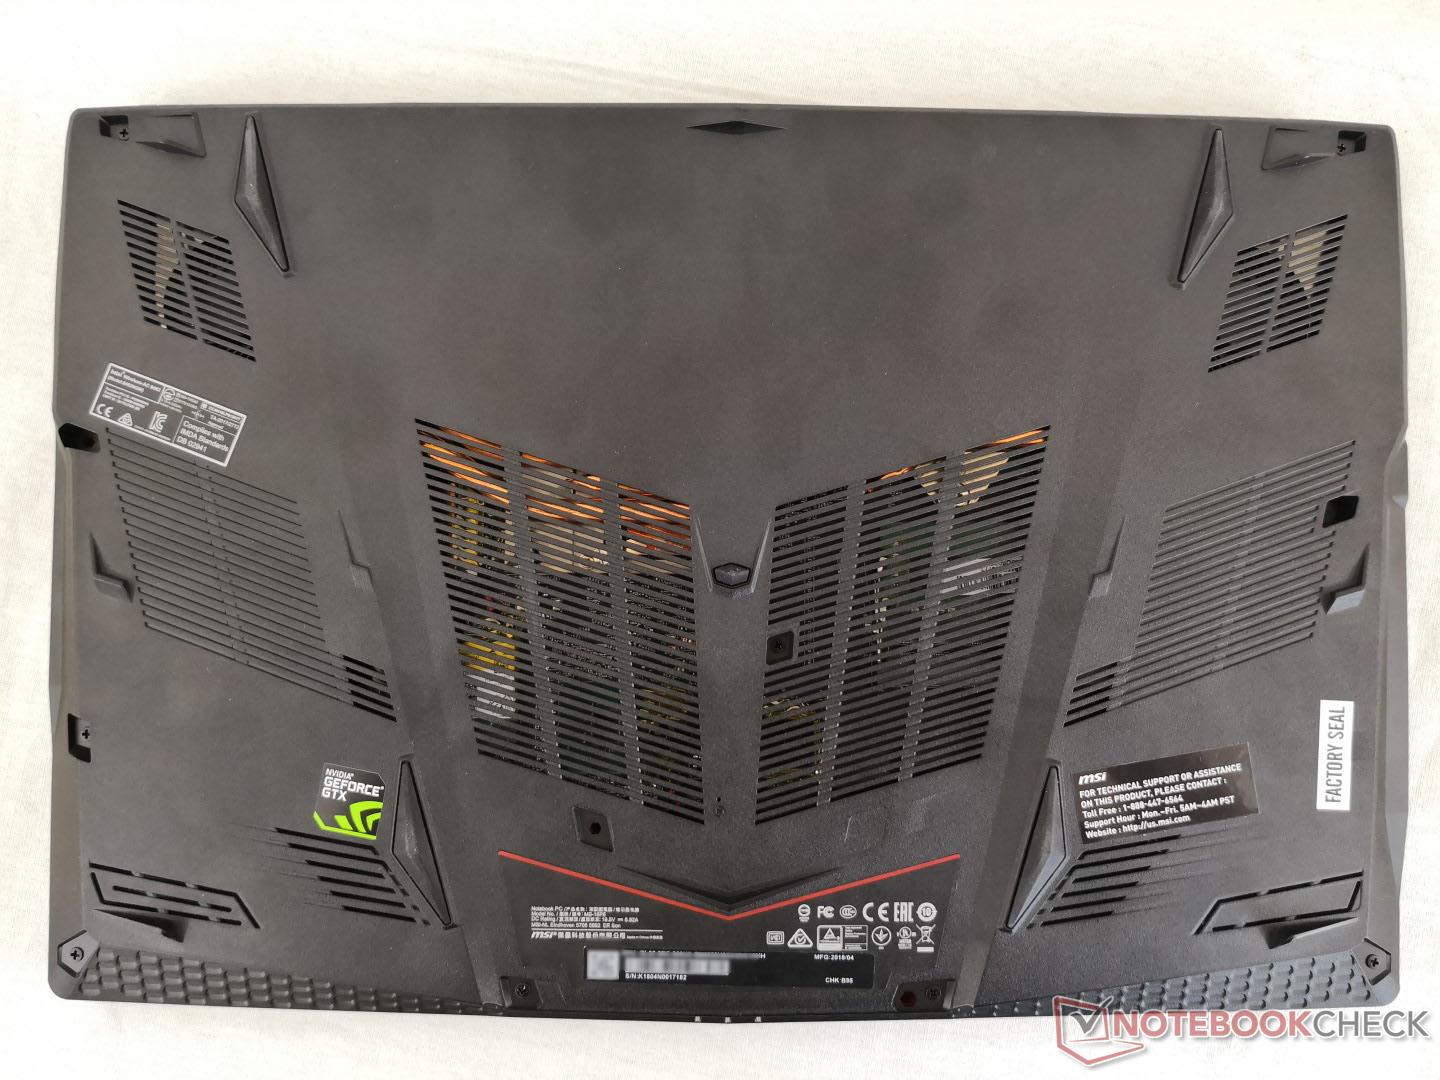
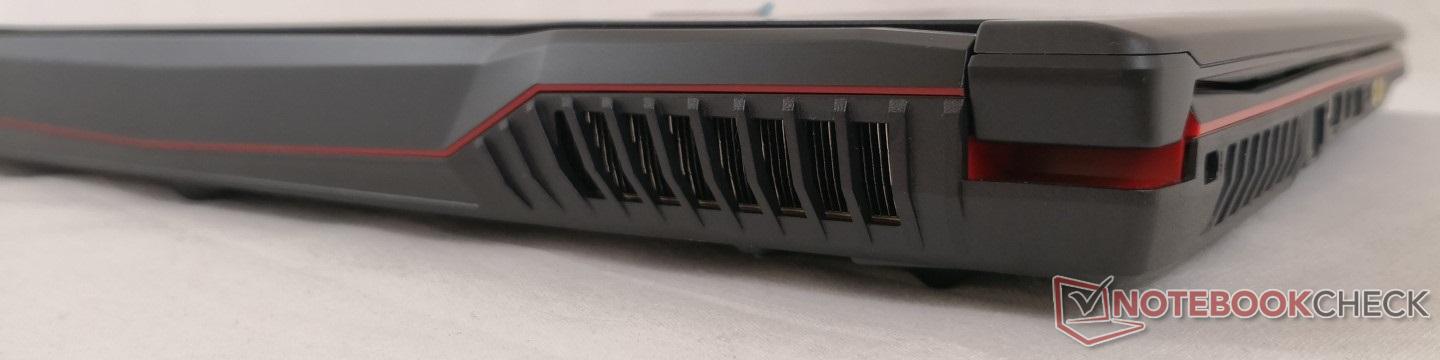
MSI GL63:s chassi är definitivt kapabel att inhysa mer krävande GPU:er än GTX 1050 med tanke på dess många ventilationsgaller och överdimensionerade kyllösning. Resultatet är positivt då köparen får ett system som på grund av detta håller sig svalt och tyst. Vi kan inte nog påpeka hur viktiga dessa aspekter är hos en spellaptop då många är ökända för att vara högljudda, varma och avge högfrekventa ljud vid tung belastning. Ägare av Razer Blade 14, MSI GS73VR, Aorus X5 eller Asus GL503VD känner till hur distraherande fläktarna kan bli när man spelar sina favoritspel.
Andra överraskningar inkluderar högtalare som är bättre än genomsnittet och utmärkt CPU-prestanda som kan upprätthålla Turbo Boost tack vare den goda temperaturmarginalen. Kraftigare och dyrare spellaptops har en del att lära från GL63.
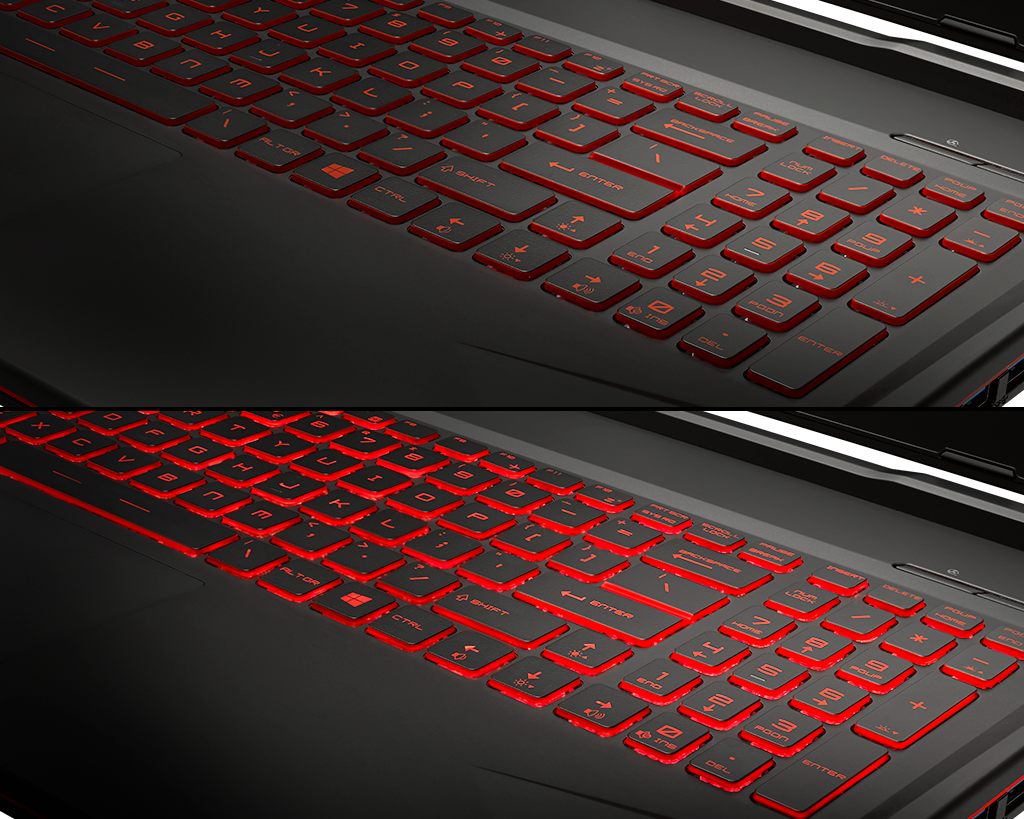
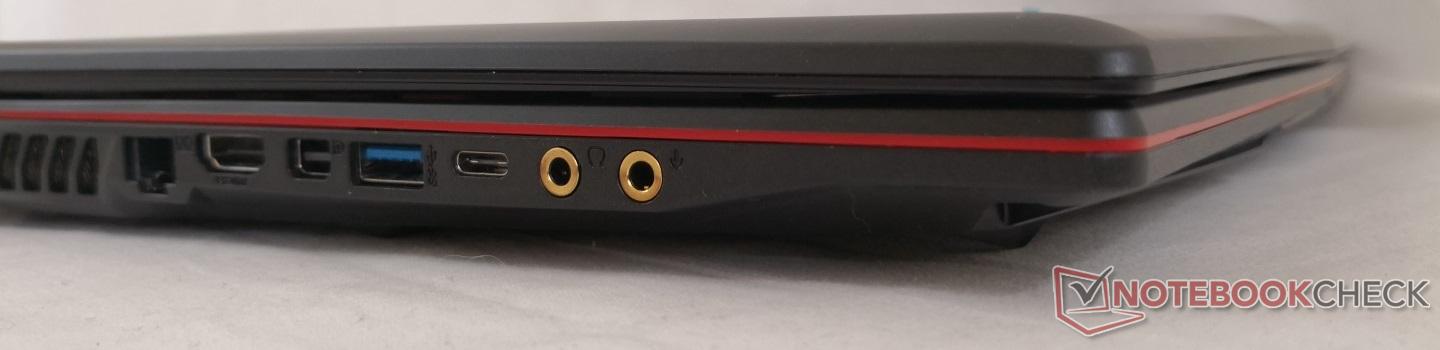
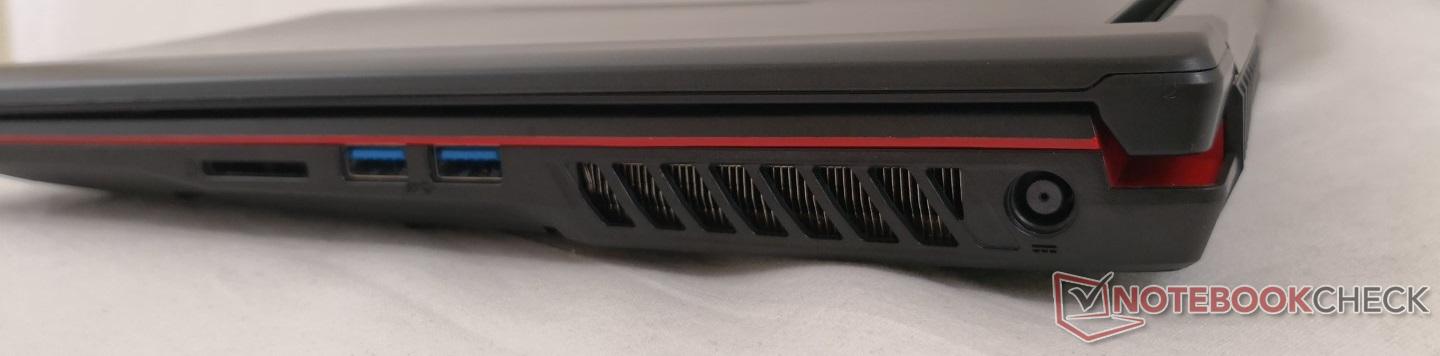
Det finns en del nackdelar och nedskärningar som reflekterar det låga priset. I synnerhet rekommenderar vi att dubbelkolla WLAN och musknapparna samt att uppdatera Windows omedelbart efter köp då vi hade problem med vår testenhet. SD-kortläsaren är otroligt långsam, både Thunderbolt 3 och NVMe saknas och WLAN-modulen är endast 1x1. Andra lyxartiklar som tangentspecifik RGB-belysning och 4K UHD ingår inte. Detta är ett system som fokuserar på dom viktigaste egenskaperna för spel och vi tycker att den lyckas med det så länge som ovanstående nackdelar inte är några större hinder.
Svala kärntemperaturer, tysta fläktar och uthållig Turbo Boost. GL63 är ett utmärkt instegssystem för spel som bockar av alla viktiga punkter för genomsnittliga spelare. En del problem med vår testenhets kvalitetskontroll innebär att man bör vara medveten om vissa defekter.
MSI GL63 8RC-069US
- 07/13/2018 v6 (old)
Allen Ngo
Price comparison
