Test: Lenovo ThinkPad P1 2019 - Tunn arbetsstation med starkare GPU och svagare CPU

| SD Card Reader | |
| average JPG Copy Test (av. of 3 runs) | |
| Lenovo ThinkPad P1 2019-20QT000RGE (Toshiba Exceria Pro SDXC 64 GB UHS-II) | |
| HP ZBook Studio G5-4QH10EA (Toshiba Exceria Pro SDXC 64 GB UHS-II) | |
| Dell XPS 15 7590 9980HK GTX 1650 (Toshiba Exceria Pro SDXC 64 GB UHS-II) | |
| Dell Precision 5530 Xeon E-2176M (Toshiba Exceria Pro SDXC 64 GB UHS-II) | |
| Genomsnitt av klass Workstation (49.6 - 681, n=14, senaste 2 åren) | |
| maximum AS SSD Seq Read Test (1GB) | |
| Genomsnitt av klass Workstation (87.6 - 1455, n=14, senaste 2 åren) | |
| HP ZBook Studio G5-4QH10EA (Toshiba Exceria Pro SDXC 64 GB UHS-II) | |
| Lenovo ThinkPad P1 2019-20QT000RGE (Toshiba Exceria Pro SDXC 64 GB UHS-II) | |
| Dell XPS 15 7590 9980HK GTX 1650 (Toshiba Exceria Pro SDXC 64 GB UHS-II) | |
| Dell Precision 5530 Xeon E-2176M (Toshiba Exceria Pro SDXC 64 GB UHS-II) | |
| |||||||||||||||||||||||||
Distribution av ljusstyrkan: 84 %
Mitt på batteriet: 521 cd/m²
Kontrast: 1322:1 (Svärta: 0.41 cd/m²)
ΔE ColorChecker Calman: 3.5 | ∀{0.5-29.43 Ø4.72}
calibrated: 1.3
ΔE Greyscale Calman: 4.8 | ∀{0.09-98 Ø4.97}
91.1% sRGB (Argyll 1.6.3 3D)
58.8% AdobeRGB 1998 (Argyll 1.6.3 3D)
63.4% AdobeRGB 1998 (Argyll 3D)
91.5% sRGB (Argyll 3D)
62.4% Display P3 (Argyll 3D)
Gamma: 2.33
CCT: 7690 K
| Lenovo ThinkPad P1 2019-20QT000RGE N156HCE-GN1, , 1920x1080, 15.6" | Lenovo ThinkPad X1 Extreme-20MF000RGE NV156FHM-N61, , 1920x1080, 15.6" | Dell XPS 15 7590 i5 iGPU FHD LQ156M1, , 1920x1080, 15.6" | Dell Precision 5530 Xeon E-2176M Sharp SHP148D / LQ156D1, , 3840x2160, 15.6" | HP ZBook Studio G5-4QH10EA AUO30EB, , 3840x2160, 15.6" | Dell XPS 15 7590 9980HK GTX 1650 Samsung 156WR04, SDCA029, , 3840x2160, 15.6" | |
|---|---|---|---|---|---|---|
| Display | 3% | 7% | 17% | 8% | 32% | |
| Display P3 Coverage (%) | 62.4 | 68.6 10% | 66.5 7% | 76.5 23% | 68.2 9% | 88.1 41% |
| sRGB Coverage (%) | 91.5 | 88.7 -3% | 98 7% | 98.4 8% | 96.2 5% | 99.6 9% |
| AdobeRGB 1998 Coverage (%) | 63.4 | 64.8 2% | 68.4 8% | 76.4 21% | 68.8 9% | 91.8 45% |
| Response Times | -105% | -91% | -90% | -106% | 88% | |
| Response Time Grey 50% / Grey 80% * (ms) | 34.4 ? | 52.8 ? -53% | 52.8 ? -53% | 48 ? -40% | 60.8 ? -77% | 2.3 ? 93% |
| Response Time Black / White * (ms) | 14 ? | 36 ? -157% | 32 ? -129% | 33.6 ? -140% | 32.8 ? -134% | 2.4 ? 83% |
| PWM Frequency (Hz) | 26040 ? | 21370 ? | 1020 ? | 1000 | 59.5 ? | |
| Screen | -26% | 14% | -12% | -5% | -8% | |
| Brightness middle (cd/m²) | 542 | 331 -39% | 588 8% | 451.7 -17% | 417 -23% | 421.2 -22% |
| Brightness (cd/m²) | 528 | 305 -42% | 555 5% | 440 -17% | 412 -22% | 417 -21% |
| Brightness Distribution (%) | 84 | 84 0% | 89 6% | 90 7% | 85 1% | 94 12% |
| Black Level * (cd/m²) | 0.41 | 0.24 41% | 0.4 2% | 0.4 2% | 0.29 29% | |
| Contrast (:1) | 1322 | 1379 4% | 1470 11% | 1129 -15% | 1438 9% | |
| Colorchecker dE 2000 * | 3.5 | 5.6 -60% | 2.5 29% | 3.11 11% | 4.4 -26% | 6.06 -73% |
| Colorchecker dE 2000 max. * | 7.8 | 9.9 -27% | 6.3 19% | 8.62 -11% | 6.7 14% | 11.89 -52% |
| Colorchecker dE 2000 calibrated * | 1.3 | 3 -131% | 0.6 54% | 3.07 -136% | 1.9 -46% | |
| Greyscale dE 2000 * | 4.8 | 6.3 -31% | 4.5 6% | 3.7 23% | 5 -4% | 2.8 42% |
| Gamma | 2.33 94% | 2.33 94% | 2.2 100% | 2.11 104% | 2.28 96% | 2.15 102% |
| CCT | 7690 85% | 7152 91% | 6836 95% | 6492 100% | 7575 86% | 6235 104% |
| Color Space (Percent of AdobeRGB 1998) (%) | 58.8 | 58 -1% | 63.2 7% | 69 17% | 62.3 6% | 81 38% |
| Color Space (Percent of sRGB) (%) | 91.1 | 88.6 -3% | 98 8% | 98 8% | 96 5% | 99.6 9% |
| Totalt genomsnitt (program/inställningar) | -43% /
-31% | -23% /
-0% | -28% /
-16% | -34% /
-15% | 37% /
16% |
* ... mindre är bättre
Visa svarstider
| ↔ Svarstid svart till vitt | ||
|---|---|---|
| 14 ms ... stiga ↗ och falla ↘ kombinerat | ↗ 4.4 ms stiga | 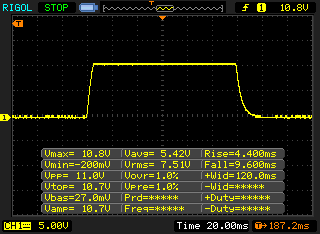 |
| ↘ 9.6 ms hösten | ||
| Skärmen visar bra svarsfrekvens i våra tester, men kan vara för långsam för konkurrenskraftiga spelare. I jämförelse sträcker sig alla testade enheter från 0.1 (minst) till 240 (maximalt) ms. » 34 % av alla enheter är bättre. Det betyder att den uppmätta svarstiden är bättre än genomsnittet av alla testade enheter (19.8 ms). | ||
| ↔ Svarstid 50 % grått till 80 % grått | ||
| 34.4 ms ... stiga ↗ och falla ↘ kombinerat | ↗ 17.2 ms stiga | 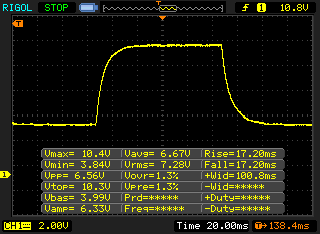 |
| ↘ 17.2 ms hösten | ||
| Skärmen visar långsamma svarsfrekvenser i våra tester och kommer att vara otillfredsställande för spelare. I jämförelse sträcker sig alla testade enheter från 0.165 (minst) till 636 (maximalt) ms. » 48 % av alla enheter är bättre. Detta innebär att den uppmätta svarstiden är sämre än genomsnittet av alla testade enheter (31 ms). | ||
Skärmflimmer / PWM (Puls-Width Modulation)
| Skärmflimmer / PWM upptäckt | 26040 Hz | ≤ 70 % ljusstyrka inställning | 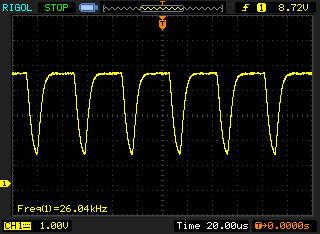 |
Displayens bakgrundsbelysning flimrar vid 26040 Hz (i värsta fall, t.ex. med PWM) Flimrande upptäckt vid en ljusstyrkeinställning på 70 % och lägre. Det ska inte finnas något flimmer eller PWM över denna ljusstyrkeinställning. Frekvensen för 26040 Hz är ganska hög, så de flesta användare som är känsliga för PWM bör inte märka något flimmer. Som jämförelse: 52 % av alla testade enheter använder inte PWM för att dämpa skärmen. Om PWM upptäcktes mättes ett medelvärde av 7763 (minst: 5 - maximum: 343500) Hz. | |||
| PCMark 8 Home Score Accelerated v2 | 3986 poäng | |
| PCMark 8 Creative Score Accelerated v2 | 3897 poäng | |
| PCMark 8 Work Score Accelerated v2 | 5332 poäng | |
| PCMark 10 Score | 5046 poäng | |
Hjälp | ||
| Lenovo ThinkPad P1 2019-20QT000RGE WDC PC SN720 SDAQNTW-512G | Lenovo ThinkPad P1-20MD002LUS Samsung SSD PM981 MZVLB2T0HMLB | Dell Precision 5530 Xeon E-2176M SK hynix PC400 512 GB | HP ZBook Studio G5-4QH10EA Samsung SSD PM981 MZVLB512HAJQ | Dell XPS 15 7590 9980HK GTX 1650 Toshiba XG6 KXG60ZNV1T02 | Genomsnitt WDC PC SN720 SDAQNTW-512G | |
|---|---|---|---|---|---|---|
| CrystalDiskMark 5.2 / 6 | -21% | -23% | -26% | -7% | 8% | |
| Write 4K (MB/s) | 162.2 | 108 -33% | 97.8 -40% | 102.7 -37% | 104.3 -36% | 183.3 ? 13% |
| Read 4K (MB/s) | 43.71 | 37.24 -15% | 41.21 -6% | 38.32 -12% | 45.23 3% | 48.2 ? 10% |
| Write Seq (MB/s) | 2441 | 1476 -40% | 1312 -46% | 1417 -42% | 1729 -29% | 2135 ? -13% |
| Read Seq (MB/s) | 1753 | 1367 -22% | 1667 -5% | 1289 -26% | 1861 6% | 2102 ? 20% |
| Write 4K Q32T1 (MB/s) | 397.6 | 302.4 -24% | 449.5 13% | 278.9 -30% | 509 28% | 452 ? 14% |
| Read 4K Q32T1 (MB/s) | 520 | 375 -28% | 327.4 -37% | 348.8 -33% | 388.5 -25% | 619 ? 19% |
| Write Seq Q32T1 (MB/s) | 2519 | 2433 -3% | 1385 -45% | 1895 -25% | 2813 12% | 2537 ? 1% |
| Read Seq Q32T1 (MB/s) | 3448 | 3493 1% | 2948 -15% | 3352 -3% | 2906 -16% | 3466 ? 1% |

| 3DMark 06 Standard Score | 33809 poäng | |
| 3DMark Vantage P Result | 31509 poäng | |
| 3DMark 11 Performance | 10211 poäng | |
| 3DMark Ice Storm Standard Score | 76341 poäng | |
| 3DMark Cloud Gate Standard Score | 23601 poäng | |
| 3DMark Fire Strike Score | 6812 poäng | |
| 3DMark Time Spy Score | 3006 poäng | |
Hjälp | ||
| The Witcher 3 - 1920x1080 High Graphics & Postprocessing (Nvidia HairWorks Off) | |
| Genomsnitt av klass Workstation (91 - 156.4, n=2, senaste 2 åren) | |
| Dell XPS 15 7590 9980HK GTX 1650 | |
| Genomsnitt NVIDIA Quadro T1000 (Laptop) (52.7 - 62.9, n=3) | |
| Lenovo ThinkPad P1 2019-20QT000RGE | |
| Lenovo ThinkPad X1 Extreme-20MF000RGE | |
| Lenovo ThinkPad P1-20MD002LUS | |
| HP ZBook Studio G5-4QH10EA | |
| låg | med. | hög | ultra | 4K | |
|---|---|---|---|---|---|
| BioShock Infinite (2013) | 280.4 | 210 | 184.7 | 72.9 | |
| The Witcher 3 (2015) | 156.2 | 94.1 | 52.7 | 30.9 | |
| Dota 2 Reborn (2015) | 134 | 115 | 113 | 106 | 47.9 |
| Rainbow Six Siege (2015) | 190.3 | 159.6 | 111.6 | 97.9 | |
| Rise of the Tomb Raider (2016) | 136.2 | 86 | 53.4 | 43.8 | |
| For Honor (2017) | 163.4 | 66.7 | 63.9 | 48.8 | |
| Ghost Recon Wildlands (2017) | 94 | 47.2 | 43.9 | 24.2 | |
| Rocket League (2017) | 246.4 | 150.7 | 117 | ||
| Final Fantasy XV Benchmark (2018) | 77.4 | 41.9 | 31.1 | ||
| Kingdom Come: Deliverance (2018) | 93.7 | 49.3 | 40.5 | 30.7 | |
| X-Plane 11.11 (2018) | 91 | 78 | 69 | ||
| Shadow of the Tomb Raider (2018) | 88 | 46 | 40 | 35 | |
| FIFA 19 (2018) | 148 | 119.2 | 113.5 | 110.8 | |
| Assassin´s Creed Odyssey (2018) | 57 | 40 | 35 | 29 | |
| Battlefield V (2018) | 61.5 | 43.2 | 37.8 | 35 | |
| Farming Simulator 19 (2018) | 182.4 | 106.7 | 86.3 | 66.5 | |
| Apex Legends (2019) | 143.7 | 73.8 | 57.8 | 55.9 | |
| Far Cry New Dawn (2019) | 77 | 48 | 46 | 43 | |
| Dirt Rally 2.0 (2019) | 185.2 | 80.7 | 63.7 | 36.3 | |
| The Division 2 (2019) | 39 | 36 | 29 | ||
| Anno 1800 (2019) | 69.6 | 52.8 | 37.2 | 20 | |
| F1 2019 (2019) | 118 | 73 | 61 | 49 |
Ljudnivå
| Låg belastning |
| 28.8 / 28.8 / 28.8 dB(A) |
| Hög belastning |
| 36.1 / 36.7 dB(A) |
 | ||
30 dB tyst 40 dB(A) hörbar 50 dB(A) högt ljud |
||
min: | ||
(±) Den maximala temperaturen på ovansidan är 44.7 °C / 112 F, jämfört med genomsnittet av 38.2 °C / 101 F , allt från 22.2 till 69.8 °C för klassen Workstation.
(-) Botten värms upp till maximalt 49.4 °C / 121 F, jämfört med genomsnittet av 41.1 °C / 106 F
(+) Vid tomgångsbruk är medeltemperaturen för ovansidan 23.6 °C / 74 F, jämfört med enhetsgenomsnittet på 32 °C / ### class_avg_f### F.
(±) När du spelar The Witcher 3 är medeltemperaturen för ovansidan 36.7 °C / 98 F, jämfört med enhetsgenomsnittet på 32 °C / ## #class_avg_f### F.
(+) Handledsstöden och pekplattan är kallare än hudtemperaturen med maximalt 30.1 °C / 86.2 F och är därför svala att ta på.
(-) Medeltemperaturen för handledsstödsområdet på liknande enheter var 27.8 °C / 82 F (-2.3 °C / -4.2 F).
Lenovo ThinkPad P1 2019-20QT000RGE ljudanalys
(±) | högtalarljudstyrkan är genomsnittlig men bra (74 dB)
Bas 100 - 315 Hz
(±) | reducerad bas - i genomsnitt 10.6% lägre än medianen
(±) | linjäriteten för basen är genomsnittlig (13% delta till föregående frekvens)
Mellan 400 - 2000 Hz
(+) | balanserad mellan - endast 4.4% från medianen
(+) | mids är linjära (5.9% delta till föregående frekvens)
Högsta 2 - 16 kHz
(+) | balanserade toppar - endast 2.4% från medianen
(±) | linjäriteten för toppar är genomsnittlig (8.2% delta till föregående frekvens)
Totalt 100 - 16 000 Hz
(±) | linjäriteten för det totala ljudet är genomsnittlig (16.7% skillnad mot median)
Jämfört med samma klass
» 46% av alla testade enheter i den här klassen var bättre, 9% liknande, 45% sämre
» Den bästa hade ett delta på 7%, genomsnittet var 17%, sämst var 35%
Jämfört med alla testade enheter
» 29% av alla testade enheter var bättre, 7% liknande, 64% sämre
» Den bästa hade ett delta på 4%, genomsnittet var 24%, sämst var 134%
Lenovo ThinkPad P1-20MD002LUS ljudanalys
(±) | högtalarljudstyrkan är genomsnittlig men bra (73.7 dB)
Bas 100 - 315 Hz
(±) | reducerad bas - i genomsnitt 10.1% lägre än medianen
(±) | linjäriteten för basen är genomsnittlig (12.3% delta till föregående frekvens)
Mellan 400 - 2000 Hz
(±) | högre mellan - i genomsnitt 5.9% högre än median
(±) | linjäriteten för mids är genomsnittlig (8.9% delta till föregående frekvens)
Högsta 2 - 16 kHz
(+) | balanserade toppar - endast 2% från medianen
(+) | toppar är linjära (5.1% delta till föregående frekvens)
Totalt 100 - 16 000 Hz
(±) | linjäriteten för det totala ljudet är genomsnittlig (21.8% skillnad mot median)
Jämfört med samma klass
» 77% av alla testade enheter i den här klassen var bättre, 6% liknande, 17% sämre
» Den bästa hade ett delta på 7%, genomsnittet var 17%, sämst var 35%
Jämfört med alla testade enheter
» 62% av alla testade enheter var bättre, 7% liknande, 31% sämre
» Den bästa hade ett delta på 4%, genomsnittet var 24%, sämst var 134%
| Av/Standby | |
| Låg belastning | |
| Hög belastning |
|
Förklaring:
min: | |
| Lenovo ThinkPad P1 2019-20QT000RGE i7-9850H, Quadro T1000 (Laptop), WDC PC SN720 SDAQNTW-512G, IPS LED, 1920x1080, 15.6" | Lenovo ThinkPad X1 Extreme-20MF000RGE i5-8300H, GeForce GTX 1050 Ti Max-Q, Samsung SSD PM981 MZVLB256HAHQ, IPS LED, 1920x1080, 15.6" | Lenovo ThinkPad P1-20MD002LUS E-2176M, Quadro P2000 Max-Q, Samsung SSD PM981 MZVLB2T0HMLB, IPS, 3840x2160, 15.6" | Dell Precision 5530 Xeon E-2176M E-2176M, Quadro P2000, SK hynix PC400 512 GB, IGZO, 3840x2160, 15.6" | HP ZBook Studio G5-4QH10EA i7-8750H, Quadro P1000, Samsung SSD PM981 MZVLB512HAJQ, IPS LED, 3840x2160, 15.6" | Dell XPS 15 7590 9980HK GTX 1650 i9-9980HK, GeForce GTX 1650 Mobile, Toshiba XG6 KXG60ZNV1T02, OLED, 3840x2160, 15.6" | Genomsnitt NVIDIA Quadro T1000 (Laptop) | Genomsnitt av klass Workstation | |
|---|---|---|---|---|---|---|---|---|
| Power Consumption | 35% | 21% | 5% | 23% | 11% | 16% | 0% | |
| Idle Minimum * (Watt) | 13.7 | 4.14 70% | 7.1 48% | 9.8 28% | 6.8 50% | 6.2 55% | 8.33 ? 39% | 9.04 ? 34% |
| Idle Average * (Watt) | 17.5 | 7.3 58% | 14.4 18% | 16.8 4% | 11.3 35% | 9.6 45% | 11.8 ? 33% | 13.8 ? 21% |
| Idle Maximum * (Watt) | 20.9 | 11.5 45% | 14.6 30% | 16.9 19% | 14.3 32% | 21.2 -1% | 15.2 ? 27% | 17.7 ? 15% |
| Load Average * (Watt) | 77.2 | 78.8 -2% | 93.9 -22% | 102.3 -33% | 78 -1% | 104.3 -35% | 86.4 ? -12% | 96.2 ? -25% |
| Load Maximum * (Watt) | 123.7 | 118 5% | 88.3 29% | 114.5 7% | 126 -2% | 135.3 -9% | 131.1 ? -6% | 178.5 ? -44% |
| Witcher 3 ultra * (Watt) | 82 | 77.9 | 76.5 | 64 | 91.7 |
* ... mindre är bättre
| Lenovo ThinkPad P1 2019-20QT000RGE i7-9850H, Quadro T1000 (Laptop), 80 Wh | Lenovo ThinkPad X1 Extreme-20MF000RGE i5-8300H, GeForce GTX 1050 Ti Max-Q, 80 Wh | Dell XPS 15 7590 i5 iGPU FHD i5-9300H, UHD Graphics 630, 97 Wh | Lenovo ThinkPad P1-20MD002LUS E-2176M, Quadro P2000 Max-Q, 80 Wh | Dell Precision 5530 Xeon E-2176M E-2176M, Quadro P2000, 97 Wh | HP ZBook Studio G5-4QH10EA i7-8750H, Quadro P1000, 97 Wh | Genomsnitt av klass Workstation | |
|---|---|---|---|---|---|---|---|
| Batteridrifttid | 16% | 59% | -40% | 16% | 25% | 3% | |
| H.264 (h) | 9.3 | 9.6 3% | 17.6 89% | 9.1 -2% | 9.51 ? 2% | ||
| WiFi v1.3 (h) | 8.9 | 9.4 6% | 14.1 58% | 5.3 -40% | 8.4 -6% | 9.7 9% | 8.52 ? -4% |
| Load (h) | 1.3 | 1.8 38% | 1.7 31% | 1.8 38% | 2.2 69% | 1.429 ? 10% | |
| Reader / Idle (h) | 21 | 16.5 | 17.3 | 26.1 ? |
För
Emot
Läs den fullständiga versionen av den här recensionen på engelska här.
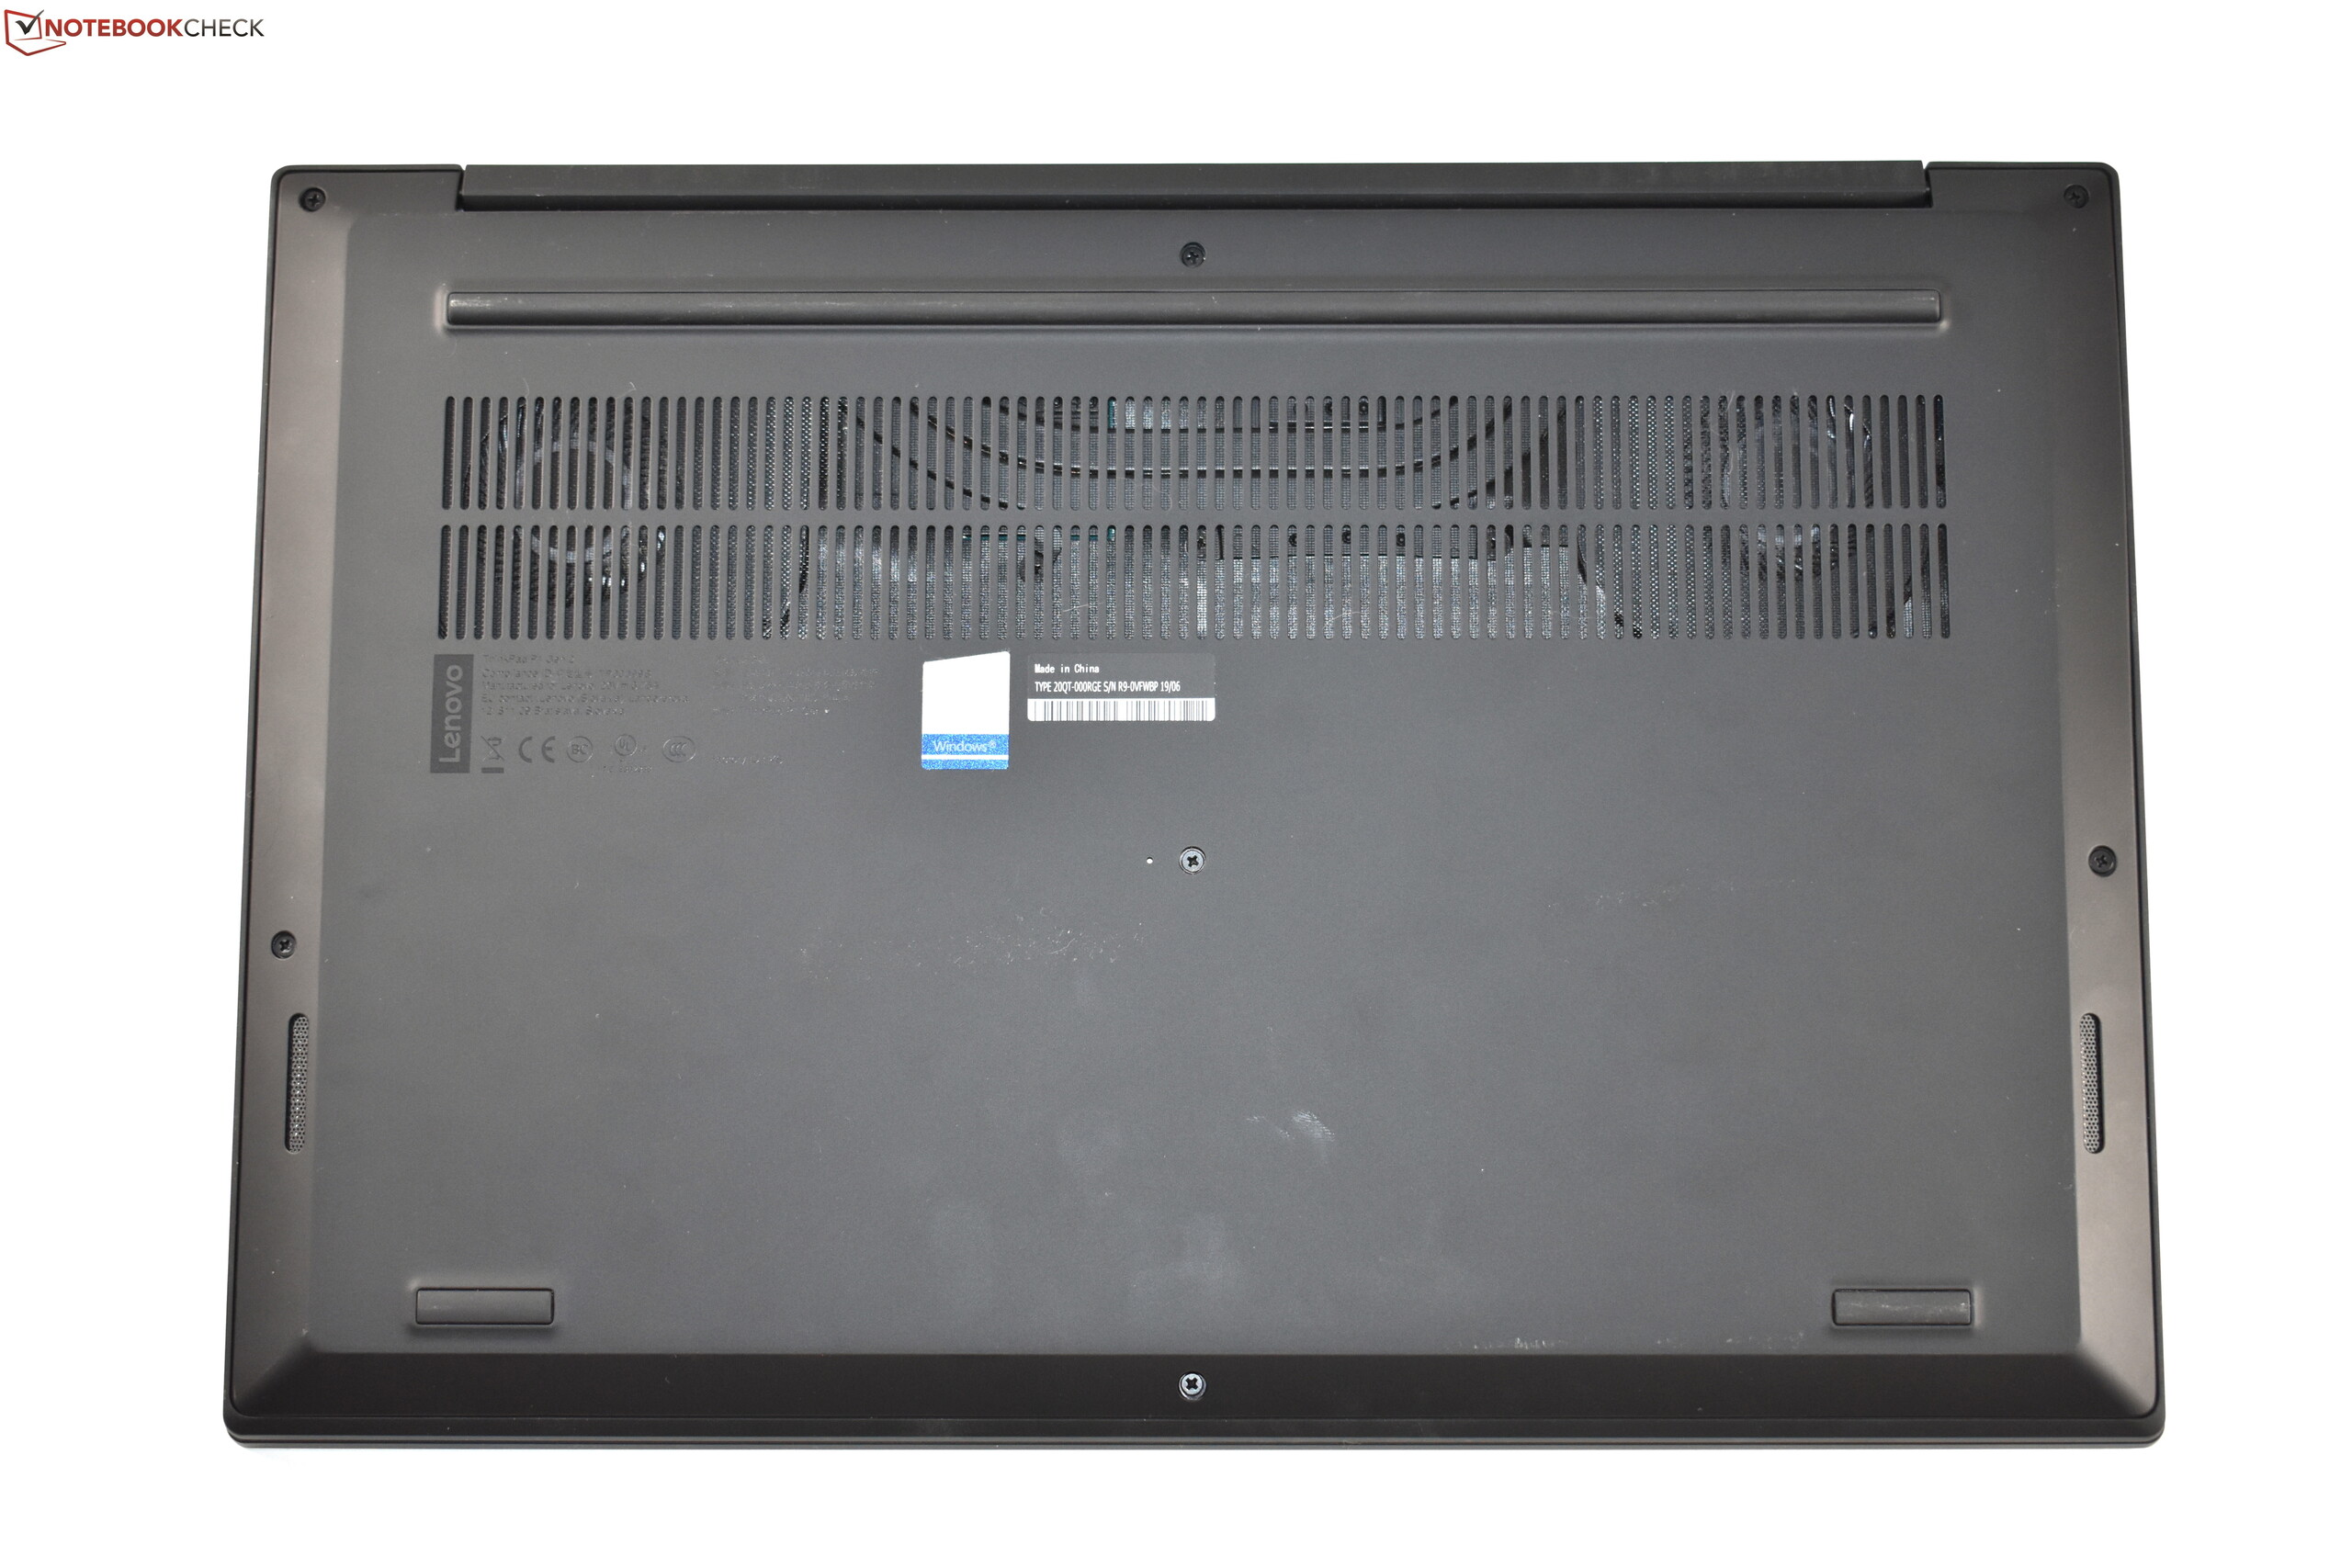
Eftersom Lenovo ThinkPad P1 2019 bara är en uppdatering av föregångaren ThinkPad P1 2018 visar sig omdömet i stort vara ungefär samma. De enda skillnaderna rör några mindre detaljer.
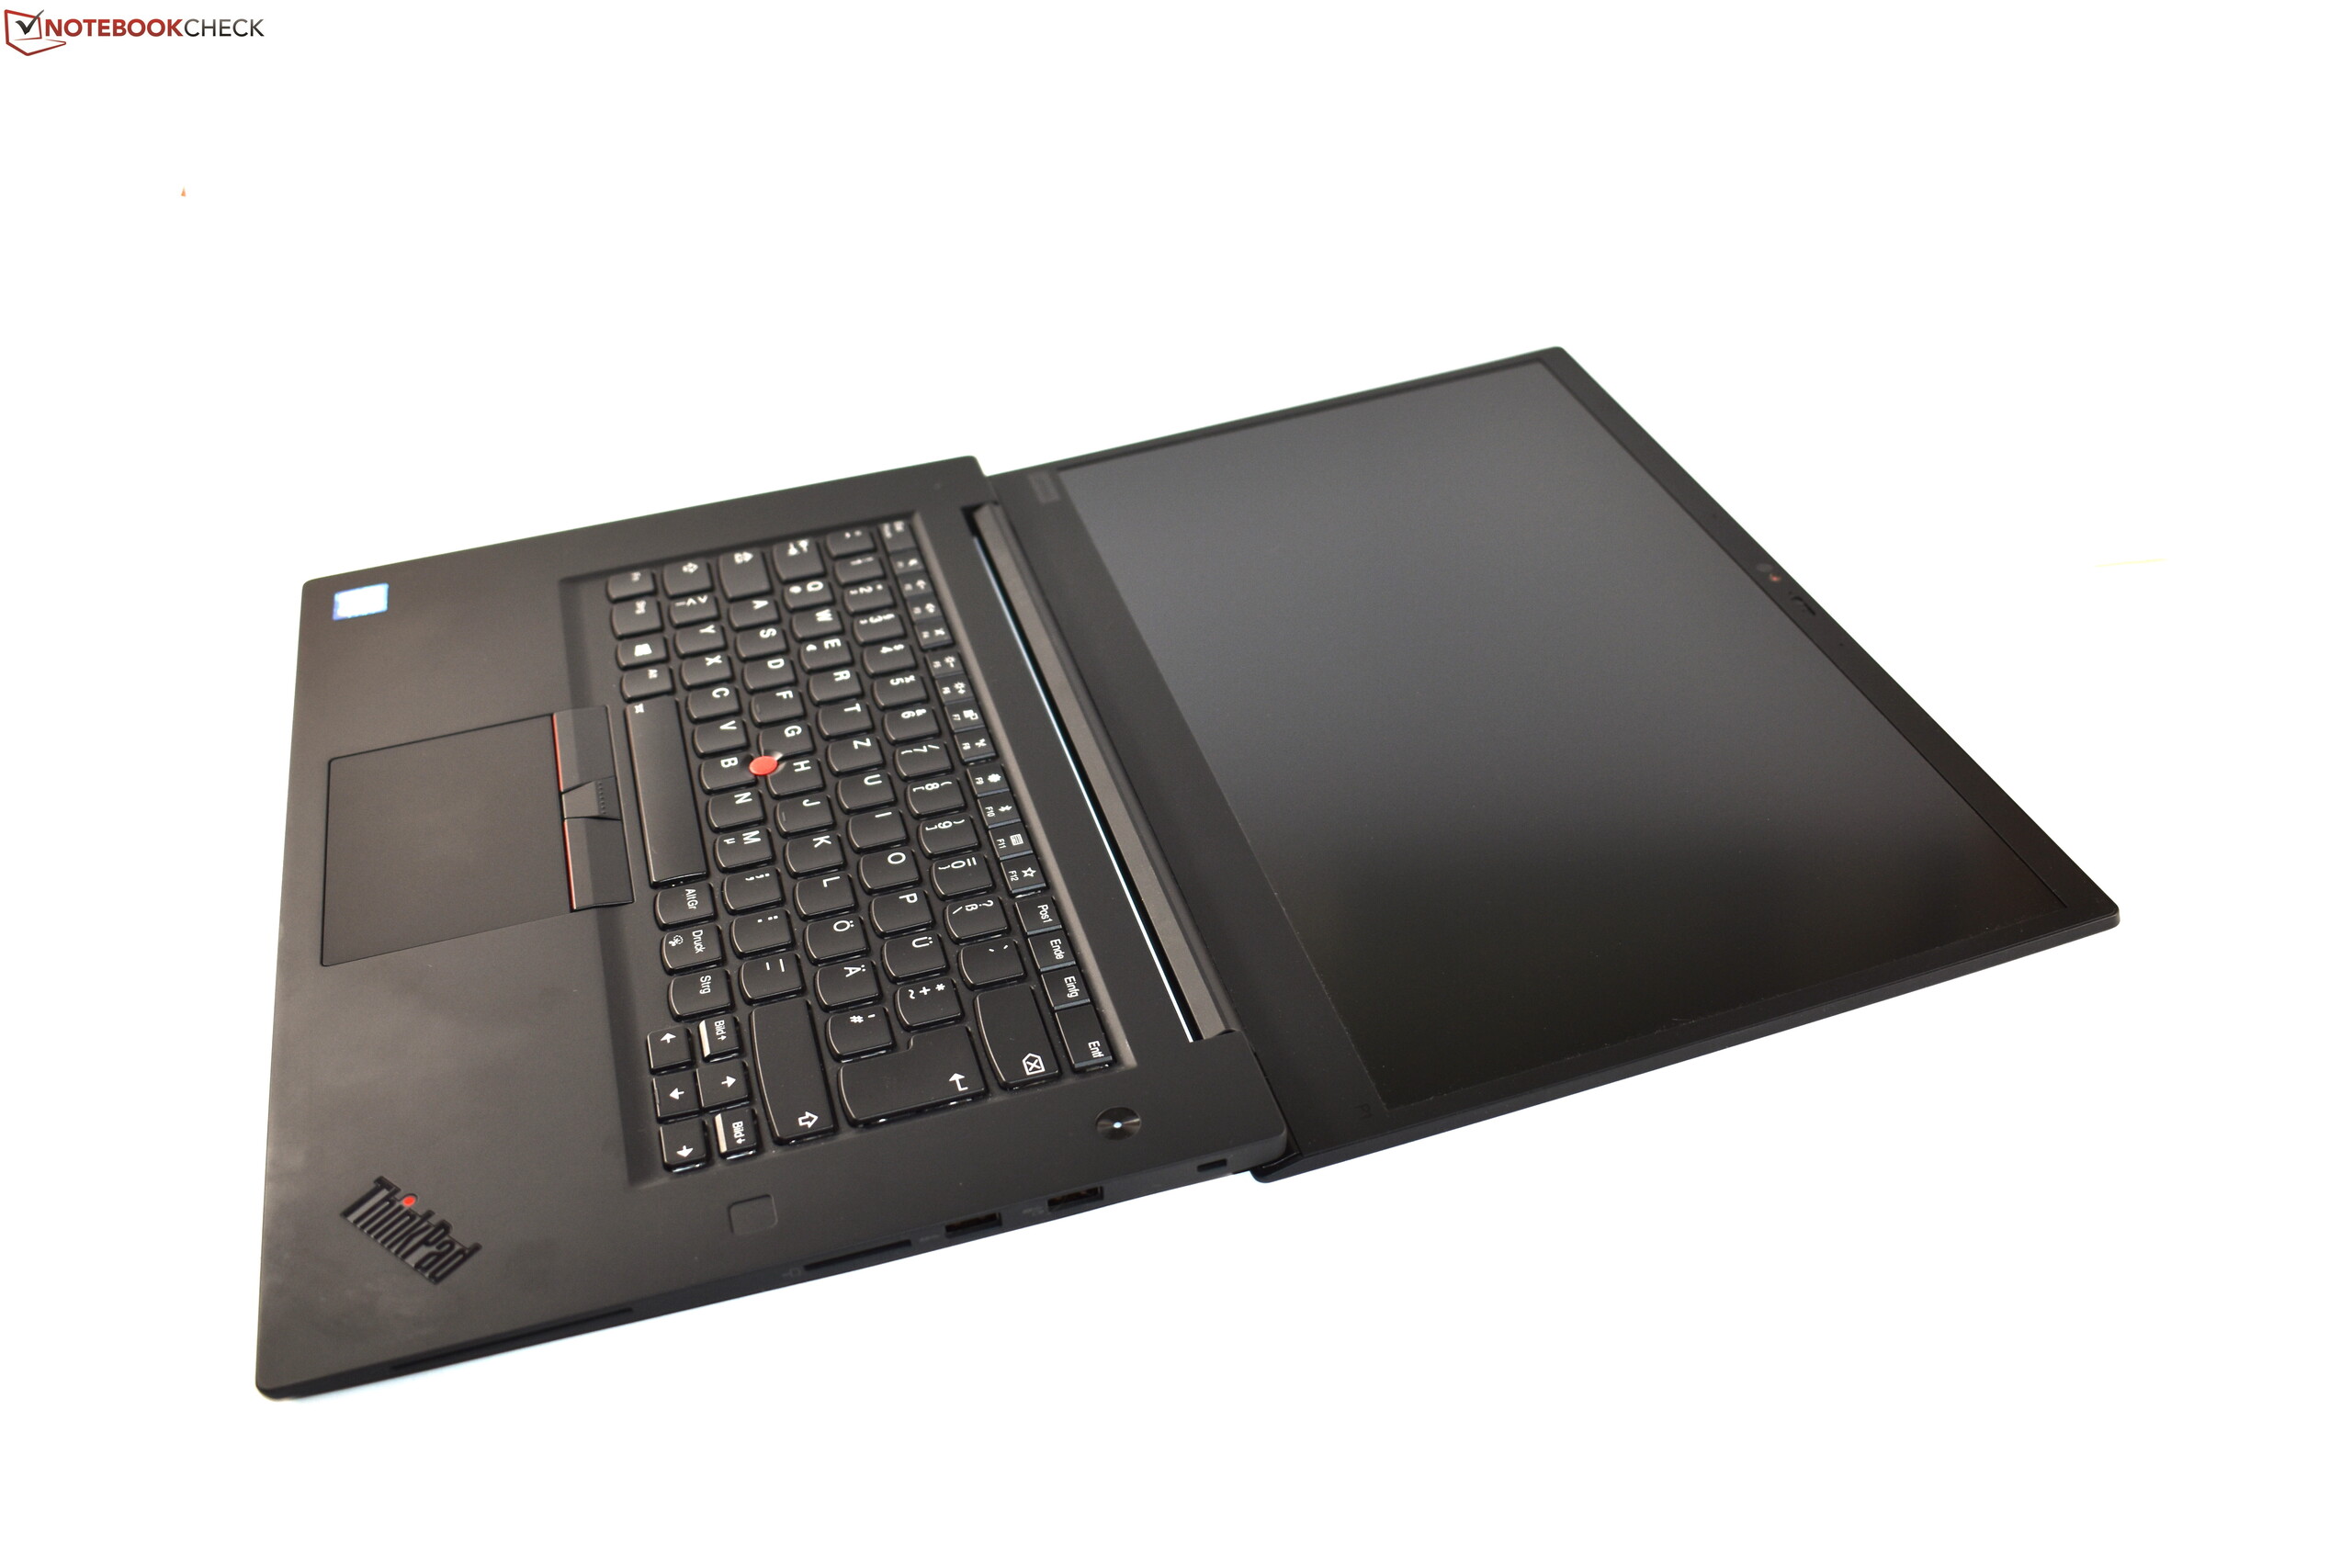
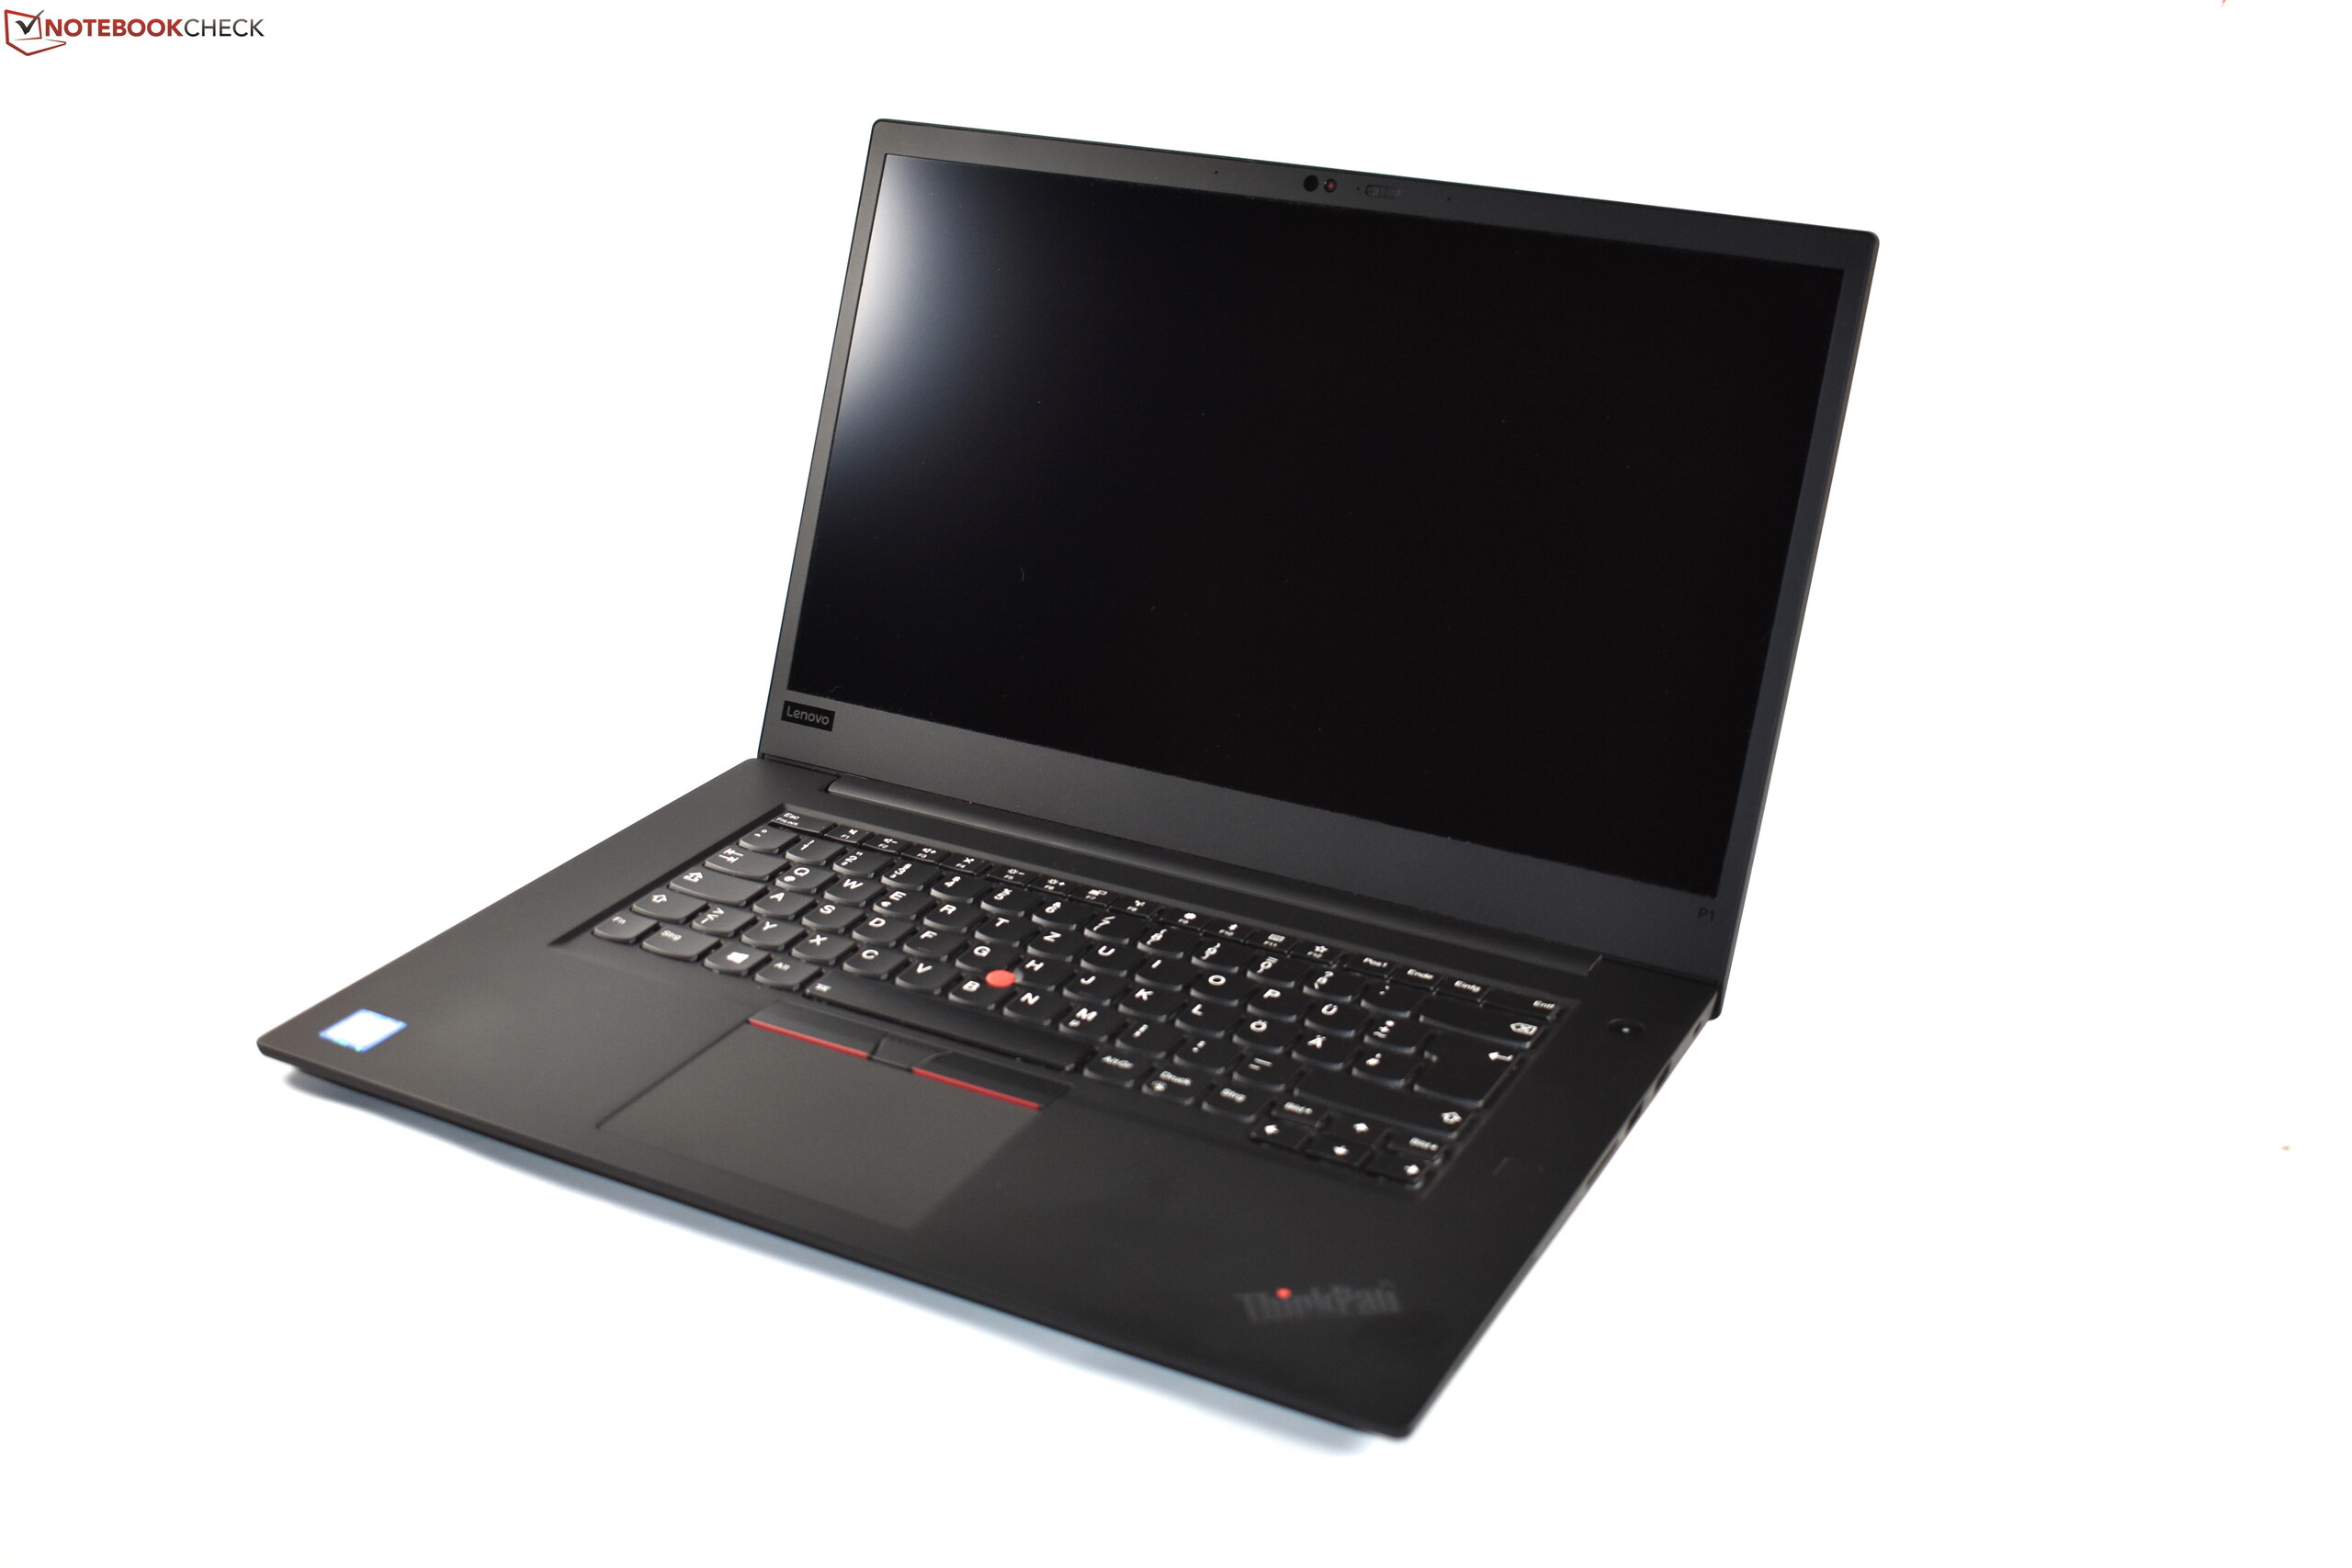
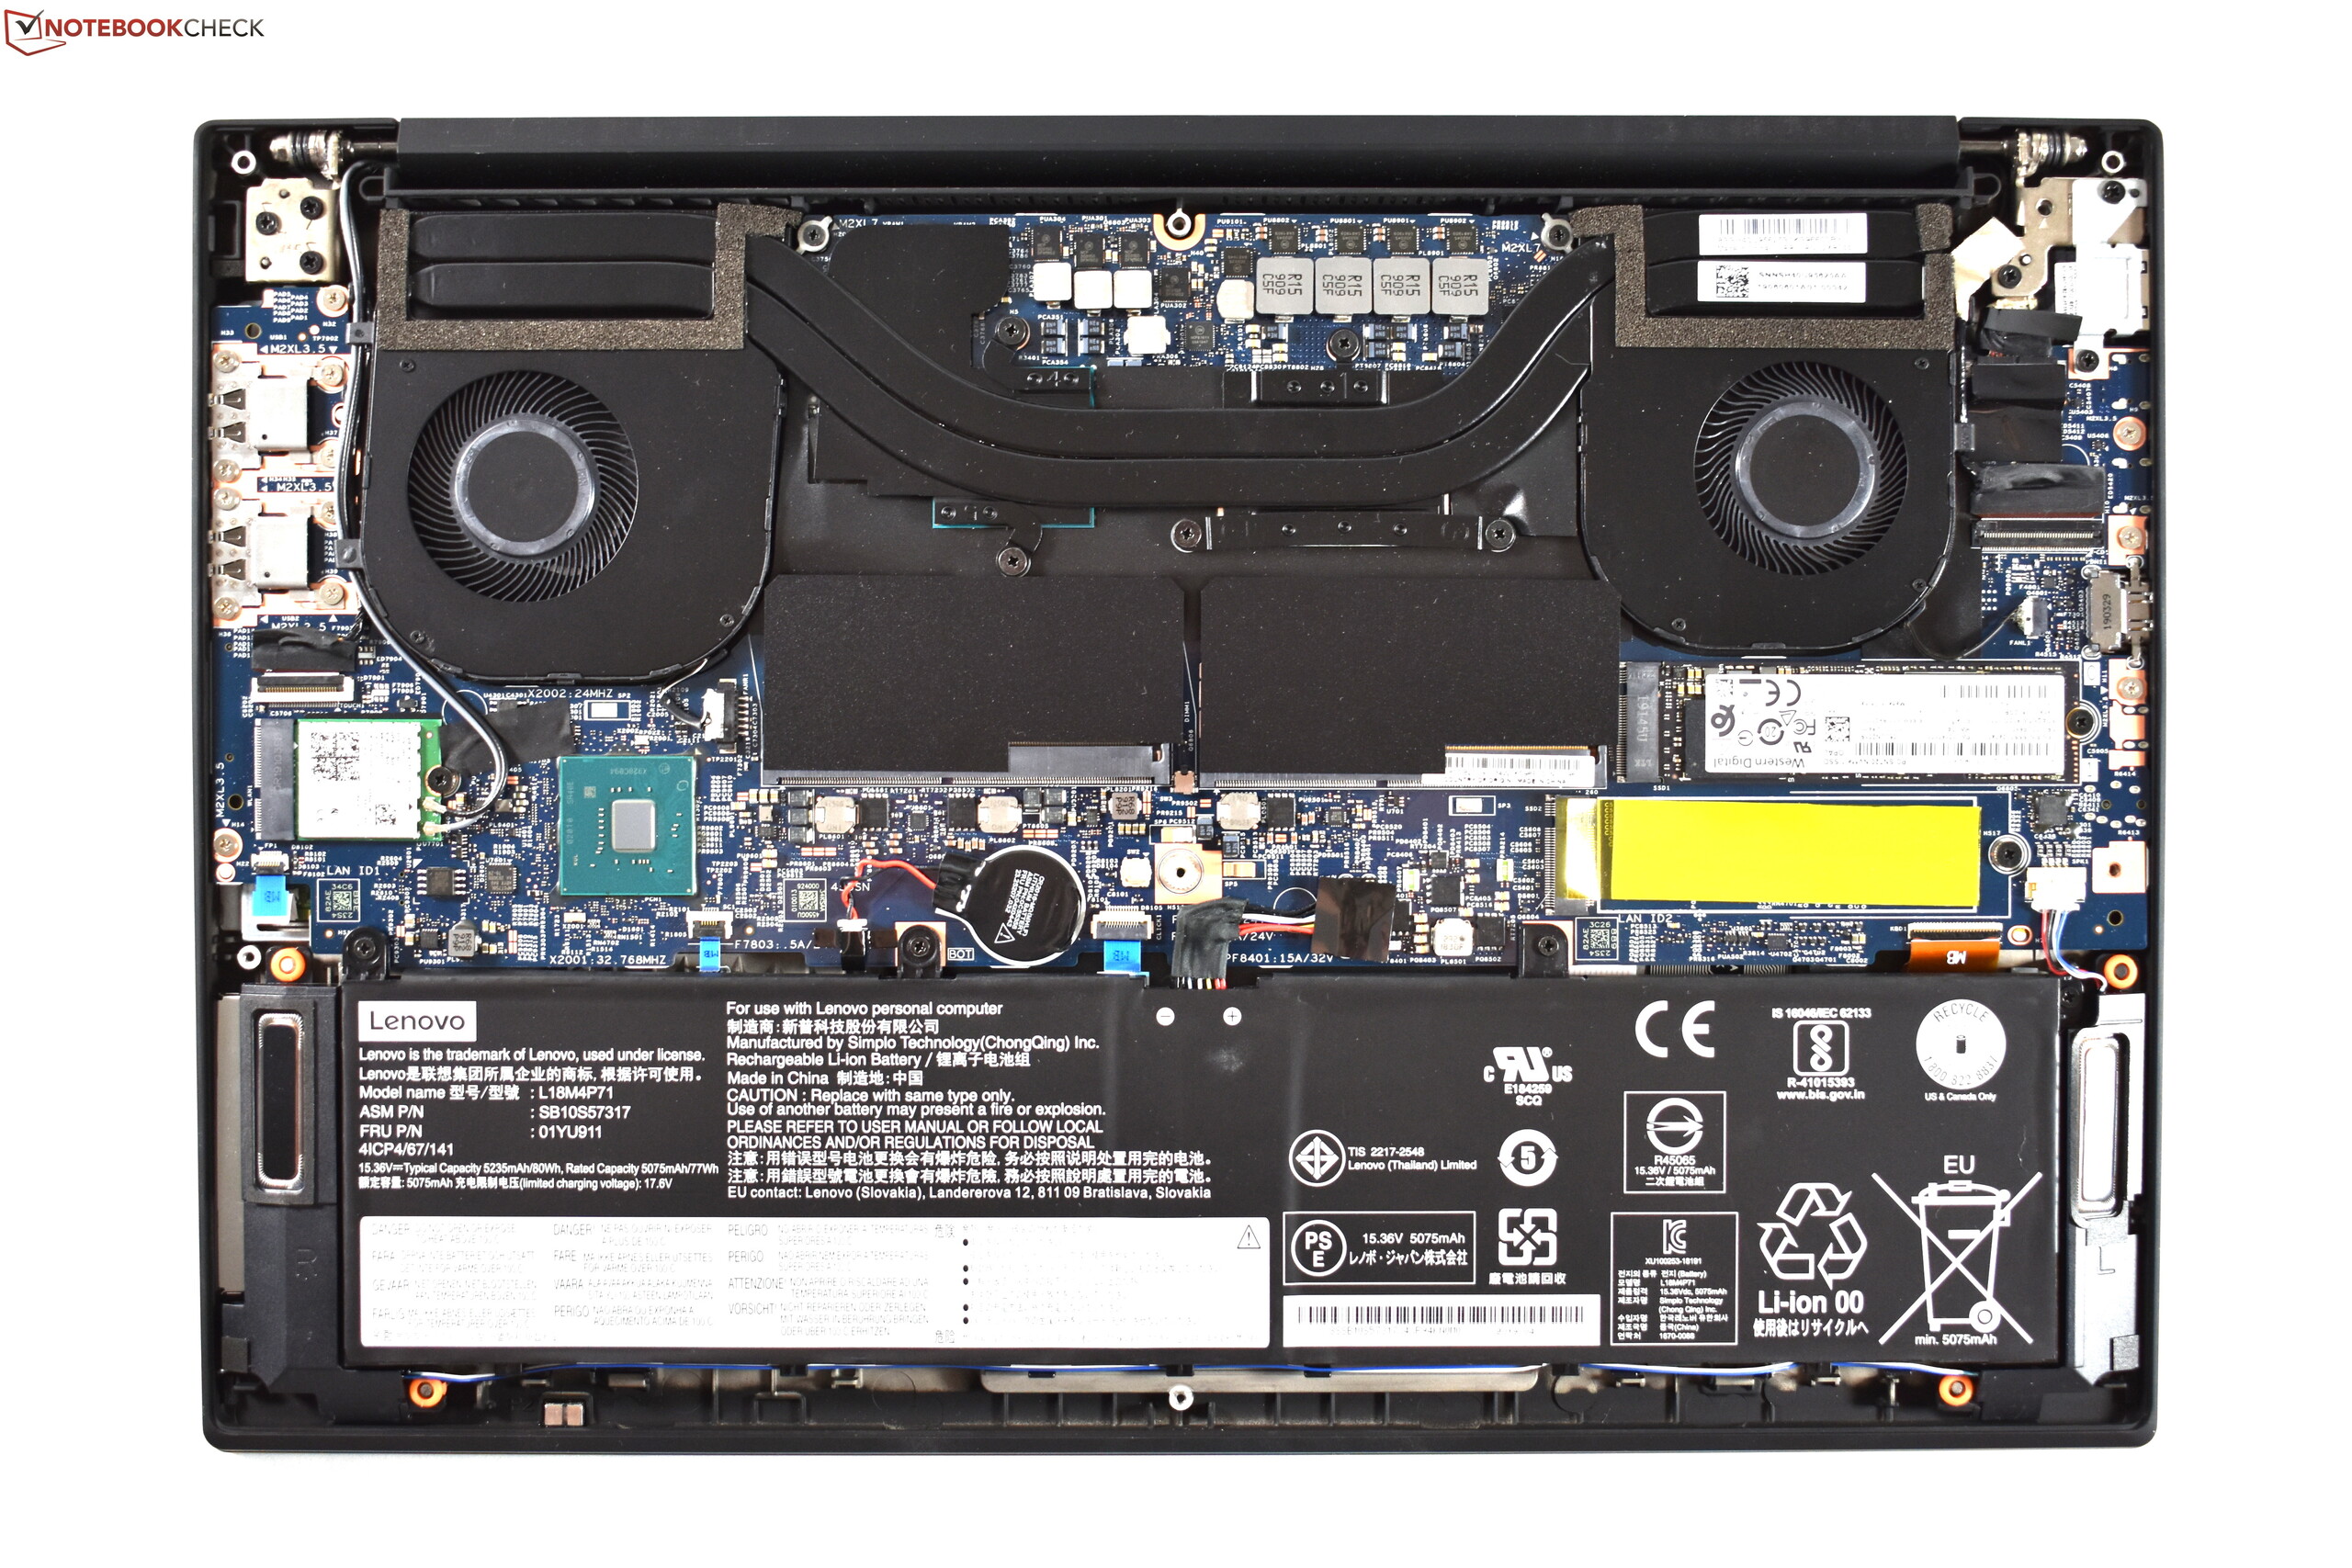
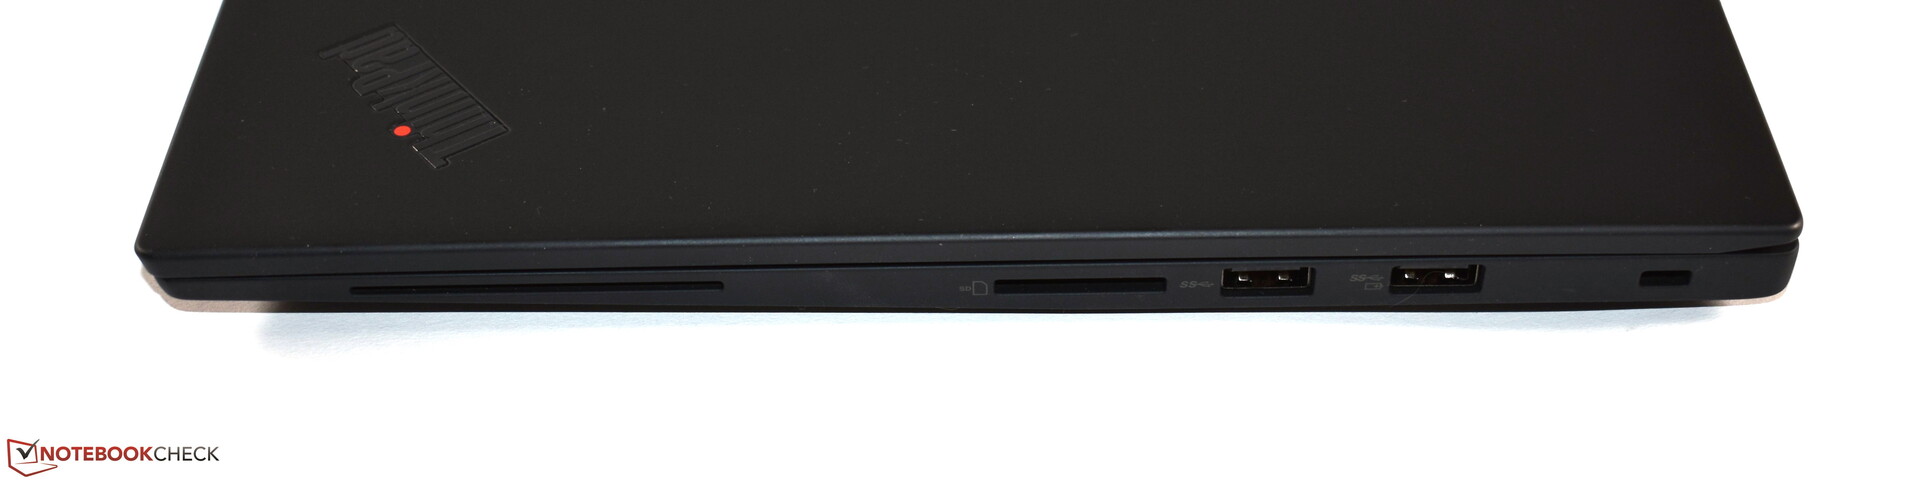
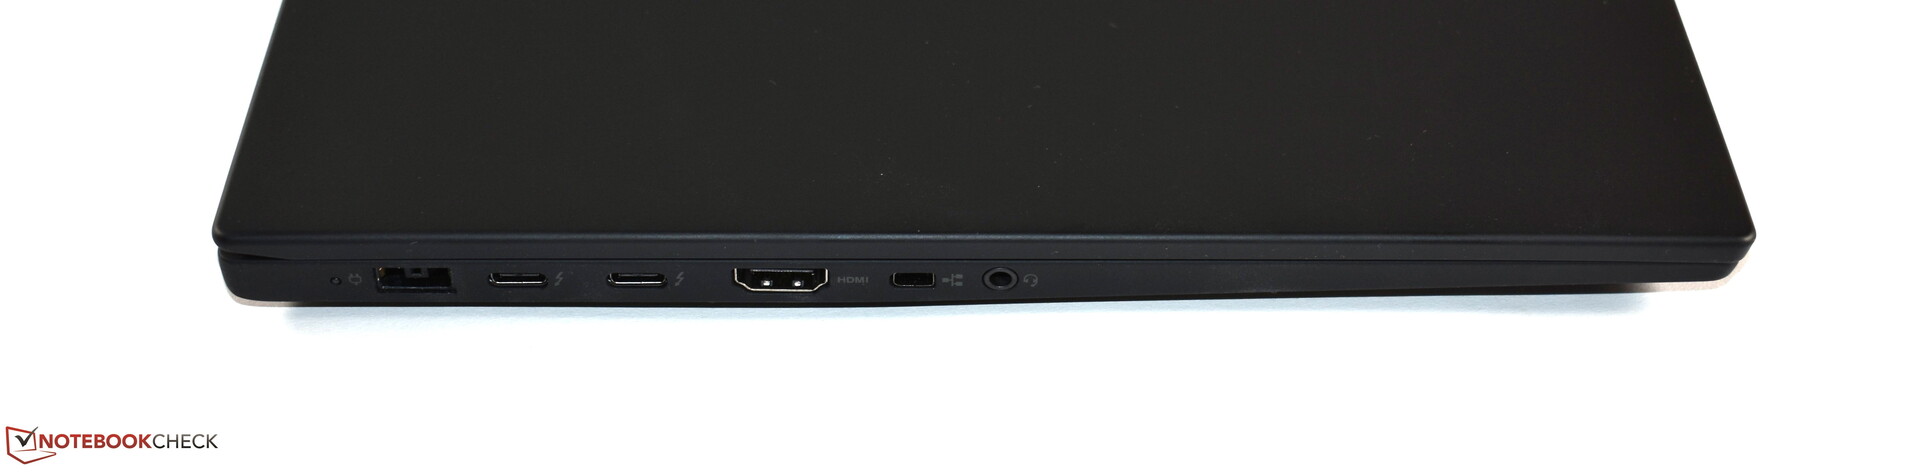
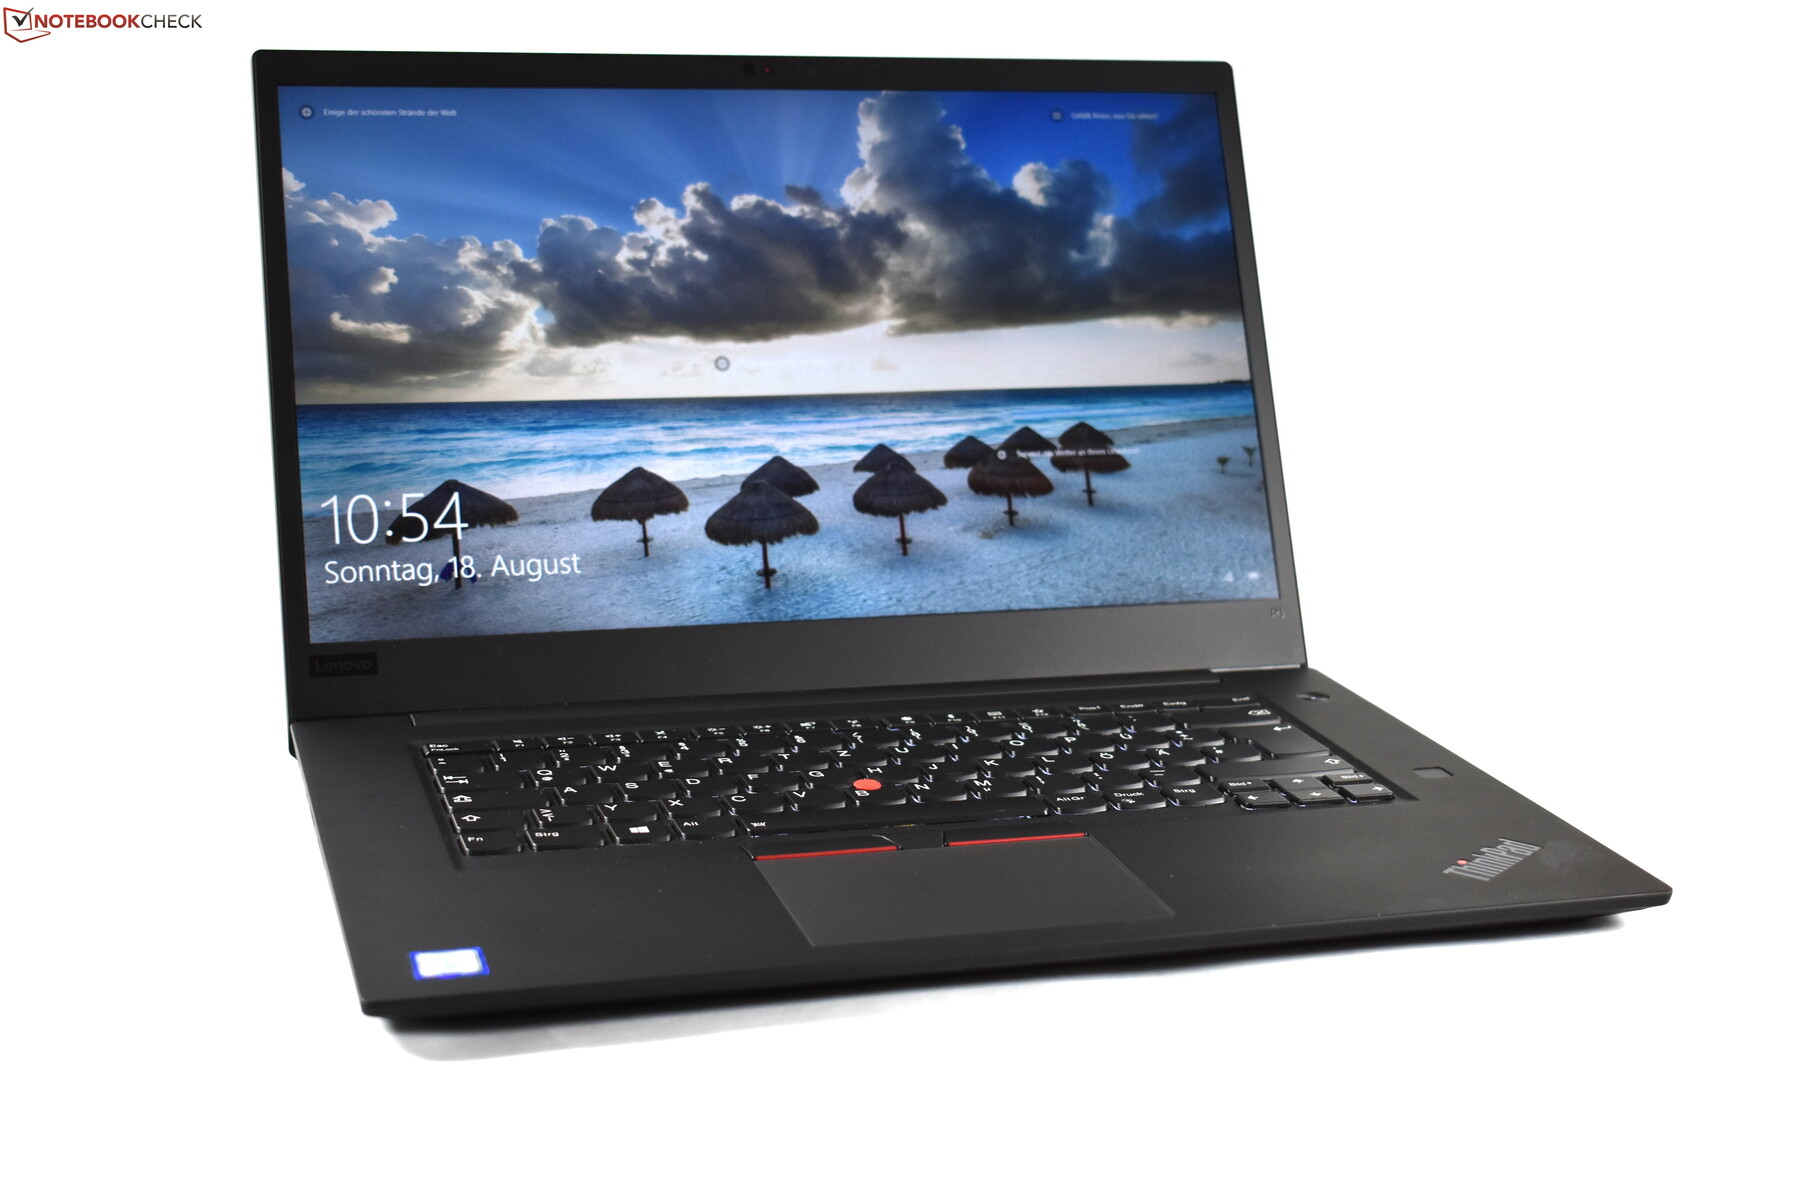
Höljet, som är tillverkat av kol, magnesium och aluminium, är fortfarande av hög kvalitet och till skillnad från den föregående modellen med en tryckkänslig skärm så knarrar inte skärmlocket den här gången. Det matta svarta höljet har fortfarande utmärkta inmatningsenheter och många anslutningar. Det är dessutom fortfarande lätt att uppgradera och underhålla ThinkPad P1 Gen 2 (2x SO-DIMM RAM, 2x 2280-M.2 SSD). Nytt för i år är en del skärmalternativ, exempelvis Full HD HDR-skärmen som sitter i vår testenhet och som övertygade med en extremt hög ljusstyrka på över 500 cd/m². Det är dock synd att den inte täcker 100% av sRGB-färgrymden. Quadro T1000 är också en nyhet som är snabbare än den Nvidia Quadro P2000 Max-Q som satt i föregångaren trots att det är en instegslösning. Andra fördelar inkluderar ett tyst kylsystem och en garantiperiod på tre år.
En negativ sak med ThinkPad P1 Gen 2 är processorns prestanda. Den är inte hemsk, snarare det motsatta: ThinkPad P1 2019 är en riktigt kraftfull laptop. Men vi känner ändå att vi måste påpeka att processorns prestanda är sämre än på den föregående modellen. På så sätt är nya ThinkPad P1 inte en uppgradering. Andra negativa aspekter är att den saknar ett alternativ för WWAN, har medioker batteritid, är dyr och lider av ett irriterande spoltjut.
Sämre CPU men bättre GPU och en betydligt mer ljusstark skärm: Så kan vi sammanfatta de ändringar som skett med ThinkPad P1 (2019) jämfört med dess föregångare.
Om vi väger fördelarna mot nackdelarna vinner definitivt fördelarna med ThinkPad P1 Gen 2. Man får en extremt välutrustad mobil arbetsstation av mycket hög kvalitet som har en otroligt ljusstark skärm. Jämfört med ThinkPad P1 2018 och många äldre bärbara arbetsstationer av liknande konstruktion står i synnerhet Nvidia Quadro T1000 för en rejäl prestandaökning samtidigt som CPU-prestandan är en svag punkt för ThinkPad P1 2019.
Lenovo ThinkPad P1 2019-20QT000RGE
- 10/22/2019 v7 (old)
Benjamin Herzig
Price comparison
