Test: MSI GE75 8SG Raider (i7-8750H, RTX 2080) Laptop (Sammanfattning)

| SD Card Reader | |
| average JPG Copy Test (av. of 3 runs) | |
| MSI GS73 Stealth 8RF-011 (Toshiba Exceria Pro SDXC 64 GB UHS-II) | |
| Genomsnitt av klass Gaming (20.9 - 210, n=54, senaste 2 åren) | |
| Asus ROG Strix Scar II GL704GW (Toshiba Exceria Pro SDXC 64 GB UHS-II) | |
| MSI GE75 8SG Raider (Toshiba Exceria Pro SDXC 64 GB UHS-II) | |
| maximum AS SSD Seq Read Test (1GB) | |
| MSI GS73 Stealth 8RF-011 (Toshiba Exceria Pro SDXC 64 GB UHS-II) | |
| Genomsnitt av klass Gaming (25.5 - 261, n=51, senaste 2 åren) | |
| Asus ROG Strix Scar II GL704GW (Toshiba Exceria Pro SDXC 64 GB UHS-II) | |
| MSI GE75 8SG Raider (Toshiba Exceria Pro SDXC 64 GB UHS-II) | |
| Networking | |
| iperf3 transmit AX12 | |
| MSI GE75 8SG Raider | |
| Asus Zephyrus S GX701GX | |
| Lenovo Legion Y740-17ICH | |
| Asus ROG Strix Scar II GL704GW | |
| MSI GS73 Stealth 8RF-011 | |
| iperf3 receive AX12 | |
| Asus Zephyrus S GX701GX | |
| MSI GE75 8SG Raider | |
| Lenovo Legion Y740-17ICH | |
| Asus ROG Strix Scar II GL704GW | |
| MSI GS73 Stealth 8RF-011 | |
| |||||||||||||||||||||||||
Distribution av ljusstyrkan: 86 %
Mitt på batteriet: 363 cd/m²
Kontrast: 1344:1 (Svärta: 0.27 cd/m²)
ΔE ColorChecker Calman: 2.29 | ∀{0.5-29.43 Ø4.73}
calibrated: 2.45
ΔE Greyscale Calman: 3.02 | ∀{0.09-98 Ø4.97}
91% sRGB (Argyll 1.6.3 3D)
58% AdobeRGB 1998 (Argyll 1.6.3 3D)
62.6% AdobeRGB 1998 (Argyll 3D)
91.2% sRGB (Argyll 3D)
60.6% Display P3 (Argyll 3D)
Gamma: 2.38
CCT: 7048 K
| MSI GE75 8SG Raider CMN N173HCE-G33 (CMN175C), , 1920x1080, 17.3" | Asus Zephyrus S GX701GX B173HAN04.0 (AUO409D), , 1920x1080, 17.3" | Lenovo Legion Y740-17ICH AU Optronics B173HAN03.2, , 1920x1080, 17.3" | Asus ROG Strix Scar II GL704GW B173HAN04.0 (AUO409D), , 1920x1080, 17.3" | MSI GS73 Stealth 8RF-011 CMN N173HHE-G32 (CMN1747), , 1920x1080, 17.3" | MSI GE75 8SF Chi Mei N173HCE-G33, , 1920x1080, 17.3" | |
|---|---|---|---|---|---|---|
| Display | 1% | 3% | 1% | 32% | 4% | |
| Display P3 Coverage (%) | 60.6 | 62.9 4% | 64 6% | 62.9 4% | 90.8 50% | 63.1 4% |
| sRGB Coverage (%) | 91.2 | 87.8 -4% | 90.4 -1% | 87.1 -4% | 99.9 10% | 94.4 4% |
| AdobeRGB 1998 Coverage (%) | 62.6 | 63.9 2% | 64.8 4% | 63.7 2% | 85.8 37% | 65.2 4% |
| Response Times | 3% | -67% | -71% | 18% | -17% | |
| Response Time Grey 50% / Grey 80% * (ms) | 8 ? | 7.2 ? 10% | 15.6 ? -95% | 17.6 ? -120% | 7.8 ? 2% | 9.6 ? -20% |
| Response Time Black / White * (ms) | 9.2 ? | 9.6 ? -4% | 12.8 ? -39% | 11.2 ? -22% | 6.2 ? 33% | 10.4 ? -13% |
| PWM Frequency (Hz) | 26040 ? | 25510 ? | 25770 ? | |||
| Screen | 3% | -43% | -8% | -9% | 17% | |
| Brightness middle (cd/m²) | 363 | 288 -21% | 299.1 -18% | 295 -19% | 262 -28% | 370.4 2% |
| Brightness (cd/m²) | 342 | 287 -16% | 273 -20% | 291 -15% | 261 -24% | 348 2% |
| Brightness Distribution (%) | 86 | 91 6% | 81 -6% | 96 12% | 94 9% | 89 3% |
| Black Level * (cd/m²) | 0.27 | 0.2 26% | 0.27 -0% | 0.24 11% | 0.2 26% | 0.29 -7% |
| Contrast (:1) | 1344 | 1440 7% | 1108 -18% | 1229 -9% | 1310 -3% | 1277 -5% |
| Colorchecker dE 2000 * | 2.29 | 2.33 -2% | 5.07 -121% | 3.2 -40% | 3.96 -73% | 1.26 45% |
| Colorchecker dE 2000 max. * | 4.54 | 5.34 -18% | 10.55 -132% | 6.64 -46% | 7.29 -61% | 3.02 33% |
| Colorchecker dE 2000 calibrated * | 2.45 | 2.47 -1% | 3.31 -35% | 2.52 -3% | 2.18 11% | 1.21 51% |
| Greyscale dE 2000 * | 3.02 | 1.19 61% | 6.8 -125% | 2.16 28% | 3.09 -2% | 1.4 54% |
| Gamma | 2.38 92% | 2.41 91% | 2.46 89% | 2.46 89% | 2.48 89% | 2.2 100% |
| CCT | 7048 92% | 6710 97% | 7805 83% | 6872 95% | 6977 93% | 6747 96% |
| Color Space (Percent of AdobeRGB 1998) (%) | 58 | 57 -2% | 58.5 1% | 57 -2% | 76 31% | 59.7 3% |
| Color Space (Percent of sRGB) (%) | 91 | 88 -3% | 89.9 -1% | 87 -4% | 100 10% | 94.4 4% |
| Totalt genomsnitt (program/inställningar) | 2% /
3% | -36% /
-38% | -26% /
-14% | 14% /
2% | 1% /
10% |
* ... mindre är bättre
Visa svarstider
| ↔ Svarstid svart till vitt | ||
|---|---|---|
| 9.2 ms ... stiga ↗ och falla ↘ kombinerat | ↗ 4.8 ms stiga | 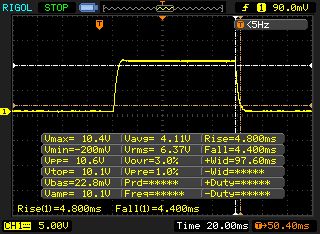 |
| ↘ 4.4 ms hösten | ||
| Skärmen visar snabba svarsfrekvenser i våra tester och bör passa för spel. I jämförelse sträcker sig alla testade enheter från 0.1 (minst) till 240 (maximalt) ms. » 25 % av alla enheter är bättre. Det betyder att den uppmätta svarstiden är bättre än genomsnittet av alla testade enheter (19.9 ms). | ||
| ↔ Svarstid 50 % grått till 80 % grått | ||
| 8 ms ... stiga ↗ och falla ↘ kombinerat | ↗ 4 ms stiga | 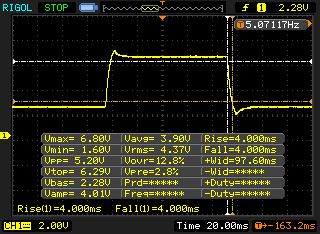 |
| ↘ 4 ms hösten | ||
| Skärmen visar snabba svarsfrekvenser i våra tester och bör passa för spel. I jämförelse sträcker sig alla testade enheter från 0.165 (minst) till 636 (maximalt) ms. » 20 % av alla enheter är bättre. Det betyder att den uppmätta svarstiden är bättre än genomsnittet av alla testade enheter (31.1 ms). | ||
Skärmflimmer / PWM (Puls-Width Modulation)
| Skärmflimmer / PWM upptäckt | 26040 Hz | ≤ 17 % ljusstyrka inställning | 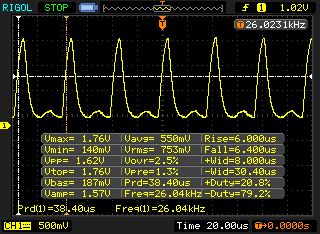 |
Displayens bakgrundsbelysning flimrar vid 26040 Hz (i värsta fall, t.ex. med PWM) Flimrande upptäckt vid en ljusstyrkeinställning på 17 % och lägre. Det ska inte finnas något flimmer eller PWM över denna ljusstyrkeinställning. Frekvensen för 26040 Hz är ganska hög, så de flesta användare som är känsliga för PWM bör inte märka något flimmer. Som jämförelse: 52 % av alla testade enheter använder inte PWM för att dämpa skärmen. Om PWM upptäcktes mättes ett medelvärde av 7798 (minst: 5 - maximum: 343500) Hz. | |||
| PCMark 8 | |
| Home Score Accelerated v2 | |
| Genomsnitt av klass Gaming (n=1senaste 2 åren) | |
| Lenovo Legion Y740-17ICH | |
| MSI GE75 8SG Raider | |
| Asus ROG Strix Scar II GL704GW | |
| Genomsnitt Intel Core i7-8750H, NVIDIA GeForce RTX 2080 Mobile (4124 - 4918, n=3) | |
| MSI GS73 Stealth 8RF-011 | |
| MSI GE75 8SF | |
| Work Score Accelerated v2 | |
| Lenovo Legion Y740-17ICH | |
| Asus ROG Strix Scar II GL704GW | |
| Genomsnitt Intel Core i7-8750H, NVIDIA GeForce RTX 2080 Mobile (5574 - 5697, n=3) | |
| MSI GE75 8SG Raider | |
| MSI GE75 8SF | |
| MSI GS73 Stealth 8RF-011 | |
| Genomsnitt av klass Gaming (n=1senaste 2 åren) | |
| PCMark 8 Home Score Accelerated v2 | 4918 poäng | |
| PCMark 8 Creative Score Accelerated v2 | 8493 poäng | |
| PCMark 8 Work Score Accelerated v2 | 5574 poäng | |
| PCMark 10 Score | 5816 poäng | |
Hjälp | ||
| MSI GE75 8SG Raider Kingston RBUSNS8154P3512GJ | Asus Zephyrus S GX701GX Samsung SSD PM981 MZVLB1T0HALR | Lenovo Legion Y740-17ICH Samsung SSD PM981 MZVLB256HAHQ | Asus ROG Strix Scar II GL704GW Intel SSD 660p SSDPEKNW512G8 | MSI GS73 Stealth 8RF-011 Samsung PM961 MZVLW256HEHP | MSI GE75 8SF Kingston RBUSNS8154P3256GJ1 | Genomsnitt Kingston RBUSNS8154P3512GJ | |
|---|---|---|---|---|---|---|---|
| AS SSD | 88% | 31% | 11% | 38% | -12% | 1% | |
| Seq Read (MB/s) | 888 | 911 3% | 1153 30% | 1315 48% | 1749 97% | 949 7% | 1215 ? 37% |
| Seq Write (MB/s) | 906 | 2347 159% | 1328 47% | 927 2% | 1173 29% | 823 -9% | 897 ? -1% |
| 4K Read (MB/s) | 22.26 | 53 138% | 35.05 57% | 52.4 135% | 42.81 92% | 25.36 14% | 32.4 ? 46% |
| 4K Write (MB/s) | 83 | 122.5 48% | 96 16% | 122.8 48% | 98.4 19% | 67.1 -19% | 87.7 ? 6% |
| 4K-64 Read (MB/s) | 861 | 1577 83% | 727 -16% | 326.5 -62% | 1238 44% | 748 -13% | 796 ? -8% |
| 4K-64 Write (MB/s) | 697 | 1734 149% | 1212 74% | 727 4% | 691 -1% | 650 -7% | 672 ? -4% |
| Access Time Read * (ms) | 0.117 | 0.08 32% | 0.063 46% | 0.11 6% | 0.077 34% | 0.173 -48% | 0.115 ? 2% |
| Access Time Write * (ms) | 0.046 | 0.031 33% | 0.04 13% | 0.045 2% | 0.038 17% | 0.059 -28% | 0.07544 ? -64% |
| Score Read (Points) | 972 | 1721 77% | 878 -10% | 510 -48% | 1456 50% | 869 -11% | 950 ? -2% |
| Score Write (Points) | 870 | 2091 140% | 1441 66% | 942 8% | 906 4% | 799 -8% | 849 ? -2% |
| Score Total (Points) | 2340 | 4771 104% | 2784 19% | 1715 -27% | 3083 32% | 2109 -10% | 2274 ? -3% |
* ... mindre är bättre

| 3DMark 11 Performance | 22658 poäng | |
| 3DMark Cloud Gate Standard Score | 35054 poäng | |
| 3DMark Fire Strike Score | 19661 poäng | |
| 3DMark Time Spy Score | 9018 poäng | |
Hjälp | ||
| låg | med. | hög | ultra | |
|---|---|---|---|---|
| The Witcher 3 (2015) | 276 | 230 | 162 | 92.1 |
| Dota 2 Reborn (2015) | 134.8 | 125.5 | 109 | 103.9 |
| Rise of the Tomb Raider (2016) | 236 | 174 | 155 | 145 |
| X-Plane 11.11 (2018) | 102 | 89 | 75 | |
| Shadow of the Tomb Raider (2018) | 126 | 111 | 106 | 99 |
| Assassin´s Creed Odyssey (2018) | 86 | 75 | 73 | 65 |
| Battlefield V (2018) | 144 | 132 | 117 | 111 |
| Darksiders III (2018) | 195 | 129 | 126 | 121 |
| Just Cause 4 (2018) | 181 | 161 | 118 | 116 |
| Far Cry New Dawn (2019) | 109 | 94 | 90 | 82 |
| Dirt Rally 2.0 (2019) | 216 | 159 | 144 | 96 |
Ljudnivå
| Låg belastning |
| 30 / 34 / 37 dB(A) |
| Hårddisk |
| 33 dB(A) |
| Hög belastning |
| 52 / 54 dB(A) |
 | ||
30 dB tyst 40 dB(A) hörbar 50 dB(A) högt ljud |
||
min: | ||
| MSI GE75 8SG Raider GeForce RTX 2080 Mobile, i7-8750H, Kingston RBUSNS8154P3512GJ | Asus Zephyrus S GX701GX GeForce RTX 2080 Max-Q, i7-8750H, Samsung SSD PM981 MZVLB1T0HALR | Lenovo Legion Y740-17ICH GeForce RTX 2080 Max-Q, i7-8750H, Samsung SSD PM981 MZVLB256HAHQ | Asus ROG Strix Scar II GL704GW GeForce RTX 2070 Mobile, i7-8750H, Intel SSD 660p SSDPEKNW512G8 | MSI GS73 Stealth 8RF-011 GeForce GTX 1070 Max-Q, i7-8750H, Samsung PM961 MZVLW256HEHP | MSI GE75 8SF GeForce RTX 2070 Mobile, i7-8750H, Kingston RBUSNS8154P3256GJ1 | |
|---|---|---|---|---|---|---|
| Noise | 7% | 14% | 3% | 7% | 4% | |
| av / miljö * (dB) | 30 | 29 3% | 28.3 6% | 29 3% | 30 -0% | 28.3 6% |
| Idle Minimum * (dB) | 30 | 29 3% | 31.5 -5% | 29 3% | 30 -0% | 33.5 -12% |
| Idle Average * (dB) | 34 | 32 6% | 31.6 7% | 32 6% | 34 -0% | 33.6 1% |
| Idle Maximum * (dB) | 37 | 33 11% | 31.6 15% | 40 -8% | 36 3% | 35 5% |
| Load Average * (dB) | 52 | 47 10% | 32.3 38% | 46 12% | 43 17% | 38 27% |
| Witcher 3 ultra * (dB) | 53 | 49 8% | 43 19% | 51 4% | 45 15% | 50 6% |
| Load Maximum * (dB) | 54 | 51 6% | 45.5 16% | 52 4% | 45 17% | 56.9 -5% |
* ... mindre är bättre
(-) Den maximala temperaturen på ovansidan är 46 °C / 115 F, jämfört med genomsnittet av 40.4 °C / 105 F , allt från 21.2 till 68.8 °C för klassen Gaming.
(±) Botten värms upp till maximalt 45 °C / 113 F, jämfört med genomsnittet av 43.2 °C / 110 F
(+) Vid tomgångsbruk är medeltemperaturen för ovansidan 25.8 °C / 78 F, jämfört med enhetsgenomsnittet på 33.9 °C / ### class_avg_f### F.
(-) När du spelar The Witcher 3 är medeltemperaturen för ovansidan 42 °C / 108 F, jämfört med enhetsgenomsnittet på 33.9 °C / ## #class_avg_f### F.
(-) Handledsstöden och pekplattan kan bli väldigt varma vid beröring med maximalt 40 °C / 104 F.
(-) Medeltemperaturen för handledsstödsområdet på liknande enheter var 28.8 °C / 83.8 F (-11.2 °C / -20.2 F).
MSI GE75 8SG Raider ljudanalys
(+) | högtalare kan spela relativt högt (91 dB)
Bas 100 - 315 Hz
(-) | nästan ingen bas - i genomsnitt 15.7% lägre än medianen
(±) | linjäriteten för basen är genomsnittlig (12.1% delta till föregående frekvens)
Mellan 400 - 2000 Hz
(±) | reducerade mids - i genomsnitt 5.1% lägre än median
(+) | mids är linjära (5.8% delta till föregående frekvens)
Högsta 2 - 16 kHz
(+) | balanserade toppar - endast 2.7% från medianen
(+) | toppar är linjära (3.2% delta till föregående frekvens)
Totalt 100 - 16 000 Hz
(+) | det totala ljudet är linjärt (12.8% skillnad mot median)
Jämfört med samma klass
» 16% av alla testade enheter i den här klassen var bättre, 4% liknande, 80% sämre
» Den bästa hade ett delta på 6%, genomsnittet var 18%, sämst var 132%
Jämfört med alla testade enheter
» 12% av alla testade enheter var bättre, 3% liknande, 85% sämre
» Den bästa hade ett delta på 4%, genomsnittet var 24%, sämst var 134%
MSI GS73 Stealth 8RF-011 ljudanalys
(+) | högtalare kan spela relativt högt (89 dB)
Bas 100 - 315 Hz
(-) | nästan ingen bas - i genomsnitt 21.6% lägre än medianen
(±) | linjäriteten för basen är genomsnittlig (9% delta till föregående frekvens)
Mellan 400 - 2000 Hz
(±) | högre mellan - i genomsnitt 6.4% högre än median
(+) | mids är linjära (6.7% delta till föregående frekvens)
Högsta 2 - 16 kHz
(±) | reducerade toppar - i genomsnitt 5% lägre än medianen
(±) | linjäriteten för toppar är genomsnittlig (8.1% delta till föregående frekvens)
Totalt 100 - 16 000 Hz
(±) | linjäriteten för det totala ljudet är genomsnittlig (19.3% skillnad mot median)
Jämfört med samma klass
» 65% av alla testade enheter i den här klassen var bättre, 8% liknande, 27% sämre
» Den bästa hade ett delta på 6%, genomsnittet var 18%, sämst var 132%
Jämfört med alla testade enheter
» 47% av alla testade enheter var bättre, 8% liknande, 46% sämre
» Den bästa hade ett delta på 4%, genomsnittet var 24%, sämst var 134%
| Av/Standby | |
| Låg belastning | |
| Hög belastning |
|
Förklaring:
min: | |
| MSI GE75 8SG Raider i7-8750H, GeForce RTX 2080 Mobile, Kingston RBUSNS8154P3512GJ, AHVA, 1920x1080, 17.3" | Asus Zephyrus S GX701GX i7-8750H, GeForce RTX 2080 Max-Q, Samsung SSD PM981 MZVLB1T0HALR, IPS, 1920x1080, 17.3" | Lenovo Legion Y740-17ICH i7-8750H, GeForce RTX 2080 Max-Q, Samsung SSD PM981 MZVLB256HAHQ, IPS, 1920x1080, 17.3" | Asus ROG Strix Scar II GL704GW i7-8750H, GeForce RTX 2070 Mobile, Intel SSD 660p SSDPEKNW512G8, AHVA, 1920x1080, 17.3" | MSI GS73 Stealth 8RF-011 i7-8750H, GeForce GTX 1070 Max-Q, Samsung PM961 MZVLW256HEHP, TN, 1920x1080, 17.3" | MSI GE75 8SF i7-8750H, GeForce RTX 2070 Mobile, Kingston RBUSNS8154P3256GJ1, IPS, 1920x1080, 17.3" | Genomsnitt NVIDIA GeForce RTX 2080 Mobile | Genomsnitt av klass Gaming | |
|---|---|---|---|---|---|---|---|---|
| Power Consumption | -38% | -40% | -41% | 6% | -30% | -101% | -28% | |
| Idle Minimum * (Watt) | 7 | 19 -171% | 20.2 -189% | 19 -171% | 8 -14% | 16.4 -134% | 24.6 ? -251% | 13.2 ? -89% |
| Idle Average * (Watt) | 15 | 22 -47% | 27.2 -81% | 22 -47% | 14 7% | 21.9 -46% | 31.4 ? -109% | 18.9 ? -26% |
| Idle Maximum * (Watt) | 22 | 30 -36% | 28.7 -30% | 29 -32% | 22 -0% | 25.4 -15% | 41.8 ? -90% | 24.3 ? -10% |
| Load Average * (Watt) | 92 | 104 -13% | 90.8 1% | 102 -11% | 92 -0% | 90.7 1% | 112 ? -22% | 108 ? -17% |
| Witcher 3 ultra * (Watt) | 207 | 167 19% | 152.1 27% | 190 8% | 154 26% | 203.3 2% | ||
| Load Maximum * (Watt) | 254 | 203 20% | 165.4 35% | 231 9% | 207 19% | 222.9 12% | 344 ? -35% | 254 ? -0% |
* ... mindre är bättre
| MSI GE75 8SG Raider i7-8750H, GeForce RTX 2080 Mobile, 65 Wh | Asus Zephyrus S GX701GX i7-8750H, GeForce RTX 2080 Max-Q, 76 Wh | Lenovo Legion Y740-17ICH i7-8750H, GeForce RTX 2080 Max-Q, 76 Wh | Asus ROG Strix Scar II GL704GW i7-8750H, GeForce RTX 2070 Mobile, 66 Wh | MSI GS73 Stealth 8RF-011 i7-8750H, GeForce GTX 1070 Max-Q, 51 Wh | MSI GE75 8SF i7-8750H, GeForce RTX 2070 Mobile, 65 Wh | Genomsnitt av klass Gaming | |
|---|---|---|---|---|---|---|---|
| Batteridrifttid | -18% | -32% | -1% | -15% | -26% | 41% | |
| Reader / Idle (h) | 7.8 | 5 -36% | 6.2 -21% | 5.8 -26% | 8.71 ? 12% | ||
| WiFi v1.3 (h) | 4.7 | 3.8 -19% | 3.2 -32% | 3.9 -17% | 3.3 -30% | 3.5 -26% | 7.02 ? 49% |
| Witcher 3 ultra (h) | 0.8 | 0.9 13% | |||||
| Load (h) | 0.9 | 0.9 0% | 1.1 22% | 1 11% | 1.47 ? 63% |
För
Emot
Omdöme – Uppgraderingen är en bra investering
Läs den fullständiga versionen av den här recensionen på engelska här.
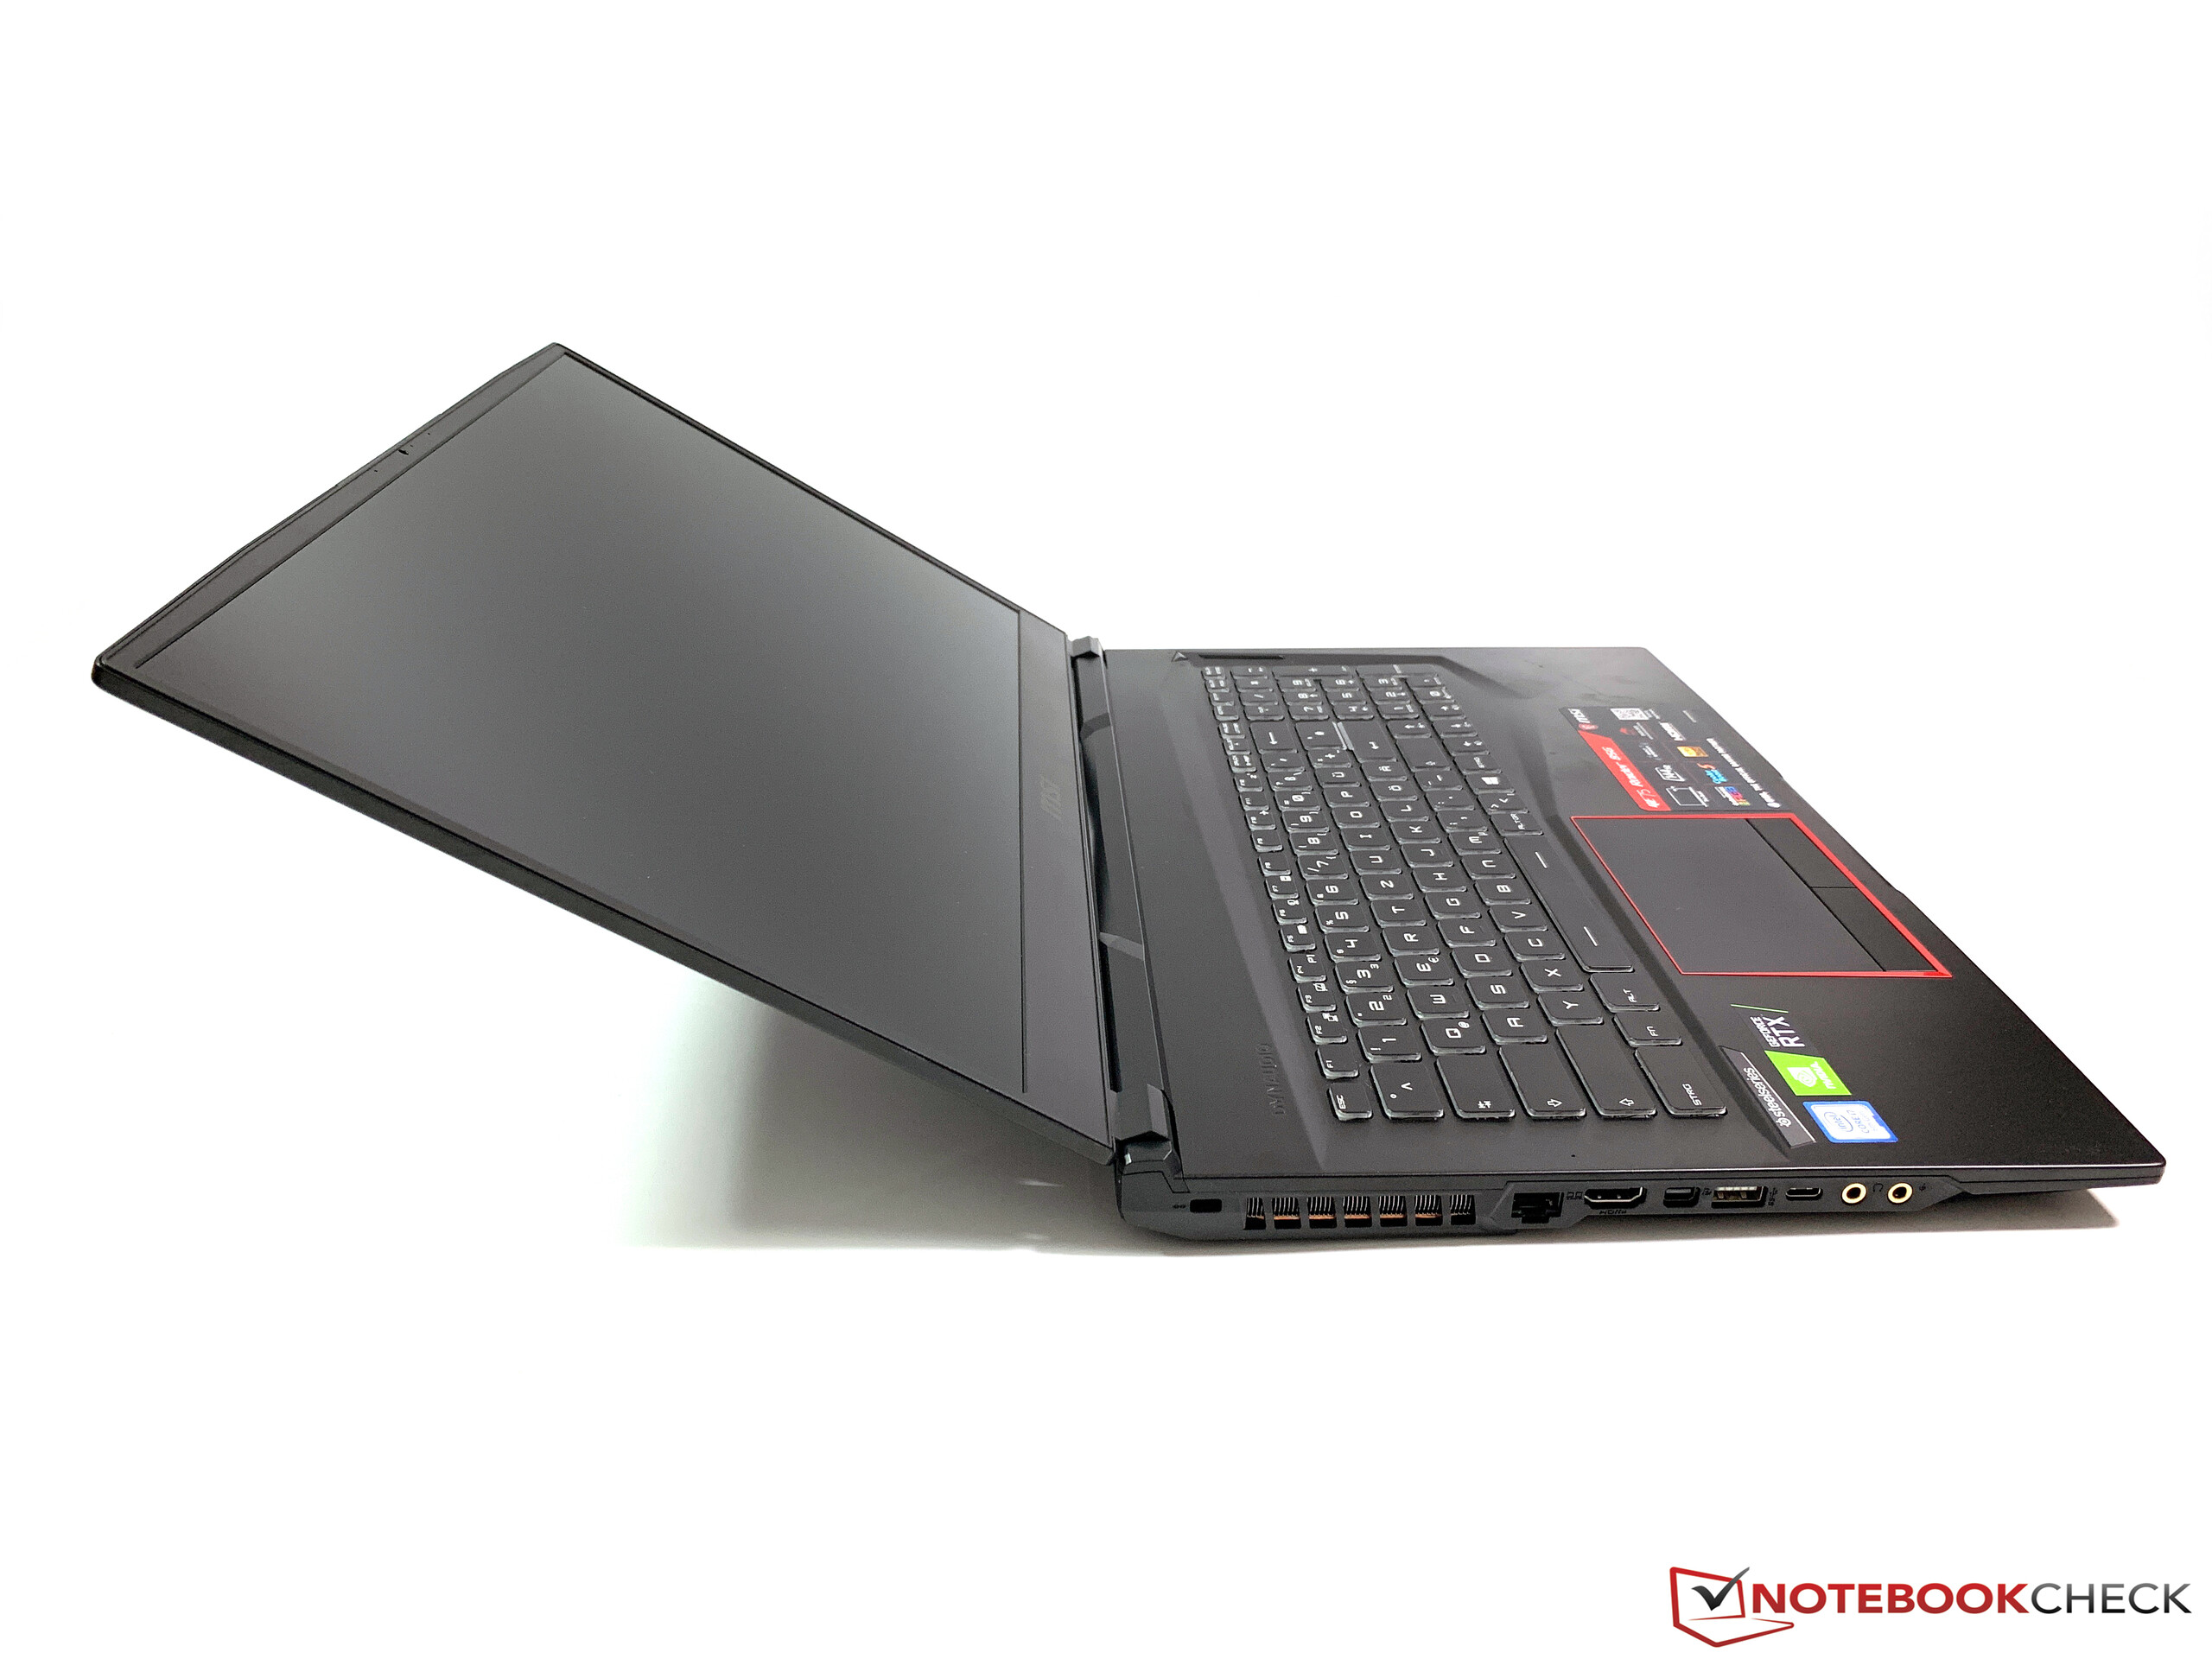
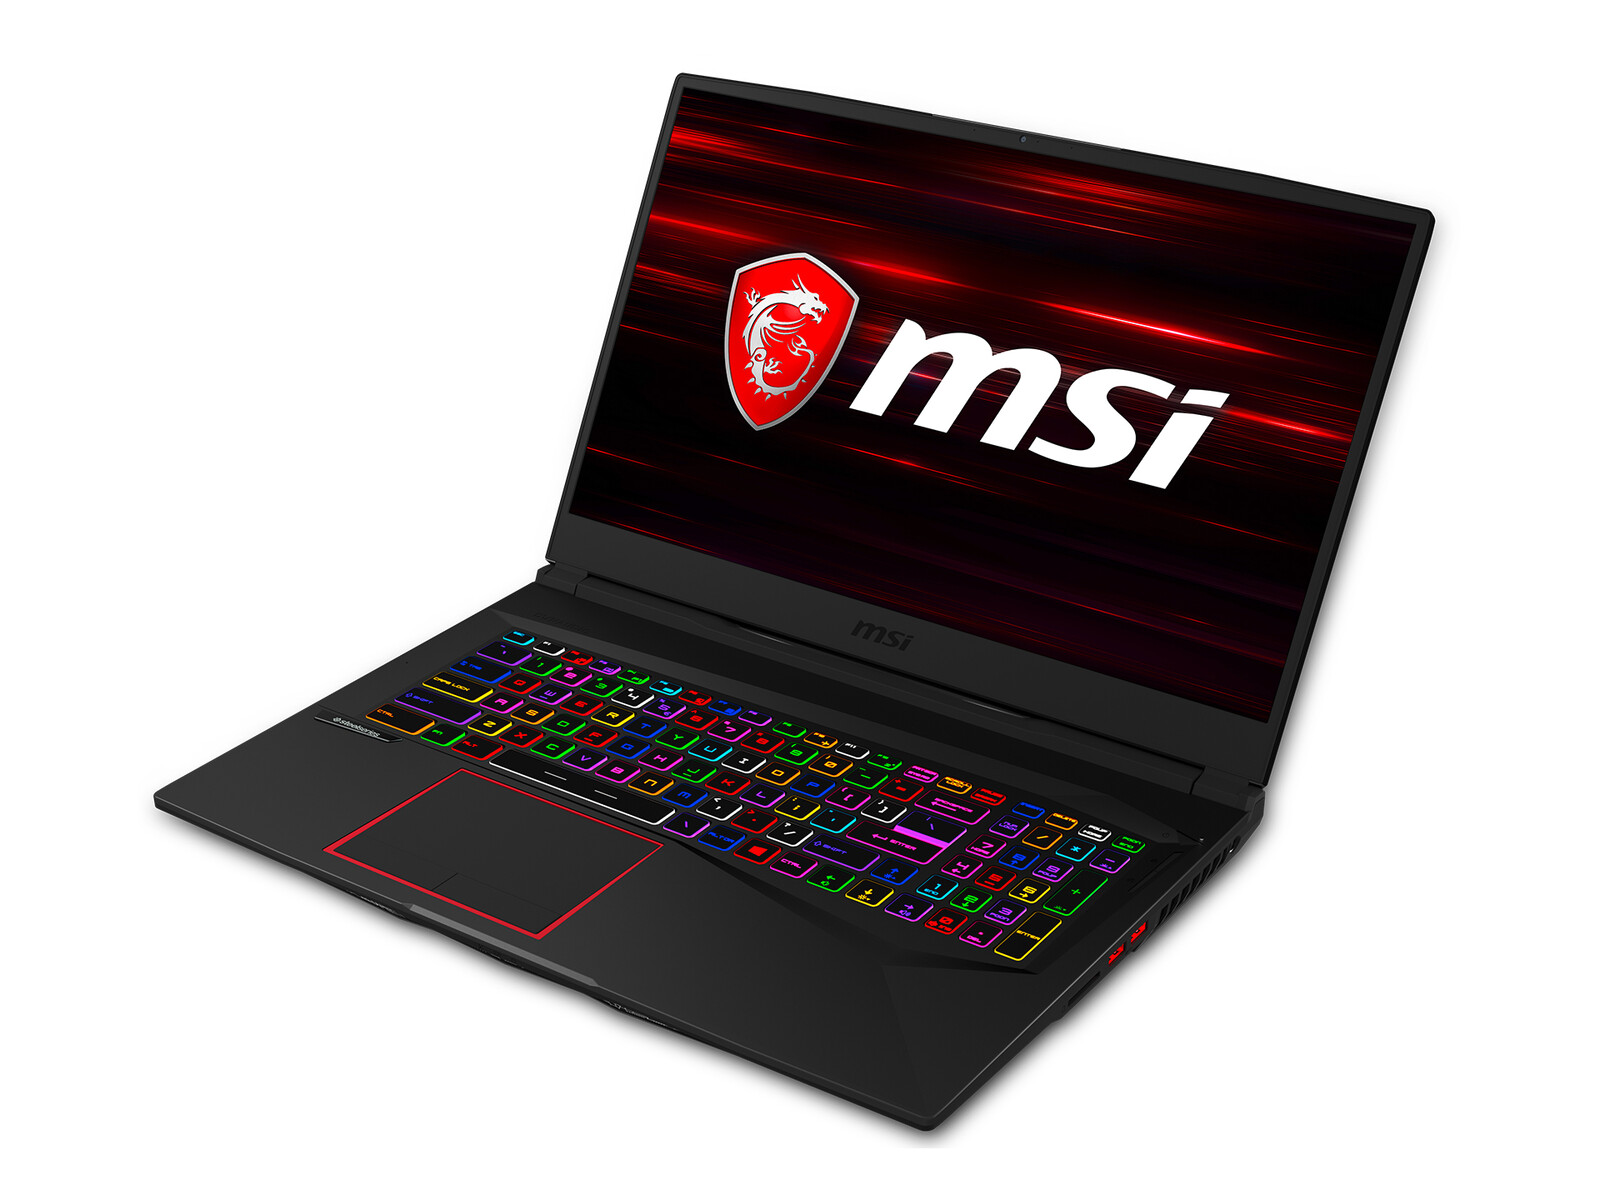
Det märks att nya MSI GE75 Raider är kompaktare än sin föregångare och den har nu en mycket kraftigare GPU. Om du är villig att betala extra för RTX 2080 kommer du inte att slösa bort dina pengar då den använder prestandan väl jämfört med de billigare varianterna med RTX 2070 eller RTX 2060. CPU-prestandan kunde definitivt ha varit en aning bättre, men det finns för tillfället inga hinder när du spelar spel.
Mindre, tunnare, snabbare – det här är en stor utmaning för en kyllösning. MSI lyckas uppnå en effektiv värmeskingring utan någon större påföljd på prestandan. Nackdelen är att fläkten låter högt. Dessutom hör man att den snabba 7200 rpm-enheten brusar vid tomgång.
En annan nackdel är ytorna, som snabbt drar åt sig smuts och fingeravtryck och som behöver göras rent ofta. En laptop för 30.000 kronor bör också ha Thunderbolt 3. Vi är inte säkra på vad vi tycker om att den saknar G-Sync. Datorn är jämförelsevis kompakt för en enhet på 17 tum, men mobilitet är definitivt inte den viktigaste egenskapen för intresserade köpare.
En uppgraderad GPU i MSI GE75 Raider är en bra investering och du kan faktiskt använda den extra prestandan trots ett tunt chassi. Det finns några brister i fråga om anslutbarhet, men vi hittar inga större problem som skulle påverka spelupplevelsen.
MSI GE75 8SG Raider
- 03/25/2019 v6 (old)
Andreas Osthoff
Price comparison
