Test: MSI GF75 Thin 3RD (i7-8750H, GTX 1050Ti Max-Q) Laptop (Sammanfattning)

| Networking | |
| iperf3 transmit AX12 | |
| HP Pavilion Gaming 15-cx0003ng | |
| Asus TUF FX705GE-EW096T | |
| Medion Erazer P6705-MD61131 | |
| Acer Aspire 7 A715-72G-704Q | |
| Lenovo Legion Y730-17ICH, i7-8750H | |
| MSI GF75 8RD-001 | |
| iperf3 receive AX12 | |
| Medion Erazer P6705-MD61131 | |
| Asus TUF FX705GE-EW096T | |
| Lenovo Legion Y730-17ICH, i7-8750H | |
| HP Pavilion Gaming 15-cx0003ng | |
| Acer Aspire 7 A715-72G-704Q | |
| MSI GF75 8RD-001 | |
| |||||||||||||||||||||||||
Distribution av ljusstyrkan: 89 %
Mitt på batteriet: 356 cd/m²
Kontrast: 1319:1 (Svärta: 0.27 cd/m²)
ΔE ColorChecker Calman: 2.73 | ∀{0.5-29.43 Ø4.73}
calibrated: 2.14
ΔE Greyscale Calman: 2.38 | ∀{0.09-98 Ø4.97}
90% sRGB (Argyll 1.6.3 3D)
59% AdobeRGB 1998 (Argyll 1.6.3 3D)
65.2% AdobeRGB 1998 (Argyll 3D)
90.1% sRGB (Argyll 3D)
64% Display P3 (Argyll 3D)
Gamma: 2.48
CCT: 6643 K
| MSI GF75 8RD-001 B173HAN04.2, , 1920x1080, 17.3" | Asus TUF FX705GE-EW096T AU Optronics B173HAN04.2, , 1920x1080, 17.3" | Lenovo Legion Y730-17ICH, i7-8750H LP173WF4-SPF6, , 1920x1080, 17.3" | Medion Erazer P6705-MD61131 AU Optronics B156HTN03.8 (AUO38ED), , 1920x1080, 15.6" | HP Pavilion Gaming 15-cx0003ng BOE07A1, , 1920x1080, 15.6" | Acer Aspire 7 A715-72G-704Q LG Philips LP156WFC-SPP1, , 1920x1080, 15.6" | |
|---|---|---|---|---|---|---|
| Display | -3% | -2% | -41% | -36% | -38% | |
| Display P3 Coverage (%) | 64 | 63.1 -1% | 66.4 4% | 36.4 -43% | 39.72 -38% | 38.34 -40% |
| sRGB Coverage (%) | 90.1 | 86.8 -4% | 84.9 -6% | 54.8 -39% | 59.3 -34% | 57.5 -36% |
| AdobeRGB 1998 Coverage (%) | 65.2 | 63.5 -3% | 62.1 -5% | 37.61 -42% | 41.04 -37% | 39.65 -39% |
| Response Times | -2% | 9% | 13% | -18% | 11% | |
| Response Time Grey 50% / Grey 80% * (ms) | 38 ? | 39 ? -3% | 36.8 ? 3% | 44.8 ? -18% | 47 ? -24% | 35 ? 8% |
| Response Time Black / White * (ms) | 28 ? | 28 ? -0% | 24 ? 14% | 16 ? 43% | 31 ? -11% | 24 ? 14% |
| PWM Frequency (Hz) | 208 ? | |||||
| Screen | -9% | -47% | -124% | -36% | -55% | |
| Brightness middle (cd/m²) | 356 | 299 -16% | 328.7 -8% | 200 -44% | 241 -32% | 280 -21% |
| Brightness (cd/m²) | 332 | 291 -12% | 318 -4% | 186 -44% | 236 -29% | 248 -25% |
| Brightness Distribution (%) | 89 | 90 1% | 91 2% | 85 -4% | 75 -16% | 81 -9% |
| Black Level * (cd/m²) | 0.27 | 0.28 -4% | 0.51 -89% | 0.43 -59% | 0.15 44% | 0.56 -107% |
| Contrast (:1) | 1319 | 1068 -19% | 645 -51% | 465 -65% | 1607 22% | 500 -62% |
| Colorchecker dE 2000 * | 2.73 | 3.02 -11% | 4.91 -80% | 11.39 -317% | 4.85 -78% | 4.75 -74% |
| Colorchecker dE 2000 max. * | 4.7 | 5.27 -12% | 10.15 -116% | 19.36 -312% | 8.82 -88% | 8.04 -71% |
| Colorchecker dE 2000 calibrated * | 2.14 | 2.76 -29% | 4.27 -100% | 3.05 -43% | 4.93 -130% | |
| Greyscale dE 2000 * | 2.38 | 2.18 8% | 3.9 -64% | 11.73 -393% | 5.15 -116% | 3.21 -35% |
| Gamma | 2.48 89% | 2.48 89% | 2.13 103% | 1.97 112% | 2.49 88% | 2.59 85% |
| CCT | 6643 98% | 6392 102% | 6911 94% | 12614 52% | 7042 92% | 6601 98% |
| Color Space (Percent of AdobeRGB 1998) (%) | 59 | 57 -3% | 55.6 -6% | 35 -41% | 38 -36% | 36 -39% |
| Color Space (Percent of sRGB) (%) | 90 | 87 -3% | 84.7 -6% | 55 -39% | 59 -34% | 57 -37% |
| Totalt genomsnitt (program/inställningar) | -5% /
-7% | -13% /
-32% | -51% /
-91% | -30% /
-34% | -27% /
-44% |
* ... mindre är bättre
Visa svarstider
| ↔ Svarstid svart till vitt | ||
|---|---|---|
| 28 ms ... stiga ↗ och falla ↘ kombinerat | ↗ 16 ms stiga | 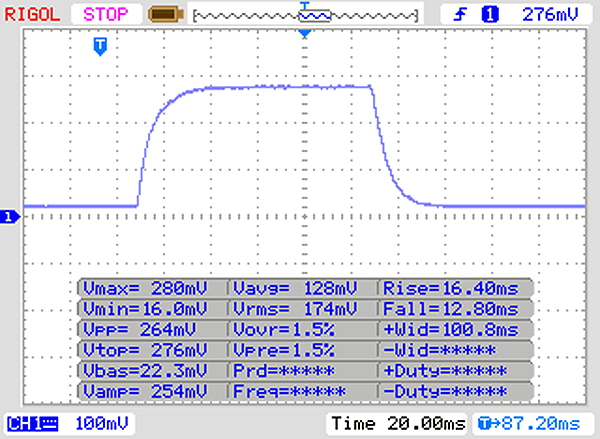 |
| ↘ 12 ms hösten | ||
| Skärmen visar relativt långsamma svarsfrekvenser i våra tester och kan vara för långsam för spelare. I jämförelse sträcker sig alla testade enheter från 0.1 (minst) till 240 (maximalt) ms. » 71 % av alla enheter är bättre. Detta innebär att den uppmätta svarstiden är sämre än genomsnittet av alla testade enheter (19.9 ms). | ||
| ↔ Svarstid 50 % grått till 80 % grått | ||
| 38 ms ... stiga ↗ och falla ↘ kombinerat | ↗ 18 ms stiga | 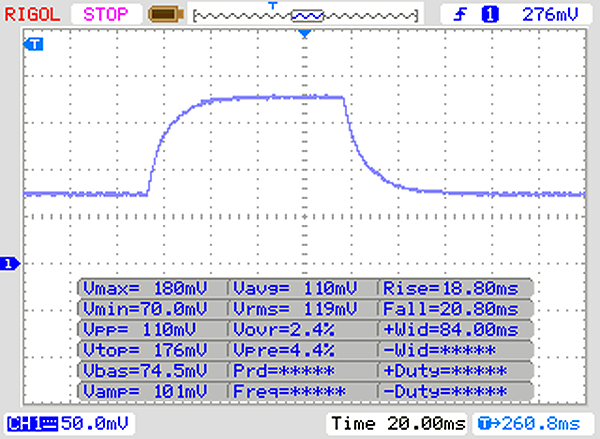 |
| ↘ 20 ms hösten | ||
| Skärmen visar långsamma svarsfrekvenser i våra tester och kommer att vara otillfredsställande för spelare. I jämförelse sträcker sig alla testade enheter från 0.165 (minst) till 636 (maximalt) ms. » 55 % av alla enheter är bättre. Detta innebär att den uppmätta svarstiden är sämre än genomsnittet av alla testade enheter (31.1 ms). | ||
Skärmflimmer / PWM (Puls-Width Modulation)
| Skärmflimmer / PWM upptäcktes inte |  | ||
Som jämförelse: 52 % av alla testade enheter använder inte PWM för att dämpa skärmen. Om PWM upptäcktes mättes ett medelvärde av 7798 (minst: 5 - maximum: 343500) Hz. | |||
| PCMark 8 | |
| Home Score Accelerated v2 | |
| Genomsnitt av klass Gaming (n=1senaste 2 åren) | |
| HP Pavilion Gaming 15-cx0003ng | |
| MSI GL73 8RD-418US | |
| Asus TUF FX705GE-EW096T | |
| Lenovo Legion Y730-17ICH, i7-8750H | |
| Acer Aspire 7 A715-72G-704Q | |
| Medion Erazer P6705-MD61131 | |
| MSI GF75 8RD-001 | |
| MSI GF63 8RC | |
| Genomsnitt Intel Core i7-8750H, NVIDIA GeForce GTX 1050 Ti Max-Q (3494 - 3969, n=4) | |
| Work Score Accelerated v2 | |
| Asus TUF FX705GE-EW096T | |
| MSI GL73 8RD-418US | |
| Medion Erazer P6705-MD61131 | |
| Lenovo Legion Y730-17ICH, i7-8750H | |
| MSI GF75 8RD-001 | |
| Acer Aspire 7 A715-72G-704Q | |
| HP Pavilion Gaming 15-cx0003ng | |
| MSI GF63 8RC | |
| Genomsnitt Intel Core i7-8750H, NVIDIA GeForce GTX 1050 Ti Max-Q (4316 - 5317, n=4) | |
| Genomsnitt av klass Gaming (n=1senaste 2 åren) | |
| PCMark 8 Home Score Accelerated v2 | 3969 poäng | |
| PCMark 8 Work Score Accelerated v2 | 5317 poäng | |
| PCMark 10 Score | 4437 poäng | |
Hjälp | ||
| MSI GF75 8RD-001 Kingston RBUSNS8154P3256GJ1 | Asus TUF FX705GE-EW096T SK hynix BC501 HFM128GDJTNG-831 | Lenovo Legion Y730-17ICH, i7-8750H Toshiba KBG30ZMT128G | Medion Erazer P6705-MD61131 Samsung SSD PM981 MZVLB256HAHQ | HP Pavilion Gaming 15-cx0003ng Intel Optane 16 GB MEMPEK1J016GAH + HGST HTS721010A9E630 1 TB HDD | Acer Aspire 7 A715-72G-704Q Intel SSD 760p SSDPEKKW256G8 | Genomsnitt Kingston RBUSNS8154P3256GJ1 | |
|---|---|---|---|---|---|---|---|
| CrystalDiskMark 5.2 / 6 | -13% | -39% | 62% | -7% | 37% | 47% | |
| Write 4K (MB/s) | 72.1 | 90.3 25% | 71.4 -1% | 107 48% | 59.2 -18% | 103.4 43% | 141.1 ? 96% |
| Read 4K (MB/s) | 28.12 | 37.03 32% | 29.98 7% | 39.91 42% | 91.3 225% | 56 99% | 82.4 ? 193% |
| Write Seq (MB/s) | 746 | 320.3 -57% | 129.6 -83% | 1439 93% | 158.3 -79% | 808 8% | 722 ? -3% |
| Read Seq (MB/s) | 834 | 1012 21% | 843 1% | 2011 141% | 880 6% | 1939 132% | 974 ? 17% |
| Write 4K Q32T1 (MB/s) | 313.7 | 196.8 -37% | 88.9 -72% | 282.1 -10% | 161.8 -48% | 281.3 -10% | 418 ? 33% |
| Read 4K Q32T1 (MB/s) | 348.7 | 271.5 -22% | 196.4 -44% | 326.6 -6% | 286.5 -18% | 326.5 -6% | 571 ? 64% |
| Write Seq Q32T1 (MB/s) | 854 | 268.8 -69% | 130.5 -85% | 1441 69% | 159.8 -81% | 474.1 -44% | 717 ? -16% |
| Read Seq Q32T1 (MB/s) | 1587 | 1595 1% | 1037 -35% | 3516 122% | 929 -41% | 2735 72% | 1413 ? -11% |
| AS SSD | -56% | -147% | 12% | -1524% | 4% | -11% | |
| Seq Read (MB/s) | 1416 | 878 -38% | 979 -31% | 2724 92% | 854 -40% | 2493 76% | 1195 ? -16% |
| Seq Write (MB/s) | 798 | 336.8 -58% | 125.4 -84% | 1365 71% | 147 -82% | 1241 56% | 668 ? -16% |
| 4K Read (MB/s) | 38.92 | 23.76 -39% | 19.73 -49% | 46.14 19% | 105.1 170% | 41.22 6% | 33.6 ? -14% |
| 4K Write (MB/s) | 100.1 | 92 -8% | 38.73 -61% | 102.6 2% | 59.5 -41% | 112.4 12% | 82.6 ? -17% |
| 4K-64 Read (MB/s) | 726 | 248.9 -66% | 168.6 -77% | 567 -22% | 42.09 -94% | 522 -28% | 667 ? -8% |
| 4K-64 Write (MB/s) | 584 | 112.5 -81% | 31.38 -95% | 459.8 -21% | 137.3 -76% | 470.7 -19% | 561 ? -4% |
| Access Time Read * (ms) | 0.072 | 0.141 -96% | 0.519 -621% | 0.08 -11% | 14.99 -20719% | 0.058 19% | 0.117 ? -63% |
| Access Time Write * (ms) | 0.044 | 0.054 -23% | 0.324 -636% | 0.037 16% | 0.043 2% | 0.099 -125% | 0.05571 ? -27% |
| Score Read (Points) | 907 | 360 -60% | 286 -68% | 886 -2% | 233 -74% | 812 -10% | 820 ? -10% |
| Score Write (Points) | 764 | 238 -69% | 86 -89% | 699 -9% | 211 -72% | 707 -7% | 710 ? -7% |
| Score Total (Points) | 2112 | 764 -64% | 479 -77% | 1983 -6% | 577 -73% | 1883 -11% | 1931 ? -9% |
| Copy ISO MB/s (MB/s) | 608 | 224.1 -63% | 272.7 -55% | 110.1 -82% | 968 59% | 773 ? 27% | |
| Copy Program MB/s (MB/s) | 350.7 | 111.9 -68% | 182.9 -48% | 94.1 -73% | 319.4 -9% | 375 ? 7% | |
| Copy Game MB/s (MB/s) | 478.7 | 229.2 -52% | 134.6 -72% | 81.7 -83% | 648 35% | 509 ? 6% | |
| Totalt genomsnitt (program/inställningar) | -35% /
-41% | -93% /
-108% | 37% /
33% | -766% /
-972% | 21% /
16% | 18% /
10% |
* ... mindre är bättre

| 3DMark 11 Performance | 9171 poäng | |
| 3DMark Cloud Gate Standard Score | 28253 poäng | |
| 3DMark Fire Strike Score | 6714 poäng | |
Hjälp | ||
| The Witcher 3 | |
| 1920x1080 High Graphics & Postprocessing (Nvidia HairWorks Off) | |
| Genomsnitt av klass Gaming (181 - 341, n=3, senaste 2 åren) | |
| Schenker XMG Neo 17 | |
| Gigabyte Aero 15-Y9 | |
| MSI GF75 8RD-001 | |
| Lenovo Legion Y730-17ICH, i7-8750H | |
| Acer Aspire 7 A715-72G-704Q | |
| Genomsnitt NVIDIA GeForce GTX 1050 Ti Max-Q (42.6 - 60, n=6) | |
| Asus TUF FX705GE-EW096T | |
| HP Spectre x360 15-df0126ng | |
| Medion Erazer P6705-MD61131 | |
| HP Pavilion Gaming 15-cx0003ng | |
| Acer Aspire 5 A515-52G-723L | |
| 1920x1080 Ultra Graphics & Postprocessing (HBAO+) | |
| Genomsnitt av klass Gaming (95 - 240, n=8, senaste 2 åren) | |
| MSI GS75 8SG Stealth | |
| Schenker XMG Neo 17 | |
| Gigabyte Aero 15-Y9 | |
| MSI GF75 8RD-001 | |
| Acer Aspire 7 A715-72G-704Q | |
| Genomsnitt NVIDIA GeForce GTX 1050 Ti Max-Q (23.5 - 43, n=7) | |
| Lenovo Legion Y730-17ICH, i7-8750H | |
| Asus TUF FX705GE-EW096T | |
| HP Spectre x360 15-df0126ng | |
| Medion Erazer P6705-MD61131 | |
| HP Pavilion Gaming 15-cx0003ng | |
| Acer Aspire 5 A515-52G-723L | |
| Far Cry New Dawn | |
| 1920x1080 High Preset | |
| MSI GS75 8SG Stealth | |
| Schenker XMG Neo 17 | |
| Gigabyte Aero 15-Y9 | |
| MSI GF75 8RD-001 | |
| Genomsnitt NVIDIA GeForce GTX 1050 Ti Max-Q (43 - 46, n=2) | |
| HP Spectre x360 15-df0126ng | |
| MSI GE72 7RE | |
| Acer Aspire 5 A515-52G-723L | |
| 1920x1080 Ultra Preset | |
| MSI GS75 8SG Stealth | |
| Schenker XMG Neo 17 | |
| Gigabyte Aero 15-Y9 | |
| MSI GF75 8RD-001 | |
| Genomsnitt NVIDIA GeForce GTX 1050 Ti Max-Q (40 - 43, n=2) | |
| HP Spectre x360 15-df0126ng | |
| MSI GE72 7RE | |
| Acer Aspire 5 A515-52G-723L | |
| 2560x1440 Ultra Preset | |
| Schenker XMG Neo 17 | |
| MSI GF75 8RD-001 | |
| Genomsnitt NVIDIA GeForce GTX 1050 Ti Max-Q (n=1) | |
| MSI GE72 7RE | |
| 3840x2160 Ultra Preset | |
| Schenker XMG Neo 17 | |
| Gigabyte Aero 15-Y9 | |
| MSI GF75 8RD-001 | |
| Genomsnitt NVIDIA GeForce GTX 1050 Ti Max-Q (14 - 15, n=2) | |
| HP Spectre x360 15-df0126ng | |
| MSI GE72 7RE | |
| Metro Exodus | |
| 1920x1080 Medium Quality AF:4x | |
| Schenker XMG Neo 17 | |
| Gigabyte Aero 15-Y9 | |
| HP Spectre x360 15-df0126ng | |
| Genomsnitt NVIDIA GeForce GTX 1050 Ti Max-Q (31.4 - 49.8, n=2) | |
| MSI GF75 8RD-001 | |
| MSI GE72 7RE | |
| Acer Aspire 5 A515-52G-723L | |
| Lenovo V145-15AST | |
| 1920x1080 High Quality AF:16x | |
| MSI GS75 8SG Stealth | |
| Schenker XMG Neo 17 | |
| Gigabyte Aero 15-Y9 | |
| HP Spectre x360 15-df0126ng | |
| Genomsnitt NVIDIA GeForce GTX 1050 Ti Max-Q (23.5 - 36.5, n=2) | |
| MSI GF75 8RD-001 | |
| MSI GE72 7RE | |
| Acer Aspire 5 A515-52G-723L | |
| 1920x1080 Ultra Quality AF:16x | |
| Schenker XMG Neo 17 | |
| MSI GS75 8SG Stealth | |
| Gigabyte Aero 15-Y9 | |
| HP Spectre x360 15-df0126ng | |
| Genomsnitt NVIDIA GeForce GTX 1050 Ti Max-Q (19.3 - 28.3, n=2) | |
| MSI GF75 8RD-001 | |
| MSI GE72 7RE | |
| Acer Aspire 5 A515-52G-723L | |
| låg | med. | hög | ultra | QHD | 4K | |
|---|---|---|---|---|---|---|
| The Witcher 3 (2015) | 145 | 99 | 60 | 43 | ||
| Final Fantasy XV Benchmark (2018) | 75.1 | 37.7 | 25 | |||
| Far Cry New Dawn (2019) | 89 | 50 | 46 | 43 | 29 | 15 |
| Metro Exodus (2019) | 60.4 | 31.4 | 23.5 | 19.3 |
Ljudnivå
| Låg belastning |
| 32 / 32 / 32.1 dB(A) |
| Hög belastning |
| 33.6 / 40.6 dB(A) |
 | ||
30 dB tyst 40 dB(A) hörbar 50 dB(A) högt ljud |
||
min: | ||
(±) Den maximala temperaturen på ovansidan är 44.2 °C / 112 F, jämfört med genomsnittet av 40.4 °C / 105 F , allt från 21.2 till 68.8 °C för klassen Gaming.
(+) Botten värms upp till maximalt 39.1 °C / 102 F, jämfört med genomsnittet av 43.2 °C / 110 F
(+) Vid tomgångsbruk är medeltemperaturen för ovansidan 23.3 °C / 74 F, jämfört med enhetsgenomsnittet på 33.9 °C / ### class_avg_f### F.
(+) Handledsstöden och pekplattan är kallare än hudtemperaturen med maximalt 26.8 °C / 80.2 F och är därför svala att ta på.
(±) Medeltemperaturen för handledsstödsområdet på liknande enheter var 28.8 °C / 83.8 F (+2 °C / 3.6 F).
MSI GF75 8RD-001 ljudanalys
(-) | inte särskilt höga högtalare (66.8 dB)
Bas 100 - 315 Hz
(-) | nästan ingen bas - i genomsnitt 17.3% lägre än medianen
(±) | linjäriteten för basen är genomsnittlig (13.5% delta till föregående frekvens)
Mellan 400 - 2000 Hz
(±) | högre mellan - i genomsnitt 6.9% högre än median
(-) | mids är inte linjära (16.5% delta till föregående frekvens)
Högsta 2 - 16 kHz
(+) | balanserade toppar - endast 3.8% från medianen
(±) | linjäriteten för toppar är genomsnittlig (9.8% delta till föregående frekvens)
Totalt 100 - 16 000 Hz
(-) | det totala ljudet är inte linjärt (31.4% skillnad mot median)
Jämfört med samma klass
» 97% av alla testade enheter i den här klassen var bättre, 1% liknande, 2% sämre
» Den bästa hade ett delta på 6%, genomsnittet var 18%, sämst var 132%
Jämfört med alla testade enheter
» 90% av alla testade enheter var bättre, 2% liknande, 8% sämre
» Den bästa hade ett delta på 4%, genomsnittet var 24%, sämst var 134%
Apple MacBook 12 (Early 2016) 1.1 GHz ljudanalys
(+) | högtalare kan spela relativt högt (83.6 dB)
Bas 100 - 315 Hz
(±) | reducerad bas - i genomsnitt 11.3% lägre än medianen
(±) | linjäriteten för basen är genomsnittlig (14.2% delta till föregående frekvens)
Mellan 400 - 2000 Hz
(+) | balanserad mellan - endast 2.4% från medianen
(+) | mids är linjära (5.5% delta till föregående frekvens)
Högsta 2 - 16 kHz
(+) | balanserade toppar - endast 2% från medianen
(+) | toppar är linjära (4.5% delta till föregående frekvens)
Totalt 100 - 16 000 Hz
(+) | det totala ljudet är linjärt (10.2% skillnad mot median)
Jämfört med samma klass
» 7% av alla testade enheter i den här klassen var bättre, 2% liknande, 91% sämre
» Den bästa hade ett delta på 5%, genomsnittet var 18%, sämst var 53%
Jämfört med alla testade enheter
» 5% av alla testade enheter var bättre, 1% liknande, 94% sämre
» Den bästa hade ett delta på 4%, genomsnittet var 24%, sämst var 134%
| Av/Standby | |
| Låg belastning | |
| Hög belastning |
|
Förklaring:
min: | |
| MSI GF75 8RD-001 i7-8750H, GeForce GTX 1050 Ti Max-Q, Kingston RBUSNS8154P3256GJ1, IPS, 1920x1080, 17.3" | Asus TUF FX705GE-EW096T i7-8750H, GeForce GTX 1050 Ti Mobile, SK hynix BC501 HFM128GDJTNG-831, IPS, 1920x1080, 17.3" | Lenovo Legion Y730-17ICH, i7-8750H i7-8750H, GeForce GTX 1050 Ti Mobile, Toshiba KBG30ZMT128G, IPS, 1920x1080, 17.3" | Medion Erazer P6705-MD61131 i7-8750H, GeForce GTX 1050 Ti Mobile, Samsung SSD PM981 MZVLB256HAHQ, TN, 1920x1080, 15.6" | HP Pavilion Gaming 15-cx0003ng i7-8750H, GeForce GTX 1050 Ti Mobile, Intel Optane 16 GB MEMPEK1J016GAH + HGST HTS721010A9E630 1 TB HDD, IPS, 1920x1080, 15.6" | Acer Aspire 7 A715-72G-704Q i7-8750H, GeForce GTX 1050 Ti Mobile, Intel SSD 760p SSDPEKKW256G8, IPS, 1920x1080, 15.6" | Genomsnitt NVIDIA GeForce GTX 1050 Ti Max-Q | Genomsnitt av klass Gaming | |
|---|---|---|---|---|---|---|---|---|
| Power Consumption | 15% | 4% | 18% | 7% | 23% | 4% | -74% | |
| Idle Minimum * (Watt) | 6.5 | 3.8 42% | 6.3 3% | 4 38% | 5.5 15% | 3.9 40% | 5.8 ? 11% | 13.3 ? -105% |
| Idle Average * (Watt) | 11.9 | 9 24% | 11 8% | 7 41% | 8.5 29% | 6.6 45% | 11.2 ? 6% | 19 ? -60% |
| Idle Maximum * (Watt) | 13.1 | 11.2 15% | 11.5 12% | 11 16% | 11.9 9% | 8.5 35% | 13.5 ? -3% | 24.5 ? -87% |
| Load Average * (Watt) | 86 | 101 -17% | 89.8 -4% | 72 16% | 94 -9% | 89 -3% | 86.9 ? -1% | 108.1 ? -26% |
| Load Maximum * (Watt) | 131 | 119.7 9% | 130.7 -0% | 158 -21% | 144 -10% | 134 -2% | 122.4 ? 7% | 254 ? -94% |
| Witcher 3 ultra * (Watt) | 102 | 79 | 86 |
* ... mindre är bättre
| MSI GF75 8RD-001 i7-8750H, GeForce GTX 1050 Ti Max-Q, 51 Wh | Lenovo ThinkPad X1 Extreme-20MF000XGE i7-8750H, GeForce GTX 1050 Ti Max-Q, 80 Wh | HP Spectre x360 15-df0126ng i7-8750H, GeForce GTX 1050 Ti Max-Q, 84 Wh | Acer Aspire 7 A715-72G-704Q i7-8750H, GeForce GTX 1050 Ti Mobile, 48.9 Wh | Asus Zephyrus S GX531GX i7-8750H, GeForce RTX 2080 Max-Q, 50 Wh | Medion Erazer P6705-MD61131 i7-8750H, GeForce GTX 1050 Ti Mobile, 62 Wh | Genomsnitt av klass Gaming | |
|---|---|---|---|---|---|---|---|
| Batteridrifttid | 71% | 130% | 54% | -36% | 70% | 66% | |
| Reader / Idle (h) | 6.3 | 11.5 83% | 18.8 198% | 12.3 95% | 8.9 41% | 8.71 ? 38% | |
| H.264 (h) | 3.4 | 6.2 82% | 7.7 126% | 6 76% | 8.26 ? 143% | ||
| WiFi v1.3 (h) | 4.7 | 6.4 36% | 8.8 87% | 6.4 36% | 3 -36% | 6.7 43% | 7.01 ? 49% |
| Load (h) | 1.1 | 2 82% | 2.3 109% | 1.2 9% | 2.5 127% | 1.47 ? 34% | |
| Witcher 3 ultra (h) | 1.1 |
För
Emot
Läs den fullständiga versionen av den här recensionen på engelska här.
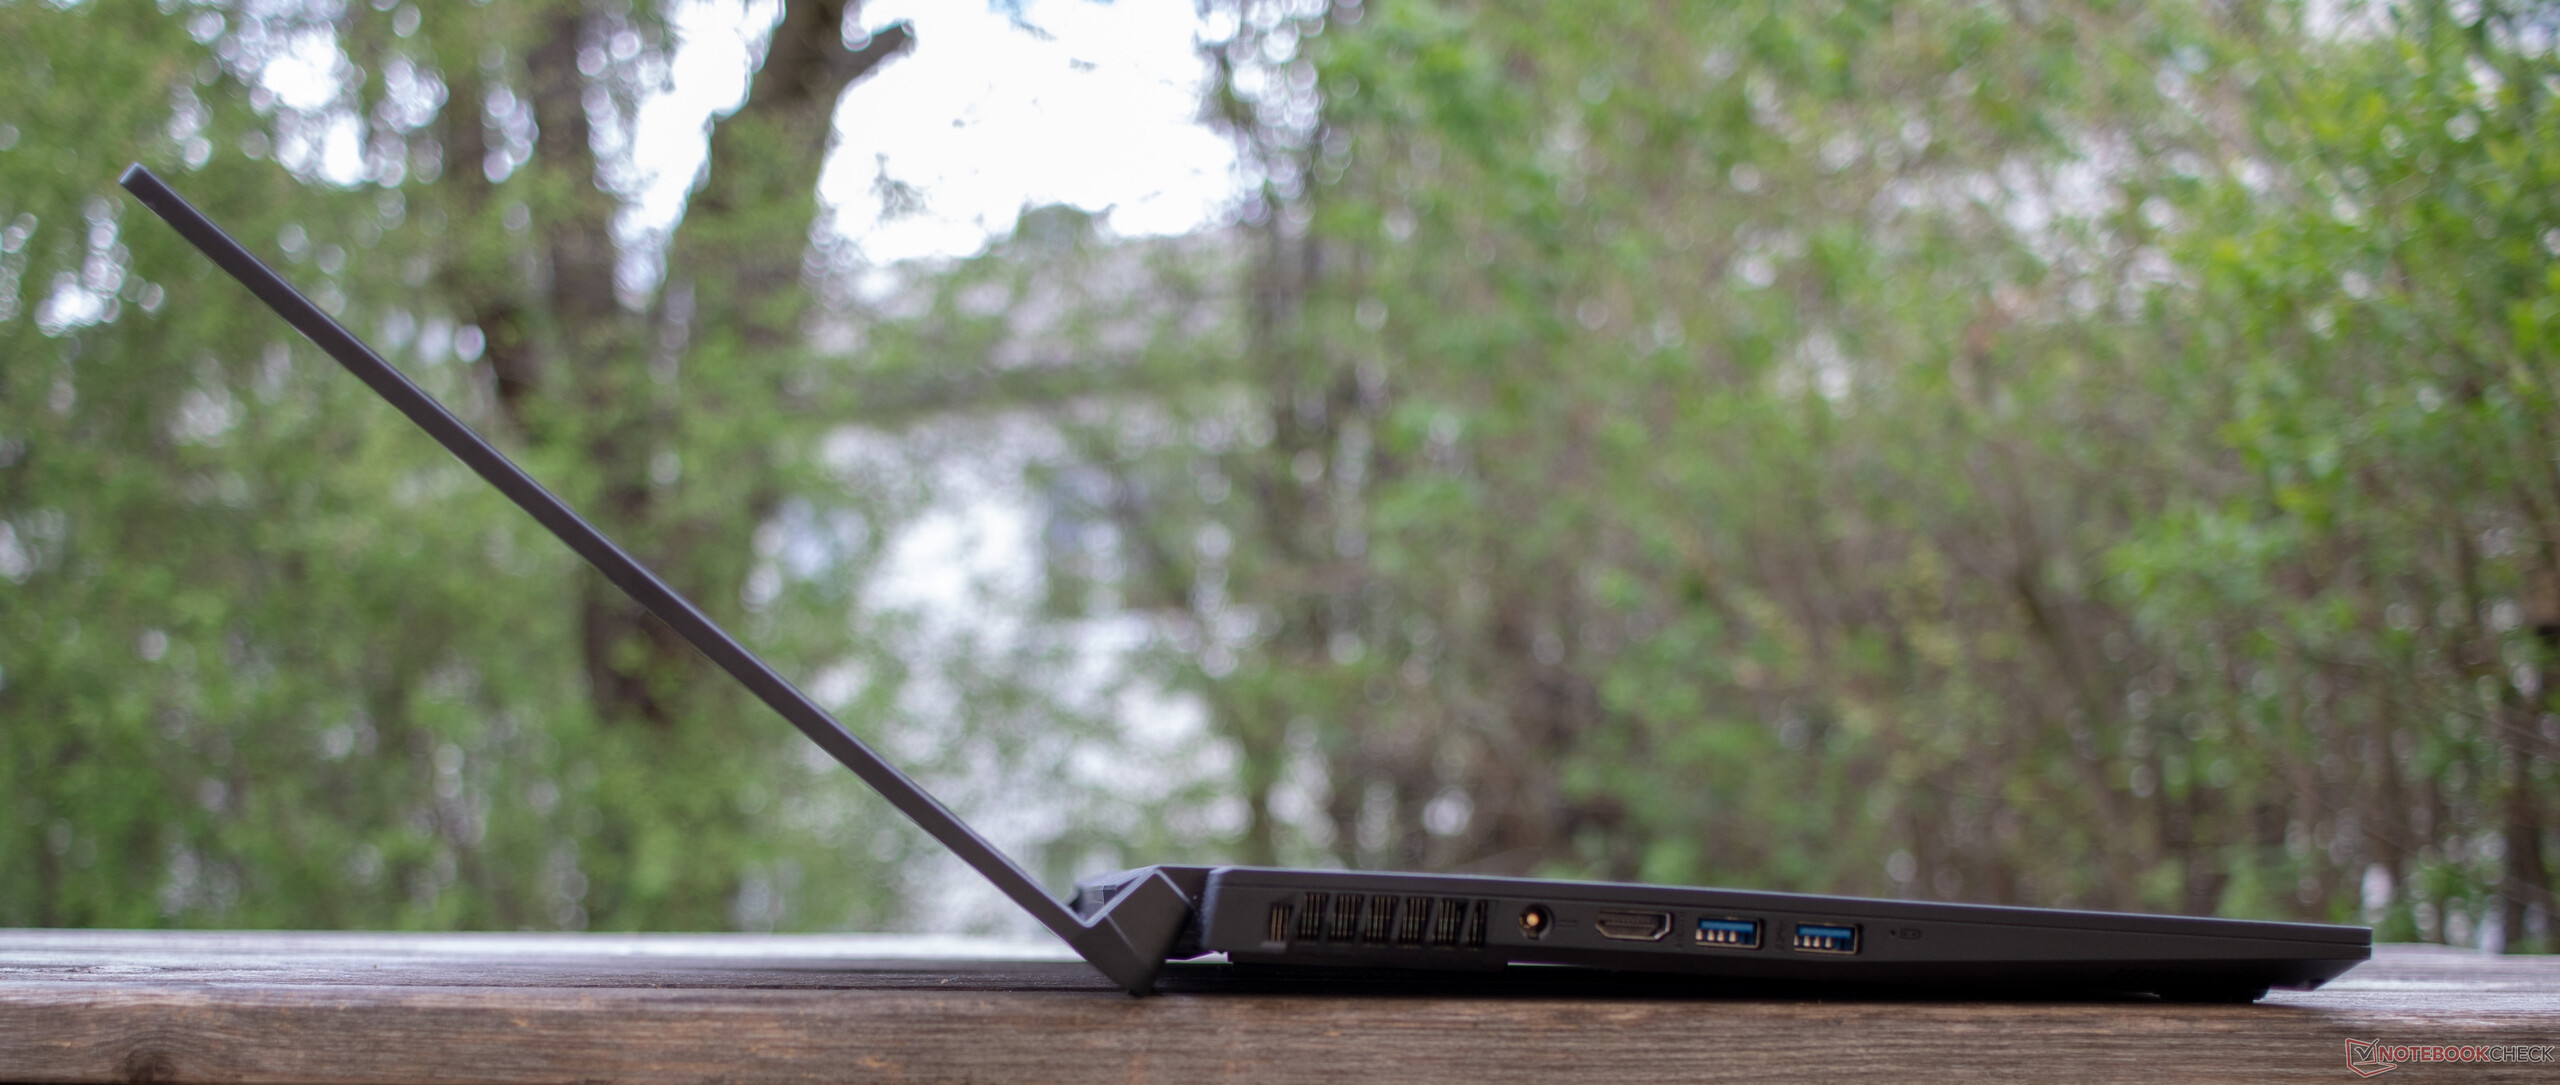
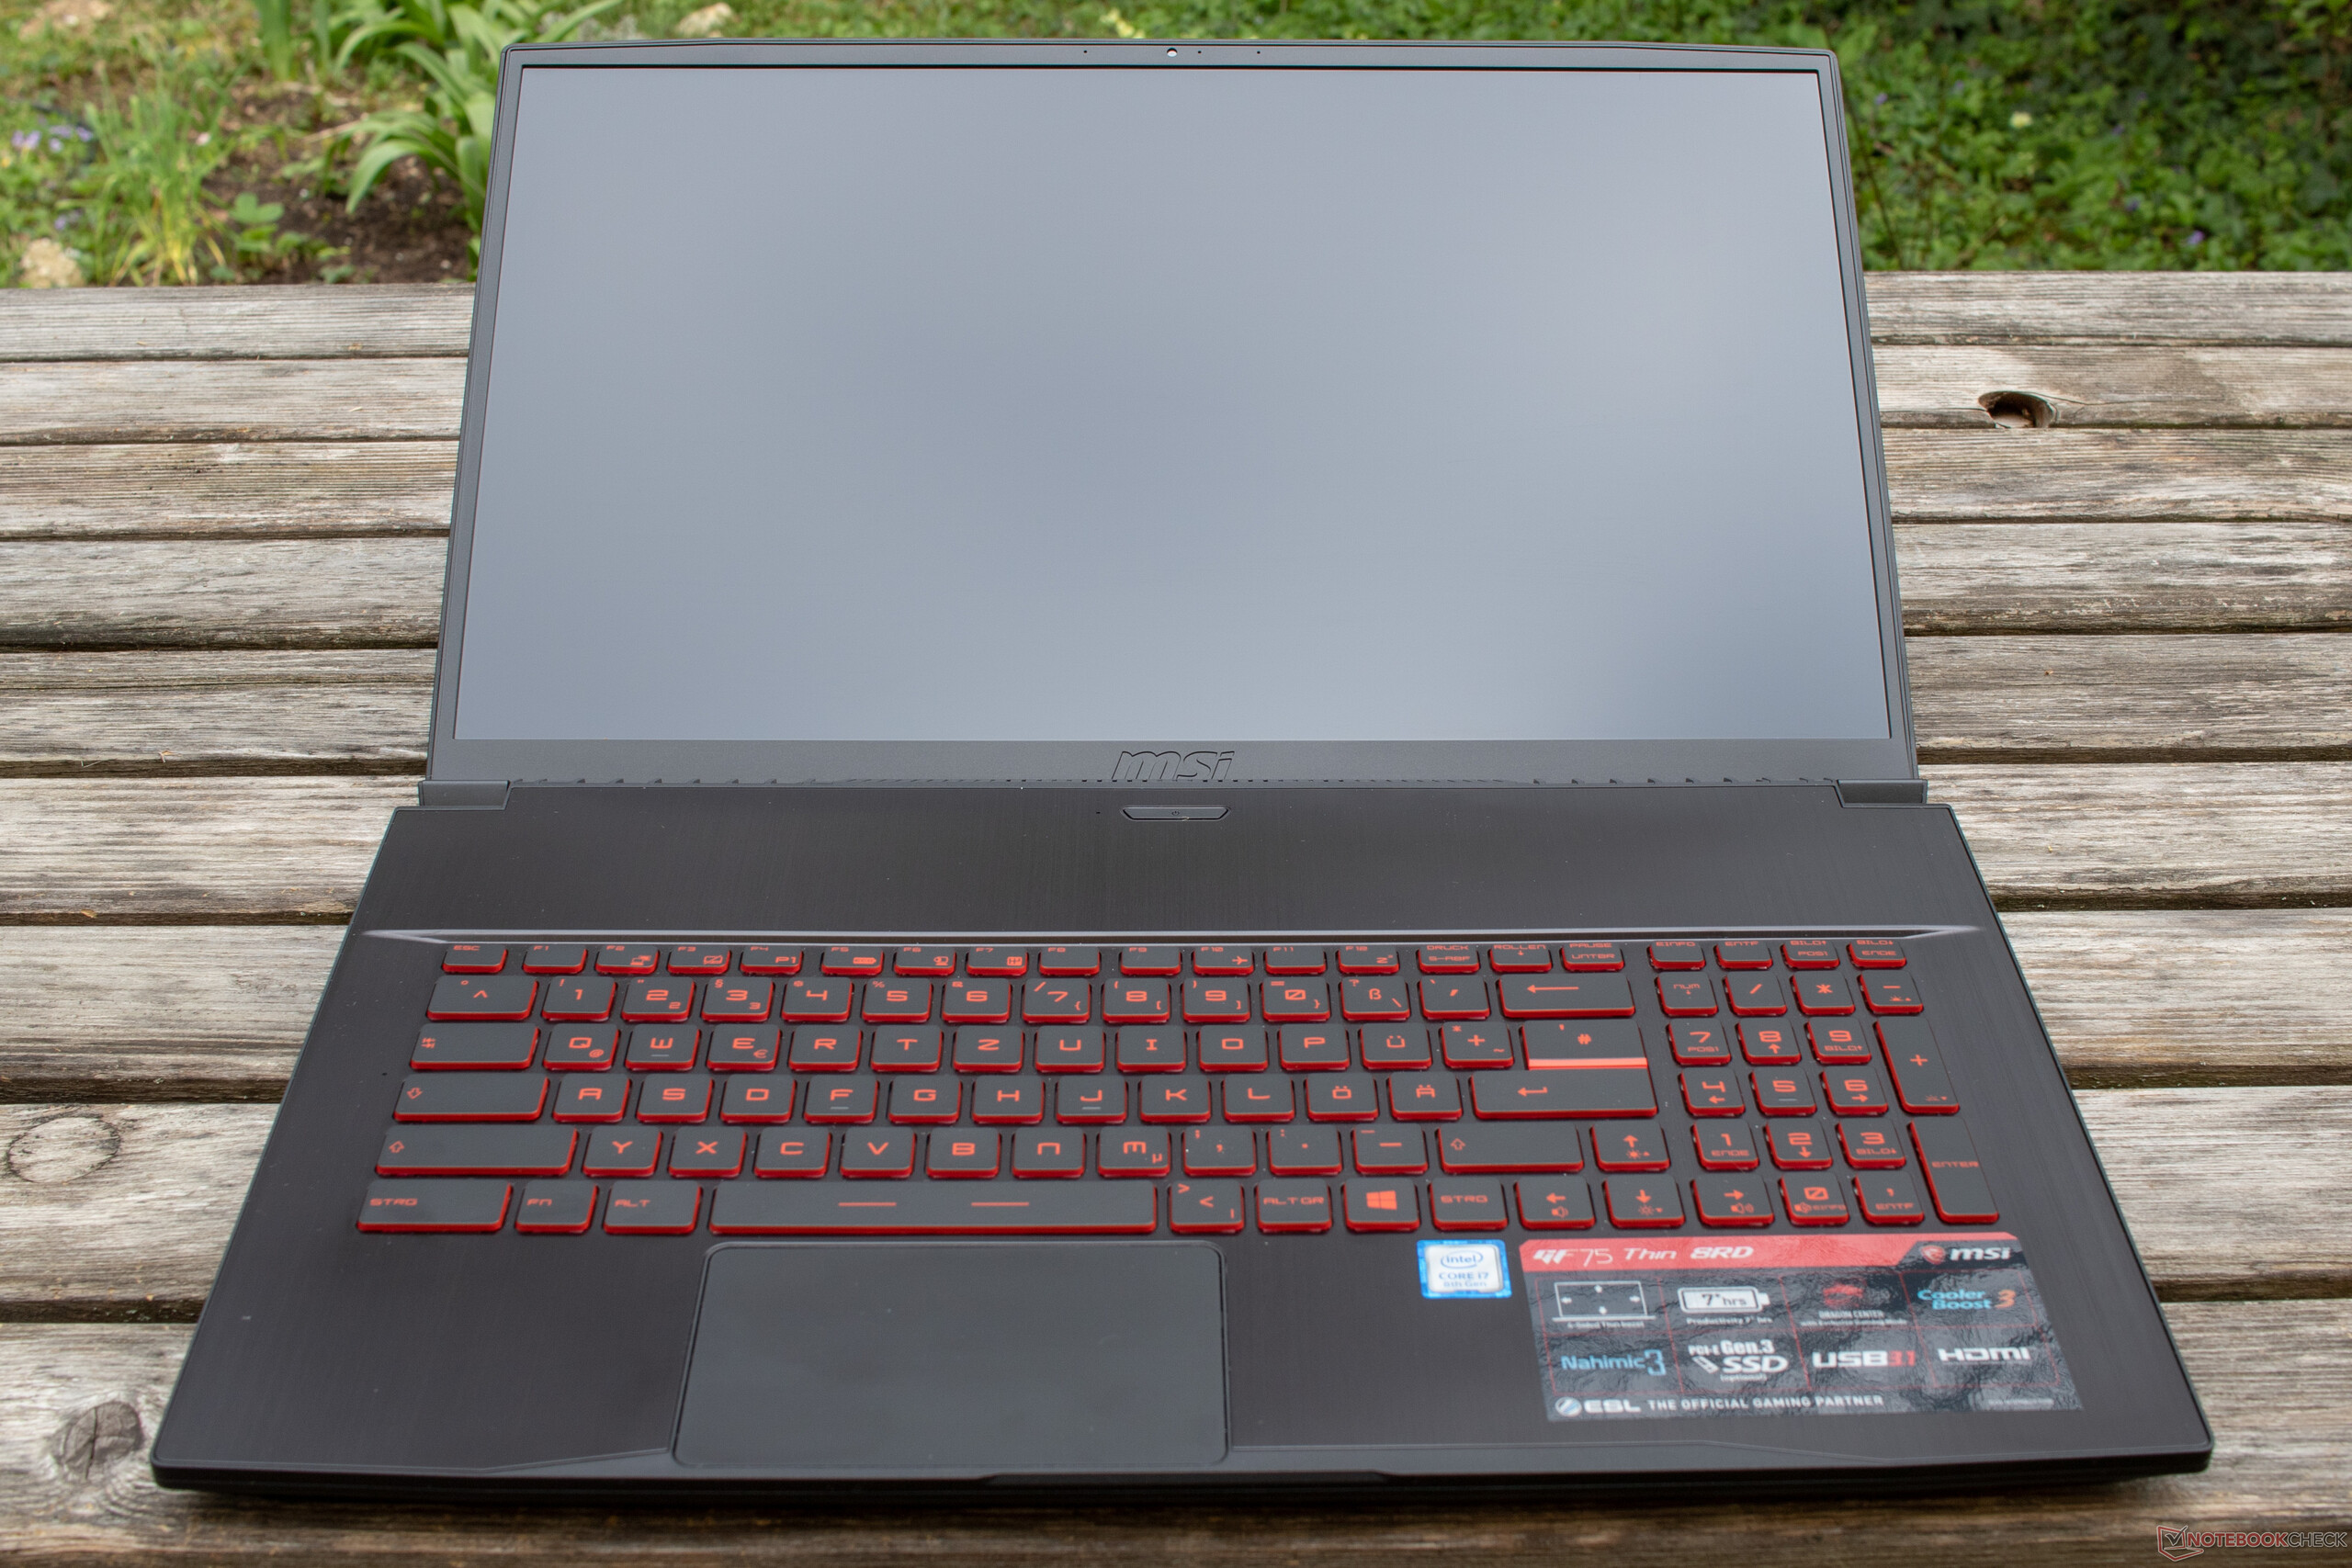
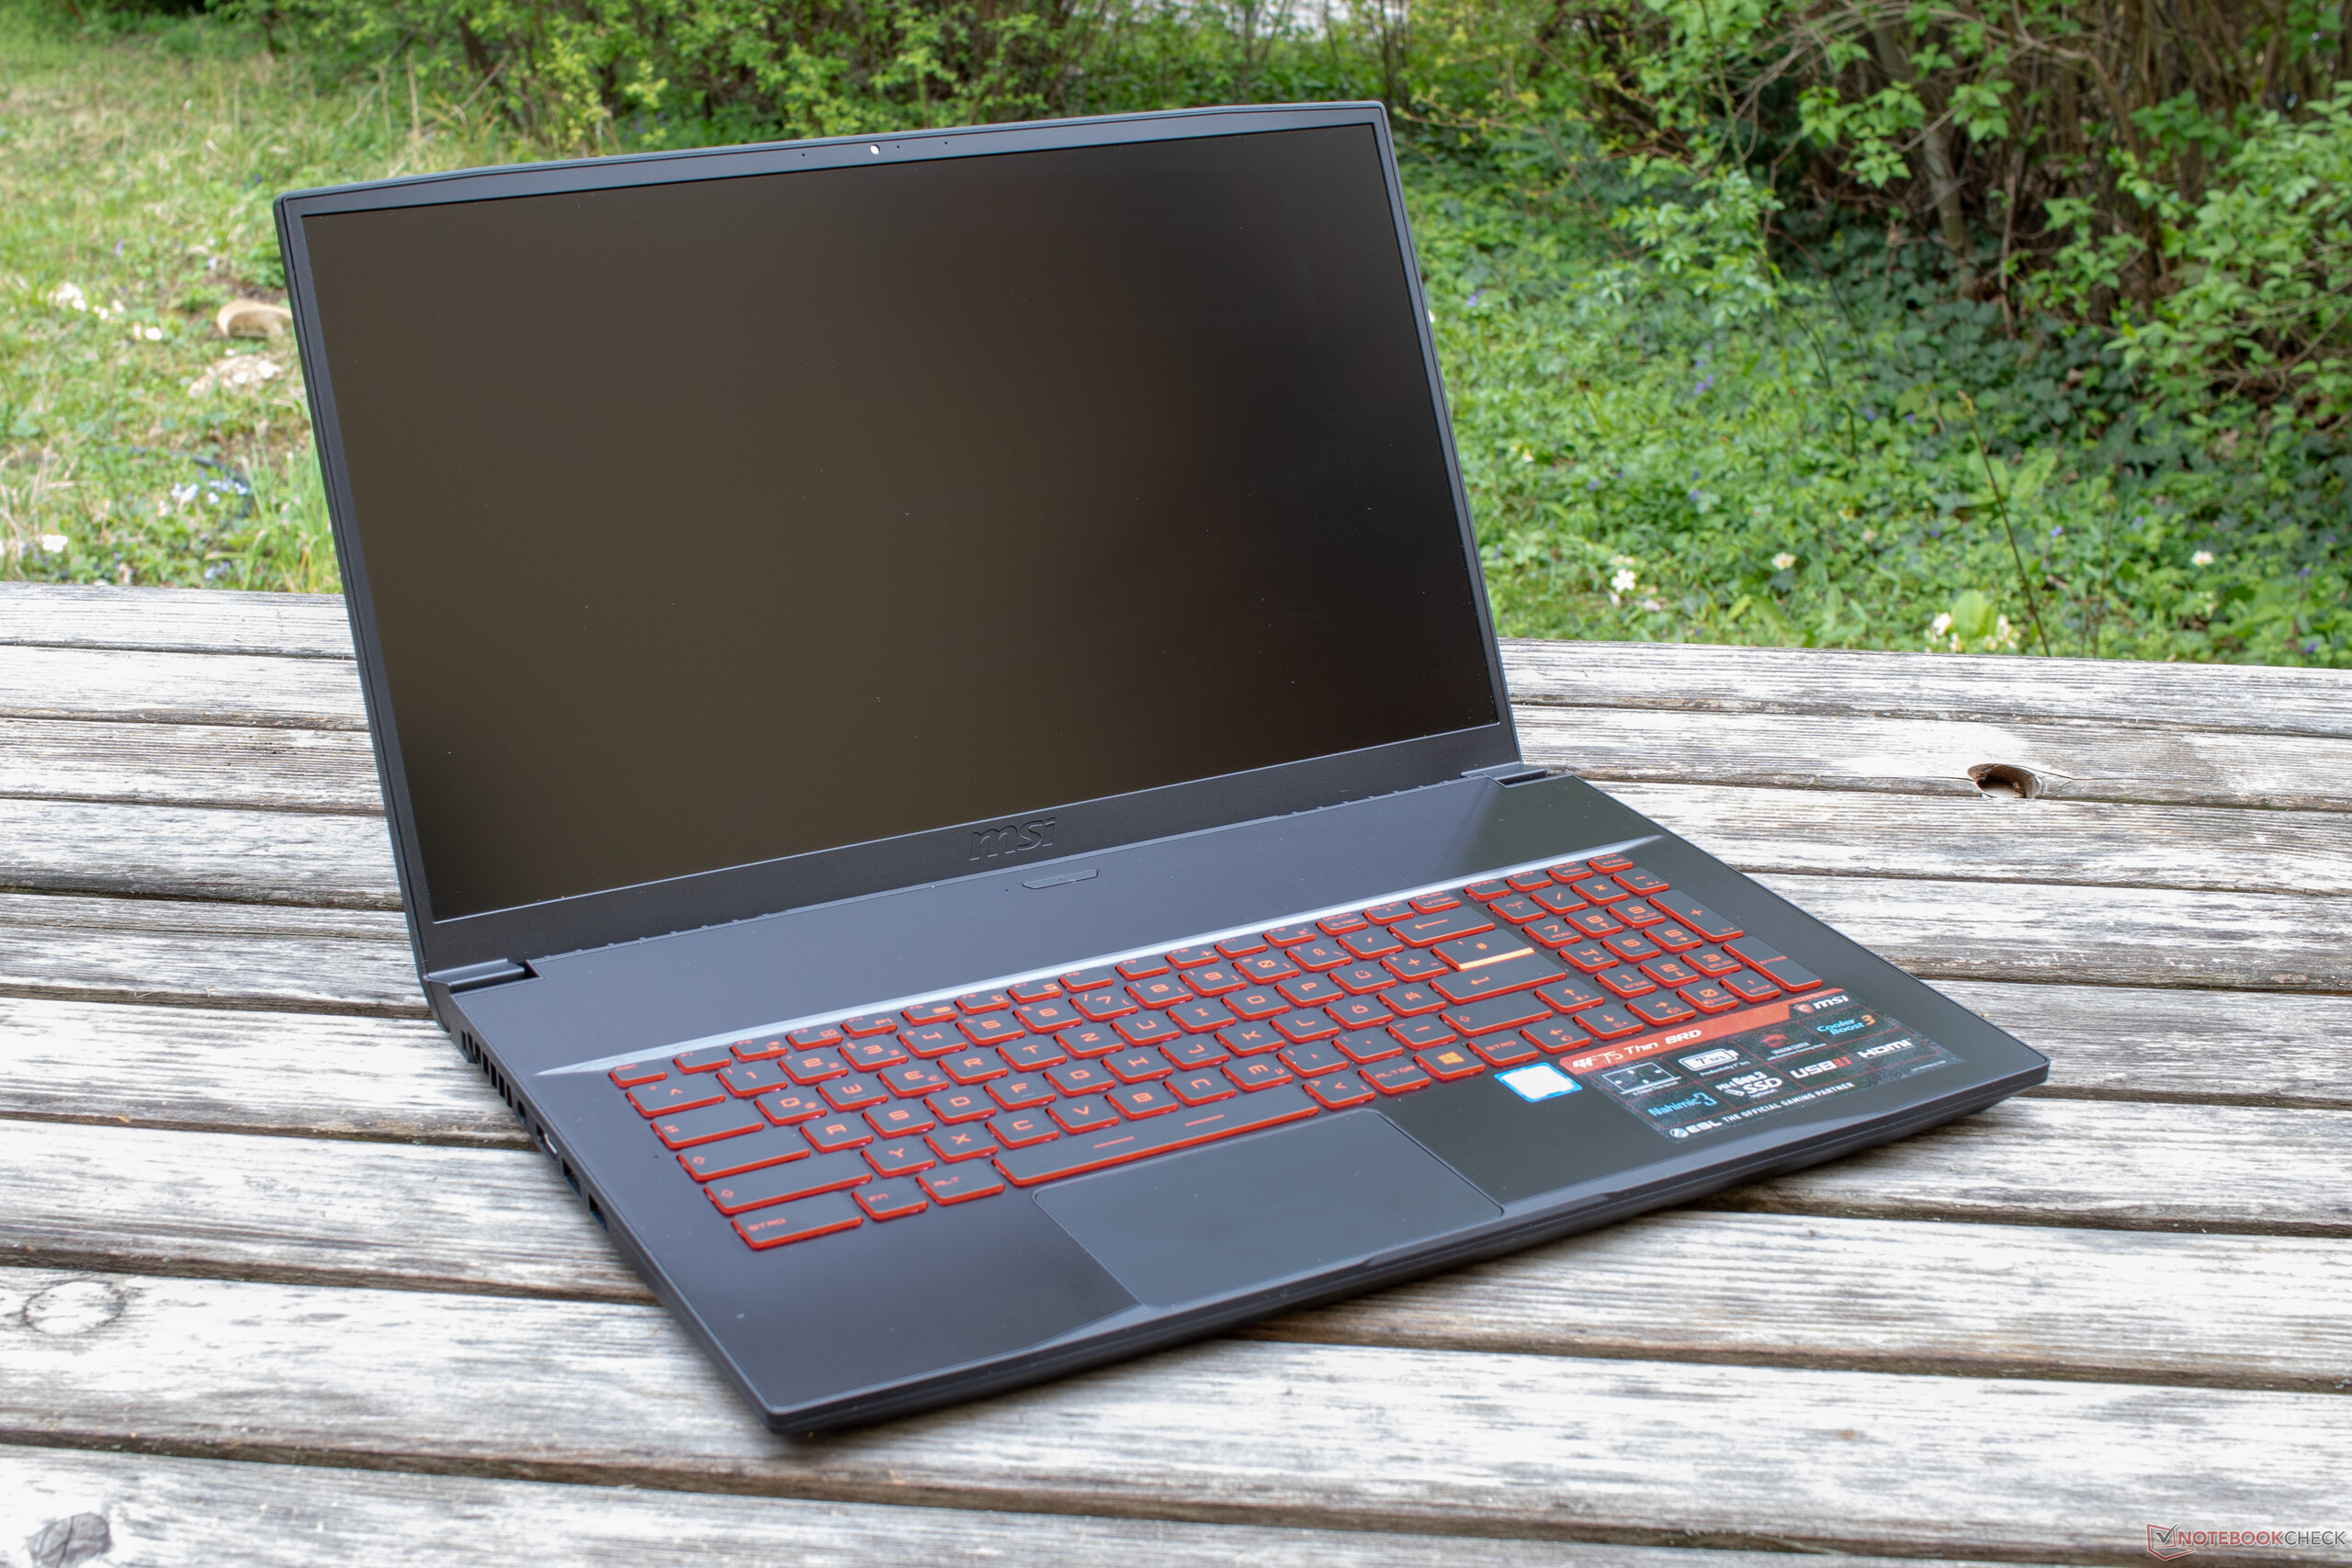
MSI har med GF75 försökt att fokusera på det nödvändiga och har lyckats skapa en hyfsad enhet. Den har tillräckligt med prestanda för att räknas som en spellaptop samtidigt som den har ett tunt hölje och en lätt konstruktion. Även om energieffektiva GeForce 1050 Ti Max-Q, som har en aning justerad klockfrekvens, inte kommer att kunna hantera de senaste spelen med höga detaljnivåer så bör den kunna visa de flesta titlar smidigt på mediuminställningar.
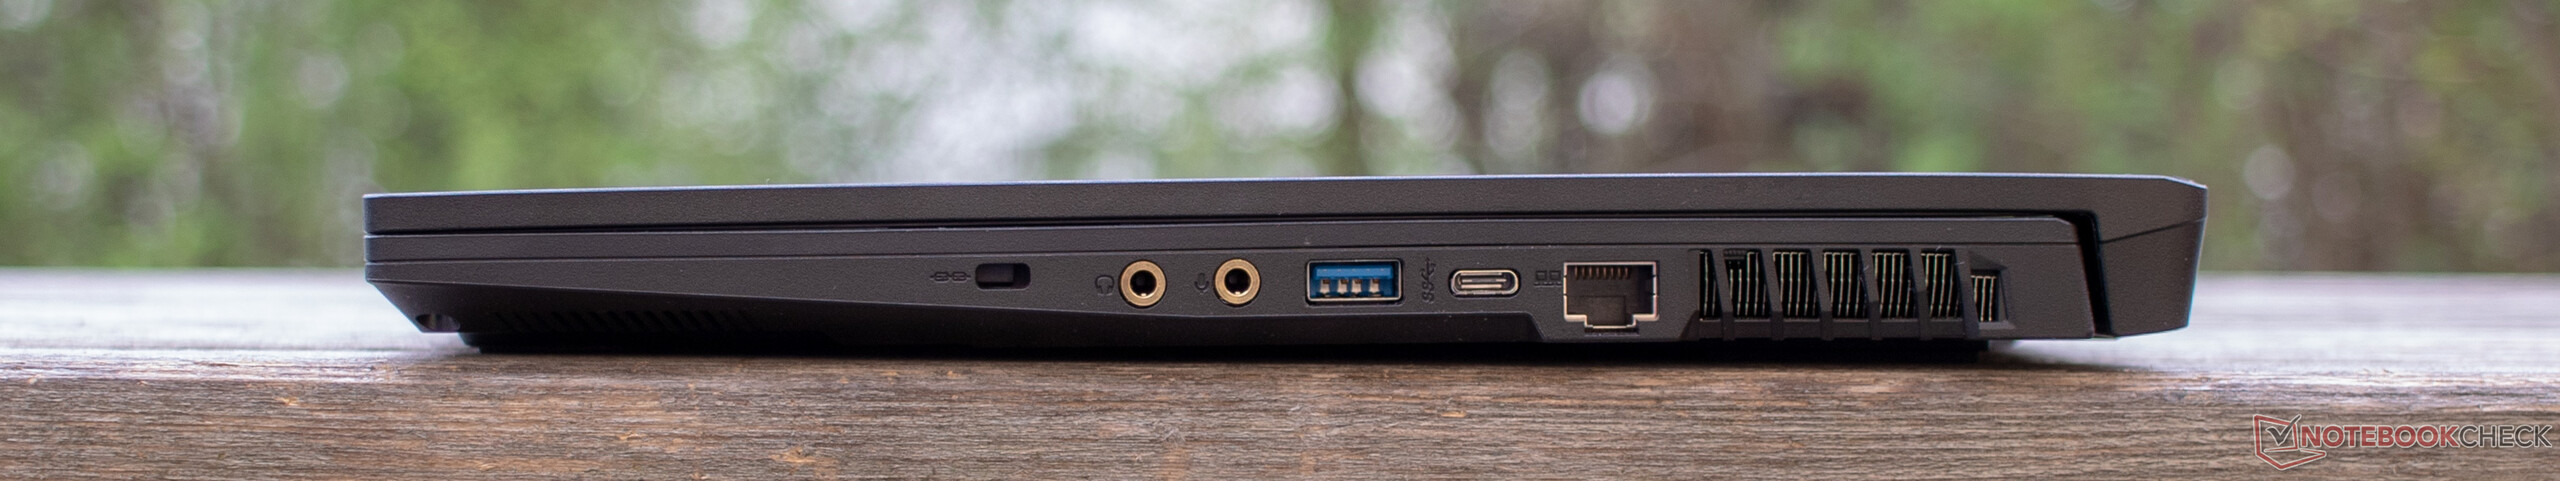
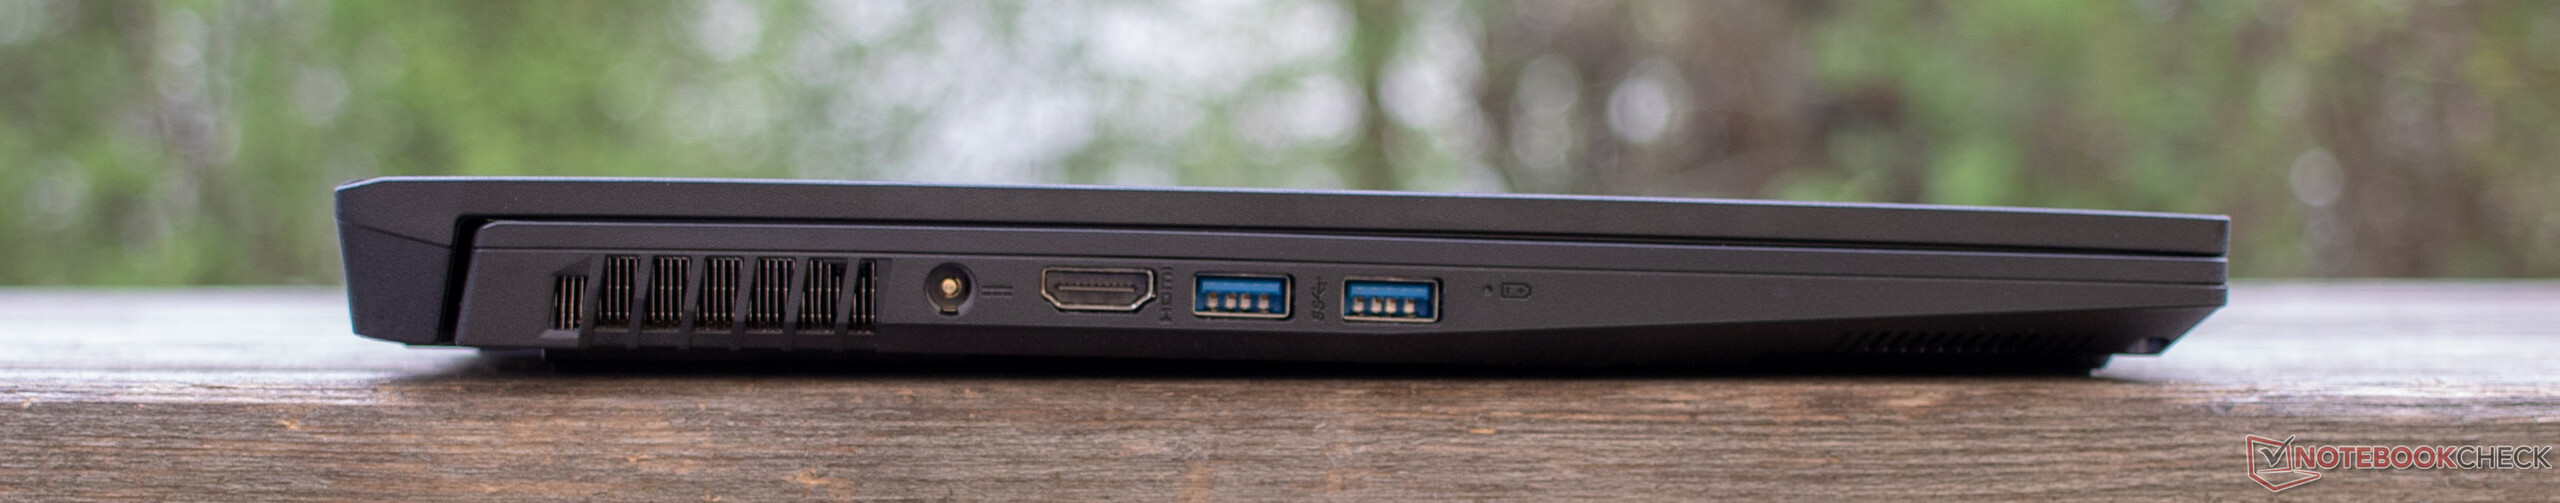
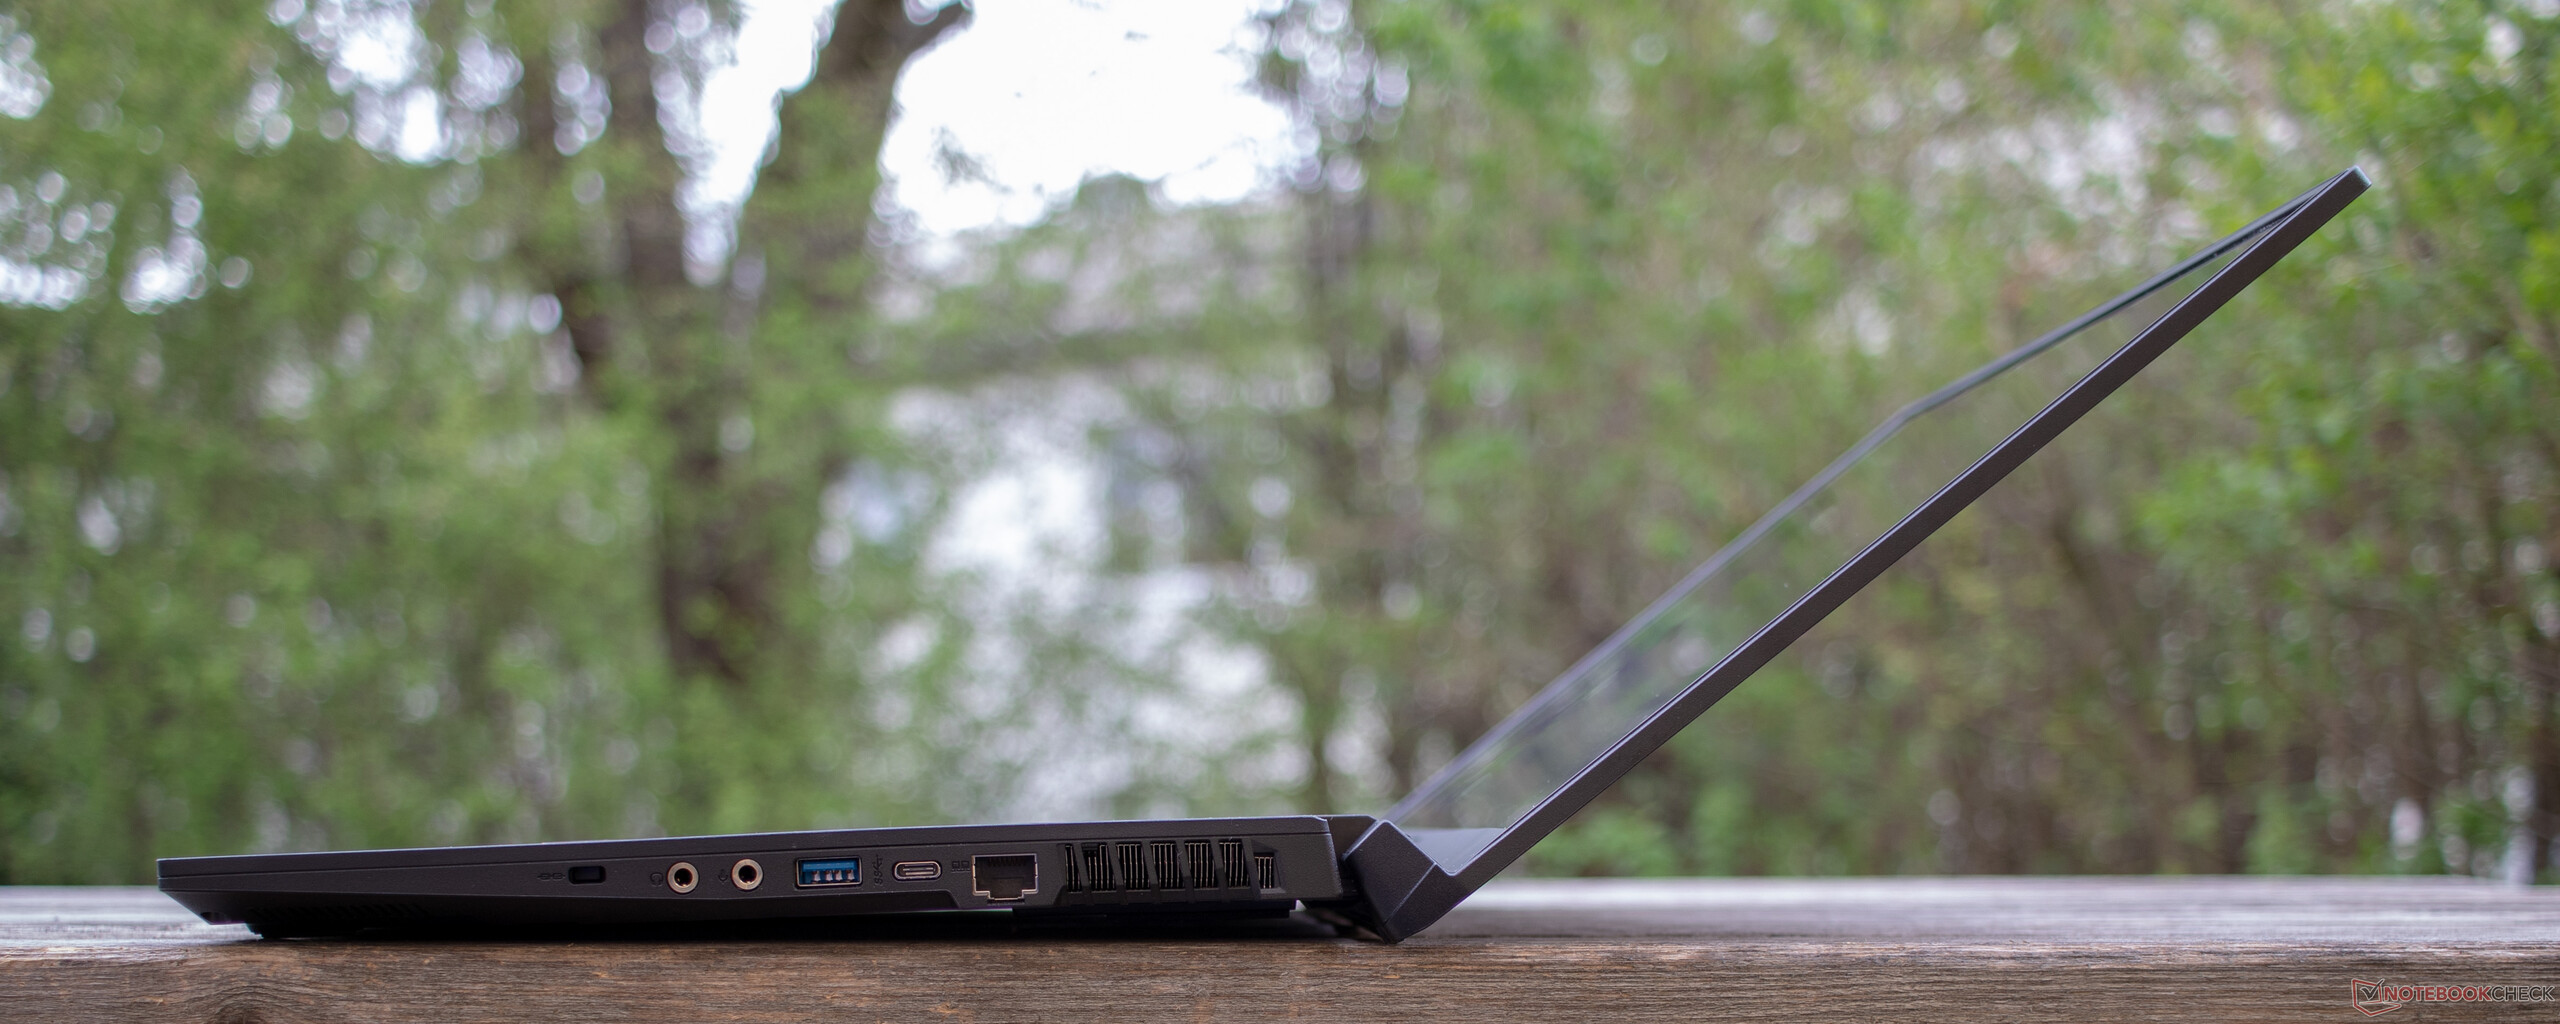
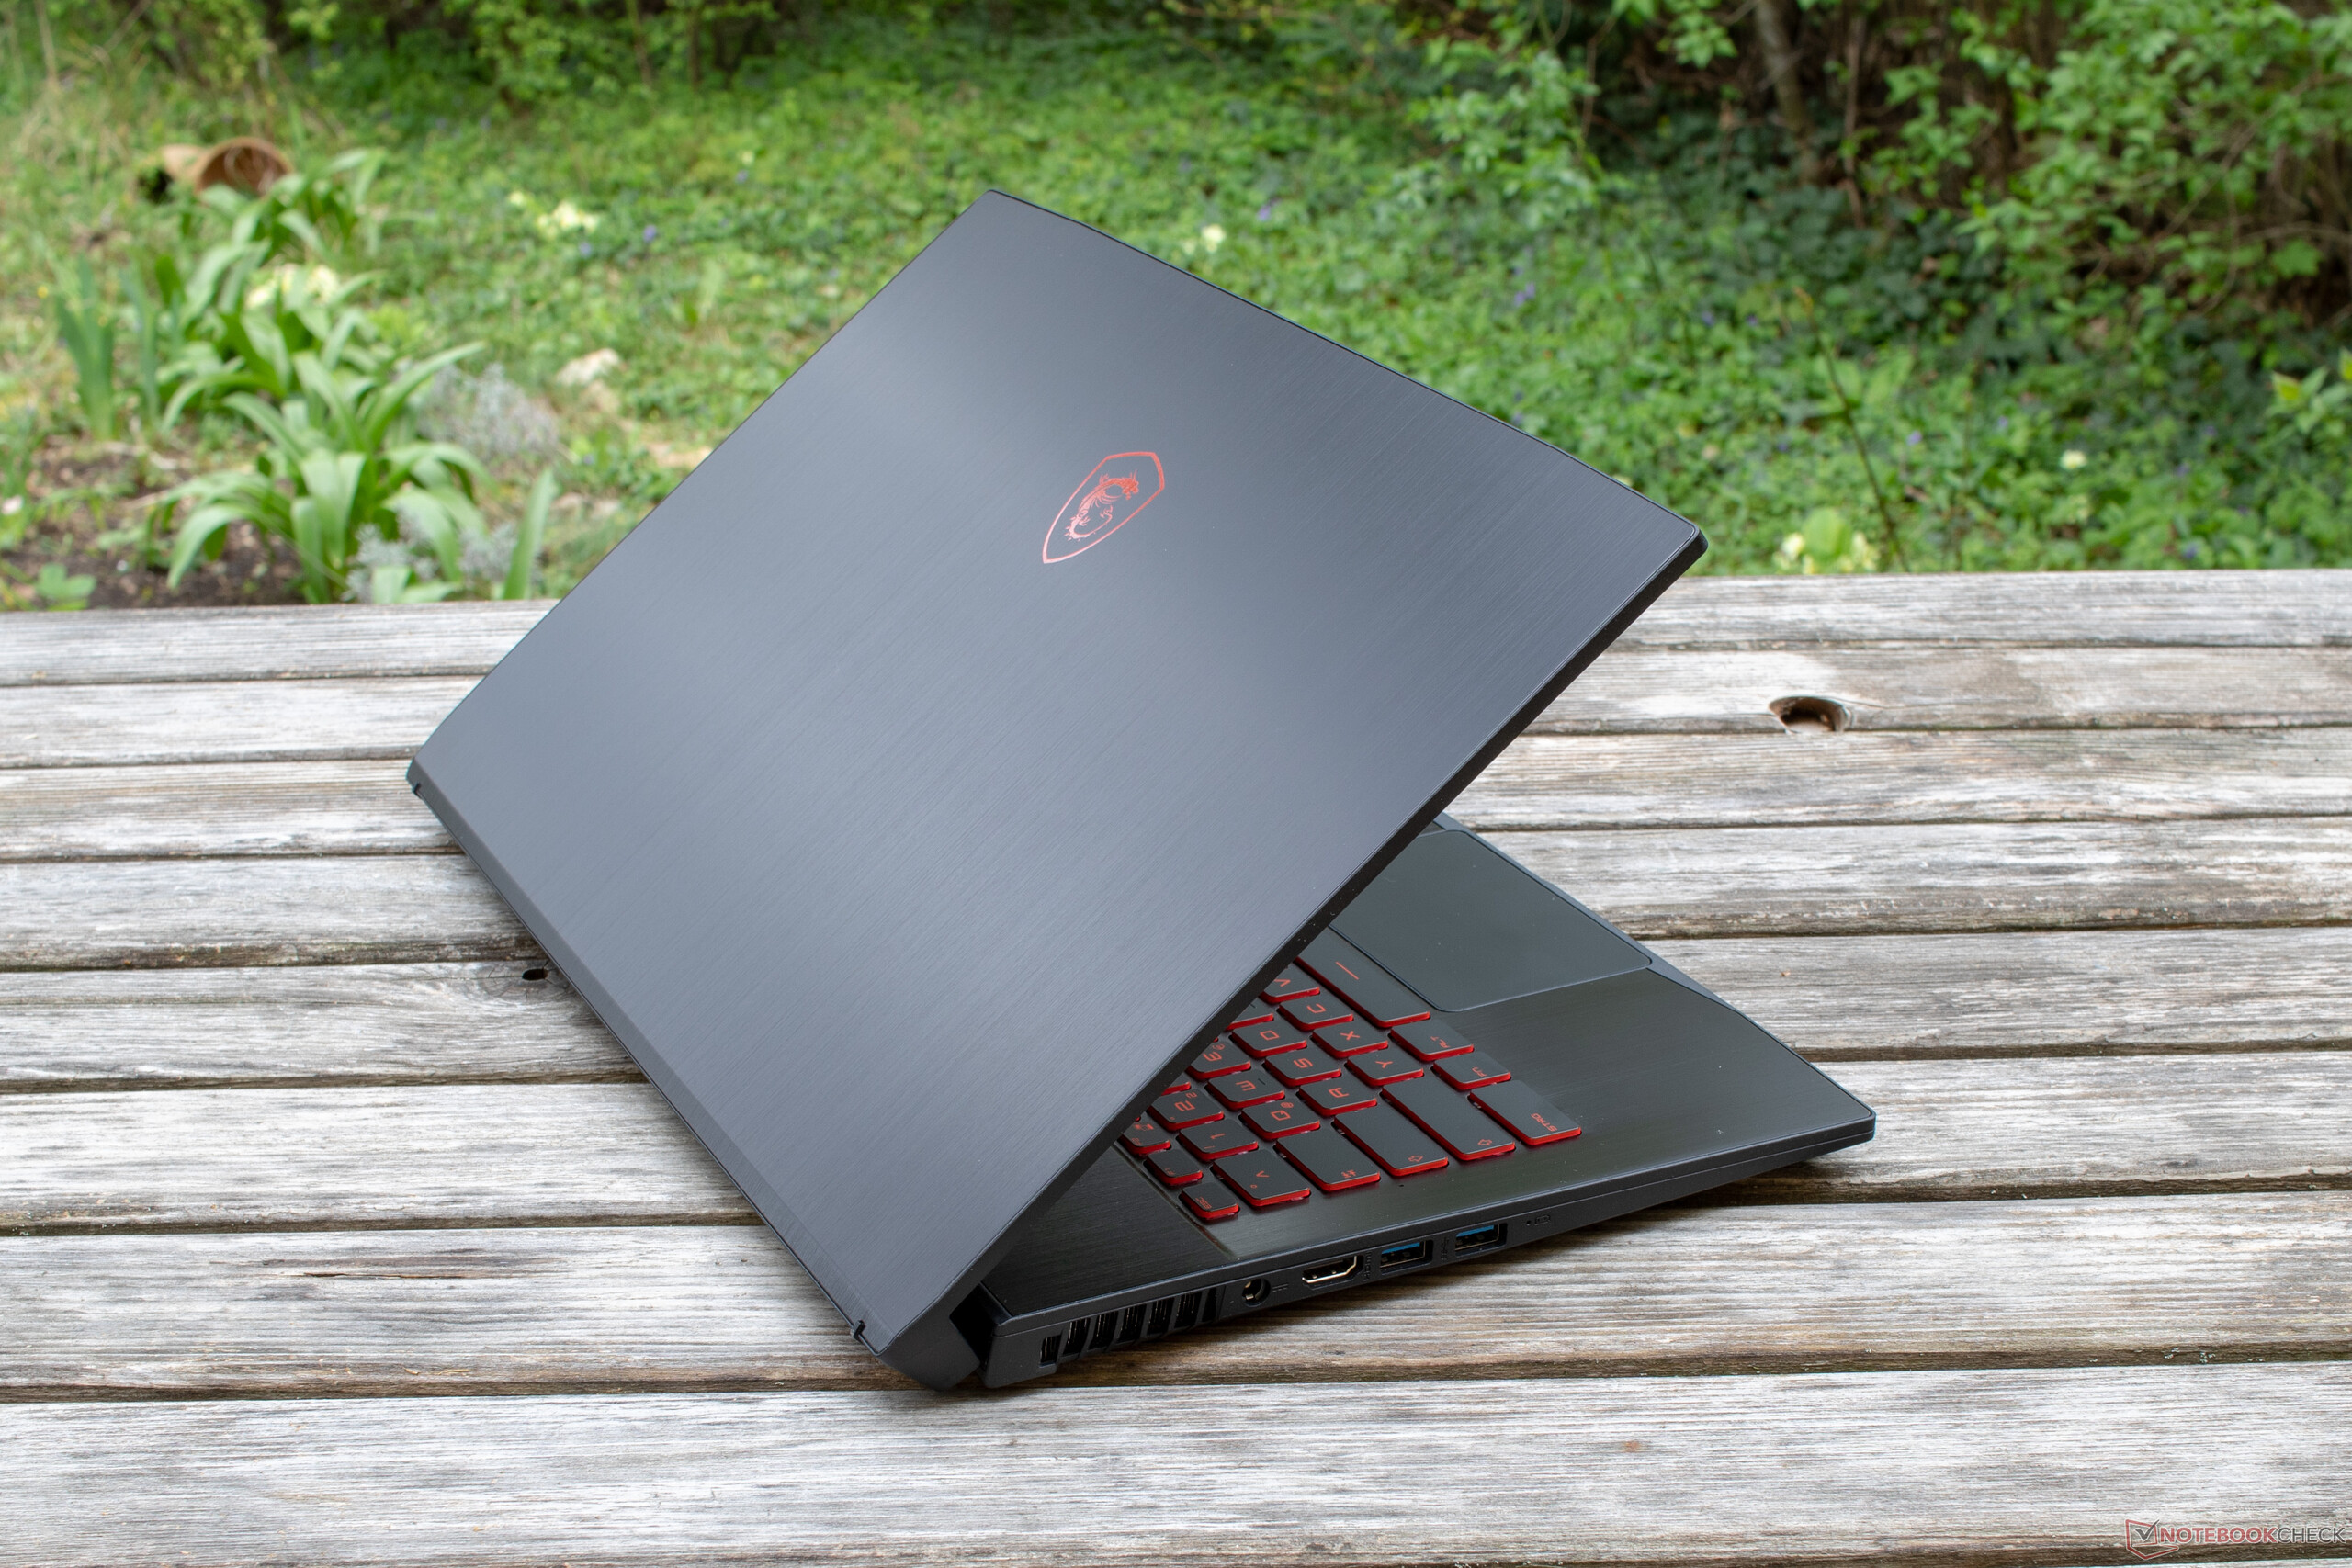
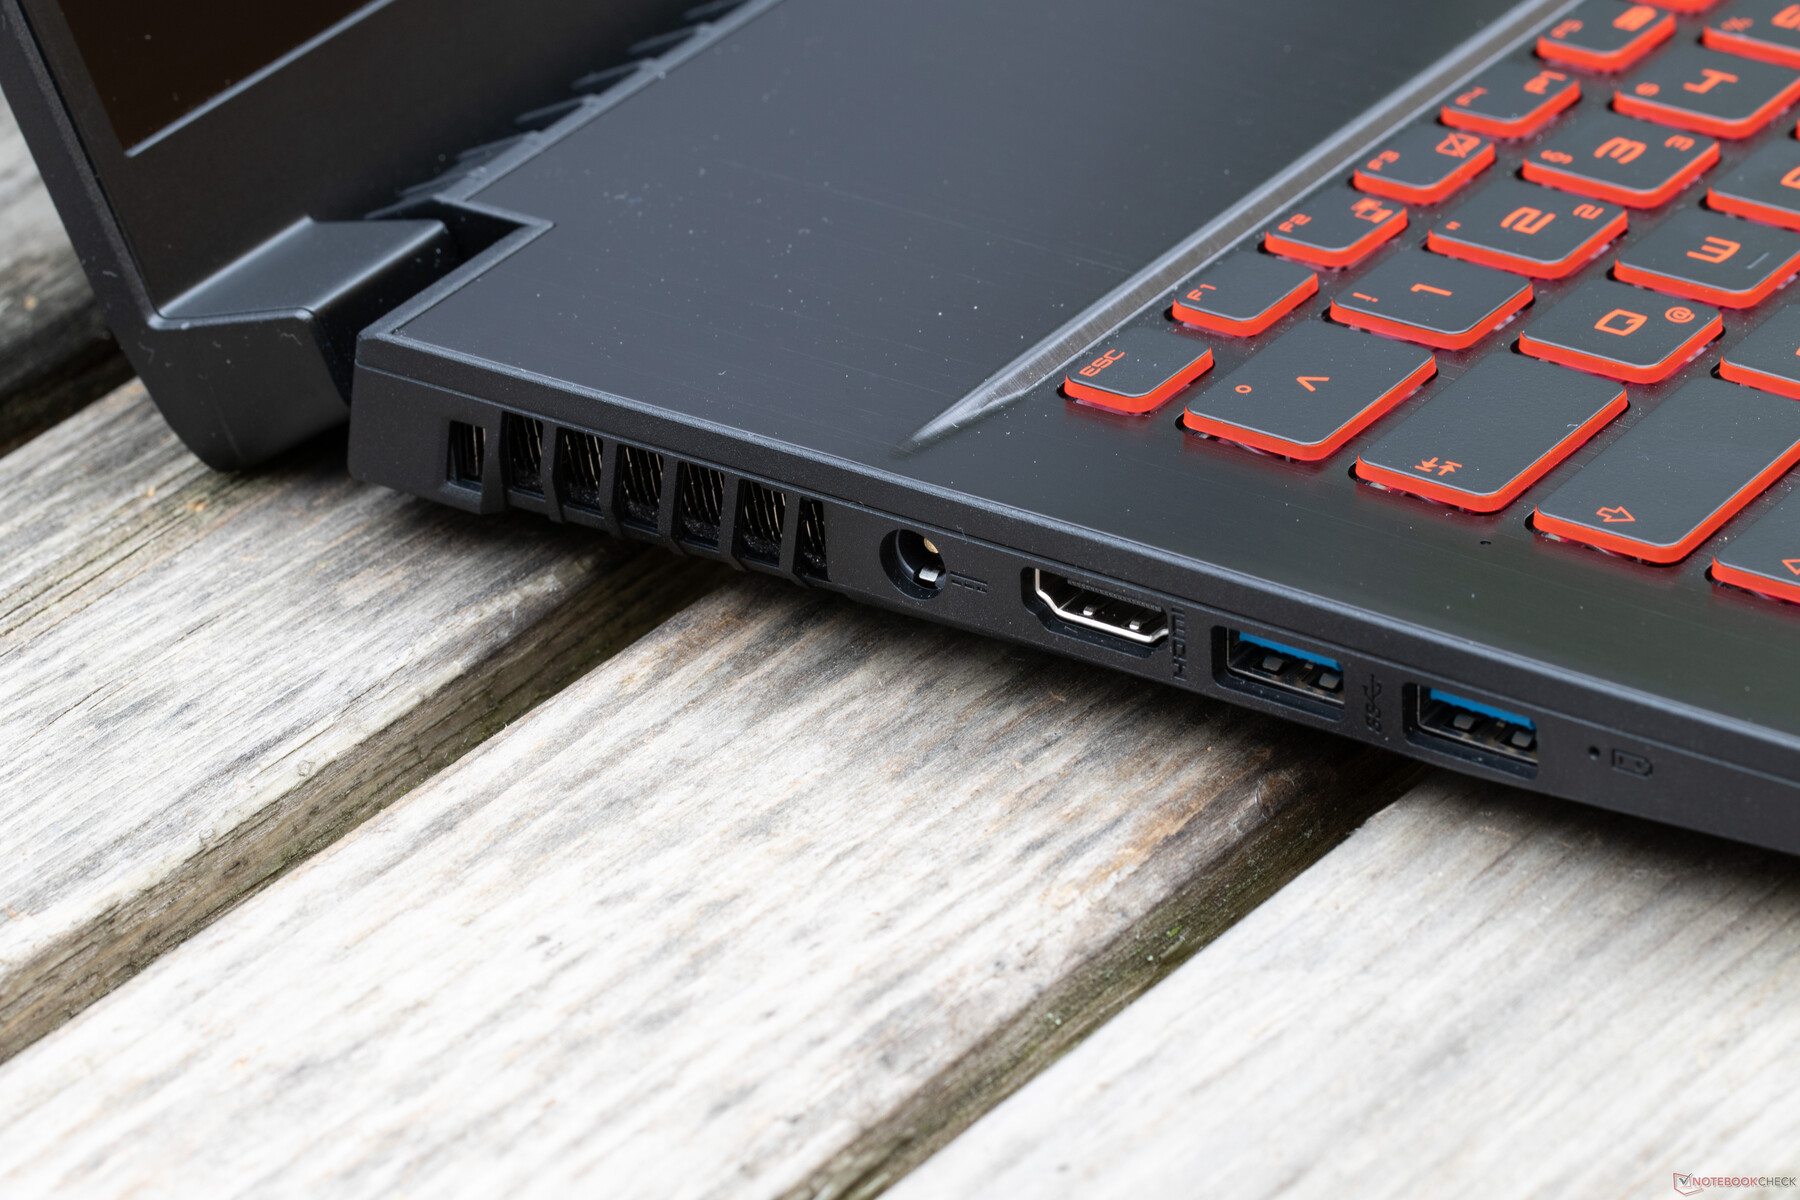
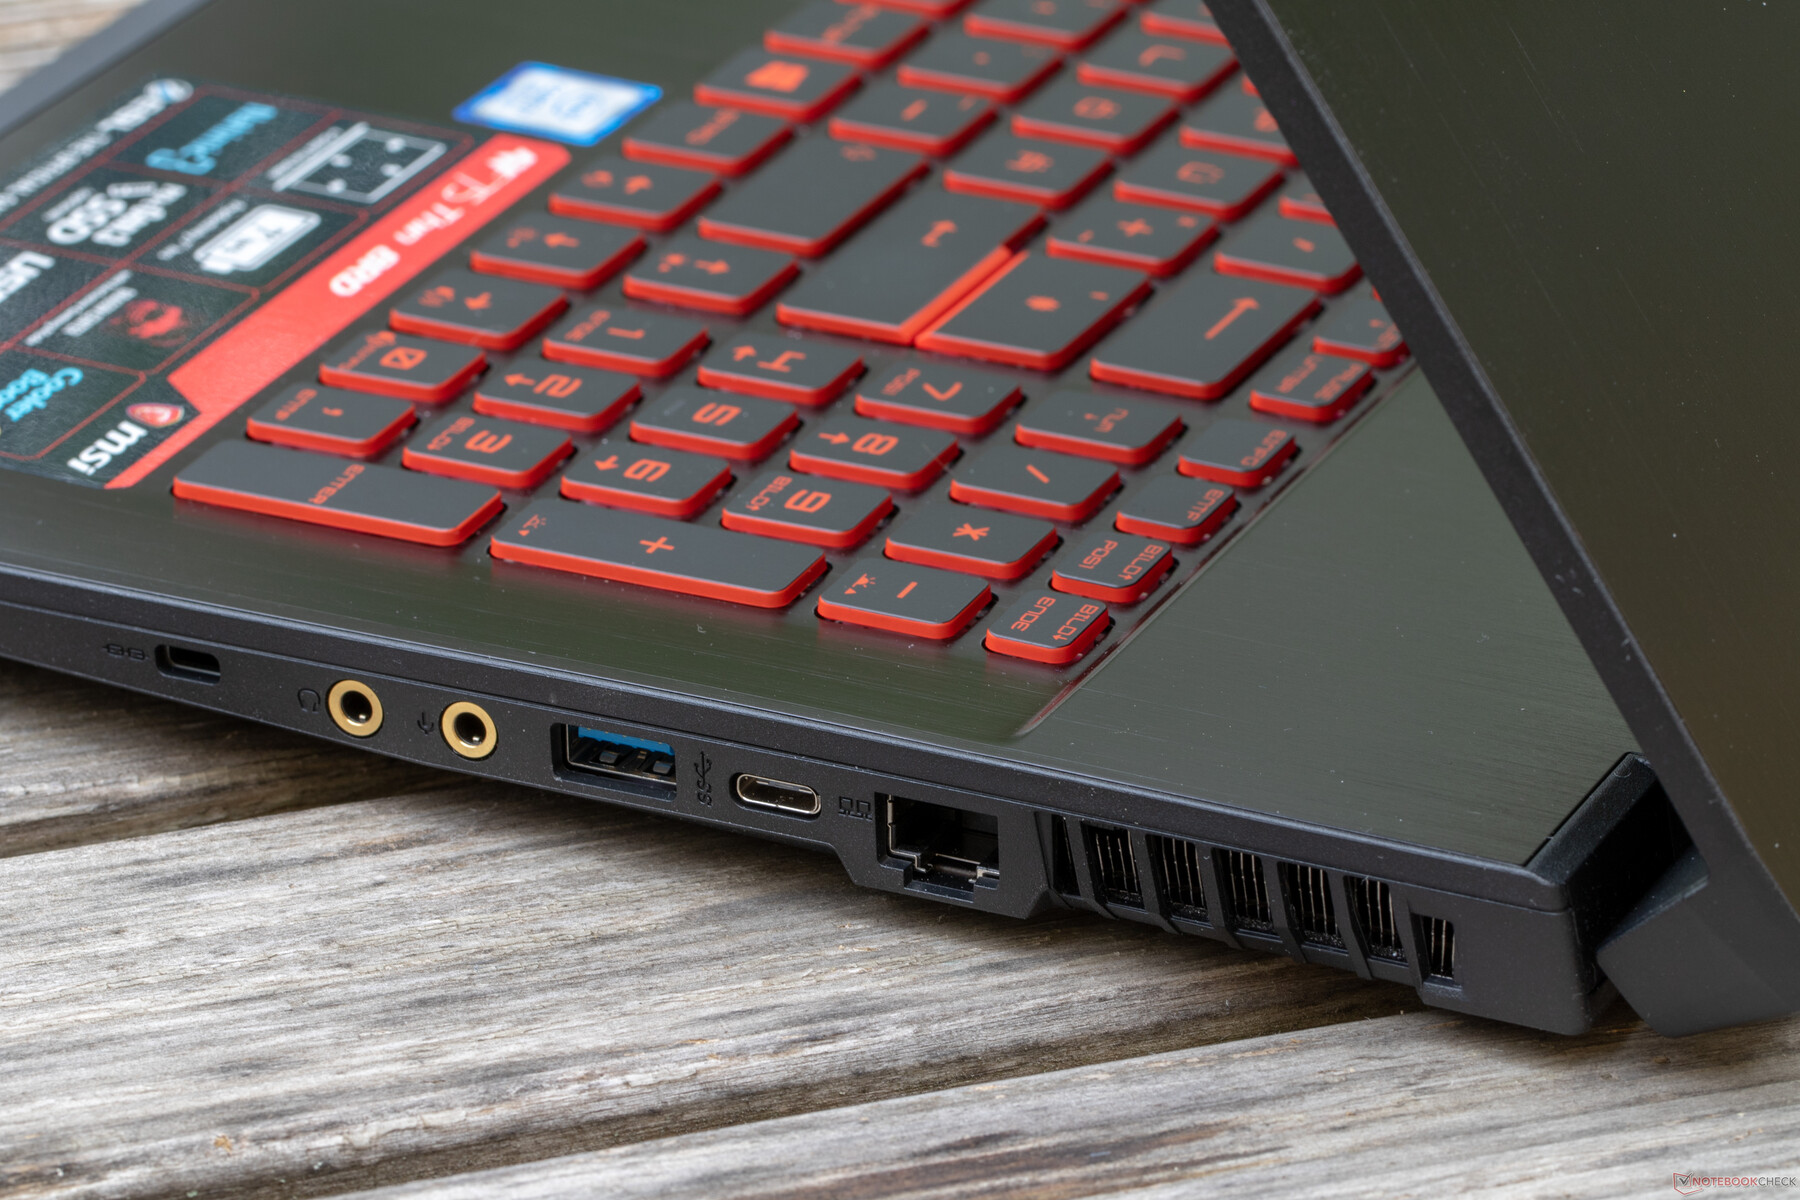
MSI har dock valt att hålla portutbudet på ett absolut minimum. Detta beror troligen på den tunna konstruktionen och för att man försökt hålla enhetens pris under en viss nivå.
Om du kan leva utan thunderbolt och en DisplayPort-anslutning och heller inte behöver en SD-kortläsare eller särskilda säkerhetsfunktioner som fingeravtrycksläsare så kan du bli riktigt nöjd med denna billiga enhet som dessutom innehåller ett GTX 1050 Ti Max-Q.
IPS-skärmen är riktigt bra och kan lätt hålla jämna steg med GF75:s konkurrenter. När det kommer till Cinebench-resultaten ser det inte riktigt lika bra ut, där hamnar GF75 längre bak. Fläkten är riktigt tyst och kunde haft ett högre varvtal. Batteriet kunde också behövt lite extra styrka. Även om batteritiden är tillräcklig för en spelmaskin på 17 tum som alltid kommer att vara ansluten till en nätadapter hemma så kan det bli lite tight om man vill använda enheten i farten.
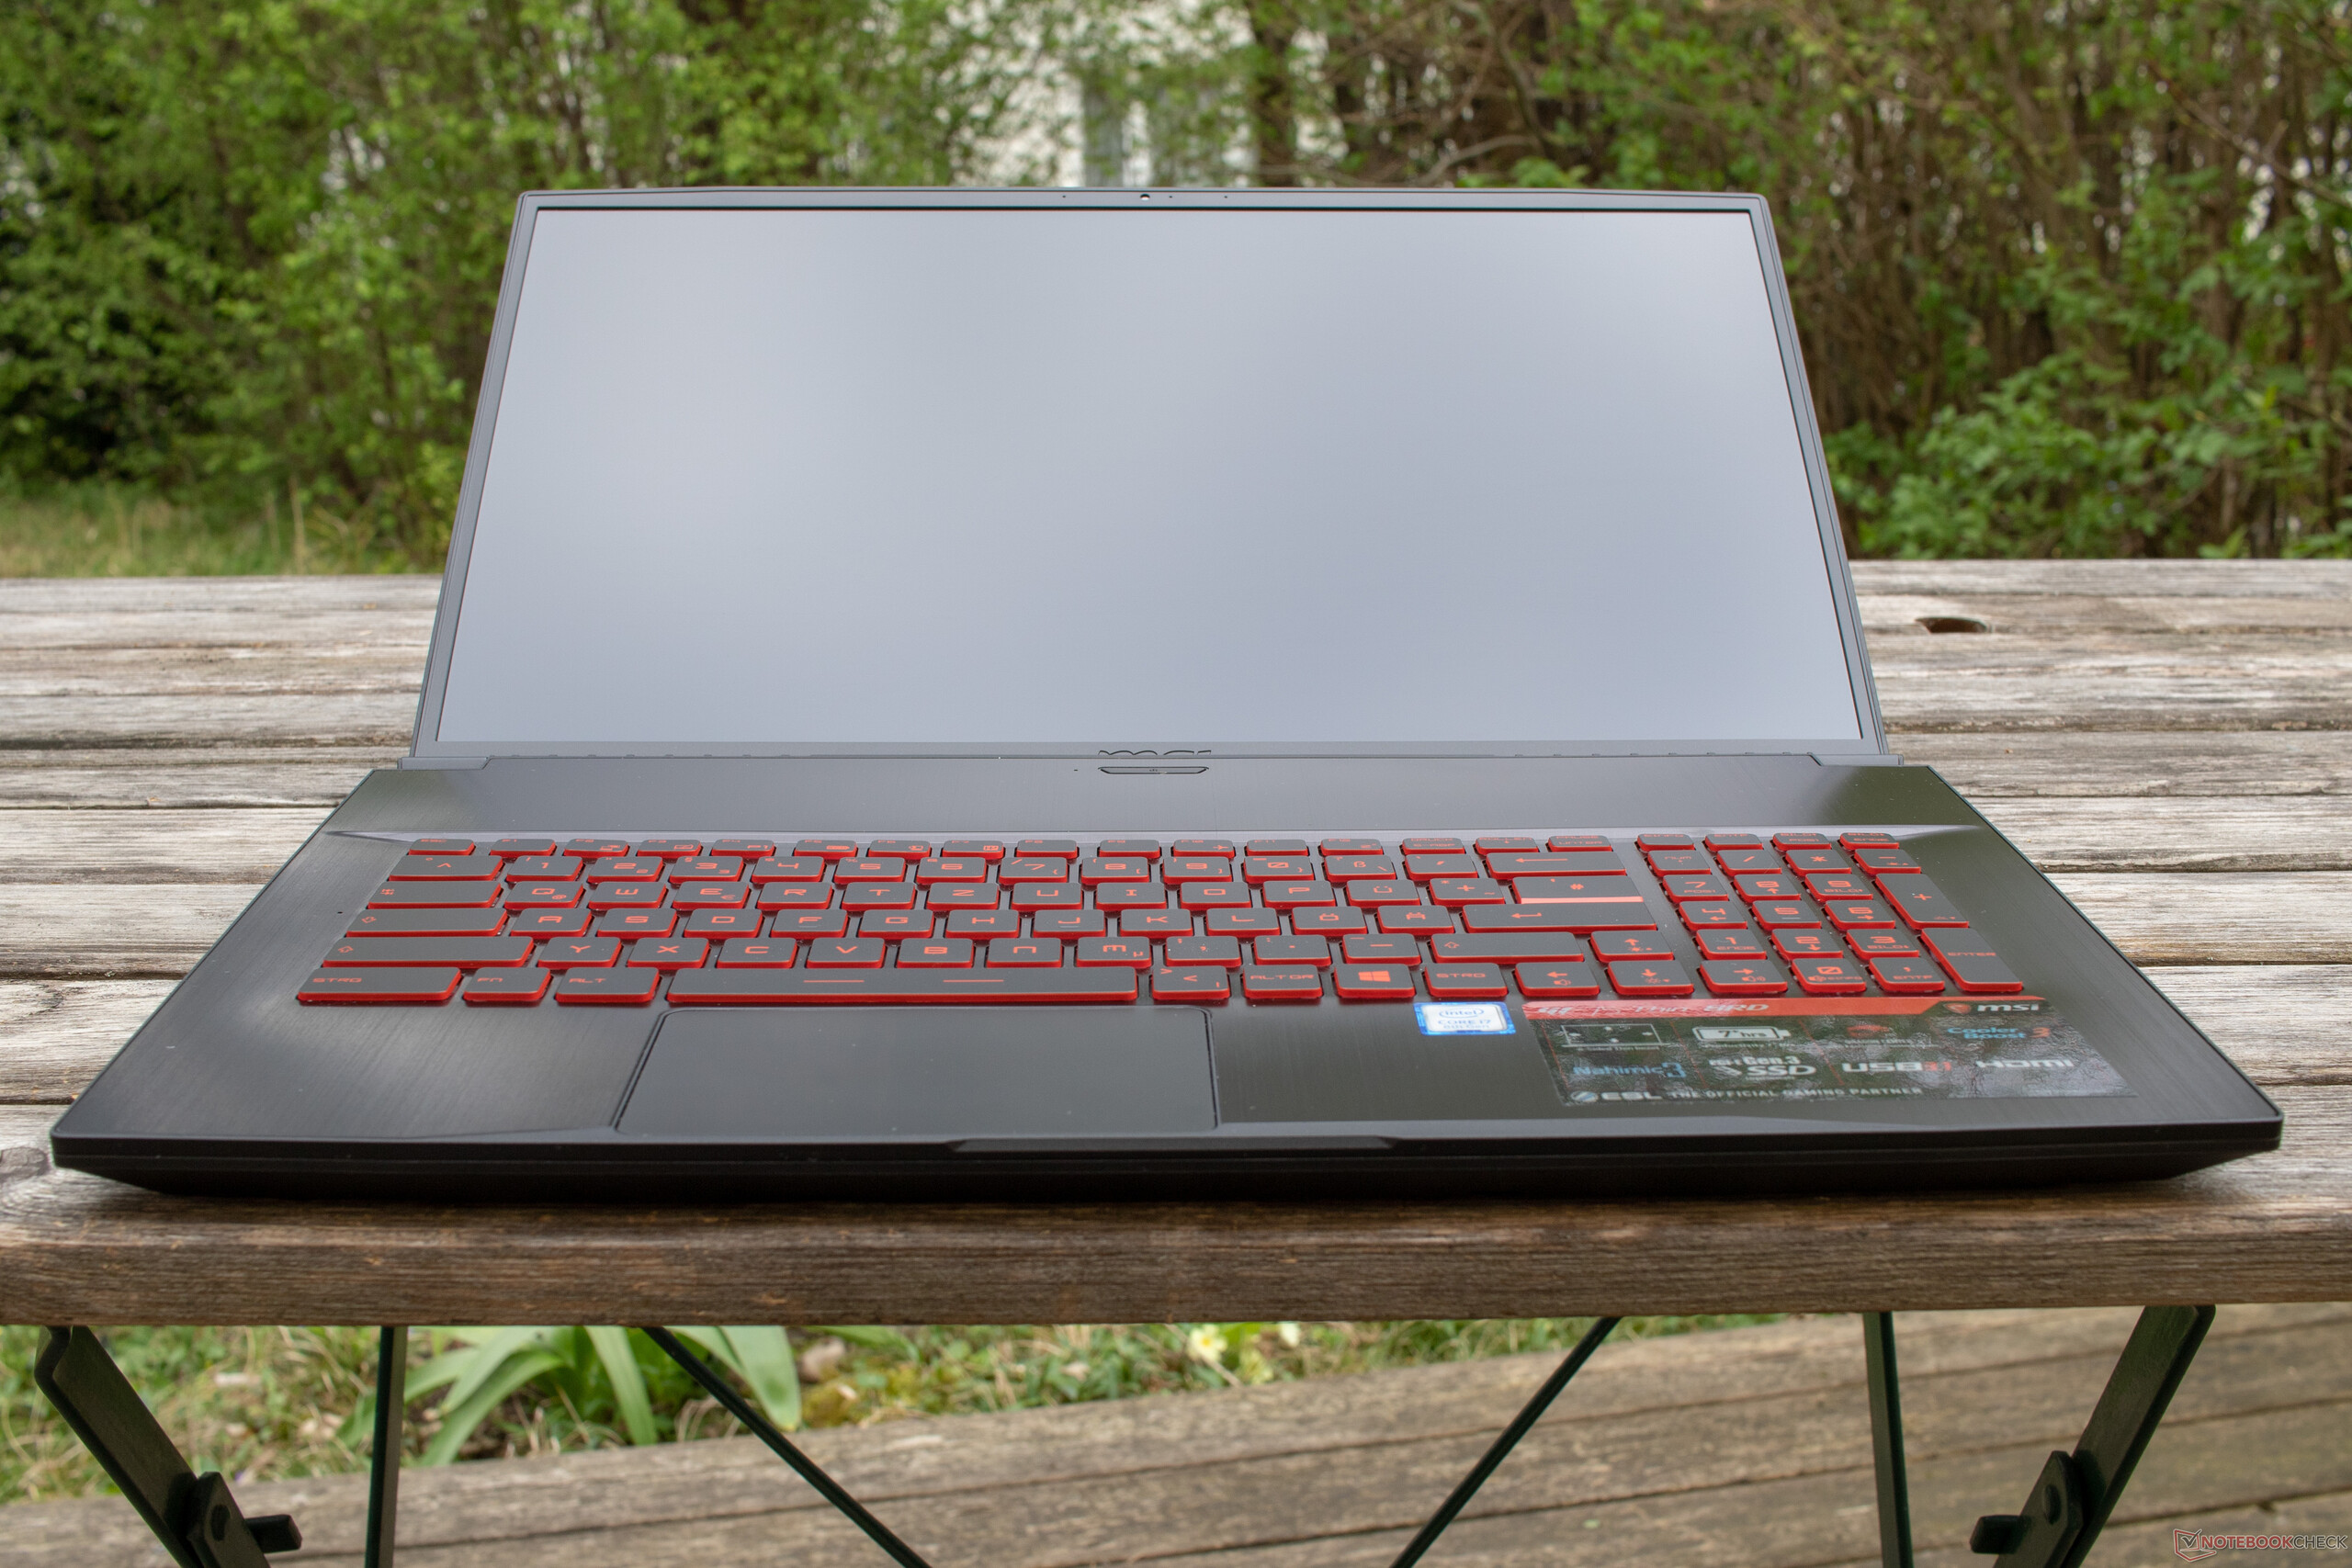
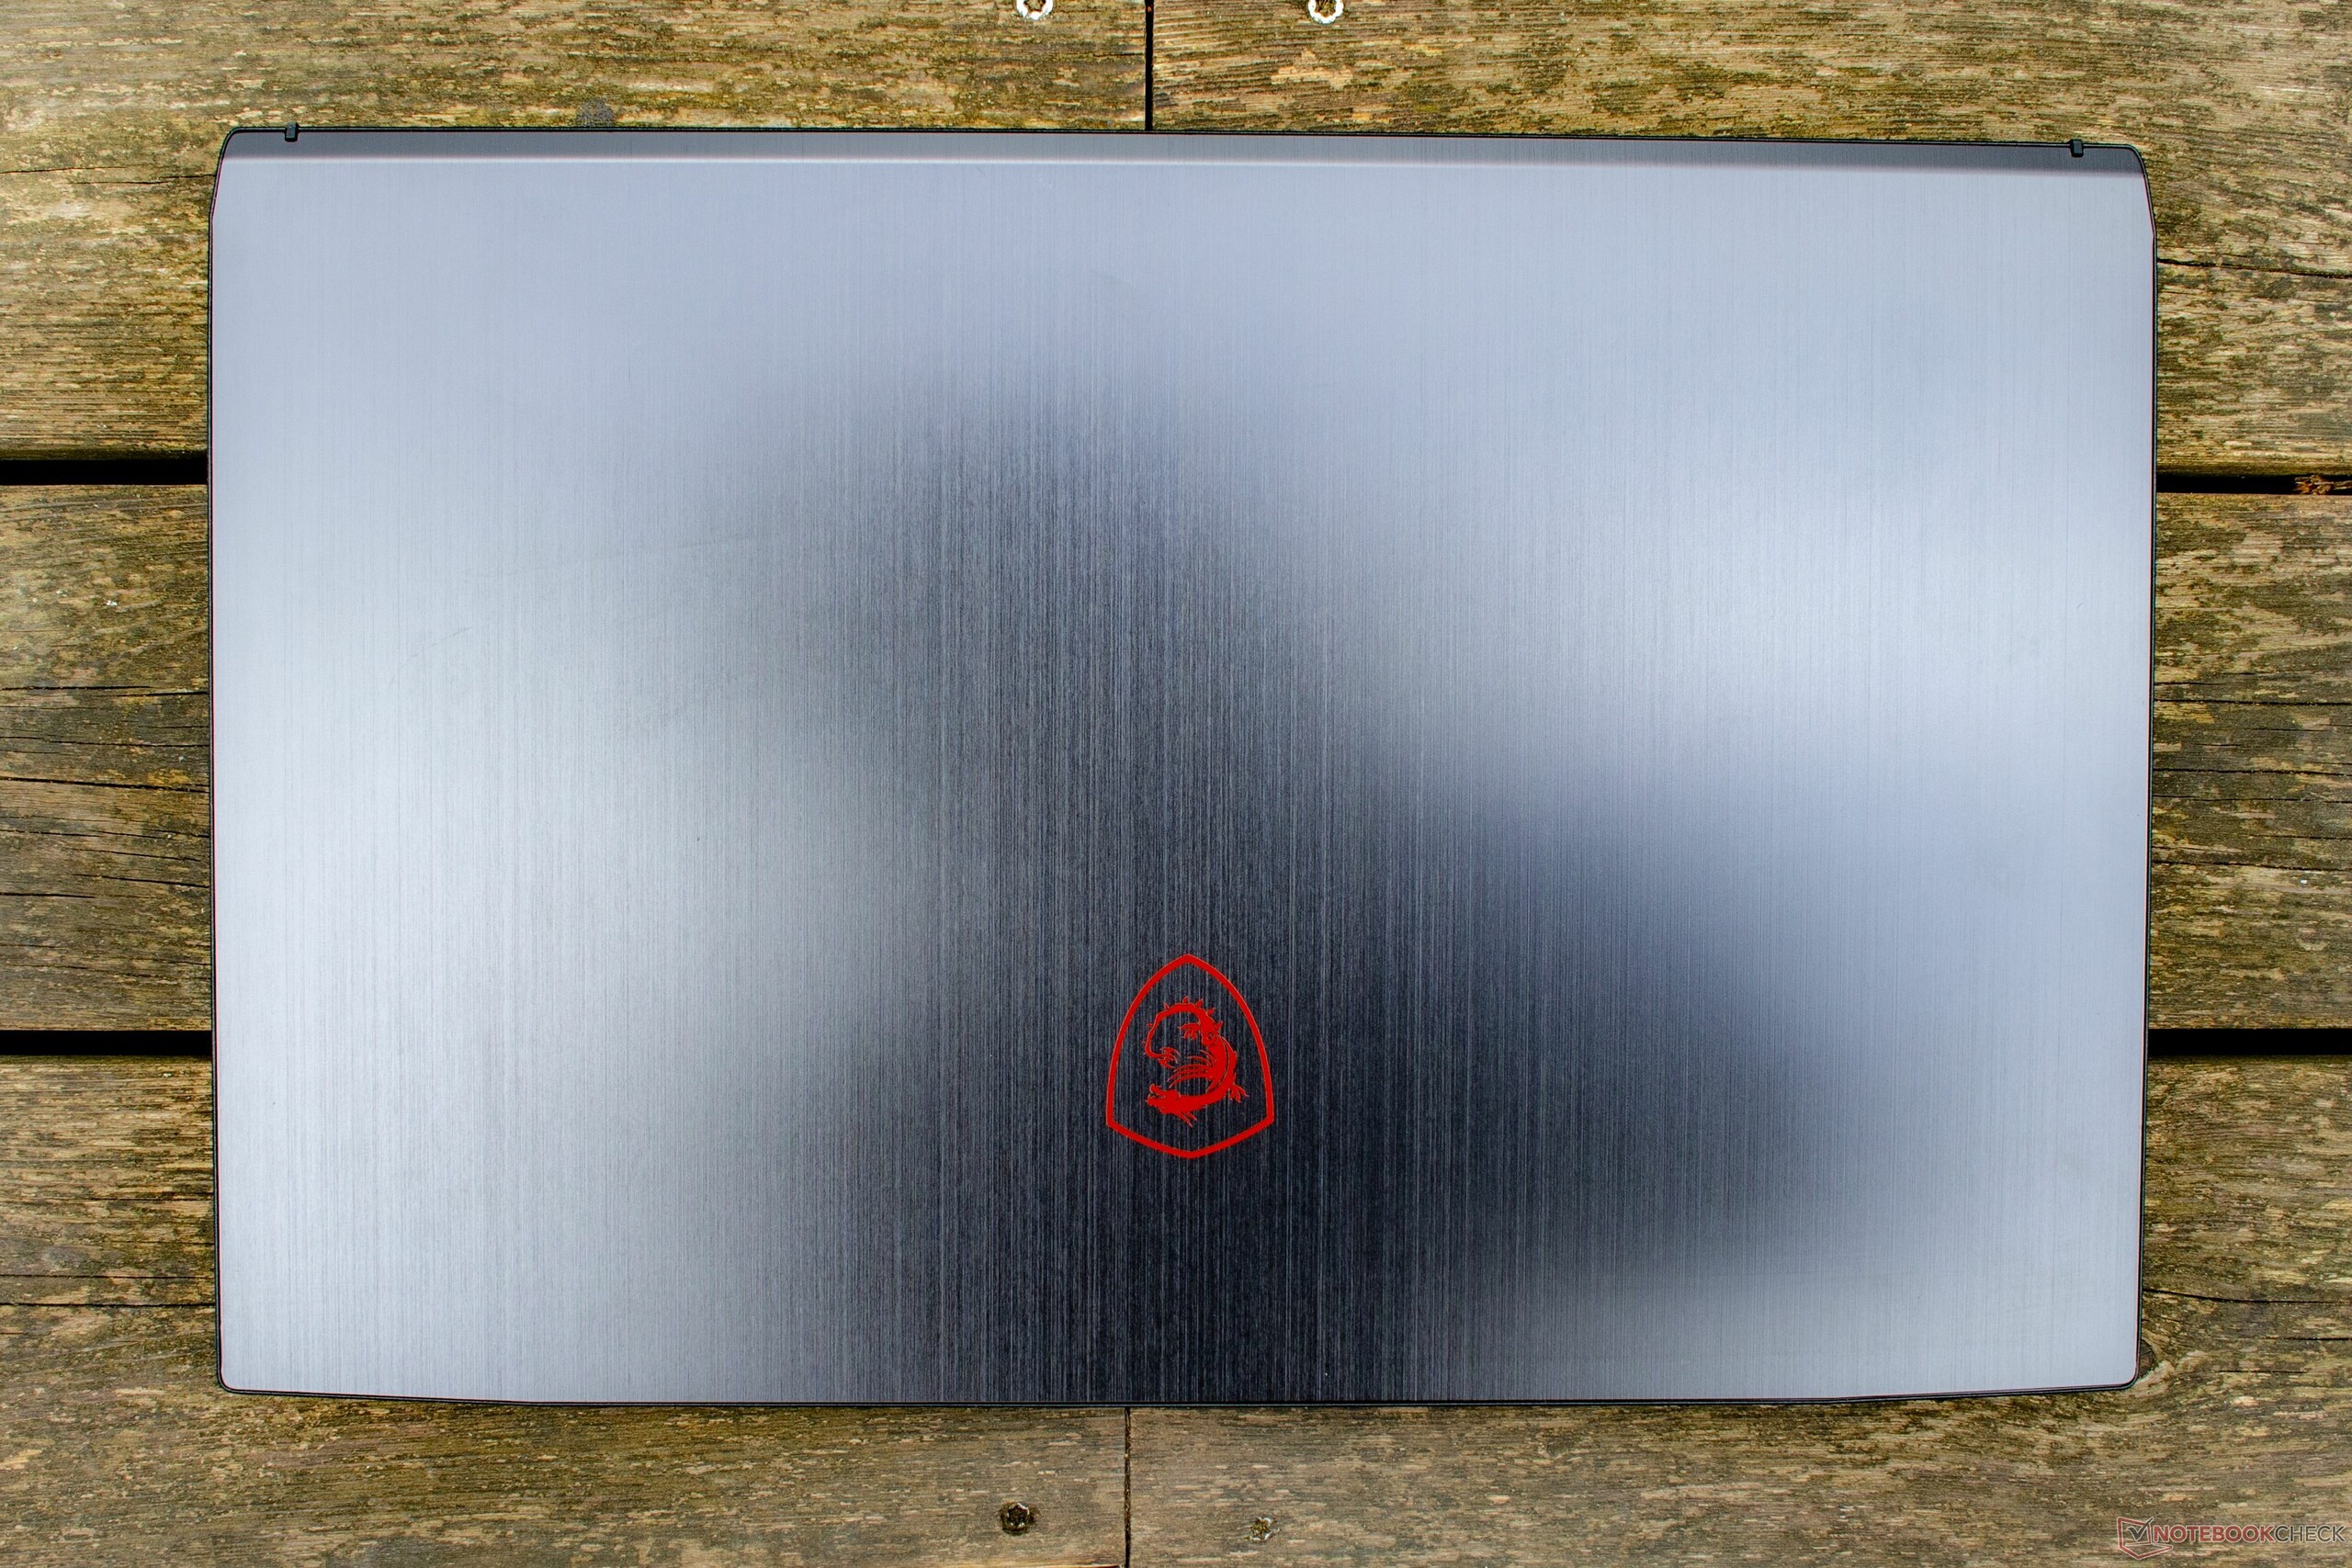
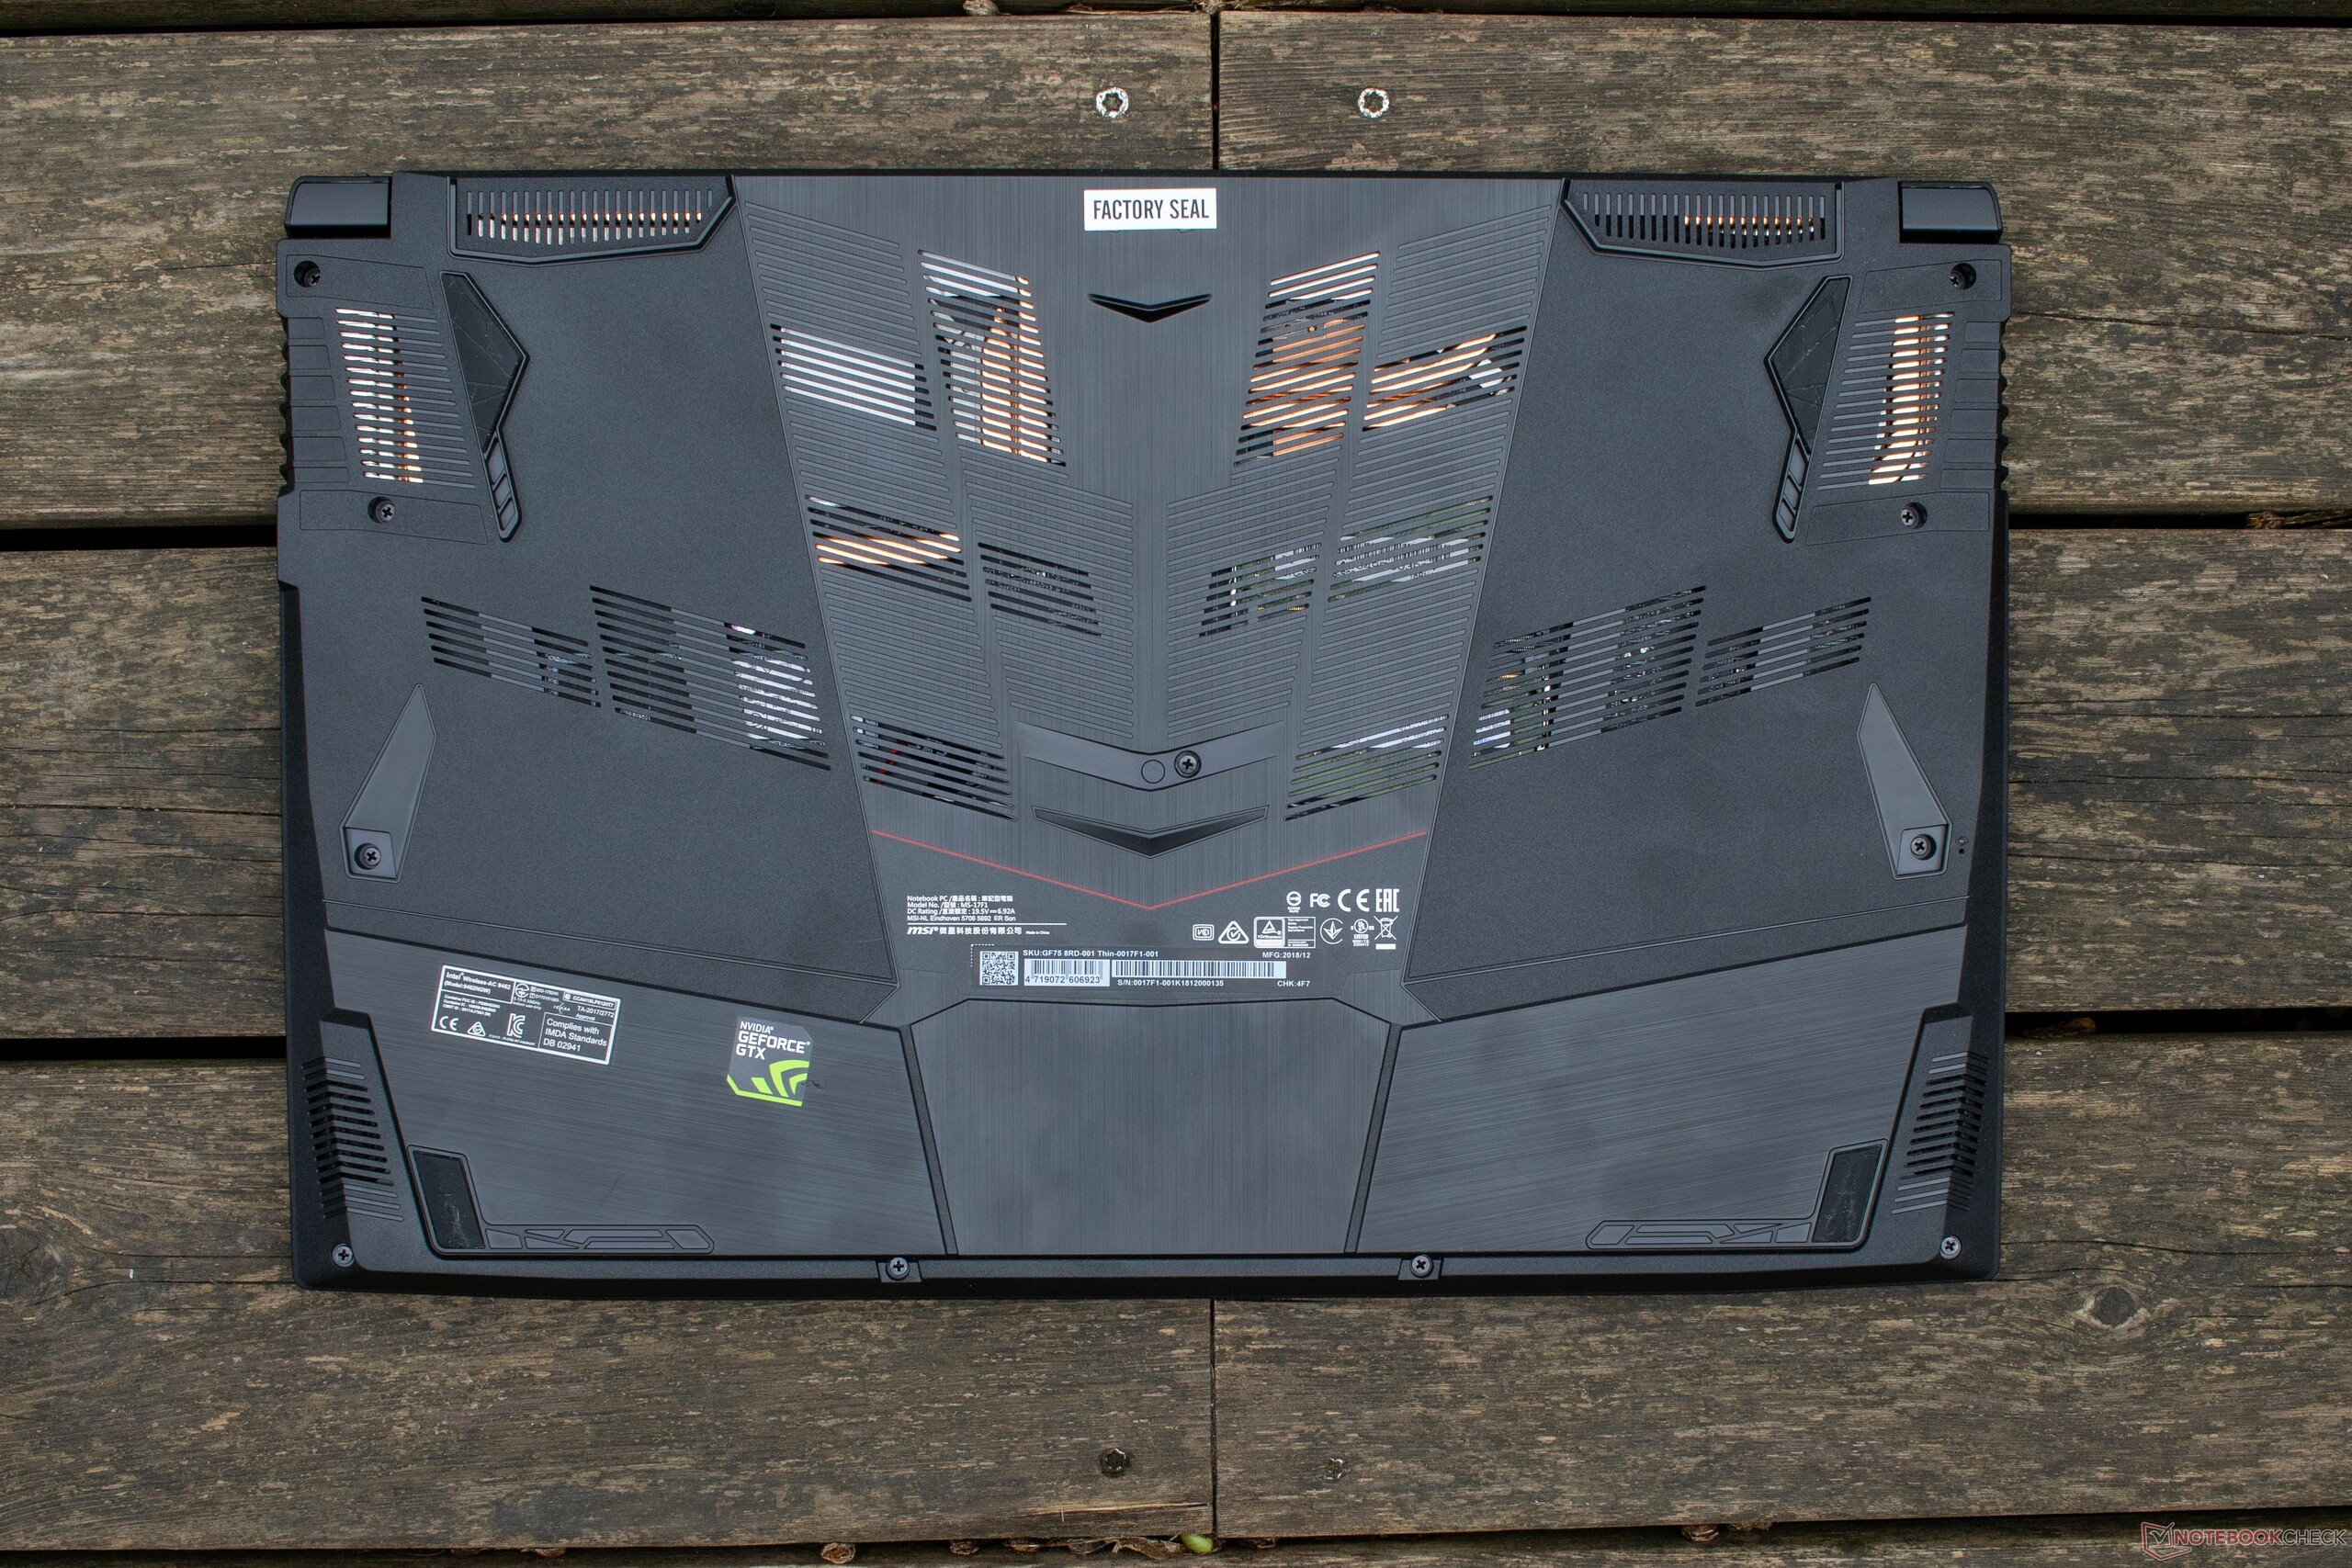
Totalt sett tror vi att gamers från mittenskiktet som spelar moderna spel kommer bli riktigt nöjda med det förhållande mellan pris och prestanda som MSI GF75 Thin erbjuder. Dessutom är utsidan riktigt tilltalande. Den som är nyfiken får själv avgöra huruvida man vill acceptera bristerna, exempelvis den plastiga undersidan. Om så är fallet blir man belönad med en skapligt snabb enhet med gedigen prestanda.
MSI GF75 8RD-001
- 04/30/2019 v7 (old)
Daniel Puschina
Price comparison
