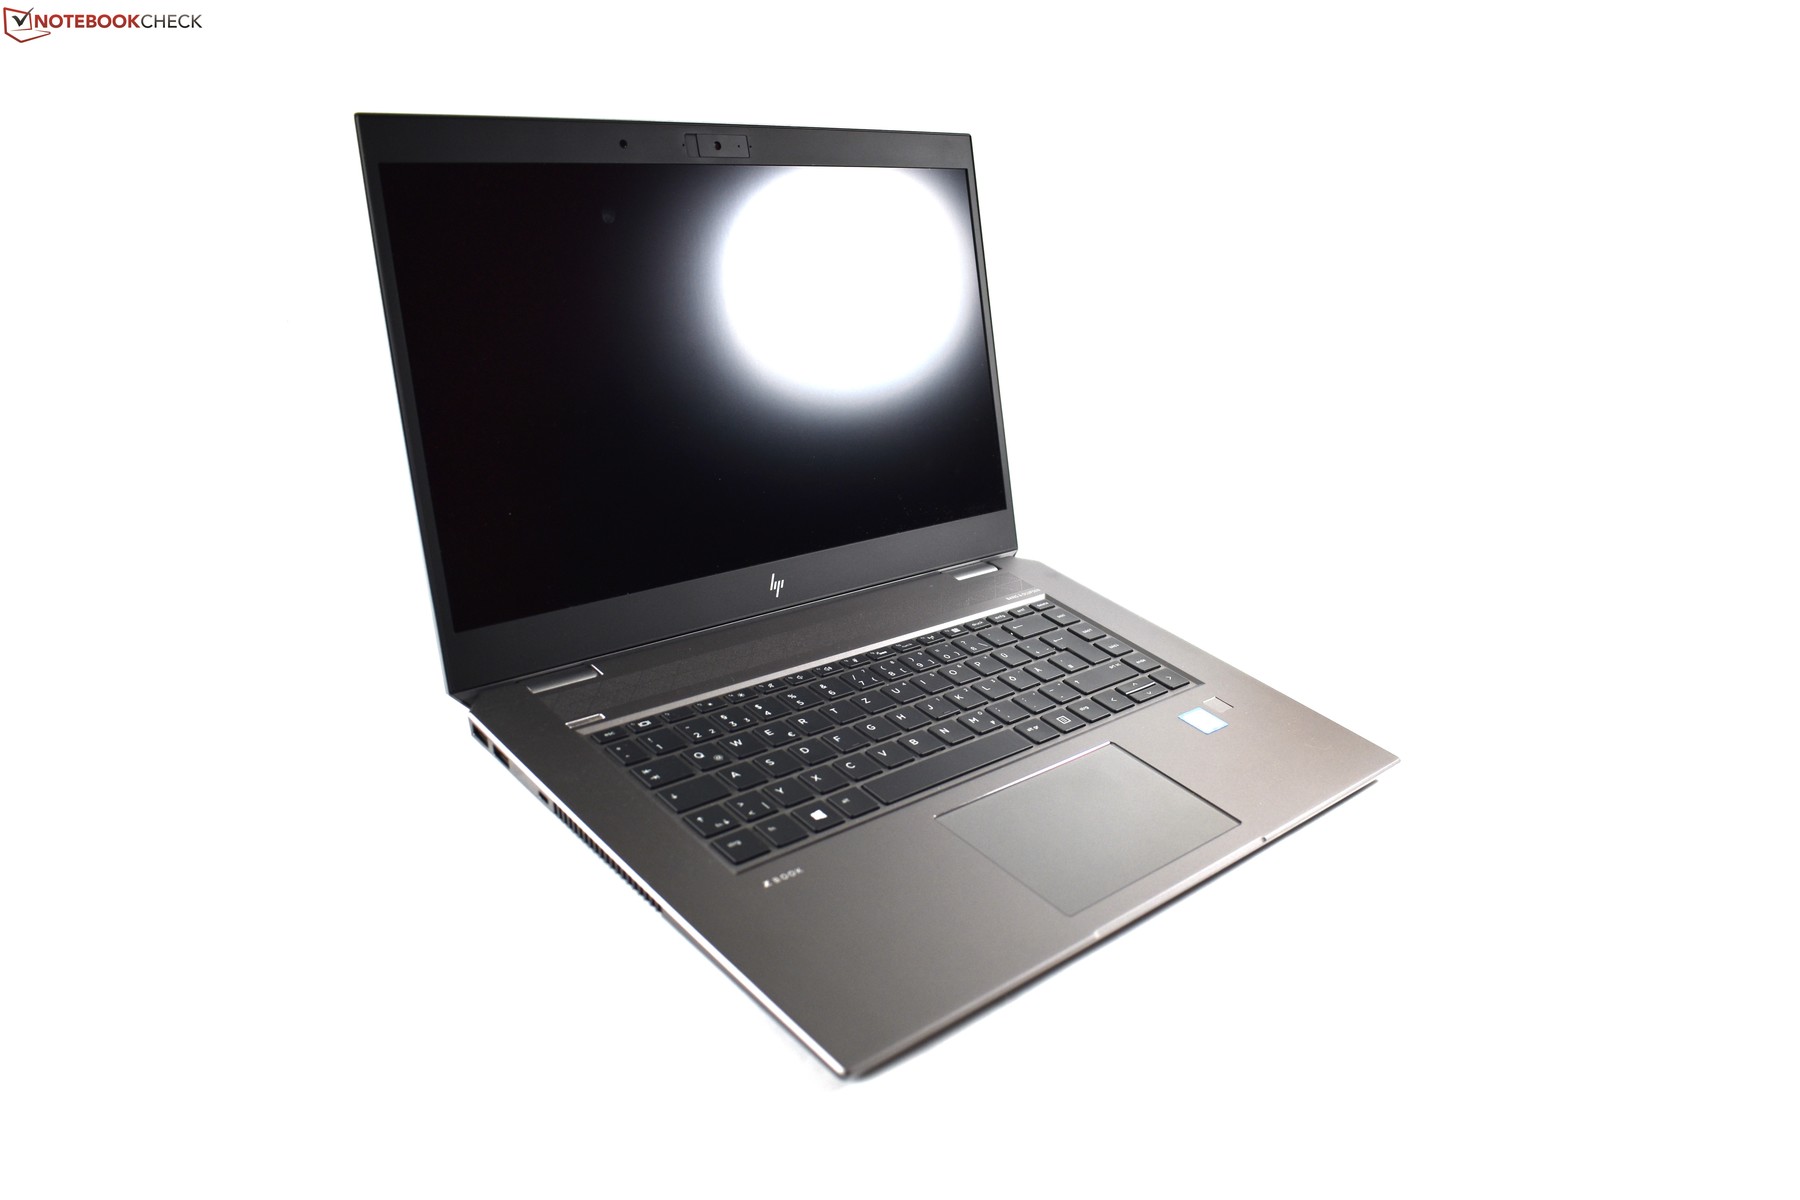
Test: HP ZBook Studio G5 (i7, P1000, 4K) Arbetsstation (Sammanfattning)
Anslutbarhet
| SD Card Reader | |
| average JPG Copy Test (av. of 3 runs) | |
| HP ZBook Studio G5-4QH10EA (Toshiba Exceria Pro SDXC 64 GB UHS-II) | |
| Lenovo ThinkPad P1-20MD002LUS (Toshiba Exceria Pro SDXC 64 GB UHS-II) | |
| Dell Precision 5530 Xeon E-2176M (Toshiba Exceria Pro SDXC 64 GB UHS-II) | |
| Genomsnitt av klass Workstation (49.6 - 681, n=14, senaste 2 åren) | |
| maximum AS SSD Seq Read Test (1GB) | |
| Lenovo ThinkPad P1-20MD002LUS (Toshiba Exceria Pro SDXC 64 GB UHS-II) | |
| Genomsnitt av klass Workstation (87.6 - 1455, n=14, senaste 2 åren) | |
| HP ZBook Studio G5-4QH10EA (Toshiba Exceria Pro SDXC 64 GB UHS-II) | |
| Dell Precision 5530 Xeon E-2176M (Toshiba Exceria Pro SDXC 64 GB UHS-II) | |
| |||||||||||||||||||||||||
Distribution av ljusstyrkan: 85 %
Mitt på batteriet: 418 cd/m²
Kontrast: 1438:1 (Svärta: 0.29 cd/m²)
ΔE ColorChecker Calman: 4.4 | ∀{0.5-29.43 Ø4.72}
calibrated: 1.9
ΔE Greyscale Calman: 5 | ∀{0.09-98 Ø4.97}
96% sRGB (Argyll 1.6.3 3D)
62.3% AdobeRGB 1998 (Argyll 1.6.3 3D)
68.8% AdobeRGB 1998 (Argyll 3D)
96.2% sRGB (Argyll 3D)
68.2% Display P3 (Argyll 3D)
Gamma: 2.28
CCT: 7575 K
| HP ZBook Studio G5-4QH10EA AUO30EB, , 3840x2160, 15.6" | Dell Precision 5530 Xeon E-2176M Sharp SHP148D / LQ156D1, , 3840x2160, 15.6" | Lenovo ThinkPad P1-20MD002LUS B156ZAN03.2, , 3840x2160, 15.6" | Apple MacBook Pro 15 2018 (2.6 GHz, 560X) APPA040, , 2880x1800, 15.4" | HP ZBook 15u G5 2ZC05EA CMN15E7, , 1920x1080, 15.6" | HP EliteBook 1050 G1-4QY20EA AUO30EB, , 3840x2160, 15.6" | |
|---|---|---|---|---|---|---|
| Display | 8% | 25% | 25% | -35% | -1% | |
| Display P3 Coverage (%) | 68.2 | 76.5 12% | 86.4 27% | 98.7 45% | 43.05 -37% | 67.8 -1% |
| sRGB Coverage (%) | 96.2 | 98.4 2% | 99.9 4% | 99.9 4% | 64.7 -33% | 94.1 -2% |
| AdobeRGB 1998 Coverage (%) | 68.8 | 76.4 11% | 99.1 44% | 86.6 26% | 44.5 -35% | 67.9 -1% |
| Response Times | 10% | 8% | 17% | 22% | 10% | |
| Response Time Grey 50% / Grey 80% * (ms) | 60.8 ? | 48 ? 21% | 55.6 ? 9% | 43.2 ? 29% | 41.6 ? 32% | 56 ? 8% |
| Response Time Black / White * (ms) | 32.8 ? | 33.6 ? -2% | 30.8 ? 6% | 31.2 ? 5% | 28.8 ? 12% | 29 ? 12% |
| PWM Frequency (Hz) | 1000 | 117000 ? | 25770 ? | |||
| Screen | -6% | -12% | 28% | -36% | -5% | |
| Brightness middle (cd/m²) | 417 | 451.7 8% | 397.6 -5% | 520 25% | 229 -45% | 440 6% |
| Brightness (cd/m²) | 412 | 440 7% | 396 -4% | 492 19% | 212 -49% | 389 -6% |
| Brightness Distribution (%) | 85 | 90 6% | 85 0% | 88 4% | 88 4% | 83 -2% |
| Black Level * (cd/m²) | 0.29 | 0.4 -38% | 0.25 14% | 0.39 -34% | 0.23 21% | 0.34 -17% |
| Contrast (:1) | 1438 | 1129 -21% | 1590 11% | 1333 -7% | 996 -31% | 1294 -10% |
| Colorchecker dE 2000 * | 4.4 | 3.11 29% | 4.95 -13% | 1.2 73% | 4.2 5% | 5.04 -15% |
| Colorchecker dE 2000 max. * | 6.7 | 8.62 -29% | 10.23 -53% | 2.3 66% | 18 -169% | 6.99 -4% |
| Colorchecker dE 2000 calibrated * | 1.9 | 3.07 -62% | 4.22 -122% | 4.2 -121% | 2.04 -7% | |
| Greyscale dE 2000 * | 5 | 3.7 26% | 5.1 -2% | 1.3 74% | 2 60% | 4.98 -0% |
| Gamma | 2.28 96% | 2.11 104% | 2.234 98% | 2.18 101% | 2.23 99% | 2.48 89% |
| CCT | 7575 86% | 6492 100% | 7543 86% | 6738 96% | 6292 103% | 7777 84% |
| Color Space (Percent of AdobeRGB 1998) (%) | 62.3 | 69 11% | 87.6 41% | 41 -34% | 61 -2% | |
| Color Space (Percent of sRGB) (%) | 96 | 98 2% | 100 4% | 64.5 -33% | 94 -2% | |
| Totalt genomsnitt (program/inställningar) | 4% /
-1% | 7% /
-2% | 23% /
25% | -16% /
-28% | 1% /
-3% |
* ... mindre är bättre
Visa svarstider
| ↔ Svarstid svart till vitt | ||
|---|---|---|
| 32.8 ms ... stiga ↗ och falla ↘ kombinerat | ↗ 16.4 ms stiga | 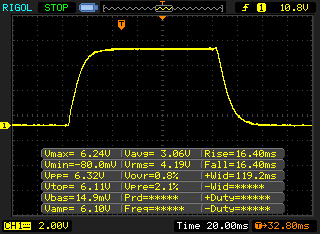 |
| ↘ 16.4 ms hösten | ||
| Skärmen visar långsamma svarsfrekvenser i våra tester och kommer att vara otillfredsställande för spelare. I jämförelse sträcker sig alla testade enheter från 0.1 (minst) till 240 (maximalt) ms. » 88 % av alla enheter är bättre. Detta innebär att den uppmätta svarstiden är sämre än genomsnittet av alla testade enheter (19.9 ms). | ||
| ↔ Svarstid 50 % grått till 80 % grått | ||
| 60.8 ms ... stiga ↗ och falla ↘ kombinerat | ↗ 30 ms stiga | 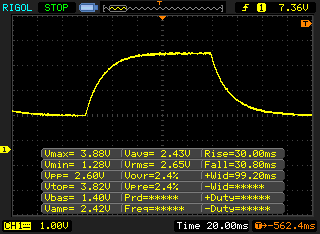 |
| ↘ 30.8 ms hösten | ||
| Skärmen visar långsamma svarsfrekvenser i våra tester och kommer att vara otillfredsställande för spelare. I jämförelse sträcker sig alla testade enheter från 0.165 (minst) till 636 (maximalt) ms. » 96 % av alla enheter är bättre. Detta innebär att den uppmätta svarstiden är sämre än genomsnittet av alla testade enheter (31.1 ms). | ||
Skärmflimmer / PWM (Puls-Width Modulation)
| Skärmflimmer / PWM upptäcktes inte | 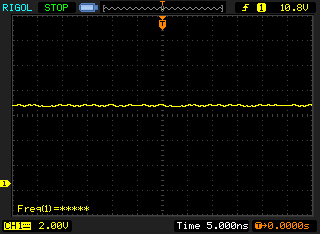 | ||
Som jämförelse: 52 % av alla testade enheter använder inte PWM för att dämpa skärmen. Om PWM upptäcktes mättes ett medelvärde av 7784 (minst: 5 - maximum: 343500) Hz. | |||
| PCMark 8 Home Score Accelerated v2 | 3433 poäng | |
| PCMark 8 Work Score Accelerated v2 | 4453 poäng | |
| PCMark 10 Score | 4462 poäng | |
Hjälp | ||
| HP ZBook Studio G5-4QH10EA Samsung SSD PM981 MZVLB512HAJQ | Dell Precision 5530 Xeon E-2176M SK hynix PC400 512 GB | Lenovo ThinkPad P1-20MD002LUS Samsung SSD PM981 MZVLB2T0HMLB | HP ZBook 15u G5 2ZC05EA Toshiba XG5 KXG50ZNV256G | HP EliteBook 1050 G1-4QY20EA Toshiba XG5-P KXG50PNV2T04 | Genomsnitt Samsung SSD PM981 MZVLB512HAJQ | |
|---|---|---|---|---|---|---|
| CrystalDiskMark 5.2 / 6 | 5% | 8% | -15% | -15% | 20% | |
| Write 4K (MB/s) | 102.7 | 97.8 -5% | 108 5% | 98.8 -4% | 94.8 -8% | 126.7 ? 23% |
| Read 4K (MB/s) | 38.32 | 41.21 8% | 37.24 -3% | 33.98 -11% | 26.45 -31% | 44 ? 15% |
| Write Seq (MB/s) | 1417 | 1312 -7% | 1476 4% | 395.7 -72% | 1037 -27% | 1617 ? 14% |
| Read Seq (MB/s) | 1289 | 1667 29% | 1367 6% | 2063 60% | 1280 -1% | 1716 ? 33% |
| Write 4K Q32T1 (MB/s) | 278.9 | 449.5 61% | 302.4 8% | 352.3 26% | 277.6 0% | 413 ? 48% |
| Read 4K Q32T1 (MB/s) | 348.8 | 327.4 -6% | 375 8% | 281.8 -19% | 333.9 -4% | 420 ? 20% |
| Write Seq Q32T1 (MB/s) | 1895 | 1385 -27% | 2433 28% | 355 -81% | 1037 -45% | 2076 ? 10% |
| Read Seq Q32T1 (MB/s) | 3352 | 2948 -12% | 3493 4% | 2775 -17% | 3135 -6% | 3130 ? -7% |

| SiSoft Sandra 2016 | |
| Image Processing | |
| Genomsnitt NVIDIA Quadro P1000 (264 - 269, n=3) | |
| HP ZBook Studio G5-4QH10EA | |
| HP ZBook 15u G5 2ZC05EA | |
| GP Cryptography (Higher Security AES256+SHA2-512) | |
| Genomsnitt NVIDIA Quadro P1000 (10.8 - 11, n=3) | |
| HP ZBook Studio G5-4QH10EA | |
| HP ZBook 15u G5 2ZC05EA | |
| GP Financial Analysis (FP High/Double Precision) | |
| HP ZBook 15u G5 2ZC05EA | |
| Genomsnitt NVIDIA Quadro P1000 (23.2 - 23.8, n=3) | |
| HP ZBook Studio G5-4QH10EA | |
| 3DMark 11 Performance | 6377 poäng | |
| 3DMark Cloud Gate Standard Score | 16596 poäng | |
| 3DMark Fire Strike Score | 4453 poäng | |
| 3DMark Time Spy Score | 1560 poäng | |
Hjälp | ||
| The Witcher 3 - 1920x1080 High Graphics & Postprocessing (Nvidia HairWorks Off) | |
| Genomsnitt av klass Workstation (53.4 - 156.4, n=3, senaste 2 åren) | |
| HP EliteBook 1050 G1-4QY20EA | |
| Dell Precision 5530 Xeon E-2176M | |
| Lenovo ThinkPad P1-20MD002LUS | |
| HP ZBook Studio G5-4QH10EA | |
| Genomsnitt NVIDIA Quadro P1000 (26.1 - 29.9, n=3) | |
| låg | med. | hög | ultra | 4K | |
|---|---|---|---|---|---|
| BioShock Infinite (2013) | 249.7 | 152.2 | 133.7 | 51 | |
| The Witcher 3 (2015) | 88.7 | 54.4 | 29.5 | 16.1 | |
| Rise of the Tomb Raider (2016) | 100.1 | 57.5 | 32.3 | 27 | 10.6 |
Ljudnivå
| Låg belastning |
| 28.6 / 28.6 / 30 dB(A) |
| Hög belastning |
| 38.1 / 42.5 dB(A) |
 | ||
30 dB tyst 40 dB(A) hörbar 50 dB(A) högt ljud |
||
min: | ||
(±) Den maximala temperaturen på ovansidan är 42.3 °C / 108 F, jämfört med genomsnittet av 38.2 °C / 101 F , allt från 22.2 till 69.8 °C för klassen Workstation.
(±) Botten värms upp till maximalt 43.1 °C / 110 F, jämfört med genomsnittet av 41.1 °C / 106 F
(+) Vid tomgångsbruk är medeltemperaturen för ovansidan 23.2 °C / 74 F, jämfört med enhetsgenomsnittet på 32 °C / ### class_avg_f### F.
(±) När du spelar The Witcher 3 är medeltemperaturen för ovansidan 34.8 °C / 95 F, jämfört med enhetsgenomsnittet på 32 °C / ## #class_avg_f### F.
(+) Handledsstöden och pekplattan är kallare än hudtemperaturen med maximalt 29.6 °C / 85.3 F och är därför svala att ta på.
(±) Medeltemperaturen för handledsstödsområdet på liknande enheter var 27.8 °C / 82 F (-1.8 °C / -3.3 F).
HP ZBook Studio G5-4QH10EA ljudanalys
(±) | högtalarljudstyrkan är genomsnittlig men bra (76.2 dB)
Bas 100 - 315 Hz
(±) | reducerad bas - i genomsnitt 8.5% lägre än medianen
(±) | linjäriteten för basen är genomsnittlig (10.7% delta till föregående frekvens)
Mellan 400 - 2000 Hz
(±) | högre mellan - i genomsnitt 6% högre än median
(±) | linjäriteten för mids är genomsnittlig (7% delta till föregående frekvens)
Högsta 2 - 16 kHz
(+) | balanserade toppar - endast 4.1% från medianen
(+) | toppar är linjära (6.5% delta till föregående frekvens)
Totalt 100 - 16 000 Hz
(±) | linjäriteten för det totala ljudet är genomsnittlig (17.4% skillnad mot median)
Jämfört med samma klass
» 53% av alla testade enheter i den här klassen var bättre, 10% liknande, 37% sämre
» Den bästa hade ett delta på 7%, genomsnittet var 17%, sämst var 35%
Jämfört med alla testade enheter
» 33% av alla testade enheter var bättre, 8% liknande, 59% sämre
» Den bästa hade ett delta på 4%, genomsnittet var 24%, sämst var 134%
Lenovo ThinkPad P1-20MD002LUS ljudanalys
(±) | högtalarljudstyrkan är genomsnittlig men bra (73.7 dB)
Bas 100 - 315 Hz
(±) | reducerad bas - i genomsnitt 10.1% lägre än medianen
(±) | linjäriteten för basen är genomsnittlig (12.3% delta till föregående frekvens)
Mellan 400 - 2000 Hz
(±) | högre mellan - i genomsnitt 5.9% högre än median
(±) | linjäriteten för mids är genomsnittlig (8.9% delta till föregående frekvens)
Högsta 2 - 16 kHz
(+) | balanserade toppar - endast 2% från medianen
(+) | toppar är linjära (5.1% delta till föregående frekvens)
Totalt 100 - 16 000 Hz
(±) | linjäriteten för det totala ljudet är genomsnittlig (21.8% skillnad mot median)
Jämfört med samma klass
» 77% av alla testade enheter i den här klassen var bättre, 6% liknande, 17% sämre
» Den bästa hade ett delta på 7%, genomsnittet var 17%, sämst var 35%
Jämfört med alla testade enheter
» 62% av alla testade enheter var bättre, 7% liknande, 31% sämre
» Den bästa hade ett delta på 4%, genomsnittet var 24%, sämst var 134%
Dell Precision 5530 Xeon E-2176M ljudanalys
(±) | högtalarljudstyrkan är genomsnittlig men bra (74.9 dB)
Bas 100 - 315 Hz
(-) | nästan ingen bas - i genomsnitt 17.9% lägre än medianen
(±) | linjäriteten för basen är genomsnittlig (9.1% delta till föregående frekvens)
Mellan 400 - 2000 Hz
(±) | högre mellan - i genomsnitt 6.7% högre än median
(±) | linjäriteten för mids är genomsnittlig (10.2% delta till föregående frekvens)
Högsta 2 - 16 kHz
(+) | balanserade toppar - endast 4% från medianen
(±) | linjäriteten för toppar är genomsnittlig (8.4% delta till föregående frekvens)
Totalt 100 - 16 000 Hz
(±) | linjäriteten för det totala ljudet är genomsnittlig (23% skillnad mot median)
Jämfört med samma klass
» 83% av alla testade enheter i den här klassen var bättre, 3% liknande, 14% sämre
» Den bästa hade ett delta på 7%, genomsnittet var 17%, sämst var 35%
Jämfört med alla testade enheter
» 69% av alla testade enheter var bättre, 5% liknande, 26% sämre
» Den bästa hade ett delta på 4%, genomsnittet var 24%, sämst var 134%
| Av/Standby | |
| Låg belastning | |
| Hög belastning |
|
Förklaring:
min: | |
| HP ZBook Studio G5-4QH10EA i7-8750H, Quadro P1000, Samsung SSD PM981 MZVLB512HAJQ, IPS LED, 3840x2160, 15.6" | Dell Precision 5530 Xeon E-2176M E-2176M, Quadro P2000, SK hynix PC400 512 GB, IGZO, 3840x2160, 15.6" | Lenovo ThinkPad P1-20MD002LUS E-2176M, Quadro P2000 Max-Q, Samsung SSD PM981 MZVLB2T0HMLB, IPS, 3840x2160, 15.6" | Apple MacBook Pro 15 2018 (2.6 GHz, 560X) i7-8850H, Radeon Pro 560X, Apple SSD AP0512, IPS, 2880x1800, 15.4" | HP ZBook 15u G5 2ZC05EA i5-8550U, Radeon Pro WX 3100, Toshiba XG5 KXG50ZNV256G, IPS LED, 1920x1080, 15.6" | HP EliteBook 1050 G1-4QY20EA i7-8750H, GeForce GTX 1050 Max-Q, Toshiba XG5-P KXG50PNV2T04, IPS LED, 3840x2160, 15.6" | Genomsnitt NVIDIA Quadro P1000 | Genomsnitt av klass Workstation | |
|---|---|---|---|---|---|---|---|---|
| Power Consumption | -26% | -8% | 15% | 37% | 5% | 9% | -27% | |
| Idle Minimum * (Watt) | 6.8 | 9.8 -44% | 7.1 -4% | 3.4 50% | 3.2 53% | 6.1 10% | 5.09 ? 25% | 8.94 ? -31% |
| Idle Average * (Watt) | 11.3 | 16.8 -49% | 14.4 -27% | 11 3% | 6.1 46% | 10.2 10% | 9.25 ? 18% | 13.8 ? -22% |
| Idle Maximum * (Watt) | 14.3 | 16.9 -18% | 14.6 -2% | 14.9 -4% | 9.7 32% | 13.4 6% | 13 ? 9% | 17.5 ? -22% |
| Load Average * (Watt) | 78 | 102.3 -31% | 93.9 -20% | 78.9 -1% | 62 21% | 82 -5% | 78.2 ? -0% | 95 ? -22% |
| Witcher 3 ultra * (Watt) | 64 | 76.5 -20% | 77.9 -22% | 48 25% | ||||
| Load Maximum * (Watt) | 126 | 114.5 9% | 88.3 30% | 91.2 28% | 71 44% | 122 3% | 132.7 ? -5% | 175.2 ? -39% |
* ... mindre är bättre
| HP ZBook Studio G5-4QH10EA i7-8750H, Quadro P1000, 97 Wh | Dell Precision 5530 Xeon E-2176M E-2176M, Quadro P2000, 97 Wh | Lenovo ThinkPad P1-20MD002LUS E-2176M, Quadro P2000 Max-Q, 80 Wh | Apple MacBook Pro 15 2018 (2.6 GHz, 560X) i7-8850H, Radeon Pro 560X, 83 Wh | HP ZBook 15u G5 2ZC05EA i5-8550U, Radeon Pro WX 3100, 56 Wh | HP EliteBook 1050 G1-4QY20EA i7-8750H, GeForce GTX 1050 Max-Q, 96 Wh | Genomsnitt av klass Workstation | |
|---|---|---|---|---|---|---|---|
| Batteridrifttid | -12% | -45% | 17% | 20% | -2% | 2% | |
| Reader / Idle (h) | 17.3 | 16.5 -5% | 21.7 25% | 17.1 -1% | 26.1 ? 51% | ||
| H.264 (h) | 9.1 | 11.7 29% | 10.4 14% | 9.7 7% | 9.51 ? 5% | ||
| WiFi v1.3 (h) | 9.7 | 8.4 -13% | 5.3 -45% | 10.2 5% | 8.6 -11% | 8.7 -10% | 8.53 ? -12% |
| Load (h) | 2.2 | 1.8 -18% | 3.3 50% | 2.1 -5% | 1.429 ? -35% | ||
| Witcher 3 ultra (h) | 1.5 |
För
Emot
Läs den fullständiga versionen av recensionen på engelska här.
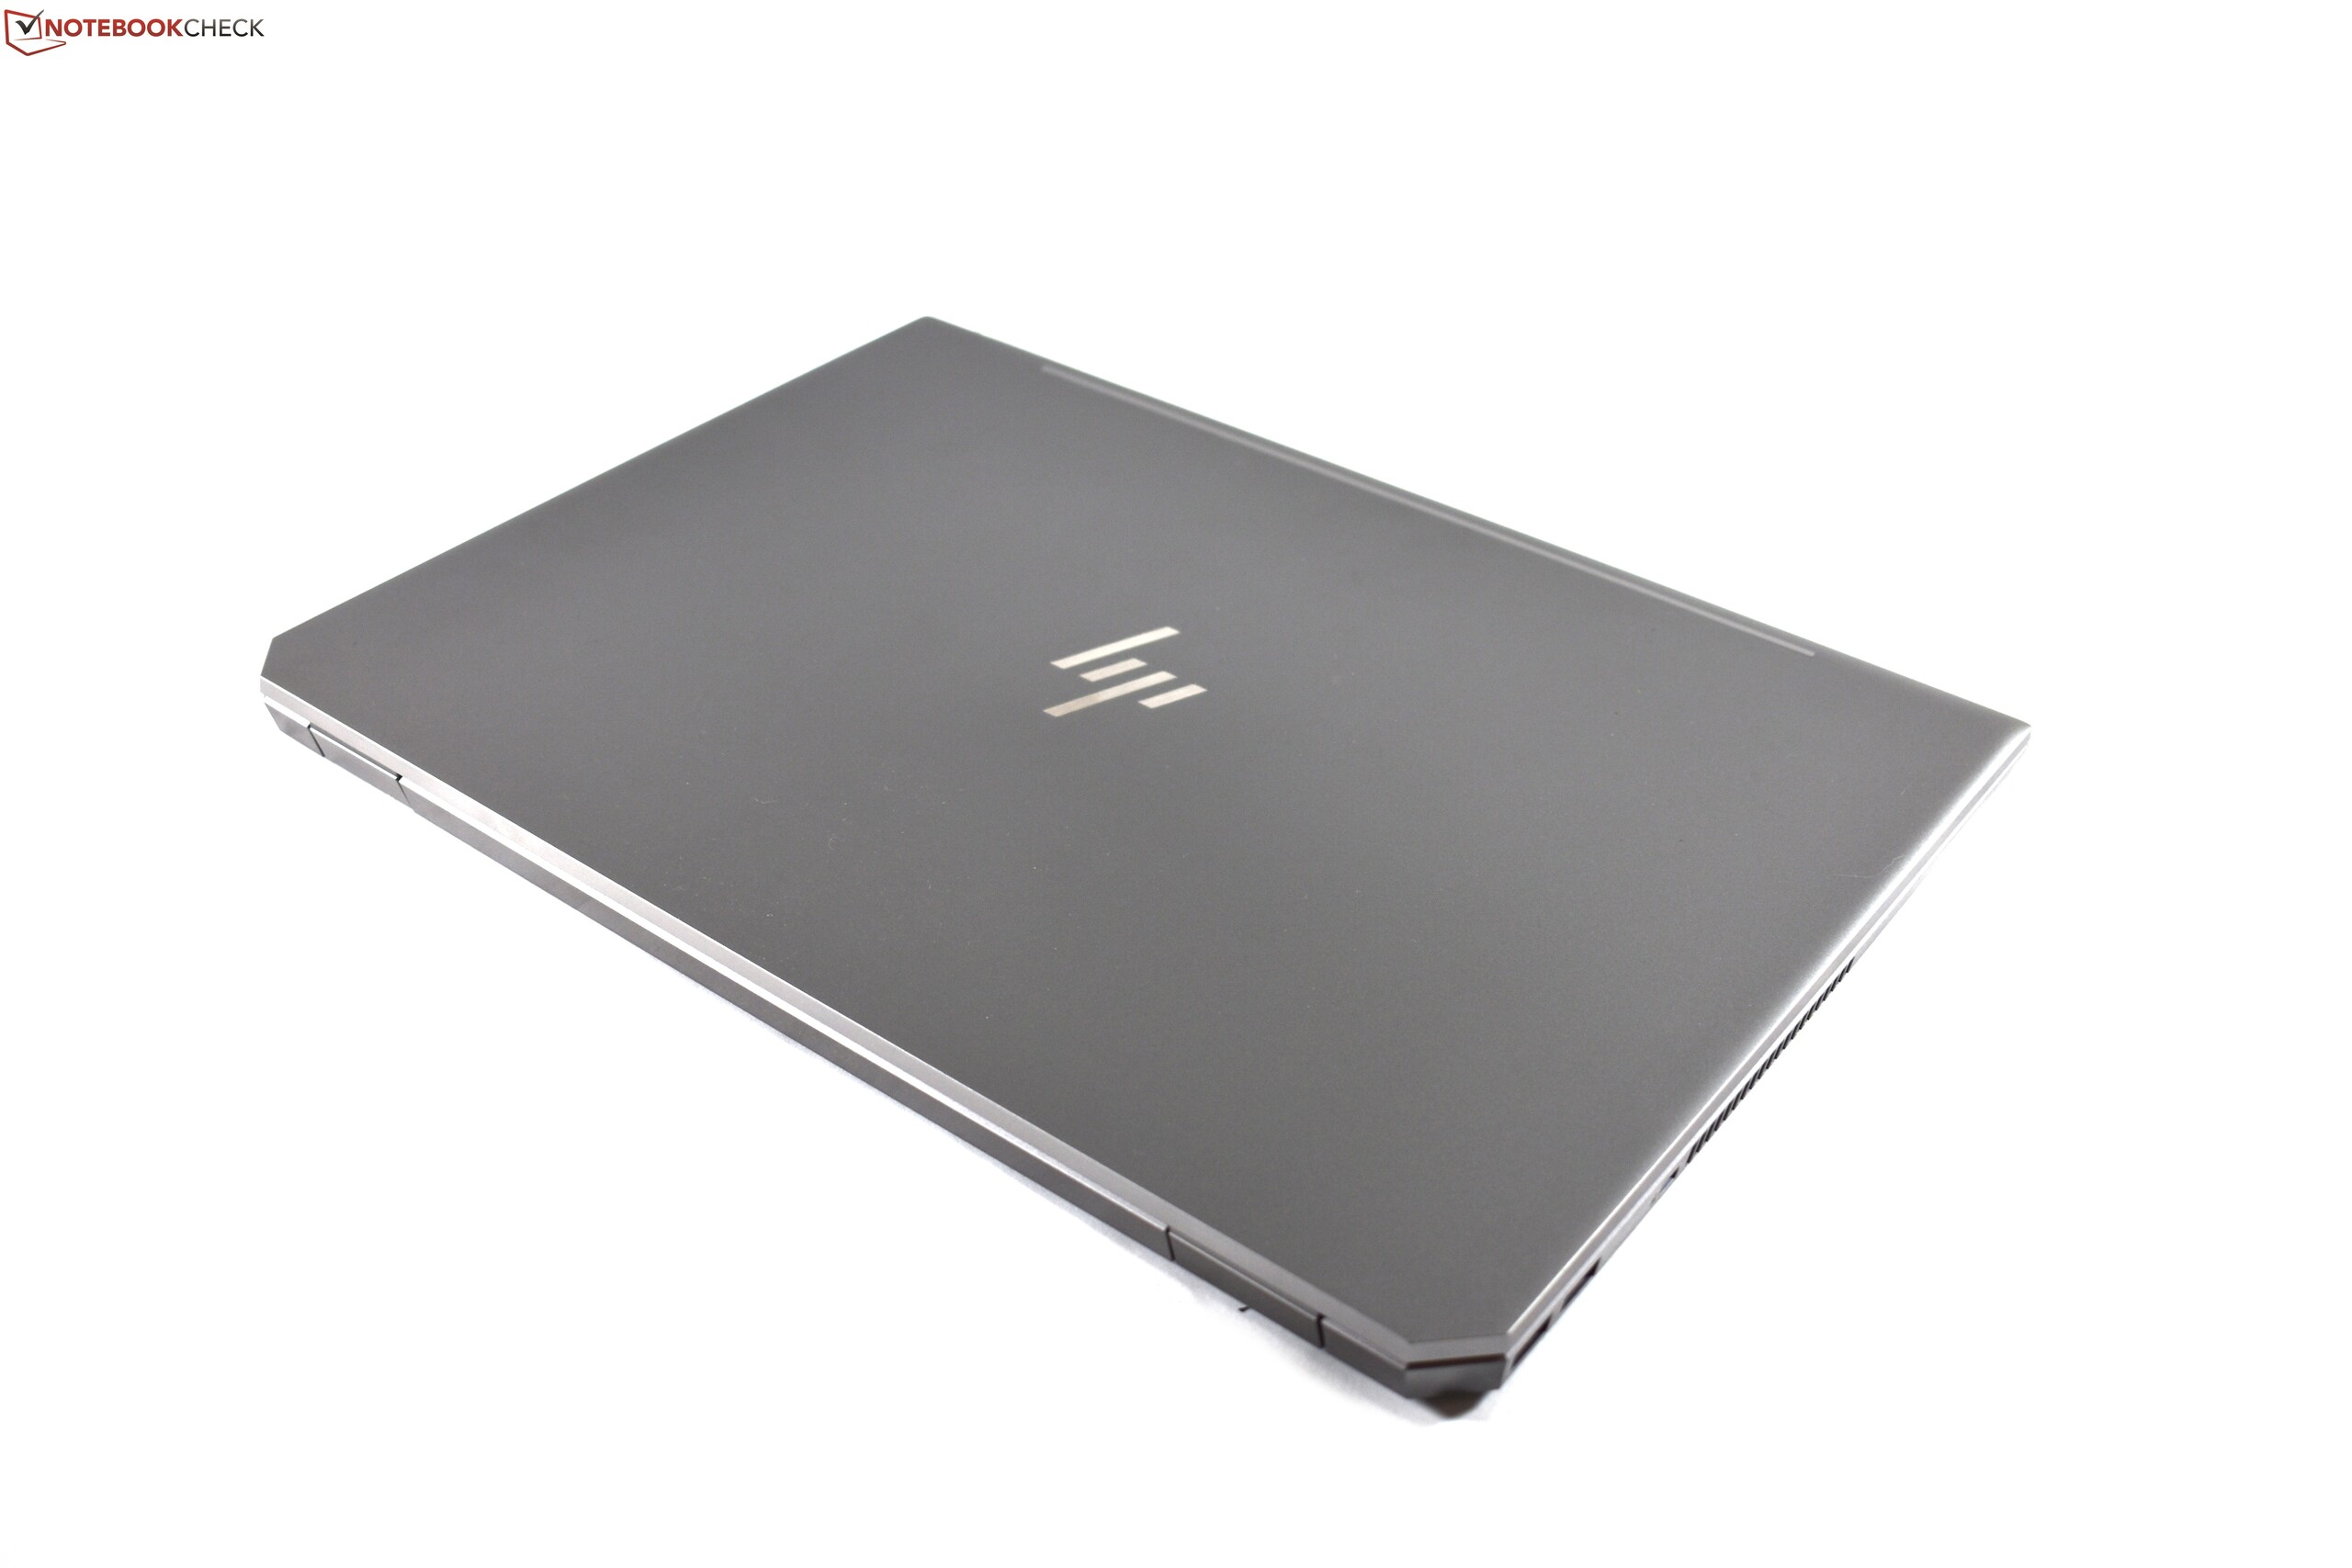
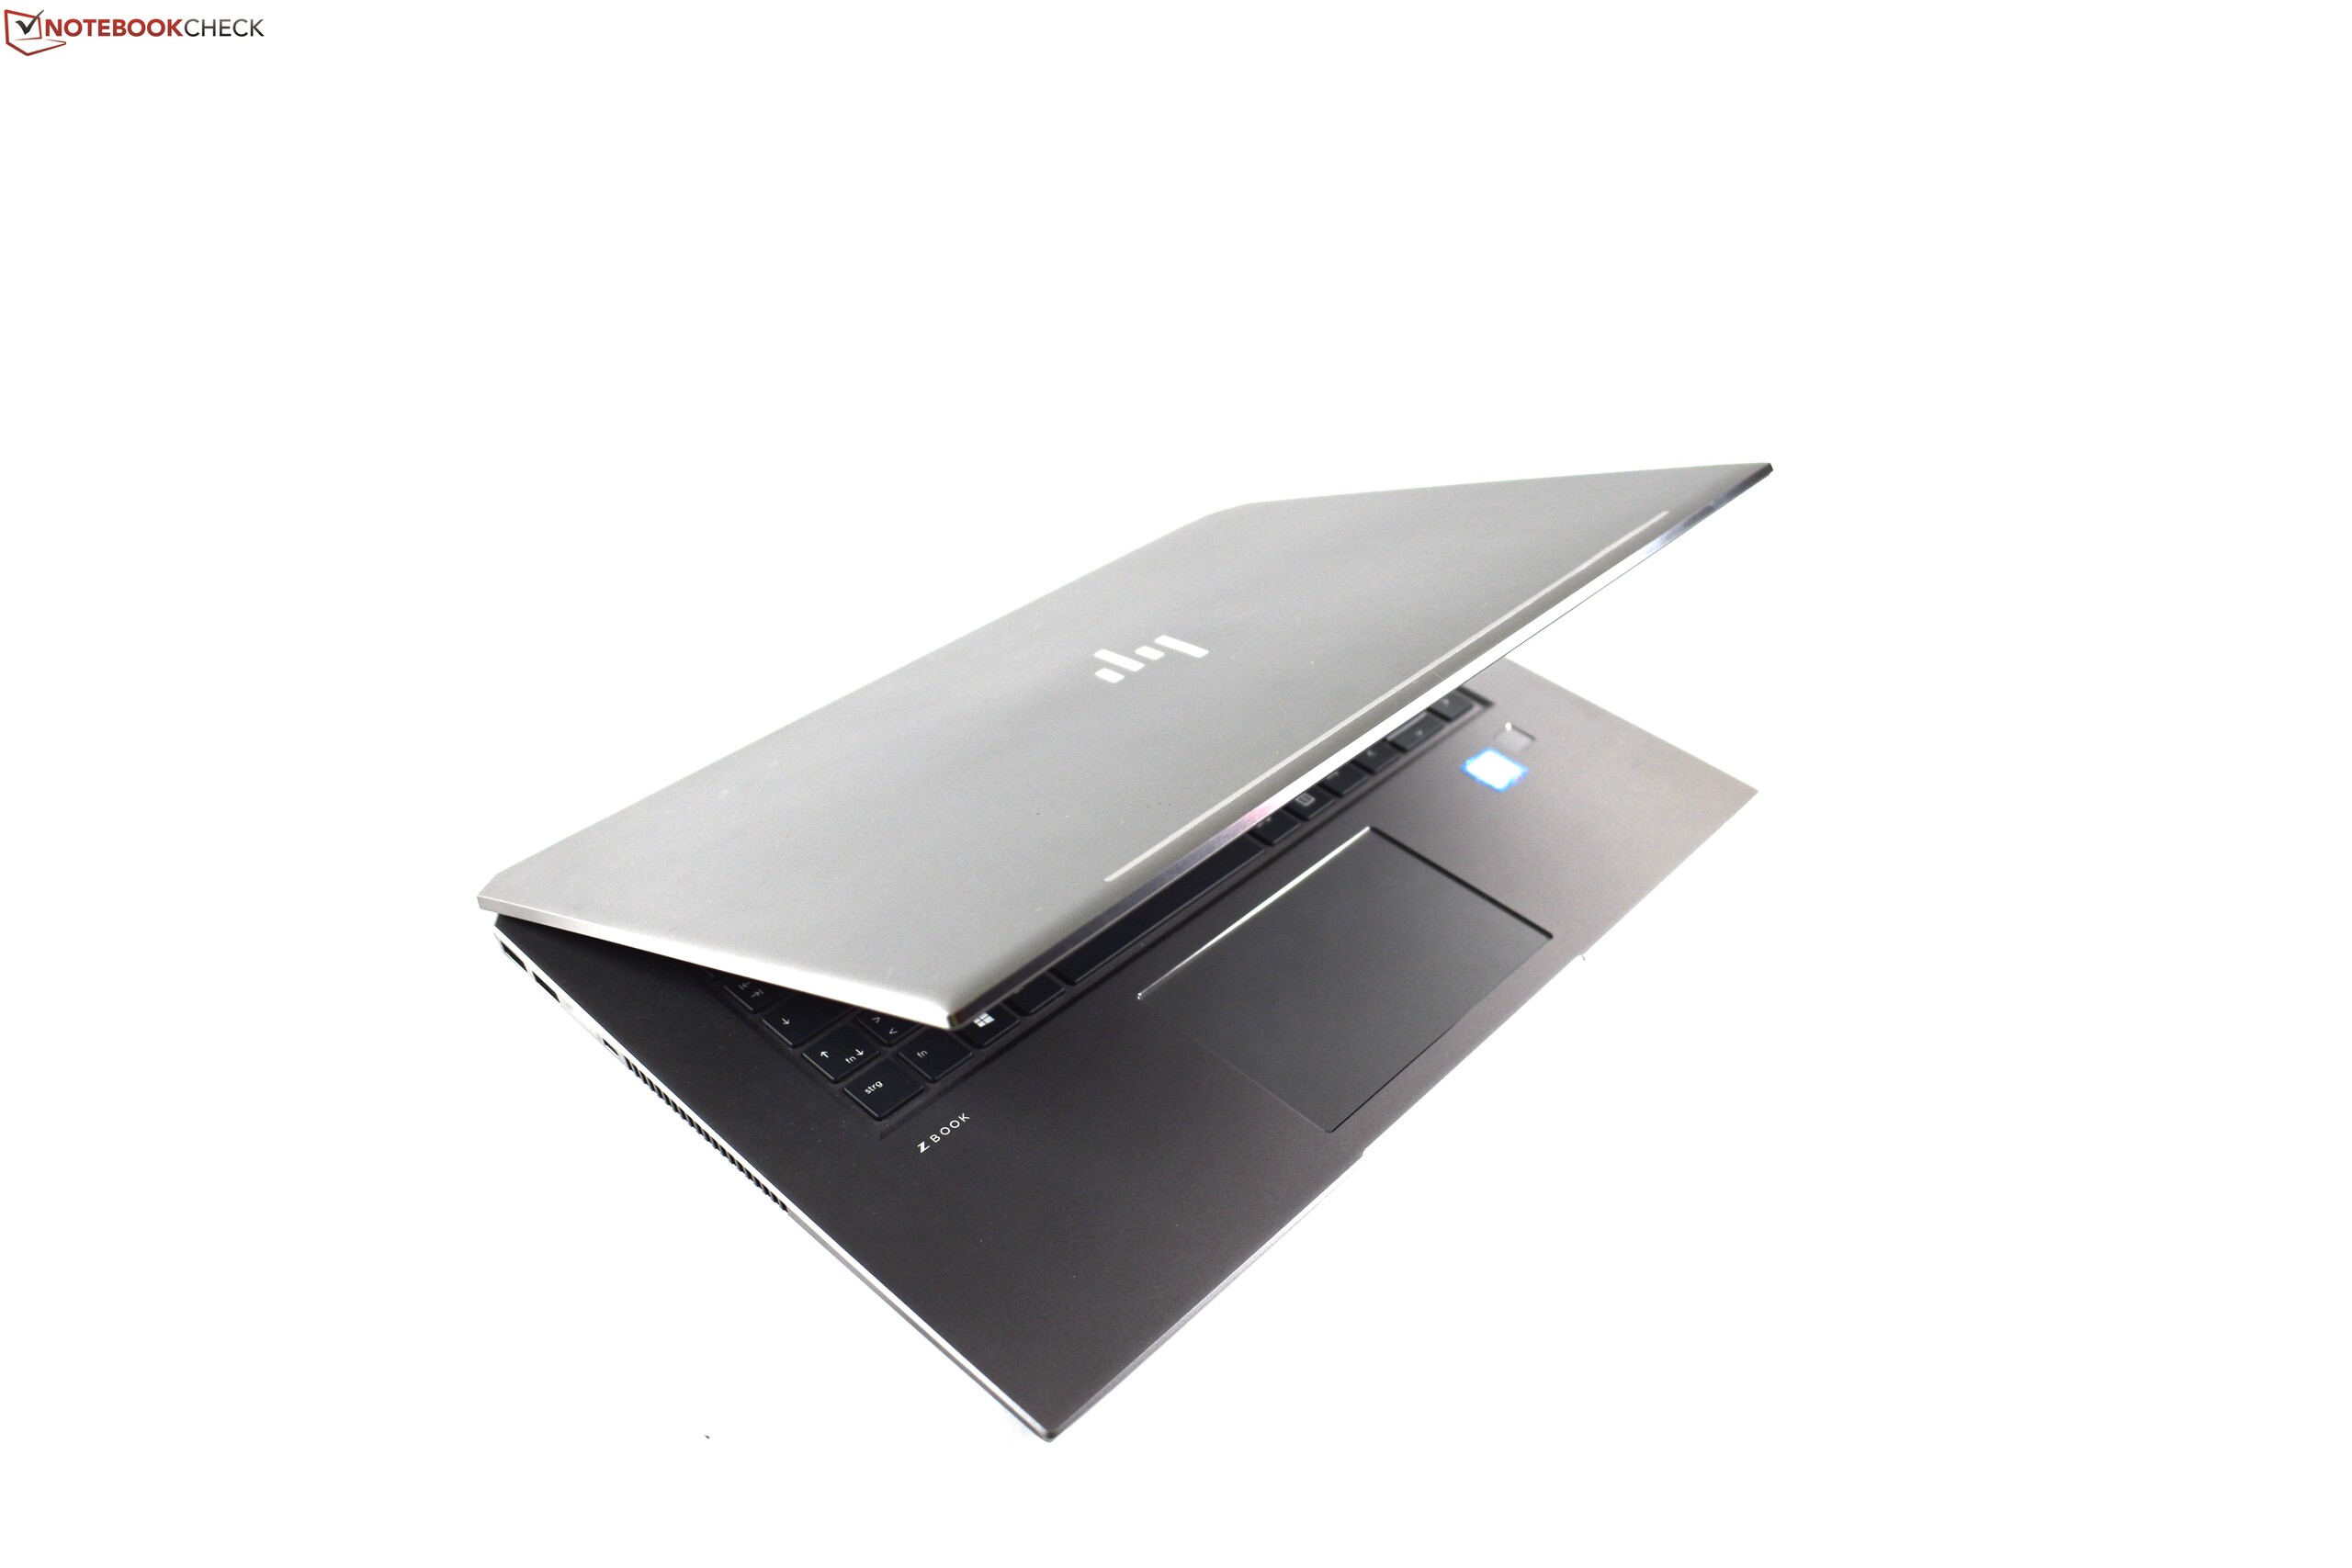
HP ZBook Studio G5 lyckades bra i vår recension – därför fick den en poängsumma på 87% och omdömet "bra". Den delar de flesta av sina bästa funktioner med EliteBook 1050 G1.
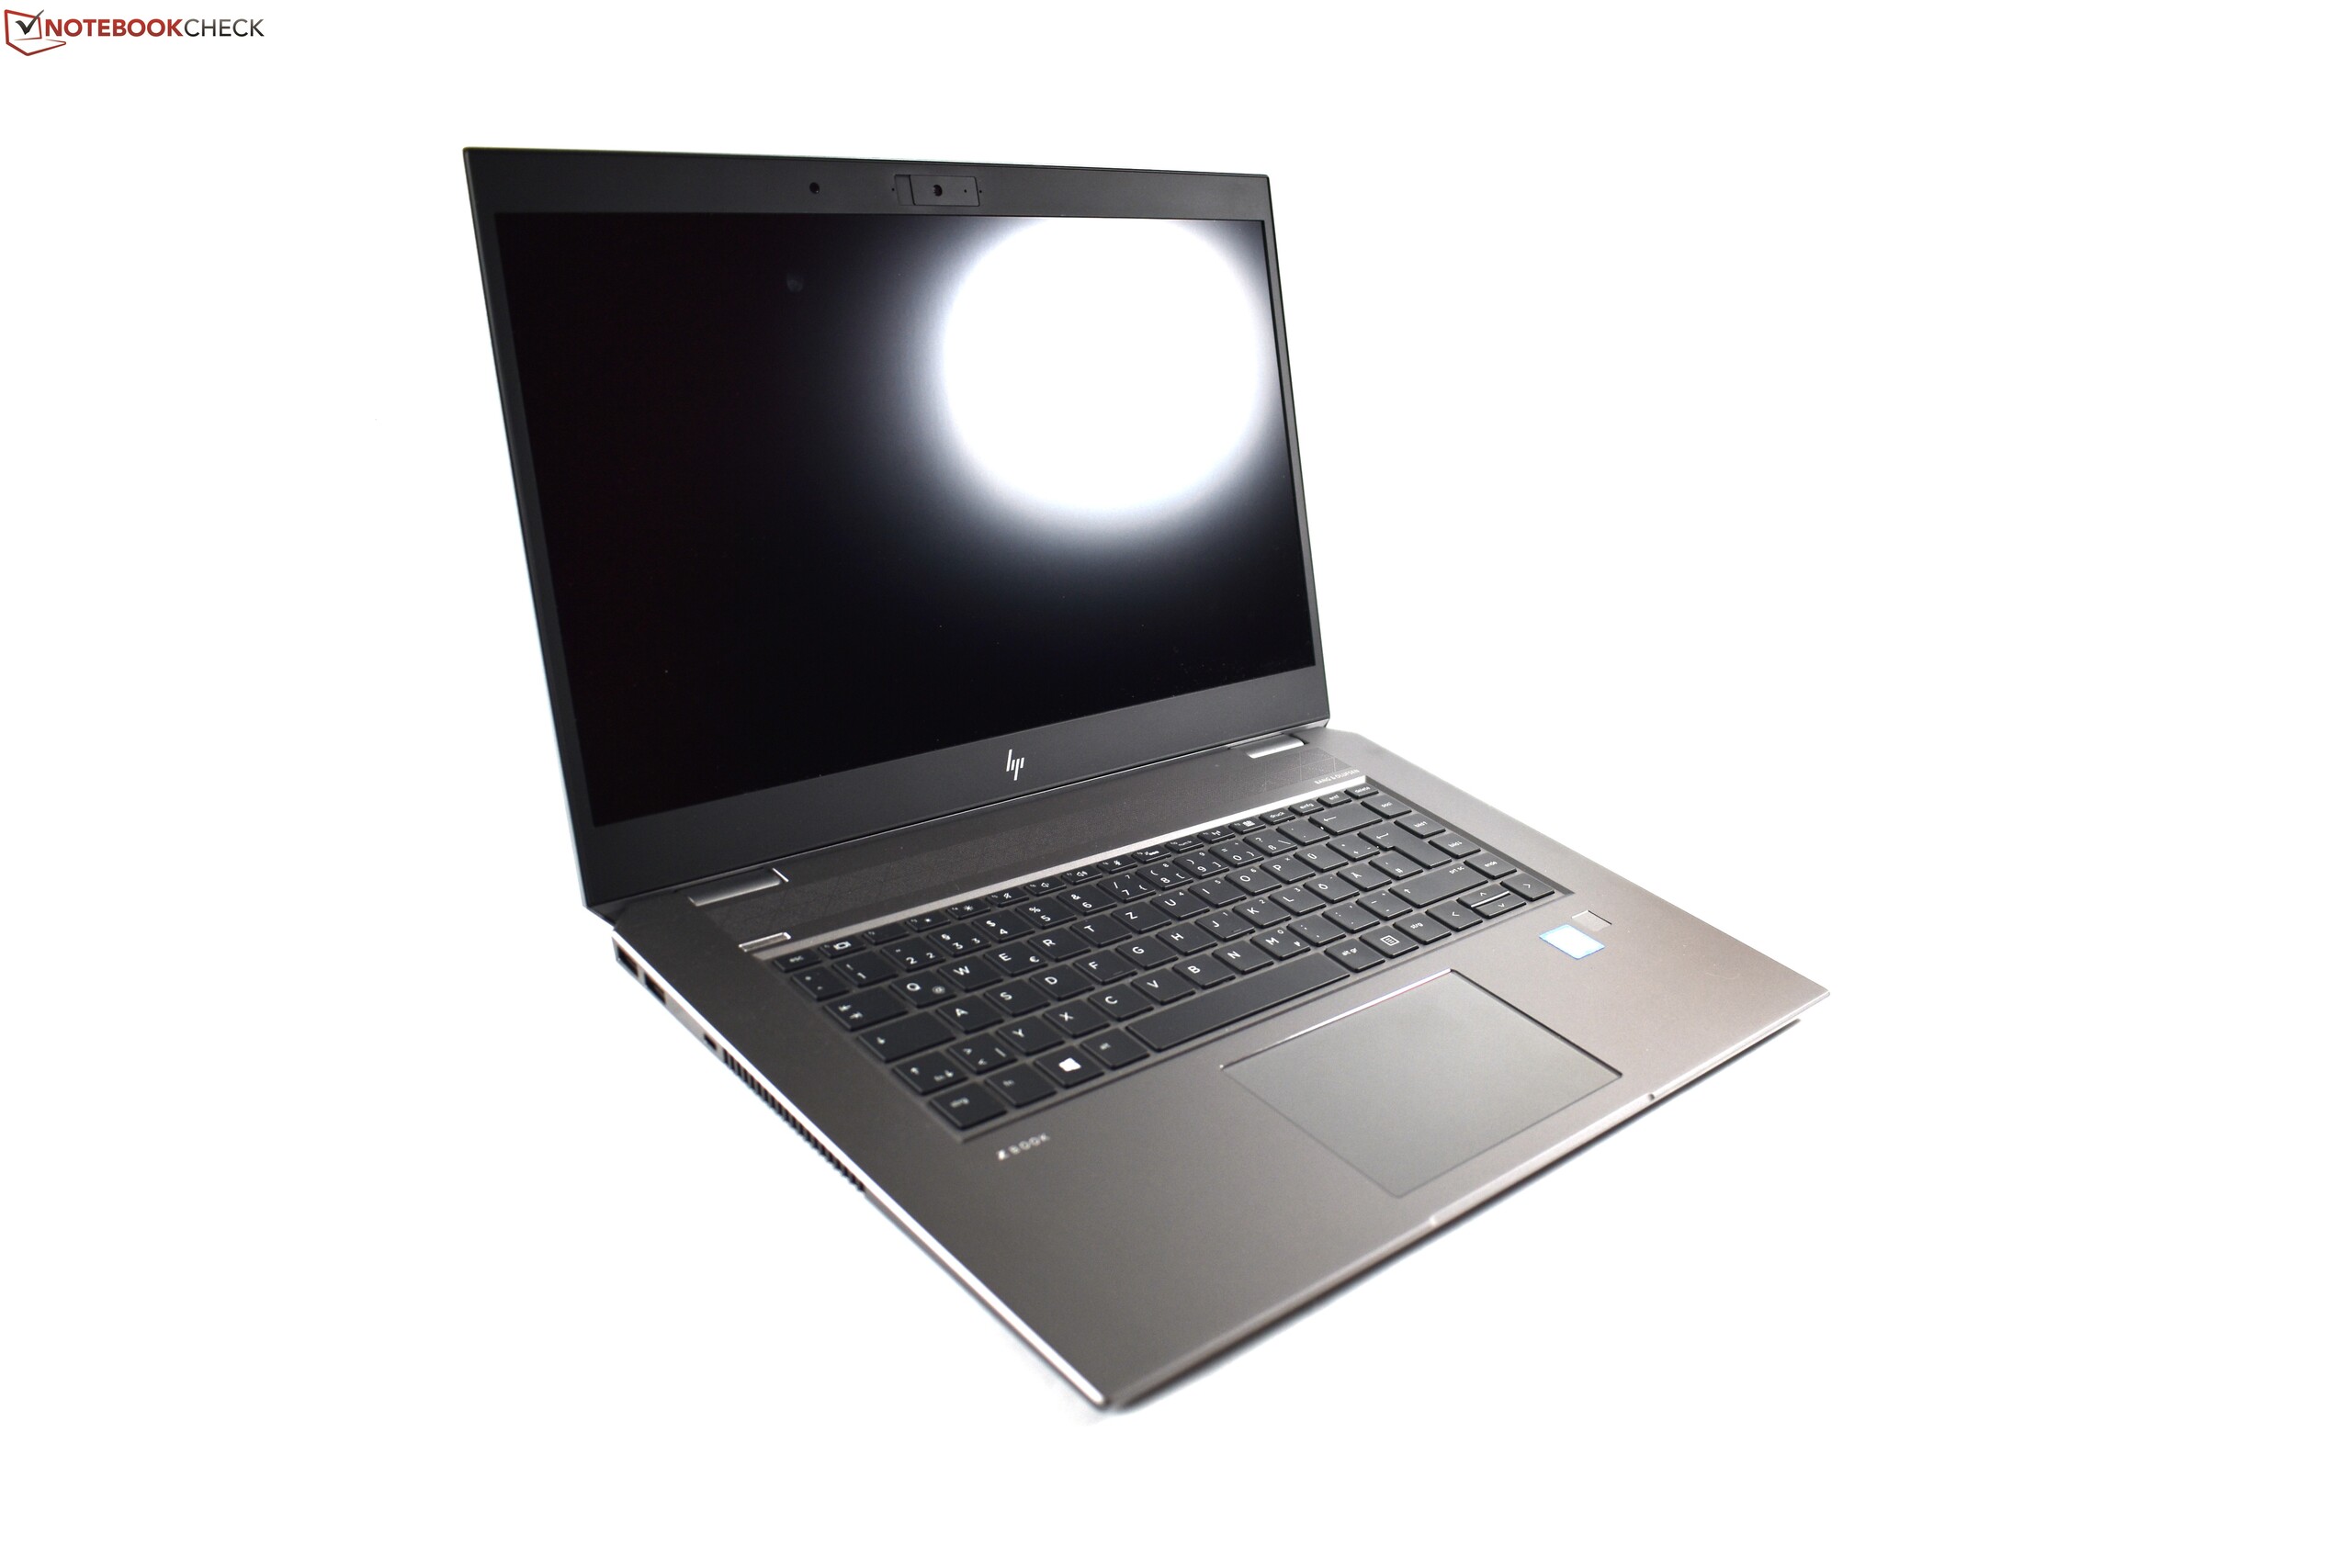
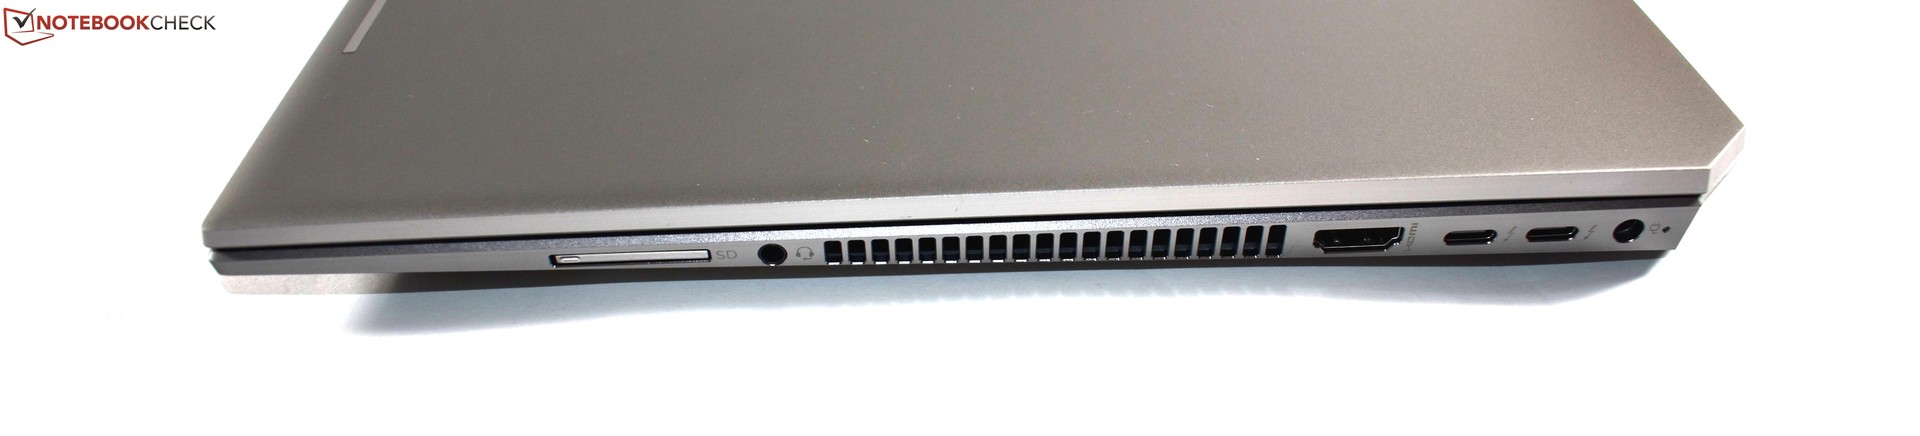
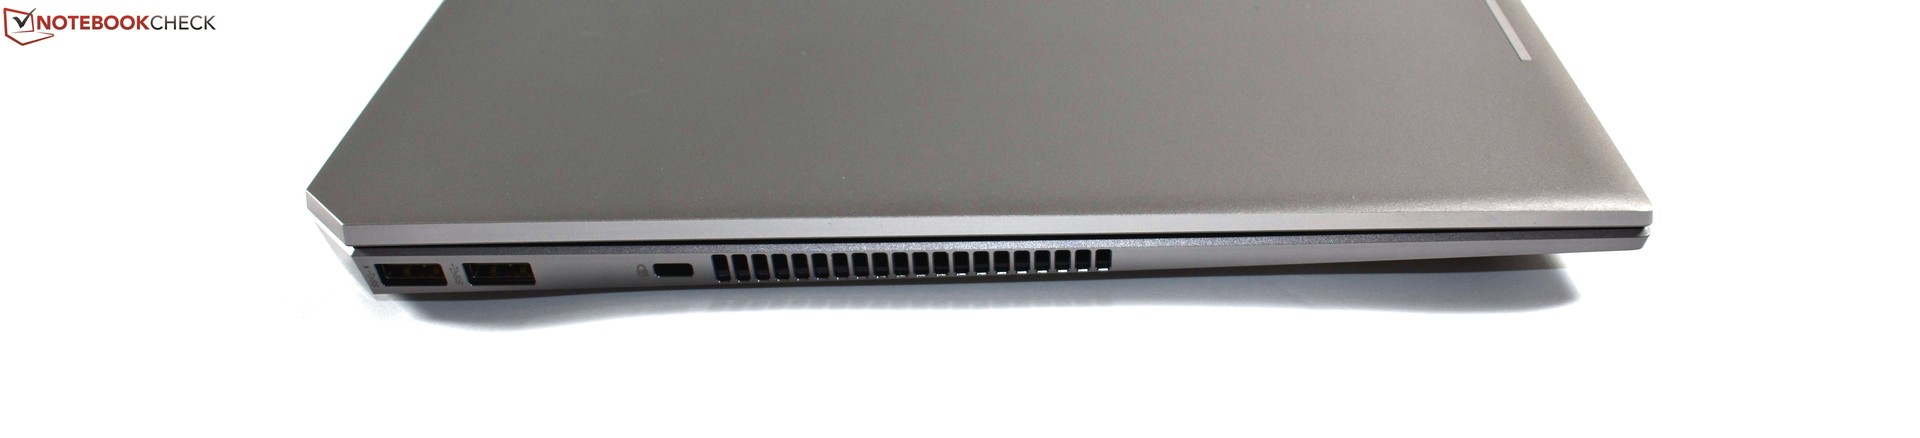
Det är förstås inte förvånande med tanke på att ZBook Studio använder samma helgjutna chassi som EliteBook 1050 G1 – men i grått istället för silver. Annat som är identiskt: det bekväma tangentbordet, det stora batteriet, portutbudet, de lovvärda uppgraderingsmöjligheterna, den utmärkta CPU-prestandan samt styrplattan. Vår recensionsenhet använder exakt samma AOU LCD-skärm som sitt EliteBook-syskon. Skillnaderna är vid en första anblick mindre uppenbara: Den viktigaste skillnaden är att den har en annan GPU – medans ZBook använder det CAD-optimerade Quadro P1000 använder HP det snabbare Nvidia GeForce GTX 1050 Max-Q i EliteBook. Detta ger ZBook en nackdel i fråga om GPU-prestanda, åtminstone tills det finns konfigurationer med Quadro P2000 tillgängliga. Utöver det bör det noteras att ZBook har Dreamcolor-skärmen som tillval vilket tyvärr EliteBook 1050 G1 inte har.
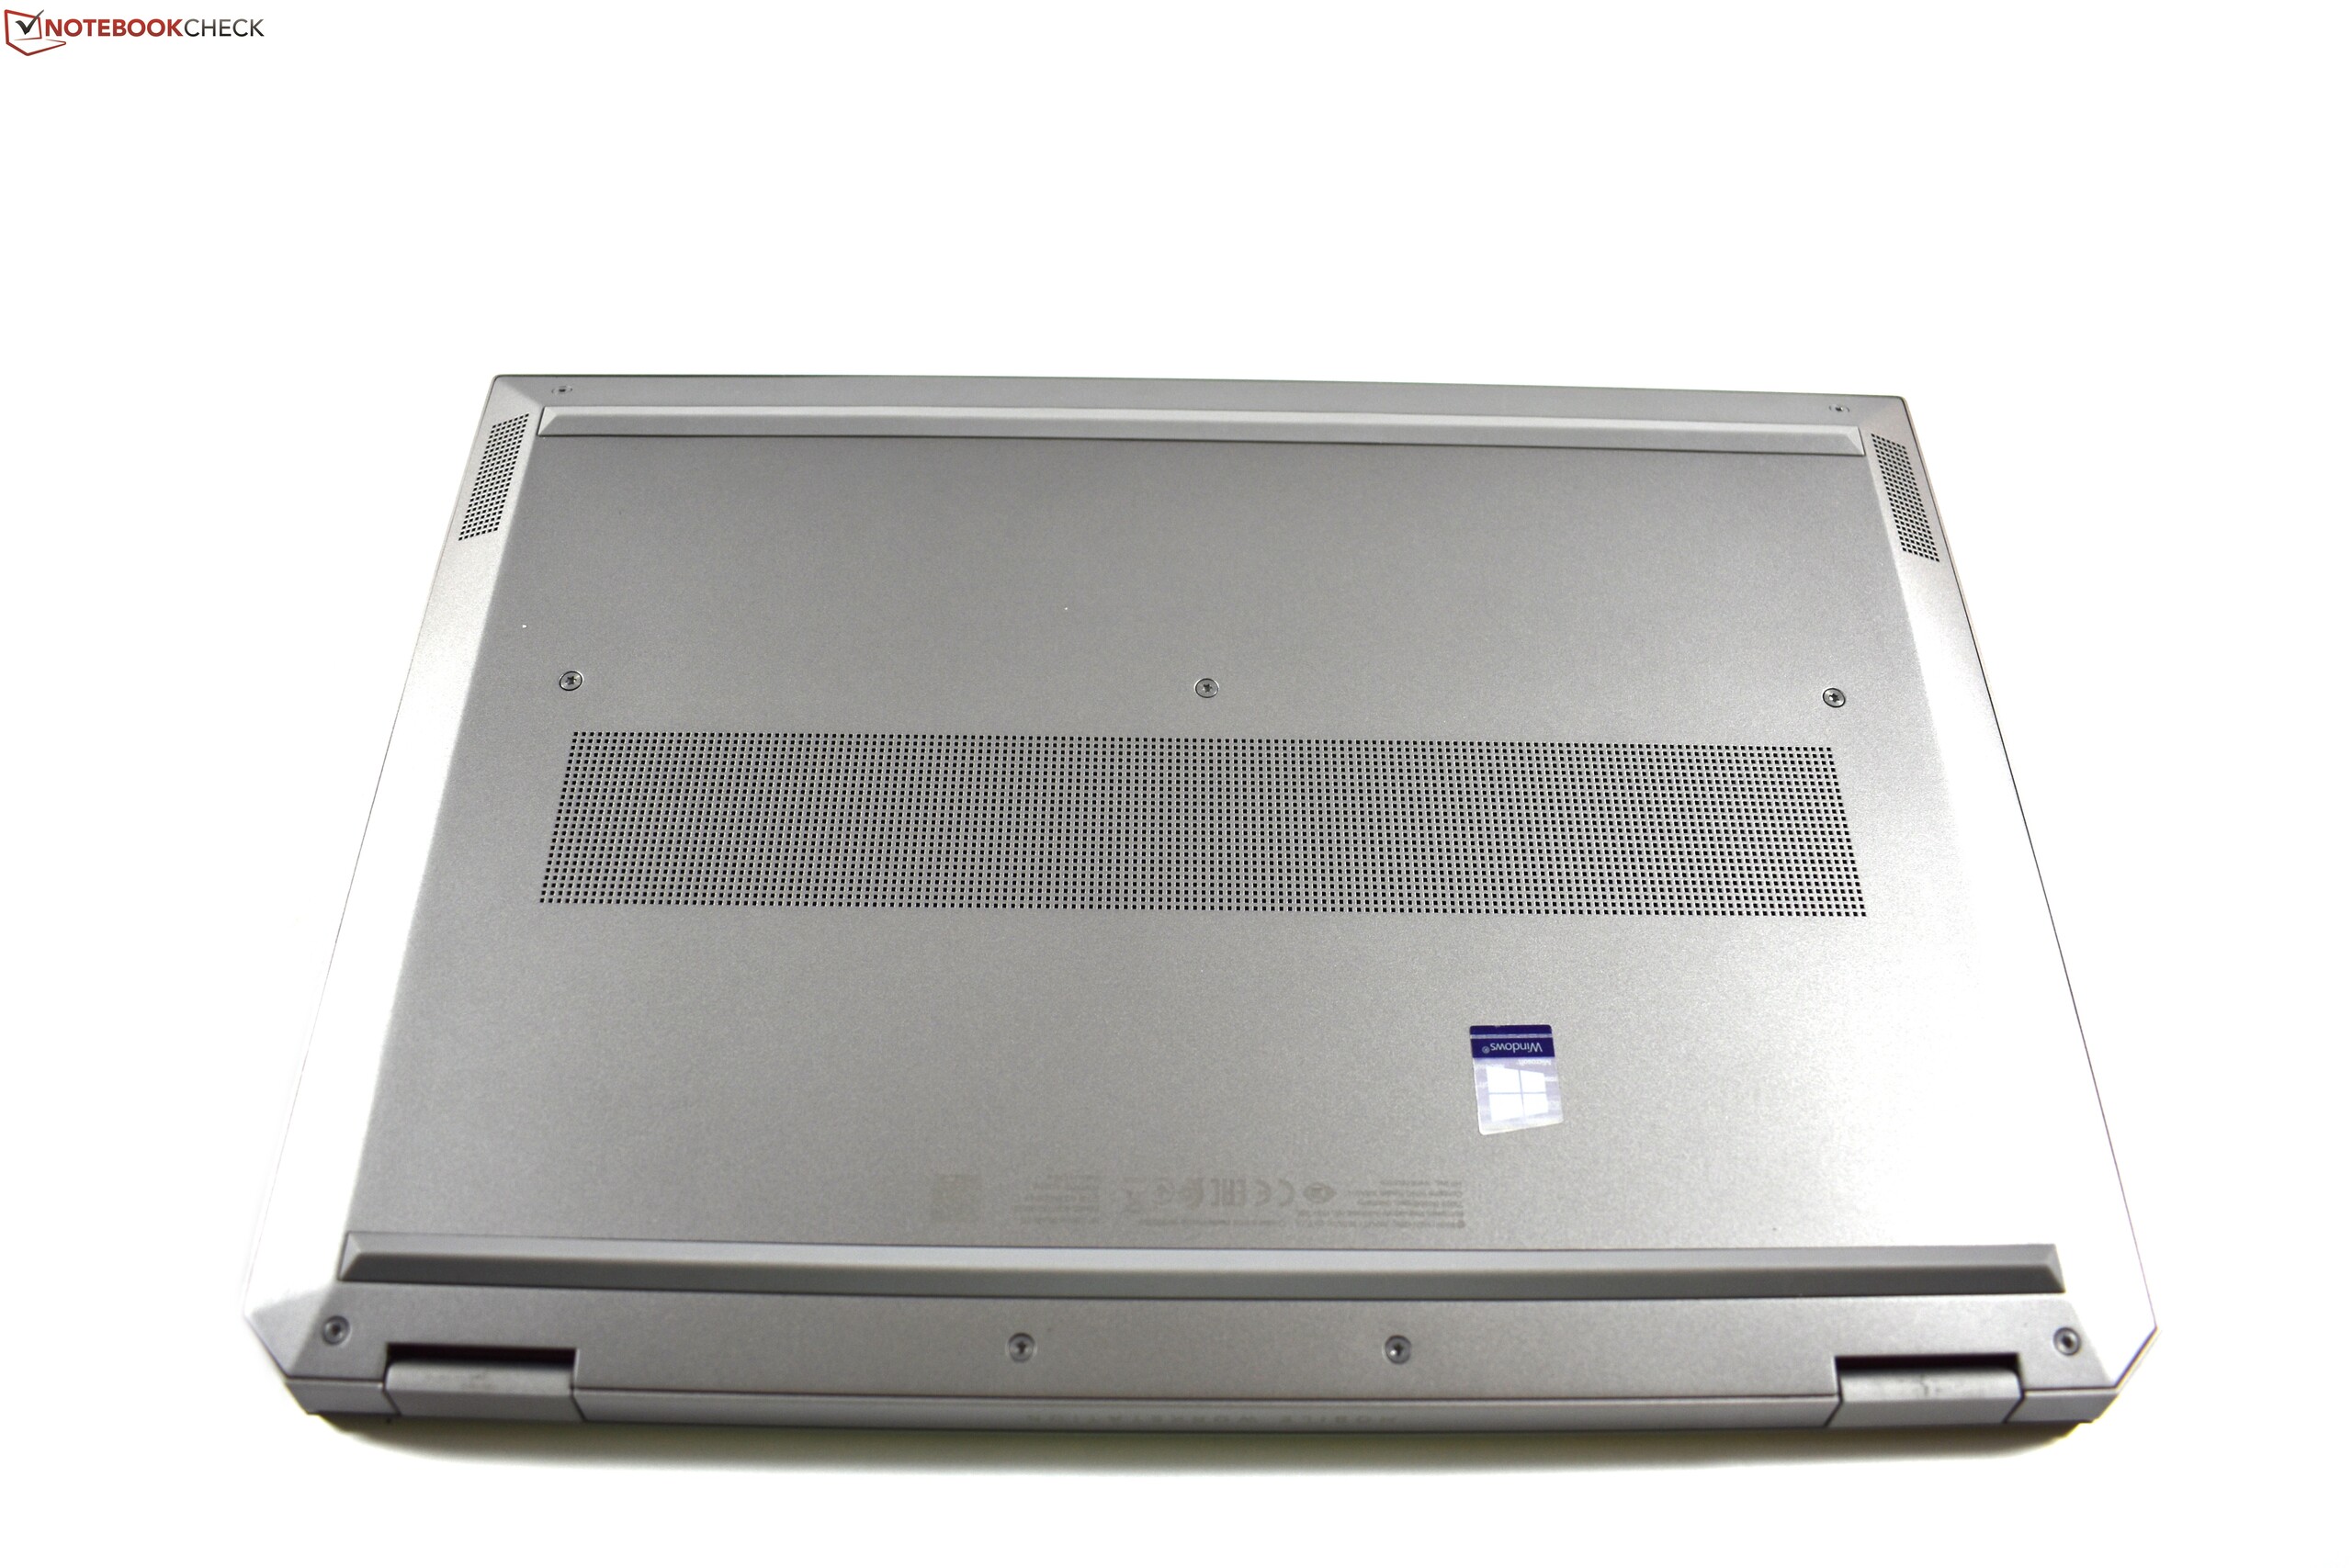
Bristen på GPU-prestanda håller i sig vid jämförelsen med Lenovo ThinkPad P1 och Dell Precision 5530: Båda kommer med Quadro P2000 vilket ZBook inte gör, åtminstone inte för tillfället. Den delar också andra brister med EliteBook 1050. Dessa inkluderar högre vikt än konkurrenterna, dålig placering av fläktventilerna och prestandastrypning vid batteridrift. Sist men inte minst: ZBook Studio G5 är en riktigt dyr enhet.
Övertygande: ZBook Studio G5 är en gedigen arbetsstation med få svaga punkter.
Totalt sett förtjänar ZBook verkligen vår rekommendation. Om den är att föredra framför Lenovo ThinkPad P1 eller Dell Precision 5530 är en fråga om smak eller krav på funktioner.
HP ZBook Studio G5-4QH10EA
- 03/26/2020 v7 (old)
Benjamin Herzig
Price comparison
