Test: MSI GT75 8RG Titan (i9-8950HK, GTX 1080, Full-HD) Laptop (Sammanfattning)
| SD Card Reader | |
| average JPG Copy Test (av. of 3 runs) | |
| Aorus X9 DT (Toshiba Exceria Pro SDXC 64 GB UHS-II) | |
| Asus G703 (Toshiba Exceria Pro SDXC 64 GB UHS-II) | |
| Genomsnitt av klass Gaming (20.9 - 210, n=54, senaste 2 åren) | |
| MSI GT75 8RG-090 Titan (Toshiba Exceria Pro SDXC 64 GB UHS-II) | |
| Acer Predator 17 X GX-792-76DL (Toshiba Exceria Pro SDXC 64 GB UHS-II) | |
| HP Omen X 17-ap0xx (Toshiba Exceria Pro SDXC 64 GB UHS-II) | |
| maximum AS SSD Seq Read Test (1GB) | |
| Aorus X9 DT (Toshiba Exceria Pro SDXC 64 GB UHS-II) | |
| Asus G703 (Toshiba Exceria Pro SDXC 64 GB UHS-II) | |
| Genomsnitt av klass Gaming (25.5 - 261, n=51, senaste 2 åren) | |
| Acer Predator 17 X GX-792-76DL (Toshiba Exceria Pro SDXC 64 GB UHS-II) | |
| HP Omen X 17-ap0xx (Toshiba Exceria Pro SDXC 64 GB UHS-II) | |
| MSI GT75 8RG-090 Titan (Toshiba Exceria Pro SDXC 64 GB UHS-II) | |
| |||||||||||||||||||||||||
Distribution av ljusstyrkan: 83 %
Mitt på batteriet: 240 cd/m²
Kontrast: 1091:1 (Svärta: 0.22 cd/m²)
ΔE ColorChecker Calman: 2.14 | ∀{0.5-29.43 Ø4.71}
calibrated: 1.54
ΔE Greyscale Calman: 1.62 | ∀{0.09-98 Ø4.96}
100% sRGB (Argyll 1.6.3 3D)
77% AdobeRGB 1998 (Argyll 1.6.3 3D)
86.2% AdobeRGB 1998 (Argyll 3D)
100% sRGB (Argyll 3D)
90.9% Display P3 (Argyll 3D)
Gamma: 2.28
CCT: 6846 K
| MSI GT75 8RG-090 Titan CMN N173HHE-G32 (CMN1747), TN, 1920x1080 | Aorus X9 DT AUO B173HAN03.0 (AUO309D), IPS, 1920x1080 | Asus G703 AUO B173HAN03.0 (AUO309D), IPS, 1920x1080 | Acer Predator 17 X GX-792-76DL LP173WF4-SPF5 (LGD056D), IPS, 1920x1080 | HP Omen X 17-ap0xx AU Optronics B173HW01, IPS, 1920x1080 | Alienware 17 R4 TN LED, 2560x1440 | |
|---|---|---|---|---|---|---|
| Display | -19% | -20% | -24% | -23% | -27% | |
| Display P3 Coverage (%) | 90.9 | 66.8 -27% | 65.5 -28% | 66 -27% | 63.7 -30% | 61.2 -33% |
| sRGB Coverage (%) | 100 | 92.1 -8% | 92.4 -8% | 83.7 -16% | 88.2 -12% | 82.9 -17% |
| AdobeRGB 1998 Coverage (%) | 86.2 | 67.3 -22% | 66.6 -23% | 61.2 -29% | 64.2 -26% | 60.5 -30% |
| Response Times | -122% | -110% | -432% | -457% | -202% | |
| Response Time Grey 50% / Grey 80% * (ms) | 8 ? | 18.4 ? -130% | 17.6 ? -120% | 45 ? -463% | 44 ? -450% | 30 ? -275% |
| Response Time Black / White * (ms) | 5.6 ? | 12 ? -114% | 11.2 ? -100% | 28 ? -400% | 31.6 ? -464% | 12.8 ? -129% |
| PWM Frequency (Hz) | 26000 ? | |||||
| Screen | 11% | -33% | -31% | -19% | -60% | |
| Brightness middle (cd/m²) | 240 | 280 17% | 274 14% | 380 58% | 343 43% | 402.3 68% |
| Brightness (cd/m²) | 248 | 262 6% | 268 8% | 362 46% | 332 34% | 372 50% |
| Brightness Distribution (%) | 83 | 86 4% | 80 -4% | 91 10% | 83 0% | 86 4% |
| Black Level * (cd/m²) | 0.22 | 0.22 -0% | 0.29 -32% | 0.37 -68% | 0.35 -59% | 0.62 -182% |
| Contrast (:1) | 1091 | 1273 17% | 945 -13% | 1027 -6% | 980 -10% | 649 -41% |
| Colorchecker dE 2000 * | 2.14 | 1.78 17% | 3.99 -86% | 4.12 -93% | 3.35 -57% | 5.6 -162% |
| Colorchecker dE 2000 max. * | 5.04 | 3.91 22% | 7.33 -45% | 8.19 -63% | 5.62 -12% | 9.8 -94% |
| Colorchecker dE 2000 calibrated * | 1.54 | 1.79 -16% | 2.5 -62% | |||
| Greyscale dE 2000 * | 1.62 | 0.74 54% | 4.14 -156% | 3.95 -144% | 2.4 -48% | 4.7 -190% |
| Gamma | 2.28 96% | 2.43 91% | 2.58 85% | 2.47 89% | 2.35 94% | 2.14 103% |
| CCT | 6846 95% | 6494 100% | 7352 88% | 6539 99% | 6495 100% | 7519 86% |
| Color Space (Percent of AdobeRGB 1998) (%) | 77 | 60 -22% | 60 -22% | 55 -29% | 57 -26% | 53.7 -30% |
| Color Space (Percent of sRGB) (%) | 100 | 92 -8% | 92 -8% | 84 -16% | 88 -12% | 82.2 -18% |
| Totalt genomsnitt (program/inställningar) | -43% /
-13% | -54% /
-40% | -162% /
-83% | -166% /
-74% | -96% /
-72% |
* ... mindre är bättre
Visa svarstider
| ↔ Svarstid svart till vitt | ||
|---|---|---|
| 5.6 ms ... stiga ↗ och falla ↘ kombinerat | ↗ 3.8 ms stiga | 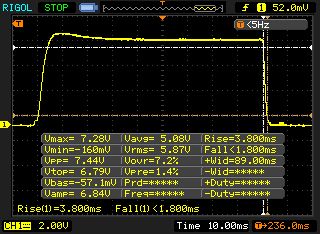 |
| ↘ 1.8 ms hösten | ||
| Skärmen visar väldigt snabba svarsfrekvenser i våra tester och borde vara mycket väl lämpad för fartfyllt spel. I jämförelse sträcker sig alla testade enheter från 0.1 (minst) till 240 (maximalt) ms. » 18 % av alla enheter är bättre. Det betyder att den uppmätta svarstiden är bättre än genomsnittet av alla testade enheter (19.8 ms). | ||
| ↔ Svarstid 50 % grått till 80 % grått | ||
| 8 ms ... stiga ↗ och falla ↘ kombinerat | ↗ 4.4 ms stiga | 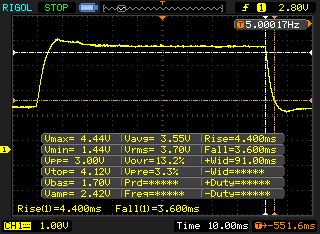 |
| ↘ 3.6 ms hösten | ||
| Skärmen visar snabba svarsfrekvenser i våra tester och bör passa för spel. I jämförelse sträcker sig alla testade enheter från 0.165 (minst) till 636 (maximalt) ms. » 21 % av alla enheter är bättre. Det betyder att den uppmätta svarstiden är bättre än genomsnittet av alla testade enheter (31 ms). | ||
Skärmflimmer / PWM (Puls-Width Modulation)
| Skärmflimmer / PWM upptäckt | 26000 Hz | ≤ 19 % ljusstyrka inställning | 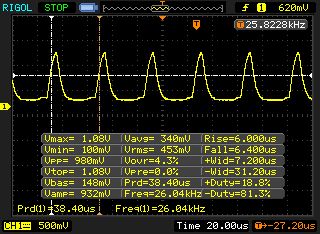 |
Displayens bakgrundsbelysning flimrar vid 26000 Hz (i värsta fall, t.ex. med PWM) Flimrande upptäckt vid en ljusstyrkeinställning på 19 % och lägre. Det ska inte finnas något flimmer eller PWM över denna ljusstyrkeinställning. Frekvensen för 26000 Hz är ganska hög, så de flesta användare som är känsliga för PWM bör inte märka något flimmer. Som jämförelse: 52 % av alla testade enheter använder inte PWM för att dämpa skärmen. Om PWM upptäcktes mättes ett medelvärde av 7754 (minst: 5 - maximum: 343500) Hz. | |||
| PCMark 10 - Score | |
| Genomsnitt av klass Gaming (5828 - 12414, n=93, senaste 2 åren) | |
| MSI GT75 8RG-090 Titan | |
| Aorus X9 DT | |
| HP Omen X 17-ap0xx | |
| Asus G703 | |
| PCMark 8 Home Score Accelerated v2 | 5720 poäng | |
| PCMark 8 Work Score Accelerated v2 | 5801 poäng | |
| PCMark 10 Score | 6558 poäng | |
Hjälp | ||
| MSI GT75 8RG-090 Titan 2x Samsung PM961 MZVLW256HEHP (RAID 0) | Aorus X9 DT Transcend TS1TMTE850 | Asus G703 2x Samsung SM961 MZVKW512HMJP NVMe (RAID 0) | Acer Predator 17 X GX-792-76DL Toshiba NVMe THNSN5512GPU7 | HP Omen X 17-ap0xx Samsung PM961 MZVLW256HEHP | Alienware 17 R4 SK Hynix PC300 NVMe 512 GB | |
|---|---|---|---|---|---|---|
| AS SSD | -41% | 13% | -19% | -18% | -35% | |
| Seq Read (MB/s) | 3058 | 1518 -50% | 3177 4% | 2261 -26% | 2352 -23% | 1752 -43% |
| Seq Write (MB/s) | 2196 | 1019 -54% | 2556 16% | 1338 -39% | 1145 -48% | 735 -67% |
| 4K Read (MB/s) | 38.37 | 22.23 -42% | 47.61 24% | 39.52 3% | 44.81 17% | 35.61 -7% |
| 4K Write (MB/s) | 97.7 | 98.9 1% | 148.4 52% | 133.8 37% | 116.2 19% | 113.4 16% |
| Score Read (Points) | 1691 | 828 -51% | 1633 -3% | 1118 -34% | 1248 -26% | 831 -51% |
| Score Write (Points) | 1553 | 916 -41% | 1519 -2% | 930 -40% | 1029 -34% | 858 -45% |
| Score Total (Points) | 4066 | 2145 -47% | 3962 -3% | 2581 -37% | 2862 -30% | 2072 -49% |

| 3DMark - 1920x1080 Fire Strike Graphics | |
| Genomsnitt av klass Gaming (12242 - 62849, n=115, senaste 2 åren) | |
| Acer Predator 17 X GX-792-76DL | |
| Aorus X9 DT | |
| Asus G703 | |
| Alienware 17 R4 | |
| MSI GT75 8RG-090 Titan | |
| HP Omen X 17-ap0xx | |
| 3DMark 11 Performance | 23175 poäng | |
| 3DMark Ice Storm Standard Score | 193287 poäng | |
| 3DMark Cloud Gate Standard Score | 42660 poäng | |
| 3DMark Fire Strike Score | 18738 poäng | |
Hjälp | ||
| The Witcher 3 - 1920x1080 Ultra Graphics & Postprocessing (HBAO+) | |
| Genomsnitt av klass Gaming (104.7 - 240, n=7, senaste 2 åren) | |
| Alienware 17 R4 | |
| Asus G703 | |
| Aorus X9 DT | |
| MSI GT75 8RG-090 Titan | |
| Acer Predator 17 X GX-792-76DL | |
| HP Omen X 17-ap0xx | |
| låg | med. | hög | ultra | |
|---|---|---|---|---|
| The Witcher 3 (2015) | 148 | 76.8 | ||
| Ghost Recon Wildlands (2017) | 110 | 60.5 | ||
| FIFA 18 (2017) | 427 | 418 | ||
| Need for Speed Payback (2017) | 145 | 141 | ||
| Star Wars Battlefront 2 (2017) | 139 | 121 | ||
| Far Cry 5 (2018) | 120 | 113 |
Ljudnivå
| Låg belastning |
| 32 / 34 / 37 dB(A) |
| Hårddisk |
| 34 dB(A) |
| Hög belastning |
| 43 / 62 dB(A) |
 | ||
30 dB tyst 40 dB(A) hörbar 50 dB(A) högt ljud |
||
min: | ||
| MSI GT75 8RG-090 Titan i9-8950HK, GeForce GTX 1080 Mobile | Aorus X9 DT i9-8950HK, GeForce GTX 1080 Mobile | Asus G703 i7-7820HK, GeForce GTX 1080 Mobile | Acer Predator 17 X GX-792-76DL i7-7820HK, GeForce GTX 1080 Mobile | HP Omen X 17-ap0xx i7-7820HK, GeForce GTX 1080 Mobile | Alienware 17 R4 i7-7820HK, GeForce GTX 1080 Mobile | |
|---|---|---|---|---|---|---|
| Noise | -7% | 1% | 3% | 11% | 1% | |
| av / miljö * (dB) | 30 | 30 -0% | 30 -0% | 30 -0% | 28.3 6% | 28.2 6% |
| Idle Minimum * (dB) | 32 | 36 -13% | 35 -9% | 33 -3% | 31.5 2% | 35.6 -11% |
| Idle Average * (dB) | 34 | 37 -9% | 36 -6% | 35 -3% | 31.6 7% | 35.6 -5% |
| Idle Maximum * (dB) | 37 | 43 -16% | 38 -3% | 37 -0% | 31.6 15% | 35.7 4% |
| Load Average * (dB) | 43 | 50 -16% | 46 -7% | 40 7% | 36.8 14% | 50.2 -17% |
| Witcher 3 ultra * (dB) | 57 | 57 -0% | 48 16% | 48.2 15% | 50.2 12% | |
| Load Maximum * (dB) | 62 | 61 2% | 54 13% | 50 19% | 52.1 16% | 50.2 19% |
* ... mindre är bättre
(-) Den maximala temperaturen på ovansidan är 47 °C / 117 F, jämfört med genomsnittet av 40.4 °C / 105 F , allt från 21.2 till 68.8 °C för klassen Gaming.
(-) Botten värms upp till maximalt 53 °C / 127 F, jämfört med genomsnittet av 43.2 °C / 110 F
(+) Vid tomgångsbruk är medeltemperaturen för ovansidan 24.9 °C / 77 F, jämfört med enhetsgenomsnittet på 33.9 °C / ### class_avg_f### F.
(±) När du spelar The Witcher 3 är medeltemperaturen för ovansidan 35.9 °C / 97 F, jämfört med enhetsgenomsnittet på 33.9 °C / ## #class_avg_f### F.
(+) Handledsstöden och pekplattan är kallare än hudtemperaturen med maximalt 30 °C / 86 F och är därför svala att ta på.
(±) Medeltemperaturen för handledsstödsområdet på liknande enheter var 28.8 °C / 83.8 F (-1.2 °C / -2.2 F).
| MSI GT75 8RG-090 Titan i9-8950HK, GeForce GTX 1080 Mobile | Aorus X9 DT i9-8950HK, GeForce GTX 1080 Mobile | Asus G703 i7-7820HK, GeForce GTX 1080 Mobile | Acer Predator 17 X GX-792-76DL i7-7820HK, GeForce GTX 1080 Mobile | HP Omen X 17-ap0xx i7-7820HK, GeForce GTX 1080 Mobile | Alienware 17 R4 i7-7820HK, GeForce GTX 1080 Mobile | |
|---|---|---|---|---|---|---|
| Heat | -2% | -13% | -5% | 14% | -9% | |
| Maximum Upper Side * (°C) | 47 | 43 9% | 55 -17% | 44.2 6% | 35.6 24% | 49.6 -6% |
| Maximum Bottom * (°C) | 53 | 55 -4% | 54 -2% | 43 19% | 39 26% | 56 -6% |
| Idle Upper Side * (°C) | 26 | 27 -4% | 29 -12% | 32.4 -25% | 24.2 7% | 29.6 -14% |
| Idle Bottom * (°C) | 27 | 29 -7% | 32 -19% | 32.8 -21% | 27.4 -1% | 29.2 -8% |
* ... mindre är bättre
MSI GT75 8RG-090 Titan ljudanalys
(+) | högtalare kan spela relativt högt (94 dB)
Bas 100 - 315 Hz
(±) | reducerad bas - i genomsnitt 9.4% lägre än medianen
(±) | linjäriteten för basen är genomsnittlig (8.7% delta till föregående frekvens)
Mellan 400 - 2000 Hz
(±) | högre mellan - i genomsnitt 6.8% högre än median
(±) | linjäriteten för mids är genomsnittlig (8.4% delta till föregående frekvens)
Högsta 2 - 16 kHz
(±) | högre toppar - i genomsnitt 5% högre än medianen
(±) | linjäriteten för toppar är genomsnittlig (7.8% delta till föregående frekvens)
Totalt 100 - 16 000 Hz
(+) | det totala ljudet är linjärt (14.4% skillnad mot median)
Jämfört med samma klass
» 27% av alla testade enheter i den här klassen var bättre, 7% liknande, 66% sämre
» Den bästa hade ett delta på 6%, genomsnittet var 18%, sämst var 132%
Jämfört med alla testade enheter
» 18% av alla testade enheter var bättre, 4% liknande, 78% sämre
» Den bästa hade ett delta på 4%, genomsnittet var 23%, sämst var 134%
Aorus X9 DT ljudanalys
(±) | högtalarljudstyrkan är genomsnittlig men bra (78 dB)
Bas 100 - 315 Hz
(±) | reducerad bas - i genomsnitt 9.3% lägre än medianen
(±) | linjäriteten för basen är genomsnittlig (9.6% delta till föregående frekvens)
Mellan 400 - 2000 Hz
(+) | balanserad mellan - endast 2.5% från medianen
(+) | mids är linjära (3.9% delta till föregående frekvens)
Högsta 2 - 16 kHz
(±) | reducerade toppar - i genomsnitt 5.2% lägre än medianen
(±) | linjäriteten för toppar är genomsnittlig (7.4% delta till föregående frekvens)
Totalt 100 - 16 000 Hz
(+) | det totala ljudet är linjärt (14.4% skillnad mot median)
Jämfört med samma klass
» 27% av alla testade enheter i den här klassen var bättre, 7% liknande, 66% sämre
» Den bästa hade ett delta på 6%, genomsnittet var 18%, sämst var 132%
Jämfört med alla testade enheter
» 18% av alla testade enheter var bättre, 4% liknande, 78% sämre
» Den bästa hade ett delta på 4%, genomsnittet var 23%, sämst var 134%
| Av/Standby | |
| Låg belastning | |
| Hög belastning |
|
Förklaring:
min: | |
| MSI GT75 8RG-090 Titan i9-8950HK, GeForce GTX 1080 Mobile | Aorus X9 DT i9-8950HK, GeForce GTX 1080 Mobile | Asus G703 i7-7820HK, GeForce GTX 1080 Mobile | Acer Predator 17 X GX-792-76DL i7-7820HK, GeForce GTX 1080 Mobile | HP Omen X 17-ap0xx i7-7820HK, GeForce GTX 1080 Mobile | Alienware 17 R4 i7-7820HK, GeForce GTX 1080 Mobile | |
|---|---|---|---|---|---|---|
| Power Consumption | 7% | 11% | 17% | 31% | 9% | |
| Idle Minimum * (Watt) | 31 | 28 10% | 26 16% | 27 13% | 21.6 30% | 37.5 -21% |
| Idle Average * (Watt) | 35 | 37 -6% | 30 14% | 32 9% | 26.4 25% | 37.6 -7% |
| Idle Maximum * (Watt) | 45 | 40 11% | 37 18% | 41 9% | 26.6 41% | 37.6 16% |
| Load Average * (Watt) | 130 | 109 16% | 123 5% | 102 22% | 95.6 26% | 122.4 6% |
| Witcher 3 ultra * (Watt) | 268 | 256 4% | 257 4% | 221.7 17% | 180.3 33% | |
| Load Maximum * (Watt) | 374 | 353 6% | 341 9% | 248 34% | 199.6 47% | 277.4 26% |
* ... mindre är bättre
| MSI GT75 8RG-090 Titan i9-8950HK, GeForce GTX 1080 Mobile, 75 Wh | Aorus X9 DT i9-8950HK, GeForce GTX 1080 Mobile, 94.24 Wh | Asus G703 i7-7820HK, GeForce GTX 1080 Mobile, 71 Wh | Acer Predator 17 X GX-792-76DL i7-7820HK, GeForce GTX 1080 Mobile, 88.8 Wh | HP Omen X 17-ap0xx i7-7820HK, GeForce GTX 1080 Mobile, 99 Wh | Alienware 17 R4 i7-7820HK, GeForce GTX 1080 Mobile, 99 Wh | |
|---|---|---|---|---|---|---|
| Batteridrifttid | 15% | -16% | 30% | 68% | 15% | |
| Reader / Idle (h) | 3.8 | 4.2 11% | 3.3 -13% | 5.2 37% | 5.8 53% | 4.6 21% |
| H.264 (h) | 2.9 | 2.4 -17% | 3.4 17% | |||
| Load (h) | 1.1 | 1.3 18% | 0.9 -18% | 1.5 36% | 2 82% | 1.2 9% |
| WiFi v1.3 (h) | 3.2 | 2.5 | 4.2 | 5.6 | 3 |
För
Emot
Läs den fullständiga versionen av den här recensionen på engelska här.
Om du kan komma över dess storlek och vikt så är MSI GT75 8RG en högkvalitativ, välutrustad och extremt kraftfull desktop-ersättning som påminner om en klassisk tower-PC. GT75 har bland annat omfattande möjligheter till service och uppgraderingar samt rikligt med anslutningar.
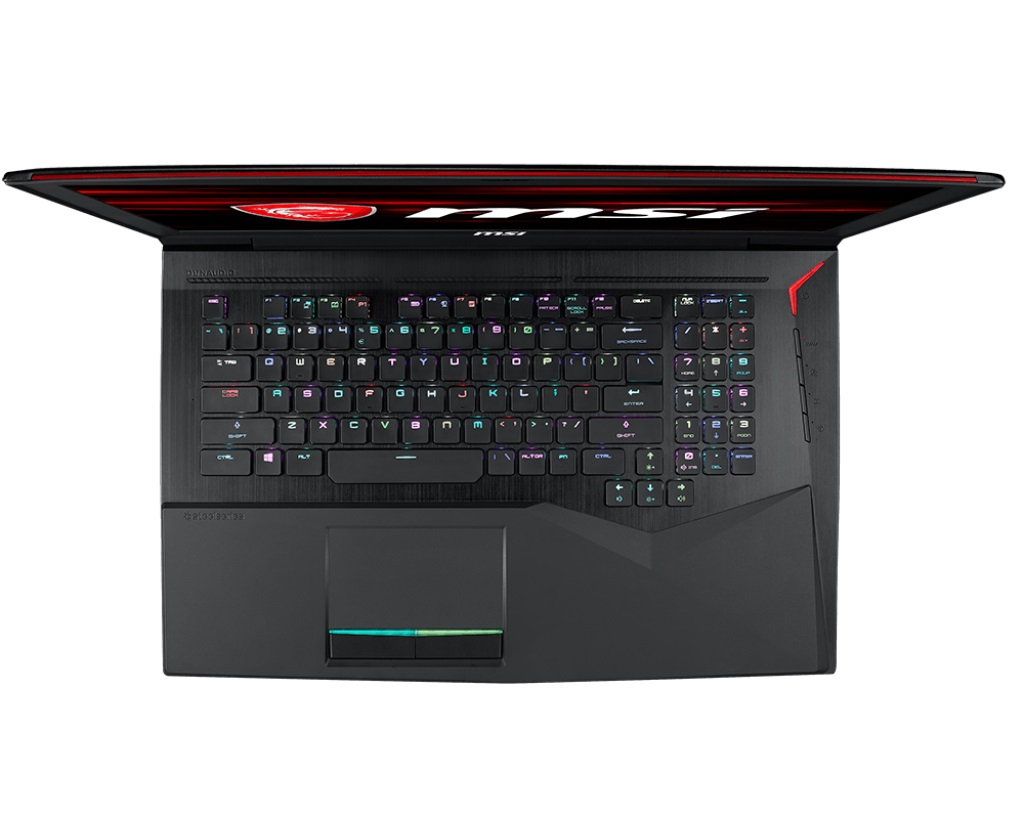
Till det har MSI byggt in en blixtsnabb och färgexakt 120 Hz-skärm och ett skapligt ljudsystem. Inmatningsenheterna är precis lika imponerande. En av höjdpunkterna med GT75 är det mekaniska tangentbordet; vars skrivupplevelse är mil framför konkurrensen.
Vi kan inte rekommendera GT75 8RG tillräckligt. Likt hos föregångaren är fläktljudet en svår punkt. Även om denna enhet på 17 tum praktiskt taget är 6 cm tjock så är fläktarna extremt högljudda vid belastning. Dom låter så mycket att du kommer behöva ett headset när du spelar. Detsamma gäller Aorus X9 DT, men den enheten är bara 3 cm tjock. Dess jämförbara prestanda visar att MSI:s kyllösning är aningen bristfällig.
MSI GT75 8RG-090 Titan
- 05/16/2018 v6 (old)
Florian Glaser
Price comparison