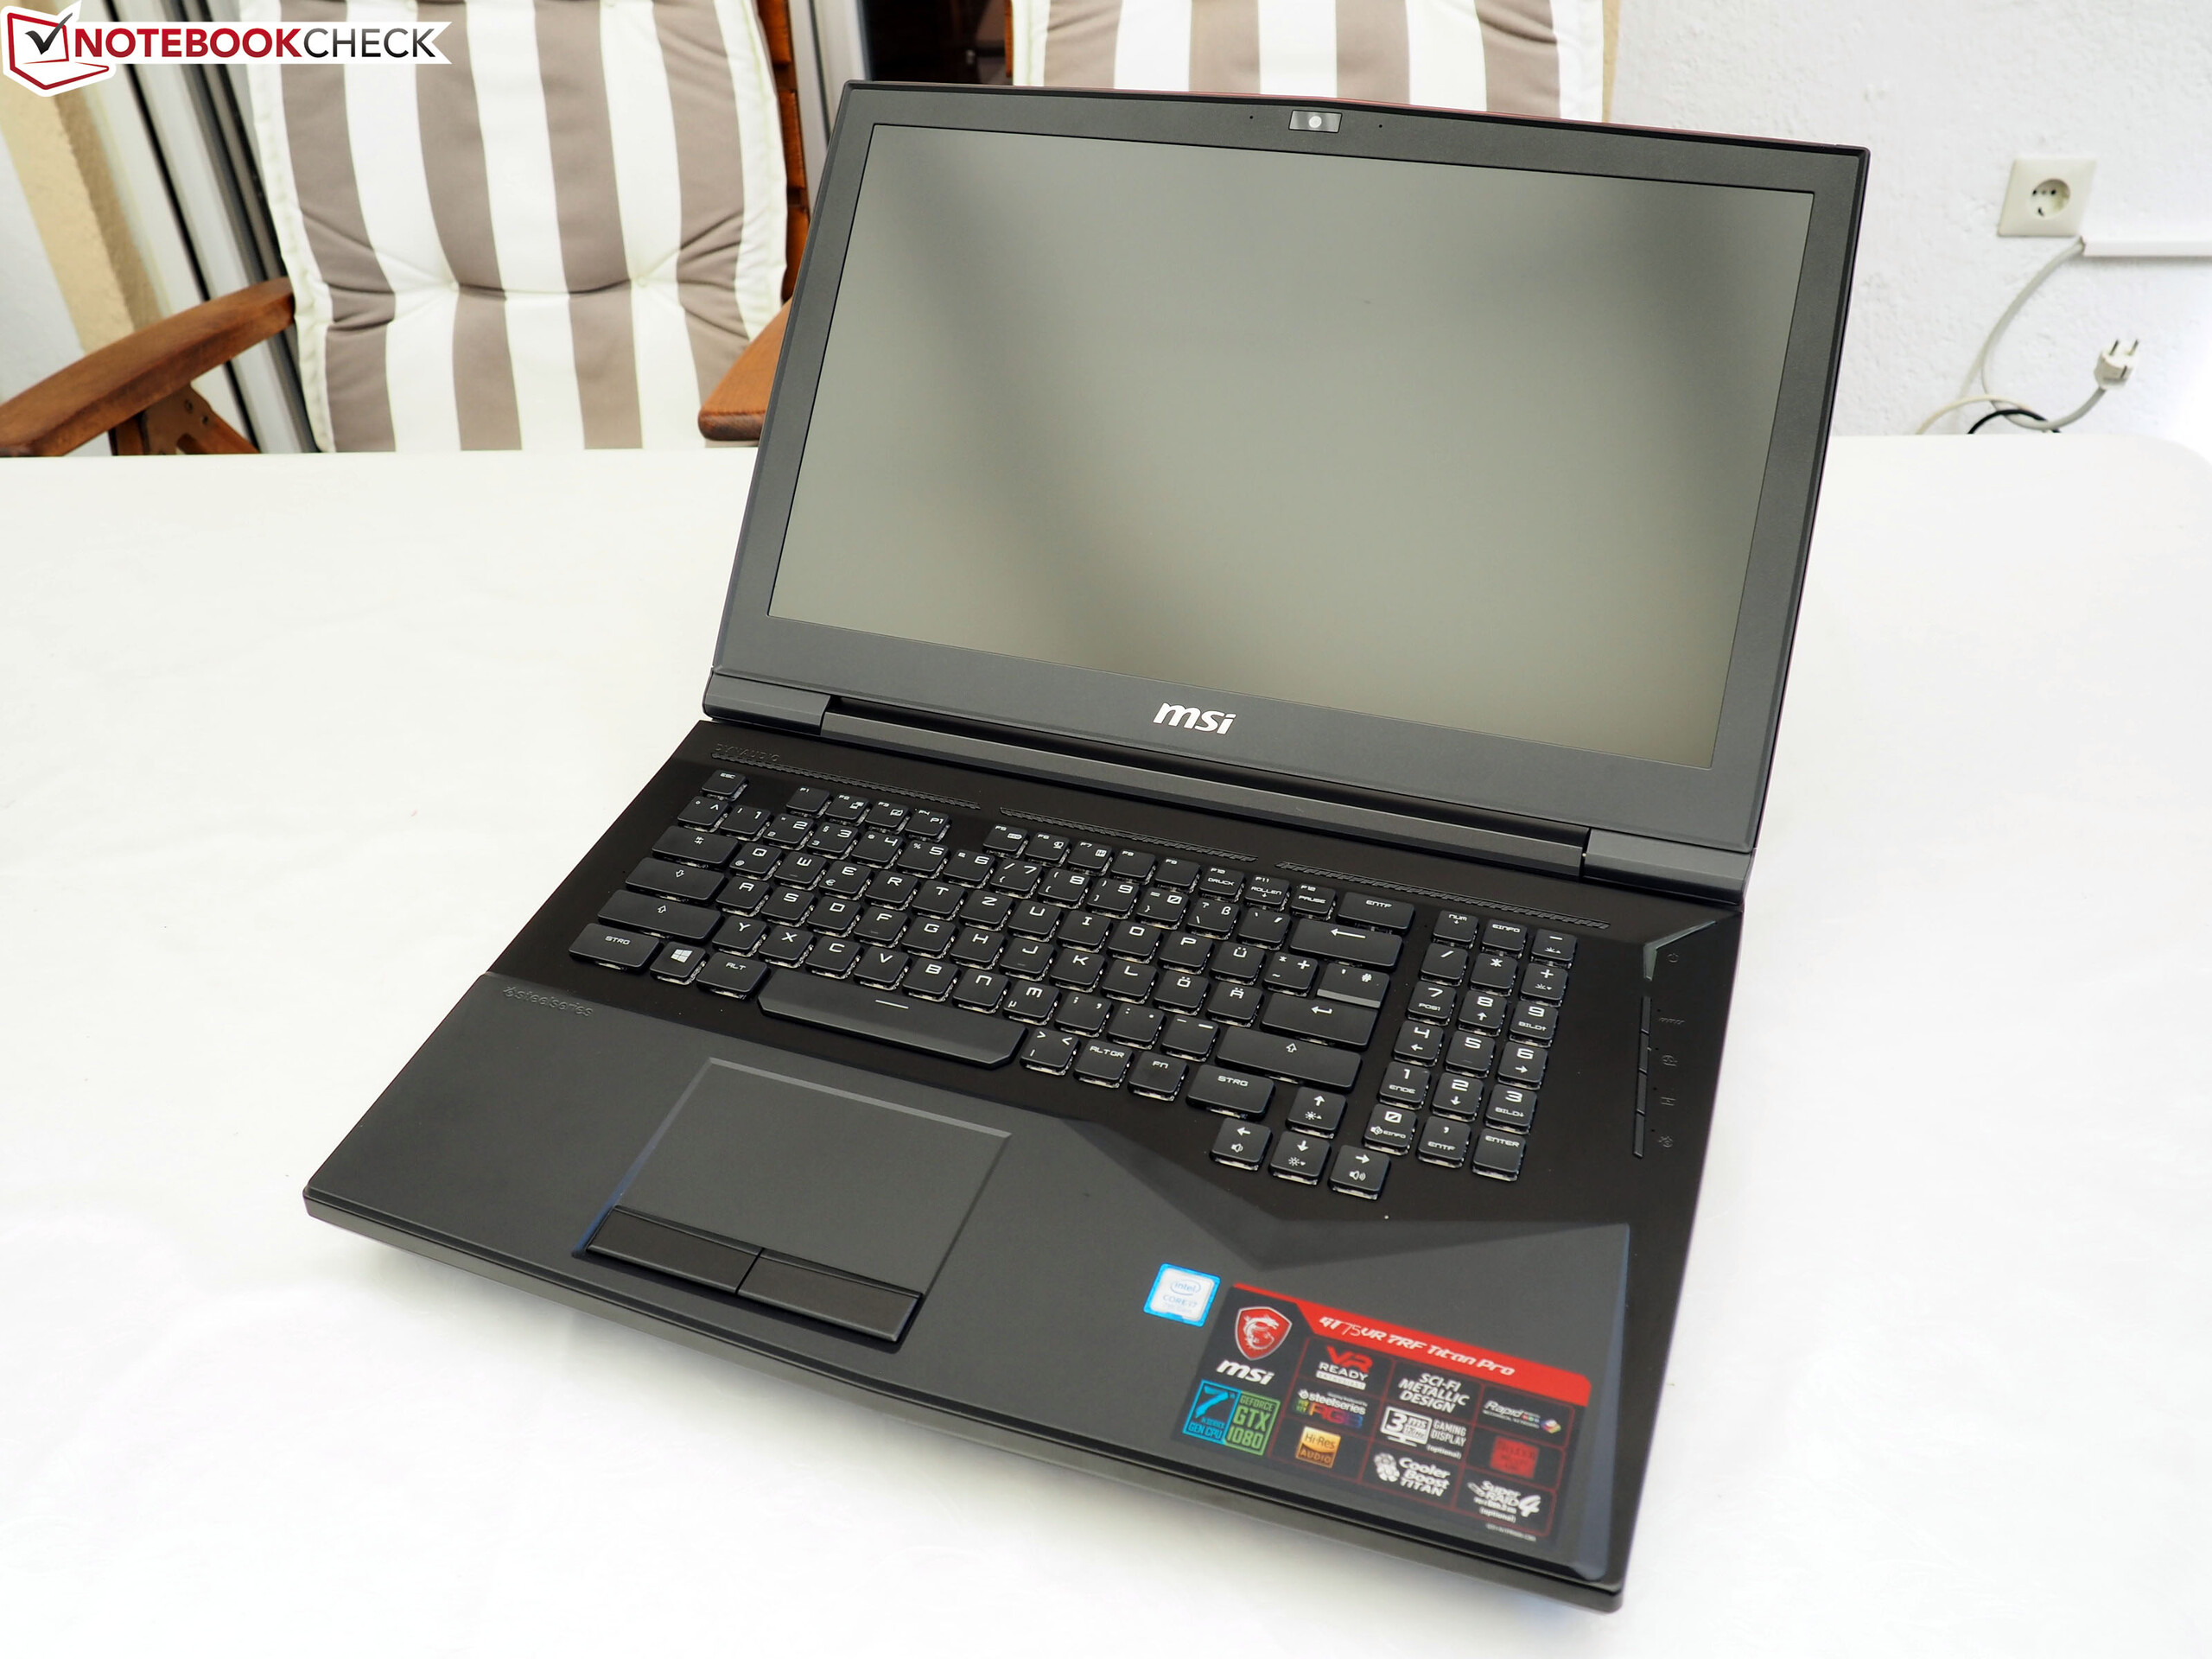
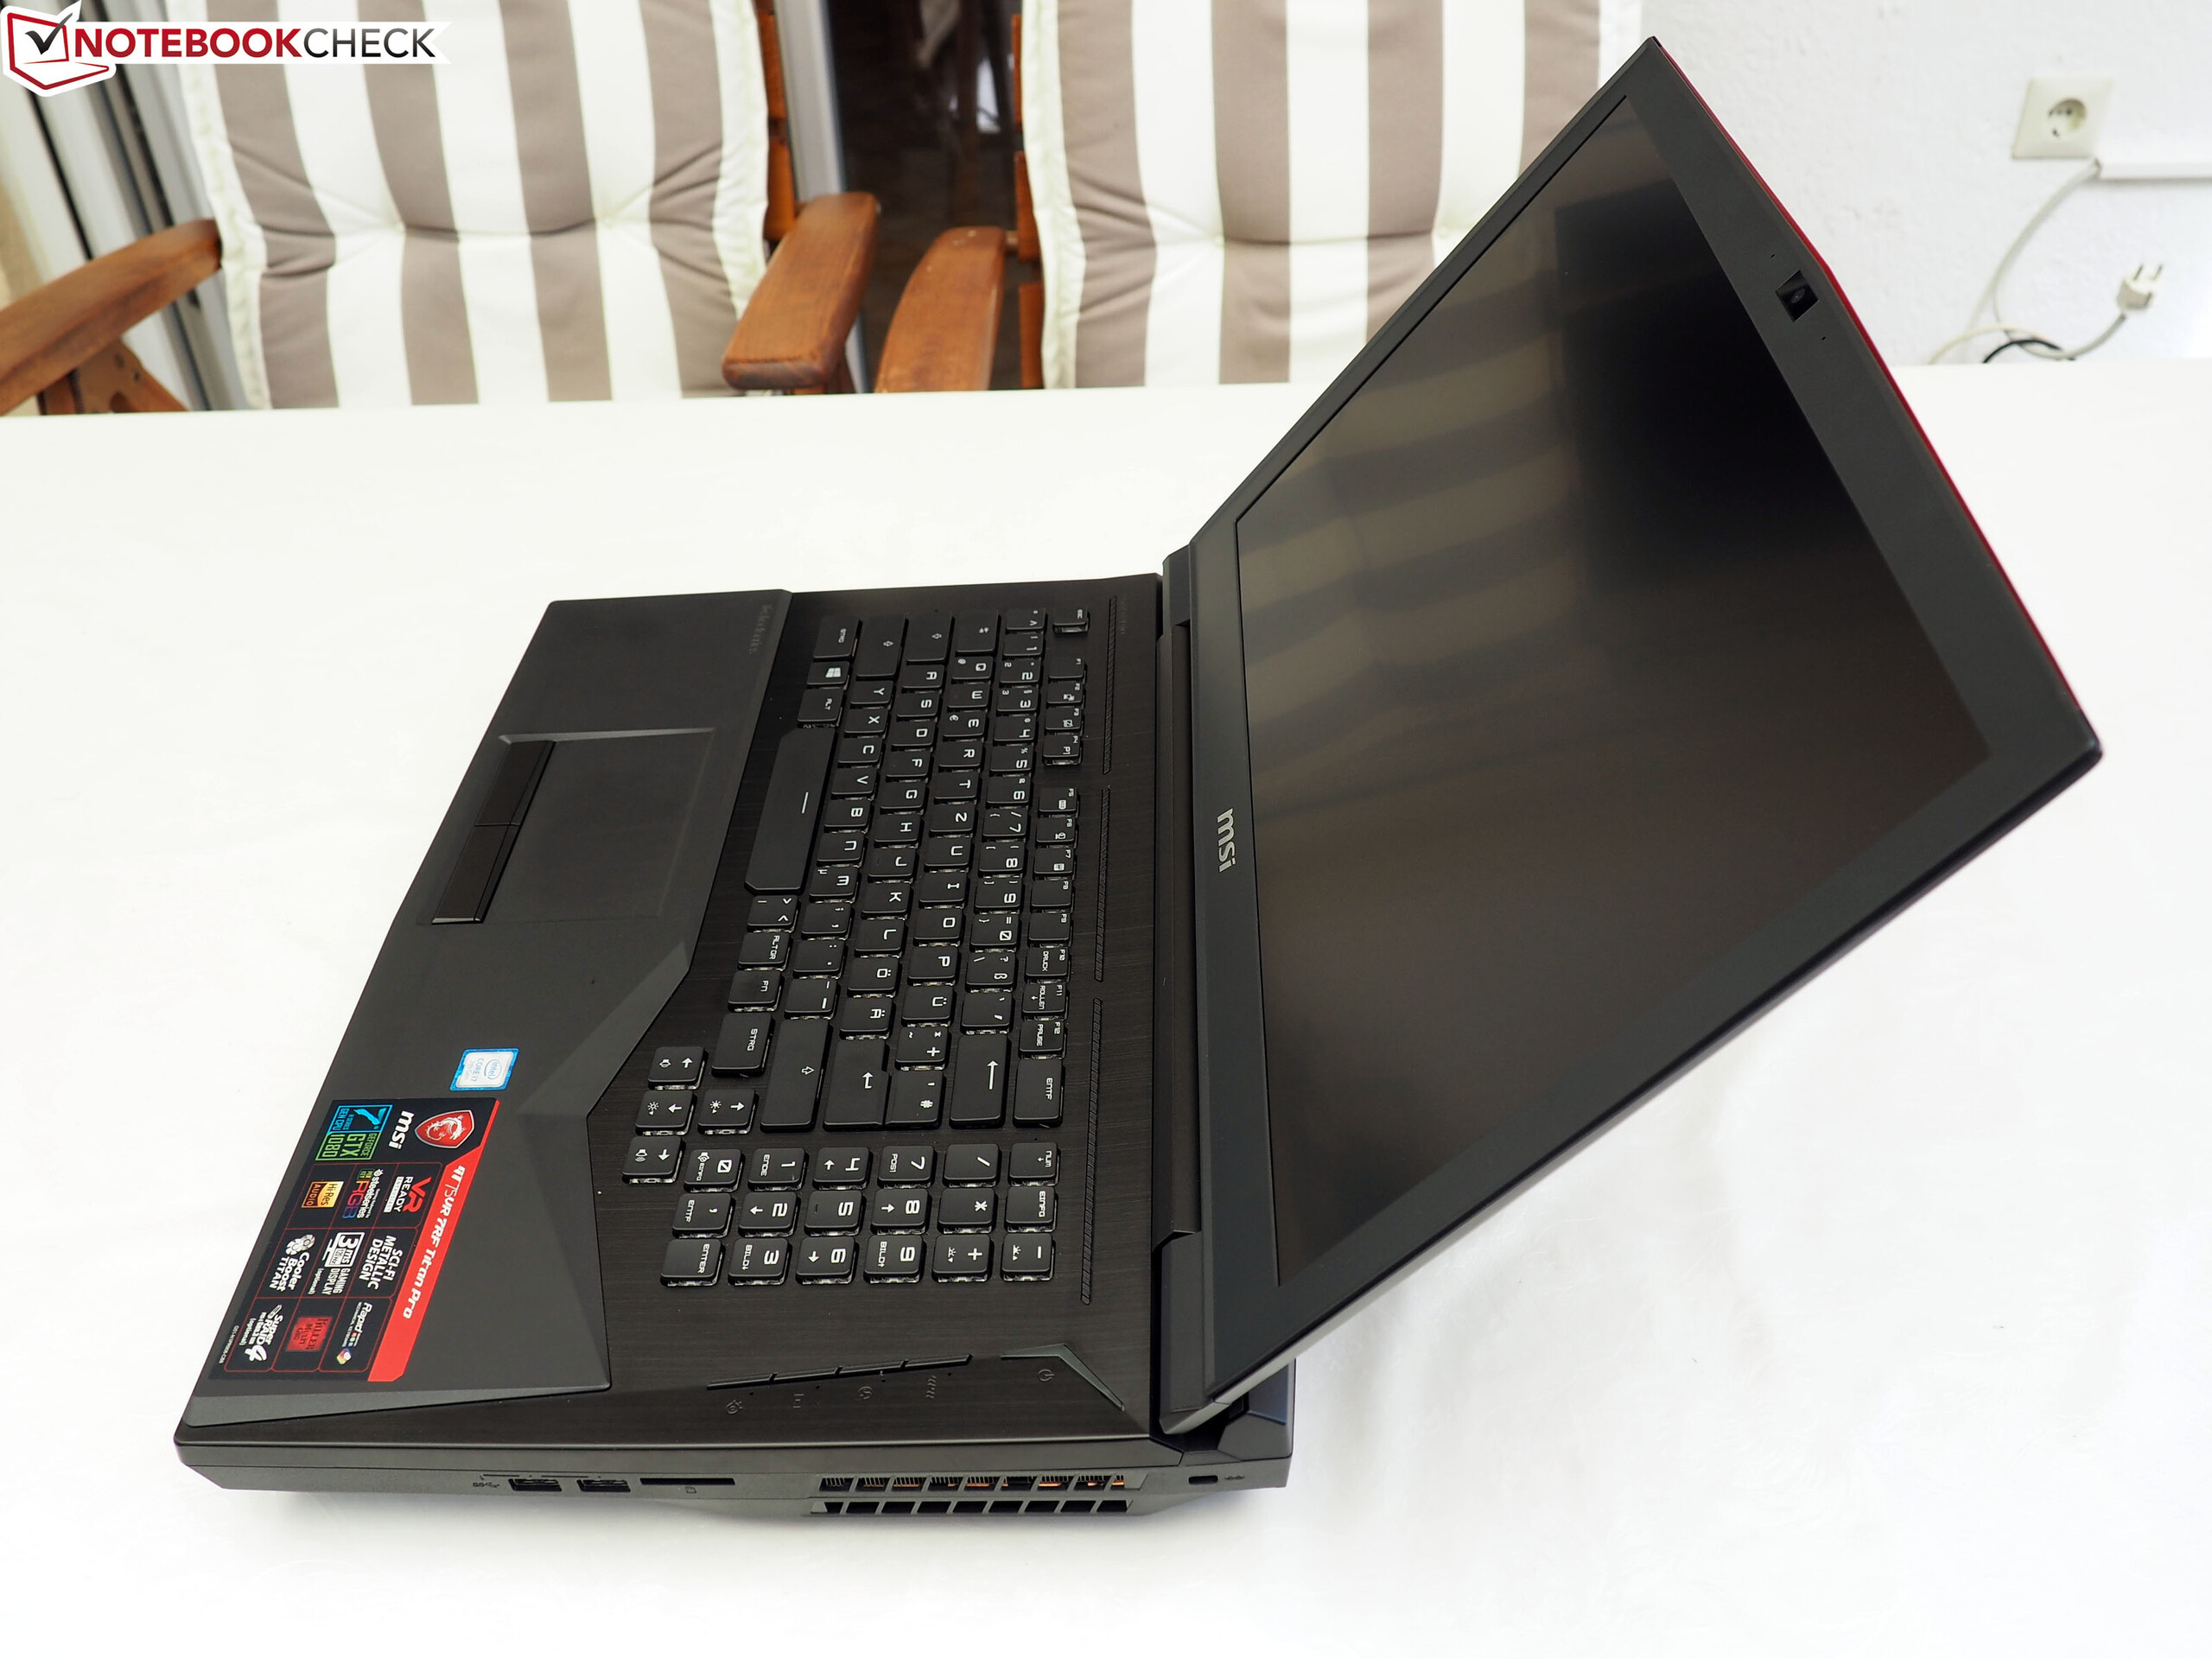
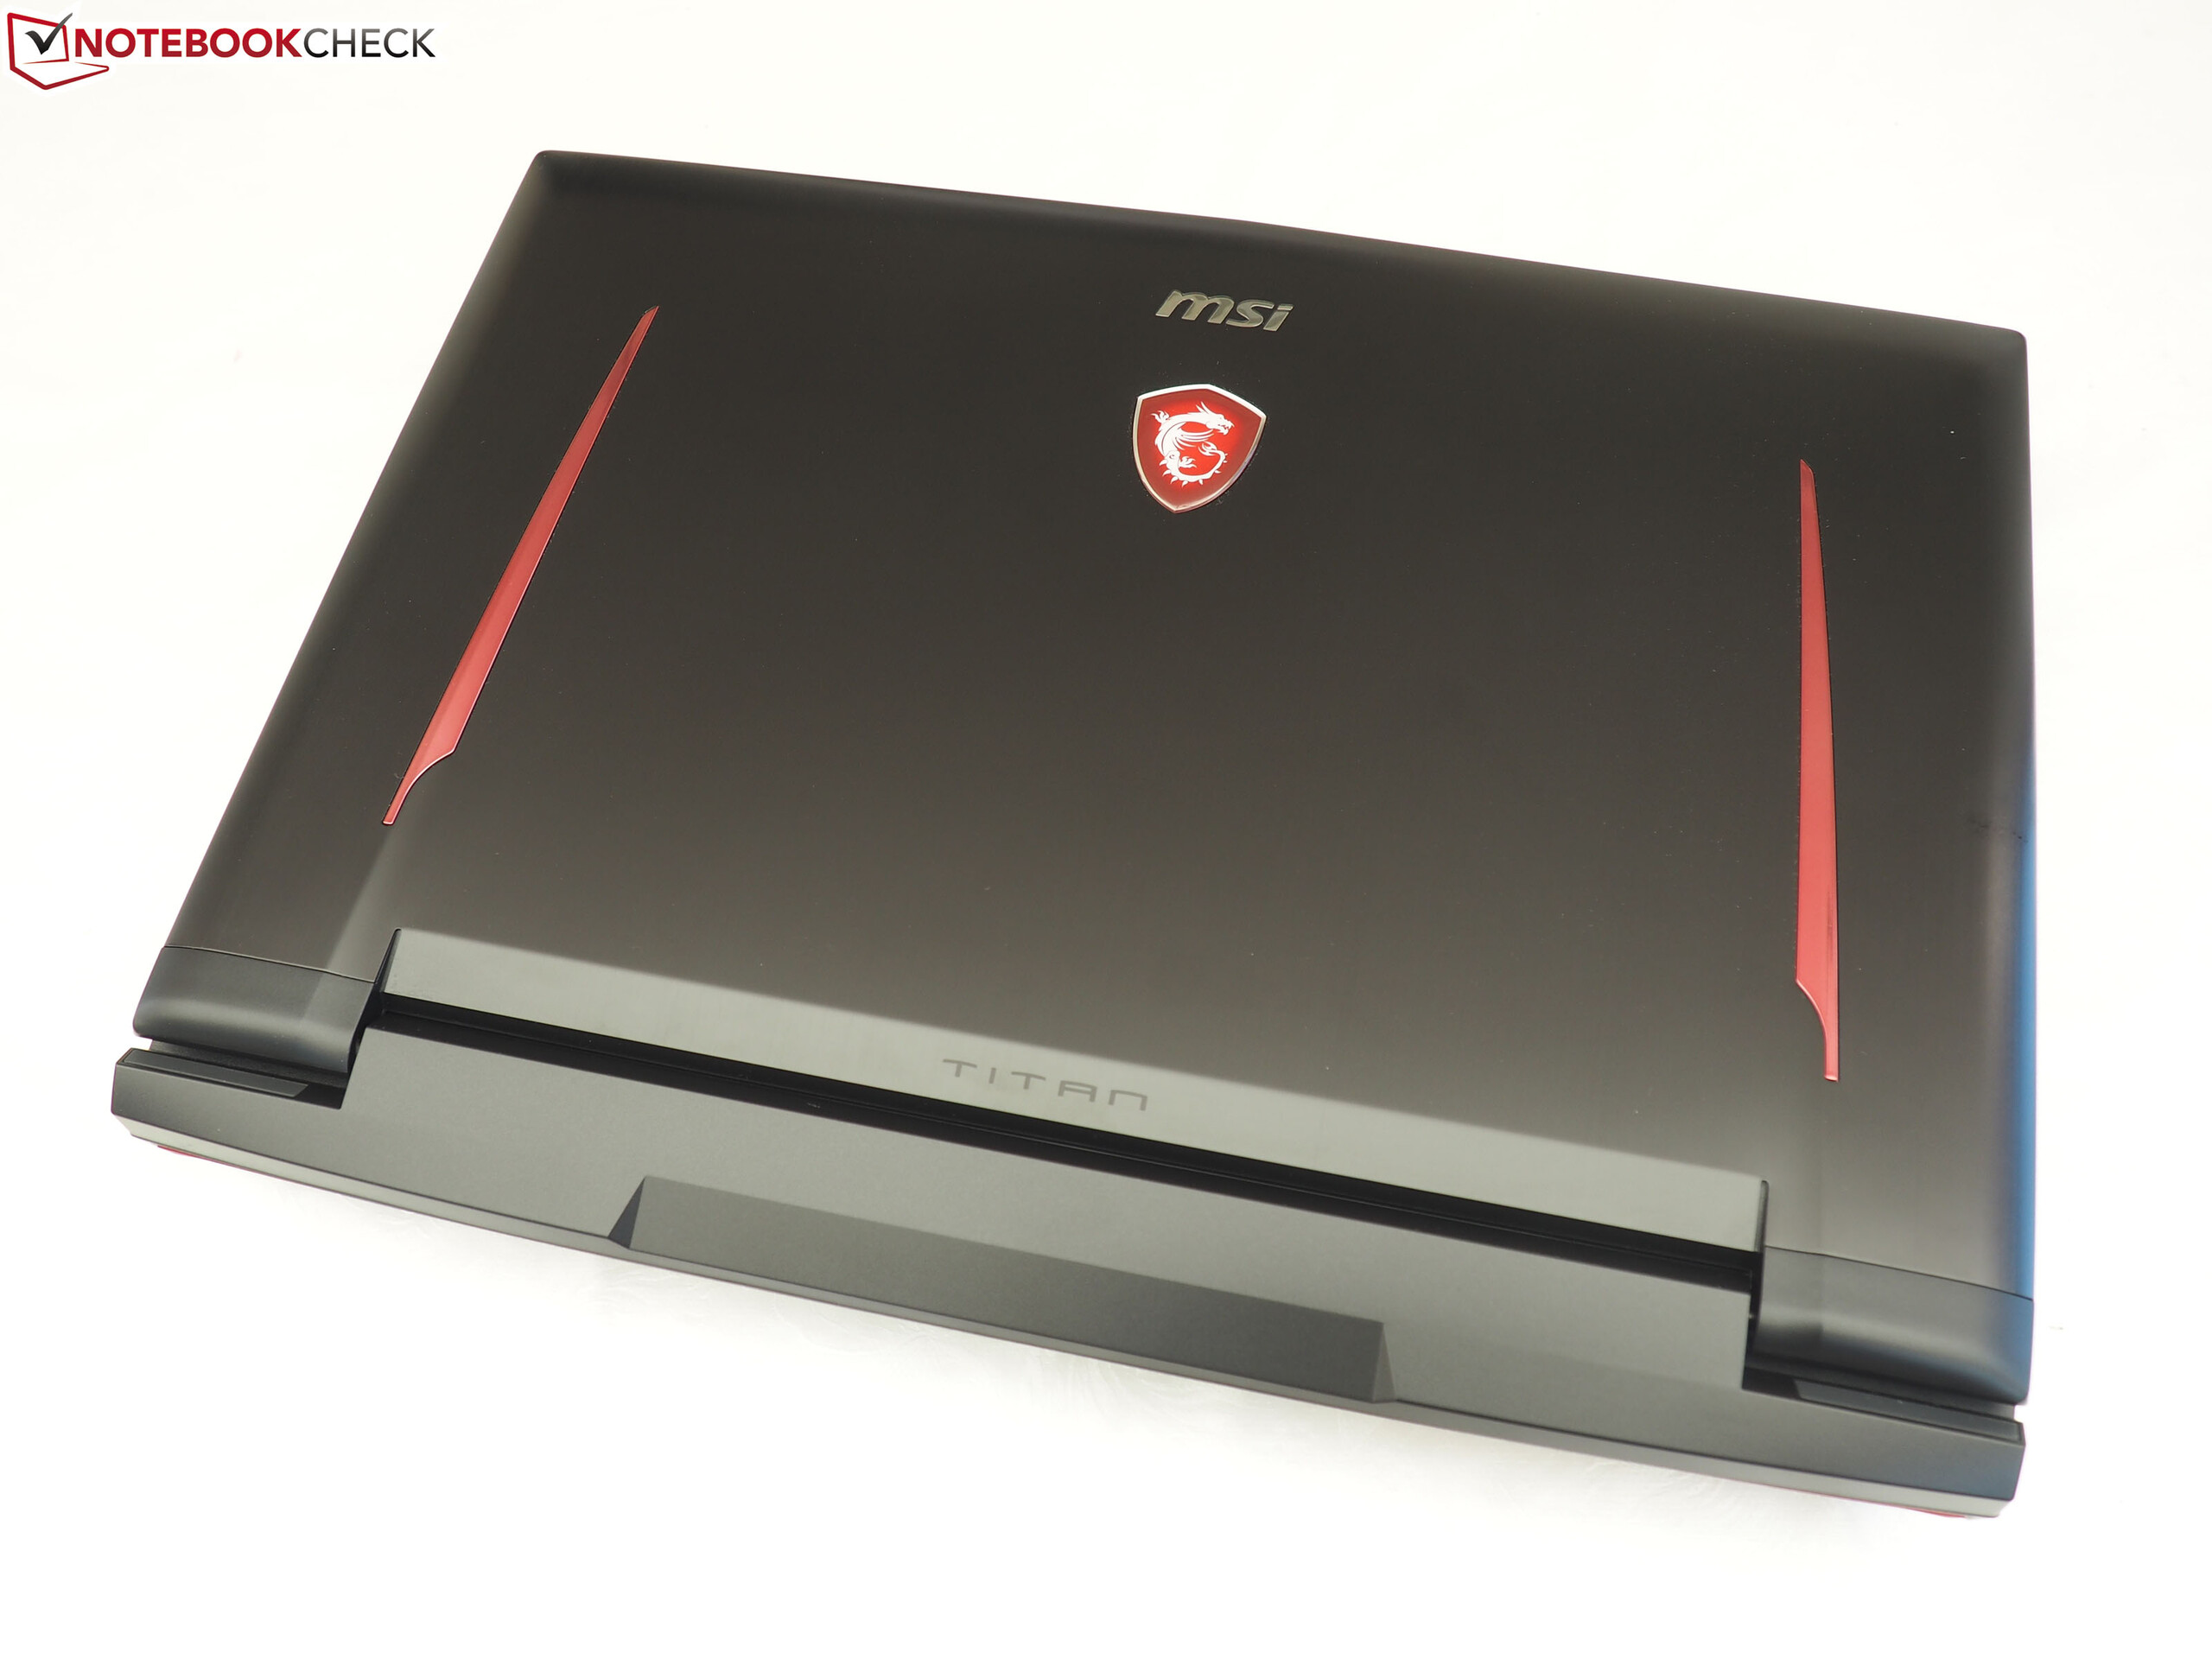
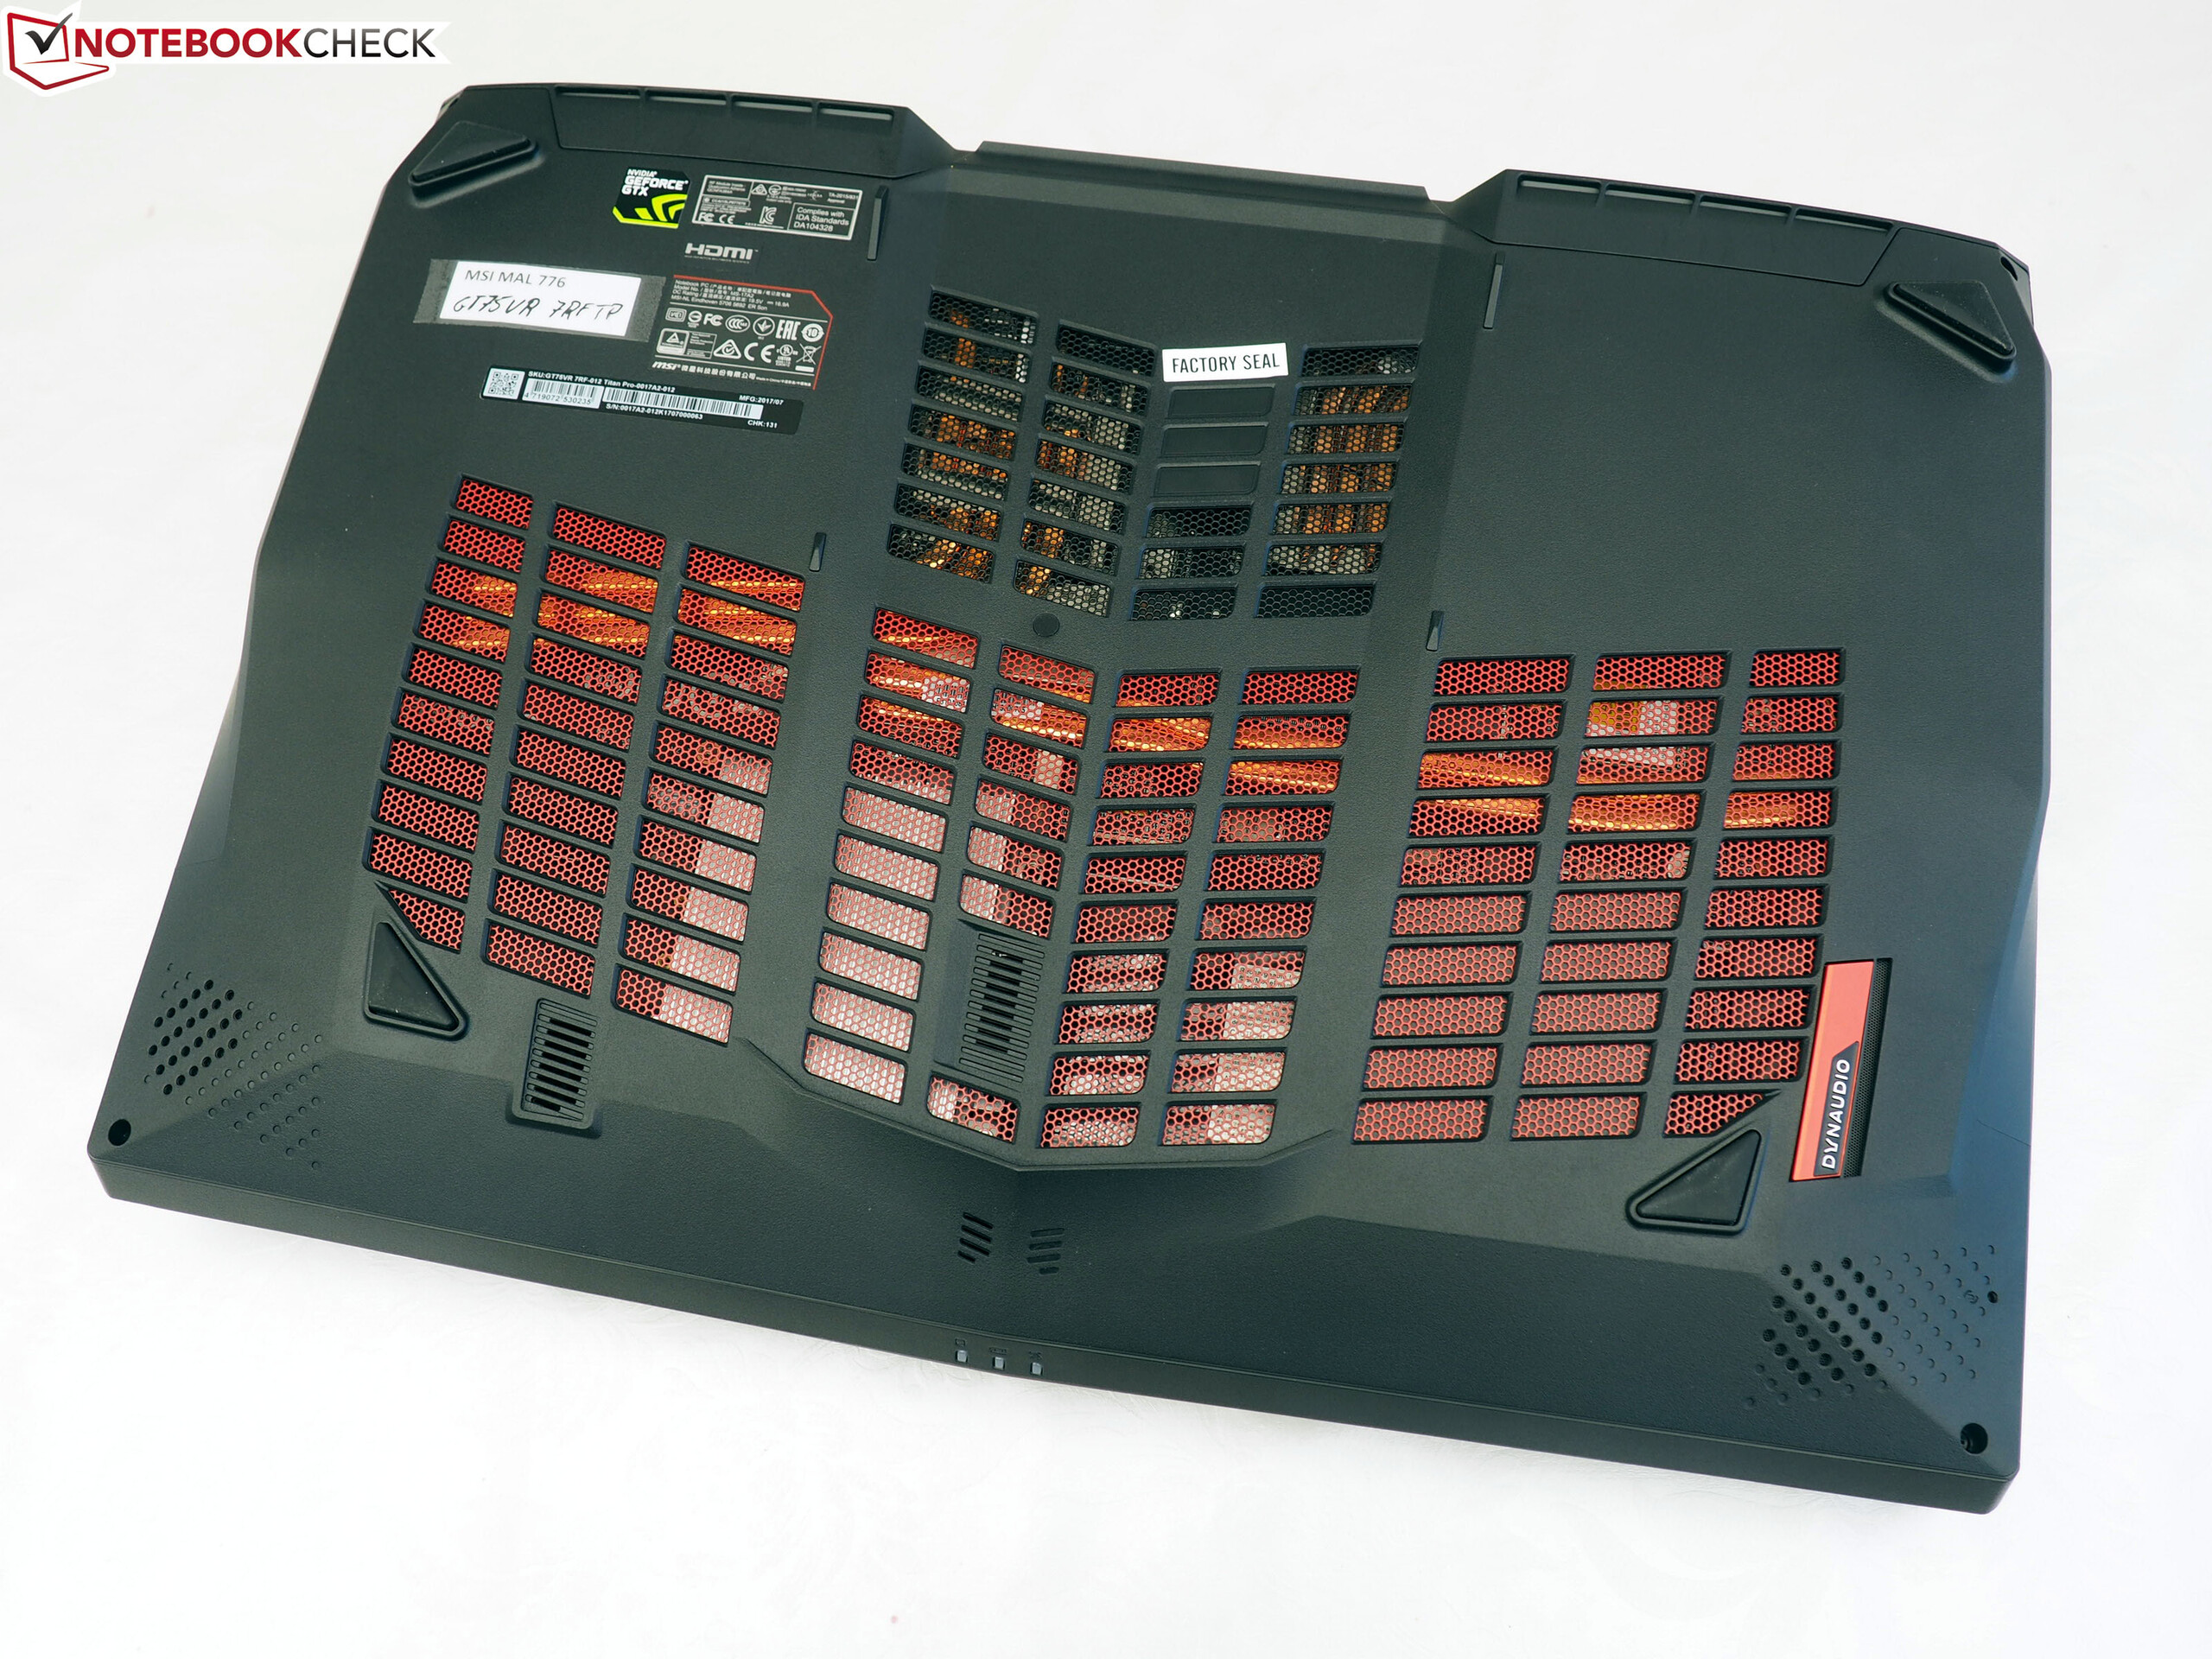
Test: MSI GT75VR 7RF Titan Pro (i7-7820HK, GTX 1080) (sammanfattning)
| SD Card Reader | |
| average JPG Copy Test (av. of 3 runs) | |
| Asus G701VIK-BA049T (Toshiba Exceria Pro SDXC 64 GB UHS-II) | |
| MSI GT73VR 7RF-296 (Toshiba Exceria Pro SDXC 64 GB UHS-II) | |
| Schenker XMG U727 2017 (Toshiba Exceria Pro SDXC 64 GB UHS-II) | |
| MSI GT75VR 7RF-012 Titan Pro (Toshiba Exceria Pro SDXC 64 GB UHS-II) | |
| Acer Predator 17 X GX-792-76DL (Toshiba Exceria Pro SDXC 64 GB UHS-II) | |
| maximum AS SSD Seq Read Test (1GB) | |
| Asus G701VIK-BA049T (Toshiba Exceria Pro SDXC 64 GB UHS-II) | |
| MSI GT73VR 7RF-296 (Toshiba Exceria Pro SDXC 64 GB UHS-II) | |
| Schenker XMG U727 2017 (Toshiba Exceria Pro SDXC 64 GB UHS-II) | |
| Acer Predator 17 X GX-792-76DL (Toshiba Exceria Pro SDXC 64 GB UHS-II) | |
| MSI GT75VR 7RF-012 Titan Pro (Toshiba Exceria Pro SDXC 64 GB UHS-II) | |
| Networking | |
| iperf3 transmit AX12 | |
| Acer Predator 17 X GX-792-76DL | |
| MSI GT73VR 7RF-296 | |
| Alienware 17 R4 | |
| Schenker XMG U727 2017 | |
| MSI GT75VR 7RF-012 Titan Pro | |
| Asus G701VIK-BA049T | |
| iperf3 receive AX12 | |
| MSI GT75VR 7RF-012 Titan Pro | |
| Schenker XMG U727 2017 | |
| MSI GT73VR 7RF-296 | |
| Acer Predator 17 X GX-792-76DL | |
| Asus G701VIK-BA049T | |
| Alienware 17 R4 | |

| |||||||||||||||||||||||||
Distribution av ljusstyrkan: 87 %
Mitt på batteriet: 274 cd/m²
Kontrast: 1054:1 (Svärta: 0.26 cd/m²)
ΔE ColorChecker Calman: 1.36 | ∀{0.5-29.43 Ø4.71}
ΔE Greyscale Calman: 0.64 | ∀{0.09-98 Ø4.96}
100% sRGB (Argyll 1.6.3 3D)
77% AdobeRGB 1998 (Argyll 1.6.3 3D)
86.8% AdobeRGB 1998 (Argyll 3D)
99.6% sRGB (Argyll 3D)
90.3% Display P3 (Argyll 3D)
Gamma: 2.19
CCT: 6551 K
| MSI GT75VR 7RF-012 Titan Pro CMN N173HHE-G32 (CMN1747), 1920x1080, 17.3" | MSI GT73VR 7RF-296 N173HHE-G32 (CMN1747), 1920x1080, 17.3" | Acer Predator 17 X GX-792-76DL LP173WF4-SPF5 (LGD056D), 1920x1080, 17.3" | Alienware 17 R4 2560x1440, 17.3" | Asus G701VIK-BA049T B173HAN01.1 (AUO119D), 1920x1080, 17.3" | Schenker XMG U727 2017 AU Optronics B173ZAN01.0 (AUO109B), 3840x2160, 17.3" | |
|---|---|---|---|---|---|---|
| Display | -1% | -24% | -26% | -21% | 4% | |
| Display P3 Coverage (%) | 90.3 | 90.6 0% | 66 -27% | 61.2 -32% | 68.8 -24% | 86.6 -4% |
| sRGB Coverage (%) | 99.6 | 99.9 0% | 83.7 -16% | 82.9 -17% | 87.7 -12% | 99.9 0% |
| AdobeRGB 1998 Coverage (%) | 86.8 | 84.7 -2% | 61.2 -29% | 60.5 -30% | 64.1 -26% | 99.5 15% |
| Response Times | -64% | -300% | -124% | -211% | -296% | |
| Response Time Grey 50% / Grey 80% * (ms) | 11.6 ? | 26 ? -124% | 45 ? -288% | 30 ? -159% | 38 ? -228% | 44 ? -279% |
| Response Time Black / White * (ms) | 6.8 ? | 7 ? -3% | 28 ? -312% | 12.8 ? -88% | 20 ? -194% | 28 ? -312% |
| PWM Frequency (Hz) | 25000 ? | |||||
| Screen | -235% | -83% | -122% | -82% | -40% | |
| Brightness middle (cd/m²) | 274 | 307 12% | 380 39% | 402.3 47% | 306 12% | 362 32% |
| Brightness (cd/m²) | 262 | 284 8% | 362 38% | 372 42% | 299 14% | 344 31% |
| Brightness Distribution (%) | 87 | 85 -2% | 91 5% | 86 -1% | 91 5% | 85 -2% |
| Black Level * (cd/m²) | 0.26 | 0.25 4% | 0.37 -42% | 0.62 -138% | 0.27 -4% | 0.35 -35% |
| Contrast (:1) | 1054 | 1228 17% | 1027 -3% | 649 -38% | 1133 7% | 1034 -2% |
| Colorchecker dE 2000 * | 1.36 | 9.65 -610% | 4.12 -203% | 5.6 -312% | 3.98 -193% | 2.46 -81% |
| Colorchecker dE 2000 max. * | 4.1 | 16.36 -299% | 8.19 -100% | 9.8 -139% | 7.29 -78% | 4.26 -4% |
| Greyscale dE 2000 * | 0.64 | 10.07 -1473% | 3.95 -517% | 4.7 -634% | 4.15 -548% | 2.9 -353% |
| Gamma | 2.19 100% | 2.12 104% | 2.47 89% | 2.14 103% | 2.45 90% | 2.31 95% |
| CCT | 6551 99% | 12145 54% | 6539 99% | 7519 86% | 7386 88% | 6120 106% |
| Color Space (Percent of AdobeRGB 1998) (%) | 77 | 75 -3% | 55 -29% | 53.7 -30% | 58 -25% | 88 14% |
| Color Space (Percent of sRGB) (%) | 100 | 100 0% | 84 -16% | 82.2 -18% | 89 -11% | 100 0% |
| Totalt genomsnitt (program/inställningar) | -100% /
-165% | -136% /
-100% | -91% /
-103% | -105% /
-87% | -111% /
-65% |
* ... mindre är bättre
Visa svarstider
| ↔ Svarstid svart till vitt | ||
|---|---|---|
| 6.8 ms ... stiga ↗ och falla ↘ kombinerat | ↗ 4.8 ms stiga | 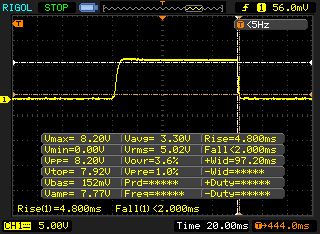 |
| ↘ 2 ms hösten | ||
| Skärmen visar väldigt snabba svarsfrekvenser i våra tester och borde vara mycket väl lämpad för fartfyllt spel. I jämförelse sträcker sig alla testade enheter från 0.1 (minst) till 240 (maximalt) ms. » 21 % av alla enheter är bättre. Det betyder att den uppmätta svarstiden är bättre än genomsnittet av alla testade enheter (19.8 ms). | ||
| ↔ Svarstid 50 % grått till 80 % grått | ||
| 11.6 ms ... stiga ↗ och falla ↘ kombinerat | ↗ 6.4 ms stiga | 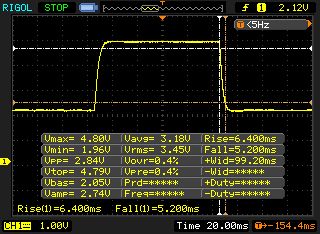 |
| ↘ 5.2 ms hösten | ||
| Skärmen visar bra svarsfrekvens i våra tester, men kan vara för långsam för konkurrenskraftiga spelare. I jämförelse sträcker sig alla testade enheter från 0.165 (minst) till 636 (maximalt) ms. » 25 % av alla enheter är bättre. Det betyder att den uppmätta svarstiden är bättre än genomsnittet av alla testade enheter (31 ms). | ||
Skärmflimmer / PWM (Puls-Width Modulation)
| Skärmflimmer / PWM upptäckt | 25000 Hz | ≤ 15 % ljusstyrka inställning | 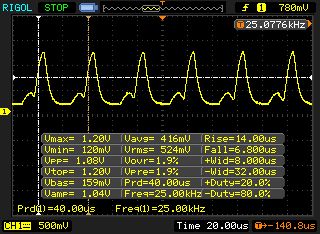 |
Displayens bakgrundsbelysning flimrar vid 25000 Hz (i värsta fall, t.ex. med PWM) Flimrande upptäckt vid en ljusstyrkeinställning på 15 % och lägre. Det ska inte finnas något flimmer eller PWM över denna ljusstyrkeinställning. Frekvensen för 25000 Hz är ganska hög, så de flesta användare som är känsliga för PWM bör inte märka något flimmer. Som jämförelse: 52 % av alla testade enheter använder inte PWM för att dämpa skärmen. Om PWM upptäcktes mättes ett medelvärde av 7757 (minst: 5 - maximum: 343500) Hz. | |||
| Cinebench R15 | |
| CPU Single 64Bit | |
| Schenker XMG U727 2017 | |
| Acer Predator 17 X GX-792-76DL | |
| Asus G701VIK-BA049T | |
| MSI GT73VR 7RF-296 | |
| Alienware 17 R4 | |
| MSI GT75VR 7RF-012 Titan Pro | |
| CPU Multi 64Bit | |
| Schenker XMG U727 2017 | |
| Asus G701VIK-BA049T | |
| Acer Predator 17 X GX-792-76DL | |
| Alienware 17 R4 | |
| MSI GT73VR 7RF-296 | |
| MSI GT75VR 7RF-012 Titan Pro | |
| Cinebench R11.5 | |
| CPU Single 64Bit | |
| Schenker XMG U727 2017 | |
| Acer Predator 17 X GX-792-76DL | |
| Asus G701VIK-BA049T | |
| MSI GT73VR 7RF-296 | |
| MSI GT75VR 7RF-012 Titan Pro | |
| Alienware 17 R4 | |
| CPU Multi 64Bit | |
| Schenker XMG U727 2017 | |
| Asus G701VIK-BA049T | |
| MSI GT73VR 7RF-296 | |
| Acer Predator 17 X GX-792-76DL | |
| Alienware 17 R4 | |
| MSI GT75VR 7RF-012 Titan Pro | |
| PCMark 8 | |
| Home Score Accelerated v2 | |
| Acer Predator 17 X GX-792-76DL | |
| Asus G701VIK-BA049T | |
| MSI GT75VR 7RF-012 Titan Pro | |
| Alienware 17 R4 | |
| Schenker XMG U727 2017 | |
| Work Score Accelerated v2 | |
| Acer Predator 17 X GX-792-76DL | |
| Asus G701VIK-BA049T | |
| MSI GT75VR 7RF-012 Titan Pro | |
| Alienware 17 R4 | |
| Schenker XMG U727 2017 | |
| PCMark 10 - Score | |
| MSI GT75VR 7RF-012 Titan Pro | |
| PCMark 8 Home Score Accelerated v2 | 5237 poäng | |
| PCMark 8 Work Score Accelerated v2 | 5444 poäng | |
| PCMark 10 Score | 5211 poäng | |
Hjälp | ||
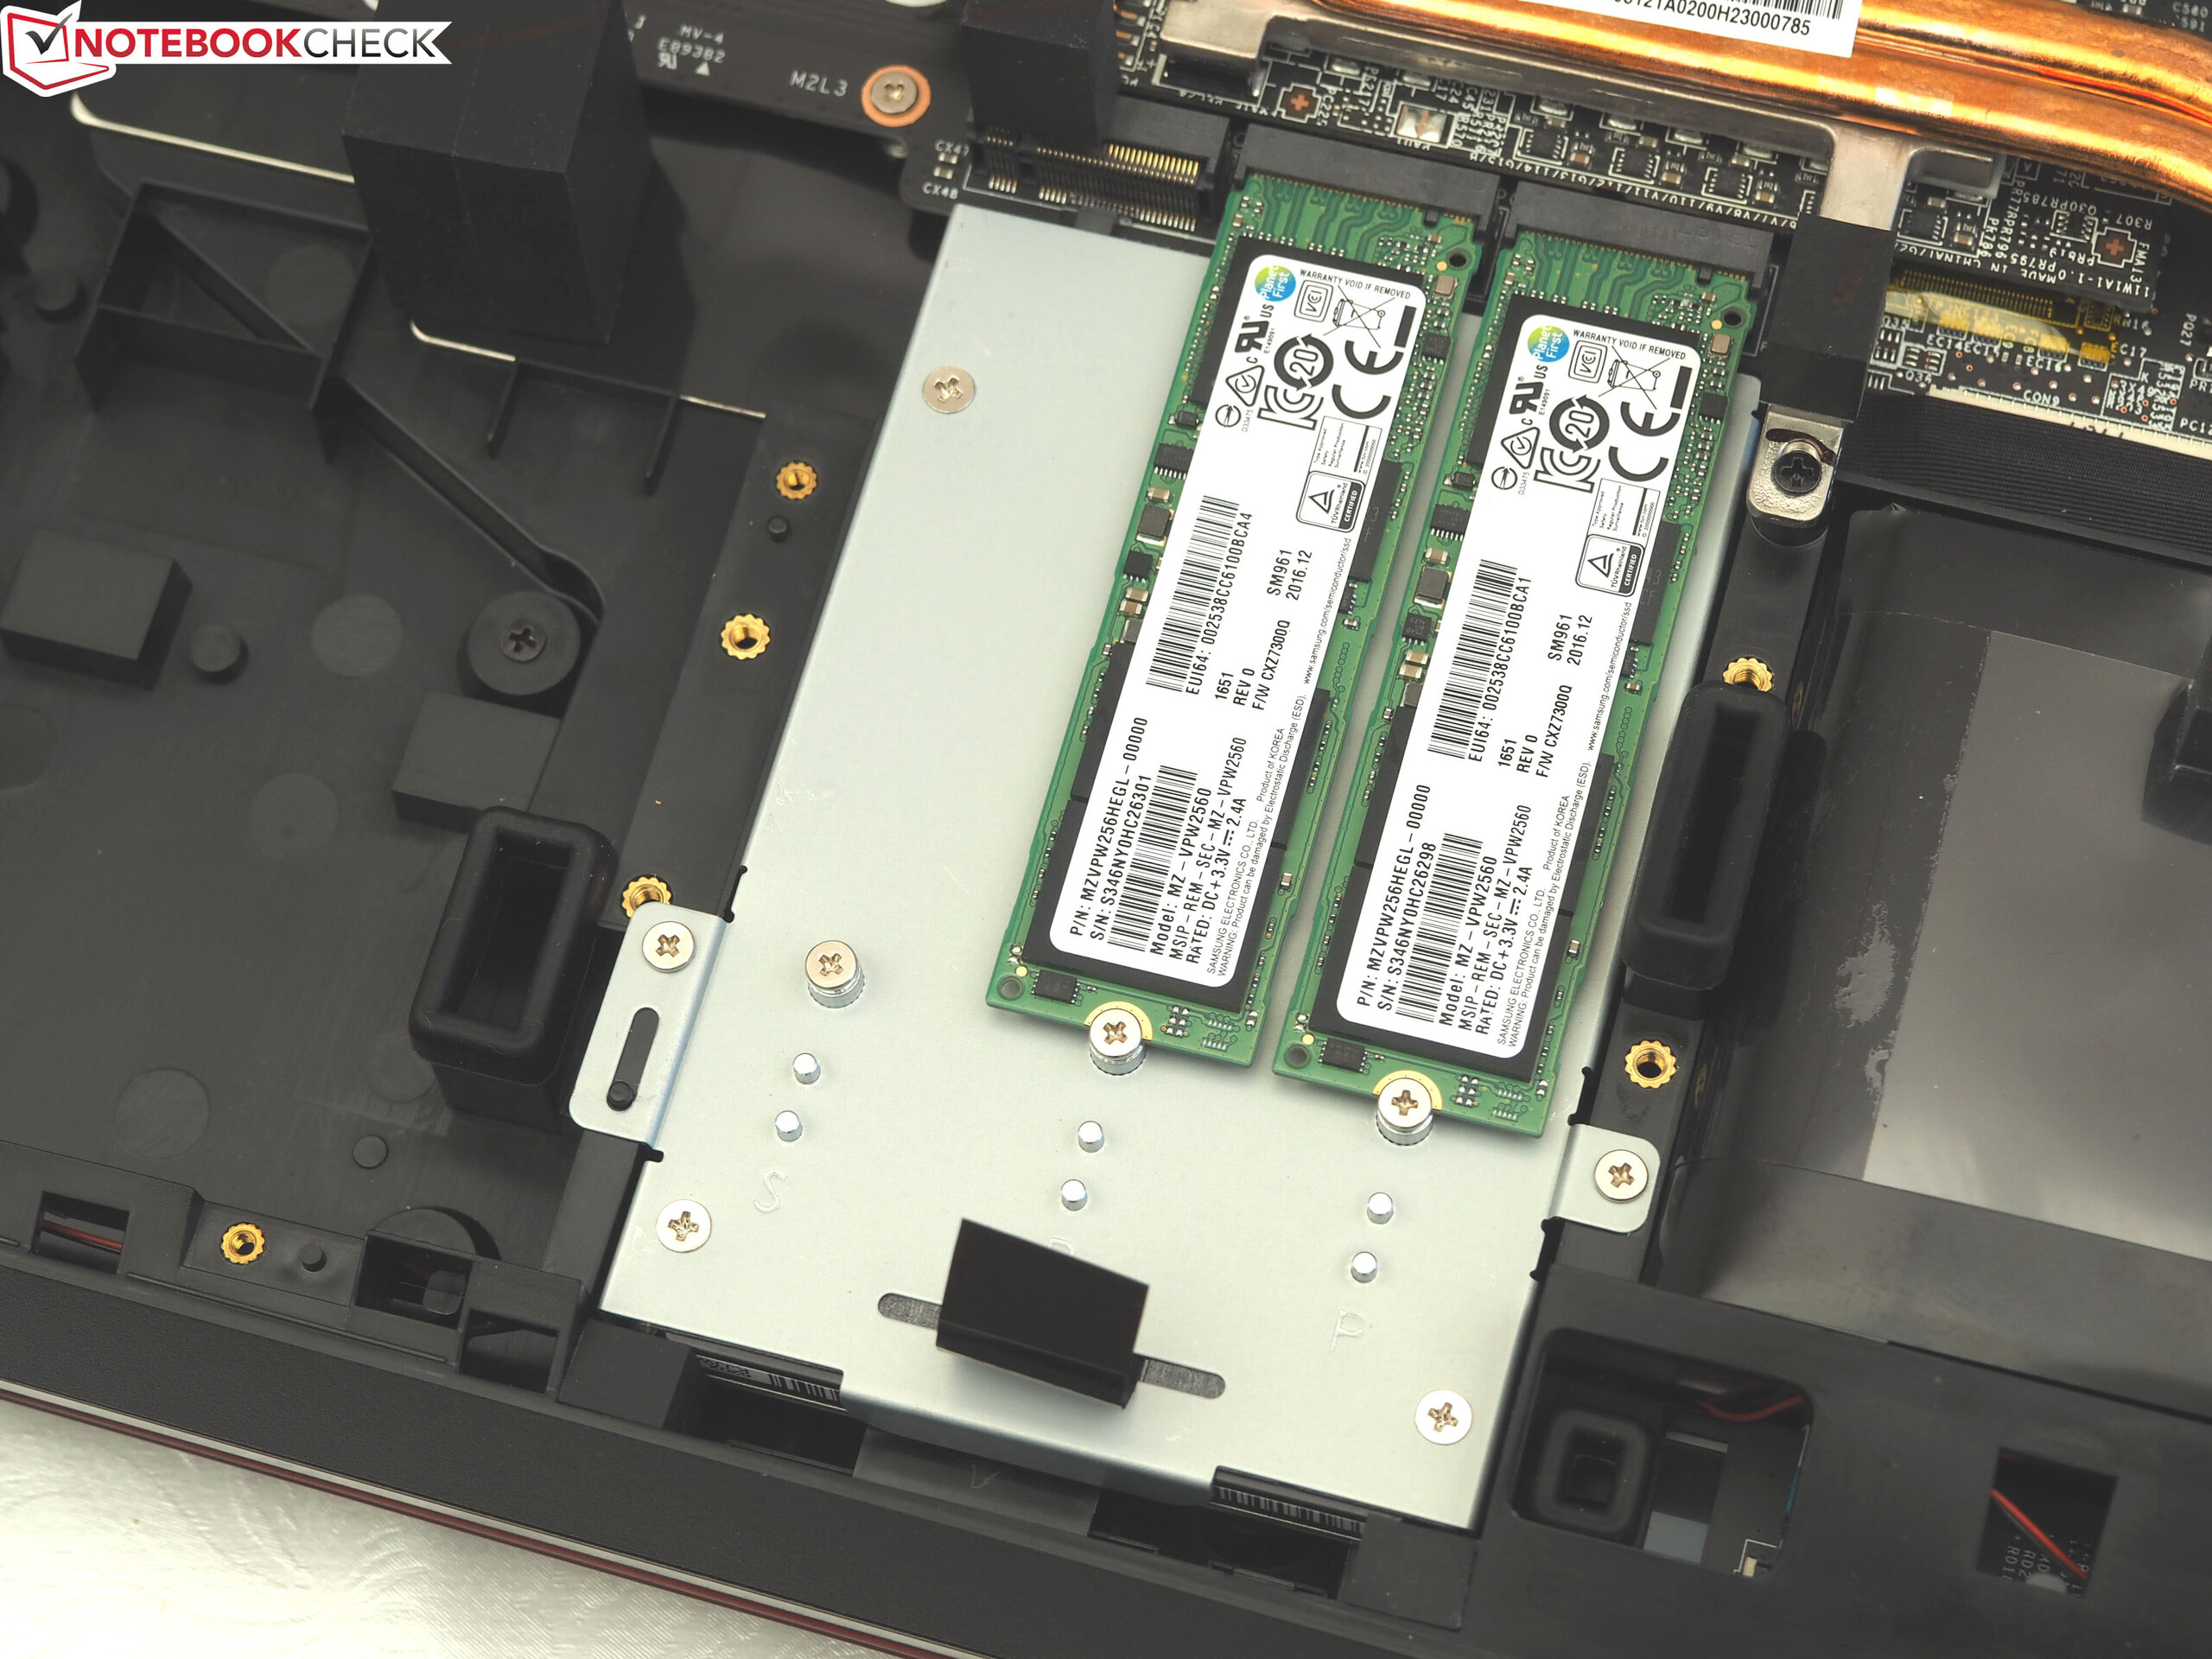
| MSI GT75VR 7RF-012 Titan Pro 2x Samsung SM961 MZVPW256HEGL NVMe (RAID 0) | MSI GT73VR 7RF-296 2x Samsung SM951 MZVPV256HDGL (RAID 0) | Acer Predator 17 X GX-792-76DL Toshiba NVMe THNSN5512GPU7 | Alienware 17 R4 SK Hynix PC300 NVMe 512 GB | Asus G701VIK-BA049T 2x Samsung SM961 MZVPW256HEGL NVMe (RAID 0) | Schenker XMG U727 2017 Samsung SM961 MZVPW256 m.2 PCI-e | |
|---|---|---|---|---|---|---|
| AS SSD | -4% | -23% | -38% | 9% | 6% | |
| Seq Read (MB/s) | 3137 | 2988 -5% | 2261 -28% | 1752 -44% | 3247 4% | 2746 -12% |
| Seq Write (MB/s) | 2352 | 2332 -1% | 1338 -43% | 735 -69% | 2520 7% | 1445 -39% |
| 4K Read (MB/s) | 50.1 | 46.75 -7% | 39.52 -21% | 35.61 -29% | 51 2% | 56.8 13% |
| 4K Write (MB/s) | 128.8 | 123.8 -4% | 133.8 4% | 113.4 -12% | 120.9 -6% | 175.9 37% |
| Score Read (Points) | 1412 | 1511 7% | 1118 -21% | 831 -41% | 1760 25% | 1858 32% |
| Score Write (Points) | 1289 | 1054 -18% | 930 -28% | 858 -33% | 1458 13% | 1187 -8% |
| Score Total (Points) | 3392 | 3310 -2% | 2581 -24% | 2072 -39% | 4088 21% | 3938 16% |

| 3DMark - 1920x1080 Fire Strike Graphics | |
| Asus G701VIK-BA049T | |
| Acer Predator 17 X GX-792-76DL | |
| Alienware 17 R4 | |
| Schenker XMG U727 2017 | |
| MSI GT75VR 7RF-012 Titan Pro | |
| MSI GT73VR 7RF-296 | |
| 3DMark 11 - 1280x720 Performance GPU | |
| Asus G701VIK-BA049T | |
| Schenker XMG U727 2017 | |
| MSI GT75VR 7RF-012 Titan Pro | |
| MSI GT73VR 7RF-296 | |
| Acer Predator 17 X GX-792-76DL | |
| Alienware 17 R4 | |
| Unigine Heaven 4.0 - Extreme Preset DX11 | |
| Asus G701VIK-BA049T | |
| Schenker XMG U727 2017 | |
| MSI GT75VR 7RF-012 Titan Pro | |
| MSI GT73VR 7RF-296 | |
| 3DMark 11 Performance | 19621 poäng | |
| 3DMark Ice Storm Standard Score | 155671 poäng | |
| 3DMark Cloud Gate Standard Score | 29451 poäng | |
| 3DMark Fire Strike Score | 15851 poäng | |
| 3DMark Time Spy Score | 6563 poäng | |
Hjälp | ||
| låg | med. | hög | ultra | 4K | |
|---|---|---|---|---|---|
| The Witcher 3 (2015) | 144 | 75.9 | 52.2 | ||
| Ghost Recon Wildlands (2017) | 99.7 | 61.4 | 41.4 | ||
| Prey (2017) | 139 | 136 | 68.3 | ||
| Rocket League (2017) | 240 | 110 | |||
| Dirt 4 (2017) | 178 | 105 | |||
| Playerunknown's Battlegrounds (PUBG) (2017) | 115 | 90.1 | 32.8 |
Ljudnivå
| Låg belastning |
| 33 / 34 / 38 dB(A) |
| Hög belastning |
| 44 / 62 dB(A) |
 | ||
30 dB tyst 40 dB(A) hörbar 50 dB(A) högt ljud |
||
min: | ||
| MSI GT75VR 7RF-012 Titan Pro i7-7820HK, GeForce GTX 1080 Mobile | MSI GT73VR 7RF-296 i7-7820HK, GeForce GTX 1080 Mobile | Acer Predator 17 X GX-792-76DL i7-7820HK, GeForce GTX 1080 Mobile | Alienware 17 R4 i7-7820HK, GeForce GTX 1080 Mobile | Asus G701VIK-BA049T i7-7820HK, GeForce GTX 1080 Mobile | Schenker XMG U727 2017 i7-7700K, GeForce GTX 1080 Mobile | |
|---|---|---|---|---|---|---|
| Noise | 3% | 5% | 2% | 4% | 5% | |
| av / miljö * (dB) | 30 | 30 -0% | 30 -0% | 28.2 6% | 30 -0% | 30 -0% |
| Idle Minimum * (dB) | 33 | 34 -3% | 33 -0% | 35.6 -8% | 30 9% | 31 6% |
| Idle Average * (dB) | 34 | 35 -3% | 35 -3% | 35.6 -5% | 31 9% | 34 -0% |
| Idle Maximum * (dB) | 38 | 37 3% | 37 3% | 35.7 6% | 36 5% | 37 3% |
| Load Average * (dB) | 44 | 39 11% | 40 9% | 50.2 -14% | 47 -7% | 44 -0% |
| Witcher 3 ultra * (dB) | 56 | 50.2 10% | 51 9% | |||
| Load Maximum * (dB) | 62 | 56 10% | 50 19% | 50.2 19% | 56 10% | 52 16% |
* ... mindre är bättre
(-) Den maximala temperaturen på ovansidan är 46 °C / 115 F, jämfört med genomsnittet av 40.4 °C / 105 F , allt från 21.2 till 68.8 °C för klassen Gaming.
(-) Botten värms upp till maximalt 57 °C / 135 F, jämfört med genomsnittet av 43.2 °C / 110 F
(+) Vid tomgångsbruk är medeltemperaturen för ovansidan 31.7 °C / 89 F, jämfört med enhetsgenomsnittet på 33.9 °C / ### class_avg_f### F.
(±) När du spelar The Witcher 3 är medeltemperaturen för ovansidan 37.8 °C / 100 F, jämfört med enhetsgenomsnittet på 33.9 °C / ## #class_avg_f### F.
(+) Handledsstöden och pekplattan når maximal hudtemperatur (32 °C / 89.6 F) och är därför inte varma.
(-) Medeltemperaturen för handledsstödsområdet på liknande enheter var 28.8 °C / 83.8 F (-3.2 °C / -5.8 F).
| MSI GT75VR 7RF-012 Titan Pro i7-7820HK, GeForce GTX 1080 Mobile | MSI GT73VR 7RF-296 i7-7820HK, GeForce GTX 1080 Mobile | Acer Predator 17 X GX-792-76DL i7-7820HK, GeForce GTX 1080 Mobile | Alienware 17 R4 i7-7820HK, GeForce GTX 1080 Mobile | Asus G701VIK-BA049T i7-7820HK, GeForce GTX 1080 Mobile | Schenker XMG U727 2017 i7-7700K, GeForce GTX 1080 Mobile | |
|---|---|---|---|---|---|---|
| Heat | 18% | 10% | 6% | 10% | 1% | |
| Maximum Upper Side * (°C) | 46 | 39.8 13% | 44.2 4% | 49.6 -8% | 50.9 -11% | 47.5 -3% |
| Maximum Bottom * (°C) | 57 | 47.8 16% | 43 25% | 56 2% | 44.6 22% | 56 2% |
| Idle Upper Side * (°C) | 34 | 27.1 20% | 32.4 5% | 29.6 13% | 29.9 12% | 34.5 -1% |
| Idle Bottom * (°C) | 35 | 27.4 22% | 32.8 6% | 29.2 17% | 28.8 18% | 33.6 4% |
* ... mindre är bättre
MSI GT75VR 7RF-012 Titan Pro ljudanalys
(+) | högtalare kan spela relativt högt (98 dB)
Bas 100 - 315 Hz
(±) | reducerad bas - i genomsnitt 8.7% lägre än medianen
(+) | basen är linjär (4.9% delta till föregående frekvens)
Mellan 400 - 2000 Hz
(+) | balanserad mellan - endast 3.6% från medianen
(+) | mids är linjära (4% delta till föregående frekvens)
Högsta 2 - 16 kHz
(±) | högre toppar - i genomsnitt 6% högre än medianen
(+) | toppar är linjära (3.4% delta till föregående frekvens)
Totalt 100 - 16 000 Hz
(+) | det totala ljudet är linjärt (13.4% skillnad mot median)
Jämfört med samma klass
» 19% av alla testade enheter i den här klassen var bättre, 7% liknande, 74% sämre
» Den bästa hade ett delta på 6%, genomsnittet var 18%, sämst var 132%
Jämfört med alla testade enheter
» 14% av alla testade enheter var bättre, 4% liknande, 82% sämre
» Den bästa hade ett delta på 4%, genomsnittet var 23%, sämst var 134%
MSI GT73VR 7RF-296 ljudanalys
(+) | högtalare kan spela relativt högt (93 dB)
Bas 100 - 315 Hz
(±) | reducerad bas - i genomsnitt 11.7% lägre än medianen
(±) | linjäriteten för basen är genomsnittlig (9% delta till föregående frekvens)
Mellan 400 - 2000 Hz
(+) | balanserad mellan - endast 3% från medianen
(+) | mids är linjära (3.6% delta till föregående frekvens)
Högsta 2 - 16 kHz
(+) | balanserade toppar - endast 4% från medianen
(+) | toppar är linjära (3.5% delta till föregående frekvens)
Totalt 100 - 16 000 Hz
(+) | det totala ljudet är linjärt (13.6% skillnad mot median)
Jämfört med samma klass
» 20% av alla testade enheter i den här klassen var bättre, 7% liknande, 73% sämre
» Den bästa hade ett delta på 6%, genomsnittet var 18%, sämst var 132%
Jämfört med alla testade enheter
» 15% av alla testade enheter var bättre, 4% liknande, 82% sämre
» Den bästa hade ett delta på 4%, genomsnittet var 23%, sämst var 134%
| Av/Standby | |
| Låg belastning | |
| Hög belastning |
|
Förklaring:
min: | |
| MSI GT75VR 7RF-012 Titan Pro i7-7820HK, GeForce GTX 1080 Mobile | MSI GT73VR 7RF-296 i7-7820HK, GeForce GTX 1080 Mobile | Acer Predator 17 X GX-792-76DL i7-7820HK, GeForce GTX 1080 Mobile | Alienware 17 R4 i7-7820HK, GeForce GTX 1080 Mobile | Asus G701VIK-BA049T i7-7820HK, GeForce GTX 1080 Mobile | Schenker XMG U727 2017 i7-7700K, GeForce GTX 1080 Mobile | |
|---|---|---|---|---|---|---|
| Power Consumption | 13% | 17% | 9% | 17% | -8% | |
| Idle Minimum * (Watt) | 34 | 29 15% | 27 21% | 37.5 -10% | 24 29% | 32 6% |
| Idle Average * (Watt) | 41 | 35 15% | 32 22% | 37.6 8% | 31 24% | 43 -5% |
| Idle Maximum * (Watt) | 50 | 40 20% | 41 18% | 37.6 25% | 38 24% | 51 -2% |
| Load Average * (Watt) | 106 | 94 11% | 102 4% | 122.4 -15% | 98 8% | 138 -30% |
| Witcher 3 ultra * (Watt) | 257 | 180.3 30% | 279 -9% | |||
| Load Maximum * (Watt) | 320 | 315 2% | 248 22% | 277.4 13% | 320 -0% | 350 -9% |
* ... mindre är bättre
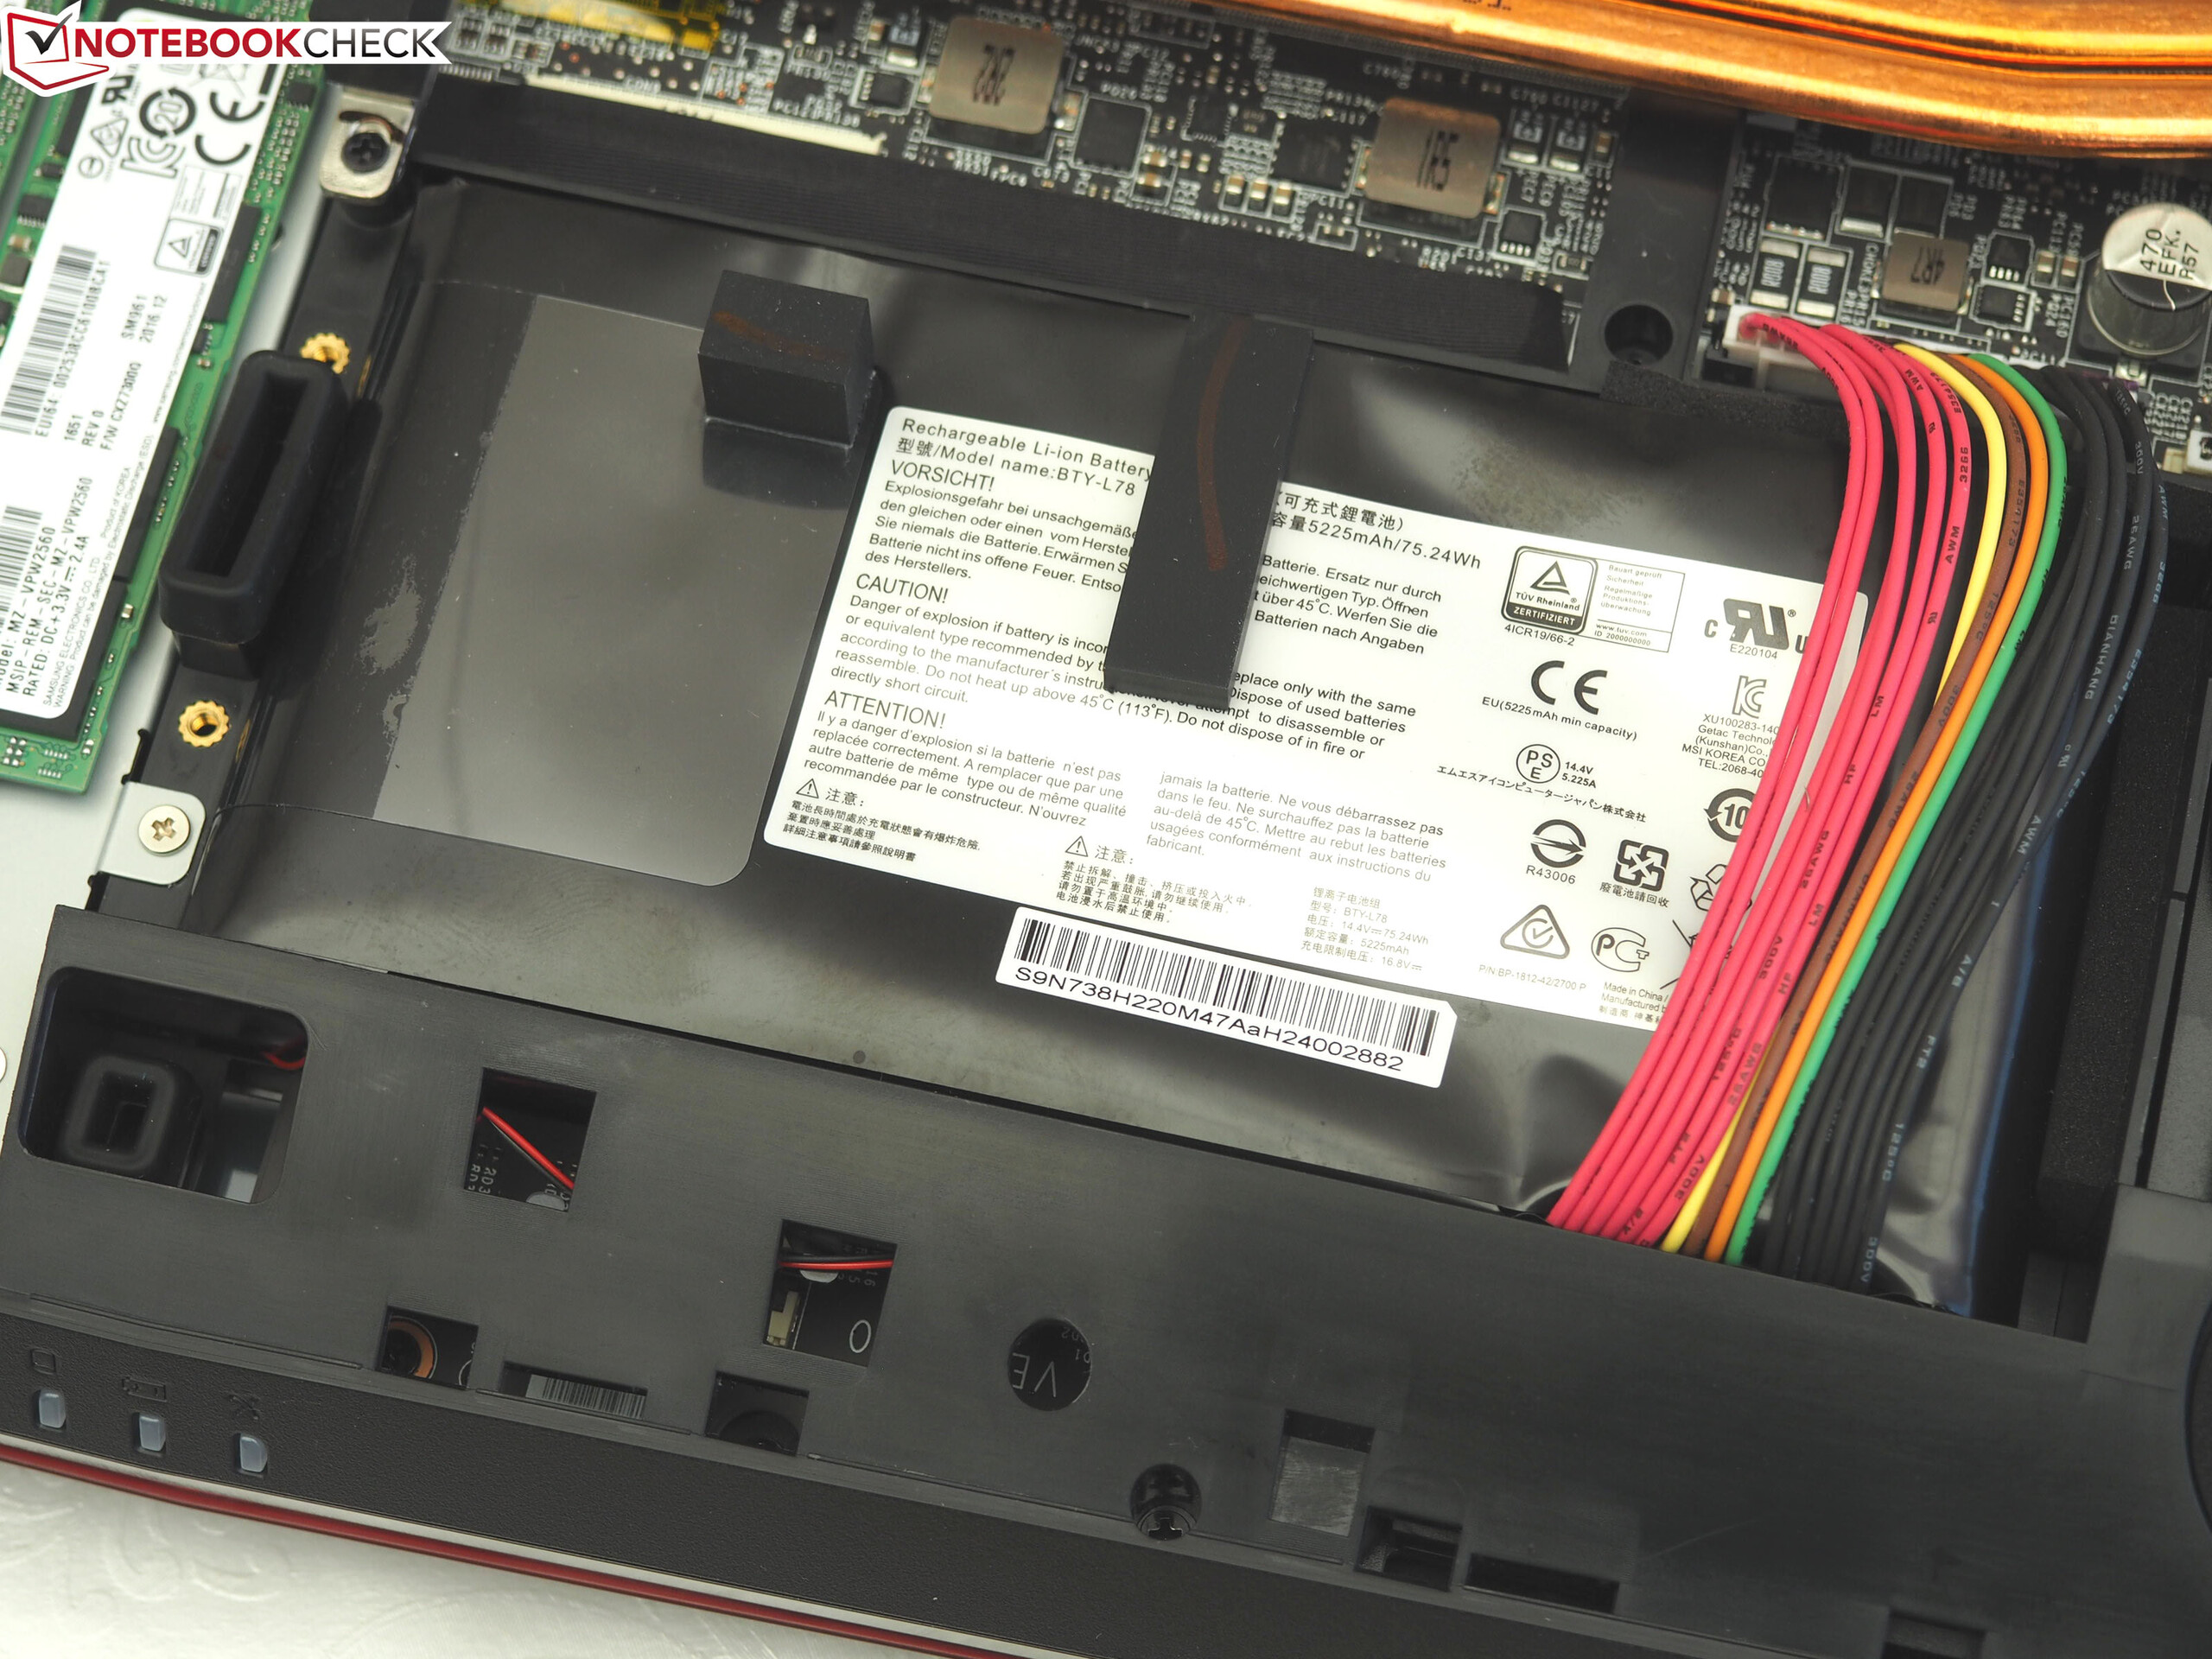
| MSI GT75VR 7RF-012 Titan Pro i7-7820HK, GeForce GTX 1080 Mobile, 75 Wh | MSI GT73VR 7RF-296 i7-7820HK, GeForce GTX 1080 Mobile, 75.2 Wh | Acer Predator 17 X GX-792-76DL i7-7820HK, GeForce GTX 1080 Mobile, 88.8 Wh | Alienware 17 R4 i7-7820HK, GeForce GTX 1080 Mobile, 99 Wh | Asus G701VIK-BA049T i7-7820HK, GeForce GTX 1080 Mobile, 93 Wh | Schenker XMG U727 2017 i7-7700K, GeForce GTX 1080 Mobile, 89 Wh | |
|---|---|---|---|---|---|---|
| Batteridrifttid | 5% | 55% | 29% | 61% | 28% | |
| Reader / Idle (h) | 3 | 5.2 73% | 4.6 53% | 5.7 90% | 3.7 23% | |
| H.264 (h) | 2.5 | 2.4 -4% | 3.4 36% | |||
| WiFi v1.3 (h) | 2.4 | 2.7 13% | 4.2 75% | 3 25% | 4 67% | 2.8 17% |
| Load (h) | 1.1 | 1.5 36% | 1.2 9% | 1.4 27% | 1.6 45% |
För
Emot
Läs
MSI GT75VR 7RF-012 Titan Pro
- 08/08/2017 v6 (old)
Florian Glaser
Price comparison