Test: Dell Precision 3530 (Xeon E-2176M, Quadro P600) Arbetsstation (Sammanfattning)
| SD Card Reader | |
| average JPG Copy Test (av. of 3 runs) | |
| Dell Precision 3520 (Toshiba Exceria Pro SDXC 64 GB UHS-II) | |
| HP ZBook 15 G4-Y4E80AV (Toshiba Exceria Pro SDXC 64 GB UHS-II) | |
| Dell Precision 3530 (Toshiba Exceria Pro SDXC 64 GB UHS-II) | |
| Lenovo ThinkPad P52 20MAS03N00 (Toshiba Exceria Pro SDXC 64 GB UHS-II) | |
| Dell Precision 5520 UHD (Toshiba Exceria Pro SDXC 64 GB UHS-II) | |
| Genomsnitt av klass Workstation (49.6 - 681, n=14, senaste 2 åren) | |
| Lenovo ThinkPad P52S-20LB001FUS (Toshiba Exceria Pro SDXC 64 GB UHS-II) | |
| maximum AS SSD Seq Read Test (1GB) | |
| Dell Precision 5520 UHD (Toshiba Exceria Pro SDXC 64 GB UHS-II) | |
| Genomsnitt av klass Workstation (87.6 - 1455, n=14, senaste 2 åren) | |
| HP ZBook 15 G4-Y4E80AV (Toshiba Exceria Pro SDXC 64 GB UHS-II) | |
| Dell Precision 3530 (Toshiba Exceria Pro SDXC 64 GB UHS-II) | |
| Lenovo ThinkPad P52 20MAS03N00 (Toshiba Exceria Pro SDXC 64 GB UHS-II) | |
| Dell Precision 3520 (Toshiba Exceria Pro SDXC 64 GB UHS-II) | |
| Lenovo ThinkPad P52S-20LB001FUS (Toshiba Exceria Pro SDXC 64 GB UHS-II) | |
| |||||||||||||||||||||||||
Distribution av ljusstyrkan: 85 %
Mitt på batteriet: 285.7 cd/m²
Kontrast: 922:1 (Svärta: 0.31 cd/m²)
ΔE ColorChecker Calman: 5.84 | ∀{0.5-29.43 Ø4.71}
calibrated: 3.14
ΔE Greyscale Calman: 6.5 | ∀{0.09-98 Ø4.96}
94% sRGB (Argyll 1.6.3 3D)
62% AdobeRGB 1998 (Argyll 1.6.3 3D)
69.3% AdobeRGB 1998 (Argyll 3D)
94.6% sRGB (Argyll 3D)
72.8% Display P3 (Argyll 3D)
Gamma: 2.383
CCT: 7176 K
| Dell Precision 3530 BOE BOE06F1, IPS, 15.6", 1920x1080 | Dell Precision 3520 IPS LED, 15.6", 1920x1080 | Dell Precision 5520 UHD SHP1476, IPS, 15.6", 3840x2160 | Lenovo ThinkPad P52 20MAS03N00 N156HCE-EN1, IPS LED, 15.6", 1920x1080 | Lenovo ThinkPad P52S-20LB001FUS Lenovo LEN40BD, IPS, 15.6", 3840x2160 | HP ZBook 15 G4-Y4E80AV LG Philips LGD057E, IPS, 15.6", 1920x1080 | |
|---|---|---|---|---|---|---|
| Display | 0% | -1% | -7% | -6% | -13% | |
| Display P3 Coverage (%) | 72.8 | 72.7 0% | 67.4 -7% | 65.6 -10% | 67.3 -8% | 64 -12% |
| sRGB Coverage (%) | 94.6 | 94.8 0% | 98.5 4% | 90.3 -5% | 89.4 -5% | 82.7 -13% |
| AdobeRGB 1998 Coverage (%) | 69.3 | 69.3 0% | 68.9 -1% | 65.9 -5% | 65.4 -6% | 60.4 -13% |
| Response Times | -9% | -34% | 14% | 21% | 15% | |
| Response Time Grey 50% / Grey 80% * (ms) | 40.4 ? | 48 ? -19% | 59.2 ? -47% | 39.2 ? 3% | 43.2 ? -7% | 39.2 ? 3% |
| Response Time Black / White * (ms) | 34.8 ? | 34.4 ? 1% | 41.6 ? -20% | 26 ? 25% | 18 ? 48% | 25.6 ? 26% |
| PWM Frequency (Hz) | 1053 ? | 1064 ? | 25250 ? | 980 | 20830 ? | |
| Screen | 6% | 14% | 11% | 13% | 10% | |
| Brightness middle (cd/m²) | 285.7 | 345 21% | 372.4 30% | 304 6% | 305.5 7% | 321 12% |
| Brightness (cd/m²) | 275 | 329 20% | 368 34% | 293 7% | 282 3% | 320 16% |
| Brightness Distribution (%) | 85 | 88 4% | 90 6% | 88 4% | 78 -8% | 89 5% |
| Black Level * (cd/m²) | 0.31 | 0.37 -19% | 0.48 -55% | 0.26 16% | 0.24 23% | 0.29 6% |
| Contrast (:1) | 922 | 932 1% | 776 -16% | 1169 27% | 1273 38% | 1107 20% |
| Colorchecker dE 2000 * | 5.84 | 5 14% | 2.6 55% | 4.5 23% | 3.51 40% | 4.5 23% |
| Colorchecker dE 2000 max. * | 8.76 | 8 9% | 5.6 36% | 7.7 12% | 7.28 17% | 9.5 -8% |
| Colorchecker dE 2000 calibrated * | 3.14 | 2.4 24% | 3.15 -0% | |||
| Greyscale dE 2000 * | 6.5 | 6.2 5% | 3.7 43% | 5.2 20% | 4 38% | 2.9 55% |
| Gamma | 2.383 92% | 2.35 94% | 2.14 103% | 2.26 97% | 2.18 101% | 2.27 97% |
| CCT | 7176 91% | 6702 97% | 7096 92% | 6789 96% | 7291 89% | 6519 100% |
| Color Space (Percent of AdobeRGB 1998) (%) | 62 | 61.8 0% | 63 2% | 53.8 -13% | 58 -6% | 54.2 -13% |
| Color Space (Percent of sRGB) (%) | 94 | 94.7 1% | 99 5% | 90.1 -4% | 89 -5% | 82.6 -12% |
| Totalt genomsnitt (program/inställningar) | -1% /
3% | -7% /
5% | 6% /
8% | 9% /
11% | 4% /
6% |
* ... mindre är bättre
Visa svarstider
| ↔ Svarstid svart till vitt | ||
|---|---|---|
| 34.8 ms ... stiga ↗ och falla ↘ kombinerat | ↗ 20.8 ms stiga | 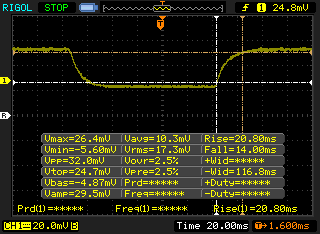 |
| ↘ 14 ms hösten | ||
| Skärmen visar långsamma svarsfrekvenser i våra tester och kommer att vara otillfredsställande för spelare. I jämförelse sträcker sig alla testade enheter från 0.1 (minst) till 240 (maximalt) ms. » 92 % av alla enheter är bättre. Detta innebär att den uppmätta svarstiden är sämre än genomsnittet av alla testade enheter (19.8 ms). | ||
| ↔ Svarstid 50 % grått till 80 % grått | ||
| 40.4 ms ... stiga ↗ och falla ↘ kombinerat | ↗ 22 ms stiga | 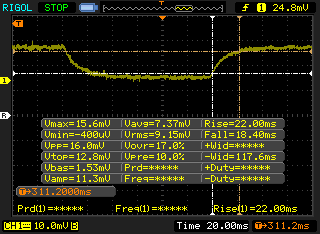 |
| ↘ 18.4 ms hösten | ||
| Skärmen visar långsamma svarsfrekvenser i våra tester och kommer att vara otillfredsställande för spelare. I jämförelse sträcker sig alla testade enheter från 0.165 (minst) till 636 (maximalt) ms. » 64 % av alla enheter är bättre. Detta innebär att den uppmätta svarstiden är sämre än genomsnittet av alla testade enheter (31 ms). | ||
Skärmflimmer / PWM (Puls-Width Modulation)
| Skärmflimmer / PWM upptäckt | 1053 Hz | ≤ 98 % ljusstyrka inställning | 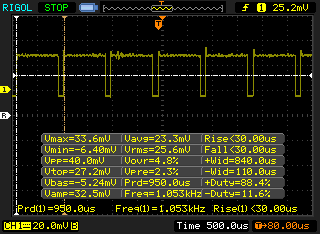 |
Displayens bakgrundsbelysning flimrar vid 1053 Hz (i värsta fall, t.ex. med PWM) Flimrande upptäckt vid en ljusstyrkeinställning på 98 % och lägre. Det ska inte finnas något flimmer eller PWM över denna ljusstyrkeinställning. Frekvensen för 1053 Hz är ganska hög, så de flesta användare som är känsliga för PWM bör inte märka något flimmer. Som jämförelse: 52 % av alla testade enheter använder inte PWM för att dämpa skärmen. Om PWM upptäcktes mättes ett medelvärde av 7754 (minst: 5 - maximum: 343500) Hz. | |||
| Cinebench R10 | |
| Rendering Multiple CPUs 32Bit | |
| Genomsnitt av klass Workstation (n=1senaste 2 åren) | |
| Genomsnitt Intel Xeon E-2176M (31923 - 43681, n=3) | |
| Dell Precision 3530 | |
| Lenovo ThinkPad P52S-20LB001FUS | |
| Rendering Single 32Bit | |
| Genomsnitt av klass Workstation (n=1senaste 2 åren) | |
| Genomsnitt Intel Xeon E-2176M (6928 - 9142, n=3) | |
| Dell Precision 3530 | |
| Lenovo ThinkPad P52S-20LB001FUS | |
| wPrime 2.10 - 1024m | |
| Dell Precision 5520 UHD | |
| Eurocom Tornado F5W | |
| Genomsnitt av klass Workstation (n=1senaste 2 åren) | |
| Dell Precision 3530 | |
| Genomsnitt Intel Xeon E-2176M (147 - 179.6, n=2) | |
* ... mindre är bättre
| PCMark 8 Home Score Accelerated v2 | 4233 poäng | |
| PCMark 8 Creative Score Accelerated v2 | 5126 poäng | |
| PCMark 8 Work Score Accelerated v2 | 5295 poäng | |
| PCMark 10 Score | 4817 poäng | |
Hjälp | ||
| Dell Precision 3530 SK hynix PC400 512 GB | Dell Precision 3520 Toshiba XG4 NVMe (THNSN5512GPUK) | Dell Precision 5520 UHD Samsung SM961 MZVKW512HMJP m.2 PCI-e | Lenovo ThinkPad P52 20MAS03N00 Samsung SSD PM981 MZVLB512HAJQ | Lenovo ThinkPad P52S-20LB001FUS Samsung SSD PM981 MZVLB1T0HALR | HP ZBook 15 G4-Y4E80AV Samsung SSD SM961 1TB M.2 MZVKW1T0HMLH | |
|---|---|---|---|---|---|---|
| AS SSD | -31% | 29% | 33% | 26% | 35% | |
| Copy Game MB/s (MB/s) | 1050 | 747 -29% | 921 -12% | 1016 -3% | 982 -6% | |
| Copy Program MB/s (MB/s) | 346.1 | 340.4 -2% | 372.8 8% | 476.9 38% | 325.4 -6% | |
| Copy ISO MB/s (MB/s) | 1701 | 1053 -38% | 1659 -2% | 1016 -40% | 1486 -13% | |
| Score Total (Points) | 3013 | 1646 -45% | 3681 22% | 4307 43% | 4038 34% | 4303 43% |
| Score Write (Points) | 1138 | 248 -78% | 1379 21% | 2079 83% | 1468 29% | 1472 29% |
| Score Read (Points) | 1288 | 961 -25% | 1554 21% | 1485 15% | 1703 32% | 1902 48% |
| Access Time Write * (ms) | 0.053 | 0.034 36% | 0.023 57% | 0.031 42% | 0.04 25% | 0.023 57% |
| Access Time Read * (ms) | 0.099 | 0.123 -24% | 0.038 62% | 0.072 27% | 0.04 60% | 0.034 66% |
| 4K-64 Write (MB/s) | 908 | 134.5 -85% | 1055 16% | 1780 96% | 1245 37% | 1136 25% |
| 4K-64 Read (MB/s) | 994 | 788 -21% | 1223 23% | 1203 21% | 1524 53% | 1578 59% |
| 4K Write (MB/s) | 102.8 | 93.8 -9% | 155.3 51% | 121 18% | 100.5 -2% | 158 54% |
| 4K Read (MB/s) | 25.98 | 32.58 25% | 51.5 98% | 52.6 102% | 44.33 71% | 51.7 99% |
| Seq Write (MB/s) | 1272 | 201.9 -84% | 1694 33% | 1781 40% | 1220 -4% | 1777 40% |
| Seq Read (MB/s) | 2682 | 1406 -48% | 2799 4% | 2294 -14% | 1351 -50% | 2719 1% |
* ... mindre är bättre

| 3DMark 06 Standard Score | 18112 poäng | |
| 3DMark 11 Performance | 5193 poäng | |
| 3DMark Cloud Gate Standard Score | 19813 poäng | |
| 3DMark Fire Strike Score | 3858 poäng | |
Hjälp | ||
| BioShock Infinite - 1920x1080 Ultra Preset, DX11 (DDOF) (sortera efter värde) | |
| Dell Precision 3520 | |
| Dell Precision 5520 UHD | |
| MSI WS63VR 7RL-023US | |
| Genomsnitt NVIDIA Quadro P600 (n=1) | |
| Rise of the Tomb Raider | |
| 1920x1080 Very High Preset AA:FX AF:16x (sortera efter värde) | |
| Dell Precision 3530 | |
| Lenovo ThinkPad P52S-20LB001FUS | |
| MSI WS63VR 7RL-023US | |
| Genomsnitt NVIDIA Quadro P600 (20 - 21, n=2) | |
| 1366x768 Medium Preset AF:2x (sortera efter värde) | |
| Dell Precision 3530 | |
| Dell Precision 3520 | |
| Lenovo ThinkPad P52S-20LB001FUS | |
| MSI WS63VR 7RL-023US | |
| Genomsnitt NVIDIA Quadro P600 (45 - 46.5, n=2) | |
| låg | med. | hög | ultra | |
|---|---|---|---|---|
| The Witcher 3 (2015) | 60 | 45 | 25 | 14 |
| Rise of the Tomb Raider (2016) | 70 | 45 | 23 | 20 |
| Rocket League (2017) | 220 | 118 | 72 | |
| Middle-earth: Shadow of War (2017) | 81 | 32 | 23 | 17 |
Ljudnivå
| Låg belastning |
| 28.3 / 28.3 / 28.4 dB(A) |
| Hög belastning |
| 46.2 / 48.6 dB(A) |
 | ||
30 dB tyst 40 dB(A) hörbar 50 dB(A) högt ljud |
||
min: | ||
| Dell Precision 3530 Quadro P600, E-2176M, SK hynix PC400 512 GB | Dell Precision 3520 Quadro M620, i7-7820HQ, Toshiba XG4 NVMe (THNSN5512GPUK) | Dell Precision 5520 UHD Quadro M1200, E3-1505M v6, Samsung SM961 MZVKW512HMJP m.2 PCI-e | Lenovo ThinkPad P52 20MAS03N00 Quadro P1000, i7-8750H, Samsung SSD PM981 MZVLB512HAJQ | Lenovo ThinkPad P52S-20LB001FUS Quadro P500, i7-8650U, Samsung SSD PM981 MZVLB1T0HALR | HP ZBook 15 G4-Y4E80AV Quadro M2200, E3-1535M v6, Samsung SSD SM961 1TB M.2 MZVKW1T0HMLH | |
|---|---|---|---|---|---|---|
| Noise | -3% | -2% | 5% | 4% | 4% | |
| av / miljö * (dB) | 28.1 | 29.6 -5% | 28.7 -2% | 29.5 -5% | 28.3 -1% | 29.5 -5% |
| Idle Minimum * (dB) | 28.3 | 29.6 -5% | 28.7 -1% | 29.5 -4% | 28.3 -0% | 29.5 -4% |
| Idle Average * (dB) | 28.3 | 29.6 -5% | 32.1 -13% | 29.5 -4% | 28.3 -0% | 29.5 -4% |
| Idle Maximum * (dB) | 28.4 | 31.2 -10% | 32.1 -13% | 29.5 -4% | 29.8 -5% | 30 -6% |
| Load Average * (dB) | 46.2 | 43 7% | 41.3 11% | 34.7 25% | 40.6 12% | 39.5 15% |
| Load Maximum * (dB) | 48.6 | 46.9 3% | 45.5 6% | 39.4 19% | 40.6 16% | 36 26% |
| Witcher 3 ultra * (dB) | 45.5 | 33.1 | 40.6 | 39.5 |
* ... mindre är bättre
(±) Den maximala temperaturen på ovansidan är 44.8 °C / 113 F, jämfört med genomsnittet av 38.2 °C / 101 F , allt från 22.2 till 69.8 °C för klassen Workstation.
(-) Botten värms upp till maximalt 56.4 °C / 134 F, jämfört med genomsnittet av 41.1 °C / 106 F
(+) Vid tomgångsbruk är medeltemperaturen för ovansidan 25.9 °C / 79 F, jämfört med enhetsgenomsnittet på 32 °C / ### class_avg_f### F.
(+) Handledsstöden och pekplattan är kallare än hudtemperaturen med maximalt 23.4 °C / 74.1 F och är därför svala att ta på.
(+) Medeltemperaturen för handledsstödsområdet på liknande enheter var 27.8 °C / 82 F (+4.4 °C / 7.9 F).
Dell Precision 3530 ljudanalys
(±) | högtalarljudstyrkan är genomsnittlig men bra (74 dB)
Bas 100 - 315 Hz
(±) | reducerad bas - i genomsnitt 13.4% lägre än medianen
(±) | linjäriteten för basen är genomsnittlig (14.9% delta till föregående frekvens)
Mellan 400 - 2000 Hz
(±) | högre mellan - i genomsnitt 5.5% högre än median
(±) | linjäriteten för mids är genomsnittlig (7.5% delta till föregående frekvens)
Högsta 2 - 16 kHz
(+) | balanserade toppar - endast 1.3% från medianen
(+) | toppar är linjära (5.2% delta till föregående frekvens)
Totalt 100 - 16 000 Hz
(±) | linjäriteten för det totala ljudet är genomsnittlig (17.9% skillnad mot median)
Jämfört med samma klass
» 56% av alla testade enheter i den här klassen var bättre, 11% liknande, 33% sämre
» Den bästa hade ett delta på 7%, genomsnittet var 17%, sämst var 35%
Jämfört med alla testade enheter
» 37% av alla testade enheter var bättre, 8% liknande, 55% sämre
» Den bästa hade ett delta på 4%, genomsnittet var 23%, sämst var 134%
Dell Precision 5520 UHD ljudanalys
(±) | högtalarljudstyrkan är genomsnittlig men bra (79.6 dB)
Bas 100 - 315 Hz
(±) | reducerad bas - i genomsnitt 12.8% lägre än medianen
(±) | linjäriteten för basen är genomsnittlig (14.2% delta till föregående frekvens)
Mellan 400 - 2000 Hz
(+) | balanserad mellan - endast 4% från medianen
(±) | linjäriteten för mids är genomsnittlig (9.9% delta till föregående frekvens)
Högsta 2 - 16 kHz
(+) | balanserade toppar - endast 3.3% från medianen
(±) | linjäriteten för toppar är genomsnittlig (12% delta till föregående frekvens)
Totalt 100 - 16 000 Hz
(±) | linjäriteten för det totala ljudet är genomsnittlig (16.7% skillnad mot median)
Jämfört med samma klass
» 46% av alla testade enheter i den här klassen var bättre, 9% liknande, 45% sämre
» Den bästa hade ett delta på 7%, genomsnittet var 17%, sämst var 35%
Jämfört med alla testade enheter
» 29% av alla testade enheter var bättre, 7% liknande, 64% sämre
» Den bästa hade ett delta på 4%, genomsnittet var 23%, sämst var 134%
| Av/Standby | |
| Låg belastning | |
| Hög belastning |
|
Förklaring:
min: | |
| Dell Precision 3530 E-2176M, Quadro P600, SK hynix PC400 512 GB, IPS, 1920x1080, 15.6" | Dell Precision 3520 i7-7820HQ, Quadro M620, Toshiba XG4 NVMe (THNSN5512GPUK), IPS LED, 1920x1080, 15.6" | Dell Precision 5520 UHD E3-1505M v6, Quadro M1200, Samsung SM961 MZVKW512HMJP m.2 PCI-e, IPS, 3840x2160, 15.6" | Lenovo ThinkPad P52 20MAS03N00 i7-8750H, Quadro P1000, Samsung SSD PM981 MZVLB512HAJQ, IPS LED, 1920x1080, 15.6" | Lenovo ThinkPad P52S-20LB001FUS i7-8650U, Quadro P500, Samsung SSD PM981 MZVLB1T0HALR, IPS, 3840x2160, 15.6" | HP ZBook 15 G4-Y4E80AV E3-1535M v6, Quadro M2200, Samsung SSD SM961 1TB M.2 MZVKW1T0HMLH, IPS, 1920x1080, 15.6" | |
|---|---|---|---|---|---|---|
| Power Consumption | 0% | -30% | 4% | 10% | -13% | |
| Idle Minimum * (Watt) | 5.3 | 5.8 -9% | 8.9 -68% | 4.02 24% | 5.9 -11% | 5.9 -11% |
| Idle Average * (Watt) | 10.7 | 10.7 -0% | 13.6 -27% | 7.2 33% | 11.7 -9% | 8.9 17% |
| Idle Maximum * (Watt) | 14.1 | 13.3 6% | 14.1 -0% | 11.46 19% | 15.6 -11% | 12.7 10% |
| Load Average * (Watt) | 85.4 | 78.2 8% | 100.3 -17% | 76.3 11% | 63 26% | 95.2 -11% |
| Witcher 3 ultra * (Watt) | 75.5 | 58.8 22% | 100.2 -33% | 74 2% | 48.4 36% | 87.7 -16% |
| Load Maximum * (Watt) | 91.9 | 116 -26% | 126.3 -37% | 154 -68% | 63.1 31% | 154 -68% |
* ... mindre är bättre
| Dell Precision 3530 E-2176M, Quadro P600, 92 Wh | Dell Precision 3520 i7-7820HQ, Quadro M620, 68 Wh | Dell Precision 5520 UHD E3-1505M v6, Quadro M1200, 97 Wh | Lenovo ThinkPad P52 20MAS03N00 i7-8750H, Quadro P1000, 96 Wh | Lenovo ThinkPad P52S-20LB001FUS i7-8650U, Quadro P500, 80 Wh | HP ZBook 15 G4-Y4E80AV E3-1535M v6, Quadro M2200, 90 Wh | |
|---|---|---|---|---|---|---|
| Batteridrifttid | -16% | -43% | 10% | 20% | 5% | |
| Reader / Idle (h) | 18.8 | 16.6 -12% | 12.1 -36% | 25.3 35% | 17.2 -9% | 18.3 -3% |
| WiFi v1.3 (h) | 9.3 | 7.6 -18% | 4.2 -55% | 10.6 14% | 11.1 19% | 9.1 -2% |
| Load (h) | 1.6 | 1.3 -19% | 1 -37% | 1.3 -19% | 2.4 50% | 1.9 19% |
För
Emot
Läs den fullständiga versionen av den här recensionen på engelska här.
Berättelsen om Dell Precision 3530 handlar om kompromisser. Dell har återanvänt chassit från den äldre 3520 men stoppat i kraftigare hårdvara. Detta gör att liknande problem plågar 3530, i huvudsak när det rör hantering av värme samt ljudnivån. Precis som 3520 har 3530 obekvämt varma områden. Fläkten spinner också upp snabbt och högljutt. Än värre, den dåliga värmehanteringen resulterar i kraftig värmestrypning som begränsar processorns prestanda vid hög belastning med upp till 20%.
Dessa kompromisser fördärvar en i övrigt utmärkt enhet. 3530 är välbyggd, har ett utmärkt tangentbord och har en bra uppsättning portar (inklusive en Thunderbolt 3-port). Skärmen är genomsnittlig och borde vara tillräcklig för professionellt arbete som inte är färgberoende. Batteritiden är utmärkt.
Trots alla dessa fördelar faller Precision 3530 i slutändan på sin inkonsekventa prestanda. Xeon CPU:n och Quadro GPU:n är helt enkelt för mycket för det mediokra värmesystemet. Resultatet är kraftig strypning, särskilt när det gäller processorns prestanda, samt en högljudd och aggressiv fläkt. Det finns mycket bättre alternativ som erbjuder liknande (om inte bättre) och mycket mer konsekvent prestanda. HP:s Zbook 15 G4 eller Lenovo ThinkPad P52 hade varit bättre val.
Dell Precision 3530
- 08/13/2018 v6 (old)
Sam Medley
Price comparison
