Test: Alienware 15 R3 (i7-7820HK, GTX 1080 Max-Q, Full-HD) Laptop (Sammanfattning)
| Networking | |
| iperf3 transmit AX12 | |
| Alienware 15 R3 Max-Q | |
| Alienware 15 R3 | |
| Acer Predator Triton 700 | |
| Aorus X5 v7 | |
| Eurocom Q5 | |
| iperf3 receive AX12 | |
| Alienware 15 R3 Max-Q | |
| Acer Predator Triton 700 | |
| Alienware 15 R3 | |
| Eurocom Q5 | |
| Aorus X5 v7 | |
| |||||||||||||||||||||||||
Distribution av ljusstyrkan: 89 %
Mitt på batteriet: 306 cd/m²
Kontrast: 1093:1 (Svärta: 0.28 cd/m²)
ΔE ColorChecker Calman: 5.45 | ∀{0.5-29.43 Ø4.71}
ΔE Greyscale Calman: 4.9 | ∀{0.09-98 Ø4.96}
83% sRGB (Argyll 1.6.3 3D)
54% AdobeRGB 1998 (Argyll 1.6.3 3D)
60.6% AdobeRGB 1998 (Argyll 3D)
82.9% sRGB (Argyll 3D)
64.3% Display P3 (Argyll 3D)
Gamma: 2.49
CCT: 7062 K
| Alienware 15 R3 Max-Q LG Philips LP156WF6 (LGD049B), 1920x1080, 15.6" | Alienware 15 R3 HPJGK_B156HTN (AUO51ED), 1920x1080, 15.6" | Acer Predator Triton 700 AUO B156HAN04.2 (AUO42ED), 1920x1080, 15.6" | Aorus X5 v7 AU Optronics B156ZAN02.3 (AUO23EB), 3840x2160, 15.6" | Eurocom Q5 ID: LGD04D4, Name: LG Philips LP156UD1-SPB1, 3840x2160, 15.6" | |
|---|---|---|---|---|---|
| Display | 7% | 3% | 7% | 5% | |
| Display P3 Coverage (%) | 64.3 | 66 3% | 62.5 -3% | 65.3 2% | 63 -2% |
| sRGB Coverage (%) | 82.9 | 90.5 9% | 88.7 7% | 91.9 11% | 92.7 12% |
| AdobeRGB 1998 Coverage (%) | 60.6 | 66.2 9% | 63.5 5% | 66.3 9% | 64.4 6% |
| Response Times | 47% | -9% | -2% | 8% | |
| Response Time Grey 50% / Grey 80% * (ms) | 40 ? | 25 ? 37% | 44.8 ? -12% | 44 ? -10% | 32.4 ? 19% |
| Response Time Black / White * (ms) | 28 ? | 12 ? 57% | 29.6 ? -6% | 26.4 ? 6% | 28.8 ? -3% |
| PWM Frequency (Hz) | 21100 ? | ||||
| Screen | -26% | -1% | 4% | -16% | |
| Brightness middle (cd/m²) | 306 | 386 26% | 291 -5% | 307 0% | 287.5 -6% |
| Brightness (cd/m²) | 297 | 382 29% | 277 -7% | 297 0% | 279 -6% |
| Brightness Distribution (%) | 89 | 93 4% | 84 -6% | 92 3% | 87 -2% |
| Black Level * (cd/m²) | 0.28 | 0.39 -39% | 0.22 21% | 0.3 -7% | 0.65 -132% |
| Contrast (:1) | 1093 | 990 -9% | 1323 21% | 1023 -6% | 442 -60% |
| Colorchecker dE 2000 * | 5.45 | 10.2 -87% | 5.52 -1% | 4.72 13% | 4.5 17% |
| Colorchecker dE 2000 max. * | 9.45 | 15.81 -67% | 10.72 -13% | 8.07 15% | 8.9 6% |
| Greyscale dE 2000 * | 4.9 | 11.28 -130% | 6.59 -34% | 4.79 2% | 4.6 6% |
| Gamma | 2.49 88% | 2.23 99% | 2.44 90% | 2.42 91% | 2.39 92% |
| CCT | 7062 92% | 11383 57% | 7816 83% | 7690 85% | 7393 88% |
| Color Space (Percent of AdobeRGB 1998) (%) | 54 | 59 9% | 58 7% | 60 11% | 59 9% |
| Color Space (Percent of sRGB) (%) | 83 | 90 8% | 89 7% | 92 11% | 92.3 11% |
| Totalt genomsnitt (program/inställningar) | 9% /
-9% | -2% /
-1% | 3% /
4% | -1% /
-8% |
* ... mindre är bättre
Skärmflimmer / PWM (Puls-Width Modulation)
| Skärmflimmer / PWM upptäckt | 21100 Hz | ≤ 95 % ljusstyrka inställning | 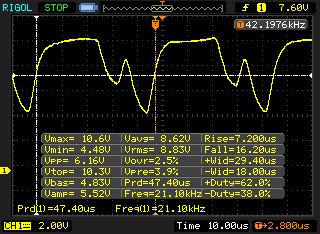 |
Displayens bakgrundsbelysning flimrar vid 21100 Hz (i värsta fall, t.ex. med PWM) Flimrande upptäckt vid en ljusstyrkeinställning på 95 % och lägre. Det ska inte finnas något flimmer eller PWM över denna ljusstyrkeinställning. Frekvensen för 21100 Hz är ganska hög, så de flesta användare som är känsliga för PWM bör inte märka något flimmer. Som jämförelse: 52 % av alla testade enheter använder inte PWM för att dämpa skärmen. Om PWM upptäcktes mättes ett medelvärde av 7754 (minst: 5 - maximum: 343500) Hz. | |||
Visa svarstider
| ↔ Svarstid svart till vitt | ||
|---|---|---|
| 28 ms ... stiga ↗ och falla ↘ kombinerat | ↗ 16 ms stiga | 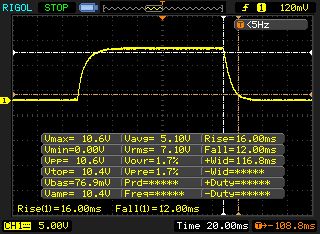 |
| ↘ 12 ms hösten | ||
| Skärmen visar relativt långsamma svarsfrekvenser i våra tester och kan vara för långsam för spelare. I jämförelse sträcker sig alla testade enheter från 0.1 (minst) till 240 (maximalt) ms. » 71 % av alla enheter är bättre. Detta innebär att den uppmätta svarstiden är sämre än genomsnittet av alla testade enheter (19.8 ms). | ||
| ↔ Svarstid 50 % grått till 80 % grått | ||
| 40 ms ... stiga ↗ och falla ↘ kombinerat | ↗ 19.6 ms stiga | 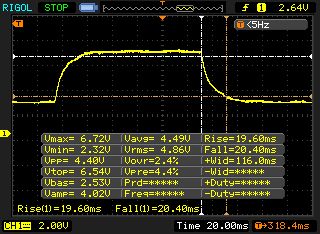 |
| ↘ 20.4 ms hösten | ||
| Skärmen visar långsamma svarsfrekvenser i våra tester och kommer att vara otillfredsställande för spelare. I jämförelse sträcker sig alla testade enheter från 0.165 (minst) till 636 (maximalt) ms. » 61 % av alla enheter är bättre. Detta innebär att den uppmätta svarstiden är sämre än genomsnittet av alla testade enheter (31 ms). | ||
| Cinebench R15 | |
| CPU Single 64Bit | |
| Aorus X5 v7 | |
| Alienware 15 R3 Max-Q | |
| Alienware 15 R3 | |
| Acer Predator Triton 700 | |
| Eurocom Q5 | |
| CPU Multi 64Bit | |
| Aorus X5 v7 | |
| Alienware 15 R3 Max-Q | |
| Eurocom Q5 | |
| Alienware 15 R3 | |
| Acer Predator Triton 700 | |
| Cinebench R10 | |
| Rendering Single 32Bit | |
| Alienware 15 R3 Max-Q | |
| Eurocom Q5 | |
| Rendering Multiple CPUs 32Bit | |
| Alienware 15 R3 Max-Q | |
| Eurocom Q5 | |
| Geekbench 3 | |
| 32 Bit Multi-Core Score | |
| Alienware 15 R3 Max-Q | |
| 32 Bit Single-Core Score | |
| Alienware 15 R3 Max-Q | |
| Geekbench 4.0 | |
| 64 Bit Multi-Core Score | |
| Alienware 15 R3 Max-Q | |
| 64 Bit Single-Core Score | |
| Alienware 15 R3 Max-Q | |
| Geekbench 4.4 | |
| 64 Bit Multi-Core Score | |
| Alienware 15 R3 Max-Q | |
| 64 Bit Single-Core Score | |
| Alienware 15 R3 Max-Q | |
| JetStream 1.1 - 1.1 Total | |
| Alienware 15 R3 Max-Q | |
| Eurocom Q5 | |
| PCMark 7 Score | 6972 poäng | |
| PCMark 8 Home Score Accelerated v2 | 5121 poäng | |
| PCMark 8 Creative Score Accelerated v2 | 7892 poäng | |
| PCMark 8 Work Score Accelerated v2 | 5305 poäng | |
| PCMark 10 Score | 5295 poäng | |
Hjälp | ||
| PCMark 8 | |
| Home Score Accelerated v2 | |
| Acer Predator Triton 700 | |
| Alienware 15 R3 Max-Q | |
| Alienware 15 R3 | |
| Aorus X5 v7 | |
| Eurocom Q5 | |
| Work Score Accelerated v2 | |
| Alienware 15 R3 Max-Q | |
| Alienware 15 R3 | |
| Acer Predator Triton 700 | |
| Eurocom Q5 | |

| Alienware 15 R3 Max-Q LiteOn CX2-8B256 | Aorus X5 v7 Toshiba NVMe THNSN5256GPU7 | Alienware 15 R3 | |
|---|---|---|---|
| CrystalDiskMark 3.0 | 19% | -20% | |
| Read Seq (MB/s) | 1840 | 1479 -20% | 1123 -39% |
| Write Seq (MB/s) | 802 | 1076 34% | 429.2 -46% |
| Read 512 (MB/s) | 944 | 1086 15% | 833 -12% |
| Write 512 (MB/s) | 671 | 1101 64% | 428.1 -36% |
| Read 4k (MB/s) | 43.03 | 44 2% | 37.8 -12% |
| Write 4k (MB/s) | 141 | 137.8 -2% | 122.9 -13% |
| Read 4k QD32 (MB/s) | 595 | 697 17% | 542 -9% |
| Write 4k QD32 (MB/s) | 403.6 | 556 38% | 429.8 6% |
| 3DMark 06 Standard Score | 31555 poäng | |
| 3DMark 11 Performance | 17829 poäng | |
| 3DMark Ice Storm Standard Score | 134673 poäng | |
| 3DMark Cloud Gate Standard Score | 28375 poäng | |
| 3DMark Fire Strike Score | 14631 poäng | |
| 3DMark Fire Strike Extreme Score | 7998 poäng | |
| 3DMark Time Spy Score | 5793 poäng | |
Hjälp | ||
| 3DMark 11 - 1280x720 Performance GPU | |
| Guru Mars K | |
| MSI GT75VR 7RF-012 Titan Pro | |
| Alienware 15 R3 Max-Q | |
| Acer Predator Triton 700 | |
| Alienware 15 R3 | |
| Aorus X5 v7 | |
| Eurocom Q5 | |
| 3DMark - 1920x1080 Fire Strike Graphics | |
| Guru Mars K | |
| MSI GT75VR 7RF-012 Titan Pro | |
| Alienware 15 R3 Max-Q | |
| Acer Predator Triton 700 | |
| Alienware 15 R3 | |
| Aorus X5 v7 | |
| Eurocom Q5 | |
| The Witcher 3 - 1920x1080 Ultra Graphics & Postprocessing (HBAO+) | |
| MSI GT75VR 7RF-012 Titan Pro | |
| Guru Mars K | |
| Razer Blade Pro 2017 | |
| Alienware 15 R3 Max-Q | |
| Acer Predator Triton 700 | |
| Aorus X5 v7 | |
| Eurocom Q5 | |
| Prey - 1920x1080 Very High Preset AA:2TX SM AF:16x | |
| Alienware 15 R3 Max-Q | |
| Guru Mars K | |
| Eurocom Q5 | |
| MSI GT75VR 7RF-012 Titan Pro | |
| Acer Predator Triton 700 | |
| Razer Blade Pro 2017 | |
| BioShock Infinite - 1920x1080 Ultra Preset, DX11 (DDOF) | |
| Alienware 15 R3 Max-Q | |
| Eurocom Q5 | |
| Ghost Recon Wildlands - 1920x1080 Ultra Preset AA:T AF:16x | |
| Guru Mars K | |
| MSI GT75VR 7RF-012 Titan Pro | |
| Razer Blade Pro 2017 | |
| Alienware 15 R3 Max-Q | |
| Acer Predator Triton 700 | |
| låg | med. | hög | ultra | |
|---|---|---|---|---|
| Tomb Raider (2013) | 486.5 | 461.9 | 419.2 | 230.4 |
| BioShock Infinite (2013) | 272.3 | 243.6 | 232 | 151.7 |
| The Witcher 3 (2015) | 278.6 | 201.6 | 122.4 | 64.2 |
| For Honor (2017) | 229.6 | 161.2 | 152.9 | 121.3 |
| Ghost Recon Wildlands (2017) | 131.7 | 101.4 | 94.9 | 54.6 |
| Prey (2017) | 141.7 | 142 | 139.8 | 140.8 |
| Middle-earth: Shadow of War (2017) | 146 | 132 | 111 | 88 |
| The Evil Within 2 (2017) | 90.1 | 66.6 | 64 | 62.6 |
Ljudnivå
| Låg belastning |
| 32 / 33 / 35 dB(A) |
| Hårddisk |
| 33 dB(A) |
| Hög belastning |
| 46 / 50 dB(A) |
 | ||
30 dB tyst 40 dB(A) hörbar 50 dB(A) högt ljud |
||
min: | ||
| Alienware 15 R3 Max-Q i7-7820HK, GeForce GTX 1080 Max-Q | Acer Predator Triton 700 i7-7700HQ, GeForce GTX 1080 Max-Q | Aorus X5 v7 i7-7820HK, GeForce GTX 1070 Mobile | Eurocom Q5 i7-7700HQ, GeForce GTX 1070 Max-Q | Alienware 15 R3 i7-7700HQ, GeForce GTX 1070 Mobile | Guru Mars K i7-7700, GeForce GTX 1080 Mobile | MSI GT75VR 7RF-012 Titan Pro i7-7820HK, GeForce GTX 1080 Mobile | |
|---|---|---|---|---|---|---|---|
| Noise | -0% | -6% | 2% | -4% | -7% | -8% | |
| av / miljö * (dB) | 29 | 31 -7% | 30 -3% | 29 -0% | 30 -3% | 29 -0% | 30 -3% |
| Idle Minimum * (dB) | 32 | 33 -3% | 35 -9% | 31.5 2% | 31 3% | 36 -13% | 33 -3% |
| Idle Average * (dB) | 33 | 34 -3% | 36 -9% | 33.8 -2% | 32 3% | 37 -12% | 34 -3% |
| Idle Maximum * (dB) | 35 | 40 -14% | 40 -14% | 33.8 3% | 42 -20% | 40 -14% | 38 -9% |
| Load Average * (dB) | 46 | 41 11% | 43 7% | 41.7 9% | 49 -7% | 45 2% | 44 4% |
| Witcher 3 ultra * (dB) | 48 | 43 10% | 49 -2% | 41.7 13% | 50 -4% | 56 -17% | |
| Load Maximum * (dB) | 50 | 48 4% | 55 -10% | 54.2 -8% | 50 -0% | 55 -10% | 62 -24% |
* ... mindre är bättre
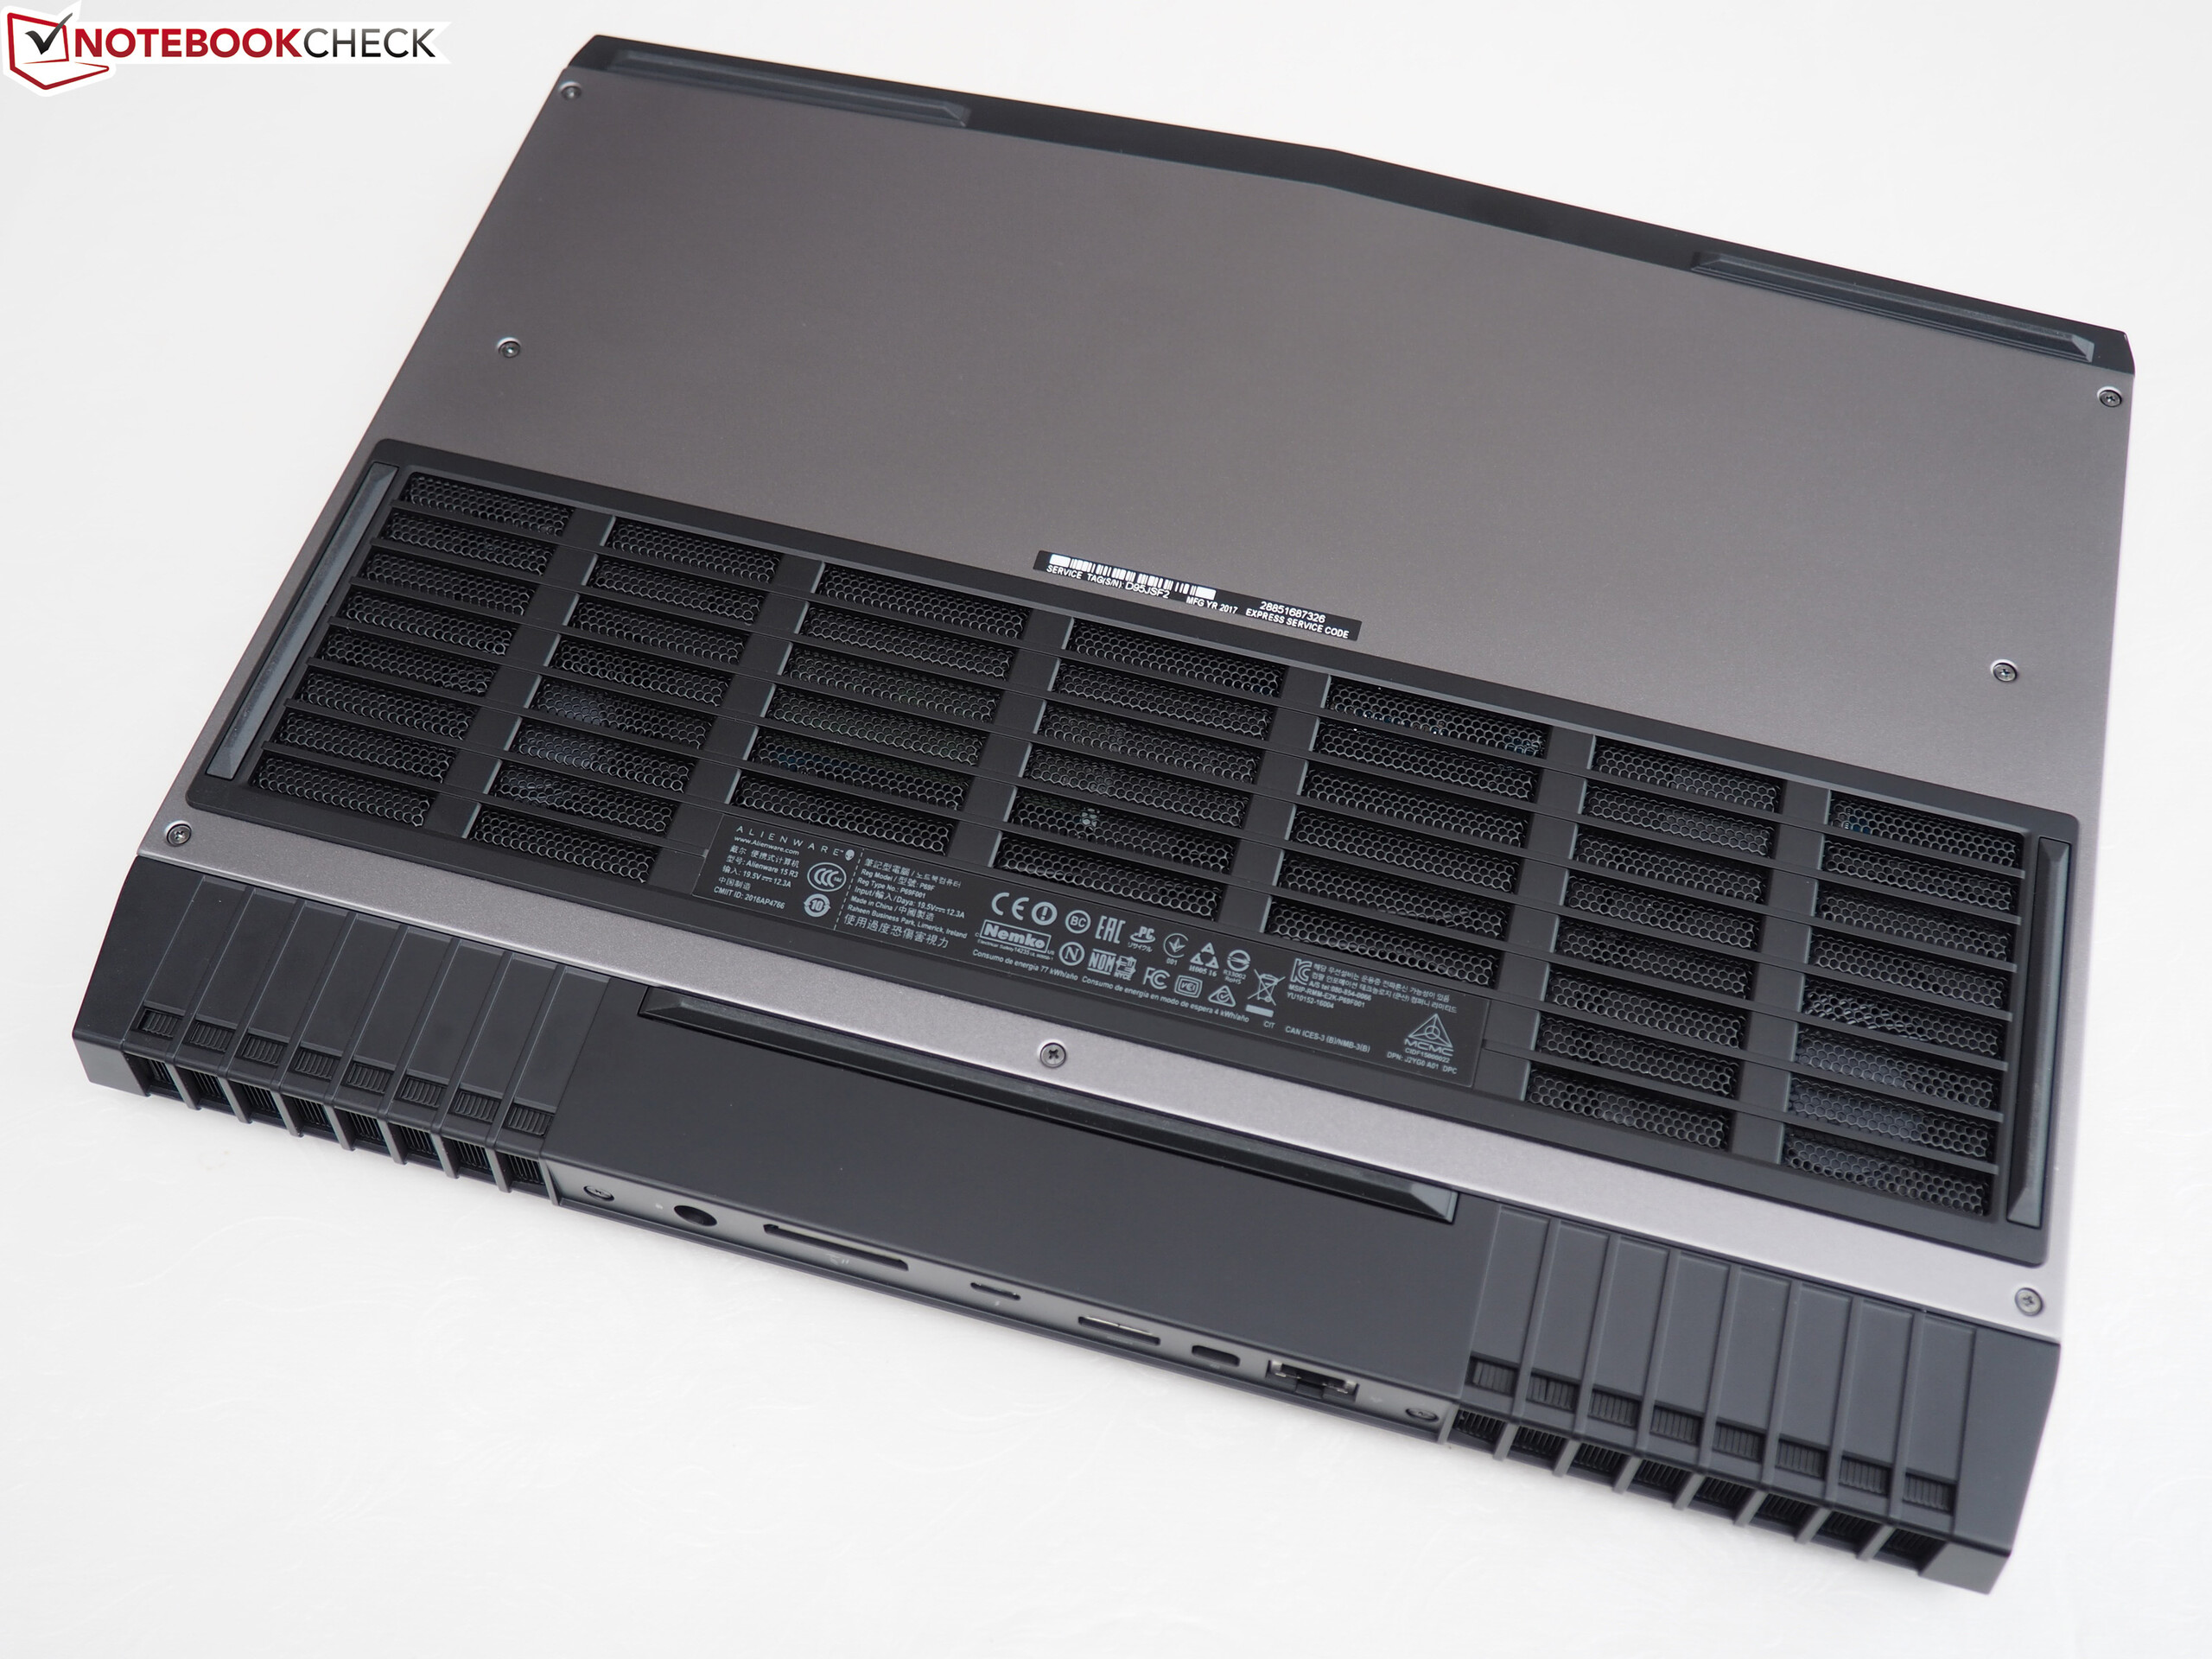
(-) Den maximala temperaturen på ovansidan är 47 °C / 117 F, jämfört med genomsnittet av 40.4 °C / 105 F , allt från 21.2 till 68.8 °C för klassen Gaming.
(-) Botten värms upp till maximalt 55 °C / 131 F, jämfört med genomsnittet av 43.2 °C / 110 F
(+) Vid tomgångsbruk är medeltemperaturen för ovansidan 31.7 °C / 89 F, jämfört med enhetsgenomsnittet på 33.9 °C / ### class_avg_f### F.
(-) När du spelar The Witcher 3 är medeltemperaturen för ovansidan 38.2 °C / 101 F, jämfört med enhetsgenomsnittet på 33.9 °C / ## #class_avg_f### F.
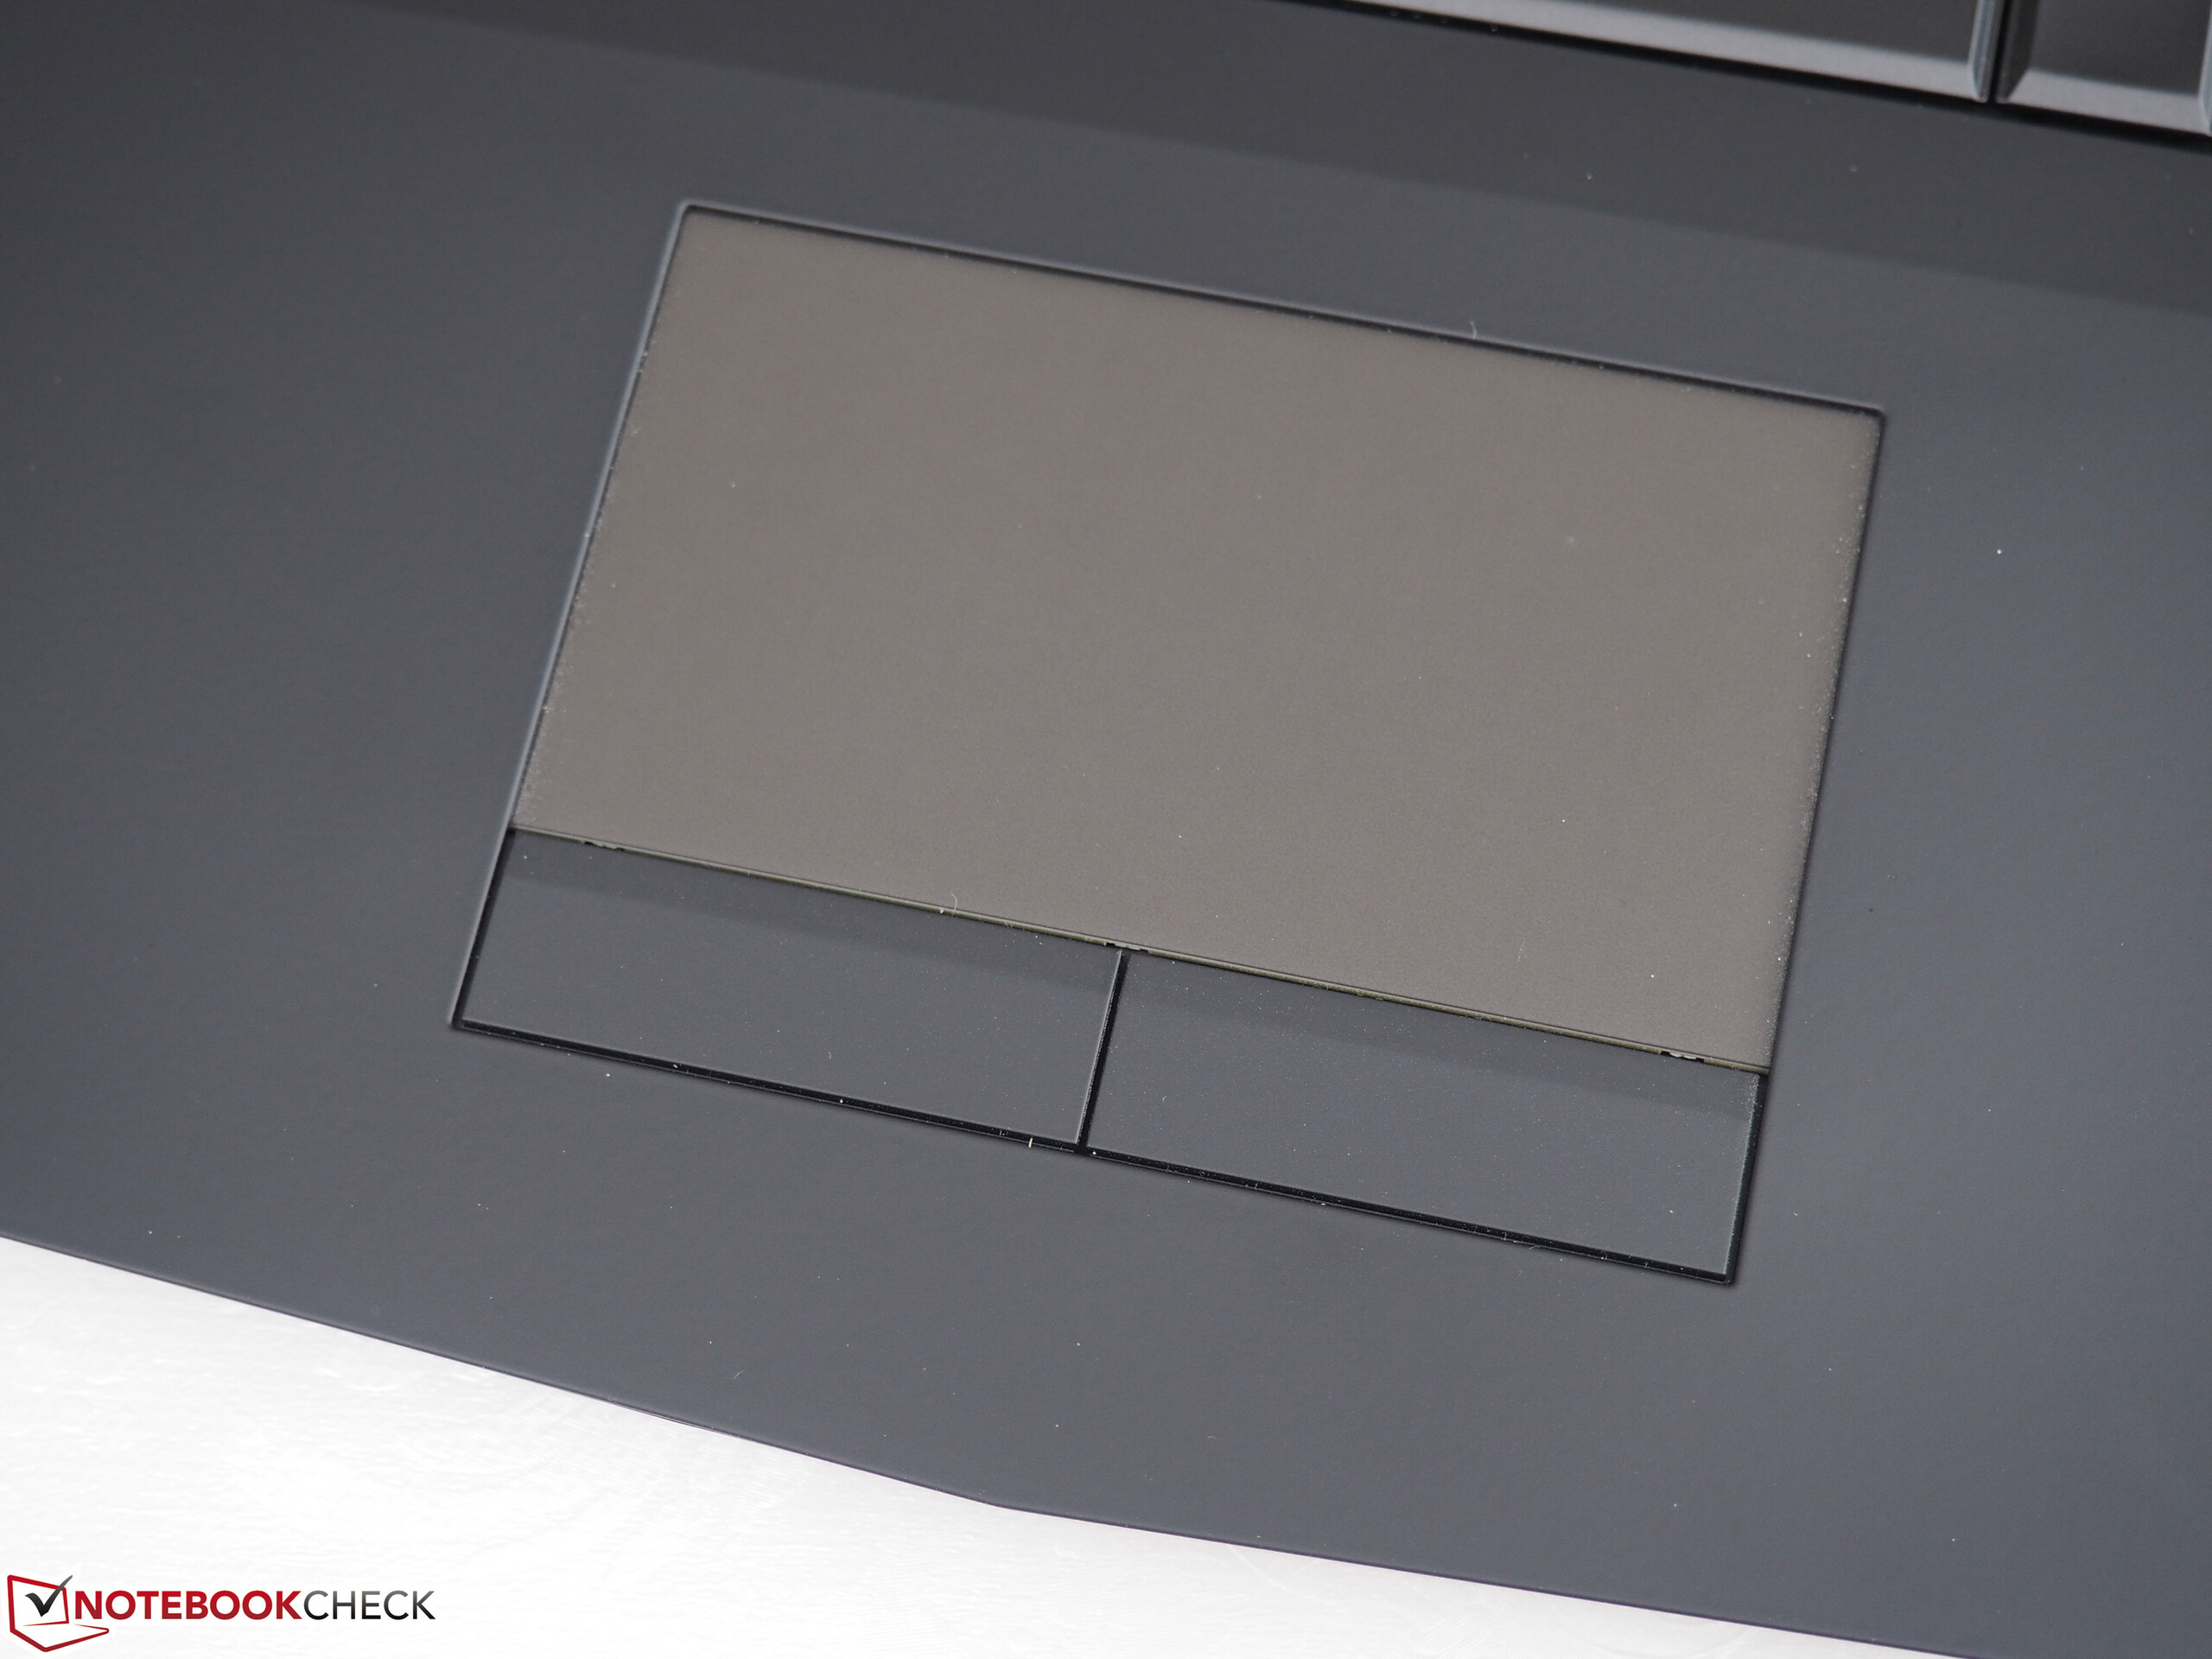
(+) Handledsstöden och pekplattan är kallare än hudtemperaturen med maximalt 27 °C / 80.6 F och är därför svala att ta på.
(±) Medeltemperaturen för handledsstödsområdet på liknande enheter var 28.8 °C / 83.8 F (+1.8 °C / 3.2 F).
| Alienware 15 R3 Max-Q i7-7820HK, GeForce GTX 1080 Max-Q | Acer Predator Triton 700 i7-7700HQ, GeForce GTX 1080 Max-Q | Aorus X5 v7 i7-7820HK, GeForce GTX 1070 Mobile | Eurocom Q5 i7-7700HQ, GeForce GTX 1070 Max-Q | Alienware 15 R3 i7-7700HQ, GeForce GTX 1070 Mobile | Guru Mars K i7-7700, GeForce GTX 1080 Mobile | MSI GT75VR 7RF-012 Titan Pro i7-7820HK, GeForce GTX 1080 Mobile | |
|---|---|---|---|---|---|---|---|
| Heat | -5% | 1% | 4% | 2% | 12% | 3% | |
| Maximum Upper Side * (°C) | 47 | 61 -30% | 64 -36% | 56.2 -20% | 46 2% | 46 2% | 46 2% |
| Maximum Bottom * (°C) | 55 | 69 -25% | 56 -2% | 61.2 -11% | 51.8 6% | 46 16% | 57 -4% |
| Idle Upper Side * (°C) | 36 | 29 19% | 29 19% | 27.8 23% | 36.5 -1% | 32 11% | 34 6% |
| Idle Bottom * (°C) | 38 | 32 16% | 30 21% | 29.6 22% | 38.2 -1% | 31 18% | 35 8% |
* ... mindre är bättre
Alienware 15 R3 Max-Q ljudanalys
(+) | högtalare kan spela relativt högt (87 dB)
Bas 100 - 315 Hz
(-) | nästan ingen bas - i genomsnitt 17.1% lägre än medianen
(±) | linjäriteten för basen är genomsnittlig (11% delta till föregående frekvens)
Mellan 400 - 2000 Hz
(±) | högre mellan - i genomsnitt 6.6% högre än median
(+) | mids är linjära (4.7% delta till föregående frekvens)
Högsta 2 - 16 kHz
(+) | balanserade toppar - endast 3% från medianen
(+) | toppar är linjära (4.3% delta till föregående frekvens)
Totalt 100 - 16 000 Hz
(±) | linjäriteten för det totala ljudet är genomsnittlig (15.2% skillnad mot median)
Jämfört med samma klass
» 33% av alla testade enheter i den här klassen var bättre, 6% liknande, 61% sämre
» Den bästa hade ett delta på 6%, genomsnittet var 18%, sämst var 132%
Jämfört med alla testade enheter
» 22% av alla testade enheter var bättre, 4% liknande, 74% sämre
» Den bästa hade ett delta på 4%, genomsnittet var 23%, sämst var 134%
Aorus X5 v7 ljudanalys
(±) | högtalarljudstyrkan är genomsnittlig men bra (78 dB)
Bas 100 - 315 Hz
(-) | nästan ingen bas - i genomsnitt 19% lägre än medianen
(±) | linjäriteten för basen är genomsnittlig (10.6% delta till föregående frekvens)
Mellan 400 - 2000 Hz
(+) | balanserad mellan - endast 4.2% från medianen
(+) | mids är linjära (5.8% delta till föregående frekvens)
Högsta 2 - 16 kHz
(+) | balanserade toppar - endast 2.1% från medianen
(+) | toppar är linjära (5.4% delta till föregående frekvens)
Totalt 100 - 16 000 Hz
(±) | linjäriteten för det totala ljudet är genomsnittlig (18.7% skillnad mot median)
Jämfört med samma klass
» 62% av alla testade enheter i den här klassen var bättre, 8% liknande, 30% sämre
» Den bästa hade ett delta på 6%, genomsnittet var 18%, sämst var 132%
Jämfört med alla testade enheter
» 43% av alla testade enheter var bättre, 8% liknande, 49% sämre
» Den bästa hade ett delta på 4%, genomsnittet var 23%, sämst var 134%
| Av/Standby | |
| Låg belastning | |
| Hög belastning |
|
Förklaring:
min: | |
| Alienware 15 R3 Max-Q i7-7820HK, GeForce GTX 1080 Max-Q | Acer Predator Triton 700 i7-7700HQ, GeForce GTX 1080 Max-Q | Aorus X5 v7 i7-7820HK, GeForce GTX 1070 Mobile | Eurocom Q5 i7-7700HQ, GeForce GTX 1070 Max-Q | Alienware 15 R3 i7-7700HQ, GeForce GTX 1070 Mobile | Guru Mars K i7-7700, GeForce GTX 1080 Mobile | MSI GT75VR 7RF-012 Titan Pro i7-7820HK, GeForce GTX 1080 Mobile | |
|---|---|---|---|---|---|---|---|
| Power Consumption | -15% | -13% | 35% | 10% | -43% | -50% | |
| Idle Minimum * (Watt) | 22 | 28 -27% | 26 -18% | 9 59% | 19 14% | 31 -41% | 34 -55% |
| Idle Average * (Watt) | 26 | 33 -27% | 31 -19% | 13.5 48% | 23 12% | 37 -42% | 41 -58% |
| Idle Maximum * (Watt) | 33 | 41 -24% | 36 -9% | 13.7 58% | 29 12% | 44 -33% | 50 -52% |
| Load Average * (Watt) | 86 | 94 -9% | 93 -8% | 87.8 -2% | 85 1% | 116 -35% | 106 -23% |
| Witcher 3 ultra * (Watt) | 159 | 160 -1% | 176 -11% | 129 19% | 259 -63% | 257 -62% | |
| Load Maximum * (Watt) | 215 | 222 -3% | 240 -12% | 158.6 26% | 192 11% | 312 -45% | 320 -49% |
* ... mindre är bättre
| Alienware 15 R3 Max-Q i7-7820HK, GeForce GTX 1080 Max-Q, 99 Wh | Alienware 15 R3 i7-7700HQ, GeForce GTX 1070 Mobile, 99 Wh | Acer Predator Triton 700 i7-7700HQ, GeForce GTX 1080 Max-Q, 54 Wh | Aorus X5 v7 i7-7820HK, GeForce GTX 1070 Mobile, 94 Wh | Eurocom Q5 i7-7700HQ, GeForce GTX 1070 Max-Q, 55 Wh | |
|---|---|---|---|---|---|
| Batteridrifttid | -13% | -56% | -44% | -23% | |
| Reader / Idle (h) | 7.1 | 6.4 -10% | 2.5 -65% | 3.5 -51% | 7.8 10% |
| H.264 (h) | 5 | 4.4 -12% | 1.8 -64% | 2.7 -46% | |
| WiFi v1.3 (h) | 5.4 | 4.4 -19% | 2.4 -56% | 2.5 -54% | 4.3 -20% |
| Load (h) | 1.9 | 1.7 -11% | 1.2 -37% | 1.4 -26% | 0.8 -58% |
För
Emot
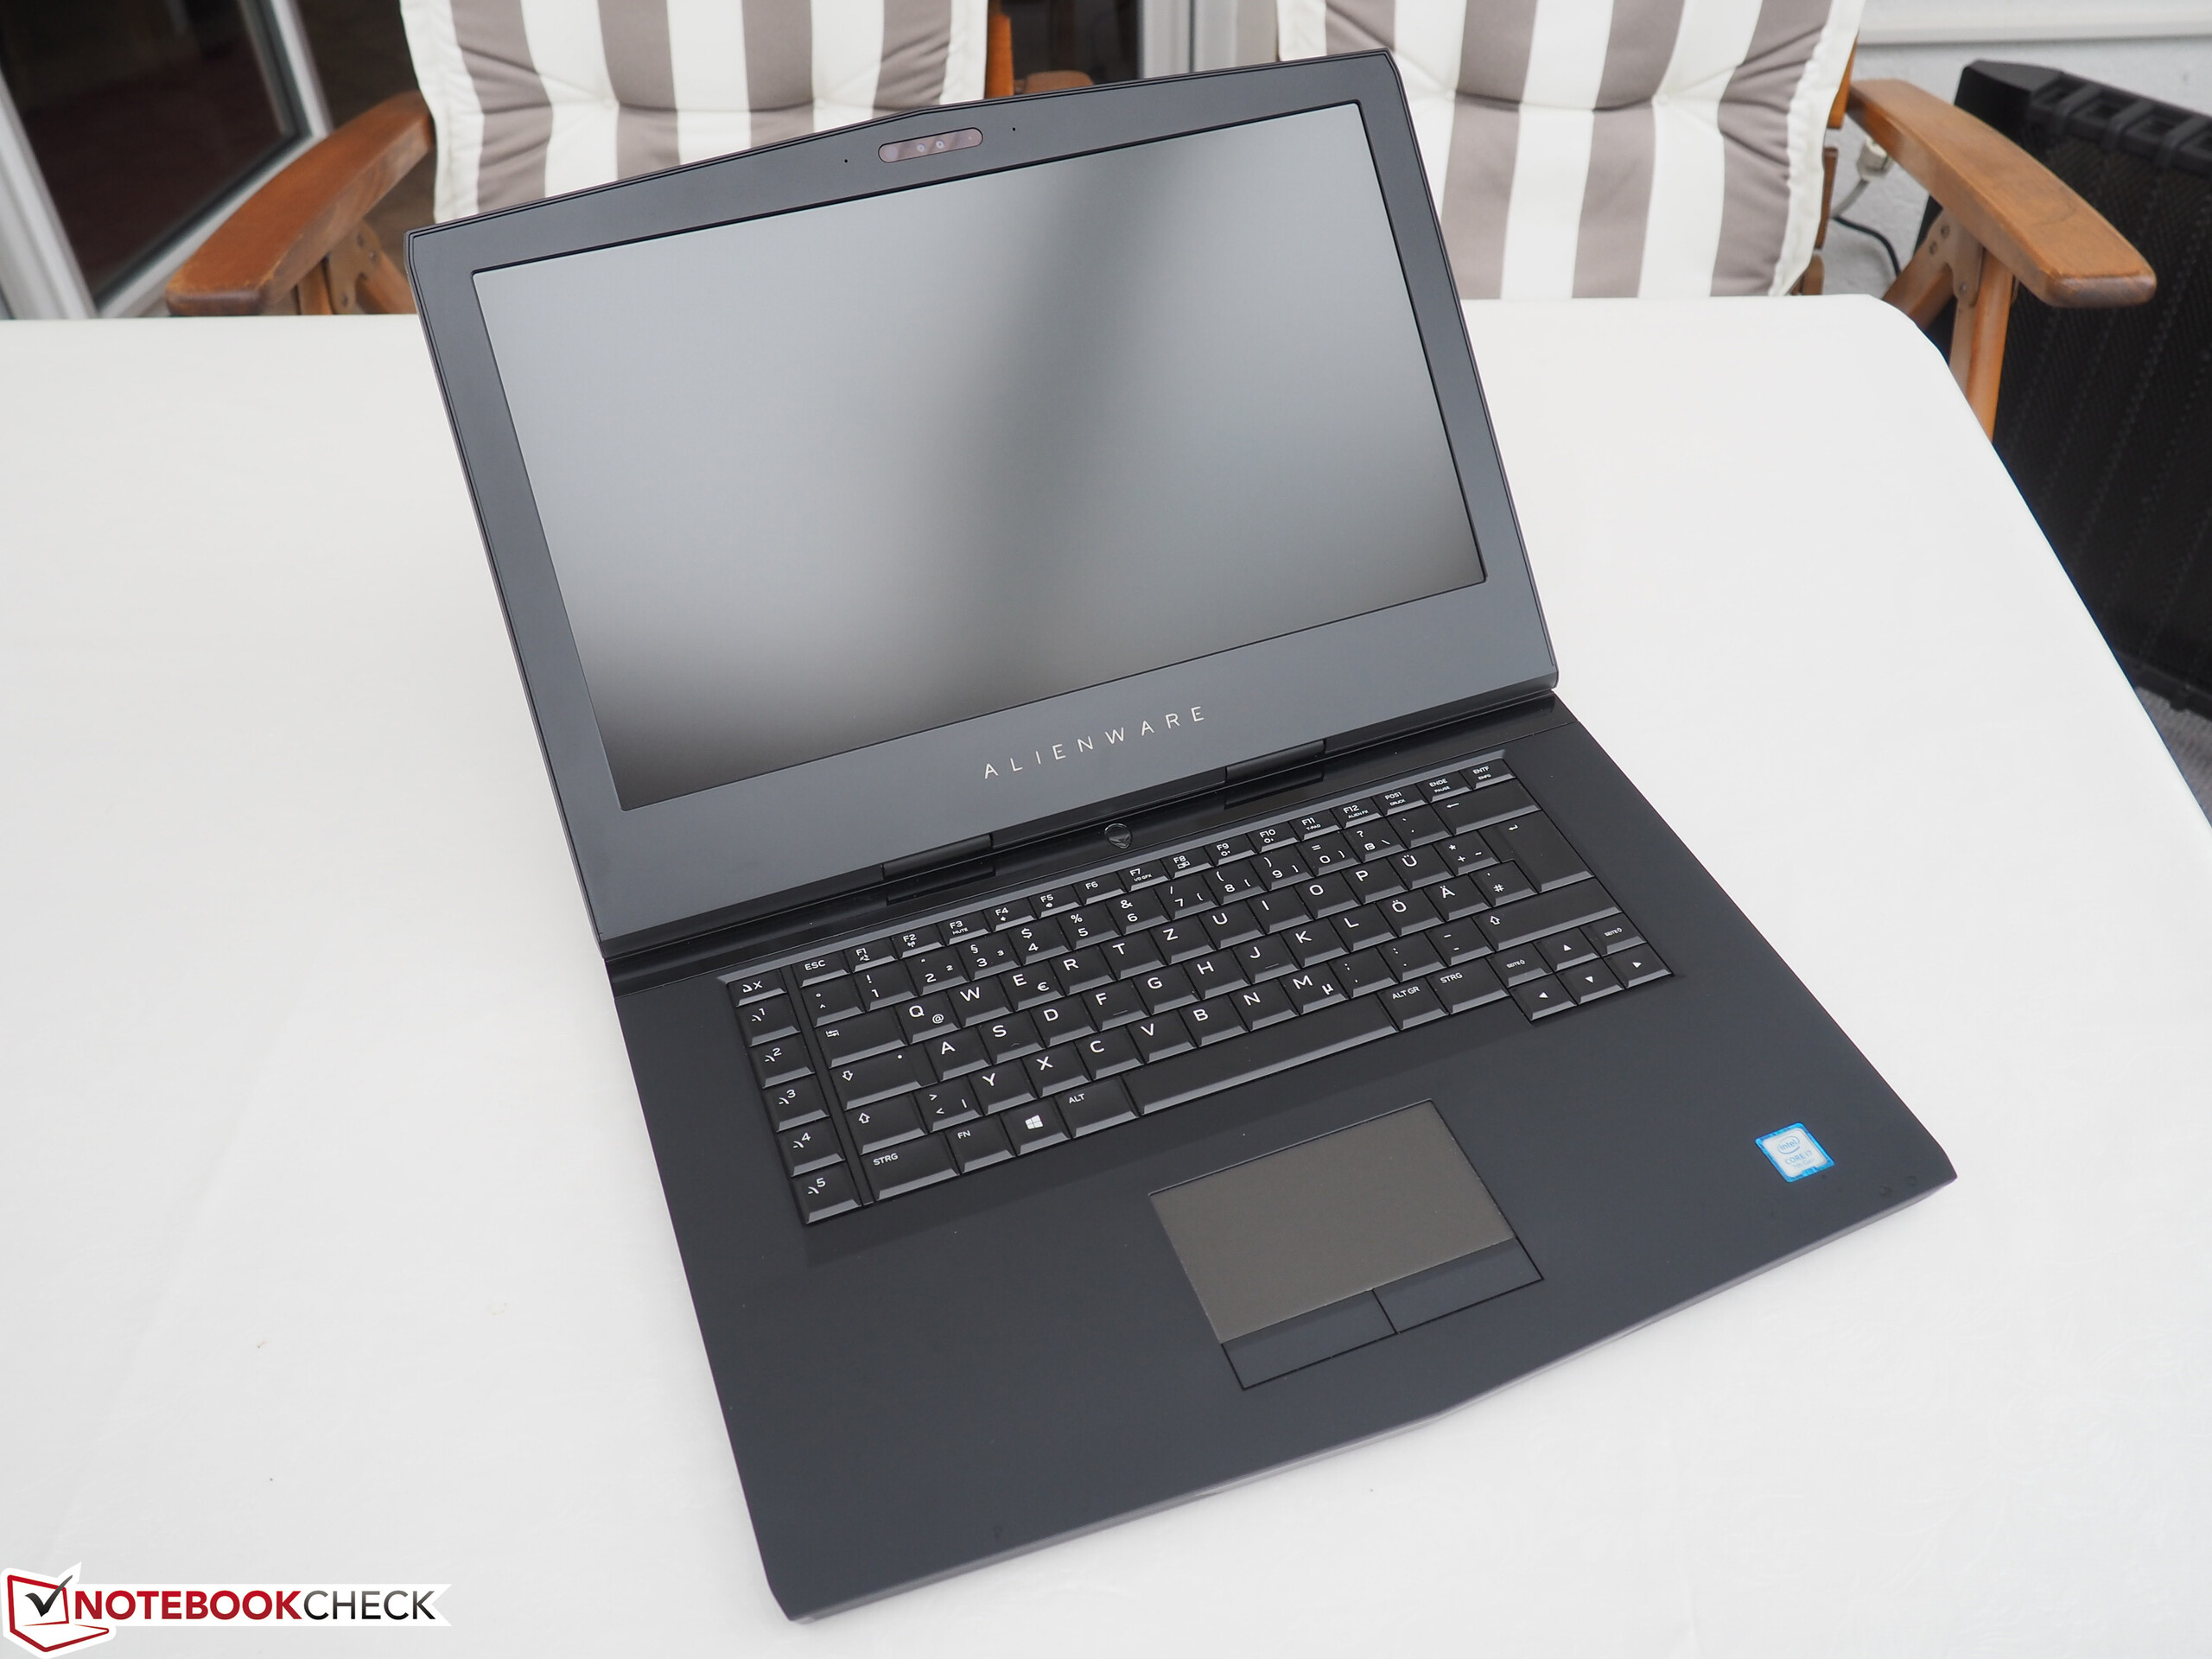
Alienware 15 R3 visar alla aktuella datorspel smidigt på sin matta FHD-skärm.
Inga kompromisser: Varje spel körs smidigt på högsta kvalitetsnivåer.
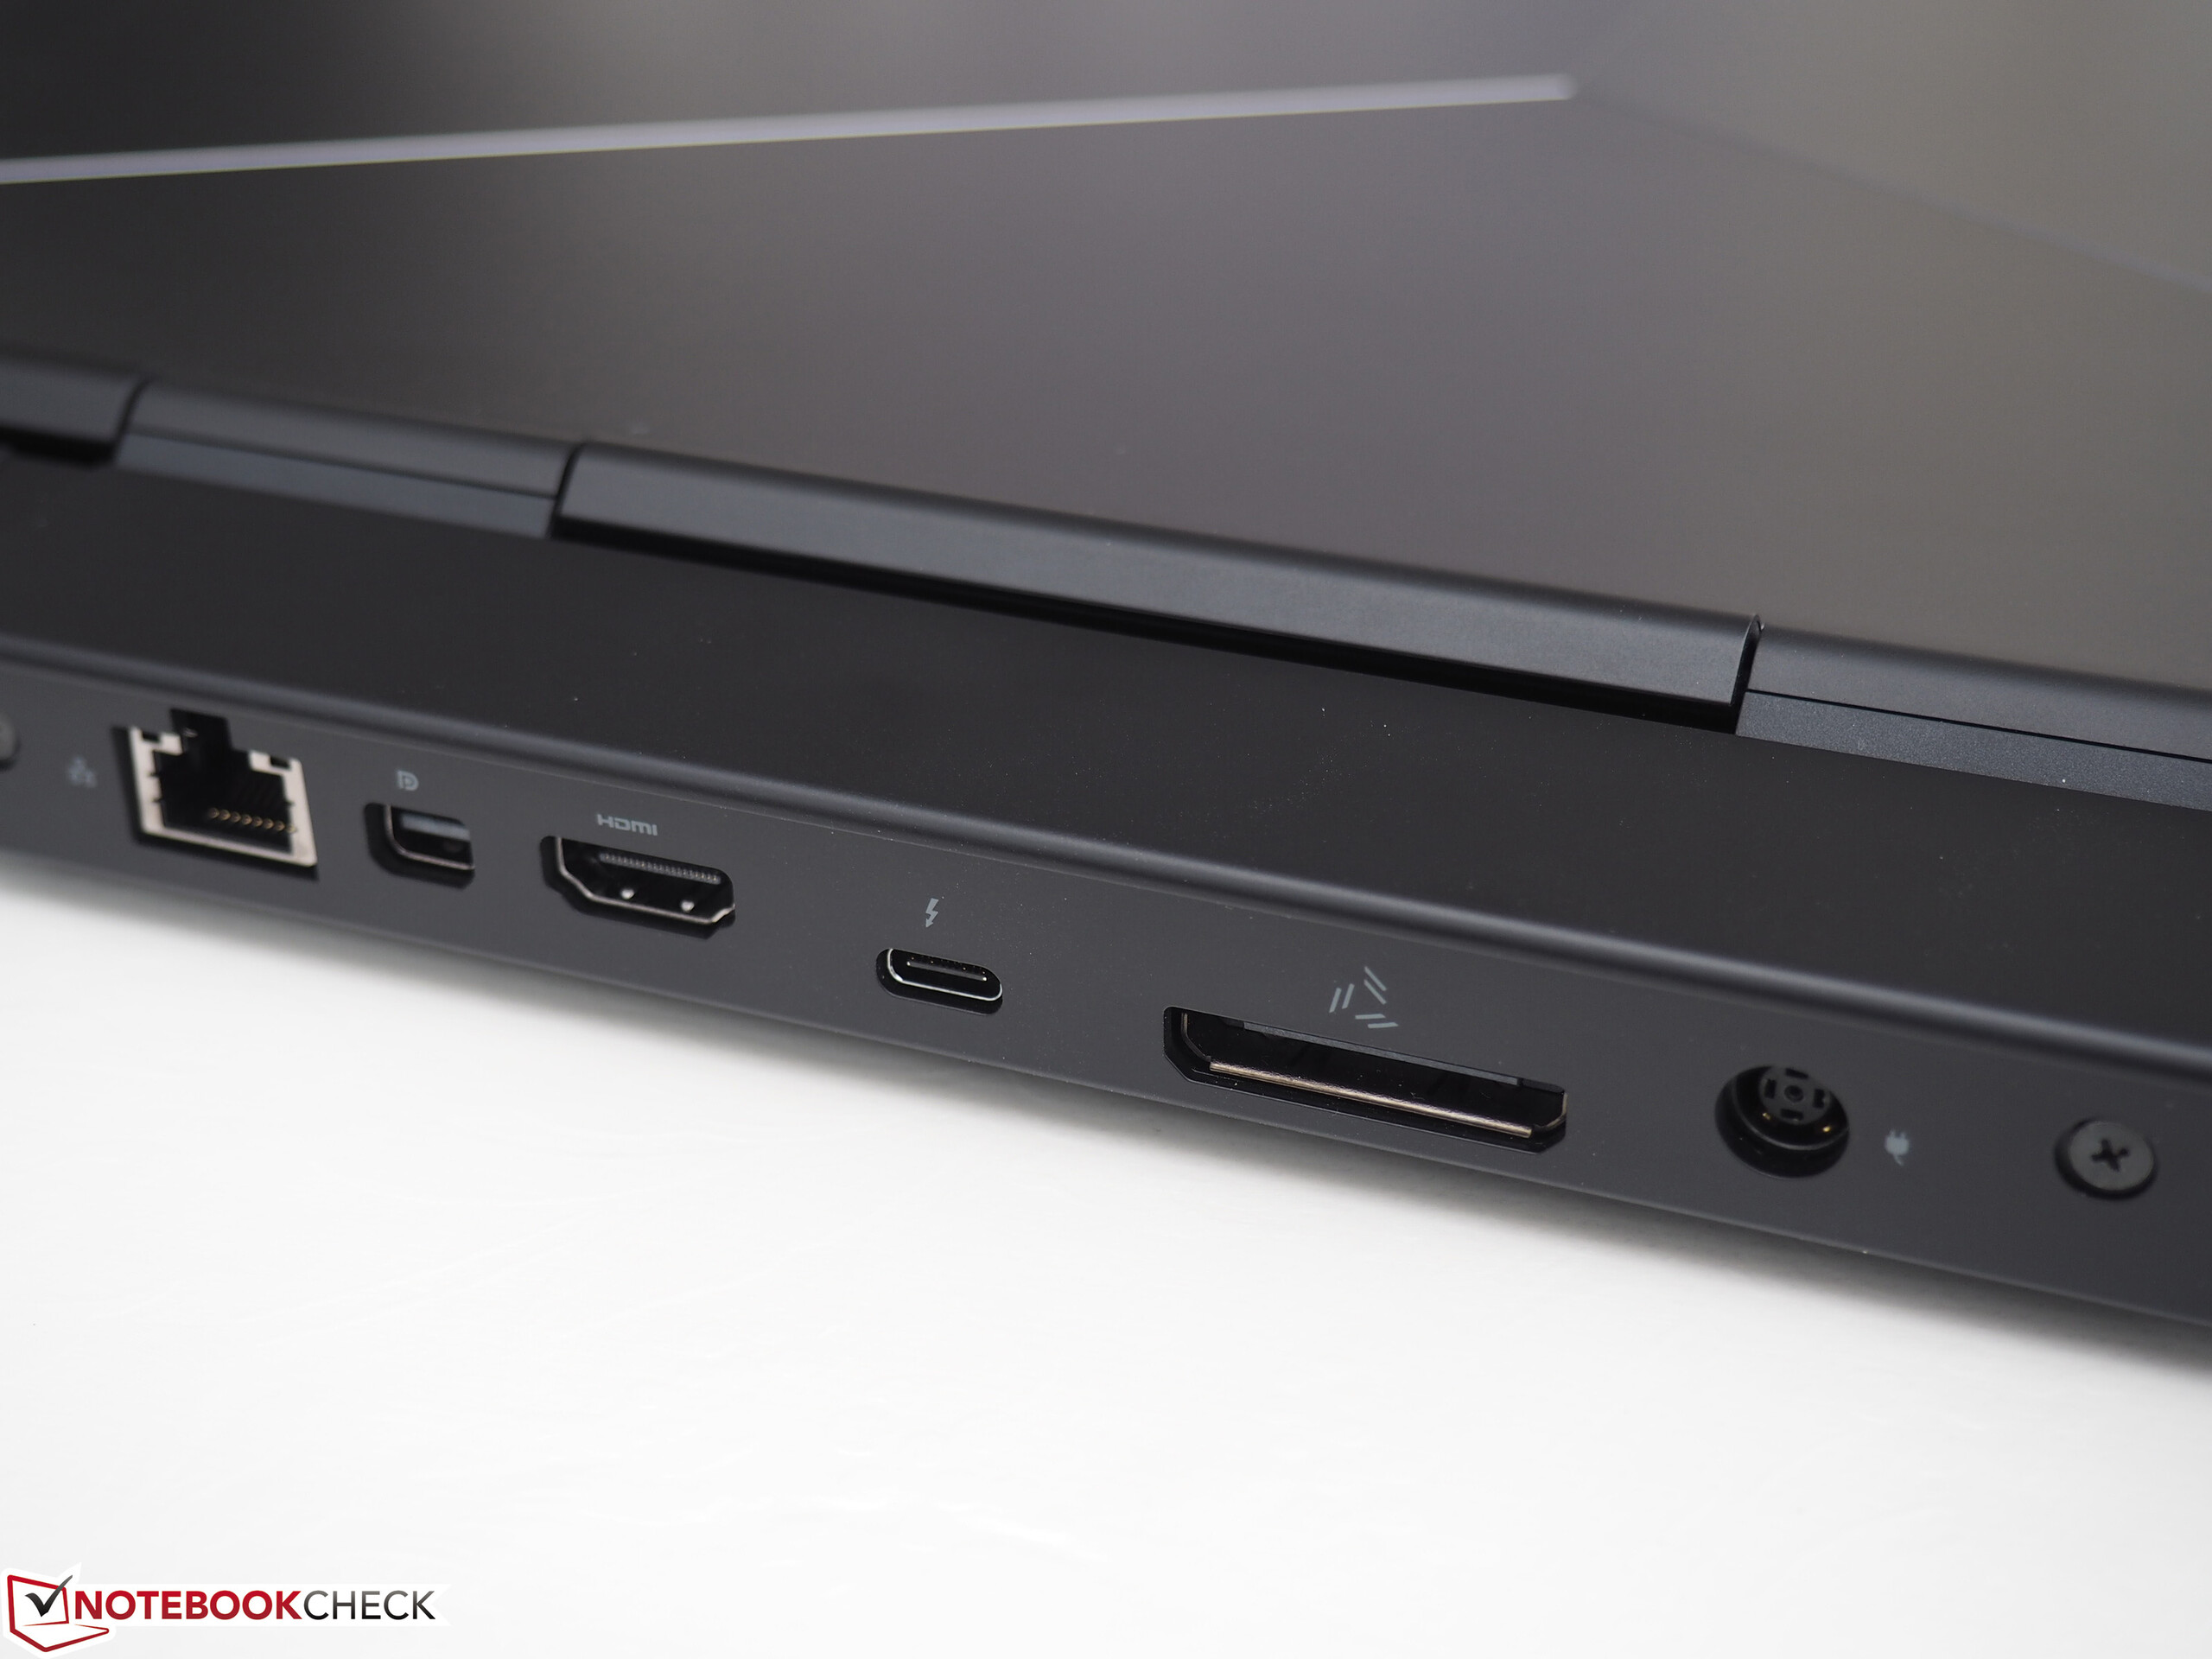
Skulle dess GPU bli för svag någon dag kan du ansluta en extern GPU via Thunderbolt 3-porten eller Graphics Amplifier.
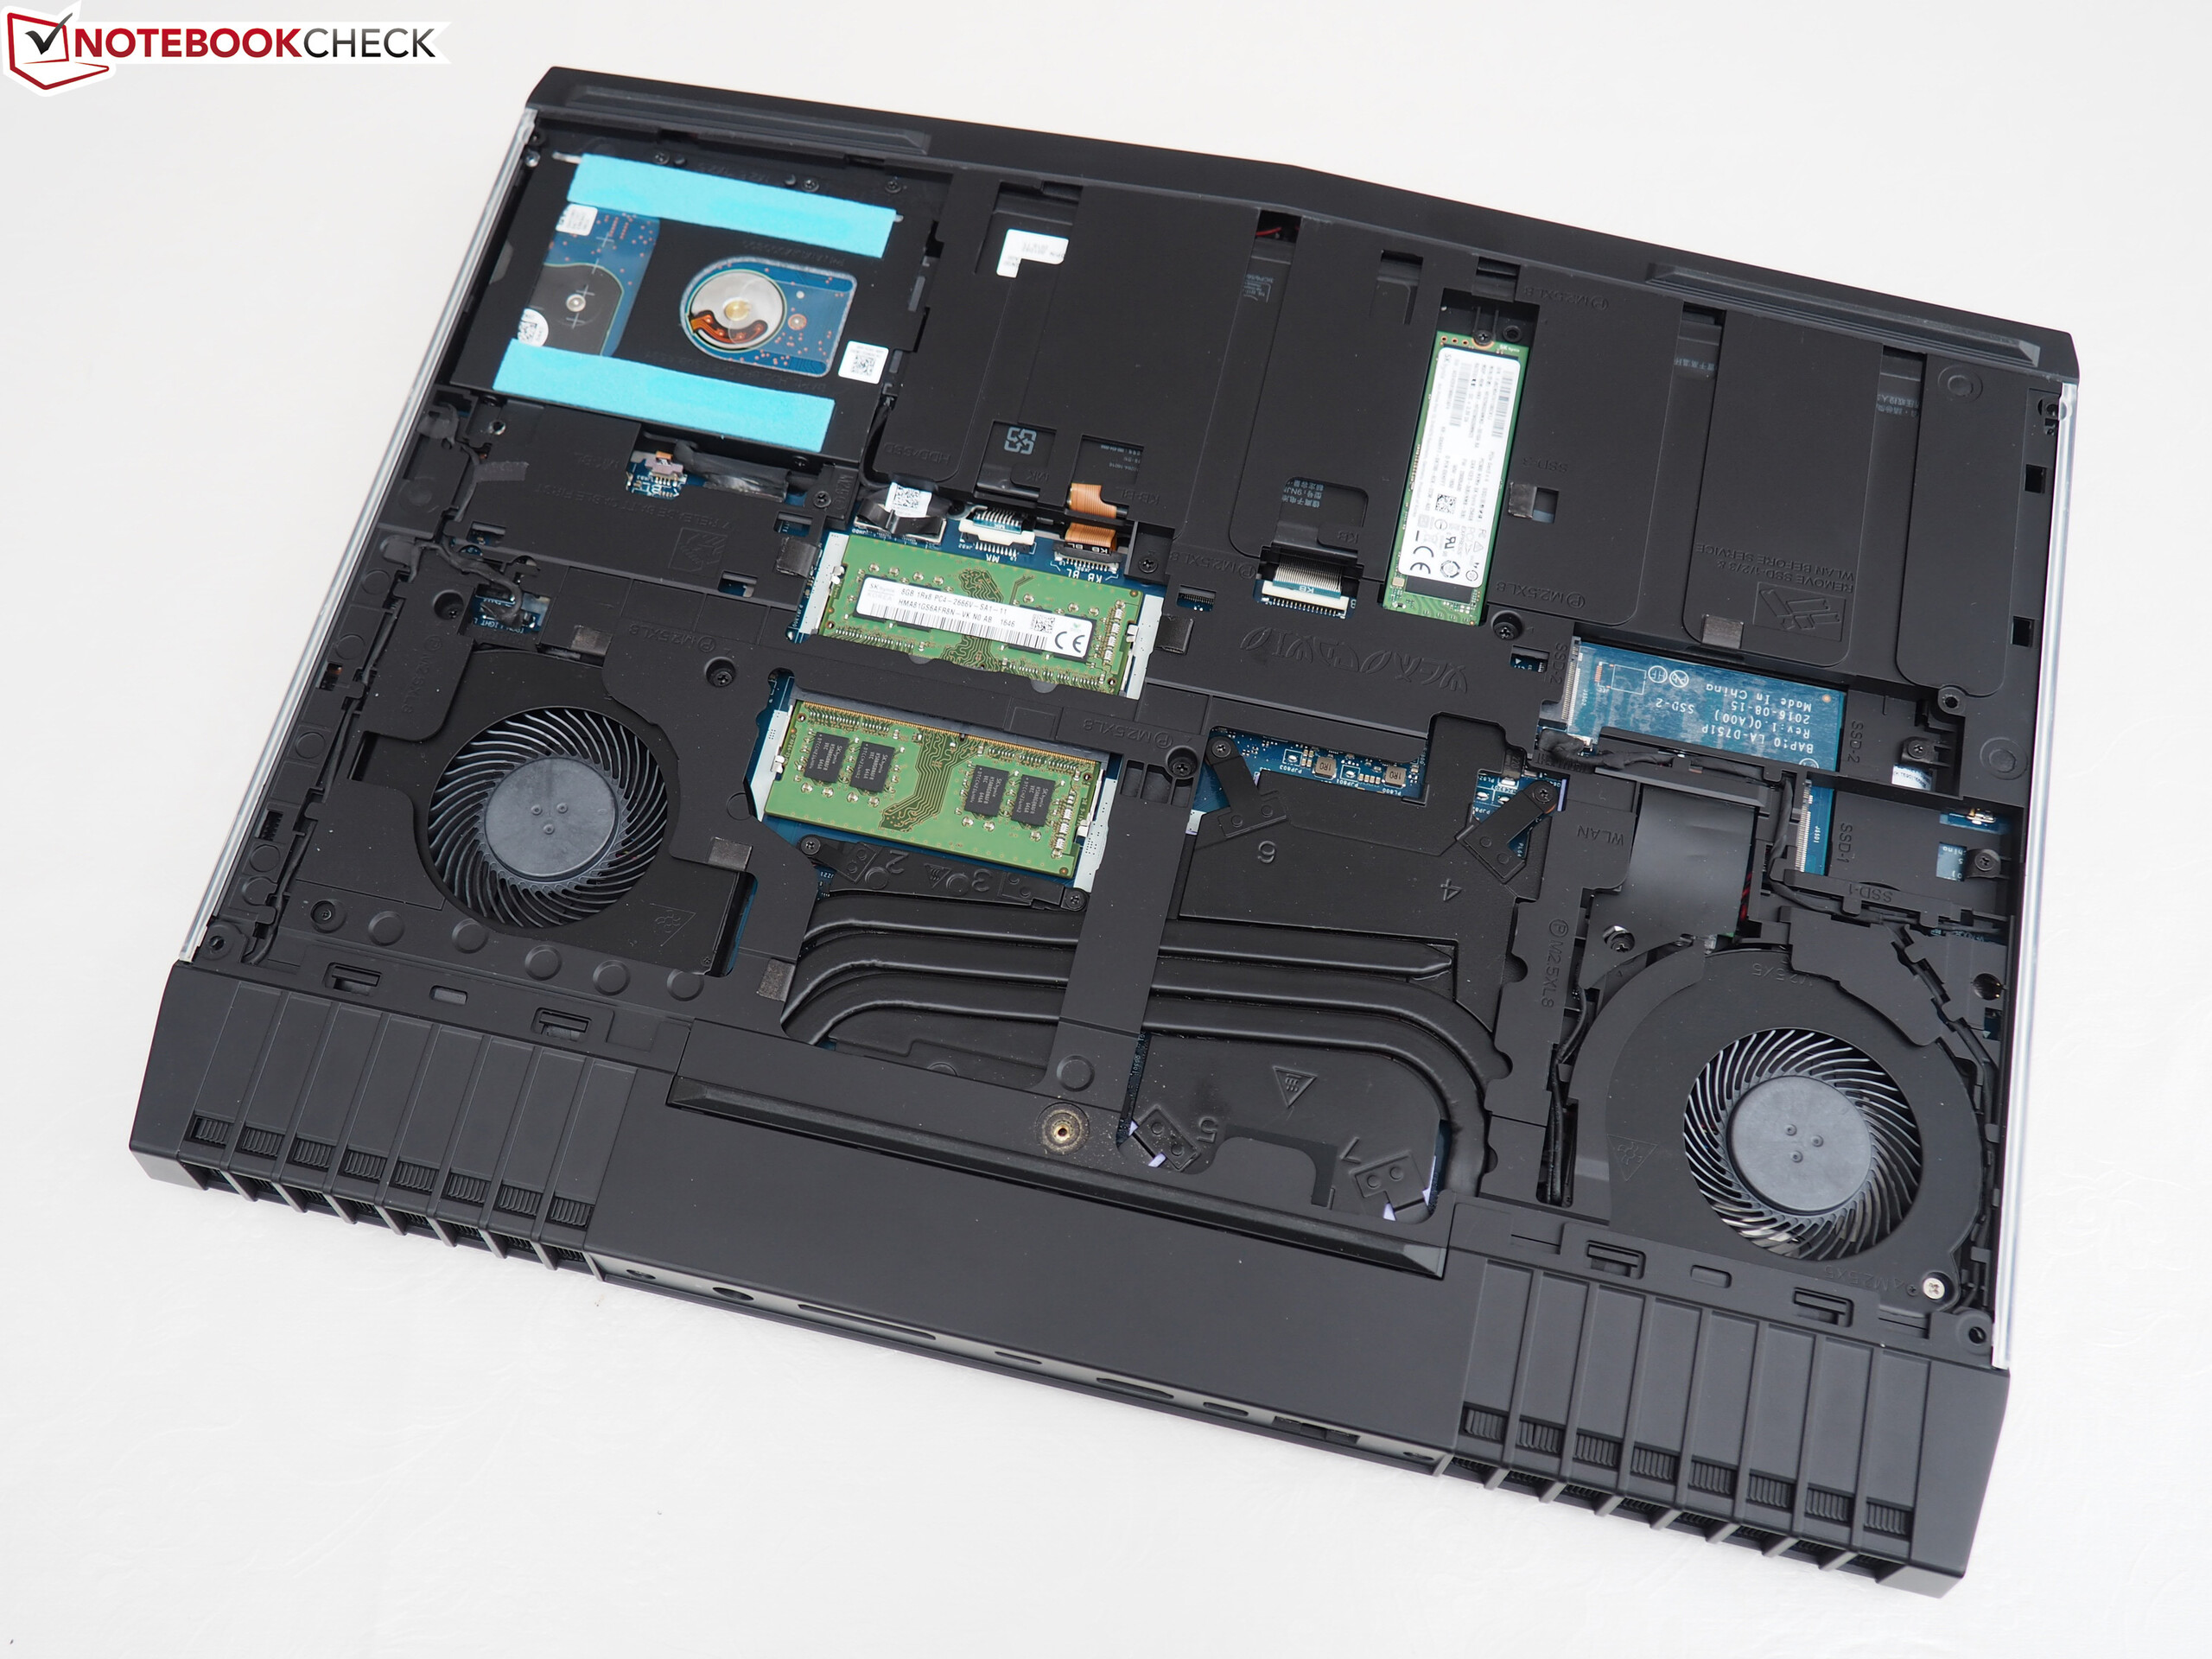
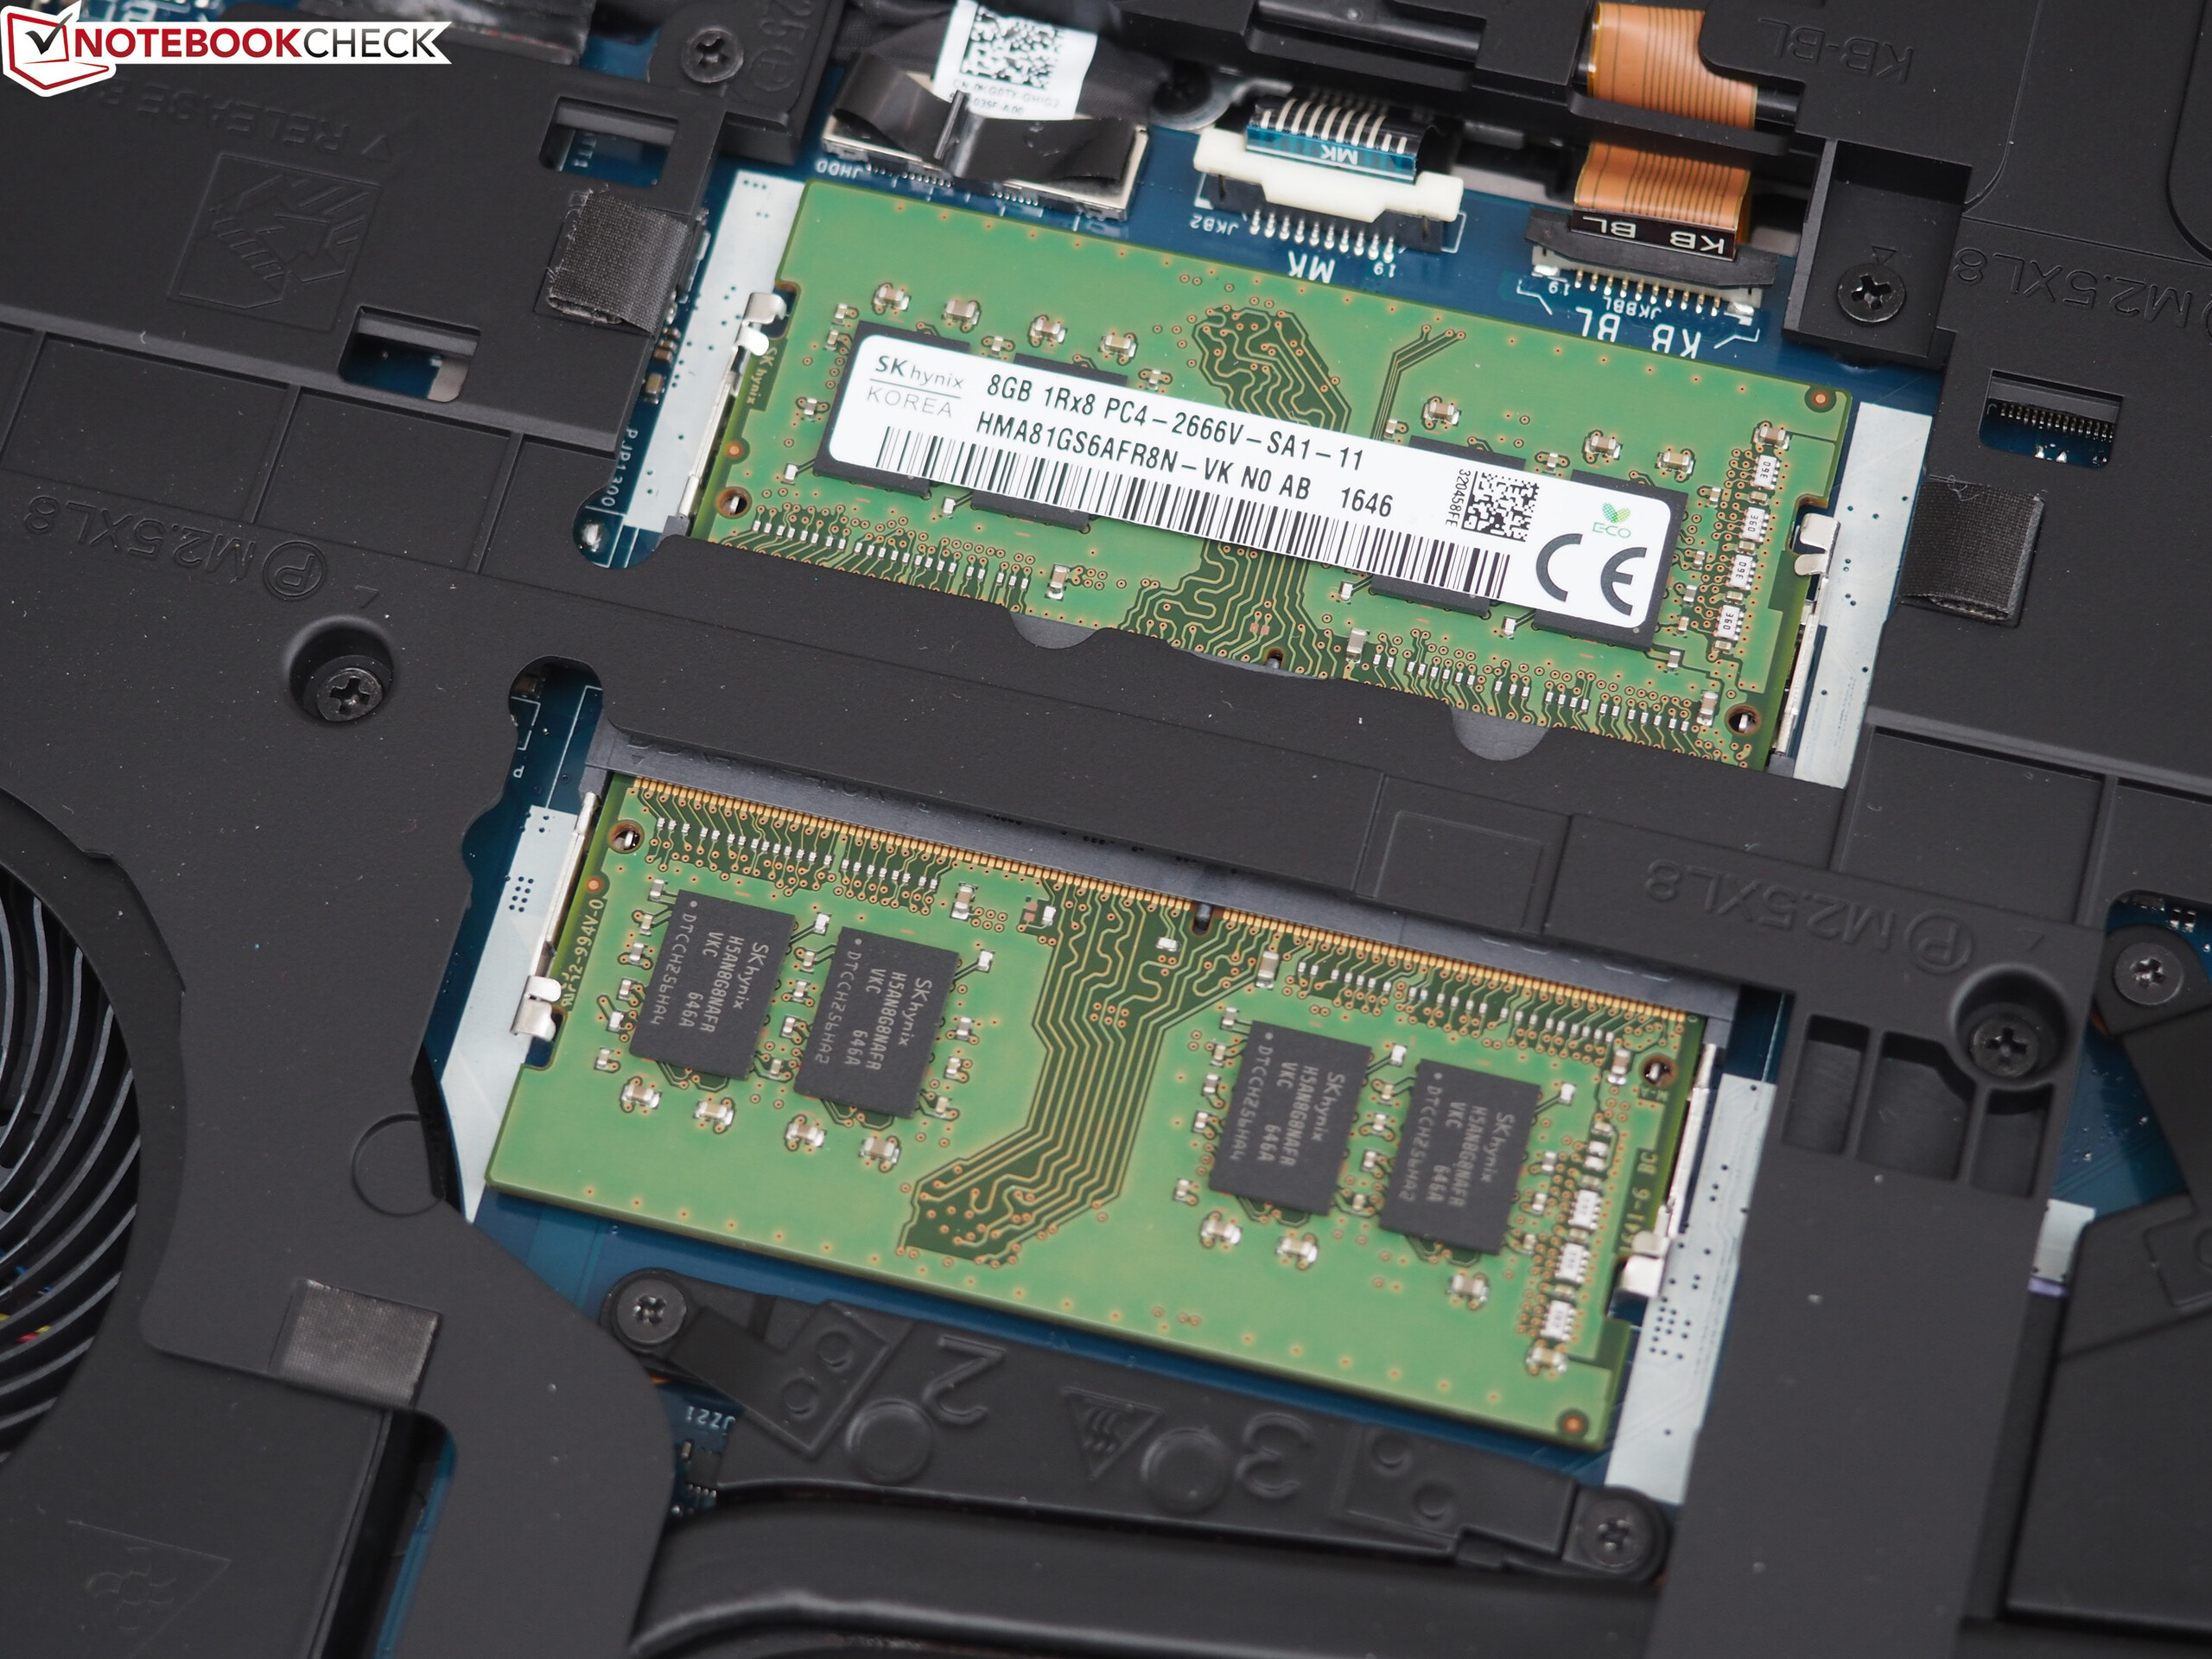
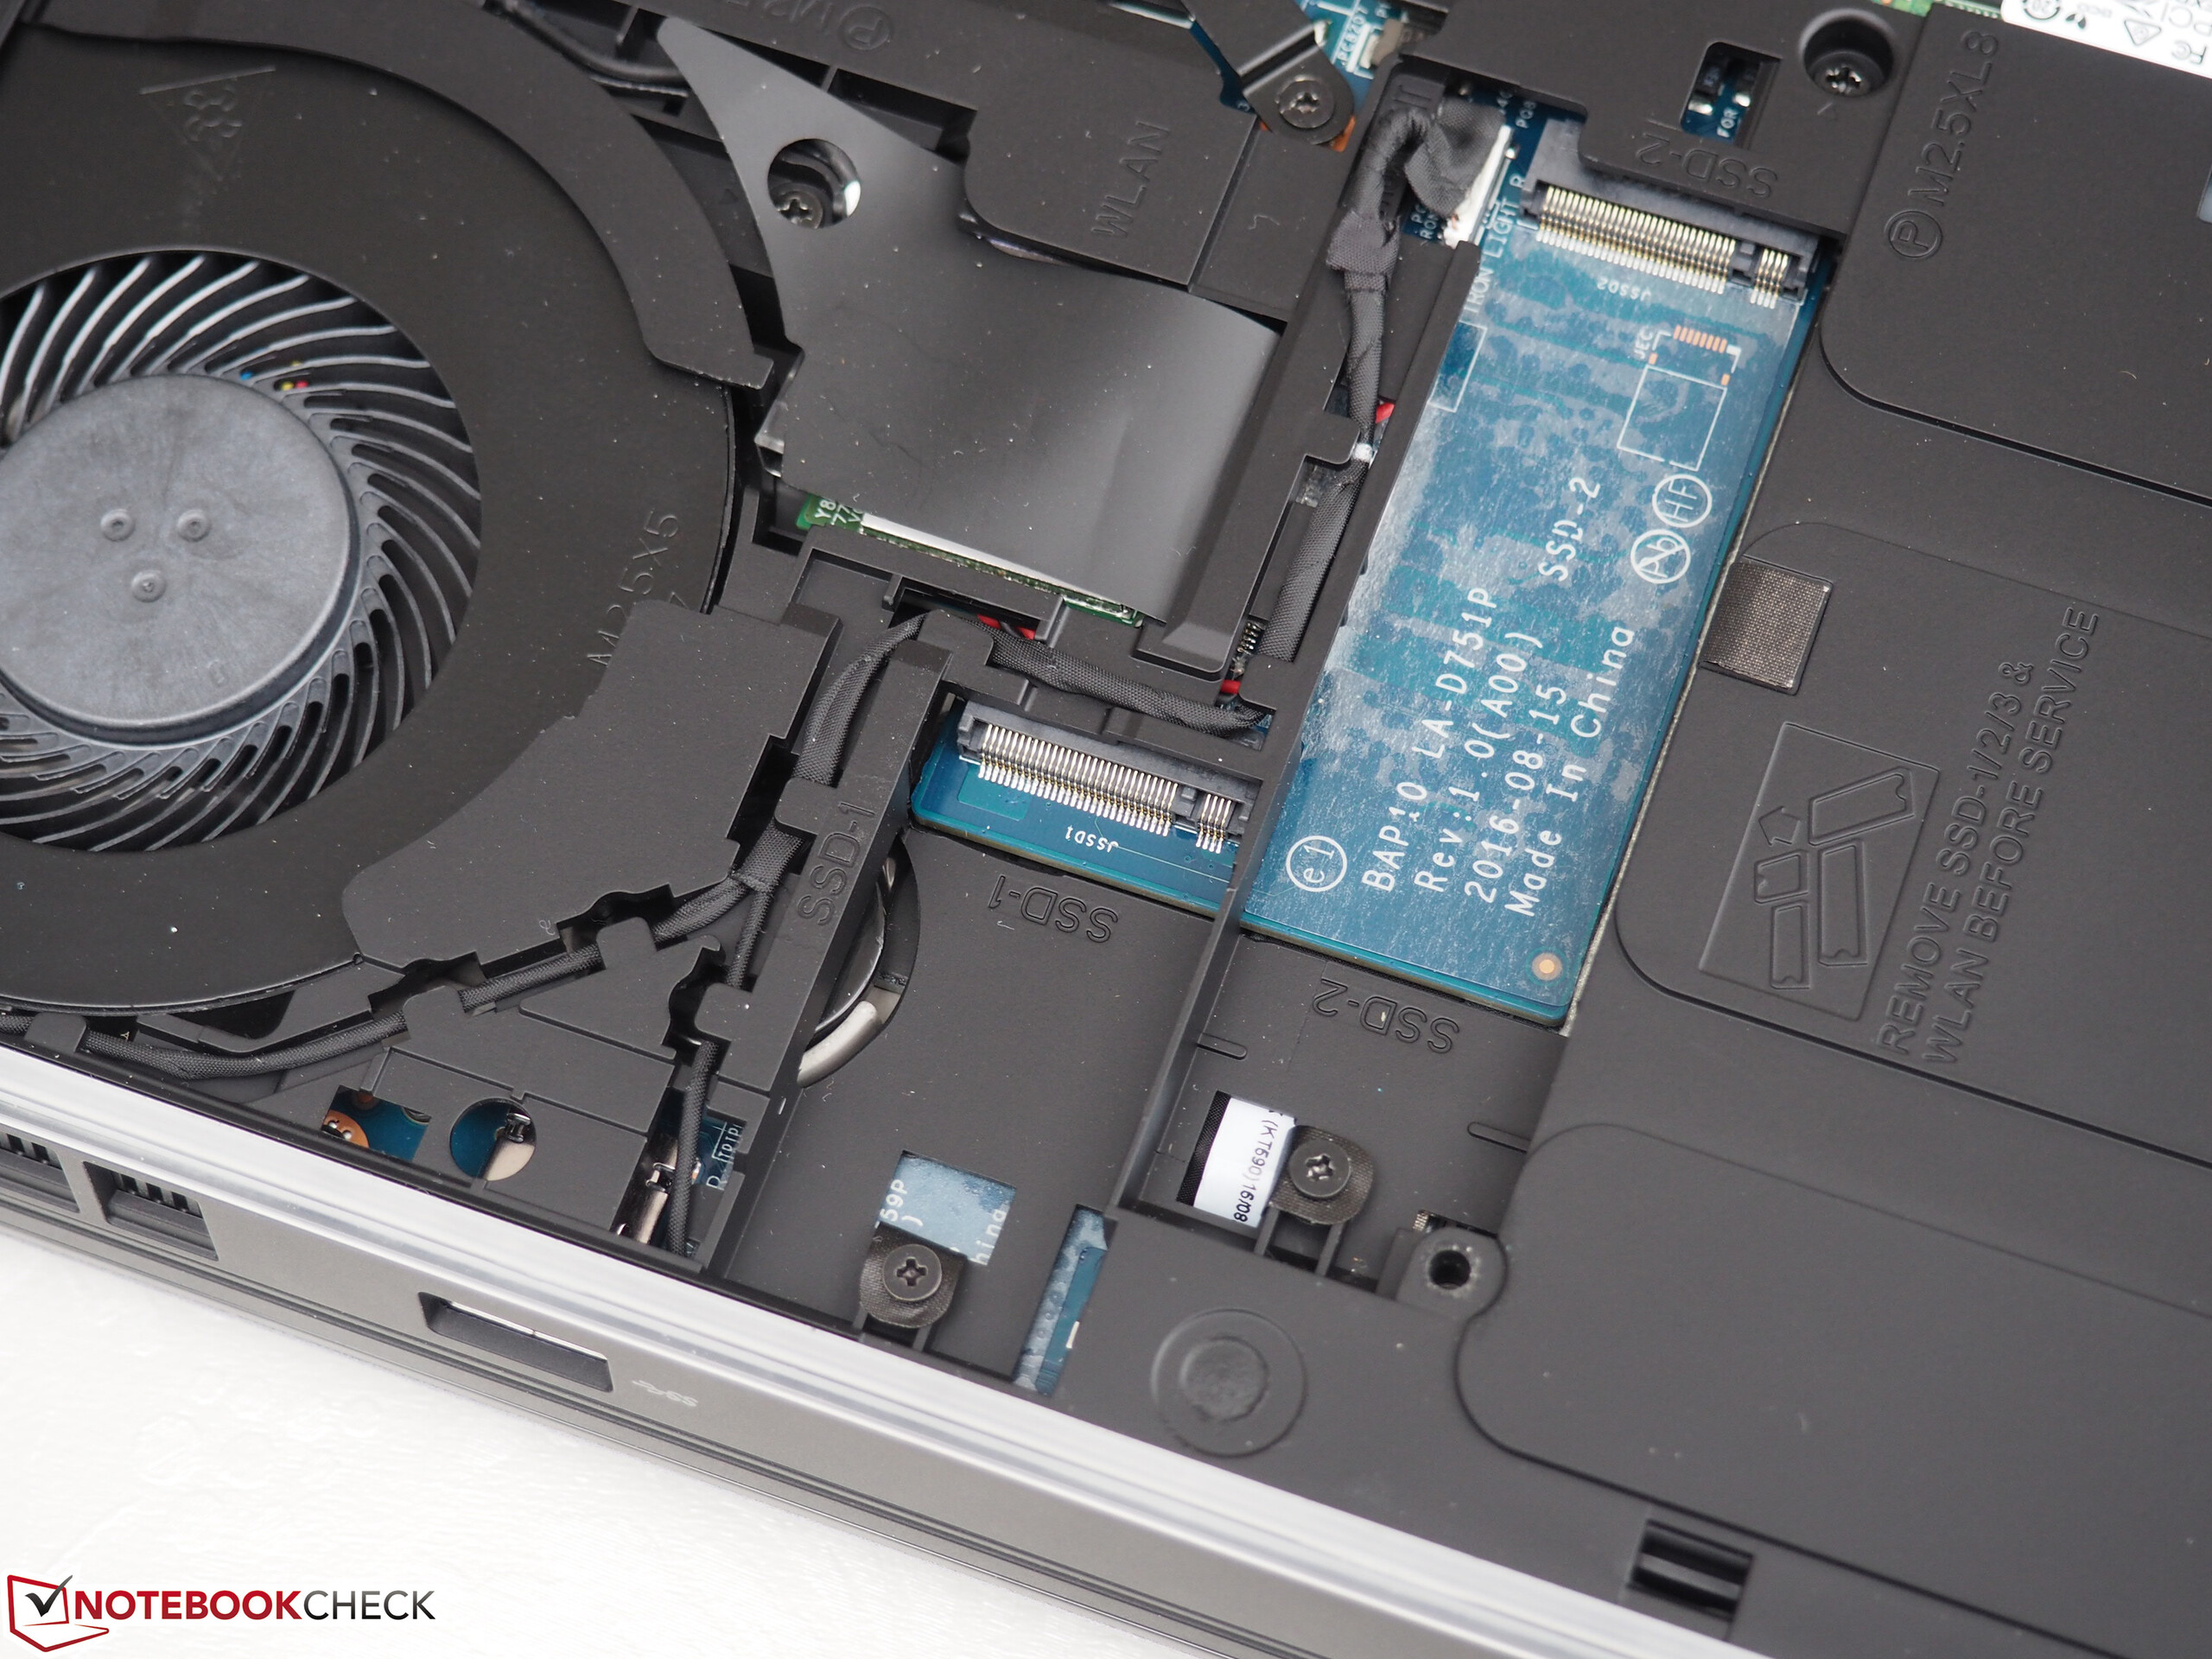
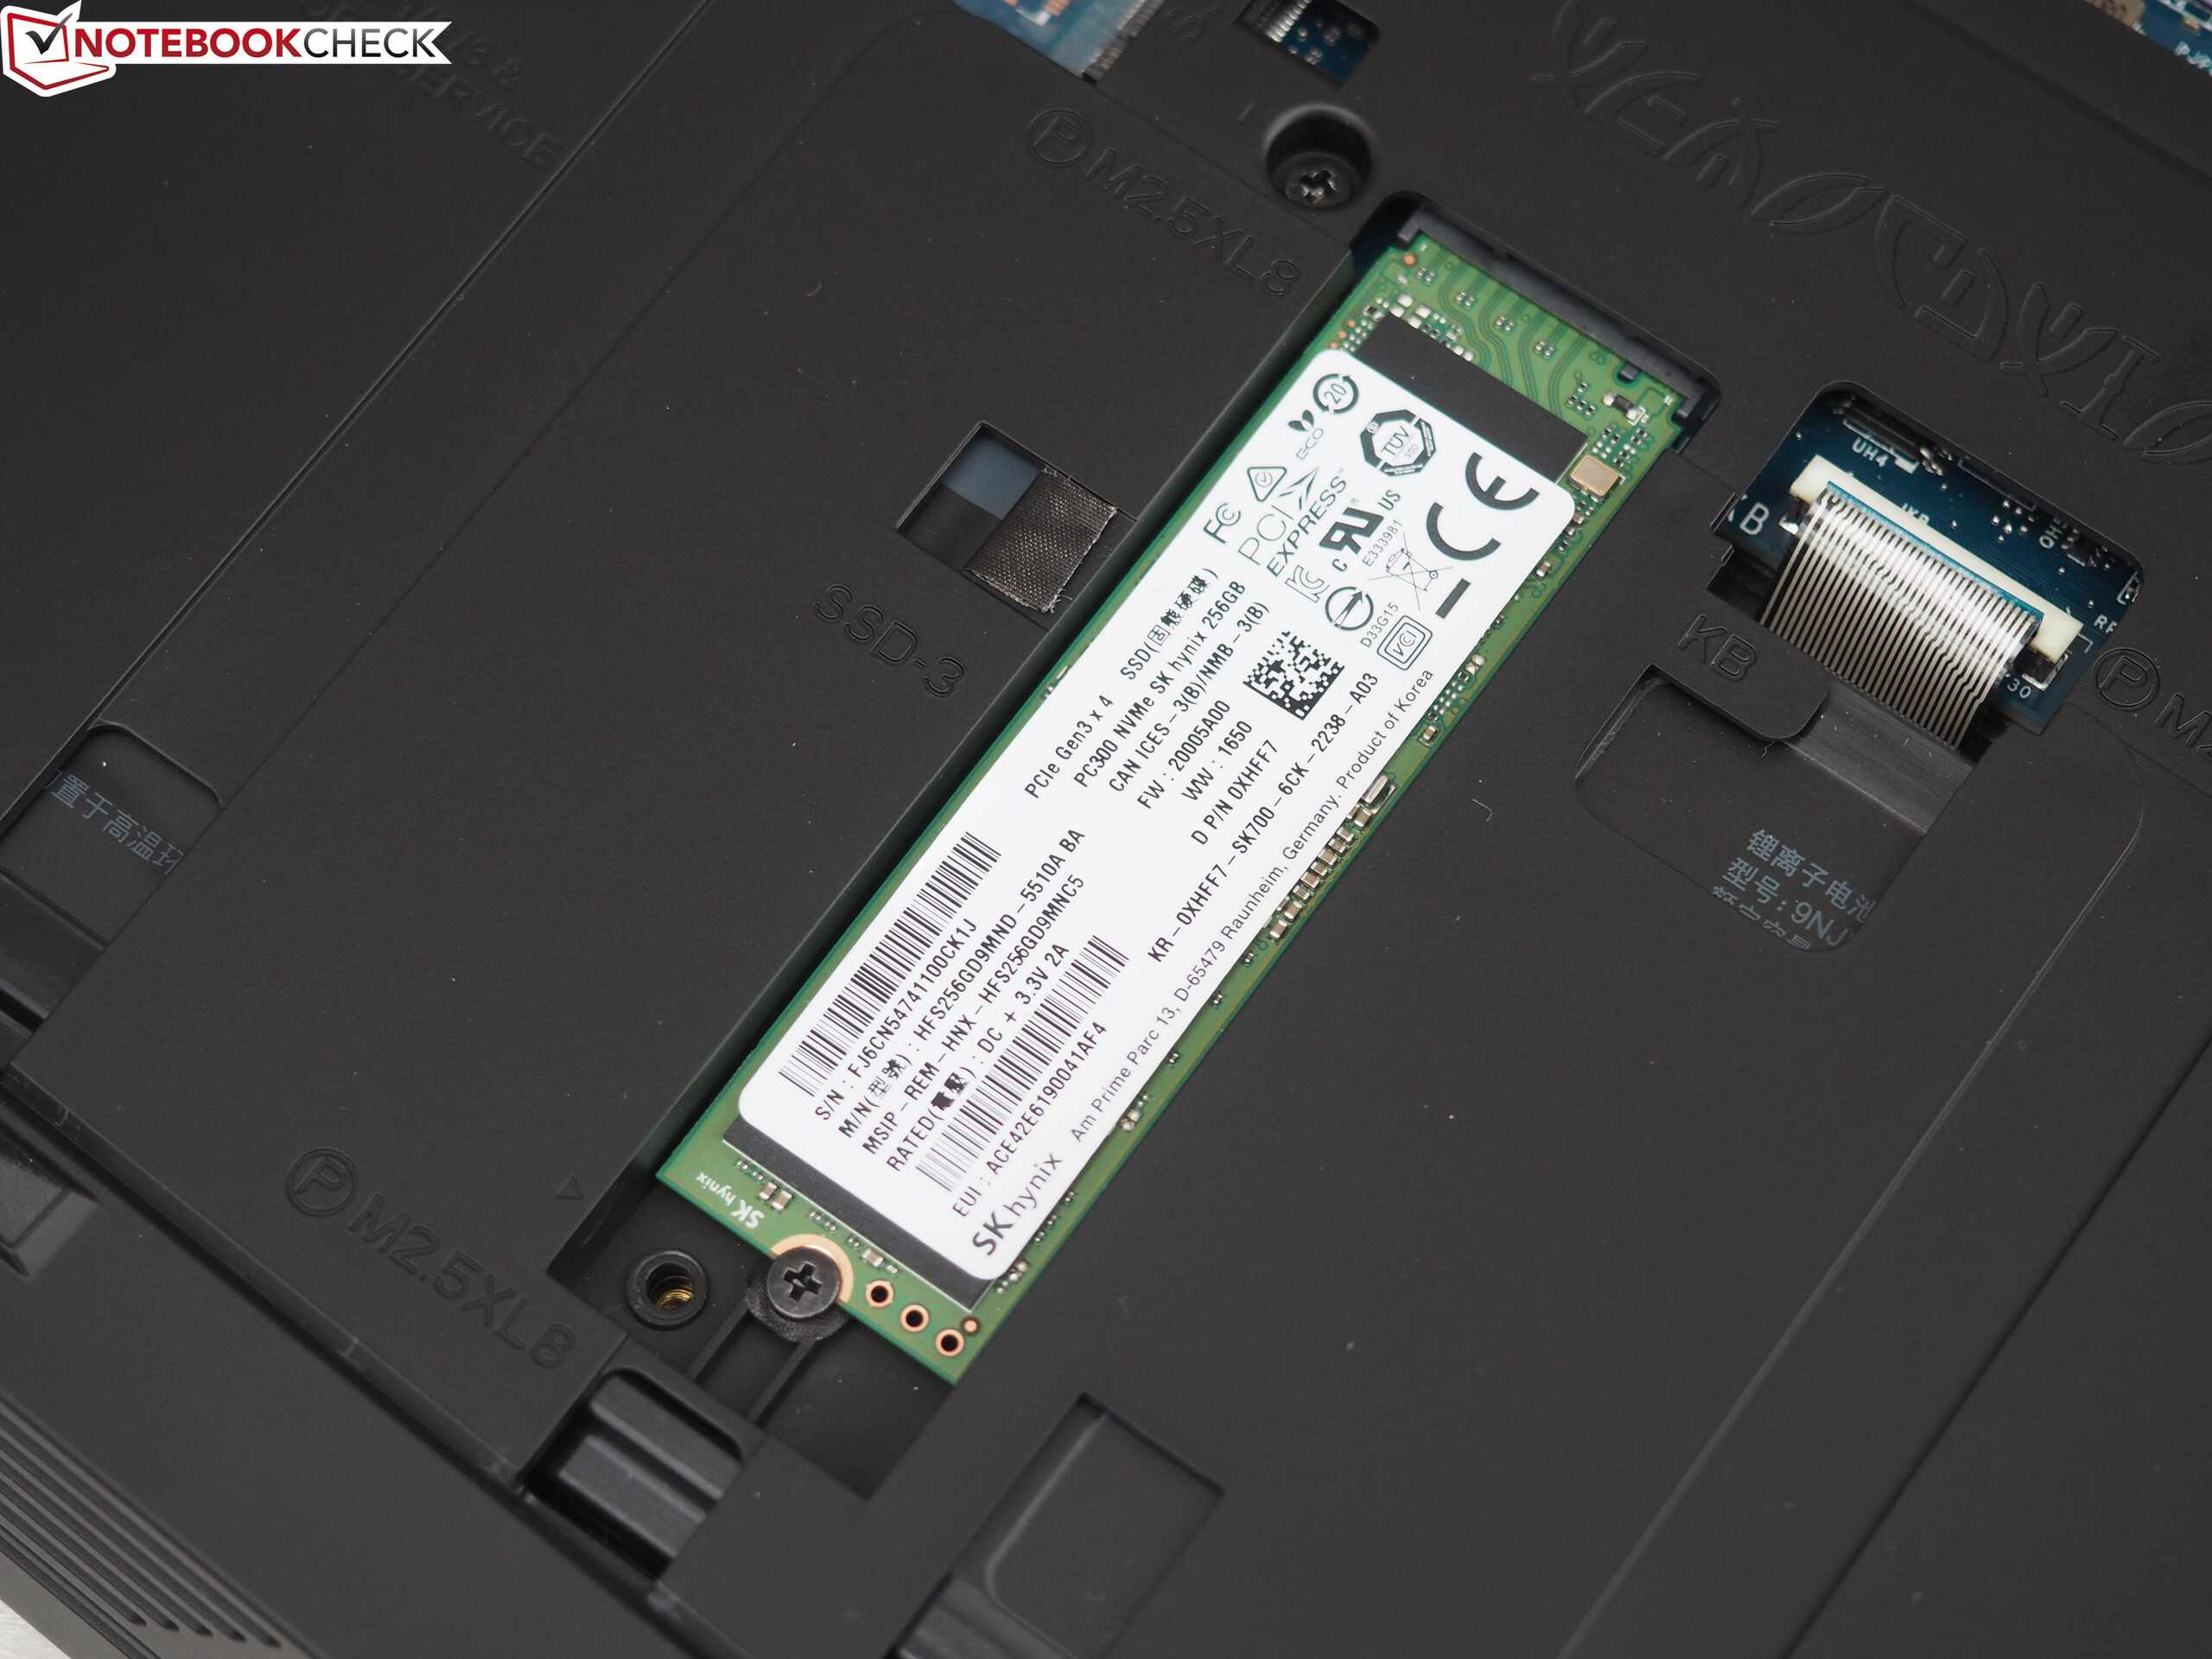
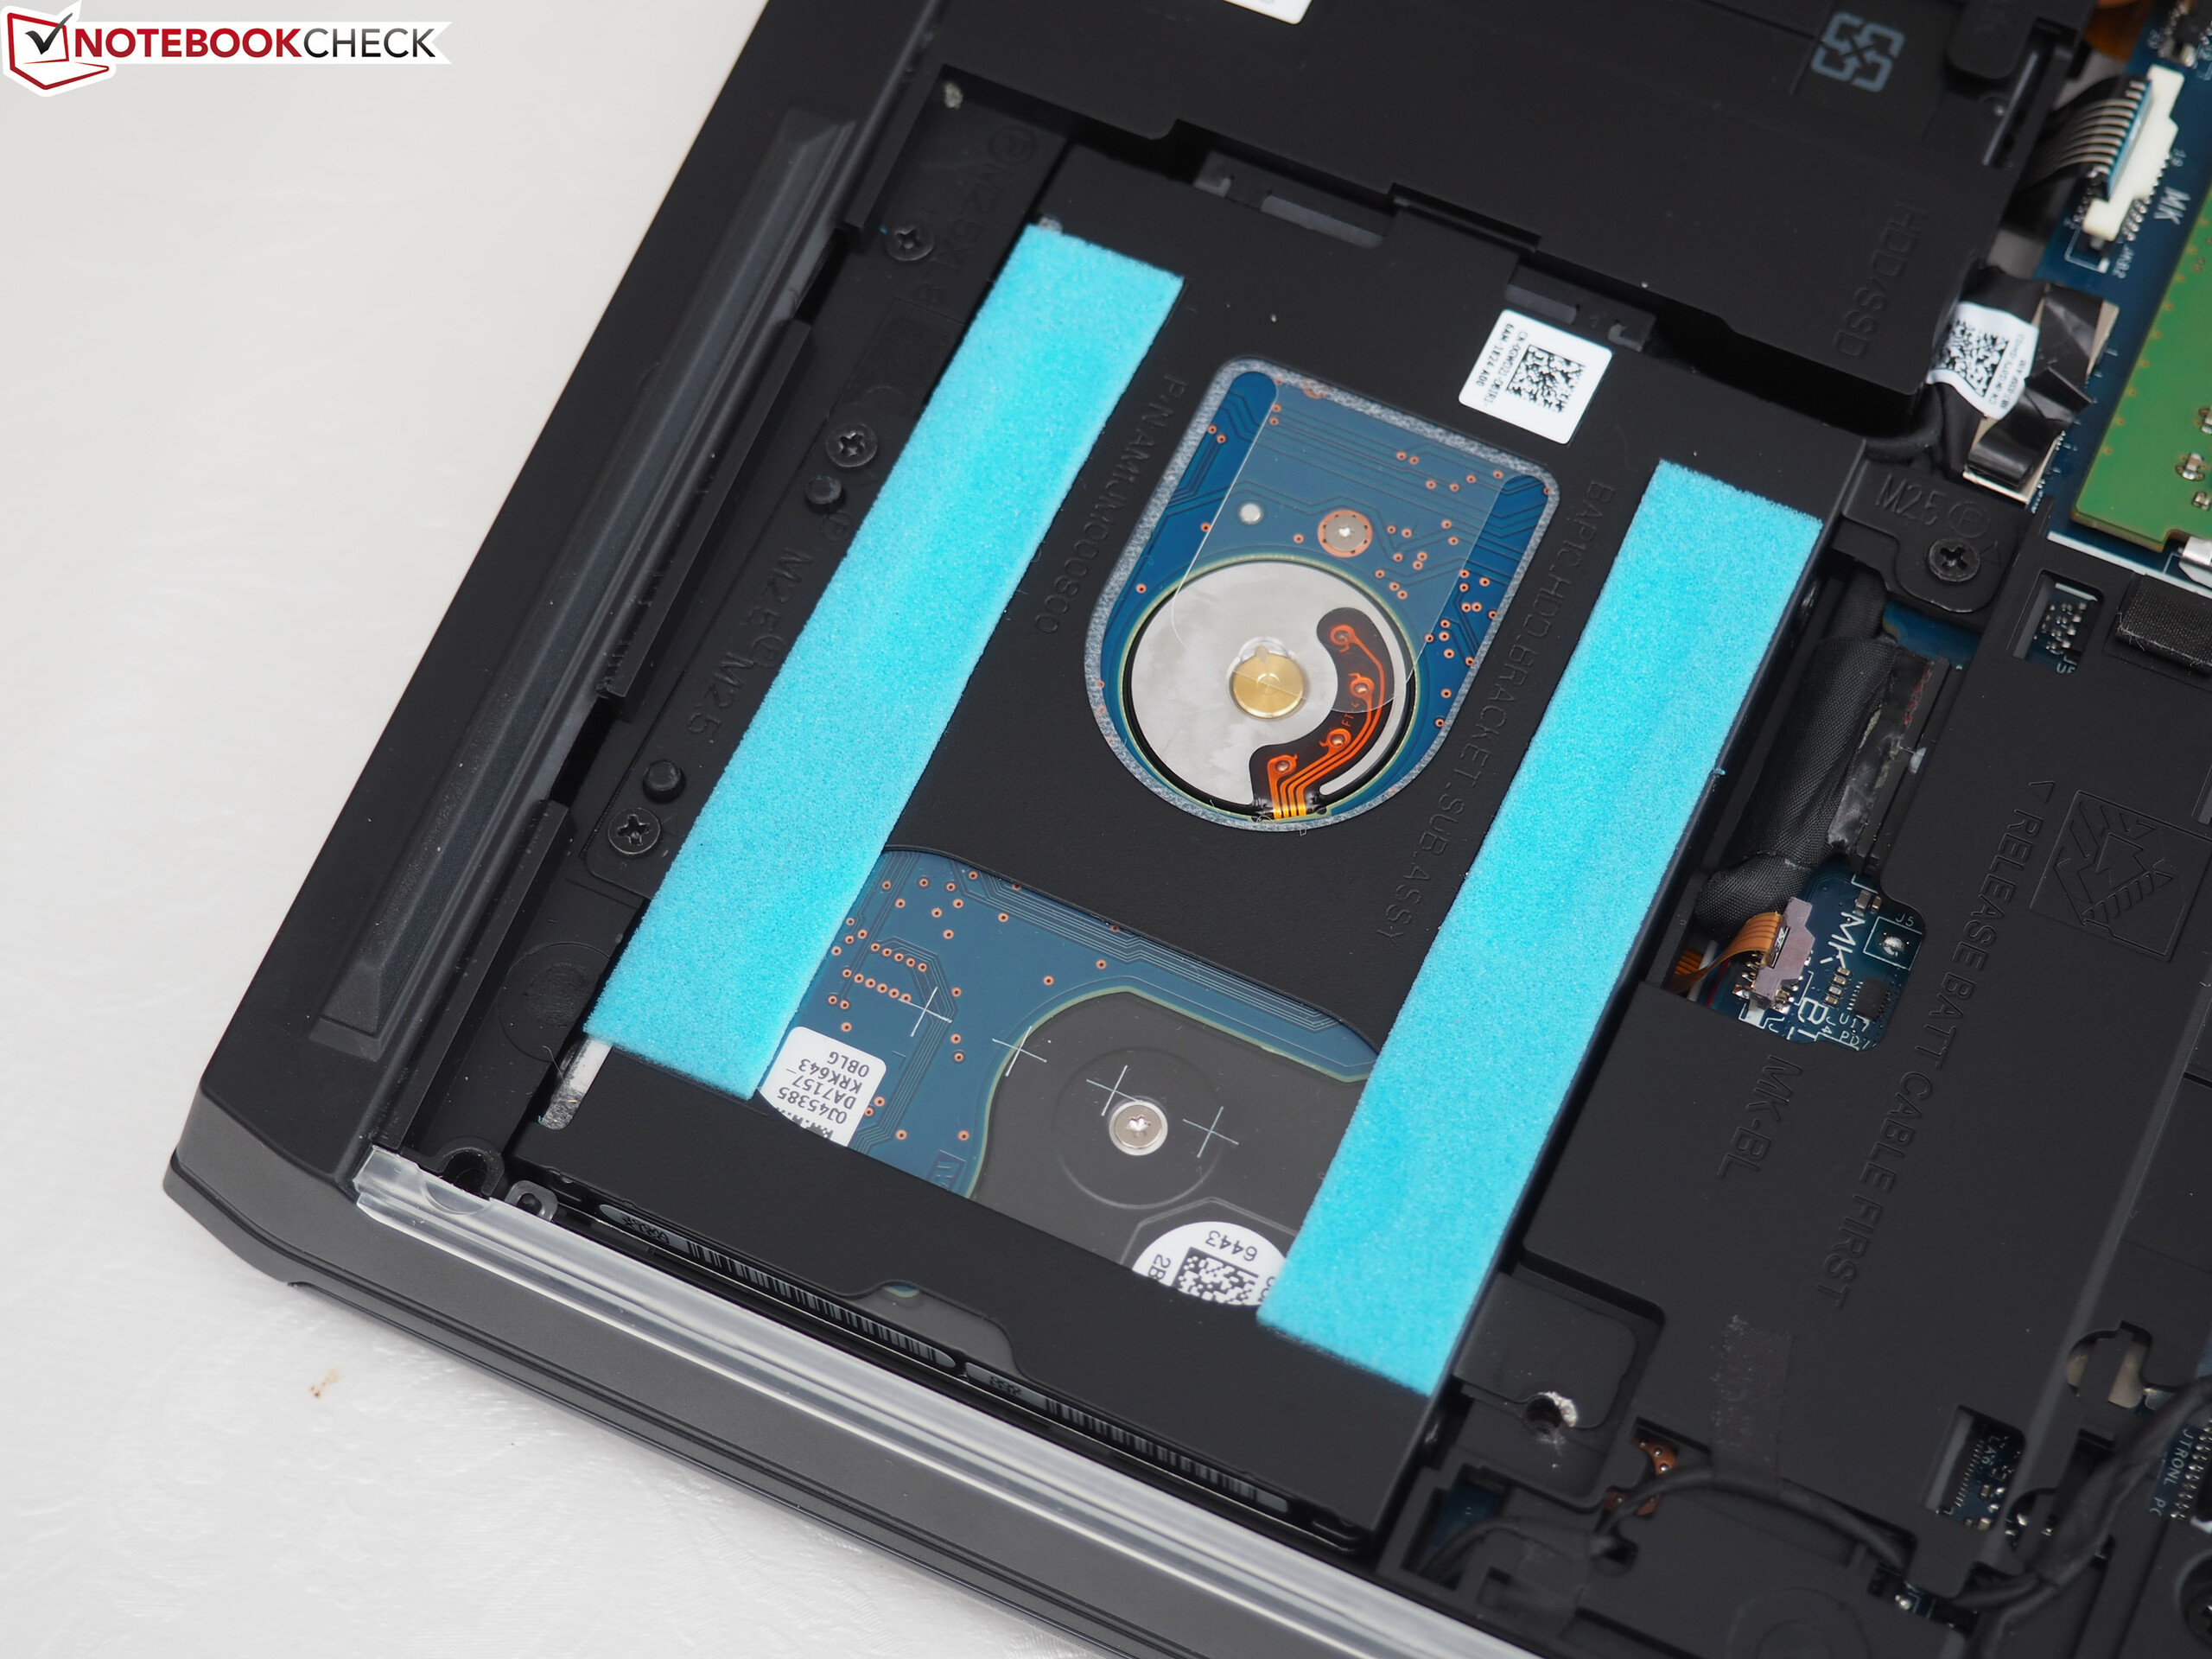
Dess NVMe SSD är snabb som vinden och möjliggör ett smidigt och snabbt system. Enheten är också utrustad med en 1 TB hårddisk. Båda lagringsenheterna kan bytas ut. Batteritiden är ordentlig för en enhet med prestanda på den här nivån.
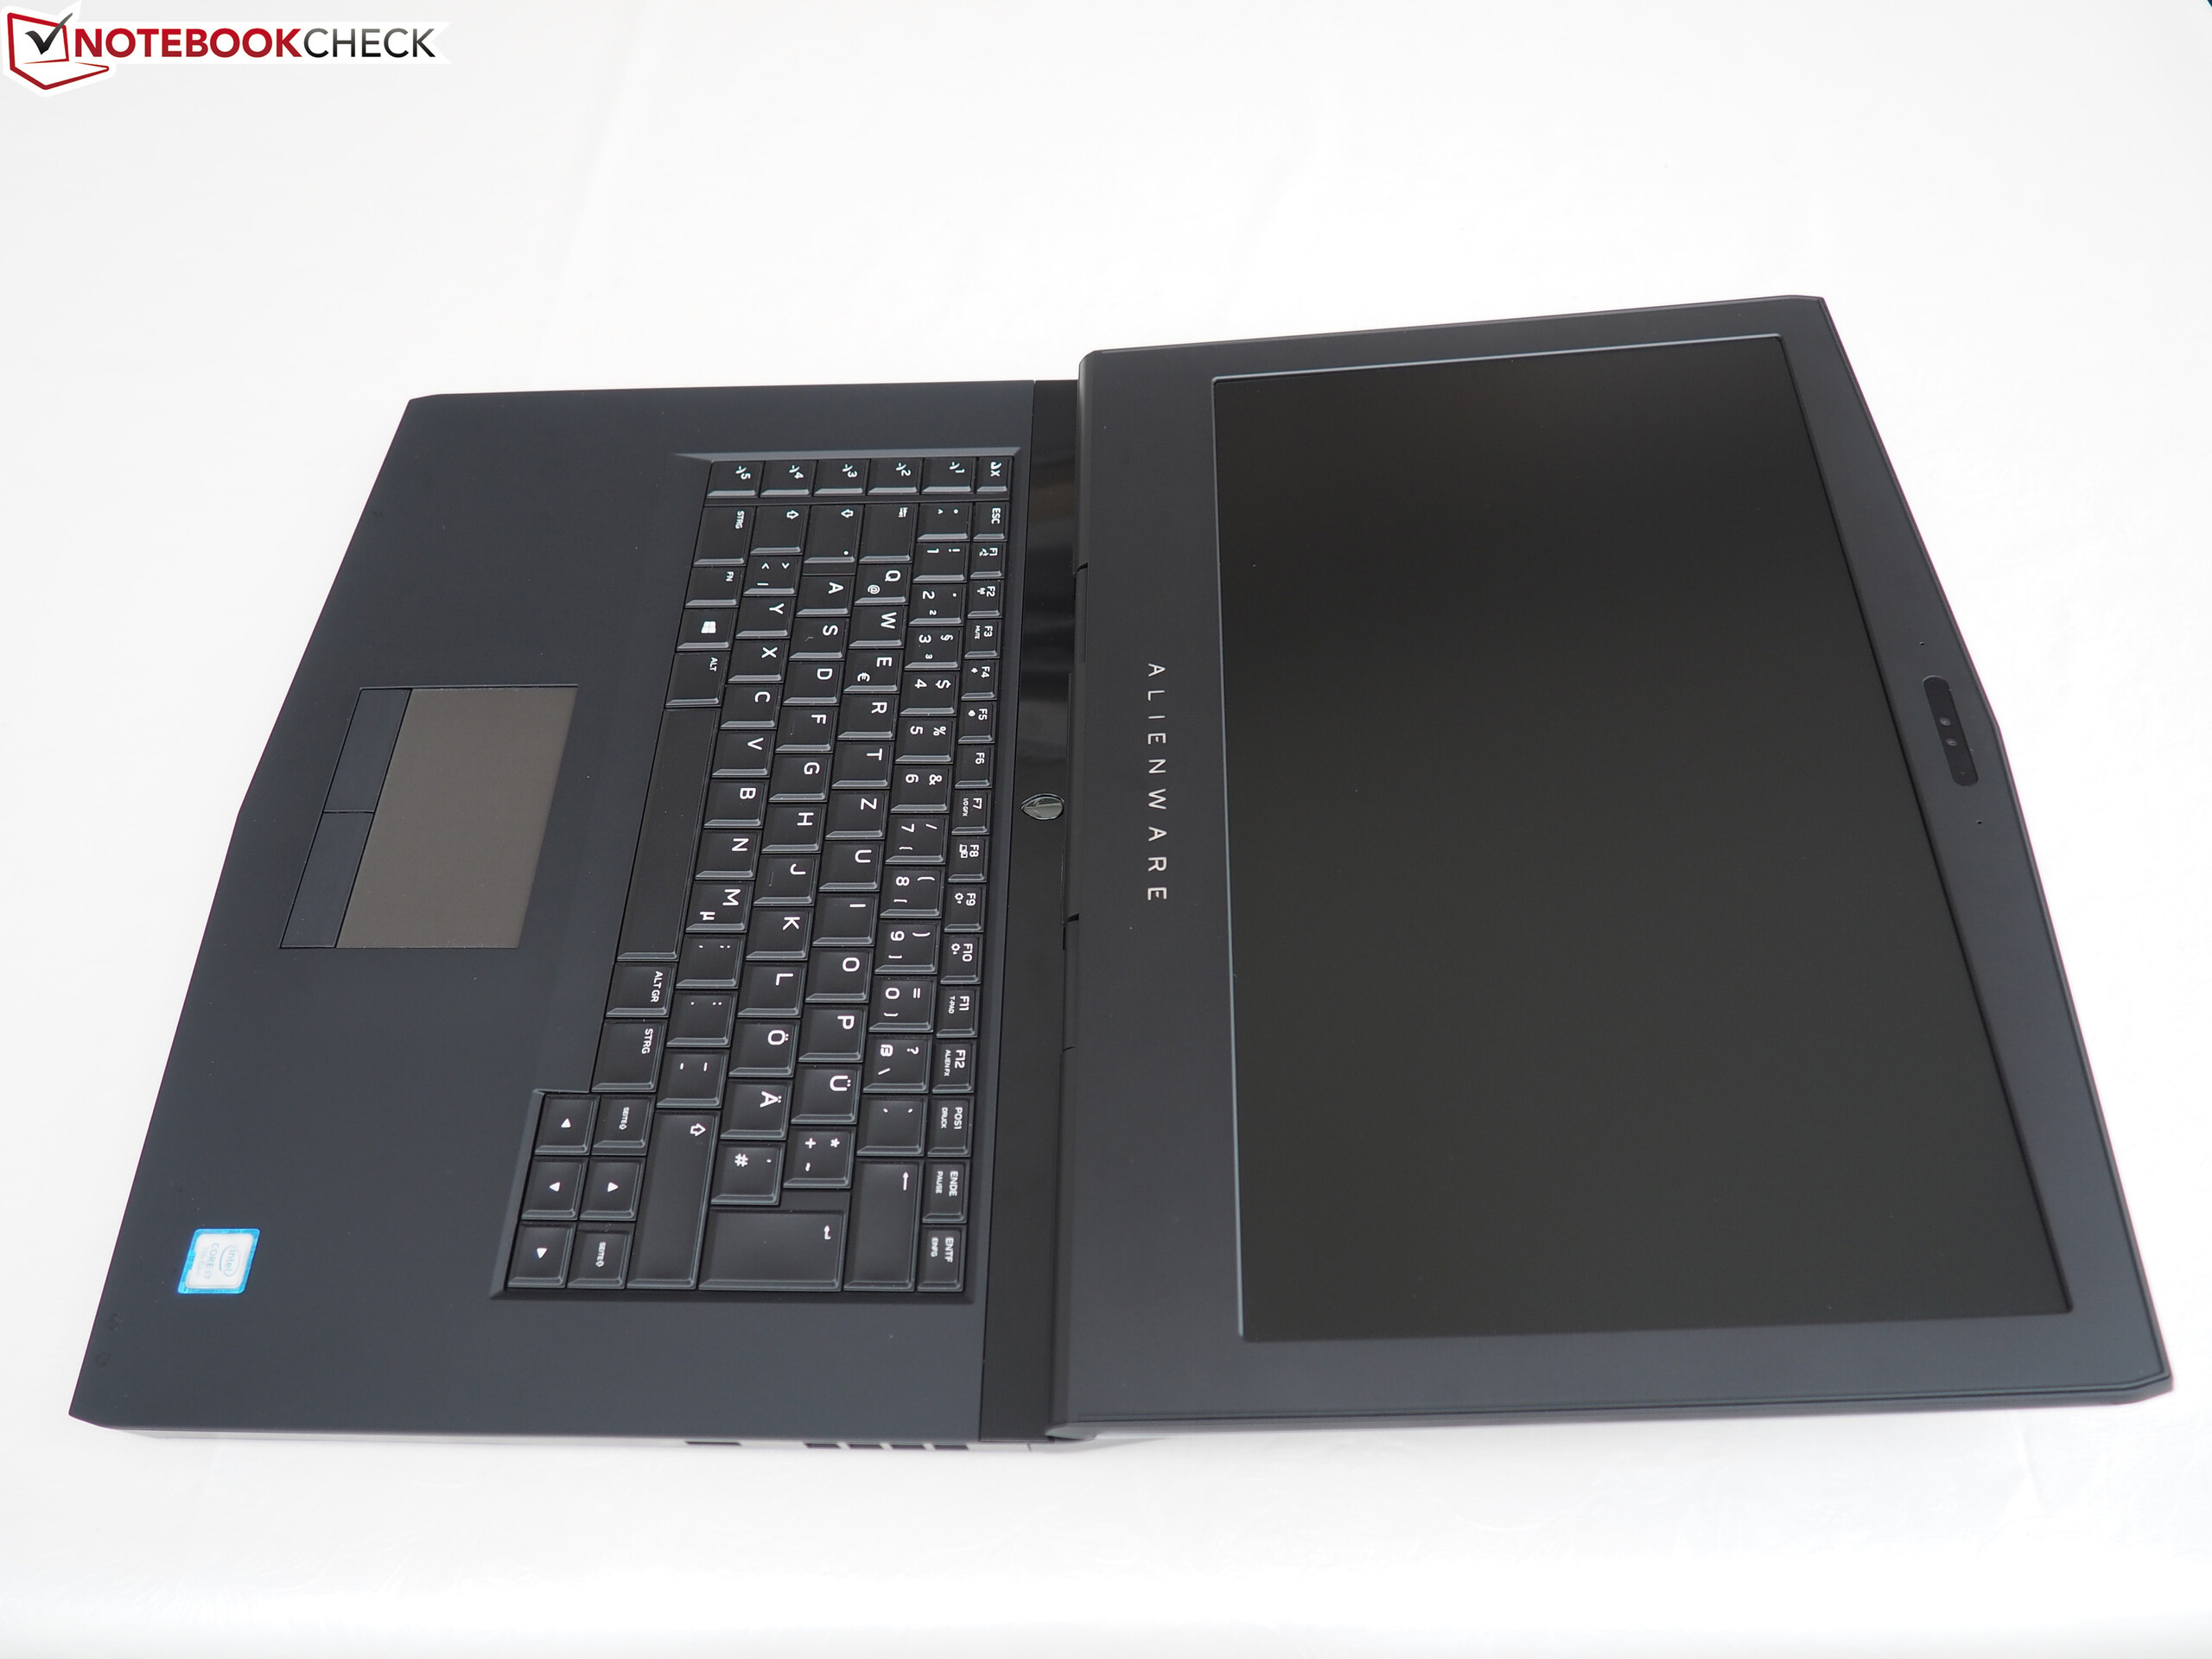
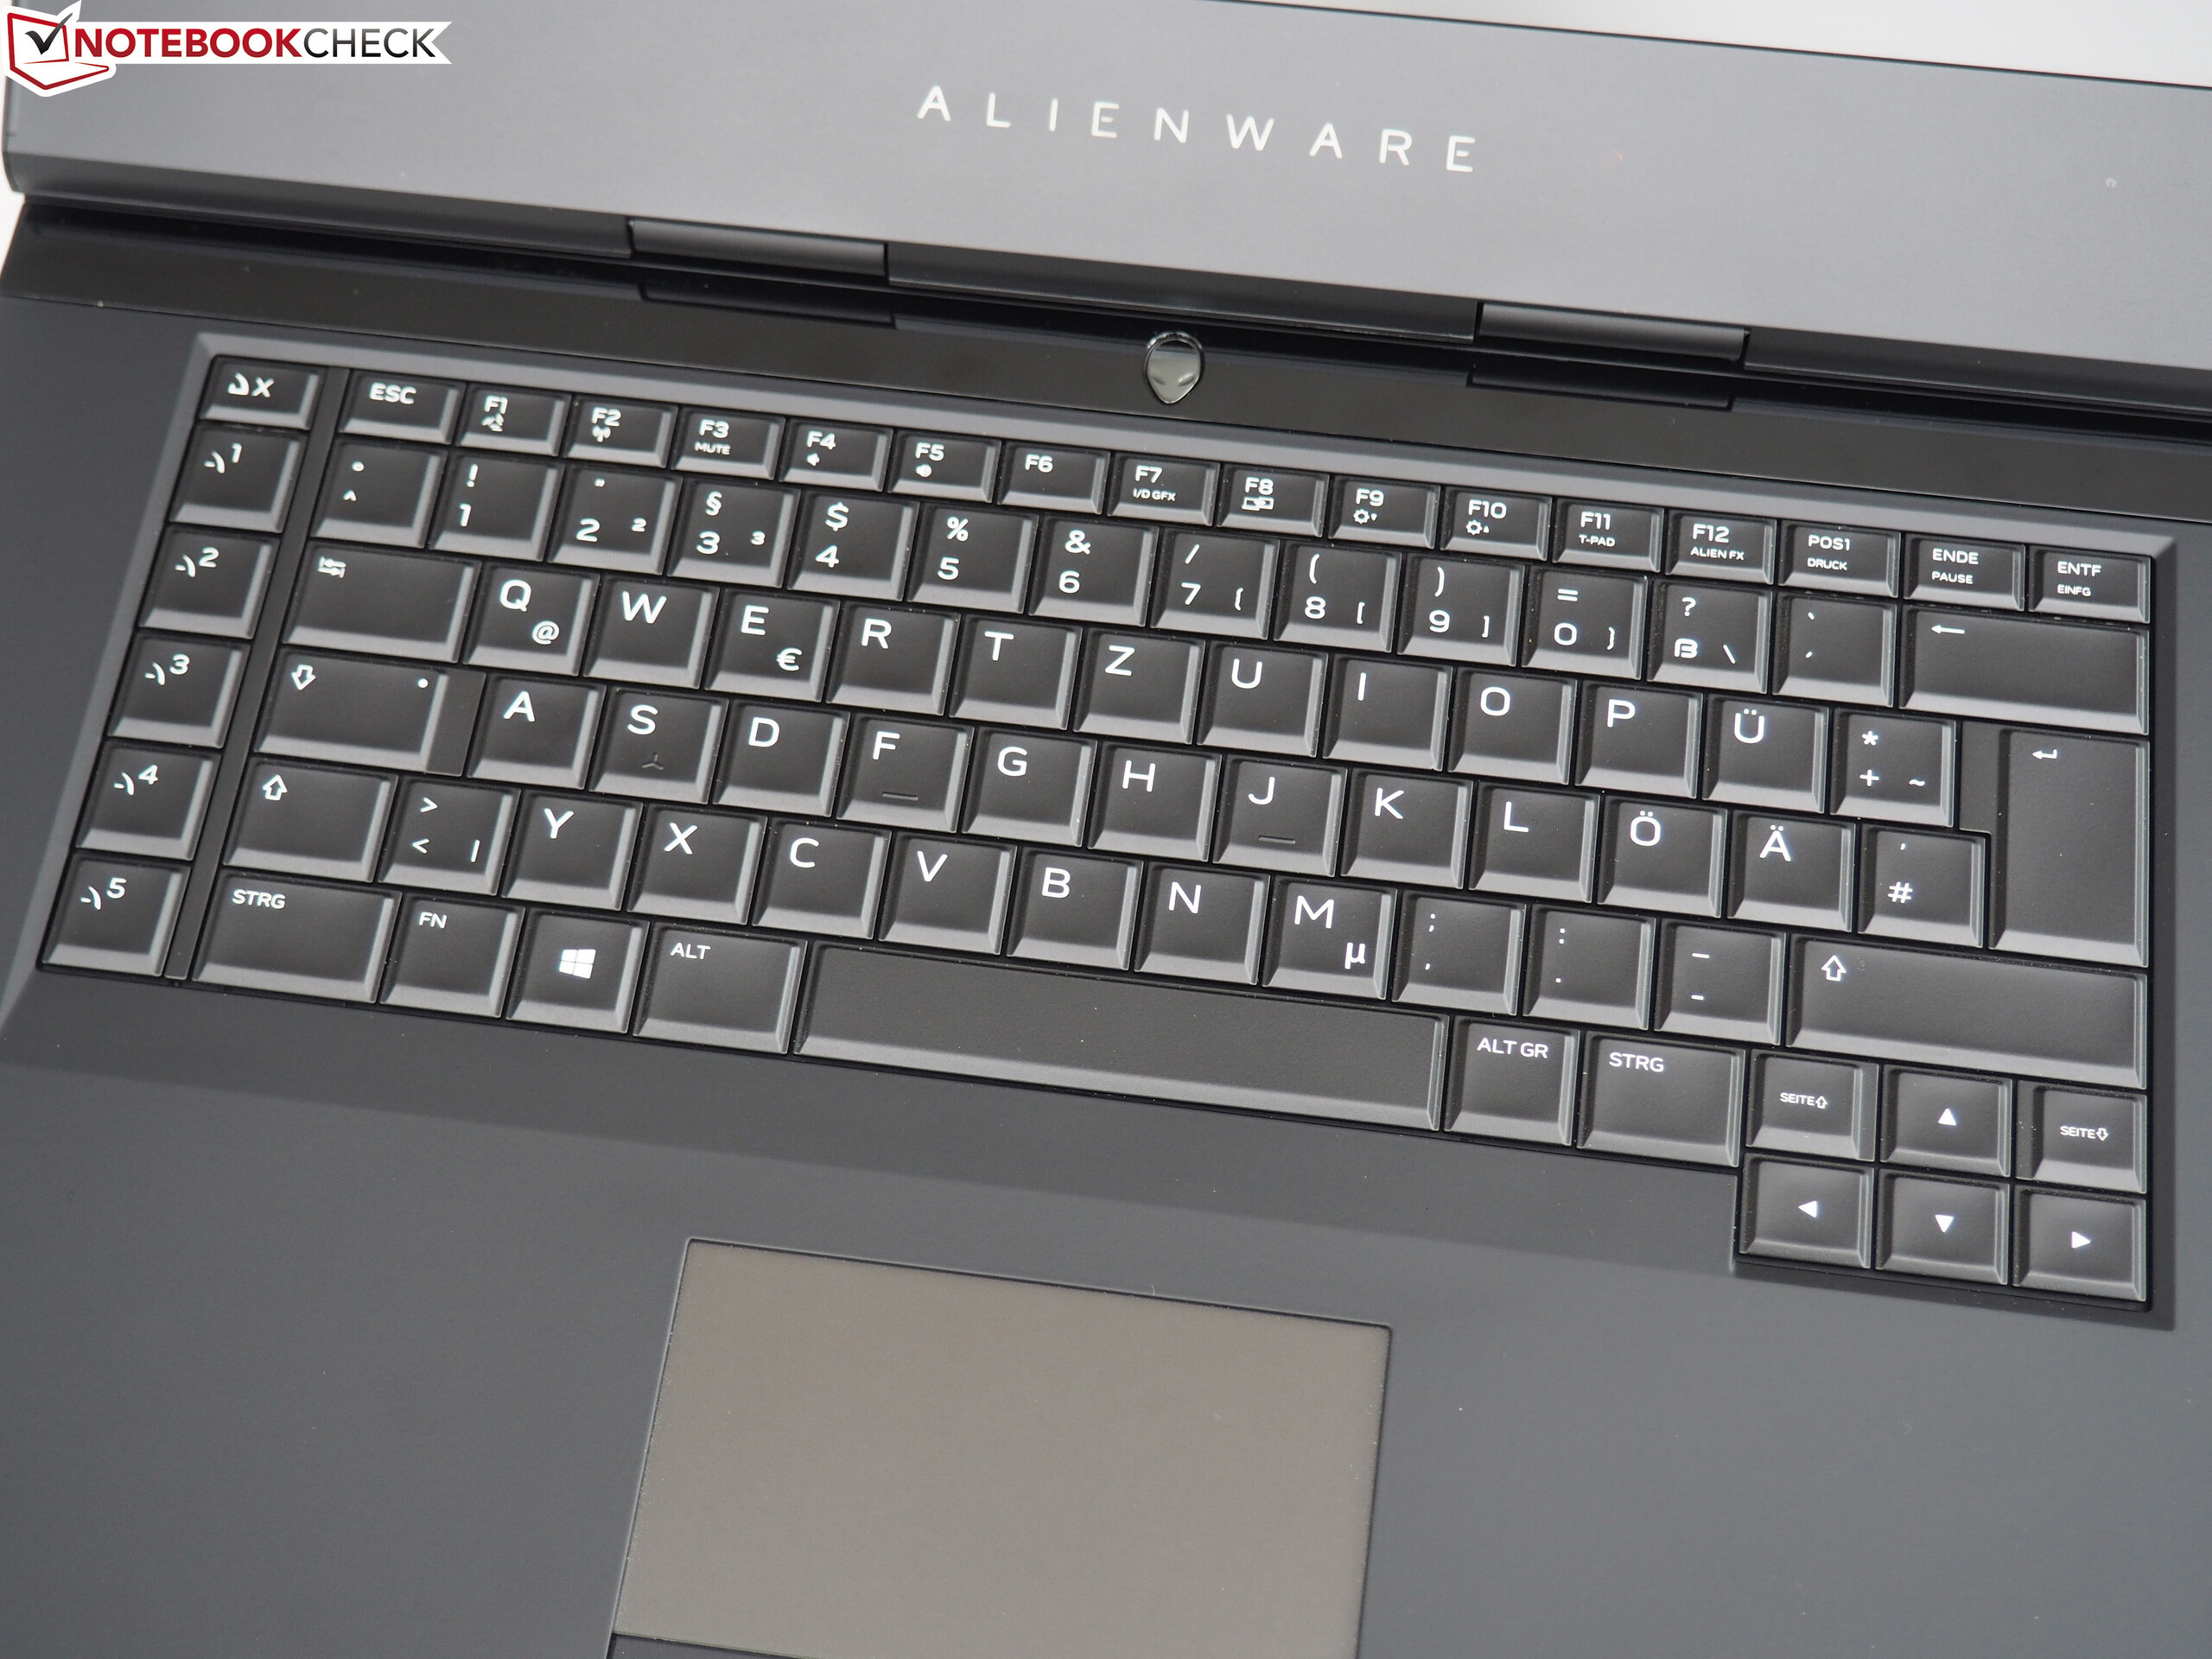
Skärmen erbjuder också betydande skillnader jämfört med den redan testade 15 R3-modellen. Även om syster-modellen är utrustad med en 120-Hz TN-skärm så erbjuder vår testmodell bara en 60-Hz IPS-skärm. Den matta skärmen på 15.6-tum har stabila betraktningsvinklar, bra kontrastratio och tillräcklig ljusstyrka. Det är bara responstiden som är högre på TN-skärmen.
Den redan testade Alienware 15 R3-modellen hade ett stort problem med temperatur och ljudnivå, vilket hörde ihop med att CPU:n blev varm ojämnt. Detta hände inte med vår nuvarande testenhet och kärnorna värms up jämnt.
Alienware 15 R3 Max-Q
- 10/27/2017 v6 (old)
Sascha Mölck