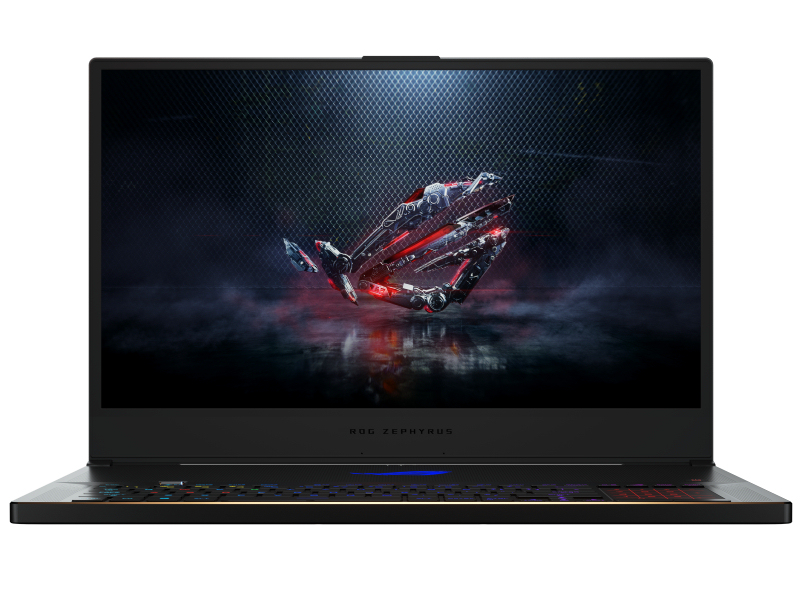
Test: Asus ROG Zephyrus S GX701GXR - Tunn spellaptop som får poäng för sin snabba 300 Hz-skärm (Sammanfattning)
Gradering | Datum | Modell | Vikt | Höjd | Storlek | Upplösning | Pris |
|---|---|---|---|---|---|---|---|
| 81.2 % v7 (old) | 12/2019 | Asus ROG Zephyrus S GX701GXR i7-9750H, GeForce RTX 2080 Max-Q | 2.7 kg | 18.7 mm | 17.30" | 1920x1080 | |
| 87.7 % v7 (old) | 06/2019 | Razer Blade Pro 17 RTX 2080 Max-Q i7-9750H, GeForce RTX 2080 Max-Q | 2.8 kg | 19.9 mm | 17.30" | 1920x1080 | |
| 86.1 % v7 (old) | 09/2019 | Gigabyte Aero 17 XA RP77 i9-9980HK, GeForce RTX 2070 Max-Q | 2.5 kg | 21.4 mm | 17.30" | 3840x2160 | |
| 87.4 % v6 (old) | 04/2019 | Alienware m17 P37E i9-8950HK, GeForce RTX 2080 Max-Q | 2.6 kg | 23 mm | 17.30" | 3840x2160 | |
| 85.6 % v6 (old) | 03/2019 | Lenovo Legion Y740-17ICH i7-8750H, GeForce RTX 2080 Max-Q | 2.8 kg | 23 mm | 17.30" | 1920x1080 |

| Networking | |
| iperf3 transmit AX12 | |
| Asus ROG Zephyrus S GX701GXR | |
| iperf3 receive AX12 | |
| Asus ROG Zephyrus S GX701GXR | |
| |||||||||||||||||||||||||
Distribution av ljusstyrkan: 93 %
Mitt på batteriet: 288 cd/m²
Kontrast: 1200:1 (Svärta: 0.24 cd/m²)
ΔE ColorChecker Calman: 1.92 | ∀{0.5-29.43 Ø4.71}
calibrated: 1.14
ΔE Greyscale Calman: 3.08 | ∀{0.09-98 Ø4.96}
96% sRGB (Argyll 1.6.3 3D)
65% AdobeRGB 1998 (Argyll 1.6.3 3D)
72.3% AdobeRGB 1998 (Argyll 3D)
96.6% sRGB (Argyll 3D)
70% Display P3 (Argyll 3D)
Gamma: 2.42
CCT: 7055 K
| Asus ROG Zephyrus S GX701GXR AU Optronics B173HAN05.1, IPS, 1920x1080 | Asus Zephyrus S GX701GX B173HAN04.0 (AUO409D), IPS, 1920x1080 | Razer Blade Pro 17 RTX 2080 Max-Q AU Optronics B173HAN04.0, IPS, 1920x1080 | Gigabyte Aero 17 XA RP77 AU Optronics B173ZAN03.2, IPS, 3840x2160 | Alienware m17 P37E AU Optronics B173ZAN01.0, IPS, 3840x2160 | Lenovo Legion Y740-17ICH AU Optronics B173HAN03.2, IPS, 1920x1080 | |
|---|---|---|---|---|---|---|
| Display | -10% | -12% | 22% | 21% | -8% | |
| Display P3 Coverage (%) | 70 | 62.9 -10% | 60.6 -13% | 86.8 24% | 86.4 23% | 64 -9% |
| sRGB Coverage (%) | 96.6 | 87.8 -9% | 89 -8% | 100 4% | 99.9 3% | 90.4 -6% |
| AdobeRGB 1998 Coverage (%) | 72.3 | 63.9 -12% | 62.1 -14% | 99.5 38% | 99.1 37% | 64.8 -10% |
| Response Times | -28% | -24% | -507% | -402% | -124% | |
| Response Time Grey 50% / Grey 80% * (ms) | 5.6 ? | 7.2 ? -29% | 6.8 ? -21% | 45.6 ? -714% | 35.6 ? -536% | 15.6 ? -179% |
| Response Time Black / White * (ms) | 7.6 ? | 9.6 ? -26% | 9.6 ? -26% | 30.4 ? -300% | 28 ? -268% | 12.8 ? -68% |
| PWM Frequency (Hz) | ||||||
| Screen | -7% | -23% | -6% | -77% | -59% | |
| Brightness middle (cd/m²) | 288 | 288 0% | 299.3 4% | 667.3 132% | 357.9 24% | 299.1 4% |
| Brightness (cd/m²) | 276 | 287 4% | 294 7% | 633 129% | 347 26% | 273 -1% |
| Brightness Distribution (%) | 93 | 91 -2% | 94 1% | 90 -3% | 94 1% | 81 -13% |
| Black Level * (cd/m²) | 0.24 | 0.2 17% | 0.29 -21% | 0.46 -92% | 0.33 -38% | 0.27 -13% |
| Contrast (:1) | 1200 | 1440 20% | 1032 -14% | 1451 21% | 1085 -10% | 1108 -8% |
| Colorchecker dE 2000 * | 1.92 | 2.33 -21% | 2.55 -33% | 3.53 -84% | 6.57 -242% | 5.07 -164% |
| Colorchecker dE 2000 max. * | 4.57 | 5.34 -17% | 4.73 -4% | 6.88 -51% | 9.86 -116% | 10.55 -131% |
| Colorchecker dE 2000 calibrated * | 1.14 | 2.47 -117% | 2.9 -154% | 3.79 -232% | 6.74 -491% | 3.31 -190% |
| Greyscale dE 2000 * | 3.08 | 1.19 61% | 3.5 -14% | 0.9 71% | 4.3 -40% | 6.8 -121% |
| Gamma | 2.42 91% | 2.41 91% | 2.28 96% | 2.17 101% | 2.6 85% | 2.46 89% |
| CCT | 7055 92% | 6710 97% | 7101 92% | 6533 99% | 6403 102% | 7805 83% |
| Color Space (Percent of AdobeRGB 1998) (%) | 65 | 57 -12% | 57 -12% | 87.1 34% | 88.4 36% | 58.5 -10% |
| Color Space (Percent of sRGB) (%) | 96 | 88 -8% | 88.7 -8% | 100 4% | 100 4% | 89.9 -6% |
| Totalt genomsnitt (program/inställningar) | -15% /
-10% | -20% /
-21% | -164% /
-64% | -153% /
-99% | -64% /
-58% |
* ... mindre är bättre
Visa svarstider
| ↔ Svarstid svart till vitt | ||
|---|---|---|
| 7.6 ms ... stiga ↗ och falla ↘ kombinerat | ↗ 3.4 ms stiga | 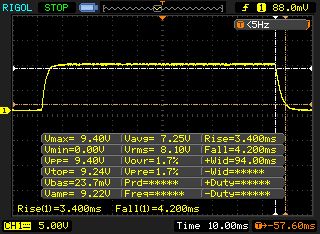 |
| ↘ 4.2 ms hösten | ||
| Skärmen visar väldigt snabba svarsfrekvenser i våra tester och borde vara mycket väl lämpad för fartfyllt spel. I jämförelse sträcker sig alla testade enheter från 0.1 (minst) till 240 (maximalt) ms. » 22 % av alla enheter är bättre. Det betyder att den uppmätta svarstiden är bättre än genomsnittet av alla testade enheter (19.8 ms). | ||
| ↔ Svarstid 50 % grått till 80 % grått | ||
| 5.6 ms ... stiga ↗ och falla ↘ kombinerat | ↗ 2.4 ms stiga | 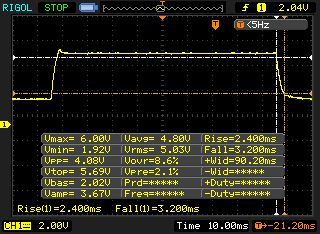 |
| ↘ 3.2 ms hösten | ||
| Skärmen visar väldigt snabba svarsfrekvenser i våra tester och borde vara mycket väl lämpad för fartfyllt spel. I jämförelse sträcker sig alla testade enheter från 0.165 (minst) till 636 (maximalt) ms. » 18 % av alla enheter är bättre. Det betyder att den uppmätta svarstiden är bättre än genomsnittet av alla testade enheter (30.9 ms). | ||
Skärmflimmer / PWM (Puls-Width Modulation)
| Skärmflimmer / PWM upptäcktes inte | 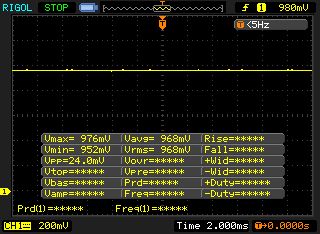 | ||
Som jämförelse: 52 % av alla testade enheter använder inte PWM för att dämpa skärmen. Om PWM upptäcktes mättes ett medelvärde av 7744 (minst: 5 - maximum: 343500) Hz. | |||
| Cinebench R15 | |
| CPU Single 64Bit | |
| Genomsnitt av klass Gaming (188.8 - 350, n=103, senaste 2 åren) | |
| Gigabyte Aero 17 XA RP77 | |
| Alienware m17 P37E | |
| Razer Blade Pro 17 RTX 2080 Max-Q | |
| Asus ROG Zephyrus S GX701GXR (Turbo) | |
| Asus ROG Zephyrus S GX701GXR | |
| Asus Zephyrus S GX701GX | |
| Lenovo Legion Y740-17ICH | |
| CPU Multi 64Bit | |
| Genomsnitt av klass Gaming (1578 - 6330, n=102, senaste 2 åren) | |
| Gigabyte Aero 17 XA RP77 | |
| Alienware m17 P37E | |
| Lenovo Legion Y740-17ICH | |
| Asus Zephyrus S GX701GX | |
| Asus ROG Zephyrus S GX701GXR (Turbo) | |
| Razer Blade Pro 17 RTX 2080 Max-Q | |
| Asus ROG Zephyrus S GX701GXR | |
| Cinebench R10 | |
| Rendering Multiple CPUs 32Bit | |
| Genomsnitt av klass Gaming (42932 - 102066, n=9, senaste 2 åren) | |
| Asus ROG Zephyrus S GX701GXR | |
| Shading 32Bit | |
| Genomsnitt av klass Gaming (13696 - 24952, n=6, senaste 2 åren) | |
| Asus ROG Zephyrus S GX701GXR | |
| Geekbench 3 | |
| 32 Bit Multi-Core Score | |
| Asus ROG Zephyrus S GX701GXR | |
| 32 Bit Single-Core Score | |
| Asus ROG Zephyrus S GX701GXR | |
| Geekbench 4.4 | |
| 64 Bit Multi-Core Score | |
| Genomsnitt av klass Gaming (89200 - 101054, n=3, senaste 2 åren) | |
| Asus ROG Zephyrus S GX701GXR | |
| 64 Bit Single-Core Score | |
| Genomsnitt av klass Gaming (9335 - 9775, n=3, senaste 2 åren) | |
| Asus ROG Zephyrus S GX701GXR | |
| Geekbench 5.0 | |
| 5.0 Multi-Core | |
| Genomsnitt av klass Gaming (21768 - 28184, n=3, senaste 2 åren) | |
| Asus ROG Zephyrus S GX701GXR | |
| 5.0 Single-Core | |
| Genomsnitt av klass Gaming (2237 - 2318, n=3, senaste 2 åren) | |
| Asus ROG Zephyrus S GX701GXR | |
| Mozilla Kraken 1.1 - Total | |
| Asus ROG Zephyrus S GX701GXR (Edge 44) | |
| Lenovo Legion Y740-17ICH (Edge 44.17763.1.0) | |
| Razer Blade Pro 17 RTX 2080 Max-Q (Edge 44.18362.1.0) | |
| Gigabyte Aero 17 XA RP77 (Edge 44.18362.267.0) | |
| Genomsnitt av klass Gaming (391 - 590, n=100, senaste 2 åren) | |
| Octane V2 - Total Score | |
| Genomsnitt av klass Gaming (93292 - 139447, n=26, senaste 2 åren) | |
| Gigabyte Aero 17 XA RP77 (Edge 44.18362.267.0) | |
| Razer Blade Pro 17 RTX 2080 Max-Q (Edge 44.18362.1.0) | |
| Lenovo Legion Y740-17ICH (Edge 44.17763.1.0) | |
| Asus ROG Zephyrus S GX701GXR (Edge 44) | |
| JetStream 1.1 - 1.1 Total | |
| Genomsnitt av klass Gaming (549 - 647, n=2, senaste 2 åren) | |
| Gigabyte Aero 17 XA RP77 (Edge 44.18362.267.0) | |
| Razer Blade Pro 17 RTX 2080 Max-Q (Edge 44.18362.1.0) | |
| Lenovo Legion Y740-17ICH (Edge 44.17763.1.0) | |
| Asus ROG Zephyrus S GX701GXR (Edge 44) | |
* ... mindre är bättre
| PCMark 8 Home Score Accelerated v2 | 5319 poäng | |
| PCMark 8 Creative Score Accelerated v2 | 6716 poäng | |
| PCMark 8 Work Score Accelerated v2 | 6593 poäng | |
| PCMark 10 Score | 6049 poäng | |
Hjälp | ||

| Asus ROG Zephyrus S GX701GXR Samsung SSD PM981 MZVLB1T0HALR | Razer Blade Pro 17 RTX 2080 Max-Q Samsung SSD PM981 MZVLB512HAJQ | Gigabyte Aero 17 XA RP77 Intel SSD 760p SSDPEKKW512G8 | Alienware m17 P37E SK Hynix PC401 512GB M.2 (HFS512GD9TNG) | Lenovo Legion Y740-17ICH Samsung SSD PM981 MZVLB256HAHQ | Asus Zephyrus S GX701GX Samsung SSD PM981 MZVLB1T0HALR | |
|---|---|---|---|---|---|---|
| CrystalDiskMark 5.2 / 6 | -1% | 34% | 6% | 12% | -6% | |
| Write 4K (MB/s) | 96.1 | 100.7 5% | 169.6 76% | 120.2 25% | 99.8 4% | 92.4 -4% |
| Read 4K (MB/s) | 40.86 | 41.03 0% | 58 42% | 44.3 8% | 40.81 0% | 39.59 -3% |
| Write Seq (MB/s) | 1317 | 1146 -13% | 1516 15% | 1278 -3% | 1385 5% | 1221 -7% |
| Read Seq (MB/s) | 1030 | 1115 8% | 2362 129% | 1389 35% | 2089 103% | 1005 -2% |
| Write 4K Q32T1 (MB/s) | 350.4 | 384.6 10% | 481.8 38% | 436.2 24% | 380 8% | 292.5 -17% |
| Read 4K Q32T1 (MB/s) | 404.1 | 429.5 6% | 506 25% | 515 27% | 445.5 10% | 330.8 -18% |
| Write Seq Q32T1 (MB/s) | 2396 | 1859 -22% | 1530 -36% | 1157 -52% | 1380 -42% | 2385 0% |
| Read Seq Q32T1 (MB/s) | 3194 | 3179 0% | 2645 -17% | 2671 -16% | 3471 9% | 3339 5% |
| 3DMark 06 Standard Score | 36228 poäng | |
| 3DMark 11 Performance | 20578 poäng | |
| 3DMark Ice Storm Standard Score | 171155 poäng | |
| 3DMark Cloud Gate Standard Score | 32628 poäng | |
| 3DMark Fire Strike Score | 17374 poäng | |
| 3DMark Time Spy Score | 7484 poäng | |
Hjälp | ||
| 3DMark | |
| 1920x1080 Fire Strike Graphics | |
| Genomsnitt av klass Gaming (18629 - 62849, n=112, senaste 2 åren) | |
| Razer Blade Pro 17 RTX 2080 Max-Q | |
| Asus ROG Zephyrus S GX701GXR (Turbo) | |
| Asus Zephyrus S GX701GX | |
| Asus ROG Zephyrus S GX701GXR | |
| Alienware m17 P37E | |
| Lenovo Legion Y740-17ICH | |
| Gigabyte Aero 17 XA RP77 | |
| 2560x1440 Time Spy Graphics | |
| Genomsnitt av klass Gaming (6387 - 26212, n=112, senaste 2 åren) | |
| Razer Blade Pro 17 RTX 2080 Max-Q | |
| Asus Zephyrus S GX701GX | |
| Asus ROG Zephyrus S GX701GXR (Turbo) | |
| Asus ROG Zephyrus S GX701GXR | |
| Alienware m17 P37E | |
| Lenovo Legion Y740-17ICH | |
| Gigabyte Aero 17 XA RP77 | |
| 3DMark 11 - 1280x720 Performance GPU | |
| Genomsnitt av klass Gaming (21841 - 80022, n=103, senaste 2 åren) | |
| Razer Blade Pro 17 RTX 2080 Max-Q | |
| Asus ROG Zephyrus S GX701GXR (Turbo) | |
| Asus Zephyrus S GX701GX | |
| Asus ROG Zephyrus S GX701GXR | |
| Alienware m17 P37E | |
| Lenovo Legion Y740-17ICH | |
| Gigabyte Aero 17 XA RP77 | |
| The Witcher 3 - 1920x1080 Ultra Graphics & Postprocessing (HBAO+) | |
| Genomsnitt av klass Gaming (104.7 - 240, n=7, senaste 2 åren) | |
| Razer Blade Pro 17 RTX 2080 Max-Q | |
| Asus Zephyrus S GX701GX | |
| Asus ROG Zephyrus S GX701GXR | |
| Alienware m17 P37E | |
| Lenovo Legion Y740-17ICH | |
| Gigabyte Aero 17 XA RP77 | |
| BioShock Infinite - 1920x1080 Ultra Preset, DX11 (DDOF) | |
| Razer Blade Pro 17 RTX 2080 Max-Q | |
| Asus ROG Zephyrus S GX701GXR | |
| Alienware m17 P37E | |
| Lenovo Legion Y740-17ICH | |
| Gigabyte Aero 17 XA RP77 | |
| låg | med. | hög | ultra | |
|---|---|---|---|---|
| BioShock Infinite (2013) | 350.6 | 306 | 285.9 | 176.5 |
| The Witcher 3 (2015) | 295.5 | 230.3 | 153.2 | 80.7 |
| Metro Exodus (2019) | 121.7 | 94.6 | 72.1 | 59 |
| Control (2019) | 231.9 | 92.8 | 71.9 | |
| Borderlands 3 (2019) | 128.8 | 110.8 | 84.7 | 67.1 |
| FIFA 20 (2019) | 214.6 | 208.1 | 197.7 | 197.1 |
| Ghost Recon Breakpoint (2019) | 105 | 95 | 92 | 71 |
| GRID 2019 (2019) | 213.5 | 187.6 | 120.7 | 81.3 |
| Call of Duty Modern Warfare 2019 (2019) | 171.5 | 126.7 | 104.9 | 90.6 |
| Need for Speed Heat (2019) | 85.6 | 66 | 63.6 | 57.2 |
| Star Wars Jedi Fallen Order (2019) | 94.5 | 84.2 | 82.3 | |
| Red Dead Redemption 2 (2019) | 121 | 102.6 | 72.8 | 45.6 |
| Escape from Tarkov (2020) | 121 | 121 | 120 | 117 |
| Hunt Showdown (2020) | 184 | 134 | 121 | |
| Doom Eternal (2020) | 156 | 140 | 138 | 134 |
Ljudnivå
| Låg belastning |
| 32 / 33 / 34 dB(A) |
| Hög belastning |
| 40 / 50 dB(A) |
 | ||
30 dB tyst 40 dB(A) hörbar 50 dB(A) högt ljud |
||
min: | ||
| Asus ROG Zephyrus S GX701GXR i7-9750H, GeForce RTX 2080 Max-Q | Razer Blade Pro 17 RTX 2080 Max-Q i7-9750H, GeForce RTX 2080 Max-Q | Gigabyte Aero 17 XA RP77 i9-9980HK, GeForce RTX 2070 Max-Q | Alienware m17 P37E i9-8950HK, GeForce RTX 2080 Max-Q | Lenovo Legion Y740-17ICH i7-8750H, GeForce RTX 2080 Max-Q | Asus Zephyrus S GX701GX i7-8750H, GeForce RTX 2080 Max-Q | Genomsnitt av klass Gaming | |
|---|---|---|---|---|---|---|---|
| Noise | 4% | -1% | 1% | 8% | -0% | 8% | |
| av / miljö * (dB) | 30 | 28.2 6% | 29.3 2% | 28.2 6% | 28.3 6% | 29 3% | 24.1 ? 20% |
| Idle Minimum * (dB) | 32 | 28.2 12% | 33 -3% | 28.2 12% | 31.5 2% | 29 9% | 25.9 ? 19% |
| Idle Average * (dB) | 33 | 28.2 15% | 33 -0% | 28.2 15% | 31.6 4% | 32 3% | 27.4 ? 17% |
| Idle Maximum * (dB) | 34 | 30.8 9% | 33 3% | 31 9% | 31.6 7% | 33 3% | 30.1 ? 11% |
| Load Average * (dB) | 40 | 42 -5% | 42.5 -6% | 50.8 -27% | 32.3 19% | 47 -18% | 43.7 ? -9% |
| Witcher 3 ultra * (dB) | 49 | 51 -4% | 42 14% | 50.8 -4% | 43 12% | 49 -0% | |
| Load Maximum * (dB) | 50 | 53 -6% | 59.6 -19% | 50.8 -2% | 45.5 9% | 51 -2% | 54.3 ? -9% |
* ... mindre är bättre
(-) Den maximala temperaturen på ovansidan är 50 °C / 122 F, jämfört med genomsnittet av 40.4 °C / 105 F , allt från 21.2 till 68.8 °C för klassen Gaming.
(-) Botten värms upp till maximalt 47 °C / 117 F, jämfört med genomsnittet av 43.2 °C / 110 F
(+) Vid tomgångsbruk är medeltemperaturen för ovansidan 31.2 °C / 88 F, jämfört med enhetsgenomsnittet på 33.9 °C / ### class_avg_f### F.
(-) När du spelar The Witcher 3 är medeltemperaturen för ovansidan 44.1 °C / 111 F, jämfört med enhetsgenomsnittet på 33.9 °C / ## #class_avg_f### F.
(±) Handledsstöden och pekplattan kan bli väldigt varma vid beröring med maximalt 38 °C / 100.4 F.
(-) Medeltemperaturen för handledsstödsområdet på liknande enheter var 28.8 °C / 83.8 F (-9.2 °C / -16.6 F).
| Asus ROG Zephyrus S GX701GXR i7-9750H, GeForce RTX 2080 Max-Q | Razer Blade Pro 17 RTX 2080 Max-Q i7-9750H, GeForce RTX 2080 Max-Q | Gigabyte Aero 17 XA RP77 i9-9980HK, GeForce RTX 2070 Max-Q | Alienware m17 P37E i9-8950HK, GeForce RTX 2080 Max-Q | Lenovo Legion Y740-17ICH i7-8750H, GeForce RTX 2080 Max-Q | Asus Zephyrus S GX701GX i7-8750H, GeForce RTX 2080 Max-Q | Genomsnitt av klass Gaming | |
|---|---|---|---|---|---|---|---|
| Heat | 11% | -4% | -6% | 9% | 5% | 3% | |
| Maximum Upper Side * (°C) | 50 | 43 14% | 46.8 6% | 55 -10% | 38.6 23% | 53 -6% | 45.1 ? 10% |
| Maximum Bottom * (°C) | 47 | 47.2 -0% | 62.2 -32% | 60 -28% | 43.6 7% | 50 -6% | 48.1 ? -2% |
| Idle Upper Side * (°C) | 33 | 27.2 18% | 29 12% | 30.4 8% | 30.2 8% | 27 18% | 31 ? 6% |
| Idle Bottom * (°C) | 34 | 30 12% | 34 -0% | 31.8 6% | 35 -3% | 30 12% | 34.2 ? -1% |
* ... mindre är bättre
Asus ROG Zephyrus S GX701GXR ljudanalys
(+) | högtalare kan spela relativt högt (83 dB)
Bas 100 - 315 Hz
(±) | reducerad bas - i genomsnitt 10.3% lägre än medianen
(±) | linjäriteten för basen är genomsnittlig (11.1% delta till föregående frekvens)
Mellan 400 - 2000 Hz
(+) | balanserad mellan - endast 2.6% från medianen
(+) | mids är linjära (4.3% delta till föregående frekvens)
Högsta 2 - 16 kHz
(+) | balanserade toppar - endast 3.3% från medianen
(+) | toppar är linjära (4.1% delta till föregående frekvens)
Totalt 100 - 16 000 Hz
(+) | det totala ljudet är linjärt (12.5% skillnad mot median)
Jämfört med samma klass
» 15% av alla testade enheter i den här klassen var bättre, 3% liknande, 81% sämre
» Den bästa hade ett delta på 6%, genomsnittet var 18%, sämst var 132%
Jämfört med alla testade enheter
» 11% av alla testade enheter var bättre, 2% liknande, 87% sämre
» Den bästa hade ett delta på 4%, genomsnittet var 23%, sämst var 134%
Razer Blade Pro 17 RTX 2080 Max-Q ljudanalys
(+) | högtalare kan spela relativt högt (83.6 dB)
Bas 100 - 315 Hz
(±) | reducerad bas - i genomsnitt 10.5% lägre än medianen
(±) | linjäriteten för basen är genomsnittlig (14.4% delta till föregående frekvens)
Mellan 400 - 2000 Hz
(±) | högre mellan - i genomsnitt 5.3% högre än median
(+) | mids är linjära (4.6% delta till föregående frekvens)
Högsta 2 - 16 kHz
(+) | balanserade toppar - endast 3.5% från medianen
(±) | linjäriteten för toppar är genomsnittlig (10% delta till föregående frekvens)
Totalt 100 - 16 000 Hz
(±) | linjäriteten för det totala ljudet är genomsnittlig (17.9% skillnad mot median)
Jämfört med samma klass
» 55% av alla testade enheter i den här klassen var bättre, 9% liknande, 36% sämre
» Den bästa hade ett delta på 6%, genomsnittet var 18%, sämst var 132%
Jämfört med alla testade enheter
» 37% av alla testade enheter var bättre, 8% liknande, 55% sämre
» Den bästa hade ett delta på 4%, genomsnittet var 23%, sämst var 134%
| Av/Standby | |
| Låg belastning | |
| Hög belastning |
|
Förklaring:
min: | |
| Asus ROG Zephyrus S GX701GXR i7-9750H, GeForce RTX 2080 Max-Q | Razer Blade Pro 17 RTX 2080 Max-Q i7-9750H, GeForce RTX 2080 Max-Q | Gigabyte Aero 17 XA RP77 i9-9980HK, GeForce RTX 2070 Max-Q | Alienware m17 P37E i9-8950HK, GeForce RTX 2080 Max-Q | Lenovo Legion Y740-17ICH i7-8750H, GeForce RTX 2080 Max-Q | Asus Zephyrus S GX701GX i7-8750H, GeForce RTX 2080 Max-Q | Genomsnitt av klass Gaming | |
|---|---|---|---|---|---|---|---|
| Power Consumption | 14% | 4% | -3% | 16% | 11% | 16% | |
| Idle Minimum * (Watt) | 32 | 16.2 49% | 13.9 57% | 21.2 34% | 20.2 37% | 19 41% | 13.1 ? 59% |
| Idle Average * (Watt) | 34 | 20.4 40% | 24.3 29% | 29.6 13% | 27.2 20% | 22 35% | 19 ? 44% |
| Idle Maximum * (Watt) | 36 | 26.1 27% | 35.5 1% | 34 6% | 28.7 20% | 30 17% | 24.6 ? 32% |
| Load Average * (Watt) | 95 | 96.5 -2% | 127.6 -34% | 130.9 -38% | 90.8 4% | 104 -9% | 111.3 ? -17% |
| Witcher 3 ultra * (Watt) | 155 | 182.9 -18% | 158 -2% | 177.5 -15% | 152.1 2% | 167 -8% | |
| Load Maximum * (Watt) | 187 | 214.3 -15% | 237.5 -27% | 219.7 -17% | 165.4 12% | 203 -9% | 260 ? -39% |
* ... mindre är bättre
| Asus ROG Zephyrus S GX701GXR i7-9750H, GeForce RTX 2080 Max-Q, 76 Wh | Razer Blade Pro 17 RTX 2080 Max-Q i7-9750H, GeForce RTX 2080 Max-Q, 70 Wh | Gigabyte Aero 17 XA RP77 i9-9980HK, GeForce RTX 2070 Max-Q, 94.24 Wh | Alienware m17 P37E i9-8950HK, GeForce RTX 2080 Max-Q, 90 Wh | Lenovo Legion Y740-17ICH i7-8750H, GeForce RTX 2080 Max-Q, 76 Wh | Asus Zephyrus S GX701GX i7-8750H, GeForce RTX 2080 Max-Q, 76 Wh | Genomsnitt av klass Gaming | |
|---|---|---|---|---|---|---|---|
| Batteridrifttid | 31% | 121% | 51% | 7% | 8% | 112% | |
| Reader / Idle (h) | 4.1 | 4.9 20% | 11.9 190% | 9.1 122% | 5 22% | 7.84 ? 91% | |
| H.264 (h) | 2.8 | 8.27 ? 195% | |||||
| WiFi v1.3 (h) | 3 | 4.7 57% | 7.2 140% | 4.9 63% | 3.2 7% | 3.8 27% | 7.08 ? 136% |
| Load (h) | 1.2 | 1.4 17% | 1.6 33% | 0.8 -33% | 0.9 -25% | 1.496 ? 25% |
För
Emot
Läs den fullständiga versionen av den här recensionen på engelska här.
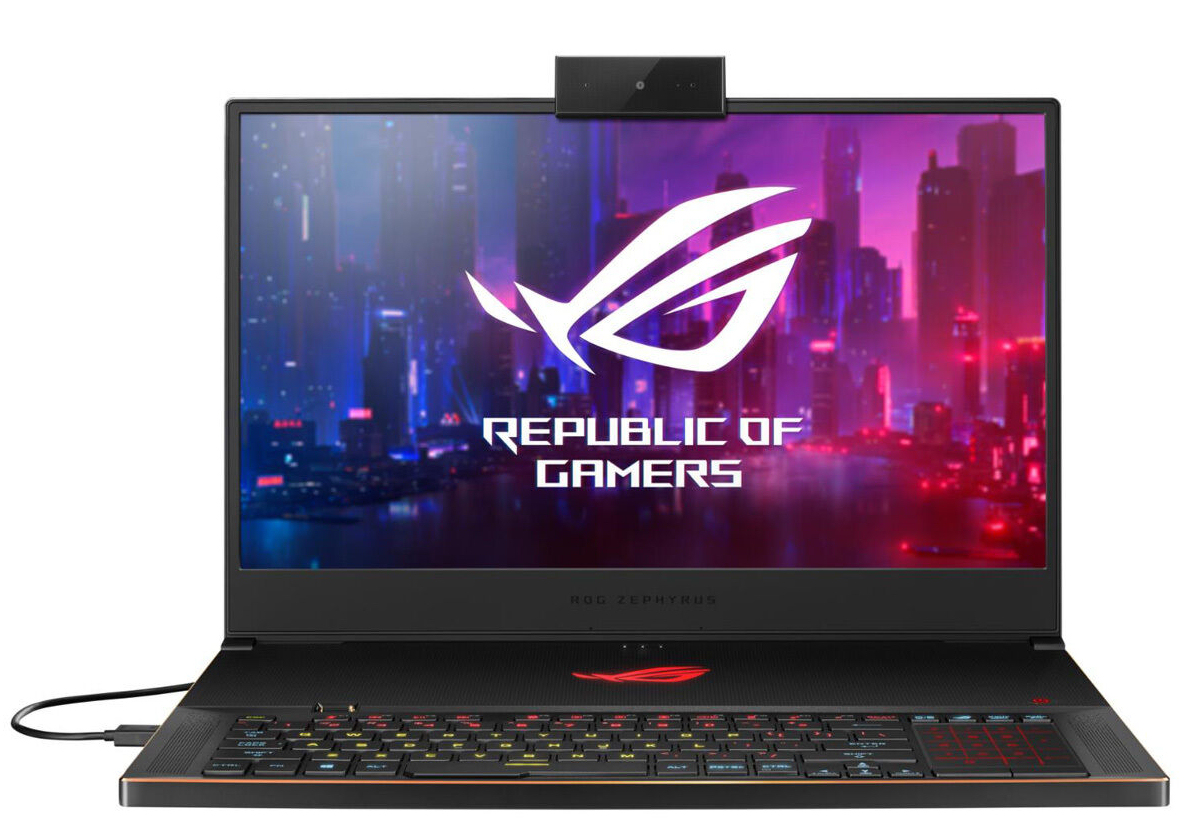
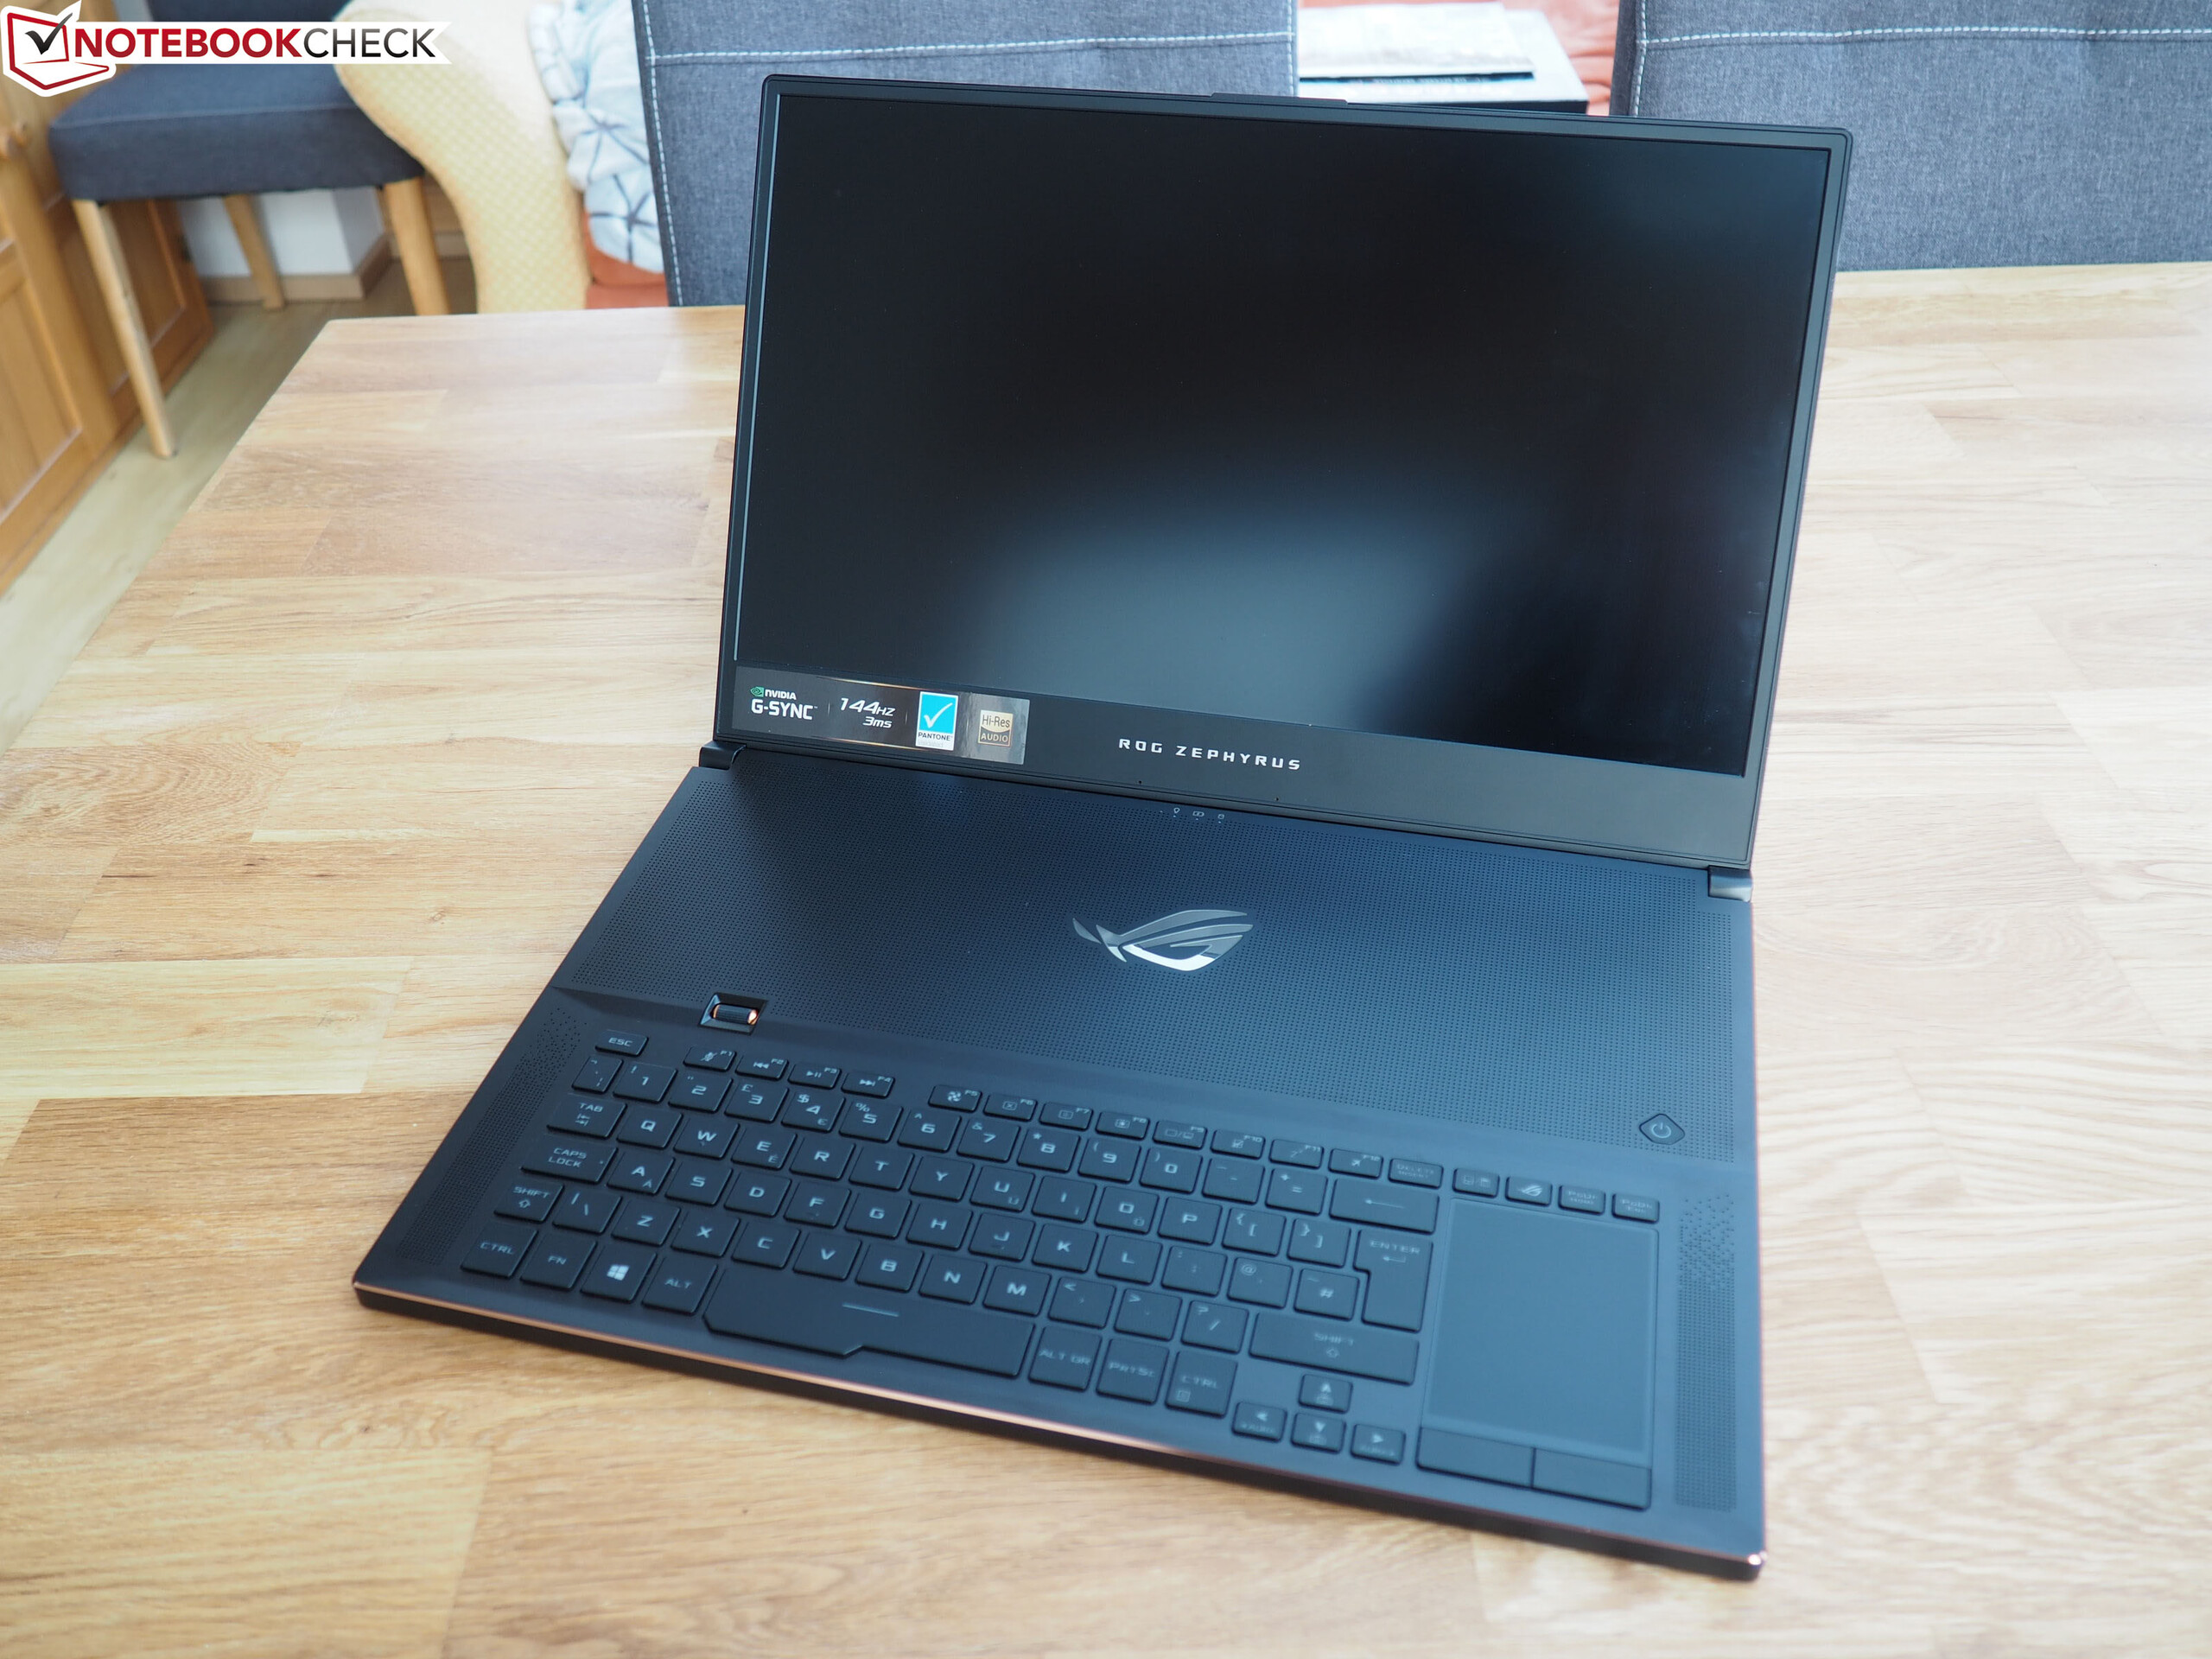
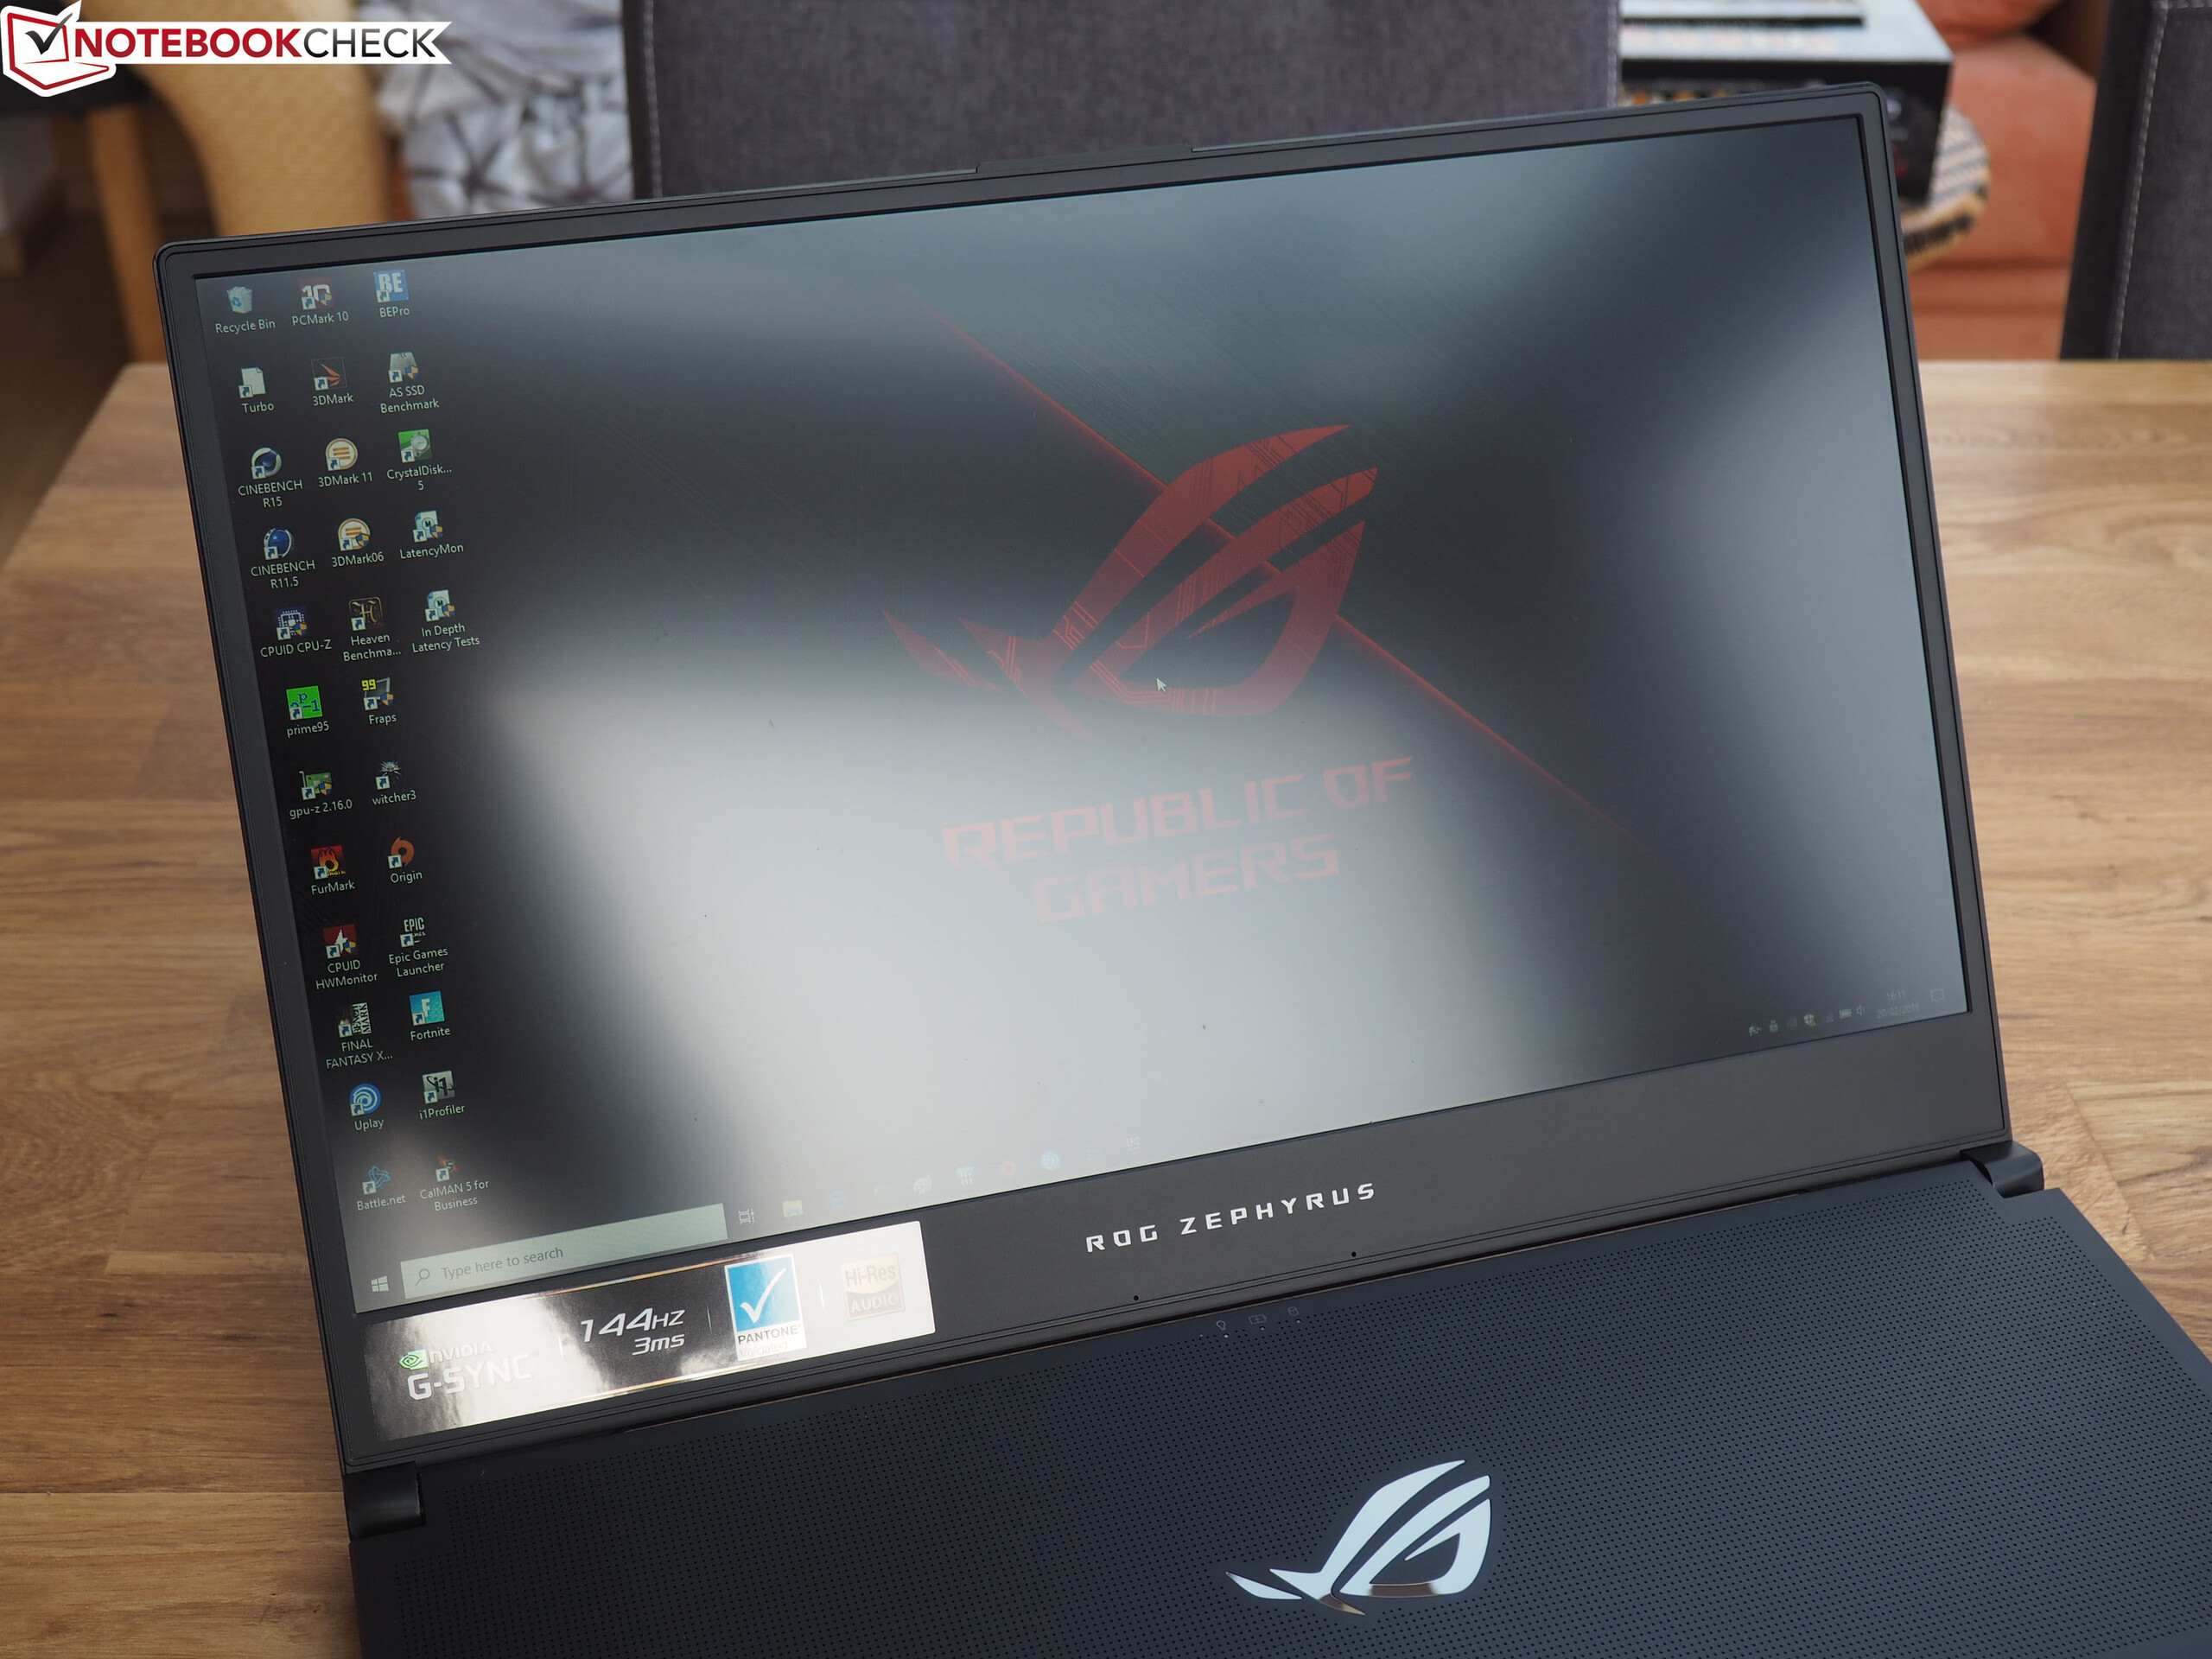
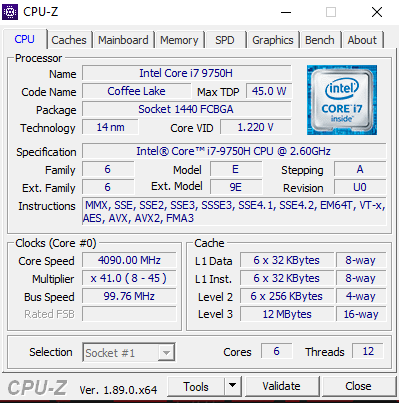
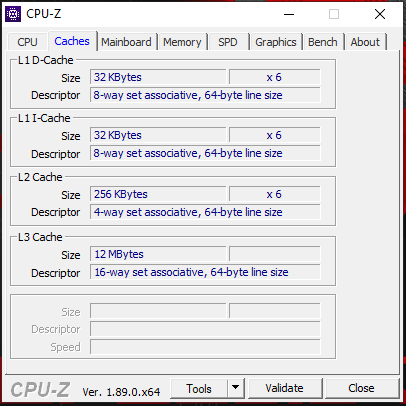
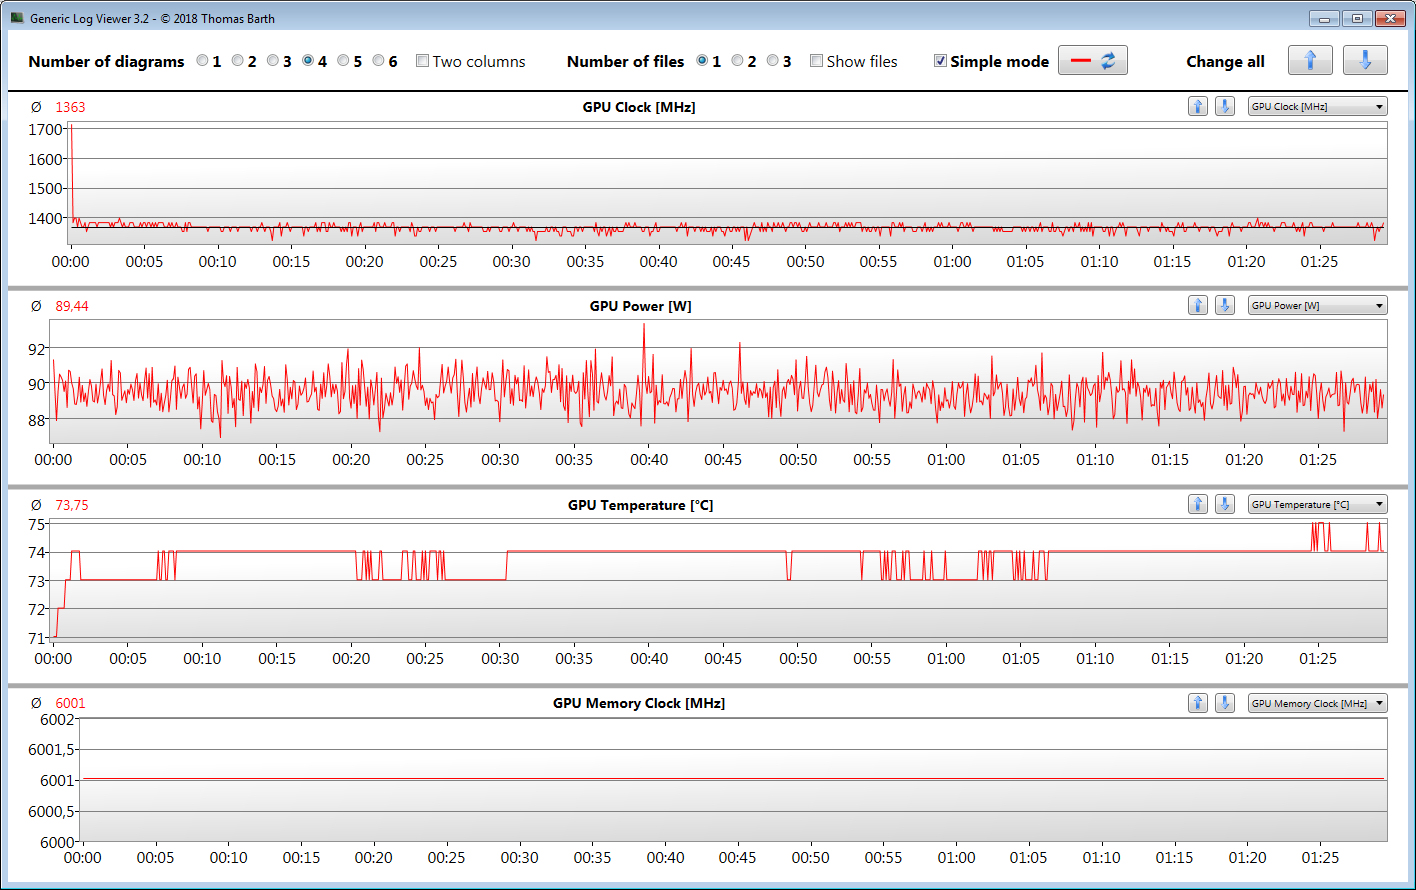
Med Zephyrus S GX701GXR levererar Asus en kompakt spellaptop på 17.3 tum som visar alla aktuella spel smidigt på den matta Full HD-skärmen tack vare en Core i7-9750H processor och en GeForce RTX 2080 Max Q GPU. Värmeutvecklingen och ljudnivån ligger på acceptabla nivåer. Batteritiden är knappt värd att nämna, men den går att förbättra genom att aktivera den integrerade GPU:n.
IPS-skärmen med bilduppdatering i 300 Hz får poäng för korta responstider, stabila betraktningsvinklar, bra kontrast, X-Rite Pantone-certifiering och utmärkt färgåtergivning.
Skärmens maximala ljusstyrka är dock en aning för låg. En dator i det här prisskiktet bör erbjuda mer på den punkten.
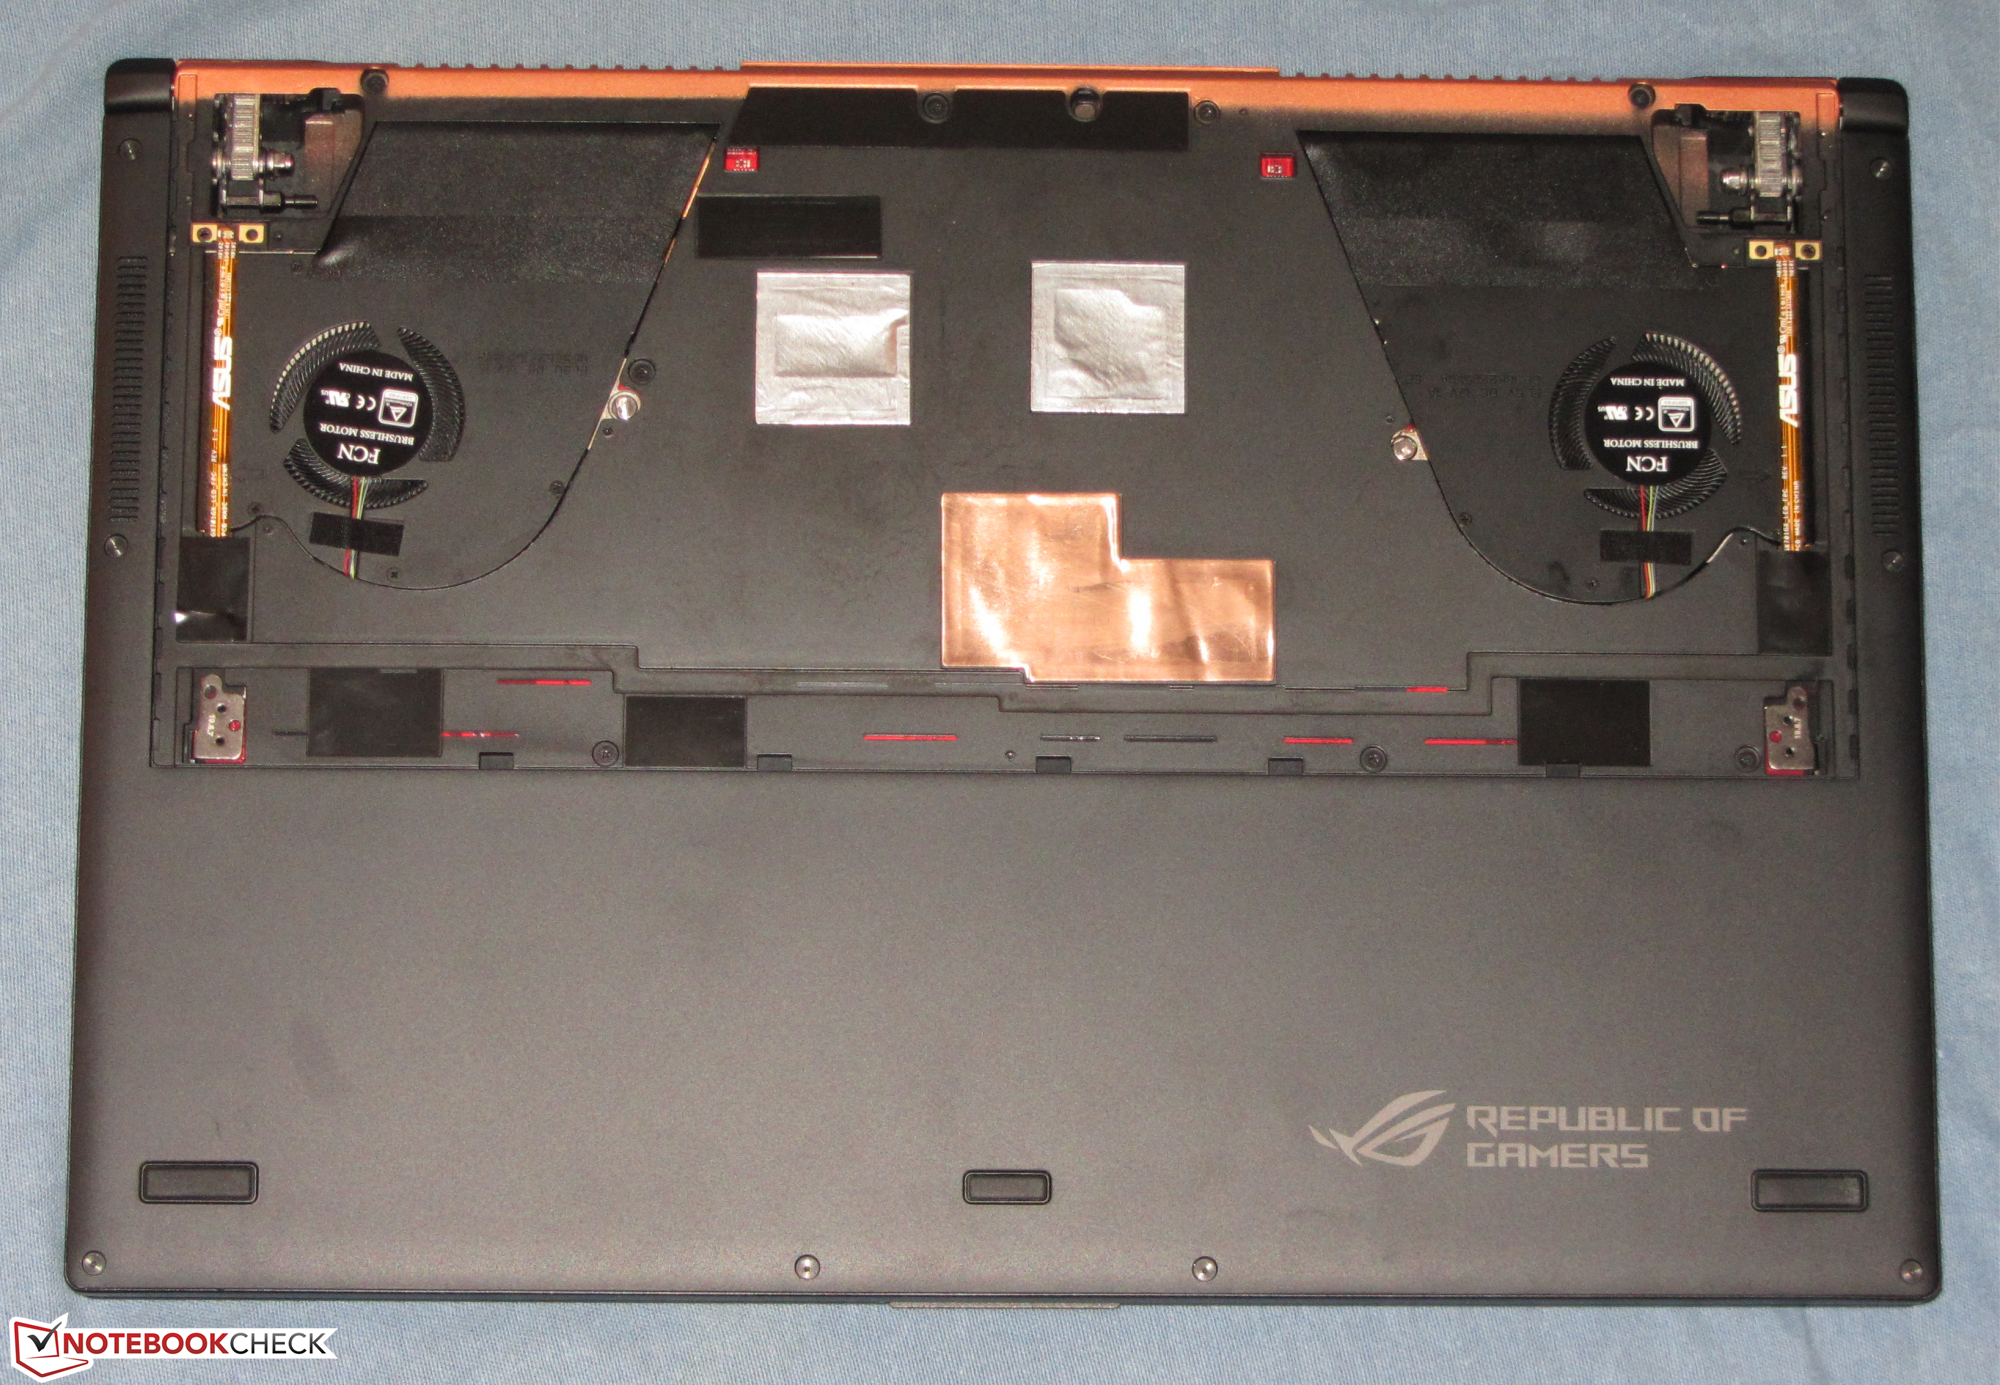
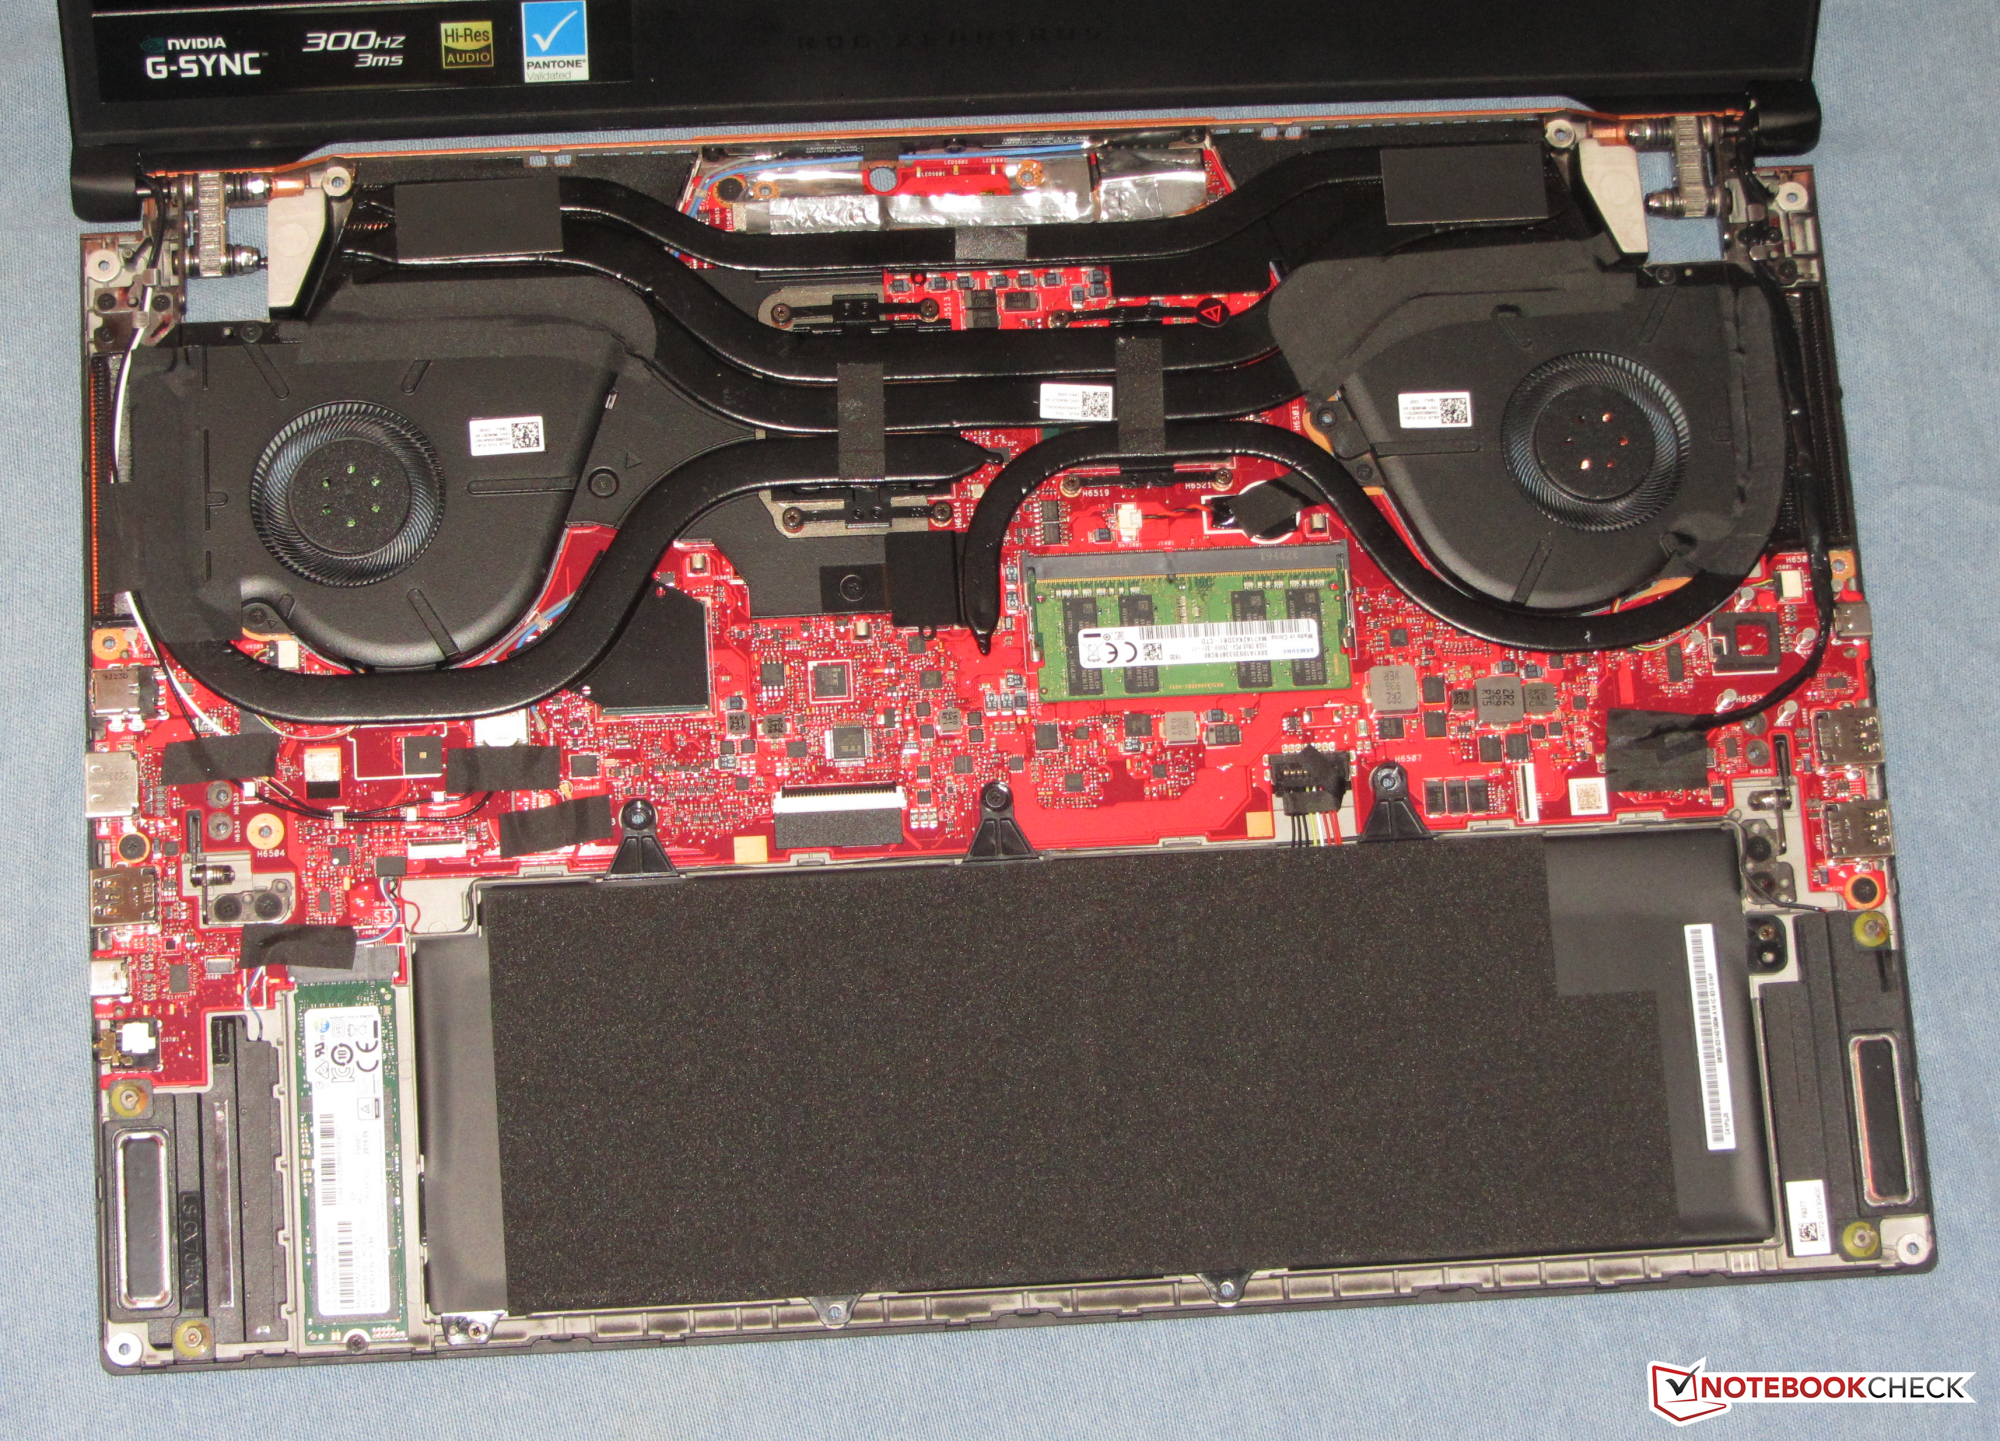
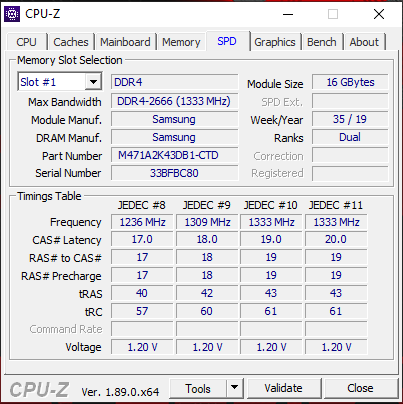
Uppgraderingsmöjligheterna är kraftigt begränsade. Det går bara att installera en lagringsenhet (M.2 SSD); det finns ingen plats för en hårddisk på 2.5 tum. Dessutom har datorn bara en minnesplats (16 GB RAM finns fastlött). Det finns inte stöd för att installera mer än 32 GB minne. Dessutom visade det sig vara krångligare att öppna höljet än på många av dess konkurrenter.
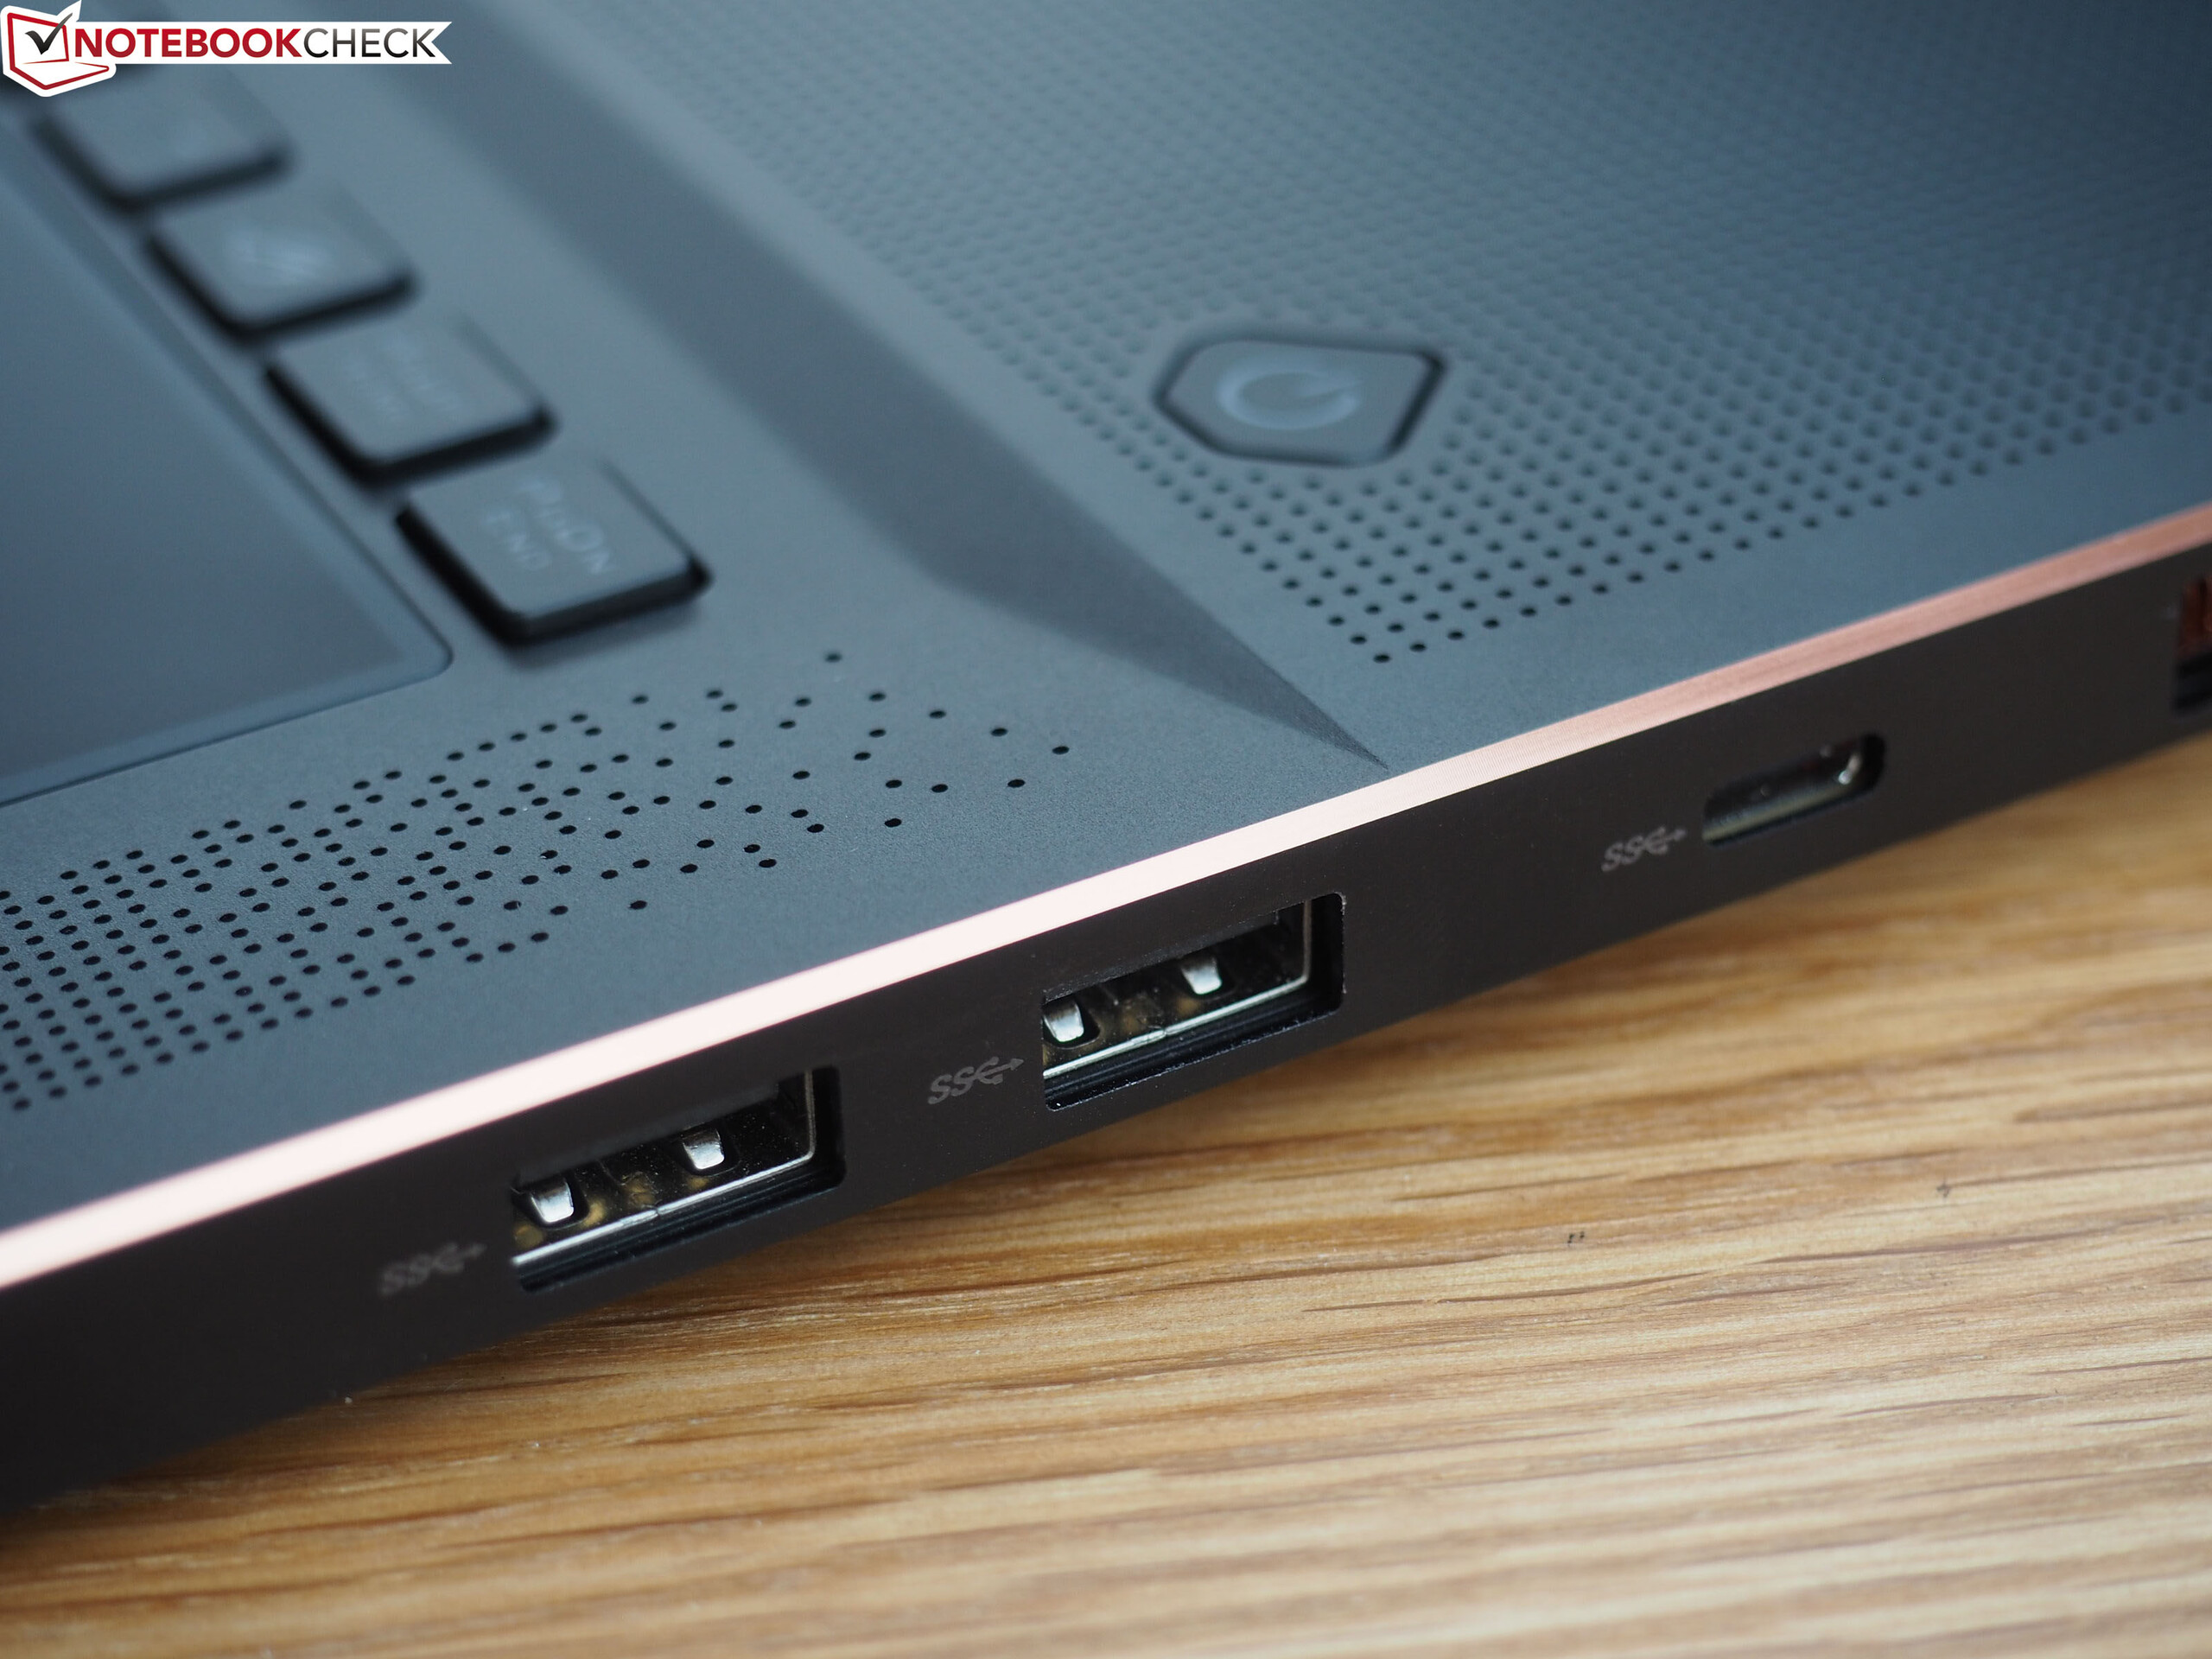
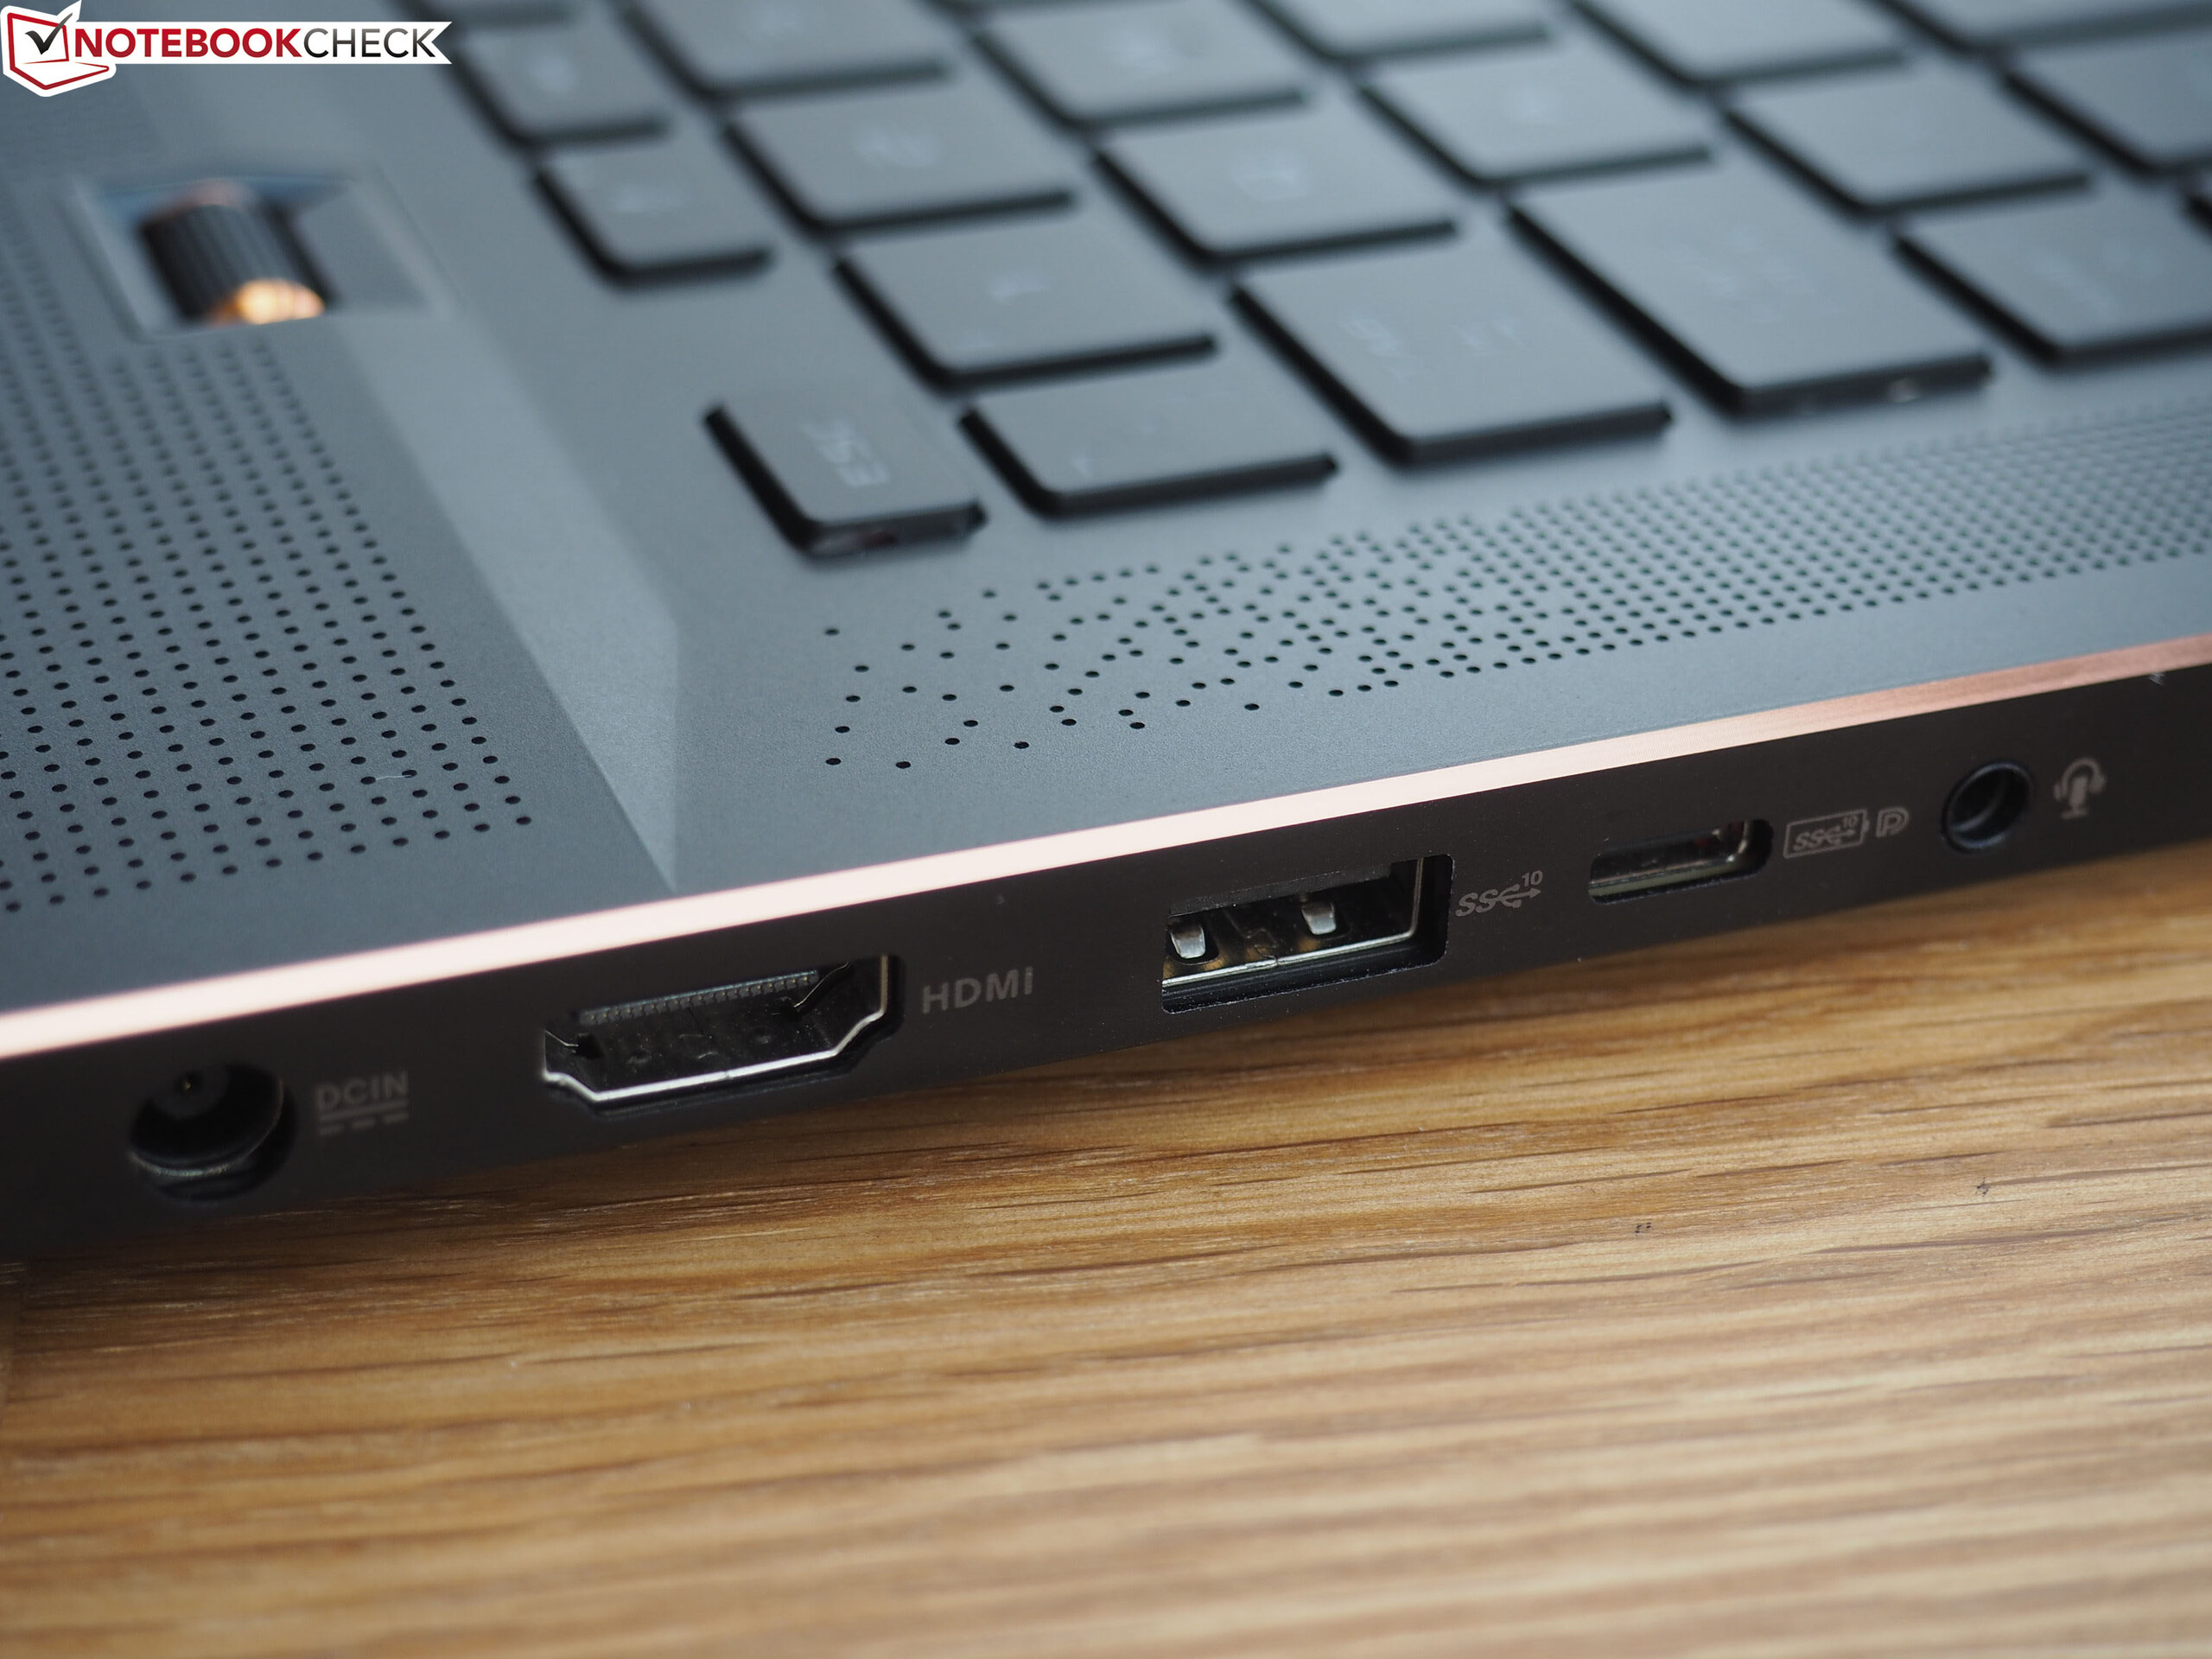
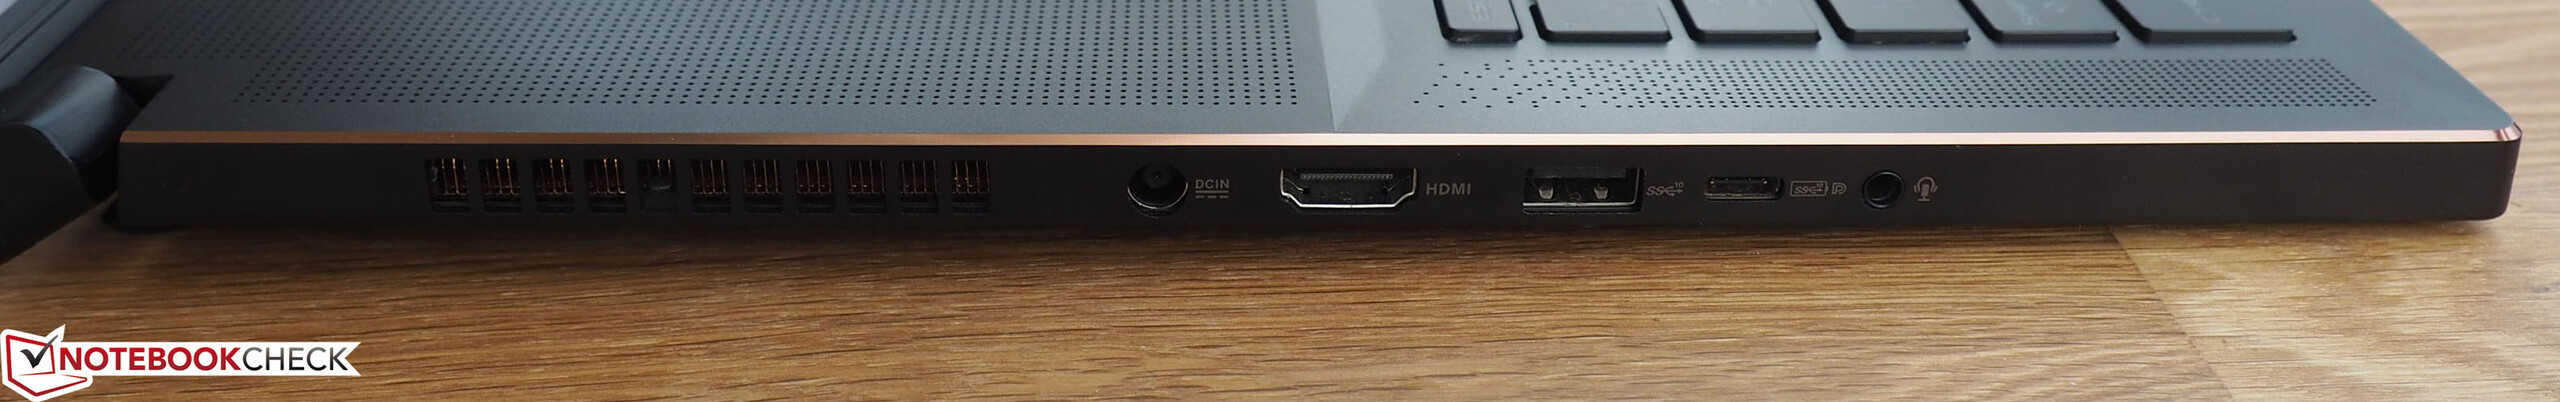
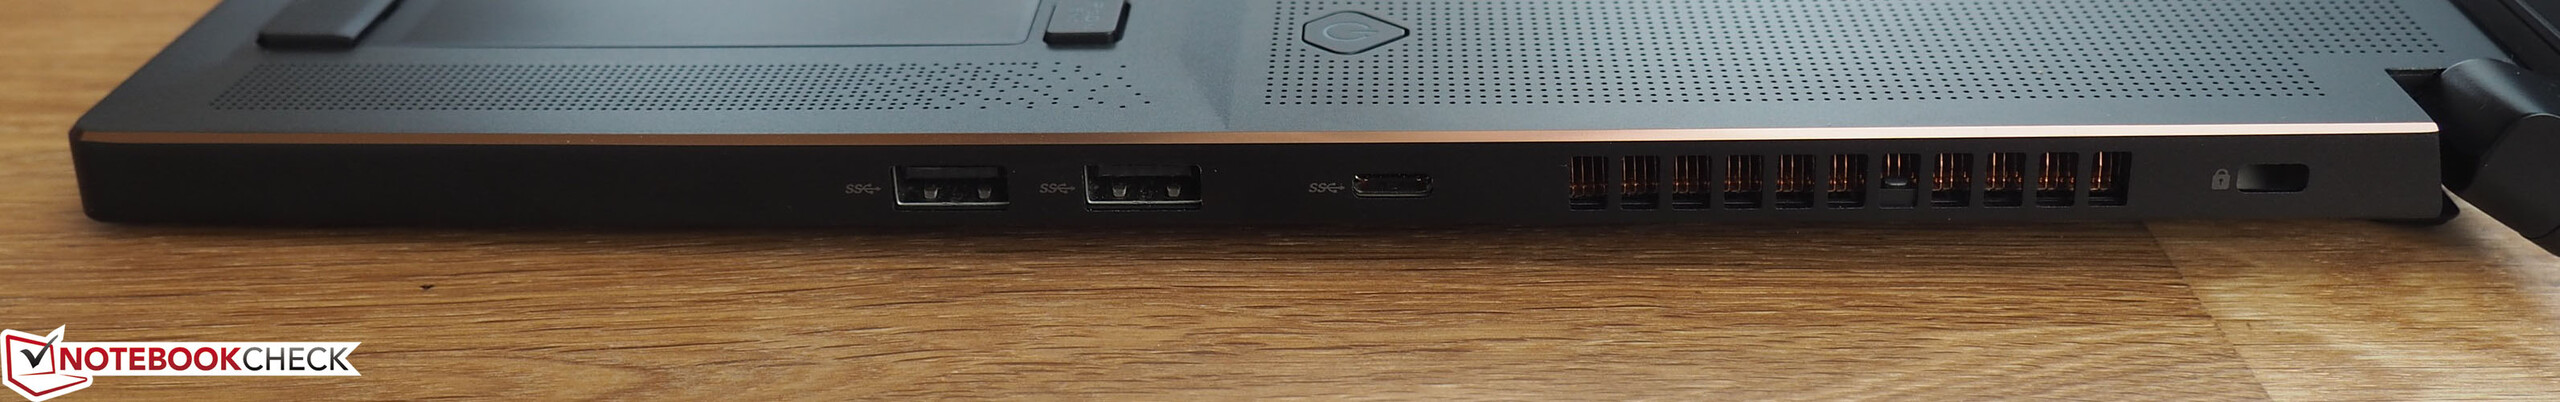
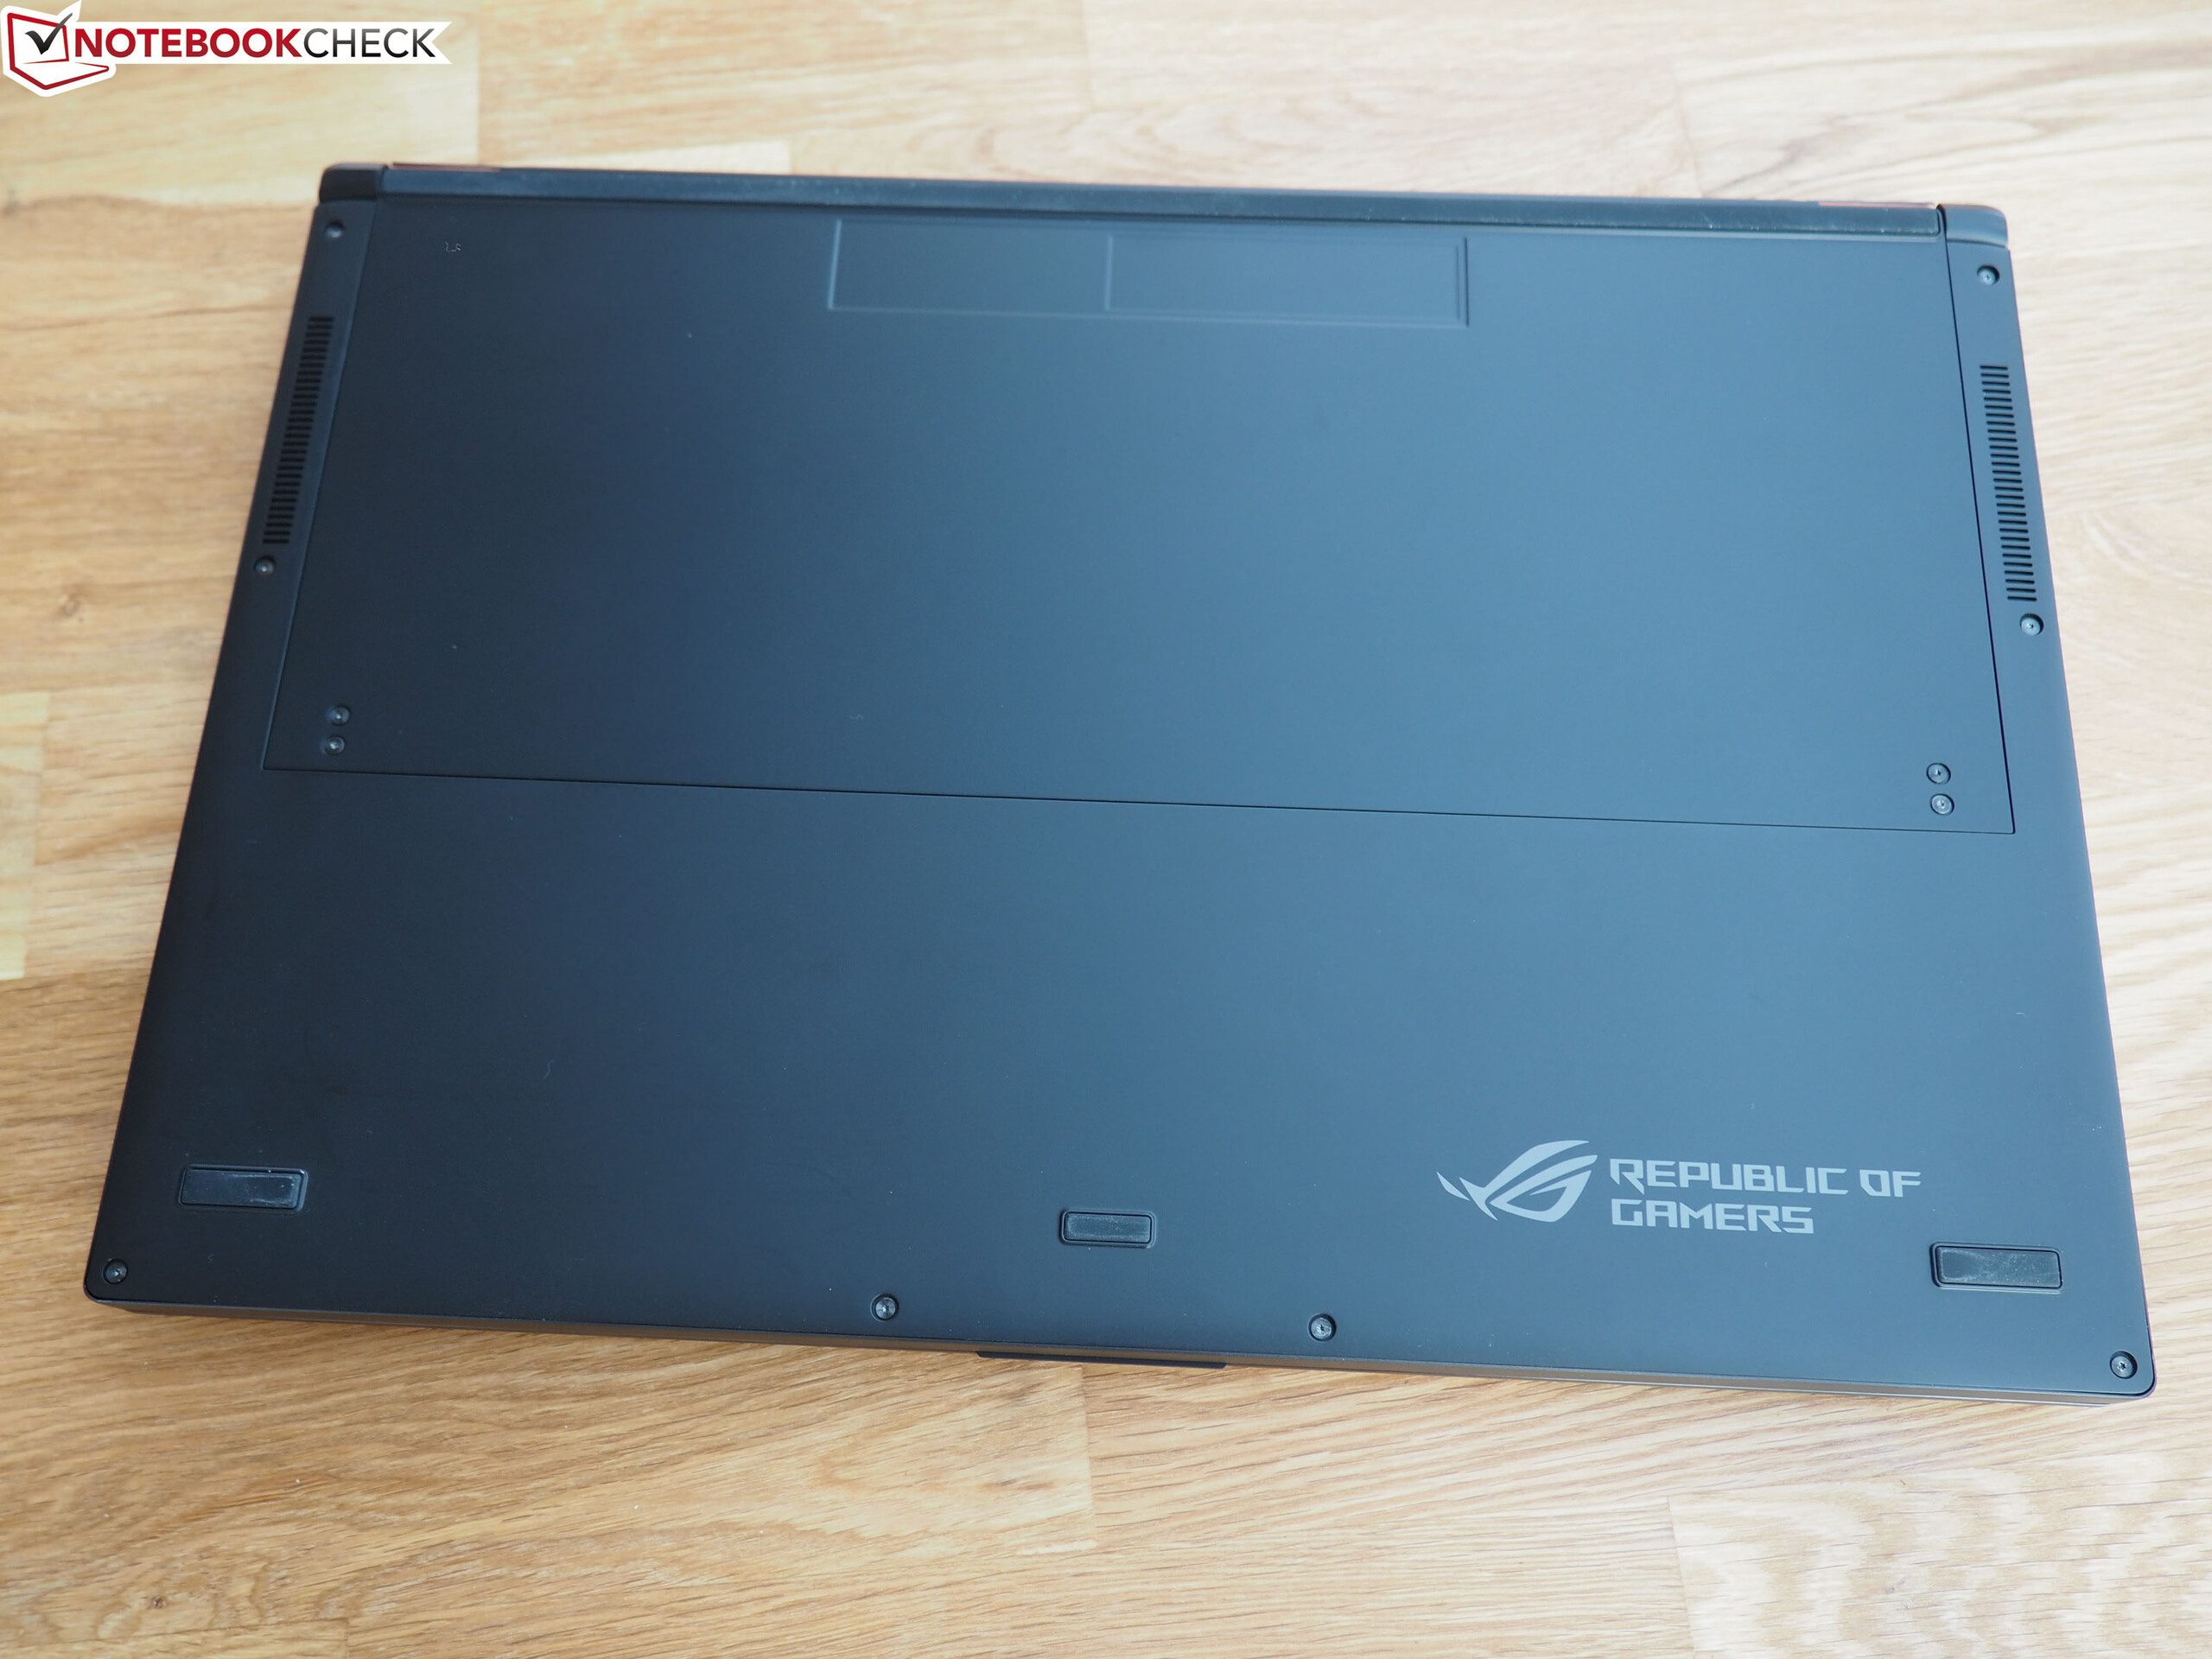
Det finns också förbättringspotential när det kommer till portarna. Asus har inte utrustat sin laptop med en Thunderbolt 3-port och datorn har bara två USB Typ C 3.1-portar (1x Gen 1, 1x Gen 2). Den saknar dessutom minneskortsläsare och Ethernet-port. Förväntar man sig mer i fråga om uppgraderings/servicemöjligheter eller portutbud får man ta till en konkurrent - exempelvis Razer Blade Pro 17 eller Gigabyte Aero 17 XA.
Asus ROG Zephyrus S GX701GXR
- 05/14/2020 v7 (old)
Sascha Mölck