Test: Som Apple Touch Bar, fast bättre - Asus ZenBook Duo UX481 (Sammanfattning)
Gradering | Datum | Modell | Vikt | Höjd | Storlek | Upplösning | Pris |
|---|---|---|---|---|---|---|---|
| 82.7 % v7 (old) | 05/2020 | Asus ZenBook Duo UX481FL i7-10510U, GeForce MX250 | 1.8 kg | 19 mm | 14.00" | 1920x1080 | |
| 84.2 % v7 (old) | 02/2020 | MSI Prestige 14 A10SC-009 i7-10710U, GeForce GTX 1650 Max-Q | 1.3 kg | 16 mm | 14.00" | 3840x2160 | |
| 85 % v6 (old) | 07/2019 | Lenovo IdeaPad S940-14IWL i7-8565U, UHD Graphics 620 | 1.2 kg | 12 mm | 14.00" | 3840x2160 | |
| 84 % v7 (old) | 02/2020 | Microsoft Surface Laptop 3 13 Core i5-1035G7 i5-1035G7, Iris Plus Graphics G7 (Ice Lake 64 EU) | 1.3 kg | 14.5 mm | 13.50" | 2256x1504 | |
| 81.2 % v7 (old) | 02/2020 | Asus ZenBook 14 UM431DA-AM020T R7 3700U, Vega 10 | 1.4 kg | 16 mm | 14.00" | 1920x1080 |
| SD Card Reader | |
| average JPG Copy Test (av. of 3 runs) | |
| MSI Prestige 14 A10SC-009 (Toshiba Exceria Pro M501 microSDXC 64GB) | |
| Dell XPS 13 9300 Core i7-1065G7 (Toshiba Exceria Pro M501 64 GB UHS-II) | |
| Asus ZenBook Duo UX481FL (Toshiba Exceria Pro M501 microSDXC 64GB) | |
| Asus ZenBook 14 UM431DA-AM020T (Toshiba Exceria Pro SDXC 64 GB UHS-II) | |
| maximum AS SSD Seq Read Test (1GB) | |
| Dell XPS 13 9300 Core i7-1065G7 (Toshiba Exceria Pro M501 64 GB UHS-II) | |
| MSI Prestige 14 A10SC-009 (Toshiba Exceria Pro M501 microSDXC 64GB) | |
| Asus ZenBook Duo UX481FL (Toshiba Exceria Pro M501 microSDXC 64GB) | |
| Asus ZenBook 14 UM431DA-AM020T (Toshiba Exceria Pro SDXC 64 GB UHS-II) | |
| Networking | |
| iperf3 transmit AX12 | |
| Asus Zephyrus G14 GA401IV | |
| Asus ZenBook Duo UX481FL | |
| Lenovo ThinkPad X1 Carbon G7 20R1-000YUS | |
| MSI GF75 Thin 10SCXR | |
| iperf3 receive AX12 | |
| Asus ZenBook Duo UX481FL | |
| MSI GF75 Thin 10SCXR | |
| Asus Zephyrus G14 GA401IV | |
| Lenovo ThinkPad X1 Carbon G7 20R1-000YUS | |


| |||||||||||||||||||||||||
Distribution av ljusstyrkan: 89 %
Mitt på batteriet: 301 cd/m²
Kontrast: 717:1 (Svärta: 0.42 cd/m²)
ΔE ColorChecker Calman: 1.01 | ∀{0.5-29.43 Ø4.73}
calibrated: 0.97
ΔE Greyscale Calman: 2.2 | ∀{0.09-98 Ø4.97}
99.5% sRGB (Argyll 1.6.3 3D)
63.2% AdobeRGB 1998 (Argyll 1.6.3 3D)
68.9% AdobeRGB 1998 (Argyll 3D)
99.5% sRGB (Argyll 3D)
67.1% Display P3 (Argyll 3D)
Gamma: 2.19
CCT: 6605 K
| Asus ZenBook Duo UX481FL Chi Mei N140HCE-EN2, IPS, 14", 1920x1080 | Asus ZenBook 14 UM431DA-AM020T CEC PA LM140LF-3L03, IPS, 14", 1920x1080 | Huawei Matebook X Pro i5 Tianma XM, IPS, 13.9", 3000x2000 | Lenovo IdeaPad S940-14IWL B140ZAN01.3, IPS, 14", 3840x2160 | Lenovo ThinkPad X1 Carbon G7 20R1-000YUS BOE NV140QUM-N53, IPS, 14", 3840x2160 | MSI Prestige 14 A10SC-009 IPS, 14", 3840x2160 | |
|---|---|---|---|---|---|---|
| Display | -3% | -3% | 16% | 15% | ||
| Display P3 Coverage (%) | 67.1 | 66.7 -1% | 65.9 -2% | 87.5 30% | 83 24% | |
| sRGB Coverage (%) | 99.5 | 92.3 -7% | 95.2 -4% | 99.7 0% | 99.7 0% | |
| AdobeRGB 1998 Coverage (%) | 68.9 | 67.5 -2% | 67.6 -2% | 81.1 18% | 83.1 21% | |
| Response Times | -9% | -15% | -54% | -42% | -59% | |
| Response Time Grey 50% / Grey 80% * (ms) | 31.2 ? | 36 ? -15% | 40.4 ? -29% | 57.2 ? -83% | 49.2 ? -58% | 55 ? -76% |
| Response Time Black / White * (ms) | 25.6 ? | 26 ? -2% | 25.6 ? -0% | 32 ? -25% | 32.2 ? -26% | 36 ? -41% |
| PWM Frequency (Hz) | 24750 ? | 44 ? | 201.6 ? | |||
| Screen | -124% | -34% | -57% | -103% | 16% | |
| Brightness middle (cd/m²) | 301 | 253 -16% | 442.7 47% | 594.5 98% | 532 77% | 567 88% |
| Brightness (cd/m²) | 285 | 245 -14% | 428 50% | 536 88% | 513 80% | 516 81% |
| Brightness Distribution (%) | 89 | 78 -12% | 84 -6% | 83 -7% | 90 1% | 86 -3% |
| Black Level * (cd/m²) | 0.42 | 0.225 46% | 0.31 26% | 0.43 -2% | 0.41 2% | 0.445 -6% |
| Contrast (:1) | 717 | 1124 57% | 1428 99% | 1383 93% | 1298 81% | 1274 78% |
| Colorchecker dE 2000 * | 1.01 | 8.89 -780% | 2.24 -122% | 4.87 -382% | 6.88 -581% | 1.55 -53% |
| Colorchecker dE 2000 max. * | 3.42 | 4.56 -33% | 7.19 -110% | 7.9 -131% | 12.65 -270% | 5.14 -50% |
| Colorchecker dE 2000 calibrated * | 0.97 | 4.9 -405% | 1.11 -14% | 2.83 -192% | 2.52 -160% | 1.24 -28% |
| Greyscale dE 2000 * | 2.2 | 6.33 -188% | 9.7 -341% | 6.7 -205% | 10.5 -377% | 1.48 33% |
| Gamma | 2.19 100% | 2.52 87% | 1.42 155% | 2.091 105% | 1.98 111% | 2.19 100% |
| CCT | 6605 98% | 6745 96% | 6227 104% | 6891 94% | 7394 88% | 6741 96% |
| Color Space (Percent of AdobeRGB 1998) (%) | 63.2 | 60 -5% | 61.6 -3% | 72 14% | 74.1 17% | |
| Color Space (Percent of sRGB) (%) | 99.5 | 91 -9% | 95 -5% | 100 1% | 99.7 0% | |
| Totalt genomsnitt (program/inställningar) | -45% /
-87% | -17% /
-26% | -32% /
-43% | -43% /
-73% | -22% /
2% |
* ... mindre är bättre
Visa svarstider
| ↔ Svarstid svart till vitt | ||
|---|---|---|
| 25.6 ms ... stiga ↗ och falla ↘ kombinerat | ↗ 14.8 ms stiga | 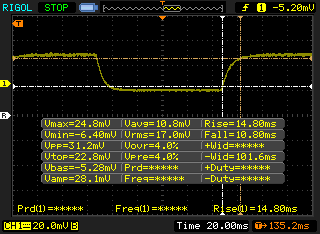 |
| ↘ 10.8 ms hösten | ||
| Skärmen visar relativt långsamma svarsfrekvenser i våra tester och kan vara för långsam för spelare. I jämförelse sträcker sig alla testade enheter från 0.1 (minst) till 240 (maximalt) ms. » 61 % av alla enheter är bättre. Detta innebär att den uppmätta svarstiden är sämre än genomsnittet av alla testade enheter (19.9 ms). | ||
| ↔ Svarstid 50 % grått till 80 % grått | ||
| 31.2 ms ... stiga ↗ och falla ↘ kombinerat | ↗ 15.6 ms stiga | 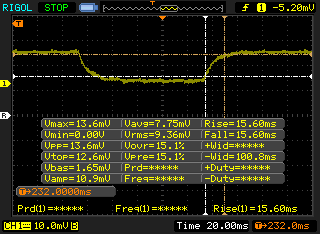 |
| ↘ 15.6 ms hösten | ||
| Skärmen visar långsamma svarsfrekvenser i våra tester och kommer att vara otillfredsställande för spelare. I jämförelse sträcker sig alla testade enheter från 0.165 (minst) till 636 (maximalt) ms. » 42 % av alla enheter är bättre. Det betyder att den uppmätta svarstiden liknar genomsnittet av alla testade enheter (31.1 ms). | ||
Skärmflimmer / PWM (Puls-Width Modulation)
| Skärmflimmer / PWM upptäckt | 24750 Hz | ≤ 29 % ljusstyrka inställning | 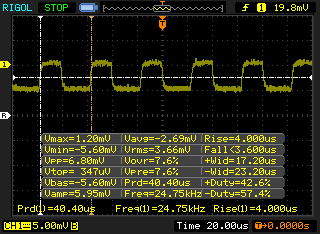 |
Displayens bakgrundsbelysning flimrar vid 24750 Hz (i värsta fall, t.ex. med PWM) Flimrande upptäckt vid en ljusstyrkeinställning på 29 % och lägre. Det ska inte finnas något flimmer eller PWM över denna ljusstyrkeinställning. Frekvensen för 24750 Hz är ganska hög, så de flesta användare som är känsliga för PWM bör inte märka något flimmer. Som jämförelse: 52 % av alla testade enheter använder inte PWM för att dämpa skärmen. Om PWM upptäcktes mättes ett medelvärde av 7798 (minst: 5 - maximum: 343500) Hz. | |||
Cinebench R15: CPU Single 64Bit | CPU Multi 64Bit
Blender: v2.79 BMW27 CPU
7-Zip 18.03: 7z b 4 -mmt1 | 7z b 4
Geekbench 5.5: Single-Core | Multi-Core
HWBOT x265 Benchmark v2.2: 4k Preset
LibreOffice : 20 Documents To PDF
R Benchmark 2.5: Overall mean
| Cinebench R20 / CPU (Multi Core) | |
| Dell XPS 13 7390 Core i7-10710U | |
| Dell XPS 13 9300 Core i7-1065G7 | |
| MSI GF63 Thin 9SC | |
| Asus ZenBook 15 UX534FT-DB77 | |
| Microsoft Surface Laptop 3 13 Core i5-1035G7 | |
| Dell Inspiron 15 5000 5585 | |
| Asus ZenBook Duo UX481FL | |
| Genomsnitt Intel Core i7-10510U (1015 - 1897, n=38) | |
| Dynabook Portege A30-E-174 | |
| HP Elite Dragonfly-8MK79EA | |
| Cinebench R20 / CPU (Single Core) | |
| Dell XPS 13 7390 Core i7-10710U | |
| Dell XPS 13 9300 Core i7-1065G7 | |
| Asus ZenBook 15 UX534FT-DB77 | |
| Asus ZenBook Duo UX481FL | |
| Microsoft Surface Laptop 3 13 Core i5-1035G7 | |
| Genomsnitt Intel Core i7-10510U (362 - 497, n=37) | |
| MSI GF63 Thin 9SC | |
| Dynabook Portege A30-E-174 | |
| HP Elite Dragonfly-8MK79EA | |
| Dell Inspiron 15 5000 5585 | |
| Cinebench R15 / CPU Single 64Bit | |
| Asus ZenBook 15 UX534FT-DB77 | |
| Dell XPS 13 7390 Core i7-10710U | |
| Dell XPS 13 9300 Core i7-1065G7 | |
| Genomsnitt Intel Core i7-10510U (113 - 202, n=42) | |
| Asus ZenBook Duo UX481FL | |
| MSI GF63 Thin 9SC | |
| Microsoft Surface Laptop 3 13 Core i5-1035G7 | |
| Dynabook Portege A30-E-174 | |
| HP Elite Dragonfly-8MK79EA | |
| Dell Inspiron 15 5000 5585 | |
| Cinebench R15 / CPU Multi 64Bit | |
| Dell XPS 13 7390 Core i7-10710U | |
| MSI GF63 Thin 9SC | |
| Asus ZenBook Duo UX481FL | |
| Dell XPS 13 9300 Core i7-1065G7 | |
| Microsoft Surface Laptop 3 13 Core i5-1035G7 | |
| Asus ZenBook 15 UX534FT-DB77 | |
| Dell Inspiron 15 5000 5585 | |
| Genomsnitt Intel Core i7-10510U (482 - 856, n=45) | |
| HP Elite Dragonfly-8MK79EA | |
| Dynabook Portege A30-E-174 | |
| Blender / v2.79 BMW27 CPU | |
| HP Elite Dragonfly-8MK79EA | |
| Genomsnitt Intel Core i7-10510U (628 - 1051, n=31) | |
| Asus ZenBook Duo UX481FL | |
| Microsoft Surface Laptop 3 13 Core i5-1035G7 | |
| Dell XPS 13 7390 Core i7-10710U | |
| 7-Zip 18.03 / 7z b 4 -mmt1 | |
| Asus ZenBook Duo UX481FL | |
| Genomsnitt Intel Core i7-10510U (3747 - 4981, n=31) | |
| Dell XPS 13 7390 Core i7-10710U | |
| Microsoft Surface Laptop 3 13 Core i5-1035G7 | |
| HP Elite Dragonfly-8MK79EA | |
| 7-Zip 18.03 / 7z b 4 | |
| Dell XPS 13 7390 Core i7-10710U | |
| Asus ZenBook Duo UX481FL | |
| Microsoft Surface Laptop 3 13 Core i5-1035G7 | |
| Genomsnitt Intel Core i7-10510U (12196 - 21298, n=31) | |
| HP Elite Dragonfly-8MK79EA | |
| Geekbench 5.5 / Single-Core | |
| Asus ZenBook Duo UX481FL | |
| Genomsnitt Intel Core i7-10510U (977 - 1287, n=31) | |
| Geekbench 5.5 / Multi-Core | |
| Asus ZenBook Duo UX481FL | |
| Genomsnitt Intel Core i7-10510U (2474 - 4484, n=31) | |
| HWBOT x265 Benchmark v2.2 / 4k Preset | |
| Dell XPS 13 7390 Core i7-10710U | |
| Asus ZenBook Duo UX481FL | |
| Genomsnitt Intel Core i7-10510U (3.41 - 6.04, n=31) | |
| Microsoft Surface Laptop 3 13 Core i5-1035G7 | |
| HP Elite Dragonfly-8MK79EA | |
| LibreOffice / 20 Documents To PDF | |
| Asus ZenBook Duo UX481FL | |
| Genomsnitt Intel Core i7-10510U (50.7 - 77.8, n=27) | |
| R Benchmark 2.5 / Overall mean | |
| Asus ZenBook Duo UX481FL | |
| Genomsnitt Intel Core i7-10510U (0.637 - 0.81, n=28) | |
* ... mindre är bättre
| PCMark 8 | |
| Home Score Accelerated v2 | |
| Asus ZenBook Duo UX481FL | |
| Asus ZenBook 14 UM431DA-AM020T | |
| Genomsnitt Intel Core i7-10510U, NVIDIA GeForce MX250 (3214 - 3958, n=8) | |
| MSI Prestige 14 A10SC-009 | |
| Huawei Matebook X Pro i5 | |
| Lenovo ThinkPad X1 Carbon G7 20R1-000YUS | |
| Lenovo IdeaPad S940-14IWL | |
| Work Score Accelerated v2 | |
| Asus ZenBook Duo UX481FL | |
| Genomsnitt Intel Core i7-10510U, NVIDIA GeForce MX250 (4599 - 5443, n=8) | |
| Asus ZenBook 14 UM431DA-AM020T | |
| MSI Prestige 14 A10SC-009 | |
| Lenovo ThinkPad X1 Carbon G7 20R1-000YUS | |
| Huawei Matebook X Pro i5 | |
| Lenovo IdeaPad S940-14IWL | |
| PCMark 8 Home Score Accelerated v2 | 3747 poäng | |
| PCMark 8 Work Score Accelerated v2 | 5266 poäng | |
| PCMark 10 Score | 4246 poäng | |
Hjälp | ||
| DPC Latencies / LatencyMon - interrupt to process latency (max), Web, Youtube, Prime95 | |
| Asus ZenBook Duo UX481FL | |
* ... mindre är bättre
| Asus ZenBook Duo UX481FL Intel SSD 660p 1TB SSDPEKNW010T8 | Asus ZenBook 14 UM431DA-AM020T SK hynix BC501 HFM512GDHTNG-8310A | Huawei Matebook X Pro i5 Samsung PM961 MZVLW256HEHP | Lenovo ThinkPad X1 Carbon G7 20R1-000YUS WDC PC SN730 SDBPNTY-512G | MSI Prestige 14 A10SC-009 Samsung SSD PM981 MZVLB1T0HALR | |
|---|---|---|---|---|---|
| AS SSD | 0% | 3% | 14% | 74% | |
| Seq Read (MB/s) | 1237 | 1417 15% | 2416 95% | 1786 44% | 2300 86% |
| Seq Write (MB/s) | 1069 | 781 -27% | 1170 9% | 1259 18% | 2051 92% |
| 4K Read (MB/s) | 52.1 | 37.03 -29% | 48.33 -7% | 45.86 -12% | 46.23 -11% |
| 4K Write (MB/s) | 134.7 | 80.1 -41% | 103.1 -23% | 147.9 10% | 84.6 -37% |
| 4K-64 Read (MB/s) | 585 | 740 26% | 1039 78% | 885 51% | 1552 165% |
| 4K-64 Write (MB/s) | 854 | 748 -12% | 399.6 -53% | 950 11% | 1789 109% |
| Access Time Read * (ms) | 0.05 | 0.047 6% | 0.058 -16% | 0.058 -16% | 0.049 2% |
| Access Time Write * (ms) | 0.117 | 0.045 62% | 0.036 69% | 0.074 37% | 0.045 62% |
| Score Read (Points) | 761 | 918 21% | 1329 75% | 1110 46% | 1828 140% |
| Score Write (Points) | 1095 | 906 -17% | 620 -43% | 1224 12% | 2079 90% |
| Score Total (Points) | 2255 | 2270 1% | 2575 14% | 2885 28% | 4831 114% |
| Copy ISO MB/s (MB/s) | 1714 | 739 -57% | 1384 -19% | ||
| Copy Program MB/s (MB/s) | 511 | 312.3 -39% | 525 3% | ||
| Copy Game MB/s (MB/s) | 1187 | 486.3 -59% | 1008 -15% | ||
| CrystalDiskMark 5.2 / 6 | -32% | -17% | 24% | 20% | |
| Write 4K (MB/s) | 140.7 | 118.8 -16% | 116.5 -17% | 151.5 8% | 163.8 16% |
| Read 4K (MB/s) | 55.6 | 41.62 -25% | 42.18 -24% | 45.83 -18% | 48.6 -13% |
| Write Seq (MB/s) | 1415 | 796 -44% | 1079 -24% | 2060 46% | 2269 60% |
| Read Seq (MB/s) | 1516 | 1101 -27% | 1030 -32% | 1973 30% | 1963 29% |
| Write 4K Q32T1 (MB/s) | 474.5 | 234.7 -51% | 225.7 -52% | 489.8 3% | 289.8 -39% |
| Read 4K Q32T1 (MB/s) | 403.4 | 313.8 -22% | 302.9 -25% | 386.2 -4% | 373.6 -7% |
| Write Seq Q32T1 (MB/s) | 1796 | 842 -53% | 1174 -35% | 2703 51% | 2395 33% |
| Read Seq Q32T1 (MB/s) | 1913 | 1645 -14% | 3394 77% | 3376 76% | 3479 82% |
| Totalt genomsnitt (program/inställningar) | -16% /
-13% | -7% /
-4% | 19% /
18% | 47% /
51% |
* ... mindre är bättre

| 3DMark | |
| 1280x720 Cloud Gate Standard Graphics | |
| Dell G5 15 5587 | |
| Asus ZenBook 15 UX534FTC-A8190T | |
| Asus ZenBook Flip 15 UX563FD-A1027T | |
| Genomsnitt NVIDIA GeForce MX250 (13805 - 23863, n=25) | |
| Dell Inspiron 15 5000 5585 | |
| Asus ZenBook Duo UX481FL | |
| Asus Zenbook 14 UX433FN-A6023T | |
| Lenovo Yoga C940-14IIL 81Q9 | |
| Asus VivoBook 15 X510UQ-BQ534T | |
| 1920x1080 Fire Strike Graphics | |
| Dell G5 15 5587 | |
| Asus ZenBook 15 UX534FTC-A8190T | |
| Asus ZenBook Flip 15 UX563FD-A1027T | |
| Genomsnitt NVIDIA GeForce MX250 (2939 - 3885, n=29) | |
| Dell Inspiron 15 5000 5585 | |
| Lenovo Yoga C940-14IIL 81Q9 | |
| Asus ZenBook Duo UX481FL | |
| Asus Zenbook 14 UX433FN-A6023T | |
| Asus VivoBook 15 X510UQ-BQ534T | |
| 2560x1440 Time Spy Graphics | |
| Dell G5 15 5587 | |
| Asus ZenBook 15 UX534FTC-A8190T | |
| Asus ZenBook Flip 15 UX563FD-A1027T | |
| Genomsnitt NVIDIA GeForce MX250 (881 - 1169, n=22) | |
| Asus ZenBook Duo UX481FL | |
| Asus Zenbook 14 UX433FN-A6023T | |
| Dell Inspiron 15 5000 5585 | |
| Lenovo Yoga C940-14IIL 81Q9 | |
| Asus VivoBook 15 X510UQ-BQ534T | |
| 3DMark 11 | |
| 1280x720 Performance GPU | |
| Dell G5 15 5587 | |
| Asus ZenBook 15 UX534FTC-A8190T | |
| Asus ZenBook Flip 15 UX563FD-A1027T | |
| Lenovo Yoga C940-14IIL 81Q9 | |
| Genomsnitt NVIDIA GeForce MX250 (3585 - 4942, n=29) | |
| Dell Inspiron 15 5000 5585 | |
| Asus ZenBook Duo UX481FL | |
| Asus Zenbook 14 UX433FN-A6023T | |
| Asus VivoBook 15 X510UQ-BQ534T | |
| 1280x720 Performance Combined | |
| Dell G5 15 5587 | |
| Asus ZenBook 15 UX534FTC-A8190T | |
| Asus ZenBook Flip 15 UX563FD-A1027T | |
| Genomsnitt NVIDIA GeForce MX250 (3532 - 4638, n=29) | |
| Lenovo Yoga C940-14IIL 81Q9 | |
| Asus ZenBook Duo UX481FL | |
| Asus Zenbook 14 UX433FN-A6023T | |
| Dell Inspiron 15 5000 5585 | |
| Asus VivoBook 15 X510UQ-BQ534T | |
| 3DMark 11 Performance | 3991 poäng | |
| 3DMark Cloud Gate Standard Score | 12710 poäng | |
| 3DMark Fire Strike Score | 2758 poäng | |
| 3DMark Time Spy Score | 995 poäng | |
Hjälp | ||
| låg | med. | hög | ultra | |
|---|---|---|---|---|
| The Witcher 3 (2015) | 58.3 | 33.8 | 18 | 9.8 |
| Dota 2 Reborn (2015) | 114 | 102 | 62.3 | 56 |
| X-Plane 11.11 (2018) | 64.8 | 45.5 | 42.5 |
| Asus ZenBook Duo UX481FL GeForce MX250, i7-10510U, Intel SSD 660p 1TB SSDPEKNW010T8 | Asus ZenBook 14 UM431DA-AM020T Vega 10, R7 3700U, SK hynix BC501 HFM512GDHTNG-8310A | Huawei Matebook X Pro i5 GeForce MX150, i5-8250U, Samsung PM961 MZVLW256HEHP | MSI Prestige 14 A10SC-009 GeForce GTX 1650 Max-Q, i7-10710U, Samsung SSD PM981 MZVLB1T0HALR | Asus Zenbook 14 UX433FN-A6023T GeForce MX150, i7-8565U, Intel SSD 660p SSDPEKNW512G8 | |
|---|---|---|---|---|---|
| Noise | 1% | -3% | -7% | -5% | |
| av / miljö * (dB) | 28.3 | 29.8 -5% | 27.9 1% | 30.3 -7% | 30.7 -8% |
| Idle Minimum * (dB) | 28.3 | 28 1% | 27.9 1% | 30.3 -7% | 30.7 -8% |
| Idle Average * (dB) | 28.3 | 28 1% | 27.9 1% | 30.3 -7% | 30.7 -8% |
| Idle Maximum * (dB) | 28.3 | 28 1% | 27.9 1% | 30.3 -7% | 30.7 -8% |
| Load Average * (dB) | 39.1 | 36.8 6% | 36.2 7% | 40.2 -3% | 38.8 1% |
| Witcher 3 ultra * (dB) | 39.1 | 45 -15% | |||
| Load Maximum * (dB) | 39.1 | 39 -0% | 45.2 -16% | 43.5 -11% | 39.3 -1% |
* ... mindre är bättre
Ljudnivå
| Låg belastning |
| 28.3 / 28.3 / 28.3 dB(A) |
| Hög belastning |
| 39.1 / 39.1 dB(A) |
 | ||
30 dB tyst 40 dB(A) hörbar 50 dB(A) högt ljud |
||
min: | ||
(+) Den maximala temperaturen på ovansidan är 38.4 °C / 101 F, jämfört med genomsnittet av 36.8 °C / 98 F , allt från 21 till 71 °C för klassen Multimedia.
(-) Botten värms upp till maximalt 48 °C / 118 F, jämfört med genomsnittet av 39.1 °C / 102 F
(+) Vid tomgångsbruk är medeltemperaturen för ovansidan 27.8 °C / 82 F, jämfört med enhetsgenomsnittet på 31.3 °C / ### class_avg_f### F.
(±) När du spelar The Witcher 3 är medeltemperaturen för ovansidan 32.6 °C / 91 F, jämfört med enhetsgenomsnittet på 31.3 °C / ## #class_avg_f### F.
(+) Handledsstöden och pekplattan är kallare än hudtemperaturen med maximalt 28 °C / 82.4 F och är därför svala att ta på.
(±) Medeltemperaturen för handledsstödsområdet på liknande enheter var 28.7 °C / 83.7 F (+0.7 °C / 1.3 F).
Asus ZenBook Duo UX481FL ljudanalys
(±) | högtalarljudstyrkan är genomsnittlig men bra (78.7 dB)
Bas 100 - 315 Hz
(±) | reducerad bas - i genomsnitt 9.8% lägre än medianen
(-) | basen är inte linjär (16.6% delta till föregående frekvens)
Mellan 400 - 2000 Hz
(±) | högre mellan - i genomsnitt 5.5% högre än median
(+) | mids är linjära (6.1% delta till föregående frekvens)
Högsta 2 - 16 kHz
(+) | balanserade toppar - endast 1.9% från medianen
(+) | toppar är linjära (4.7% delta till föregående frekvens)
Totalt 100 - 16 000 Hz
(±) | linjäriteten för det totala ljudet är genomsnittlig (18.9% skillnad mot median)
Jämfört med samma klass
» 59% av alla testade enheter i den här klassen var bättre, 7% liknande, 33% sämre
» Den bästa hade ett delta på 5%, genomsnittet var 17%, sämst var 45%
Jämfört med alla testade enheter
» 44% av alla testade enheter var bättre, 8% liknande, 48% sämre
» Den bästa hade ett delta på 4%, genomsnittet var 24%, sämst var 134%
Apple MacBook 12 (Early 2016) 1.1 GHz ljudanalys
(+) | högtalare kan spela relativt högt (83.6 dB)
Bas 100 - 315 Hz
(±) | reducerad bas - i genomsnitt 11.3% lägre än medianen
(±) | linjäriteten för basen är genomsnittlig (14.2% delta till föregående frekvens)
Mellan 400 - 2000 Hz
(+) | balanserad mellan - endast 2.4% från medianen
(+) | mids är linjära (5.5% delta till föregående frekvens)
Högsta 2 - 16 kHz
(+) | balanserade toppar - endast 2% från medianen
(+) | toppar är linjära (4.5% delta till föregående frekvens)
Totalt 100 - 16 000 Hz
(+) | det totala ljudet är linjärt (10.2% skillnad mot median)
Jämfört med samma klass
» 7% av alla testade enheter i den här klassen var bättre, 2% liknande, 91% sämre
» Den bästa hade ett delta på 5%, genomsnittet var 18%, sämst var 53%
Jämfört med alla testade enheter
» 5% av alla testade enheter var bättre, 1% liknande, 94% sämre
» Den bästa hade ett delta på 4%, genomsnittet var 24%, sämst var 134%
| Av/Standby | |
| Låg belastning | |
| Hög belastning |
|
Förklaring:
min: | |
| Asus ZenBook Duo UX481FL i7-10510U, GeForce MX250, Intel SSD 660p 1TB SSDPEKNW010T8, IPS, 1920x1080, 14" | Asus ZenBook 14 UM431DA-AM020T R7 3700U, Vega 10, SK hynix BC501 HFM512GDHTNG-8310A, IPS, 1920x1080, 14" | Huawei Matebook X Pro i5 i5-8250U, GeForce MX150, Samsung PM961 MZVLW256HEHP, IPS, 3000x2000, 13.9" | Lenovo ThinkPad X1 Carbon G7 20R1-000YUS i7-10510U, UHD Graphics 620, WDC PC SN730 SDBPNTY-512G, IPS, 3840x2160, 14" | MSI Prestige 14 A10SC-009 i7-10710U, GeForce GTX 1650 Max-Q, Samsung SSD PM981 MZVLB1T0HALR, IPS, 3840x2160, 14" | Lenovo IdeaPad S940-14IWL i7-8565U, UHD Graphics 620, Samsung SSD PM981 MZVLB512HAJQ, IPS, 3840x2160, 14" | |
|---|---|---|---|---|---|---|
| Power Consumption | 17% | -1% | -4% | -26% | -4% | |
| Idle Minimum * (Watt) | 3.5 | 3.6 -3% | 3.5 -0% | 3.5 -0% | 5.2 -49% | 5.2 -49% |
| Idle Average * (Watt) | 10 | 7.2 28% | 8.9 11% | 10.8 -8% | 12.2 -22% | 10.2 -2% |
| Idle Maximum * (Watt) | 11 | 10.8 2% | 12.3 -12% | 12.5 -14% | 14.3 -30% | 11.9 -8% |
| Load Average * (Watt) | 53 | 38 28% | 54.2 -2% | 47.2 11% | 67 -26% | 42.1 21% |
| Witcher 3 ultra * (Watt) | 35.6 | 42.4 -19% | ||||
| Load Maximum * (Watt) | 63.6 | 45.2 29% | 52.1 18% | 68.8 -8% | 67 -5% | 53.6 16% |
* ... mindre är bättre
| Asus ZenBook Duo UX481FL i7-10510U, GeForce MX250, 70 Wh | Asus ZenBook 14 UM431DA-AM020T R7 3700U, Vega 10, 47 Wh | Huawei Matebook X Pro i5 i5-8250U, GeForce MX150, 57.4 Wh | Lenovo ThinkPad X1 Carbon G7 20R1-000YUS i7-10510U, UHD Graphics 620, 51 Wh | MSI Prestige 14 A10SC-009 i7-10710U, GeForce GTX 1650 Max-Q, 52 Wh | Lenovo IdeaPad S940-14IWL i7-8565U, UHD Graphics 620, 52 Wh | |
|---|---|---|---|---|---|---|
| Batteridrifttid | -30% | -16% | 5% | -45% | -54% | |
| Reader / Idle (h) | 22.1 | 17.8 -19% | 20.7 -6% | 9.9 -55% | 8.4 -62% | |
| WiFi v1.3 (h) | 9.5 | 6.7 -29% | 9.3 -2% | 10 5% | 5.9 -38% | 5 -47% |
| Load (h) | 3.7 | 2.1 -43% | 2.2 -41% | 2.1 -43% | 1.7 -54% |
För
Emot
Läs den fullständiga versionen av den här recensionen på engelska här.
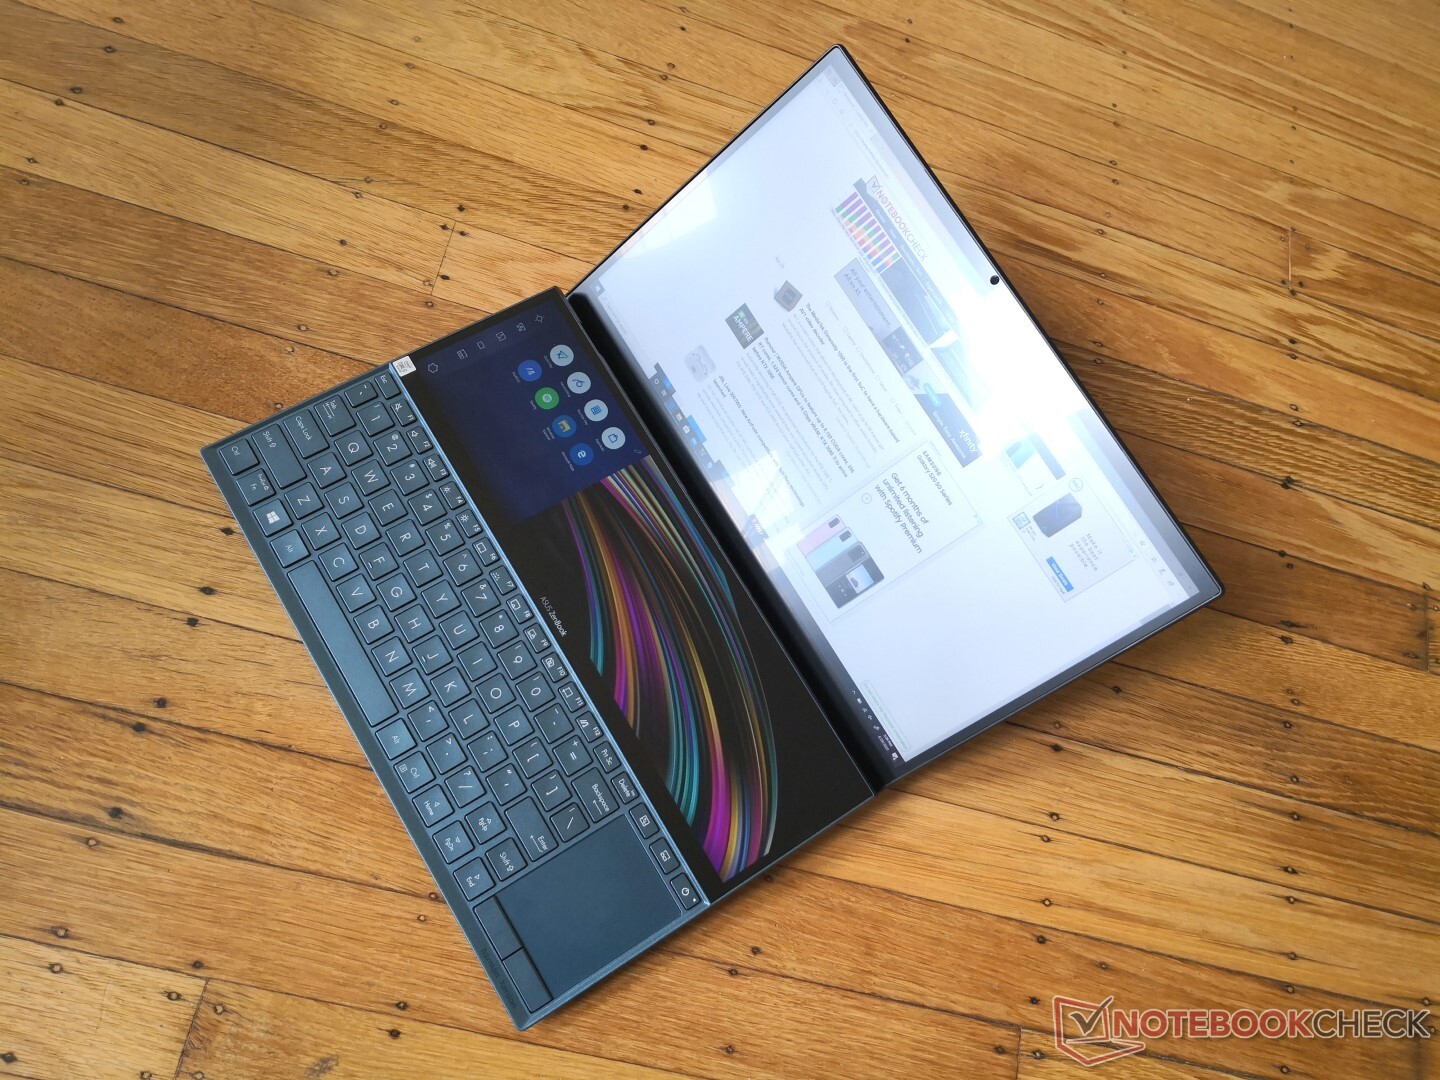
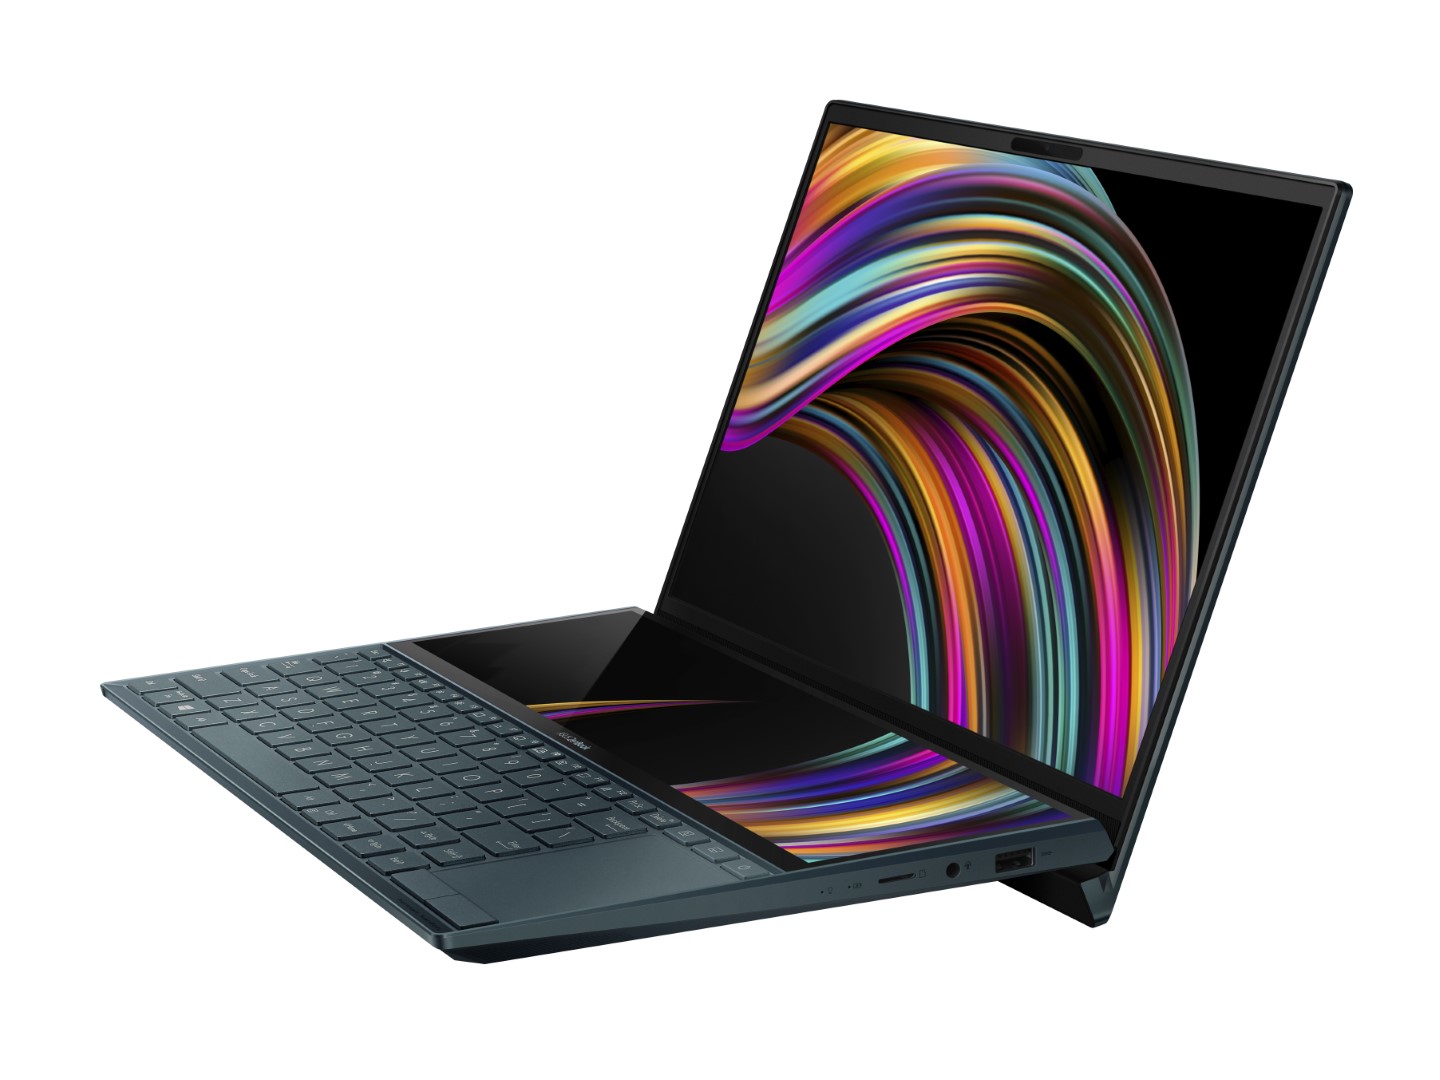
Som vilken desktop-användare som helst kan styrka kan det verkligen öka produktiviteten att ha två skärmar, och på den punkten är inte ZenBook Duo annorlunda. Det är svårt att gå tillbaka till en skärm efter att ha vant sig vid det rymliga dubbelskärms-upplägget, vilket är precis vad Asus hoppas på.
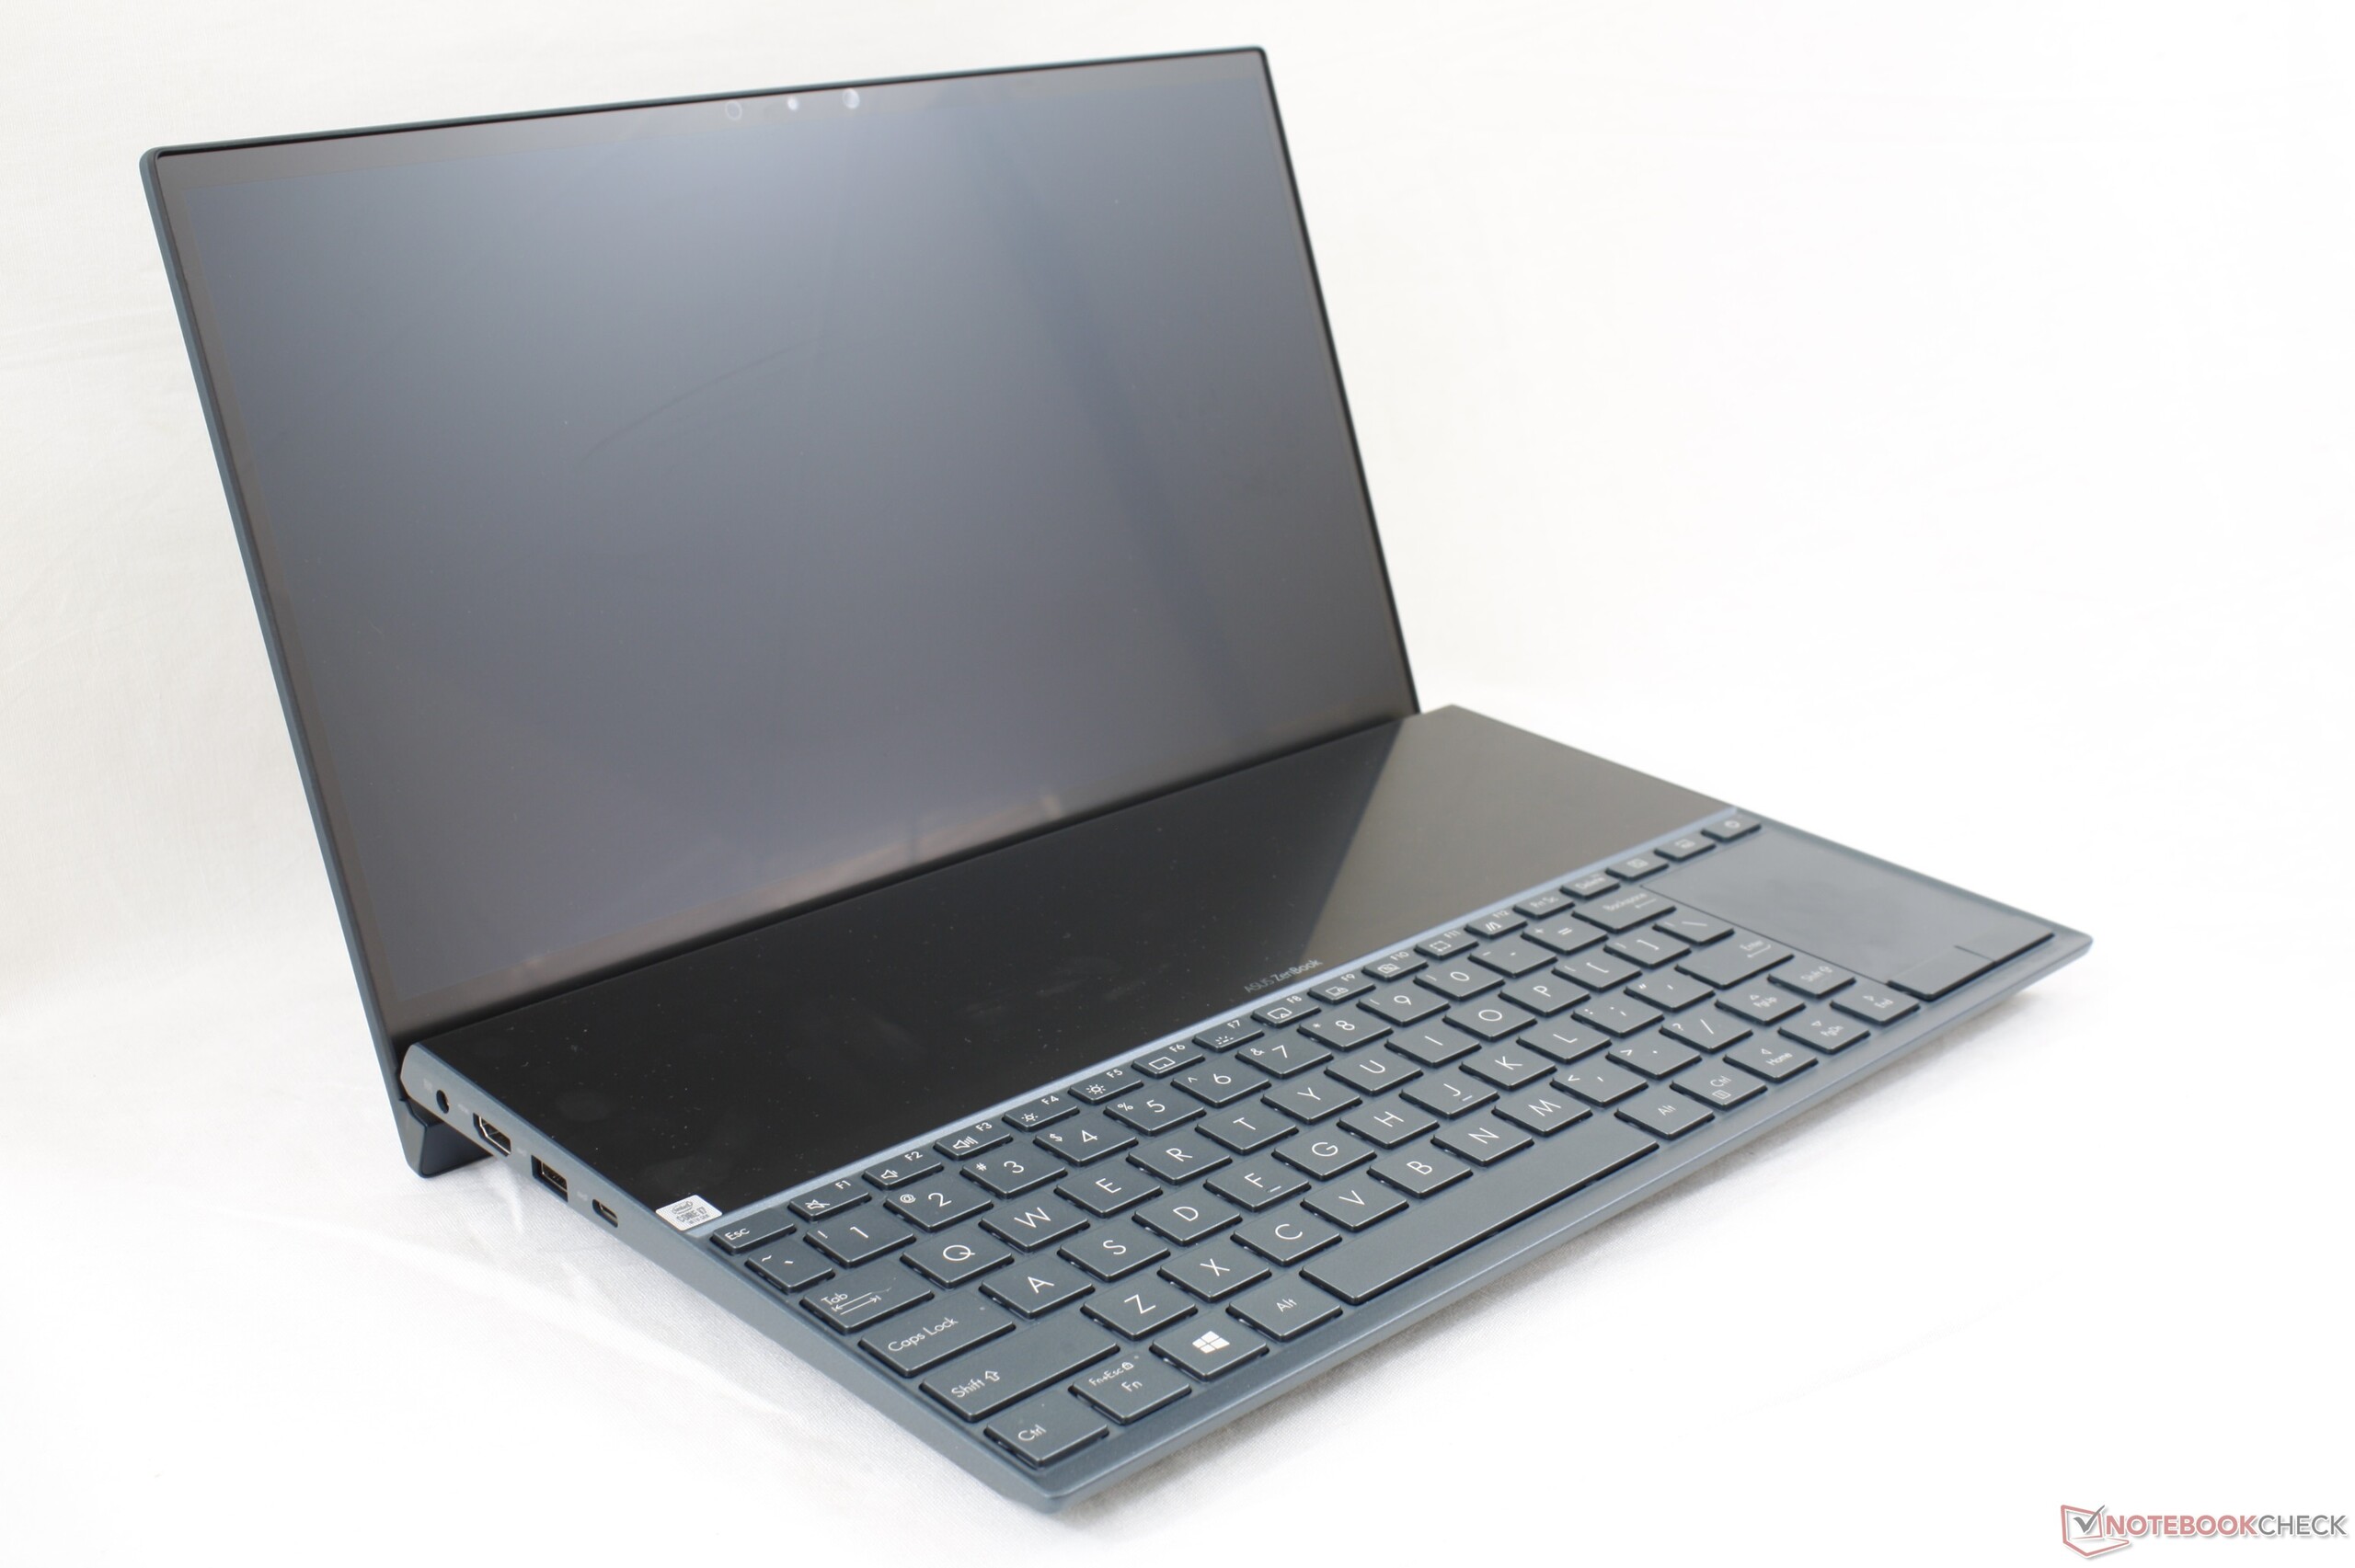
Men sedd som en laptop får man acceptera en del kompromisser. För det första är vikten en tydlig brist då systemet väger flera hundra gram mer än vanliga ZenBook 14. För det andra är färgerna på den andra skärmen inte lika levande som på den Pantone-certifierade huvudskärmen. För det tredje kommer den breda betraktningsvinkeln mellan användaren och den andra skärmen både framhäva speglingar och minska upplevd ljusstyrka om inte den omgivande miljön är perfekt. För det fjärde kan den ovanliga placeringen av tangentbordet ta en del tid att vänja sig vid, särskilt om man skriver där det är ont om plats. Och till sist fungerar skärmarna inte särskilt bra utomhus trots att datorn har en kompakt storlek på 14 tum och förvånansvärt lång batteritid. OLED hade potentiellt sett kunnat åtgärda många av dessa brister, men en sådan approach hade troligen ökat priset betydligt.
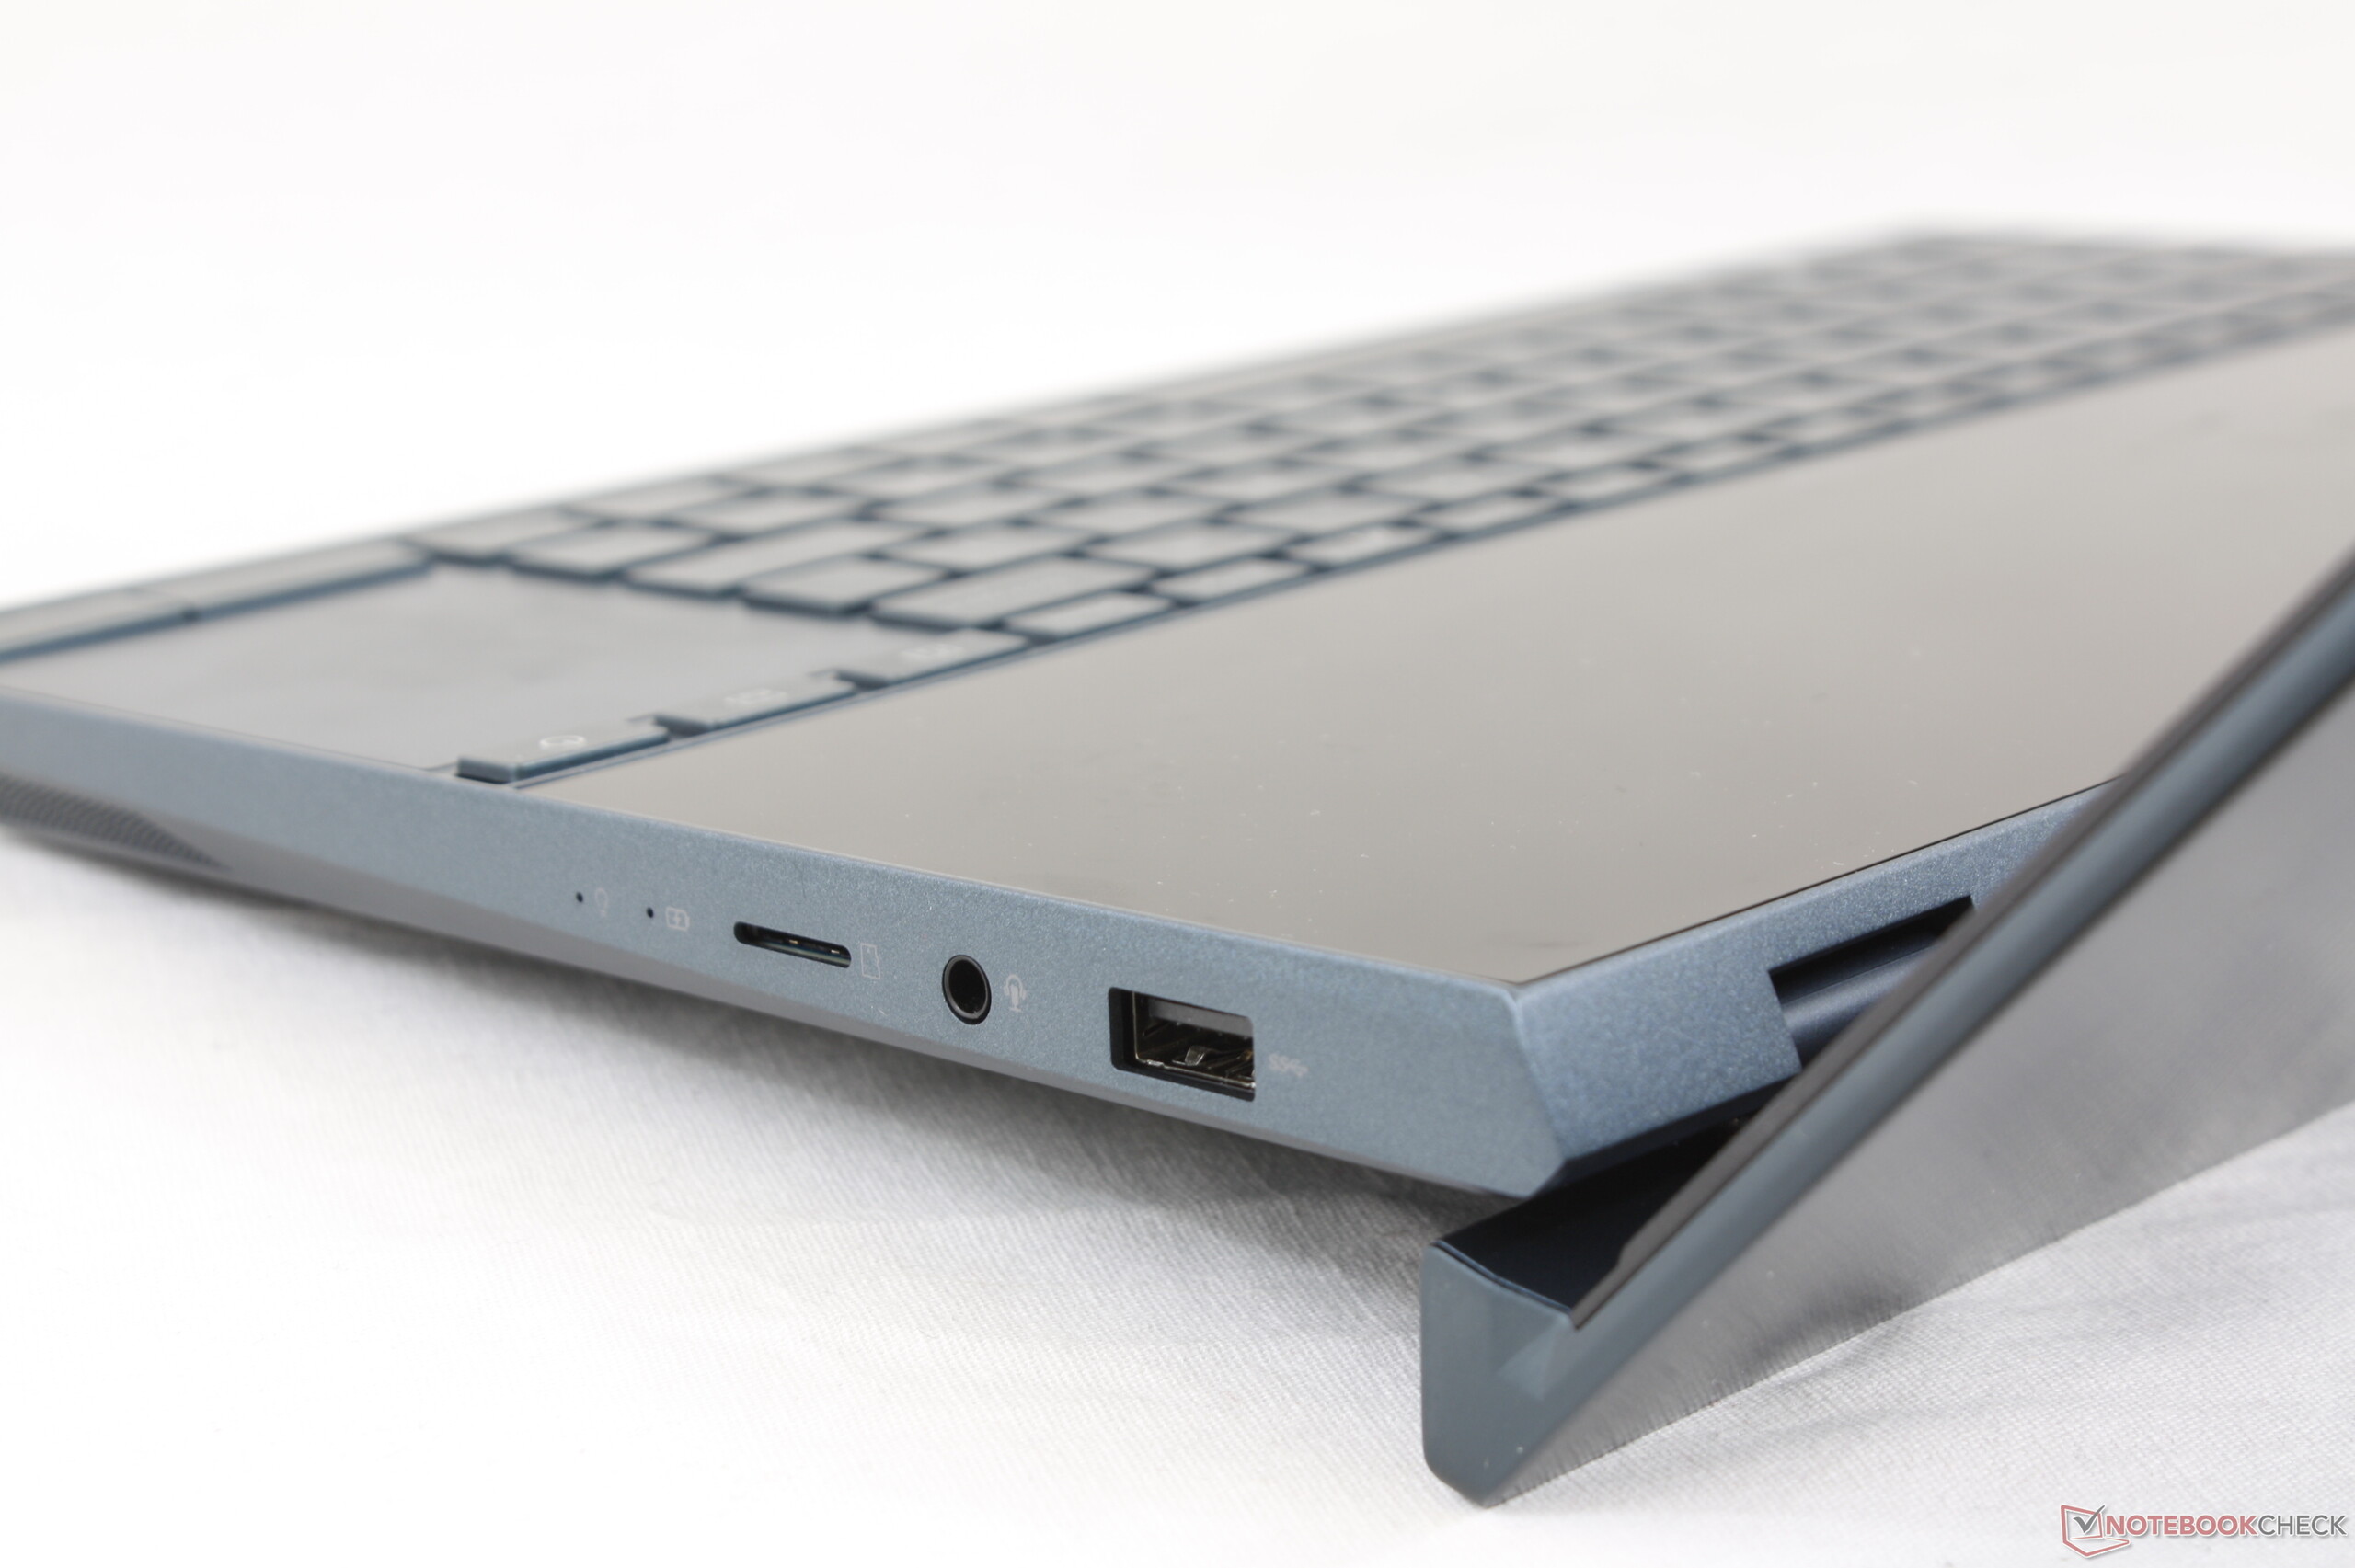
Det finns några funktioner vi saknar och hoppas att få se på kommande revideringar. Som exempel saknas ett fysiskt integritetsskydd för webbkameran och möjligheten att ladda genom USB Typ C, saker som är standard på de flesta andra flaggskepps-modeller.
Om ovanstående brister inte stör dig eller du tror att du kommer vänja dig så lär du märka att portabla ZenBook Duo och dess andra skärm är ovärderliga för multitasking-bruk.
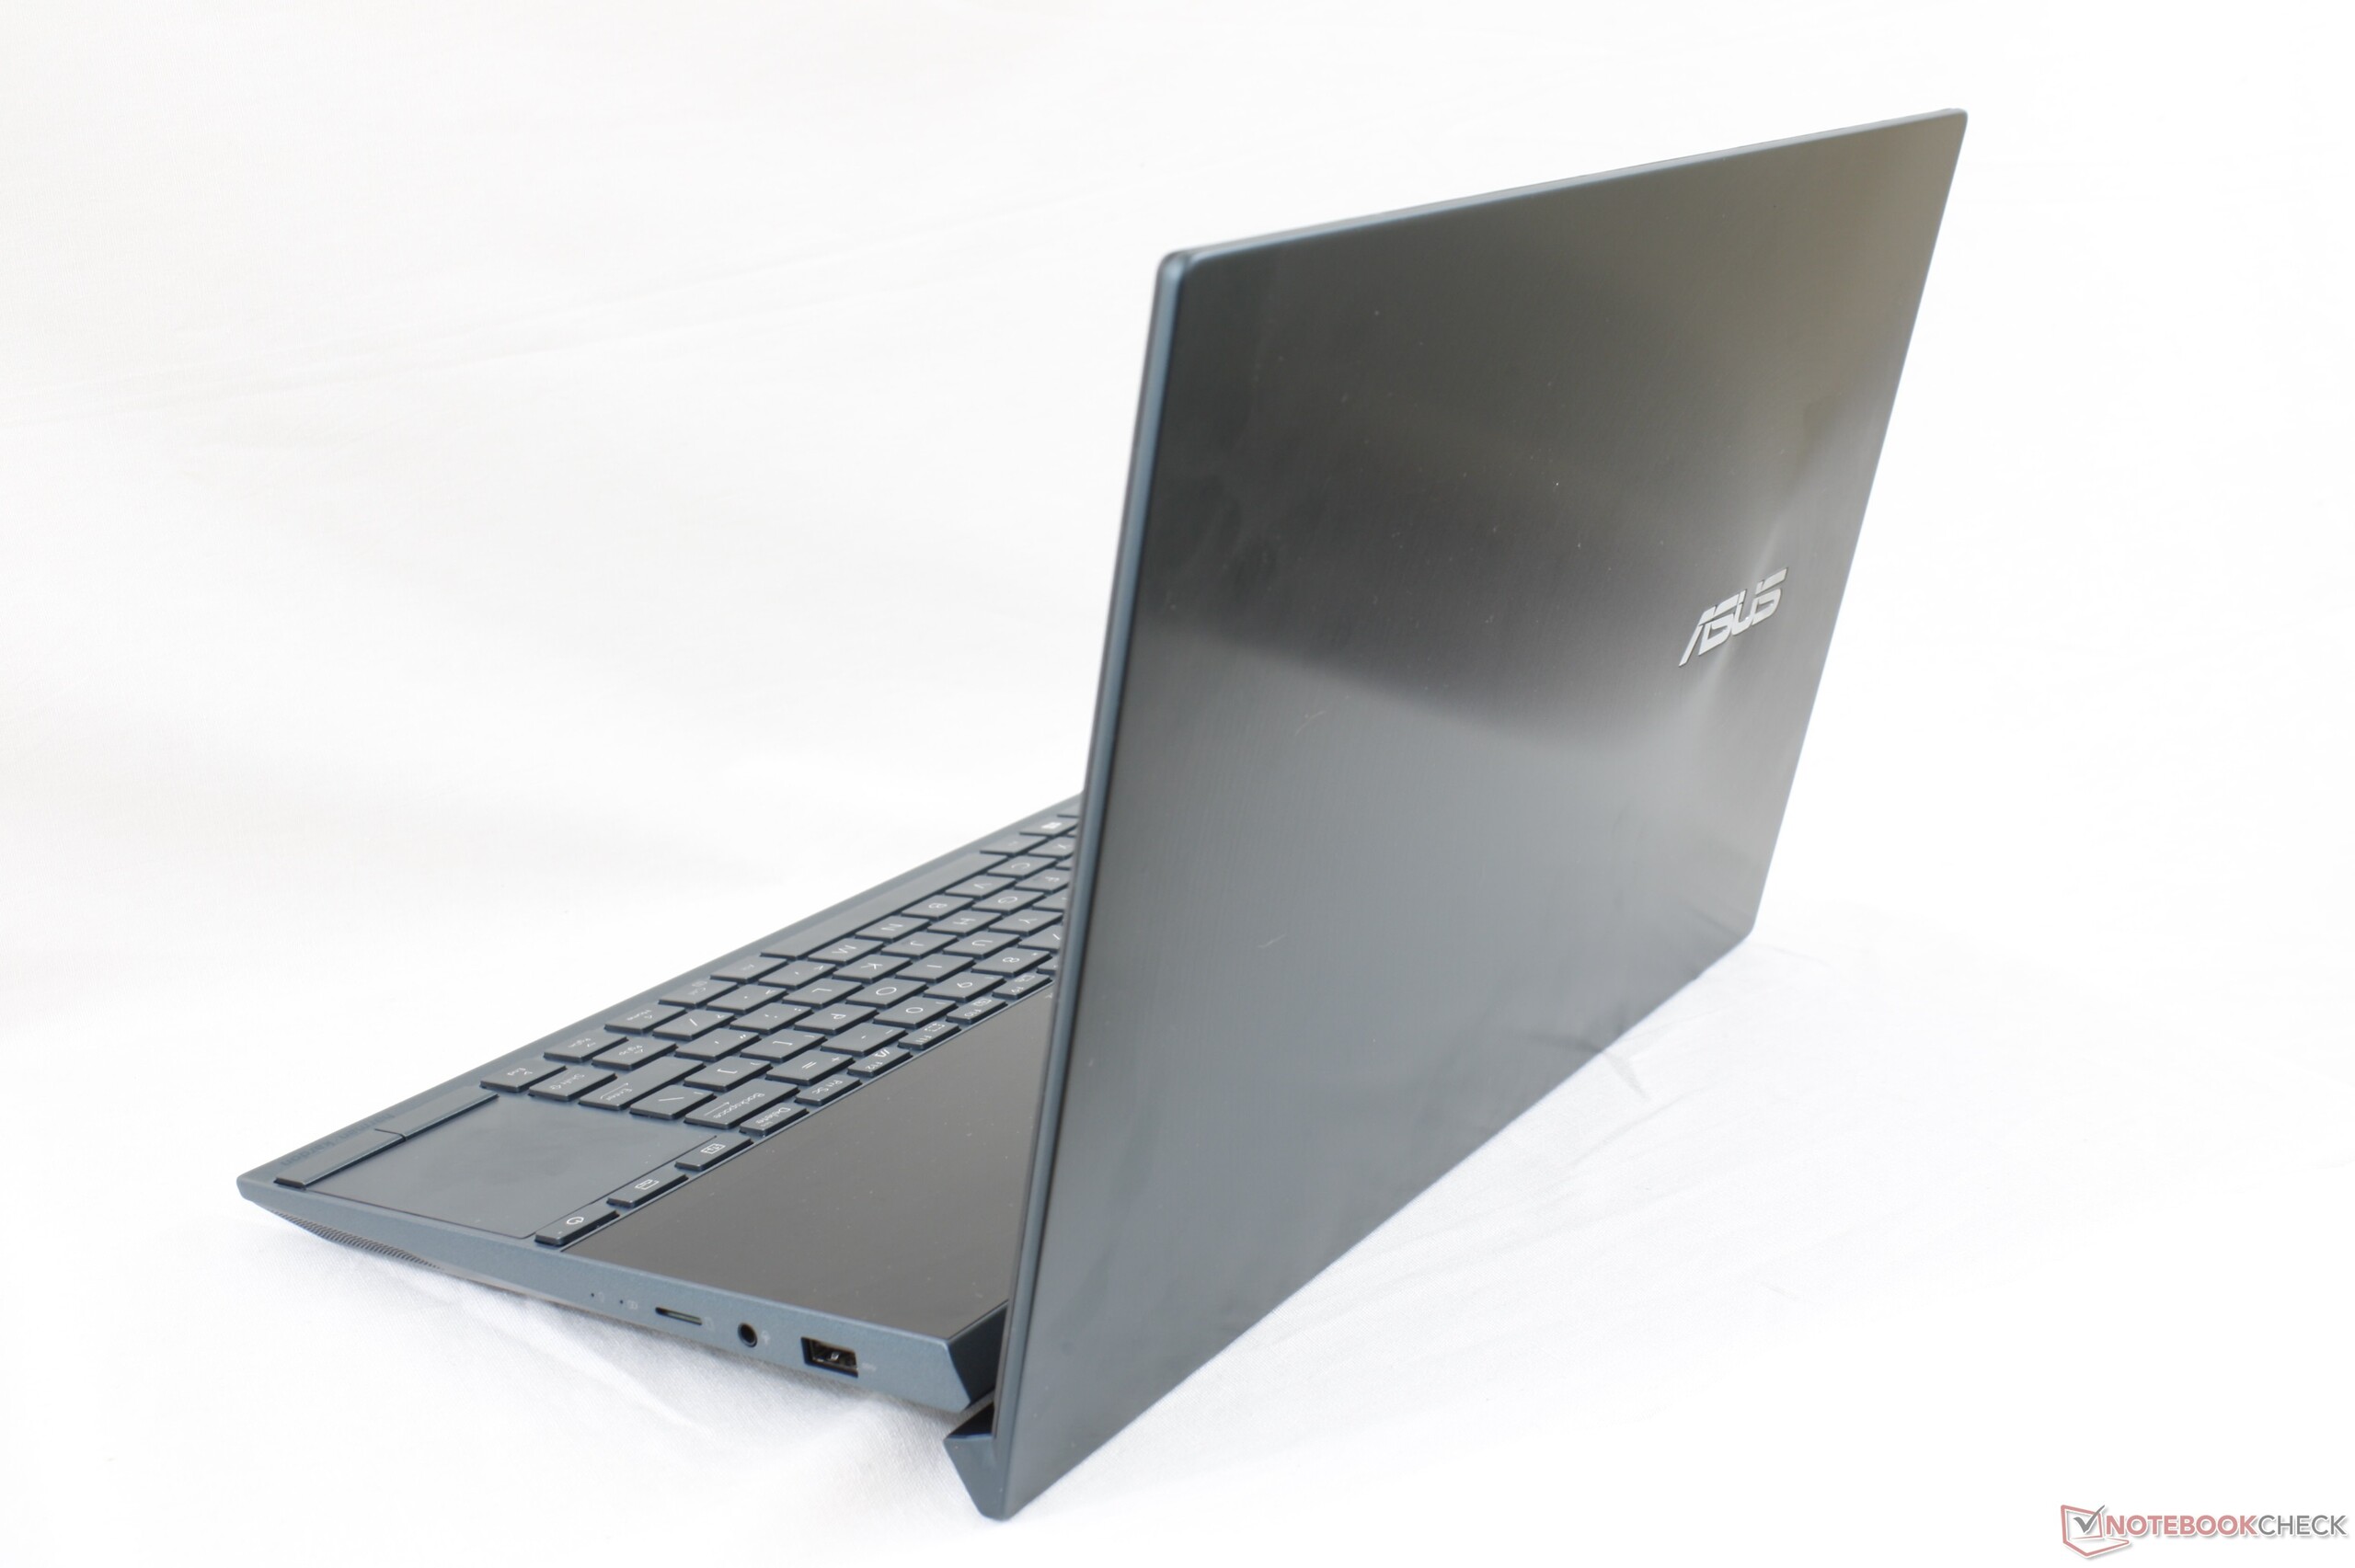
Asus ZenBook Duo är som bäst när man arbetar i en miljö där man har kontroll över ljuset och använder en extern mus för att kunna maximera synligheten och ergonomin hos den andra skärmen. Om du reser ofta och vill spara plats kan ZenBook Duo kännas logisk. Om du däremot har gott om plats på bordet kommer du istället längre med vanliga ZenBook 14 och en ordentlig extern skärm.
Asus ZenBook Duo UX481FL
- 05/01/2020 v7 (old)
Allen Ngo
Price comparison
