Test: HP Omen X 2S 15 - Dubbelt Trubbel (Sammanfattning)
| Networking | |
| iperf3 transmit AX12 | |
| Razer Blade 15 RTX 2080 Max-Q | |
| HP Omen 15-dc1020ng | |
| HP Omen X 2S 15-dg0075cl | |
| HP Omen 15-dc1303ng | |
| iperf3 receive AX12 | |
| Razer Blade 15 RTX 2080 Max-Q | |
| HP Omen X 2S 15-dg0075cl | |
| HP Omen 15-dc1303ng | |
| HP Omen 15-dc1020ng | |
| |||||||||||||||||||||||||
Distribution av ljusstyrkan: 84 %
Mitt på batteriet: 324.8 cd/m²
Kontrast: 1249:1 (Svärta: 0.26 cd/m²)
ΔE ColorChecker Calman: 4.96 | ∀{0.5-29.43 Ø4.73}
calibrated: 3.23
ΔE Greyscale Calman: 5 | ∀{0.09-98 Ø4.97}
91.8% sRGB (Argyll 1.6.3 3D)
59.8% AdobeRGB 1998 (Argyll 1.6.3 3D)
67.2% AdobeRGB 1998 (Argyll 3D)
92.3% sRGB (Argyll 3D)
66.2% Display P3 (Argyll 3D)
Gamma: 2.21
CCT: 7742 K
| HP Omen X 2S 15-dg0075cl AU Optronics AUO82ED, IPS, 15.6", 1920x1080 | HP Omen 15-dc1020ng LGD05CE, IPS, 15.6", 1920x1080 | Razer Blade 15 RTX 2080 Max-Q Sharp LQ156M1JW03 (SHP14C5), IPS, 15.6", 1920x1080 | Alienware m15 R2 P87F Sharp LQ156M1, IPS, 15.6", 1920x1080 | MSI GT63 Titan 8RG-046 N156HHE-GA1, TN, 15.6", 1920x1080 | Lenovo Legion Y740-15ICHg LP156WFG-SPB2, IPS, 15.6", 1920x1080 | |
|---|---|---|---|---|---|---|
| Display | -40% | 3% | 0% | 25% | -3% | |
| Display P3 Coverage (%) | 66.2 | 38.37 -42% | 66.9 1% | 65.3 -1% | 91.3 38% | 63.5 -4% |
| sRGB Coverage (%) | 92.3 | 57.6 -38% | 98.1 6% | 95.1 3% | 99.9 8% | 92.4 0% |
| AdobeRGB 1998 Coverage (%) | 67.2 | 39.69 -41% | 68.5 2% | 65.9 -2% | 85.7 28% | 64.7 -4% |
| Response Times | -169% | 10% | 6% | 46% | -23% | |
| Response Time Grey 50% / Grey 80% * (ms) | 15.2 ? | 40 ? -163% | 12.8 ? 16% | 16.4 ? -8% | 8.4 ? 45% | 18.8 ? -24% |
| Response Time Black / White * (ms) | 10.8 ? | 29.6 ? -174% | 10.4 ? 4% | 8.8 ? 19% | 5.8 ? 46% | 13.2 ? -22% |
| PWM Frequency (Hz) | 23810 ? | 23810 ? | 25510 ? | |||
| Screen | -23% | 19% | -11% | 10% | 2% | |
| Brightness middle (cd/m²) | 324.8 | 251 -23% | 293 -10% | 324.2 0% | 307.1 -5% | 320.4 -1% |
| Brightness (cd/m²) | 316 | 232 -27% | 270 -15% | 304 -4% | 276 -13% | 298 -6% |
| Brightness Distribution (%) | 84 | 76 -10% | 87 4% | 90 7% | 80 -5% | 85 1% |
| Black Level * (cd/m²) | 0.26 | 0.17 35% | 0.29 -12% | 0.38 -46% | 0.37 -42% | 0.42 -62% |
| Contrast (:1) | 1249 | 1476 18% | 1010 -19% | 853 -32% | 830 -34% | 763 -39% |
| Colorchecker dE 2000 * | 4.96 | 6.2 -25% | 1.69 66% | 5.01 -1% | 2.53 49% | 3.21 35% |
| Colorchecker dE 2000 max. * | 8.95 | 18.6 -108% | 3.37 62% | 12.7 -42% | 4.66 48% | 5.54 38% |
| Colorchecker dE 2000 calibrated * | 3.23 | 4.8 -49% | 1.24 62% | 1.64 49% | 2.82 13% | 2.36 27% |
| Greyscale dE 2000 * | 5 | 4.2 16% | 2.3 54% | 7.9 -58% | 1.7 66% | 3.6 28% |
| Gamma | 2.21 100% | 2.32 95% | 2.3 96% | 2.35 94% | 2.194 100% | 2.27 97% |
| CCT | 7742 84% | 7454 87% | 6758 96% | 8455 77% | 6893 94% | 6503 100% |
| Color Space (Percent of AdobeRGB 1998) (%) | 59.8 | 36.5 -39% | 63 5% | 60.8 2% | 76 27% | 59 -1% |
| Color Space (Percent of sRGB) (%) | 91.8 | 57.4 -37% | 98.5 7% | 95.5 4% | 100 9% | 92 0% |
| Totalt genomsnitt (program/inställningar) | -77% /
-44% | 11% /
15% | -2% /
-7% | 27% /
17% | -8% /
-2% |
* ... mindre är bättre
Visa svarstider
| ↔ Svarstid svart till vitt | ||
|---|---|---|
| 10.8 ms ... stiga ↗ och falla ↘ kombinerat | ↗ 6 ms stiga | 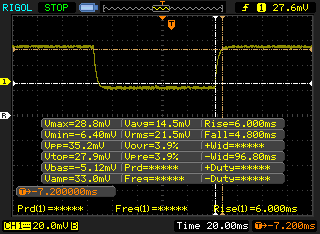 |
| ↘ 4.8 ms hösten | ||
| Skärmen visar bra svarsfrekvens i våra tester, men kan vara för långsam för konkurrenskraftiga spelare. I jämförelse sträcker sig alla testade enheter från 0.1 (minst) till 240 (maximalt) ms. » 29 % av alla enheter är bättre. Det betyder att den uppmätta svarstiden är bättre än genomsnittet av alla testade enheter (19.9 ms). | ||
| ↔ Svarstid 50 % grått till 80 % grått | ||
| 15.2 ms ... stiga ↗ och falla ↘ kombinerat | ↗ 7.6 ms stiga | 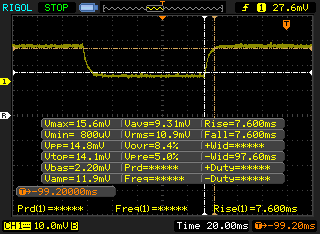 |
| ↘ 7.6 ms hösten | ||
| Skärmen visar bra svarsfrekvens i våra tester, men kan vara för långsam för konkurrenskraftiga spelare. I jämförelse sträcker sig alla testade enheter från 0.165 (minst) till 636 (maximalt) ms. » 29 % av alla enheter är bättre. Det betyder att den uppmätta svarstiden är bättre än genomsnittet av alla testade enheter (31.1 ms). | ||
Skärmflimmer / PWM (Puls-Width Modulation)
| Skärmflimmer / PWM upptäcktes inte | 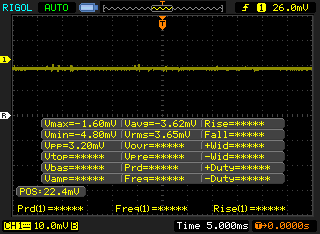 | ||
Som jämförelse: 52 % av alla testade enheter använder inte PWM för att dämpa skärmen. Om PWM upptäcktes mättes ett medelvärde av 7801 (minst: 5 - maximum: 343500) Hz. | |||
| PCMark 8 Home Score Accelerated v2 | 5039 poäng | |
| PCMark 8 Work Score Accelerated v2 | 5931 poäng | |
| PCMark 10 Score | 5991 poäng | |
Hjälp | ||
| HP Omen X 2S 15-dg0075cl WDC PC SN720 SDAPNTW-1T00 | HP Omen 15-dc1020ng WDC PC SN720 SDAQNTW-512G | Razer Blade 15 RTX 2080 Max-Q Samsung SSD PM981 MZVLB512HAJQ | Alienware m15 R2 P87F 2x Toshiba XG6 KXG60ZNV512G (RAID 0) | MSI GT63 Titan 8RG-046 CUK Cyclone 500GB M.2 NVMe | Lenovo Legion Y740-15ICHg Samsung SSD PM981 MZVLB256HAHQ | |
|---|---|---|---|---|---|---|
| AS SSD | -7% | -1% | -15% | -8% | -20% | |
| Seq Read (MB/s) | 2105 | 2955 40% | 1832 -13% | 1925 -9% | 2399 14% | 1953 -7% |
| Seq Write (MB/s) | 2493 | 2440 -2% | 1864 -25% | 2371 -5% | 1665 -33% | 1629 -35% |
| 4K Read (MB/s) | 25.01 | 40.56 62% | 52.1 108% | 37.2 49% | 49.17 97% | 33.2 33% |
| 4K Write (MB/s) | 108.7 | 118.6 9% | 108.3 0% | 108.9 0% | 87.7 -19% | 88.1 -19% |
| 4K-64 Read (MB/s) | 1604 | 1283 -20% | 1159 -28% | 1177 -27% | 1144 -29% | 757 -53% |
| 4K-64 Write (MB/s) | 1593 | 1538 -3% | 1807 13% | 1135 -29% | 648 -59% | 1501 -6% |
| Access Time Read * (ms) | 0.046 | 0.084 -83% | 0.05 -9% | 0.065 -41% | 0.05 -9% | 0.077 -67% |
| Access Time Write * (ms) | 0.102 | 0.032 69% | 0.034 67% | 0.108 -6% | 0.042 59% | 0.043 58% |
| Score Read (Points) | 1840 | 1619 -12% | 1394 -24% | 1407 -24% | 1433 -22% | 985 -46% |
| Score Write (Points) | 1951 | 1901 -3% | 2102 8% | 1481 -24% | 902 -54% | 1752 -10% |
| Score Total (Points) | 4743 | 4323 -9% | 4221 -11% | 3633 -23% | 3040 -36% | 3230 -32% |
| Copy ISO MB/s (MB/s) | 2250 | 1418 -37% | 2083 -7% | 2073 -8% | 1872 -17% | |
| Copy Program MB/s (MB/s) | 896 | 392.5 -56% | 496.5 -45% | 576 -36% | 478.2 -47% | |
| Copy Game MB/s (MB/s) | 1854 | 907 -51% | 977 -47% | 1426 -23% | 1165 -37% |
* ... mindre är bättre

| 3DMark 11 | |
| 1280x720 Performance GPU | |
| MSI RTX 2080 Gaming X Trio | |
| HP Omen 17-cb0020ng | |
| MSI RTX 2070 Gaming Z 8G | |
| Alienware m15 R2 P87F | |
| Eurocom Nightsky RX15 | |
| Genomsnitt NVIDIA GeForce RTX 2070 Max-Q (14723 - 27694, n=31) | |
| Asus Strix Hero III G731GV | |
| HP Omen X 2S 15-dg0075cl | |
| HP Pavilion Gaming 17-cd0085cl | |
| HP Omen 17-w100ng | |
| HP Omen 15-dc1020ng | |
| MSI GT72S-6QEG16SR421BW | |
| 1280x720 Performance Combined | |
| Eurocom Nightsky RX15 | |
| HP Omen 17-cb0020ng | |
| MSI RTX 2070 Gaming Z 8G | |
| MSI RTX 2080 Gaming X Trio | |
| Genomsnitt NVIDIA GeForce RTX 2070 Max-Q (9107 - 17603, n=30) | |
| HP Omen X 2S 15-dg0075cl | |
| Asus Strix Hero III G731GV | |
| HP Pavilion Gaming 17-cd0085cl | |
| Alienware m15 R2 P87F | |
| MSI GT72S-6QEG16SR421BW | |
| HP Omen 15-dc1020ng | |
| HP Omen 17-w100ng | |
| 3DMark 11 Performance | 16707 poäng | |
| 3DMark Cloud Gate Standard Score | 33377 poäng | |
| 3DMark Fire Strike Score | 14914 poäng | |
| 3DMark Time Spy Score | 6349 poäng | |
Hjälp | ||
| Shadow of the Tomb Raider - 1920x1080 Highest Preset AA:T | |
| MSI RTX 2080 Gaming X Trio | |
| MSI GE75 9SG | |
| MSI RTX 2070 Gaming Z 8G | |
| Eurocom Nightsky RX15 | |
| Alienware m15 R2 P87F | |
| HP Omen X 2S 15-dg0075cl | |
| Genomsnitt NVIDIA GeForce RTX 2070 Max-Q (57 - 89, n=12) | |
| Asus Strix Hero III G731GV | |
| HP Pavilion Gaming 17-cd0085cl | |
| Asus ROG Zephyrus G15 GA502DU | |
| MSI GF75 Thin 9SC | |
| låg | med. | hög | ultra | |
|---|---|---|---|---|
| BioShock Infinite (2013) | 306.6 | 257.7 | 234.4 | 147.8 |
| The Witcher 3 (2015) | 295.3 | 222.9 | 136.6 | 69 |
| Shadow of the Tomb Raider (2018) | 128 | 98 | 91 | 83 |
| HP Omen X 2S 15-dg0075cl GeForce RTX 2070 Max-Q, i7-9750H, WDC PC SN720 SDAPNTW-1T00 | HP Omen 15-dc1020ng GeForce GTX 1650 Mobile, i5-9300H, WDC PC SN720 SDAQNTW-512G | Razer Blade 15 RTX 2080 Max-Q GeForce RTX 2080 Max-Q, i7-9750H, Samsung SSD PM981 MZVLB512HAJQ | Alienware m15 R2 P87F GeForce RTX 2080 Max-Q, i7-9750H, 2x Toshiba XG6 KXG60ZNV512G (RAID 0) | MSI GT63 Titan 8RG-046 GeForce GTX 1080 Mobile, i7-8750H, CUK Cyclone 500GB M.2 NVMe | Lenovo Legion Y740-15ICHg GeForce RTX 2070 Max-Q, i7-8750H, Samsung SSD PM981 MZVLB256HAHQ | |
|---|---|---|---|---|---|---|
| Noise | 11% | 9% | -9% | 3% | 5% | |
| av / miljö * (dB) | 29 | 28.8 1% | 28.3 2% | 28.3 2% | 28 3% | 28 3% |
| Idle Minimum * (dB) | 30.5 | 28.8 6% | 28.8 6% | 28.5 7% | 31.4 -3% | 32.6 -7% |
| Idle Average * (dB) | 31.5 | 29.5 6% | 28.8 9% | 28.5 10% | 31.4 -0% | 32.7 -4% |
| Idle Maximum * (dB) | 31.5 | 31.1 1% | 29 8% | 49 -56% | 32.2 -2% | 32.7 -4% |
| Load Average * (dB) | 40.6 | 35.2 13% | 33.5 17% | 49 -21% | 35.5 13% | 33.3 18% |
| Witcher 3 ultra * (dB) | 49.5 | 35.2 29% | 45 9% | 49 1% | 47.6 4% | 41.6 16% |
| Load Maximum * (dB) | 53.4 | 41 23% | 45.2 15% | 55 -3% | 50.8 5% | 45.2 15% |
* ... mindre är bättre
Ljudnivå
| Låg belastning |
| 30.5 / 31.5 / 31.5 dB(A) |
| Hög belastning |
| 40.6 / 53.4 dB(A) |
 | ||
30 dB tyst 40 dB(A) hörbar 50 dB(A) högt ljud |
||
min: | ||
(-) Den maximala temperaturen på ovansidan är 48.8 °C / 120 F, jämfört med genomsnittet av 40.4 °C / 105 F , allt från 21.2 till 68.8 °C för klassen Gaming.
(-) Botten värms upp till maximalt 55 °C / 131 F, jämfört med genomsnittet av 43.2 °C / 110 F
(±) Vid tomgångsbruk är medeltemperaturen för ovansidan 35.3 °C / 96 F, jämfört med enhetsgenomsnittet på 33.9 °C / ### class_avg_f### F.
(-) När du spelar The Witcher 3 är medeltemperaturen för ovansidan 38.2 °C / 101 F, jämfört med enhetsgenomsnittet på 33.9 °C / ## #class_avg_f### F.
(+) Handledsstöden och pekplattan når maximal hudtemperatur (34 °C / 93.2 F) och är därför inte varma.
(-) Medeltemperaturen för handledsstödsområdet på liknande enheter var 28.8 °C / 83.8 F (-5.2 °C / -9.4 F).
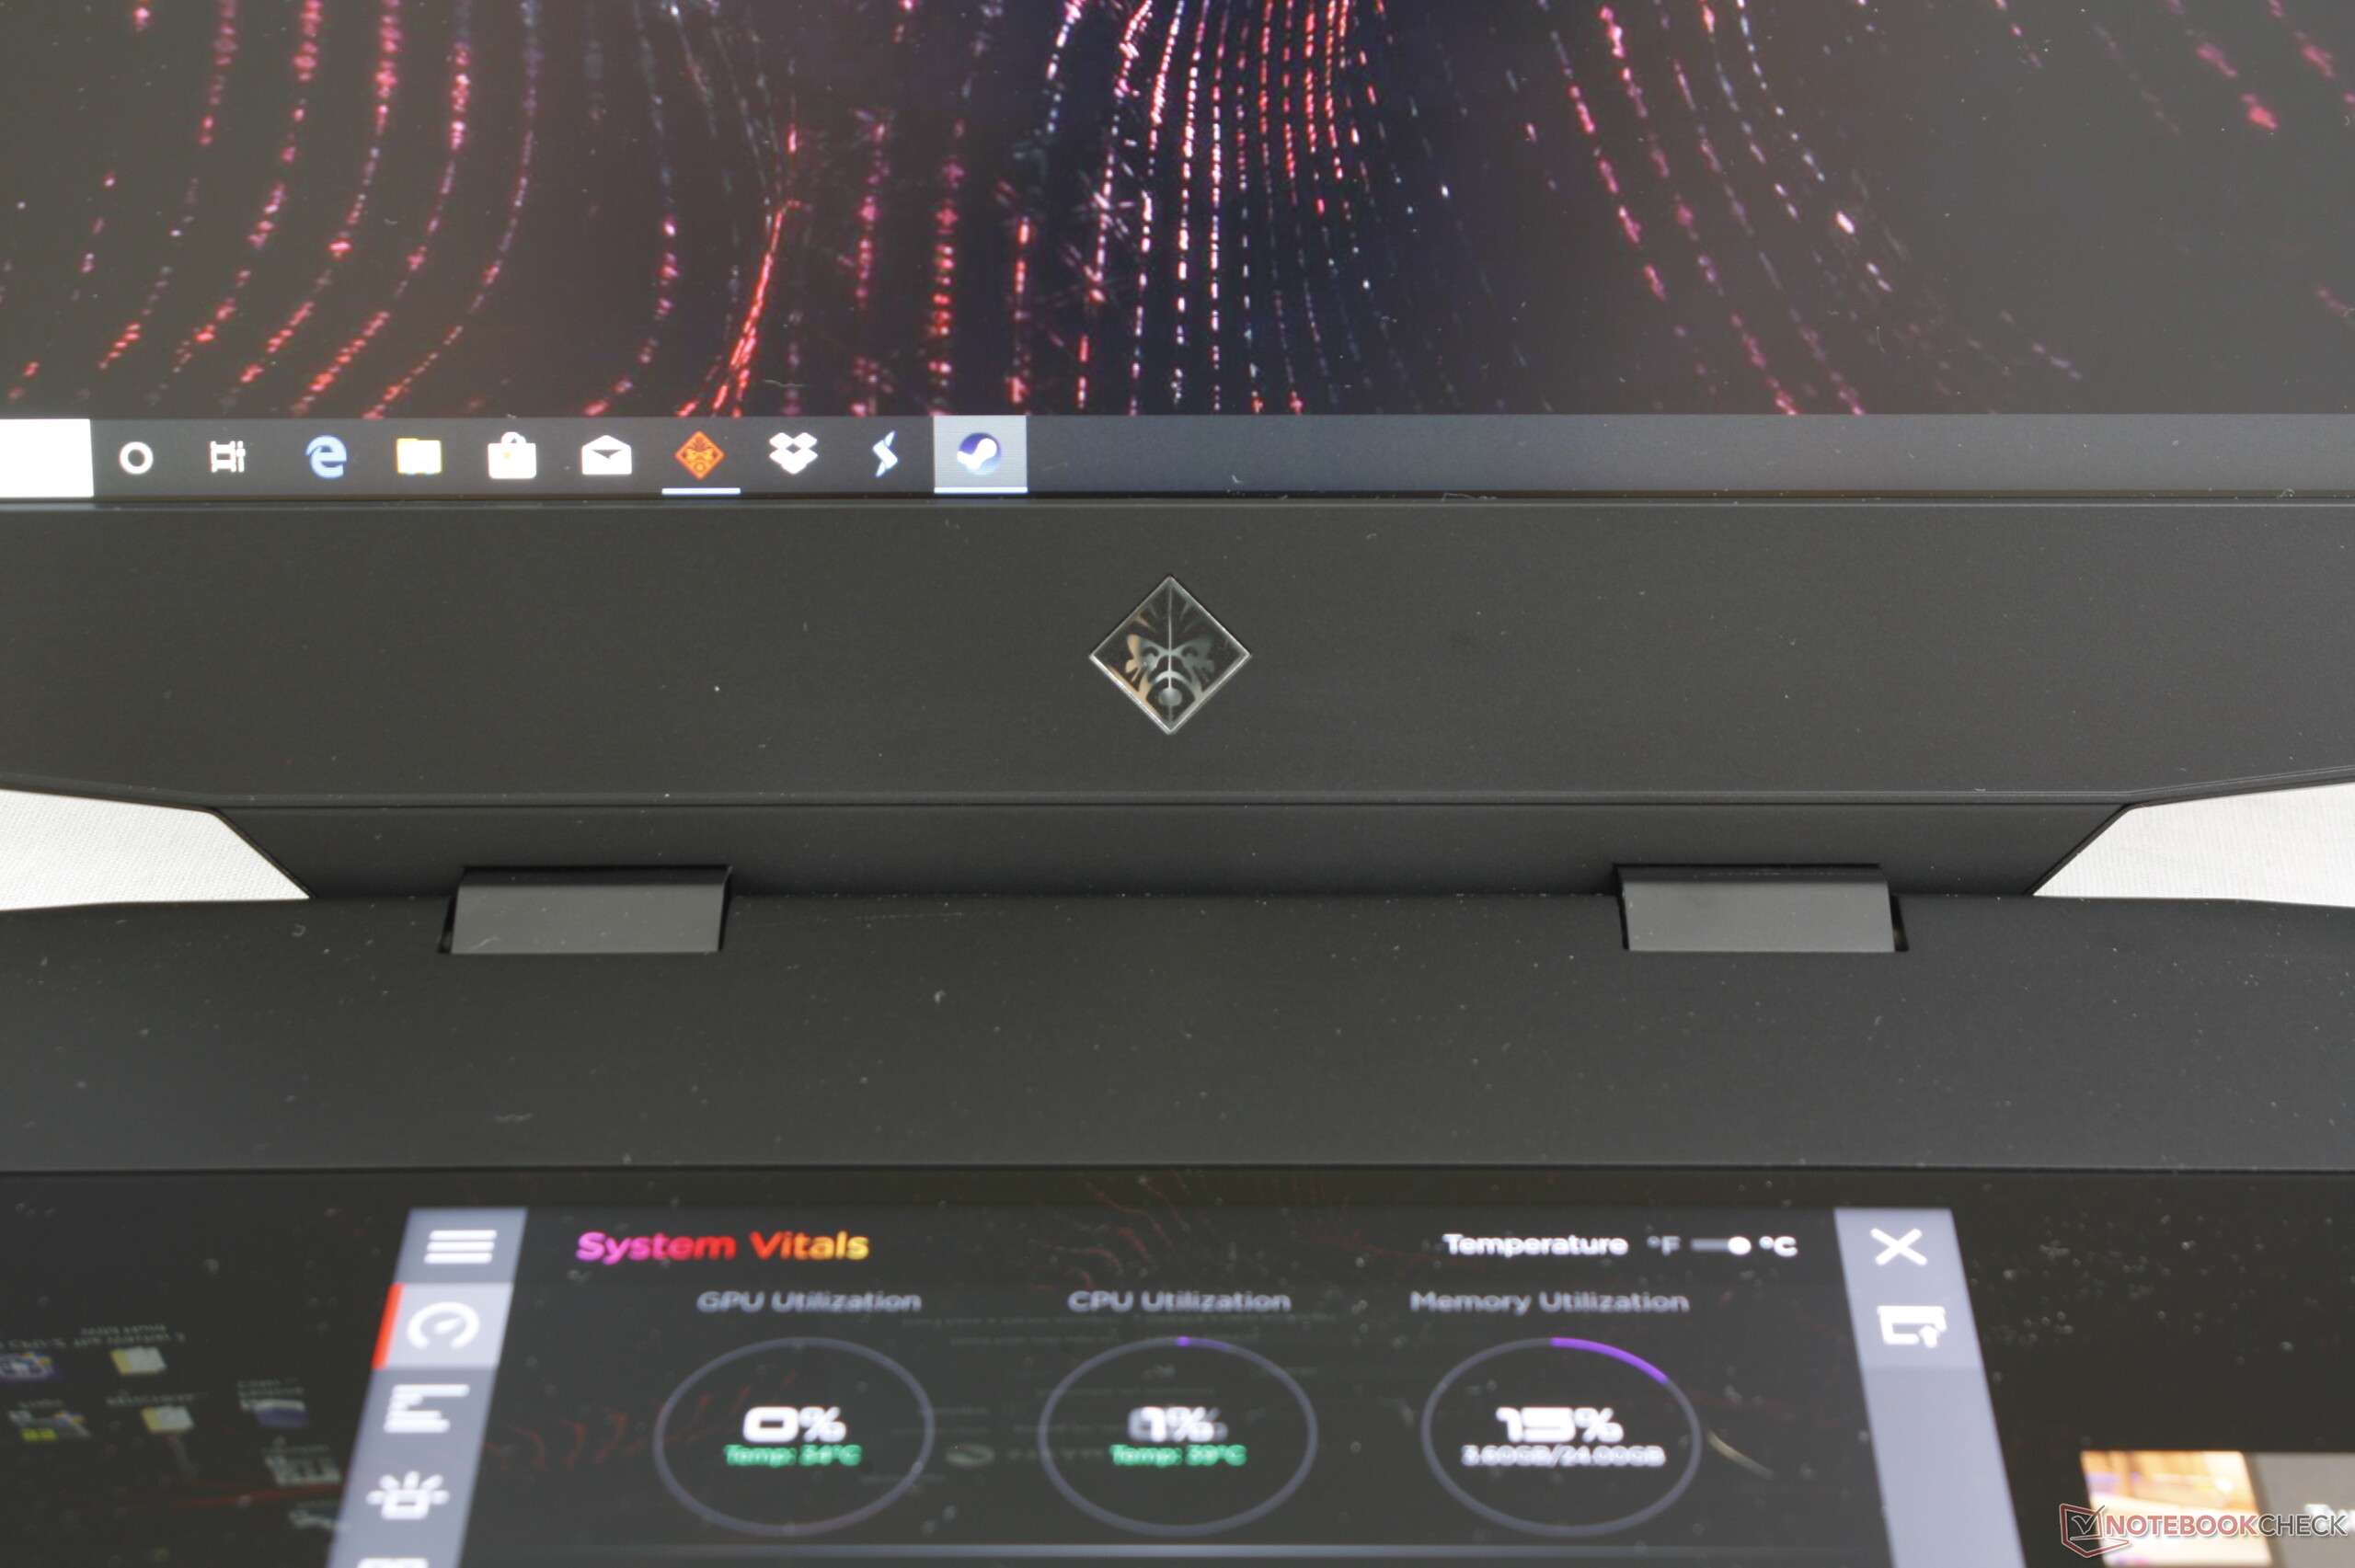
HP Omen X 2S 15-dg0075cl ljudanalys
(±) | högtalarljudstyrkan är genomsnittlig men bra (80.5 dB)
Bas 100 - 315 Hz
(-) | nästan ingen bas - i genomsnitt 16.8% lägre än medianen
(±) | linjäriteten för basen är genomsnittlig (12.2% delta till föregående frekvens)
Mellan 400 - 2000 Hz
(±) | reducerade mids - i genomsnitt 5.5% lägre än median
(±) | linjäriteten för mids är genomsnittlig (10.7% delta till föregående frekvens)
Högsta 2 - 16 kHz
(+) | balanserade toppar - endast 2.5% från medianen
(±) | linjäriteten för toppar är genomsnittlig (7.7% delta till föregående frekvens)
Totalt 100 - 16 000 Hz
(±) | linjäriteten för det totala ljudet är genomsnittlig (21.8% skillnad mot median)
Jämfört med samma klass
» 78% av alla testade enheter i den här klassen var bättre, 6% liknande, 16% sämre
» Den bästa hade ett delta på 6%, genomsnittet var 18%, sämst var 132%
Jämfört med alla testade enheter
» 62% av alla testade enheter var bättre, 7% liknande, 31% sämre
» Den bästa hade ett delta på 4%, genomsnittet var 24%, sämst var 134%
Apple MacBook 12 (Early 2016) 1.1 GHz ljudanalys
(+) | högtalare kan spela relativt högt (83.6 dB)
Bas 100 - 315 Hz
(±) | reducerad bas - i genomsnitt 11.3% lägre än medianen
(±) | linjäriteten för basen är genomsnittlig (14.2% delta till föregående frekvens)
Mellan 400 - 2000 Hz
(+) | balanserad mellan - endast 2.4% från medianen
(+) | mids är linjära (5.5% delta till föregående frekvens)
Högsta 2 - 16 kHz
(+) | balanserade toppar - endast 2% från medianen
(+) | toppar är linjära (4.5% delta till föregående frekvens)
Totalt 100 - 16 000 Hz
(+) | det totala ljudet är linjärt (10.2% skillnad mot median)
Jämfört med samma klass
» 7% av alla testade enheter i den här klassen var bättre, 2% liknande, 91% sämre
» Den bästa hade ett delta på 5%, genomsnittet var 18%, sämst var 53%
Jämfört med alla testade enheter
» 5% av alla testade enheter var bättre, 1% liknande, 94% sämre
» Den bästa hade ett delta på 4%, genomsnittet var 24%, sämst var 134%
| Av/Standby | |
| Låg belastning | |
| Hög belastning |
|
Förklaring:
min: | |
| HP Omen X 2S 15-dg0075cl i7-9750H, GeForce RTX 2070 Max-Q, WDC PC SN720 SDAPNTW-1T00, IPS, 1920x1080, 15.6" | HP Omen 15-dc1020ng i5-9300H, GeForce GTX 1650 Mobile, WDC PC SN720 SDAQNTW-512G, IPS, 1920x1080, 15.6" | Razer Blade 15 RTX 2080 Max-Q i7-9750H, GeForce RTX 2080 Max-Q, Samsung SSD PM981 MZVLB512HAJQ, IPS, 1920x1080, 15.6" | Alienware m15 R2 P87F i7-9750H, GeForce RTX 2080 Max-Q, 2x Toshiba XG6 KXG60ZNV512G (RAID 0), IPS, 1920x1080, 15.6" | MSI GT63 Titan 8RG-046 i7-8750H, GeForce GTX 1080 Mobile, CUK Cyclone 500GB M.2 NVMe, TN, 1920x1080, 15.6" | Lenovo Legion Y740-15ICHg i7-8750H, GeForce RTX 2070 Max-Q, Samsung SSD PM981 MZVLB256HAHQ, IPS, 1920x1080, 15.6" | |
|---|---|---|---|---|---|---|
| Power Consumption | 59% | 38% | 10% | 15% | 36% | |
| Idle Minimum * (Watt) | 46 | 4.04 91% | 12.5 73% | 19 59% | 26.4 43% | 22.9 50% |
| Idle Average * (Watt) | 59 | 7.2 88% | 15.3 74% | 40.5 31% | 30 49% | 27.2 54% |
| Idle Maximum * (Watt) | 65.5 | 11.4 83% | 20.7 68% | 52 21% | 30.6 53% | 27.5 58% |
| Load Average * (Watt) | 99.8 | 80.8 19% | 90.2 10% | 132.3 -33% | 90.4 9% | 83.4 16% |
| Witcher 3 ultra * (Watt) | 154.1 | 93.6 39% | 162 -5% | 183.3 -19% | 255.6 -66% | 143.6 7% |
| Load Maximum * (Watt) | 222.7 | 144.5 35% | 209.3 6% | 217.2 2% | 224.4 -1% | 160.5 28% |
* ... mindre är bättre
| HP Omen X 2S 15-dg0075cl i7-9750H, GeForce RTX 2070 Max-Q, 72 Wh | HP Omen 15-dc1020ng i5-9300H, GeForce GTX 1650 Mobile, 52.5 Wh | Razer Blade 15 RTX 2080 Max-Q i7-9750H, GeForce RTX 2080 Max-Q, 80 Wh | Alienware m15 R2 P87F i7-9750H, GeForce RTX 2080 Max-Q, 76 Wh | MSI GT63 Titan 8RG-046 i7-8750H, GeForce GTX 1080 Mobile, 75.24 Wh | Lenovo Legion Y740-15ICHg i7-8750H, GeForce RTX 2070 Max-Q, 57 Wh | |
|---|---|---|---|---|---|---|
| Batteridrifttid | 171% | 187% | 84% | 45% | -2% | |
| Reader / Idle (h) | 3.7 | 15.9 330% | 15.9 330% | 9.2 149% | 3.9 5% | |
| WiFi v1.3 (h) | 2.2 | 6.4 191% | 6.6 200% | 5.5 150% | 3.2 45% | 2.8 27% |
| Load (h) | 1.3 | 1.2 -8% | 1.7 31% | 0.7 -46% | 0.8 -38% | |
| Witcher 3 ultra (h) | 1 |
För
Emot
Läs den fullständiga versionen av den här recensionen på engelska här.
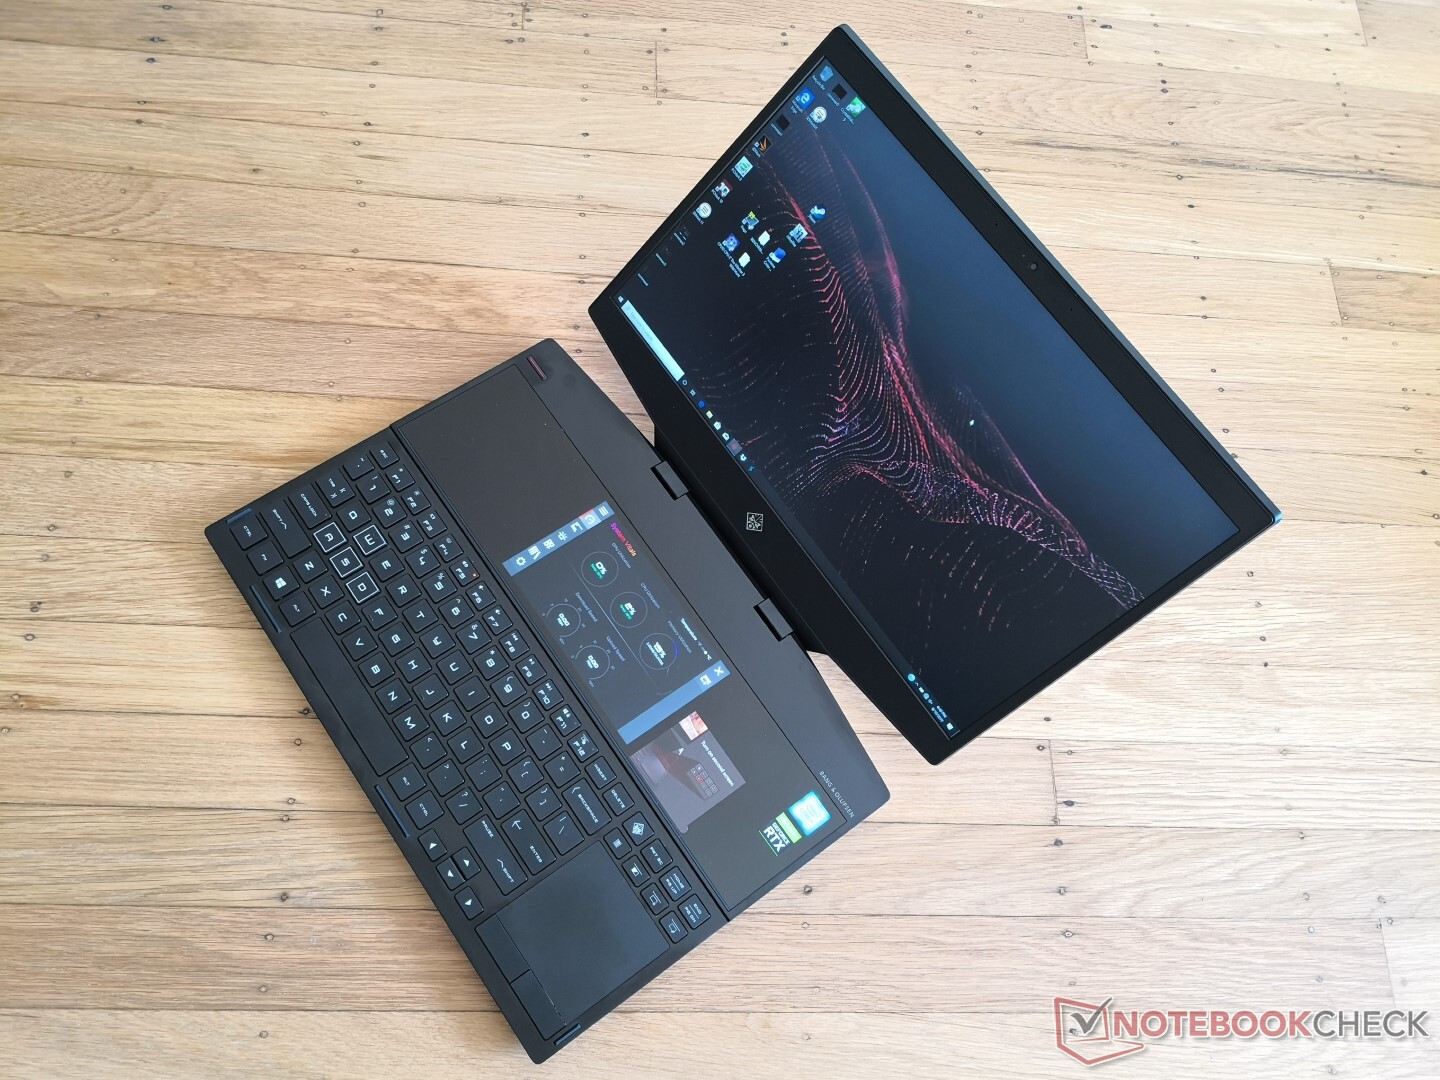
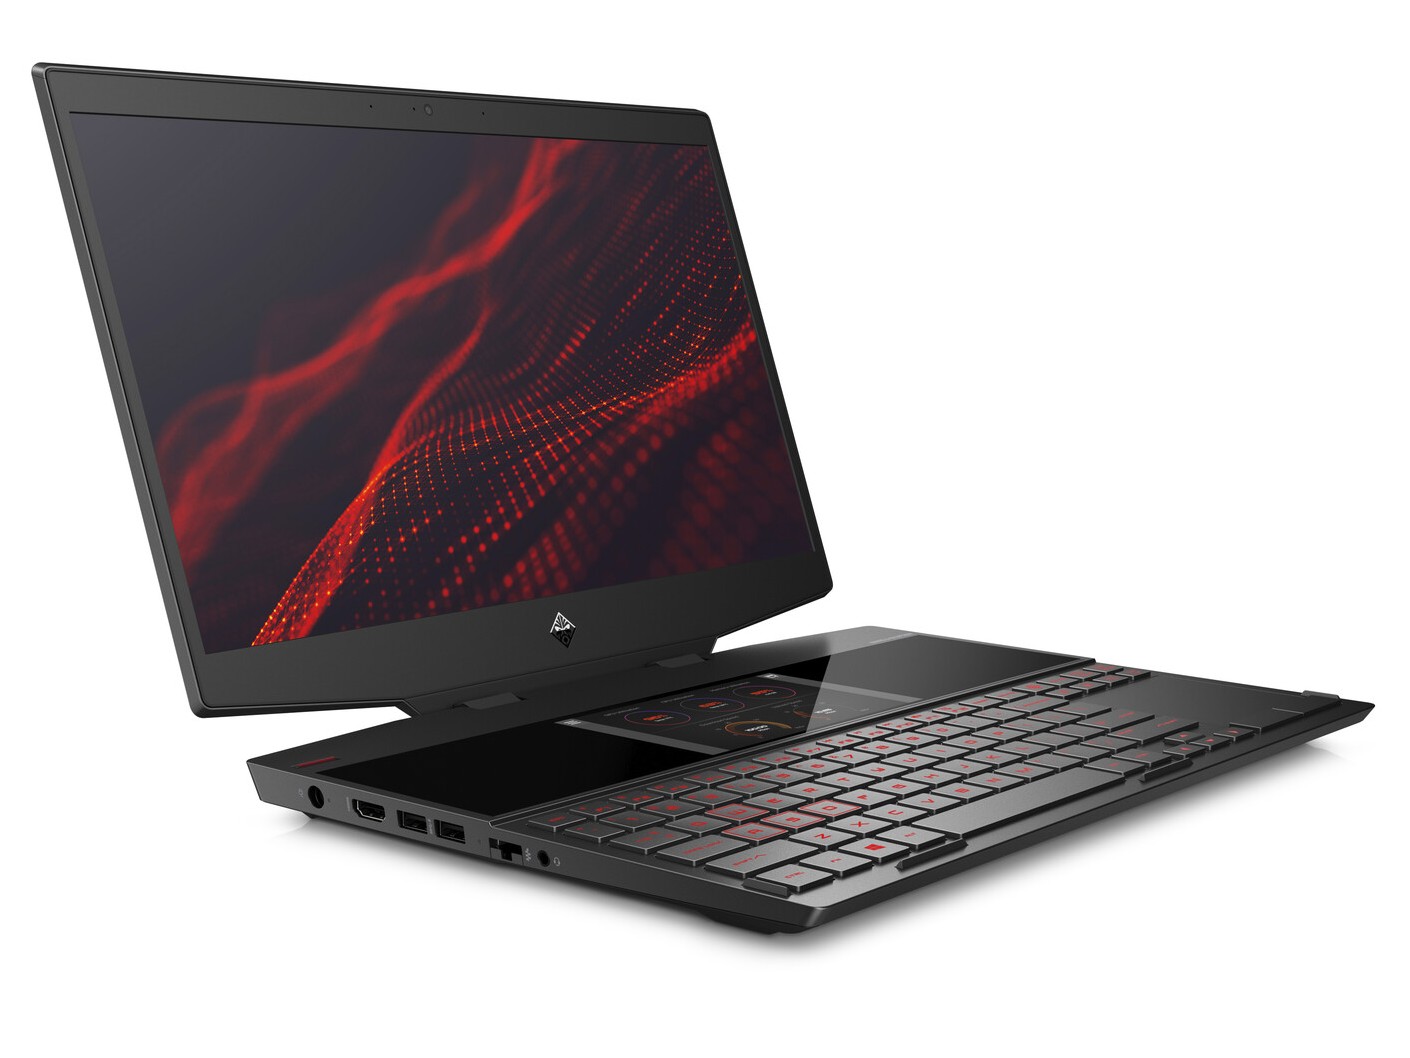
Den extra skärmen på 6 tum gör varken Omen till en bättre speldator eller en bättre resekamrat. Batteritiden är otroligt kort och använder man den andra skärmen utomhus får man kraftiga reflektioner. Färgerna är dåligt kalibrerade och därmed sämre än på en Android-telefon från mittenskiktet. Faktum är att det nog vore bättre att använda en snabbare och mer responsiv smartphone för att titta på spelguider eller forum än den suboptimalt vinklade extra skärmen.
Om du planerar att använda Omen X 2S 15 till en hel del ordbehandling, videouppspelning, surfande eller annat arbete som kräver flera fönster på begränsad skrivbordsyta kan den extra skärmen ha en poäng. Annars kan du lika gärna ansluta en extern monitor.
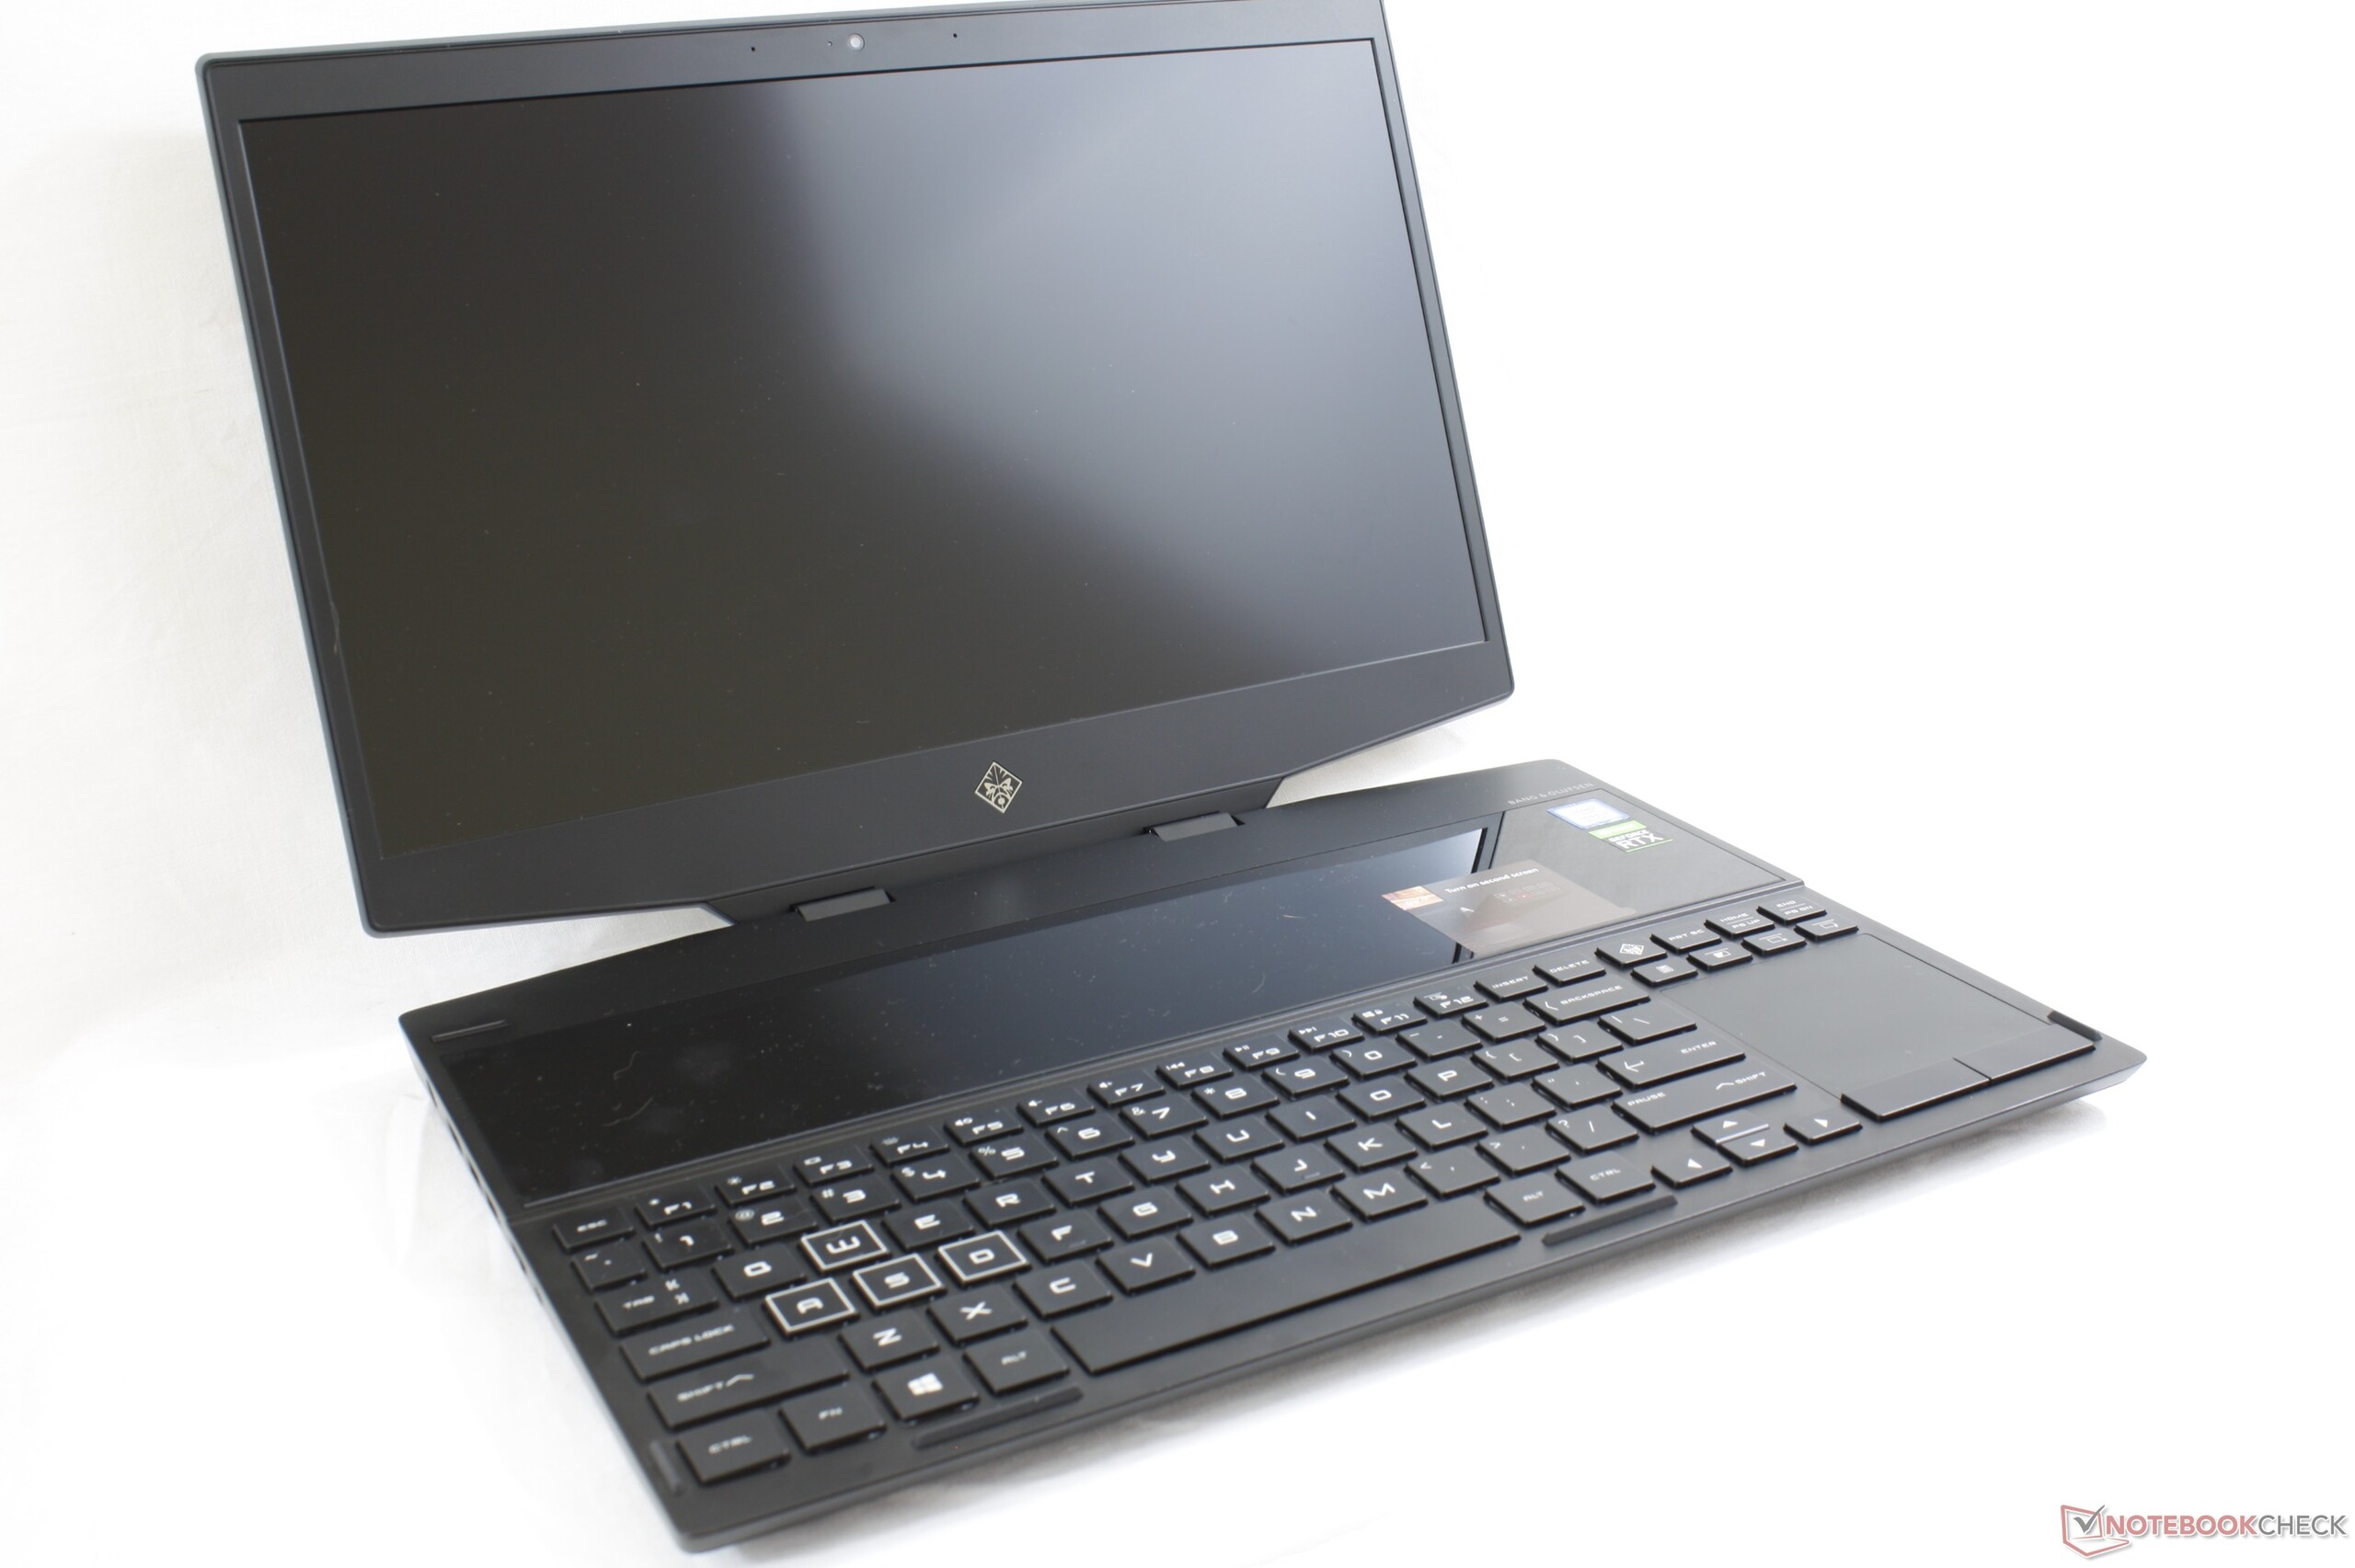
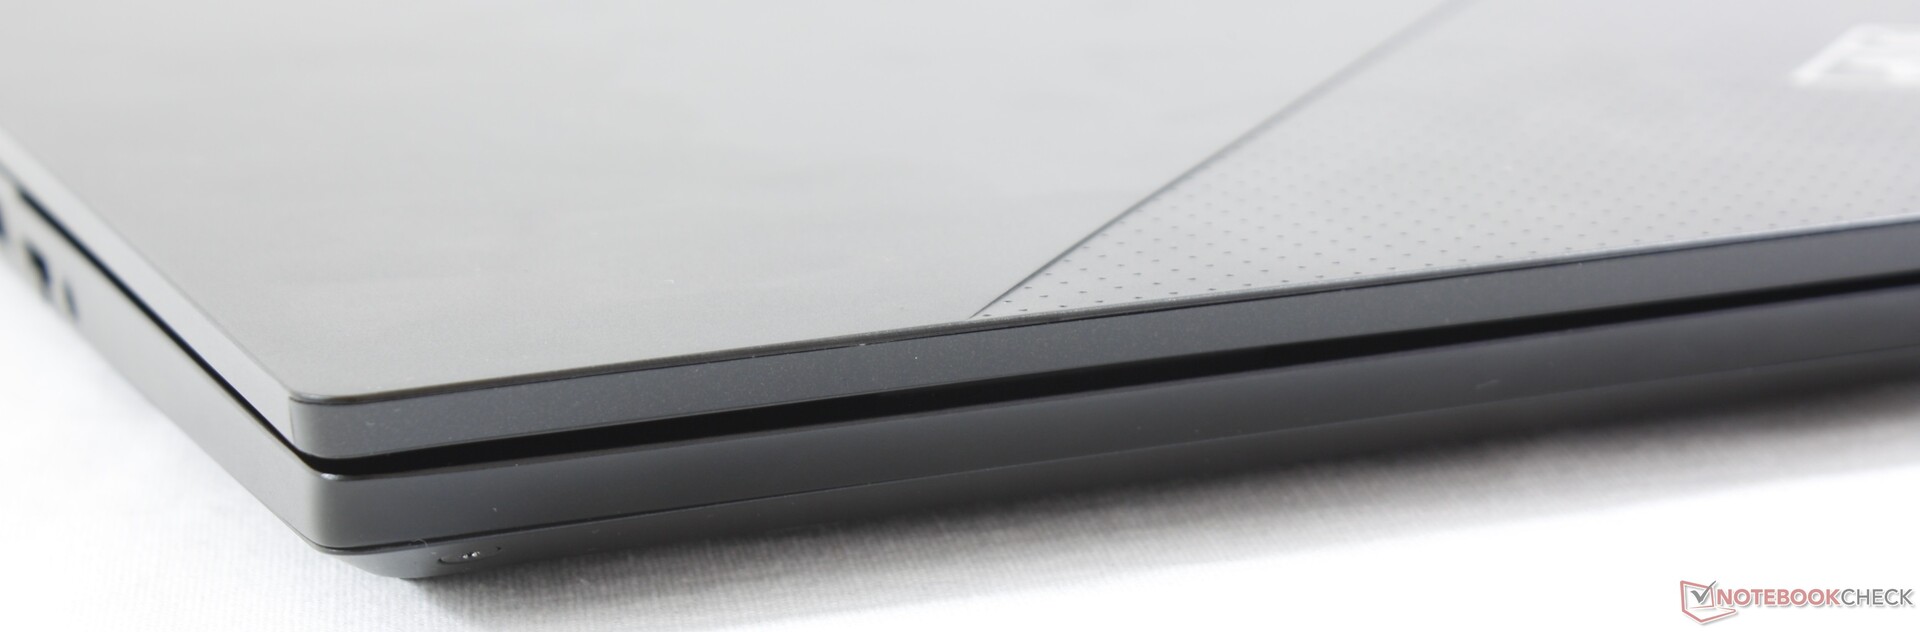
Spelprestandan är utmärkt, vilket är att förvänta från en spellaptop som kostar runt 20.000 kronor. Det finns dock problem med nästan allt annat, som att den är svår att serva, att den har tjock infattning på ovansidan och undersidan av det tunna skärmlocket och att systemets fläktar låter mycket. HP kan eventuellt vilja jobba på att skapa en tilltalande vanlig spellaptop innan man försöker bygga in dyra nymodigheter.
Kraftiga reflektioner, kort batteritid och suboptimala betraktningsvinklar gör att den extra skärmen i princip är värdelös utomhus. Den fyller sitt syfte inomhus där belysningen går att kontrollera, men om datorn kommer stå still mer än den flyttas är det istället bättre att investera i en extern monitor.
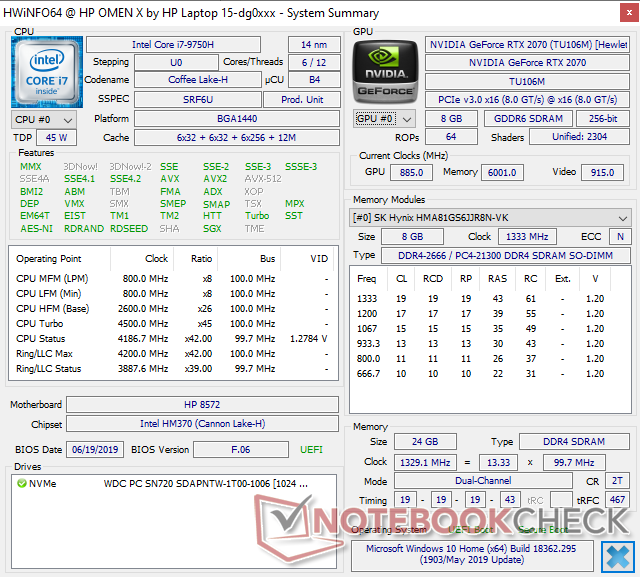
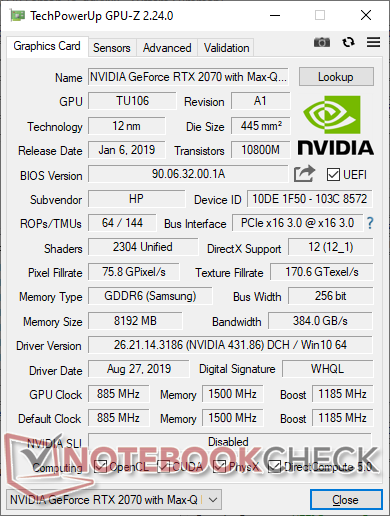
HP Omen X 2S 15-dg0075cl
- 09/13/2019 v7 (old)
Allen Ngo
Price comparison
