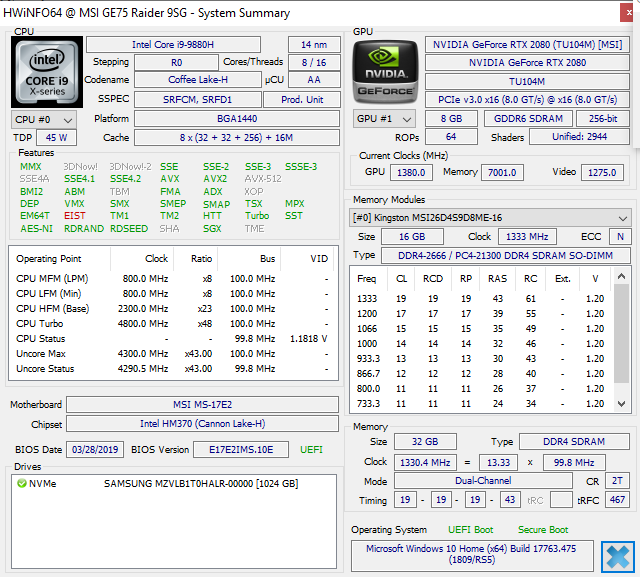
Test: MSI GE75 Raider 9SG (Core i9-9880H, RTX 2080) Laptop (Sammanfattning)
| SD Card Reader | |
| average JPG Copy Test (av. of 3 runs) | |
| Dell XPS 15 9570 Core i9 UHD (Toshiba Exceria Pro SDXC 64 GB UHS-II) | |
| MSI GT75 8RG-090 Titan (Toshiba Exceria Pro SDXC 64 GB UHS-II) | |
| MSI GE75 9SG (Toshiba Exceria Pro SDXC 64 GB UHS-II) | |
| MSI GE73 8RF-008 Raider RGB (Toshiba Exceria Pro SDXC 64 GB UHS-II) | |
| maximum AS SSD Seq Read Test (1GB) | |
| Dell XPS 15 9570 Core i9 UHD (Toshiba Exceria Pro SDXC 64 GB UHS-II) | |
| MSI GT75 8RG-090 Titan (Toshiba Exceria Pro SDXC 64 GB UHS-II) | |
| MSI GE75 9SG (Toshiba Exceria Pro SDXC 64 GB UHS-II) | |
| MSI GE73 8RF-008 Raider RGB (Toshiba Exceria Pro SDXC 64 GB UHS-II) | |
| Networking | |
| iperf3 transmit AX12 | |
| MSI GT75 8RG-090 Titan | |
| MSI GE75 9SG | |
| Acer Predator Triton 700 | |
| Asus TUF FX705DY-AU072 | |
| iperf3 receive AX12 | |
| MSI GT75 8RG-090 Titan | |
| Acer Predator Triton 700 | |
| MSI GE75 9SG | |
| Asus TUF FX705DY-AU072 | |
| |||||||||||||||||||||||||
Distribution av ljusstyrkan: 89 %
Mitt på batteriet: 400.7 cd/m²
Kontrast: 1179:1 (Svärta: 0.34 cd/m²)
ΔE ColorChecker Calman: 1.33 | ∀{0.5-29.43 Ø4.73}
calibrated: 1.39
ΔE Greyscale Calman: 1.3 | ∀{0.09-98 Ø4.97}
92.1% sRGB (Argyll 1.6.3 3D)
58.2% AdobeRGB 1998 (Argyll 1.6.3 3D)
63.5% AdobeRGB 1998 (Argyll 3D)
92% sRGB (Argyll 3D)
61.5% Display P3 (Argyll 3D)
Gamma: 2.24
CCT: 6735 K
| MSI GE75 9SG Chi Mei N173HCE-G33, AHVA, 17.3", 1920x1080 | Asus TUF FX705DY-AU072 AU Optronics B173HAN04.2, IPS, 17.3", 1920x1080 | Asus Zephyrus S GX701GX B173HAN04.0 (AUO409D), IPS, 17.3", 1920x1080 | MSI GT75 8RG-090 Titan CMN N173HHE-G32 (CMN1747), TN, 17.3", 1920x1080 | Acer Predator Triton 700 AUO B156HAN04.2 (AUO42ED), IPS, 15.6", 1920x1080 | MSI GE73 8RF-008 Raider RGB Chi Mei N173HHE-G32 (CMN1747), TN WLED, 17.3", 1920x1080 | |
|---|---|---|---|---|---|---|
| Display | -1% | 31% | -1% | 31% | ||
| Display P3 Coverage (%) | 61.5 | 62.9 2% | 90.9 48% | 62.5 2% | 90.8 48% | |
| sRGB Coverage (%) | 92 | 87.8 -5% | 100 9% | 88.7 -4% | 99.9 9% | |
| AdobeRGB 1998 Coverage (%) | 63.5 | 63.9 1% | 86.2 36% | 63.5 0% | 85.8 35% | |
| Response Times | -383% | -23% | 2% | -435% | -198% | |
| Response Time Grey 50% / Grey 80% * (ms) | 7.2 ? | 40 ? -456% | 7.2 ? -0% | 8 ? -11% | 44.8 ? -522% | 28 ? -289% |
| Response Time Black / White * (ms) | 6.6 ? | 27 ? -309% | 9.6 ? -45% | 5.6 ? 15% | 29.6 ? -348% | 13.6 ? -106% |
| PWM Frequency (Hz) | 26040 ? | 26000 ? | 25000 ? | |||
| Screen | -34% | -17% | -14% | -94% | -40% | |
| Brightness middle (cd/m²) | 400.7 | 322 -20% | 288 -28% | 240 -40% | 291 -27% | 273 -32% |
| Brightness (cd/m²) | 372 | 303 -19% | 287 -23% | 248 -33% | 277 -26% | 273 -27% |
| Brightness Distribution (%) | 89 | 84 -6% | 91 2% | 83 -7% | 84 -6% | 90 1% |
| Black Level * (cd/m²) | 0.34 | 0.32 6% | 0.2 41% | 0.22 35% | 0.22 35% | 0.26 24% |
| Contrast (:1) | 1179 | 1006 -15% | 1440 22% | 1091 -7% | 1323 12% | 1050 -11% |
| Colorchecker dE 2000 * | 1.33 | 2.97 -123% | 2.33 -75% | 2.14 -61% | 5.52 -315% | 3.52 -165% |
| Colorchecker dE 2000 max. * | 3.51 | 5.08 -45% | 5.34 -52% | 5.04 -44% | 10.72 -205% | 6.34 -81% |
| Colorchecker dE 2000 calibrated * | 1.39 | 2.29 -65% | 2.47 -78% | 1.54 -11% | 2.09 -50% | |
| Greyscale dE 2000 * | 1.3 | 2.26 -74% | 1.19 8% | 1.62 -25% | 6.59 -407% | 3.11 -139% |
| Gamma | 2.24 98% | 2.45 90% | 2.41 91% | 2.28 96% | 2.44 90% | 2.43 91% |
| CCT | 6735 97% | 6892 94% | 6710 97% | 6846 95% | 7816 83% | 6999 93% |
| Color Space (Percent of AdobeRGB 1998) (%) | 58.2 | 57 -2% | 57 -2% | 77 32% | 58 0% | 76 31% |
| Color Space (Percent of sRGB) (%) | 92.1 | 87 -6% | 88 -4% | 100 9% | 89 -3% | 100 9% |
| Totalt genomsnitt (program/inställningar) | -209% /
-87% | -14% /
-15% | 6% /
-3% | -177% /
-121% | -69% /
-46% |
* ... mindre är bättre
Visa svarstider
| ↔ Svarstid svart till vitt | ||
|---|---|---|
| 6.6 ms ... stiga ↗ och falla ↘ kombinerat | ↗ 3.2 ms stiga | 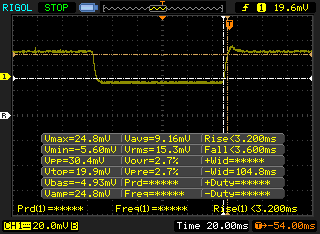 |
| ↘ 3.4 ms hösten | ||
| Skärmen visar väldigt snabba svarsfrekvenser i våra tester och borde vara mycket väl lämpad för fartfyllt spel. I jämförelse sträcker sig alla testade enheter från 0.1 (minst) till 240 (maximalt) ms. » 20 % av alla enheter är bättre. Det betyder att den uppmätta svarstiden är bättre än genomsnittet av alla testade enheter (19.9 ms). | ||
| ↔ Svarstid 50 % grått till 80 % grått | ||
| 7.2 ms ... stiga ↗ och falla ↘ kombinerat | ↗ 3.8 ms stiga | 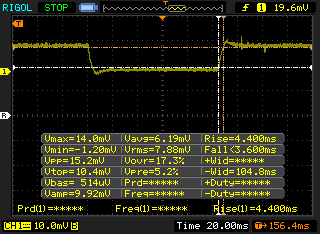 |
| ↘ 3.4 ms hösten | ||
| Skärmen visar väldigt snabba svarsfrekvenser i våra tester och borde vara mycket väl lämpad för fartfyllt spel. I jämförelse sträcker sig alla testade enheter från 0.165 (minst) till 636 (maximalt) ms. » 20 % av alla enheter är bättre. Det betyder att den uppmätta svarstiden är bättre än genomsnittet av alla testade enheter (31.1 ms). | ||
Skärmflimmer / PWM (Puls-Width Modulation)
| Skärmflimmer / PWM upptäckt | 26040 Hz | ≤ 10 % ljusstyrka inställning | 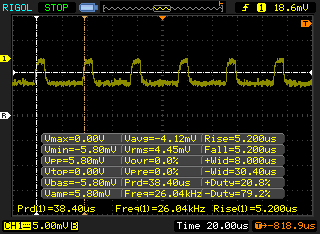 |
Displayens bakgrundsbelysning flimrar vid 26040 Hz (i värsta fall, t.ex. med PWM) Flimrande upptäckt vid en ljusstyrkeinställning på 10 % och lägre. Det ska inte finnas något flimmer eller PWM över denna ljusstyrkeinställning. Frekvensen för 26040 Hz är ganska hög, så de flesta användare som är känsliga för PWM bör inte märka något flimmer. Som jämförelse: 52 % av alla testade enheter använder inte PWM för att dämpa skärmen. Om PWM upptäcktes mättes ett medelvärde av 7798 (minst: 5 - maximum: 343500) Hz. | |||
| Cinebench R20 | |
| CPU (Multi Core) | |
| MSI GE75 9SG | |
| Genomsnitt Intel Core i9-9880H (2953 - 3712, n=7) | |
| Gigabyte Aero 15 Classic-XA | |
| Asus TUF FX705DY-AU072 | |
| CPU (Single Core) | |
| Genomsnitt Intel Core i9-9880H (441 - 474, n=7) | |
| MSI GE75 9SG | |
| Gigabyte Aero 15 Classic-XA | |
| Asus TUF FX705DY-AU072 | |
| PCMark 8 | |
| Home Score Accelerated v2 | |
| Aorus X9 DT | |
| MSI GT75 8RG-090 Titan | |
| MSI GE75 8SG Raider | |
| MSI GE75 9SG | |
| Asus TUF FX705DY-AU072 | |
| Work Score Accelerated v2 | |
| Aorus X9 DT | |
| MSI GE75 9SG | |
| MSI GT75 8RG-090 Titan | |
| MSI GE75 8SG Raider | |
| Asus TUF FX705DY-AU072 | |
| PCMark 8 Home Score Accelerated v2 | 4550 poäng | |
| PCMark 8 Work Score Accelerated v2 | 6004 poäng | |
| PCMark 10 Score | 6306 poäng | |
Hjälp | ||
| MSI GE75 9SG Samsung SSD PM981 MZVLB1T0HALR | Asus TUF FX705DY-AU072 Kingston RBUSNS8154P3512GJ | Asus Zephyrus S GX701GX Samsung SSD PM981 MZVLB1T0HALR | MSI GT75 8RG-090 Titan 2x Samsung PM961 MZVLW256HEHP (RAID 0) | Acer Predator Triton 700 2x SK Hynix Canvas SC300 512GB M.2 (HFS512G39MND) (RAID 0) | MSI GE73 8RF-008 Raider RGB Toshiba HG6 THNSNJ256G8NY | |
|---|---|---|---|---|---|---|
| AS SSD | -28% | 9% | 10% | -2% | -84% | |
| Seq Read (MB/s) | 1358 | 1419 4% | 911 -33% | 3058 125% | 2517 85% | 511 -62% |
| Seq Write (MB/s) | 2381 | 828 -65% | 2347 -1% | 2196 -8% | 2372 0% | 425.7 -82% |
| 4K Read (MB/s) | 27.02 | 35.71 32% | 53 96% | 38.37 42% | 41.47 53% | 14.07 -48% |
| 4K Write (MB/s) | 89.2 | 86.8 -3% | 122.5 37% | 97.7 10% | 93 4% | 38.34 -57% |
| 4K-64 Read (MB/s) | 1642 | 848 -48% | 1577 -4% | 1347 -18% | 1057 -36% | 351.4 -79% |
| 4K-64 Write (MB/s) | 1799 | 708 -61% | 1734 -4% | 1236 -31% | 913 -49% | 172.7 -90% |
| Access Time Read * (ms) | 0.067 | 0.063 6% | 0.08 -19% | 0.056 16% | 0.062 7% | 0.235 -251% |
| Access Time Write * (ms) | 0.05 | 0.044 12% | 0.031 38% | 0.038 24% | 0.041 18% | 0.097 -94% |
| Score Read (Points) | 1805 | 1026 -43% | 1721 -5% | 1691 -6% | 1350 -25% | 417 -77% |
| Score Write (Points) | 2127 | 878 -59% | 2091 -2% | 1553 -27% | 1243 -42% | 254 -88% |
| Score Total (Points) | 4899 | 2405 -51% | 4771 -3% | 4066 -17% | 3282 -33% | 881 -82% |
| Copy ISO MB/s (MB/s) | 3193 | 687 -78% | 412.5 -87% | |||
| Copy Program MB/s (MB/s) | 198.2 | 234.7 18% | 192.9 -3% | |||
| Copy Game MB/s (MB/s) | 1054 | 474.7 -55% | 295.5 -72% |
* ... mindre är bättre

| 3DMark 06 Standard Score | 39973 poäng | |
| 3DMark 11 Performance | 27116 poäng | |
| 3DMark Cloud Gate Standard Score | 41840 poäng | |
| 3DMark Fire Strike Score | 18947 poäng | |
| 3DMark Time Spy Score | 9266 poäng | |
Hjälp | ||
| Shadow of the Tomb Raider - 1920x1080 Highest Preset AA:T | |
| MSI RTX 2080 Gaming X Trio | |
| MSI GE75 9SG | |
| Genomsnitt NVIDIA GeForce RTX 2080 Mobile (69 - 124, n=7) | |
| MSI GE75 8SG Raider | |
| Asus Zephyrus S GX701GX | |
| MSI GL73 8SE-010US | |
| Schenker Compact 15 | |
| Acer Aspire Nitro 5 AN515-54-53Z2 | |
| låg | med. | hög | ultra | |
|---|---|---|---|---|
| BioShock Infinite (2013) | 341.4 | 303.9 | 280.7 | 190.9 |
| The Witcher 3 (2015) | 289.7 | 250.1 | 173 | 95.3 |
| Rise of the Tomb Raider (2016) | 250.6 | 187.2 | 161.7 | 144.3 |
| Shadow of the Tomb Raider (2018) | 146 | 120 | 115 | 109 |
| MSI GE75 9SG GeForce RTX 2080 Mobile, i9-9880H, Samsung SSD PM981 MZVLB1T0HALR | MSI GE75 8SG Raider GeForce RTX 2080 Mobile, i7-8750H, Kingston RBUSNS8154P3512GJ | Aorus X9 DT GeForce GTX 1080 Mobile, i9-8950HK, Transcend TS1TMTE850 | Asus Zephyrus S GX701GX GeForce RTX 2080 Max-Q, i7-8750H, Samsung SSD PM981 MZVLB1T0HALR | MSI GT75 8RG-090 Titan GeForce GTX 1080 Mobile, i9-8950HK, 2x Samsung PM961 MZVLW256HEHP (RAID 0) | MSI GE73 8RF-008 Raider RGB GeForce GTX 1070 Mobile, i7-8750H, Toshiba HG6 THNSNJ256G8NY | |
|---|---|---|---|---|---|---|
| Noise | -9% | -18% | -1% | -9% | -3% | |
| av / miljö * (dB) | 28.2 | 30 -6% | 30 -6% | 29 -3% | 30 -6% | 30 -6% |
| Idle Minimum * (dB) | 30.4 | 30 1% | 36 -18% | 29 5% | 32 -5% | 32 -5% |
| Idle Average * (dB) | 30.4 | 34 -12% | 37 -22% | 32 -5% | 34 -12% | 33 -9% |
| Idle Maximum * (dB) | 33.4 | 37 -11% | 43 -29% | 33 1% | 37 -11% | 34 -2% |
| Load Average * (dB) | 37.1 | 52 -40% | 50 -35% | 47 -27% | 43 -16% | 41 -11% |
| Witcher 3 ultra * (dB) | 54.2 | 53 2% | 57 -5% | 49 10% | 57 -5% | 50 8% |
| Load Maximum * (dB) | 56.4 | 54 4% | 61 -8% | 51 10% | 62 -10% | 54 4% |
* ... mindre är bättre
Ljudnivå
| Låg belastning |
| 30.4 / 30.4 / 33.4 dB(A) |
| Hög belastning |
| 37.1 / 56.4 dB(A) |
 | ||
30 dB tyst 40 dB(A) hörbar 50 dB(A) högt ljud |
||
min: | ||
(-) Den maximala temperaturen på ovansidan är 48.8 °C / 120 F, jämfört med genomsnittet av 40.4 °C / 105 F , allt från 21.2 till 68.8 °C för klassen Gaming.
(-) Botten värms upp till maximalt 52 °C / 126 F, jämfört med genomsnittet av 43.2 °C / 110 F
(+) Vid tomgångsbruk är medeltemperaturen för ovansidan 31.8 °C / 89 F, jämfört med enhetsgenomsnittet på 33.9 °C / ### class_avg_f### F.
(-) När du spelar The Witcher 3 är medeltemperaturen för ovansidan 40 °C / 104 F, jämfört med enhetsgenomsnittet på 33.9 °C / ## #class_avg_f### F.
(+) Handledsstöden och pekplattan når maximal hudtemperatur (32 °C / 89.6 F) och är därför inte varma.
(-) Medeltemperaturen för handledsstödsområdet på liknande enheter var 28.8 °C / 83.8 F (-3.2 °C / -5.8 F).
MSI GE75 9SG ljudanalys
(+) | högtalare kan spela relativt högt (92.8 dB)
Bas 100 - 315 Hz
(±) | reducerad bas - i genomsnitt 12.2% lägre än medianen
(±) | linjäriteten för basen är genomsnittlig (8.7% delta till föregående frekvens)
Mellan 400 - 2000 Hz
(±) | högre mellan - i genomsnitt 6.7% högre än median
(±) | linjäriteten för mids är genomsnittlig (11.5% delta till föregående frekvens)
Högsta 2 - 16 kHz
(+) | balanserade toppar - endast 2.9% från medianen
(±) | linjäriteten för toppar är genomsnittlig (7.6% delta till föregående frekvens)
Totalt 100 - 16 000 Hz
(±) | linjäriteten för det totala ljudet är genomsnittlig (16.5% skillnad mot median)
Jämfört med samma klass
» 42% av alla testade enheter i den här klassen var bättre, 7% liknande, 51% sämre
» Den bästa hade ett delta på 6%, genomsnittet var 18%, sämst var 132%
Jämfört med alla testade enheter
» 28% av alla testade enheter var bättre, 6% liknande, 66% sämre
» Den bästa hade ett delta på 4%, genomsnittet var 24%, sämst var 134%
Apple MacBook 12 (Early 2016) 1.1 GHz ljudanalys
(+) | högtalare kan spela relativt högt (83.6 dB)
Bas 100 - 315 Hz
(±) | reducerad bas - i genomsnitt 11.3% lägre än medianen
(±) | linjäriteten för basen är genomsnittlig (14.2% delta till föregående frekvens)
Mellan 400 - 2000 Hz
(+) | balanserad mellan - endast 2.4% från medianen
(+) | mids är linjära (5.5% delta till föregående frekvens)
Högsta 2 - 16 kHz
(+) | balanserade toppar - endast 2% från medianen
(+) | toppar är linjära (4.5% delta till föregående frekvens)
Totalt 100 - 16 000 Hz
(+) | det totala ljudet är linjärt (10.2% skillnad mot median)
Jämfört med samma klass
» 7% av alla testade enheter i den här klassen var bättre, 2% liknande, 91% sämre
» Den bästa hade ett delta på 5%, genomsnittet var 18%, sämst var 53%
Jämfört med alla testade enheter
» 5% av alla testade enheter var bättre, 1% liknande, 94% sämre
» Den bästa hade ett delta på 4%, genomsnittet var 24%, sämst var 134%
| Av/Standby | |
| Låg belastning | |
| Hög belastning |
|
Förklaring:
min: | |
| MSI GE75 9SG i9-9880H, GeForce RTX 2080 Mobile, Samsung SSD PM981 MZVLB1T0HALR, AHVA, 1920x1080, 17.3" | MSI GE75 8SG Raider i7-8750H, GeForce RTX 2080 Mobile, Kingston RBUSNS8154P3512GJ, AHVA, 1920x1080, 17.3" | Asus Zephyrus S GX701GX i7-8750H, GeForce RTX 2080 Max-Q, Samsung SSD PM981 MZVLB1T0HALR, IPS, 1920x1080, 17.3" | MSI GT75 8RG-090 Titan i9-8950HK, GeForce GTX 1080 Mobile, 2x Samsung PM961 MZVLW256HEHP (RAID 0), TN, 1920x1080, 17.3" | Acer Predator Triton 700 i7-7700HQ, GeForce GTX 1080 Max-Q, 2x SK Hynix Canvas SC300 512GB M.2 (HFS512G39MND) (RAID 0), IPS, 1920x1080, 15.6" | MSI GE73 8RF-008 Raider RGB i7-8750H, GeForce GTX 1070 Mobile, Toshiba HG6 THNSNJ256G8NY, TN WLED, 1920x1080, 17.3" | |
|---|---|---|---|---|---|---|
| Power Consumption | 19% | -3% | -61% | -31% | 4% | |
| Idle Minimum * (Watt) | 13.9 | 7 50% | 19 -37% | 31 -123% | 28 -101% | 15 -8% |
| Idle Average * (Watt) | 18.8 | 15 20% | 22 -17% | 35 -86% | 33 -76% | 20 -6% |
| Idle Maximum * (Watt) | 23.1 | 22 5% | 30 -30% | 45 -95% | 41 -77% | 26 -13% |
| Load Average * (Watt) | 112.3 | 92 18% | 104 7% | 130 -16% | 94 16% | 97 14% |
| Witcher 3 ultra * (Watt) | 231 | 207 10% | 167 28% | 268 -16% | 160 31% | 186 19% |
| Load Maximum * (Watt) | 291.5 | 254 13% | 203 30% | 374 -28% | 222 24% | 239 18% |
* ... mindre är bättre
| MSI GE75 9SG i9-9880H, GeForce RTX 2080 Mobile, 65 Wh | Asus TUF FX705DY-AU072 R5 3550H, Radeon RX 560X (Laptop), 64 Wh | Asus Zephyrus S GX701GX i7-8750H, GeForce RTX 2080 Max-Q, 76 Wh | Acer Predator Triton 700 i7-7700HQ, GeForce GTX 1080 Max-Q, 54 Wh | MSI GE73 8RF-008 Raider RGB i7-8750H, GeForce GTX 1070 Mobile, 51 Wh | MSI GE75 8SG Raider i7-8750H, GeForce RTX 2080 Mobile, 65 Wh | |
|---|---|---|---|---|---|---|
| Batteridrifttid | 47% | -22% | -51% | -37% | -4% | |
| WiFi v1.3 (h) | 4.9 | 7.2 47% | 3.8 -22% | 2.4 -51% | 3.1 -37% | 4.7 -4% |
| Reader / Idle (h) | 12.6 | 5 | 2.5 | 5.1 | 7.8 | |
| Load (h) | 2 | 0.9 | 1.2 | 0.6 | 0.9 | |
| Witcher 3 ultra (h) | 0.8 |
För
Emot
Läs den fullständiga versionen av den här recensionen på engelska här.
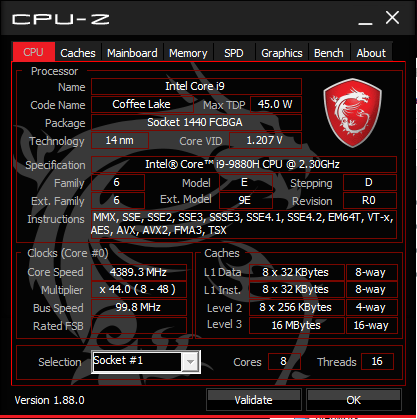
Core i9-9880H är vad Core i9-8950HK borde ha varit. De två extra kärnorna ger den en tydlig prestandafördel jämfört med både Core i7-8750H och Core i7-9750H. En genomsnittlig i7-8750H är runt 36 procent långsammare innan eventuell prestandastrypning tas i beaktande.
Nackdelarna är vad man kan förvänta sig från en snabbare CPU baserad på samma underliggande arkitektur. Det vill säga högre kärntemperaturer och energiförbrukning när processorn belastas fullständigt. i9-9880H stabiliserar sig runt 90 C vid körning av Prime95 jämfört med 73 C för modellen med i7-8750H. På samma sätt drar den 231 W när man spelar spel jämfört med 207 W för förra årets GE73 8SG. Jämfört med den sexkärniga Core i7-serien är dock prestandafördelen mindre för applikationer som inte använder alla åtta kärnorna fullt ut.
GE75 9SG är förstås bara ett exempel på en dator med Core i9-9880H. Den stora variationen i klockfrekvens i9-9880H har (2.3 - 3.8 GHz) innebär att andra tillverkare kan använda samma CPU med lägre klockfrekvenser än vad vi uppmätt här. Men med det sagt ser vårt första möte med 9:e generationens Core i9 redan riktigt lovande ut.
Entusiaster kan tänkas vilja överväga 9:e generationens Core i9, i synnerhet om man förlitar sig på applikationer som är optimerade för åtta CPU-kärnor. Gamers kan också tjäna en del på i9-9880H, om än med en mycket mindre prestandaökning på runt 10 procent för de flesta titlar. Oavsett ligger den nya processorn mycket bättre till jämfört med förra årets Core i9-8950HK.
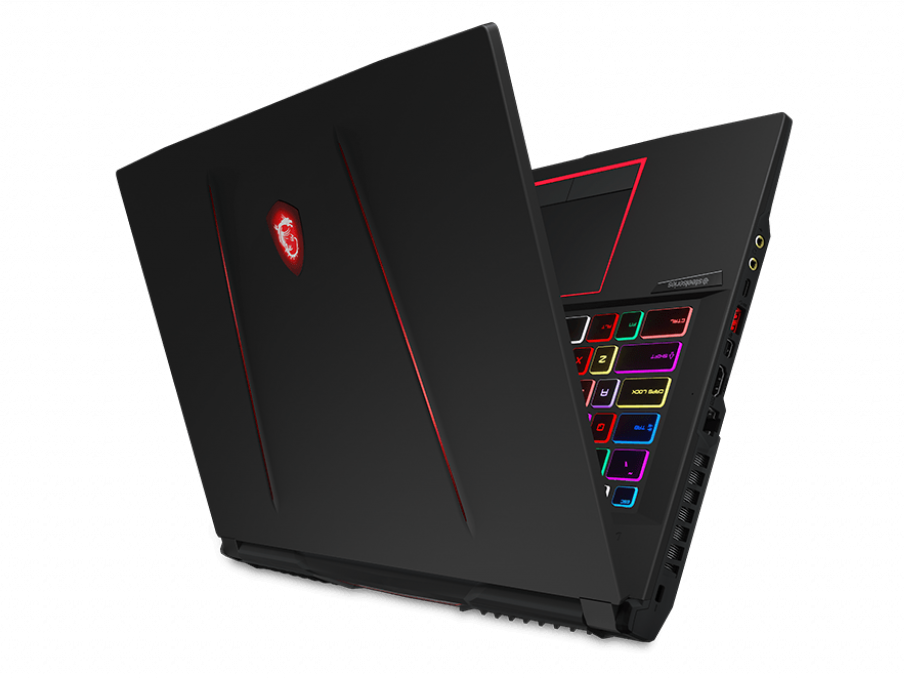
MSI GE75 9SG
- 07/02/2020 v7 (old)
Allen Ngo
Price comparison
