Test: Dell Alienware m17 R2 - Får Core i9 att löna sig (Sammanfattning)
Gradering | Datum | Modell | Vikt | Höjd | Storlek | Upplösning | Pris |
|---|---|---|---|---|---|---|---|
| 84.2 % v7 (old) | 03/2020 | Alienware m17 R2 P41E i9-9980HK, GeForce RTX 2080 Max-Q | 2.6 kg | 20.5 mm | 17.30" | 1920x1080 | |
| 82.9 % v7 (old) | 07/2019 | MSI GS75 Stealth 9SG i7-9750H, GeForce RTX 2080 Max-Q | 2.3 kg | 18.9 mm | 17.30" | 1920x1080 | |
| 87.7 % v7 (old) | 06/2019 | Razer Blade Pro 17 RTX 2080 Max-Q i7-9750H, GeForce RTX 2080 Max-Q | 2.8 kg | 19.9 mm | 17.30" | 1920x1080 | |
| 86.1 % v7 (old) | 09/2019 | Gigabyte Aero 17 XA RP77 i9-9980HK, GeForce RTX 2070 Max-Q | 2.5 kg | 21.4 mm | 17.30" | 3840x2160 | |
| 85.6 % v6 (old) | 02/2019 | Asus ROG Strix Scar II GL704GW i7-8750H, GeForce RTX 2070 Mobile | 2.9 kg | 26.4 mm | 17.30" | 1920x1080 |
| Networking | |
| iperf3 transmit AX12 | |
| Acer Aspire 5 A514-52 | |
| Alienware m17 R2 P41E | |
| iperf3 receive AX12 | |
| Acer Aspire 5 A514-52 | |
| Alienware m17 R2 P41E | |

| |||||||||||||||||||||||||
Distribution av ljusstyrkan: 90 %
Kontrast: 1325:1 (Svärta: 0.29 cd/m²)
ΔE ColorChecker Calman: 1.35 | ∀{0.5-29.43 Ø4.72}
calibrated: 1.42
ΔE Greyscale Calman: 1.2 | ∀{0.09-98 Ø4.97}
98.5% sRGB (Argyll 1.6.3 3D)
65.5% AdobeRGB 1998 (Argyll 1.6.3 3D)
72.2% AdobeRGB 1998 (Argyll 3D)
98.5% sRGB (Argyll 3D)
70.8% Display P3 (Argyll 3D)
Gamma: 2.23
CCT: 6580 K
| Alienware m17 R2 P41E Chi Mei 173HCE, CMN175F, IPS, 17.3", 1920x1080 | Alienware m17 P37E AU Optronics B173ZAN01.0, IPS, 17.3", 3840x2160 | MSI GS75 Stealth 9SG Chi Mei N173HCE-G33 (CMN175C), IPS, 17.3", 1920x1080 | Razer Blade Pro 17 RTX 2080 Max-Q AU Optronics B173HAN04.0, IPS, 17.3", 1920x1080 | Gigabyte Aero 17 XA RP77 AU Optronics B173ZAN03.2, IPS, 17.3", 3840x2160 | Asus ROG Strix Scar II GL704GW B173HAN04.0 (AUO409D), AHVA, 17.3", 1920x1080 | |
|---|---|---|---|---|---|---|
| Display | 20% | -9% | -13% | 21% | -12% | |
| Display P3 Coverage (%) | 70.8 | 86.4 22% | 62.6 -12% | 60.6 -14% | 86.8 23% | 62.9 -11% |
| sRGB Coverage (%) | 98.5 | 99.9 1% | 93.5 -5% | 89 -10% | 100 2% | 87.1 -12% |
| AdobeRGB 1998 Coverage (%) | 72.2 | 99.1 37% | 64.7 -10% | 62.1 -14% | 99.5 38% | 63.7 -12% |
| Response Times | -133% | 33% | 36% | -173% | -3% | |
| Response Time Grey 50% / Grey 80% * (ms) | 17.2 ? | 35.6 ? -107% | 7.2 ? 58% | 6.8 ? 60% | 45.6 ? -165% | 17.6 ? -2% |
| Response Time Black / White * (ms) | 10.8 ? | 28 ? -159% | 10 ? 7% | 9.6 ? 11% | 30.4 ? -181% | 11.2 ? -4% |
| PWM Frequency (Hz) | 26320 ? | 25510 ? | ||||
| Screen | -110% | -4% | -46% | -24% | -40% | |
| Brightness middle (cd/m²) | 384.2 | 357.9 -7% | 366 -5% | 299.3 -22% | 667.3 74% | 295 -23% |
| Brightness (cd/m²) | 357 | 347 -3% | 343 -4% | 294 -18% | 633 77% | 291 -18% |
| Brightness Distribution (%) | 90 | 94 4% | 91 1% | 94 4% | 90 0% | 96 7% |
| Black Level * (cd/m²) | 0.29 | 0.33 -14% | 0.29 -0% | 0.29 -0% | 0.46 -59% | 0.24 17% |
| Contrast (:1) | 1325 | 1085 -18% | 1262 -5% | 1032 -22% | 1451 10% | 1229 -7% |
| Colorchecker dE 2000 * | 1.35 | 6.57 -387% | 1.51 -12% | 2.55 -89% | 3.53 -161% | 3.2 -137% |
| Colorchecker dE 2000 max. * | 3.45 | 9.86 -186% | 3.22 7% | 4.73 -37% | 6.88 -99% | 6.64 -92% |
| Colorchecker dE 2000 calibrated * | 1.42 | 6.74 -375% | 0.71 50% | 2.9 -104% | 3.79 -167% | 2.52 -77% |
| Greyscale dE 2000 * | 1.2 | 4.3 -258% | 1.93 -61% | 3.5 -192% | 0.9 25% | 2.16 -80% |
| Gamma | 2.23 99% | 2.6 85% | 2.38 92% | 2.28 96% | 2.17 101% | 2.46 89% |
| CCT | 6580 99% | 6403 102% | 6881 94% | 7101 92% | 6533 99% | 6872 95% |
| Color Space (Percent of AdobeRGB 1998) (%) | 65.5 | 88.4 35% | 60 -8% | 57 -13% | 87.1 33% | 57 -13% |
| Color Space (Percent of sRGB) (%) | 98.5 | 100 2% | 94 -5% | 88.7 -10% | 100 2% | 87 -12% |
| Totalt genomsnitt (program/inställningar) | -74% /
-88% | 7% /
-0% | -8% /
-29% | -59% /
-34% | -18% /
-30% |
* ... mindre är bättre
Visa svarstider
| ↔ Svarstid svart till vitt | ||
|---|---|---|
| 10.8 ms ... stiga ↗ och falla ↘ kombinerat | ↗ 6 ms stiga | 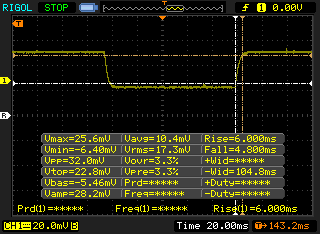 |
| ↘ 4.8 ms hösten | ||
| Skärmen visar bra svarsfrekvens i våra tester, men kan vara för långsam för konkurrenskraftiga spelare. I jämförelse sträcker sig alla testade enheter från 0.1 (minst) till 240 (maximalt) ms. » 29 % av alla enheter är bättre. Det betyder att den uppmätta svarstiden är bättre än genomsnittet av alla testade enheter (19.8 ms). | ||
| ↔ Svarstid 50 % grått till 80 % grått | ||
| 17.2 ms ... stiga ↗ och falla ↘ kombinerat | ↗ 8.8 ms stiga | 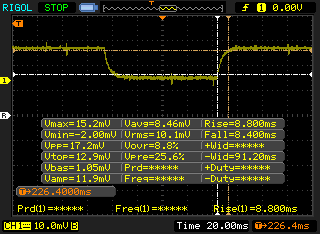 |
| ↘ 8.4 ms hösten | ||
| Skärmen visar bra svarsfrekvens i våra tester, men kan vara för långsam för konkurrenskraftiga spelare. I jämförelse sträcker sig alla testade enheter från 0.165 (minst) till 636 (maximalt) ms. » 31 % av alla enheter är bättre. Det betyder att den uppmätta svarstiden är bättre än genomsnittet av alla testade enheter (31 ms). | ||
Skärmflimmer / PWM (Puls-Width Modulation)
| Skärmflimmer / PWM upptäckt | 26320 Hz | ≤ 25 % ljusstyrka inställning | 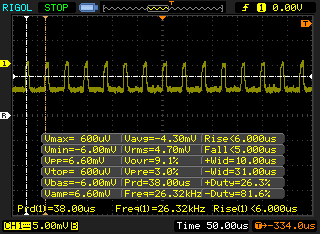 |
Displayens bakgrundsbelysning flimrar vid 26320 Hz (i värsta fall, t.ex. med PWM) Flimrande upptäckt vid en ljusstyrkeinställning på 25 % och lägre. Det ska inte finnas något flimmer eller PWM över denna ljusstyrkeinställning. Frekvensen för 26320 Hz är ganska hög, så de flesta användare som är känsliga för PWM bör inte märka något flimmer. Som jämförelse: 52 % av alla testade enheter använder inte PWM för att dämpa skärmen. Om PWM upptäcktes mättes ett medelvärde av 7763 (minst: 5 - maximum: 343500) Hz. | |||
| Cinebench R11.5 | |
| CPU Single 64Bit | |
| Eurocom Sky X4C i9-9900KS | |
| Genomsnitt Intel Core i9-9980HK (2.25 - 2.4, n=3) | |
| CPU Multi 64Bit | |
| Eurocom Sky X4C i9-9900KS | |
| Genomsnitt Intel Core i9-9980HK (14.8 - 18, n=3) | |
| Cinebench R10 | |
| Rendering Multiple CPUs 32Bit | |
| Eurocom Sky X4C i9-9900KS | |
| Genomsnitt Intel Core i9-9980HK (39440 - 50439, n=4) | |
| Medion Erazer X15805 | |
| MSI Alpha 15 A3DDK-034 | |
| Rendering Single 32Bit | |
| Genomsnitt Intel Core i9-9980HK (7709 - 9734, n=4) | |
| Eurocom Sky X4C i9-9900KS | |
| Medion Erazer X15805 | |
| MSI Alpha 15 A3DDK-034 | |
| wPrime 2.10 - 1024m | |
| Genomsnitt Intel Core i9-9980HK (110.4 - 120.2, n=2) | |
| Eurocom Sky X4C i9-9900KS | |
* ... mindre är bättre
| PCMark 8 Home Score Accelerated v2 | 4384 poäng | |
| PCMark 8 Work Score Accelerated v2 | 5818 poäng | |
| PCMark 10 Score | 5502 poäng | |
Hjälp | ||
| Alienware m17 R2 P41E 2x SK Hynix PC601 NVMe 512 GB (RAID 0) | Alienware m17 P37E SK Hynix PC401 512GB M.2 (HFS512GD9TNG) | MSI GS75 Stealth 9SG 2x Samsung SSD PM981 MZVLB1T0HALR (RAID 0) | Gigabyte Aero 17 XA RP77 Intel SSD 760p SSDPEKKW512G8 | Asus ROG Strix Scar II GL704GW Intel SSD 660p SSDPEKNW512G8 | Lenovo ThinkBook 15 Samsung SSD PM981 MZVLB512HAJQ | |
|---|---|---|---|---|---|---|
| AS SSD | -23% | 13% | -34% | -26% | 28% | |
| Seq Read (MB/s) | 1938 | 1835 -5% | 2855 47% | 1812 -7% | 1315 -32% | 2564 32% |
| Seq Write (MB/s) | 2094 | 1121 -46% | 2687 28% | 1512 -28% | 927 -56% | 2268 8% |
| 4K Read (MB/s) | 25.88 | 23.98 -7% | 30.31 17% | 32.68 26% | 52.4 102% | 57 120% |
| 4K Write (MB/s) | 100.8 | 100 -1% | 96.3 -4% | 107.7 7% | 122.8 22% | 141.4 40% |
| 4K-64 Read (MB/s) | 1217 | 687 -44% | 1460 20% | 504 -59% | 326.5 -73% | 1175 -3% |
| 4K-64 Write (MB/s) | 1137 | 776 -32% | 1224 8% | 534 -53% | 727 -36% | 1665 46% |
| Access Time Read * (ms) | 0.051 | 0.047 8% | 0.054 -6% | 0.05 2% | 0.11 -116% | 0.032 37% |
| Access Time Write * (ms) | 0.107 | 0.053 50% | 0.038 64% | 0.227 -112% | 0.045 58% | 0.025 77% |
| Score Read (Points) | 1437 | 895 -38% | 1776 24% | 718 -50% | 510 -65% | 1488 4% |
| Score Write (Points) | 1447 | 988 -32% | 1589 10% | 793 -45% | 942 -35% | 2033 40% |
| Score Total (Points) | 3624 | 2306 -36% | 4259 18% | 1871 -48% | 1715 -53% | 4279 18% |
| Copy ISO MB/s (MB/s) | 1926 | 773 -60% | 2226 16% | 946 -51% | 2118 10% | |
| Copy Program MB/s (MB/s) | 626 | 493 -21% | 426.4 -32% | 414.3 -34% | 495.6 -21% | |
| Copy Game MB/s (MB/s) | 1533 | 647 -58% | 1152 -25% | 1263 -18% | 1174 -23% | |
| CrystalDiskMark 5.2 / 6 | -18% | 6% | 2% | -33% | 6% | |
| Write 4K (MB/s) | 110.6 | 120.2 9% | 95.5 -14% | 169.6 53% | 99.6 -10% | 176.3 59% |
| Read 4K (MB/s) | 41.46 | 44.3 7% | 42.59 3% | 58 40% | 48.99 18% | 48.98 18% |
| Write Seq (MB/s) | 2378 | 1278 -46% | 2851 20% | 1516 -36% | 972 -59% | 1789 -25% |
| Read Seq (MB/s) | 2114 | 1389 -34% | 2696 28% | 2362 12% | 1515 -28% | 1671 -21% |
| Write 4K Q32T1 (MB/s) | 445.4 | 436.2 -2% | 402.6 -10% | 481.8 8% | 280.6 -37% | 433.5 -3% |
| Read 4K Q32T1 (MB/s) | 509 | 515 1% | 443.9 -13% | 506 -1% | 327.8 -36% | 526 3% |
| Write Seq Q32T1 (MB/s) | 2735 | 1157 -58% | 3420 25% | 1530 -44% | 970 -65% | 2983 9% |
| Read Seq Q32T1 (MB/s) | 3206 | 2671 -17% | 3514 10% | 2645 -17% | 1757 -45% | 3555 11% |
| Write 4K Q8T8 (MB/s) | 1688 | |||||
| Read 4K Q8T8 (MB/s) | 1036 | |||||
| Totalt genomsnitt (program/inställningar) | -21% /
-21% | 10% /
11% | -16% /
-21% | -30% /
-29% | 17% /
20% |
* ... mindre är bättre

| 3DMark | |
| 1280x720 Cloud Gate Standard Graphics | |
| MSI RTX 2080 Ti Gaming X Trio | |
| MSI GE65 Raider 9SF-049US | |
| Alienware m17 R2 P41E | |
| Walmart EVOO Gaming 17 | |
| Alienware 17 R5 | |
| Genomsnitt NVIDIA GeForce RTX 2080 Max-Q (38256 - 129506, n=17) | |
| Dell G5 15 5590-P8RVW | |
| Maingear Vector 15 | |
| HP Omen X 17-ap0xx | |
| MSI GE63 Raider 8SG | |
| MSI GT72S-6QEG16SR421BW | |
| 1920x1080 Fire Strike Graphics | |
| MSI RTX 2080 Ti Gaming X Trio | |
| MSI GE63 Raider 8SG | |
| Alienware m17 R2 P41E | |
| MSI GE65 Raider 9SF-049US | |
| Genomsnitt NVIDIA GeForce RTX 2080 Max-Q (18048 - 23032, n=19) | |
| HP Omen X 17-ap0xx | |
| Walmart EVOO Gaming 17 | |
| Alienware 17 R5 | |
| Dell G5 15 5590-P8RVW | |
| Maingear Vector 15 | |
| MSI GT72S-6QEG16SR421BW | |
| 2560x1440 Time Spy Graphics | |
| MSI RTX 2080 Ti Gaming X Trio | |
| MSI GE63 Raider 8SG | |
| Alienware m17 R2 P41E | |
| MSI GE65 Raider 9SF-049US | |
| Genomsnitt NVIDIA GeForce RTX 2080 Max-Q (6464 - 8844, n=19) | |
| Walmart EVOO Gaming 17 | |
| HP Omen X 17-ap0xx | |
| Dell G5 15 5590-P8RVW | |
| Alienware 17 R5 | |
| Maingear Vector 15 | |
| MSI GT72S-6QEG16SR421BW | |
| 3DMark 11 | |
| 1280x720 Performance GPU | |
| MSI RTX 2080 Ti Gaming X Trio | |
| MSI GE63 Raider 8SG | |
| Alienware m17 R2 P41E | |
| Genomsnitt NVIDIA GeForce RTX 2080 Max-Q (23386 - 30910, n=20) | |
| HP Omen X 17-ap0xx | |
| MSI GE65 Raider 9SF-049US | |
| Walmart EVOO Gaming 17 | |
| Alienware 17 R5 | |
| Dell G5 15 5590-P8RVW | |
| Maingear Vector 15 | |
| MSI GT72S-6QEG16SR421BW | |
| 1280x720 Performance Combined | |
| MSI RTX 2080 Ti Gaming X Trio | |
| MSI GE65 Raider 9SF-049US | |
| Alienware m17 R2 P41E | |
| Walmart EVOO Gaming 17 | |
| Maingear Vector 15 | |
| Dell G5 15 5590-P8RVW | |
| Genomsnitt NVIDIA GeForce RTX 2080 Max-Q (9212 - 14894, n=20) | |
| Alienware 17 R5 | |
| HP Omen X 17-ap0xx | |
| MSI GT72S-6QEG16SR421BW | |
| MSI GE63 Raider 8SG | |
| 3DMark 11 Performance | 23774 poäng | |
| 3DMark Cloud Gate Standard Score | 50705 poäng | |
| 3DMark Fire Strike Score | 19583 poäng | |
| 3DMark Time Spy Score | 8604 poäng | |
Hjälp | ||
| Shadow of the Tomb Raider | |
| 1280x720 Lowest Preset | |
| Corsair One i160 | |
| MSI GE75 9SG | |
| MSI GE65 Raider 9SF-049US | |
| Alienware m17 R2 P41E | |
| Walmart EVOO Gaming 17 | |
| Genomsnitt NVIDIA GeForce RTX 2080 Max-Q (114 - 142, n=5) | |
| HP Omen 15-dc0015ng | |
| HP Omen X 2S 15-dg0075cl | |
| Acer Predator Triton 700 | |
| Razer Blade 15 GTX 1660 Ti | |
| Dell G3 3590 | |
| HP Pavilion Gaming 15-ec0017ng | |
| 1920x1080 Highest Preset AA:T | |
| Corsair One i160 | |
| MSI GE75 9SG | |
| Alienware m17 R2 P41E | |
| MSI GE65 Raider 9SF-049US | |
| Genomsnitt NVIDIA GeForce RTX 2080 Max-Q (71 - 105, n=8) | |
| HP Omen X 2S 15-dg0075cl | |
| Walmart EVOO Gaming 17 | |
| Acer Predator Triton 700 | |
| Razer Blade 15 GTX 1660 Ti | |
| HP Omen 15-dc0015ng | |
| HP Pavilion Gaming 15-ec0017ng | |
| Asus TUF FX705GM | |
| The Witcher 3 - 1920x1080 Ultra Graphics & Postprocessing (HBAO+) | |
| Corsair One i160 | |
| MSI GE75 9SG | |
| Genomsnitt NVIDIA GeForce RTX 2080 Max-Q (65.7 - 92.7, n=22) | |
| MSI GE65 Raider 9SF-049US | |
| Alienware m17 R2 P41E | |
| HP Omen X 2S 15-dg0075cl | |
| Walmart EVOO Gaming 17 | |
| HP Omen 15-dc0015ng | |
| HP Pavilion Gaming 15-ec0017ng | |
| Razer Blade 15 GTX 1660 Ti | |
| Asus TUF FX705GM | |
| Dell G3 3590 | |
| låg | med. | hög | ultra | |
|---|---|---|---|---|
| BioShock Infinite (2013) | 396.1 | 337.3 | 321 | 179 |
| The Witcher 3 (2015) | 326.6 | 239.3 | 149.6 | 78 |
| Shadow of the Tomb Raider (2018) | 142 | 110 | 105 | 99 |
| Alienware m17 R2 P41E GeForce RTX 2080 Max-Q, i9-9980HK, 2x SK Hynix PC601 NVMe 512 GB (RAID 0) | Alienware m17 P37E GeForce RTX 2080 Max-Q, i9-8950HK, SK Hynix PC401 512GB M.2 (HFS512GD9TNG) | MSI GS75 Stealth 9SG GeForce RTX 2080 Max-Q, i7-9750H, 2x Samsung SSD PM981 MZVLB1T0HALR (RAID 0) | Razer Blade Pro 17 RTX 2080 Max-Q GeForce RTX 2080 Max-Q, i7-9750H, Samsung SSD PM981 MZVLB512HAJQ | Gigabyte Aero 17 XA RP77 GeForce RTX 2070 Max-Q, i9-9980HK, Intel SSD 760p SSDPEKKW512G8 | Asus ROG Strix Scar II GL704GW GeForce RTX 2070 Mobile, i7-8750H, Intel SSD 660p SSDPEKNW512G8 | |
|---|---|---|---|---|---|---|
| Noise | 2% | -3% | 4% | -2% | -4% | |
| av / miljö * (dB) | 29.1 | 28.2 3% | 30 -3% | 28.2 3% | 29.3 -1% | 29 -0% |
| Idle Minimum * (dB) | 29.4 | 28.2 4% | 31 -5% | 28.2 4% | 33 -12% | 29 1% |
| Idle Average * (dB) | 29.4 | 28.2 4% | 32 -9% | 28.2 4% | 33 -12% | 32 -9% |
| Idle Maximum * (dB) | 31.5 | 31 2% | 38 -21% | 30.8 2% | 33 -5% | 40 -27% |
| Load Average * (dB) | 49.7 | 50.8 -2% | 47 5% | 42 15% | 42.5 14% | 46 7% |
| Witcher 3 ultra * (dB) | 49.5 | 50.8 -3% | 48 3% | 51 -3% | 42 15% | 51 -3% |
| Load Maximum * (dB) | 53.3 | 50.8 5% | 49 8% | 53 1% | 59.6 -12% | 52 2% |
* ... mindre är bättre
Ljudnivå
| Låg belastning |
| 29.4 / 29.4 / 31.5 dB(A) |
| Hög belastning |
| 49.7 / 53.3 dB(A) |
 | ||
30 dB tyst 40 dB(A) hörbar 50 dB(A) högt ljud |
||
min: | ||
(-) Den maximala temperaturen på ovansidan är 54.2 °C / 130 F, jämfört med genomsnittet av 40.4 °C / 105 F , allt från 21.2 till 68.8 °C för klassen Gaming.
(-) Botten värms upp till maximalt 61.4 °C / 143 F, jämfört med genomsnittet av 43.2 °C / 110 F
(+) Vid tomgångsbruk är medeltemperaturen för ovansidan 31.9 °C / 89 F, jämfört med enhetsgenomsnittet på 33.9 °C / ### class_avg_f### F.
(±) När du spelar The Witcher 3 är medeltemperaturen för ovansidan 33.8 °C / 93 F, jämfört med enhetsgenomsnittet på 33.9 °C / ## #class_avg_f### F.
(+) Handledsstöden och pekplattan är kallare än hudtemperaturen med maximalt 31.4 °C / 88.5 F och är därför svala att ta på.
(-) Medeltemperaturen för handledsstödsområdet på liknande enheter var 28.8 °C / 83.8 F (-2.6 °C / -4.7 F).
| Av/Standby | |
| Låg belastning | |
| Hög belastning |
|
Förklaring:
min: | |
| Alienware m17 R2 P41E i9-9980HK, GeForce RTX 2080 Max-Q, 2x SK Hynix PC601 NVMe 512 GB (RAID 0), IPS, 1920x1080, 17.3" | Alienware m17 P37E i9-8950HK, GeForce RTX 2080 Max-Q, SK Hynix PC401 512GB M.2 (HFS512GD9TNG), IPS, 3840x2160, 17.3" | MSI GS75 Stealth 9SG i7-9750H, GeForce RTX 2080 Max-Q, 2x Samsung SSD PM981 MZVLB1T0HALR (RAID 0), IPS, 1920x1080, 17.3" | Razer Blade Pro 17 RTX 2080 Max-Q i7-9750H, GeForce RTX 2080 Max-Q, Samsung SSD PM981 MZVLB512HAJQ, IPS, 1920x1080, 17.3" | Gigabyte Aero 17 XA RP77 i9-9980HK, GeForce RTX 2070 Max-Q, Intel SSD 760p SSDPEKKW512G8, IPS, 3840x2160, 17.3" | Asus ROG Strix Scar II GL704GW i7-8750H, GeForce RTX 2070 Mobile, Intel SSD 660p SSDPEKNW512G8, AHVA, 1920x1080, 17.3" | |
|---|---|---|---|---|---|---|
| Power Consumption | 17% | 35% | 30% | 25% | 25% | |
| Idle Minimum * (Watt) | 24.7 | 21.2 14% | 13 47% | 16.2 34% | 13.9 44% | 19 23% |
| Idle Average * (Watt) | 35.9 | 29.6 18% | 17 53% | 20.4 43% | 24.3 32% | 22 39% |
| Idle Maximum * (Watt) | 69.6 | 34 51% | 25 64% | 26.1 62% | 35.5 49% | 29 58% |
| Load Average * (Watt) | 141.8 | 130.9 8% | 96 32% | 96.5 32% | 127.6 10% | 102 28% |
| Witcher 3 ultra * (Watt) | 185.8 | 177.5 4% | 156 16% | 182.9 2% | 158 15% | 190 -2% |
| Load Maximum * (Watt) | 235.4 | 219.7 7% | 239 -2% | 214.3 9% | 237.5 -1% | 231 2% |
* ... mindre är bättre
| Alienware m17 R2 P41E i9-9980HK, GeForce RTX 2080 Max-Q, 76 Wh | Alienware m17 P37E i9-8950HK, GeForce RTX 2080 Max-Q, 90 Wh | MSI GS75 Stealth 9SG i7-9750H, GeForce RTX 2080 Max-Q, 80.25 Wh | Razer Blade Pro 17 RTX 2080 Max-Q i7-9750H, GeForce RTX 2080 Max-Q, 70 Wh | Gigabyte Aero 17 XA RP77 i9-9980HK, GeForce RTX 2070 Max-Q, 94.24 Wh | Asus ROG Strix Scar II GL704GW i7-8750H, GeForce RTX 2070 Mobile, 66 Wh | |
|---|---|---|---|---|---|---|
| Batteridrifttid | 30% | 58% | 49% | 113% | 29% | |
| Reader / Idle (h) | 7.1 | 9.1 28% | 7.7 8% | 4.9 -31% | 11.9 68% | 6.2 -13% |
| WiFi v1.3 (h) | 4.8 | 4.9 2% | 6 25% | 4.7 -2% | 7.2 50% | 3.9 -19% |
| Load (h) | 0.5 | 0.8 60% | 1.2 140% | 1.4 180% | 1.6 220% | 1.1 120% |
| Witcher 3 ultra (h) | 0.9 |
För
Emot
Läs den fullständiga versionen av den här recensionen på engelska här.
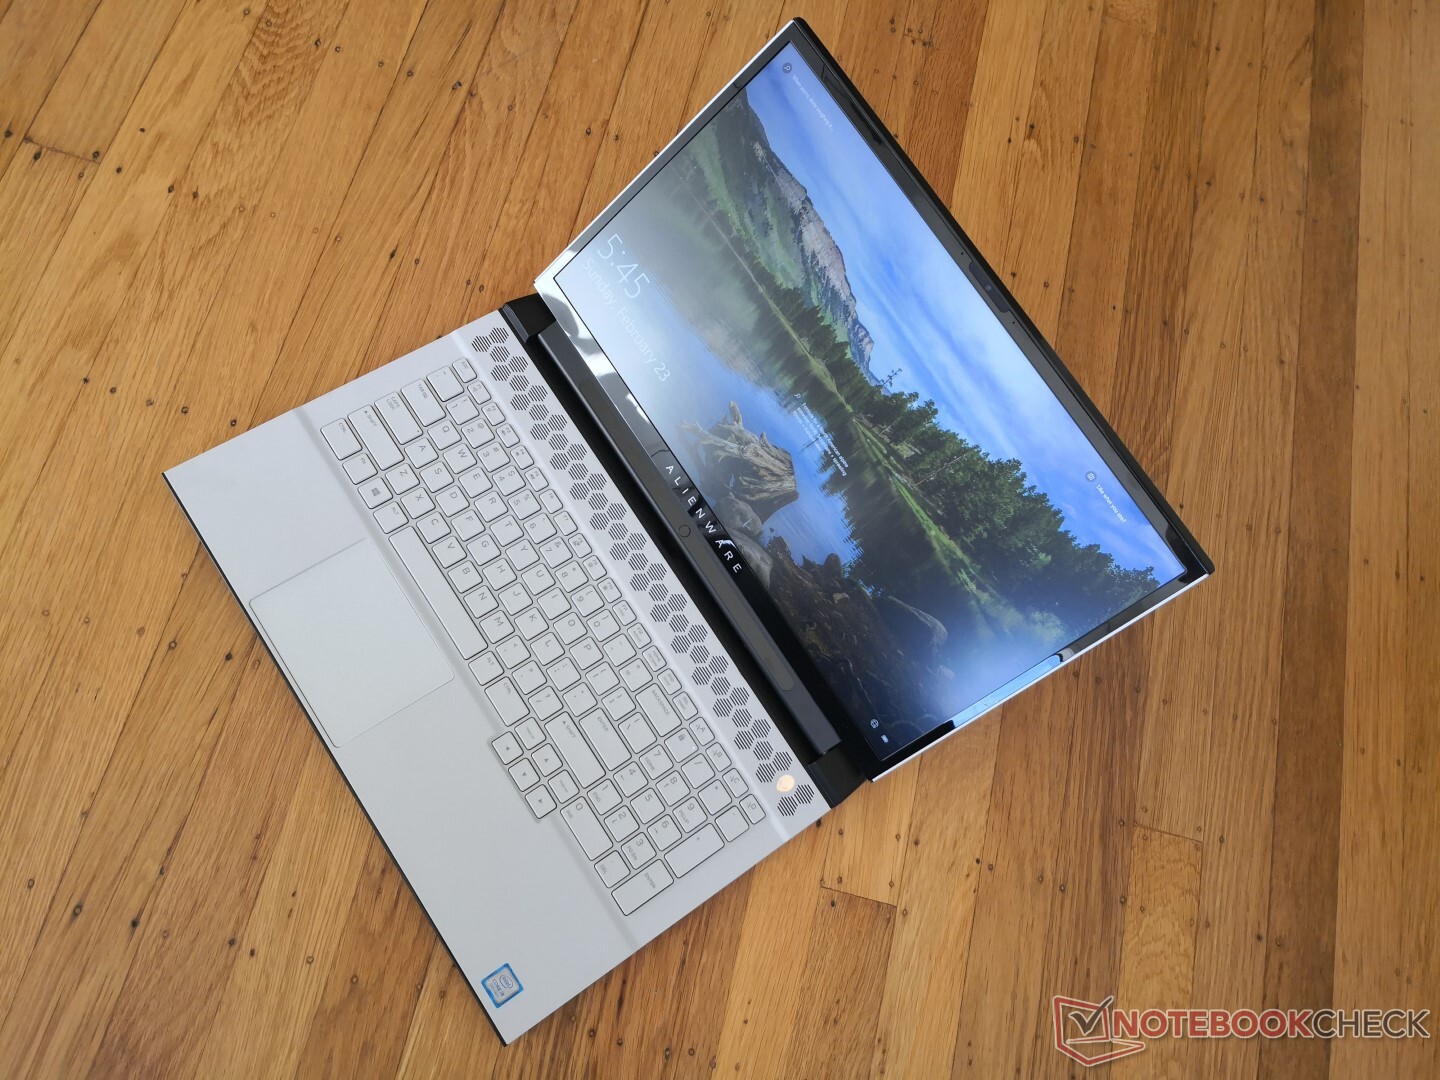
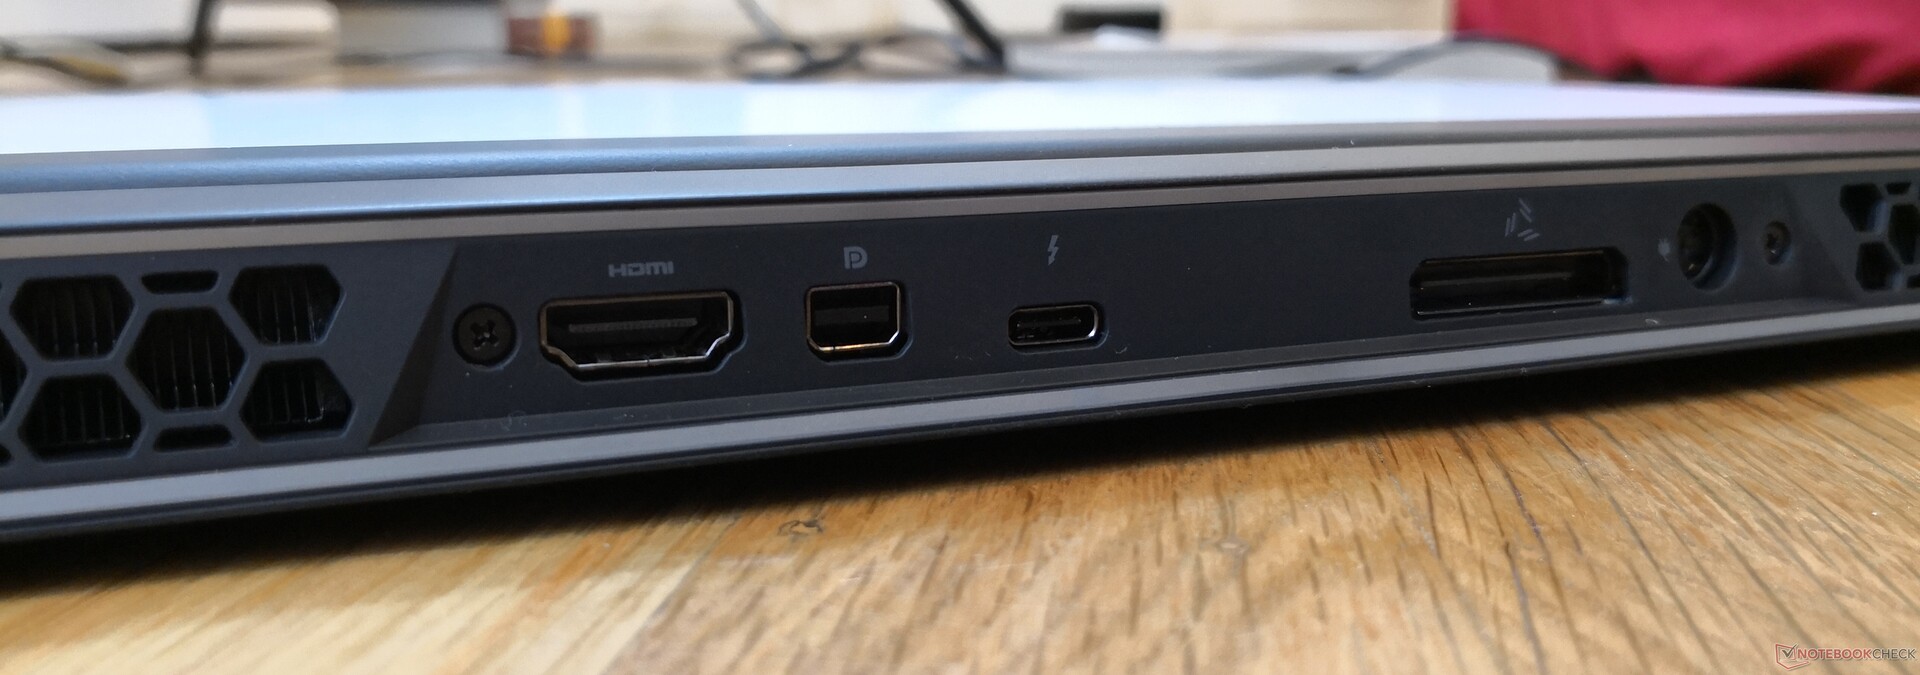
Man förväntar sig att andra generationens modeller är bättre än första generationens på alla sätt. Men i fallet Alienware m17 R2 är det snarare ett steg i sidled jämfört med Alienware m17 R1. Den senaste utgåvan både lägger till och tar bort funktioner, vilket kan irritera en del entusiaster. Man får byta löstagbart RAM, löstagbart WiFi, 2.5-tums SATA III-plats, möjlighet till 4K UHD-skärm och större batteri mot ett bättre tangentbord, en större klickplatta, tangentspecifik RGB-belysning och en ny chassidesign. Om ditt arbete kräver mycket RAM och lagring kan du istället vilja ta en titt på den större Alienware Area-51m.
När det kommer till prestandan så imponerades vi av hur bra processorn var på att upprätthålla Turbo Boost. Core i9-laptops — särskilt tunnare sådana — gör oss ofta besvikna eftersom designen inte alltid utnyttjar processorns potential fullt ut, men den här Alienware-modellen är ett undantag. De huvudsakliga bristerna är att den är större, har högre kärntemperaturer och högljudda fläktar som inte förbättrats alls jämfört med m17 R1. Detta är tyvärr konsekvenserna man får när man stoppar en Core i9 CPU i ett såpass tunt chassi. Men vi misstänker att modellerna med enklare utrustning i form av Core i5- eller Core i7-processorer kommer hålla sig svalare än vad vi uppmätt här.
Gör Alienware m17 R2 tillräckligt mycket för att få en stark rekommendation? Om du inte värderar bättre tangentbord, Core i9 och möjlighet till Tobii eye-tracking får du likvärdig spelprestanda från mindre och mer portabla Core i7-alternativ som Asus ROG Strix Scar GL704GW eller Razer Blade Pro 17.
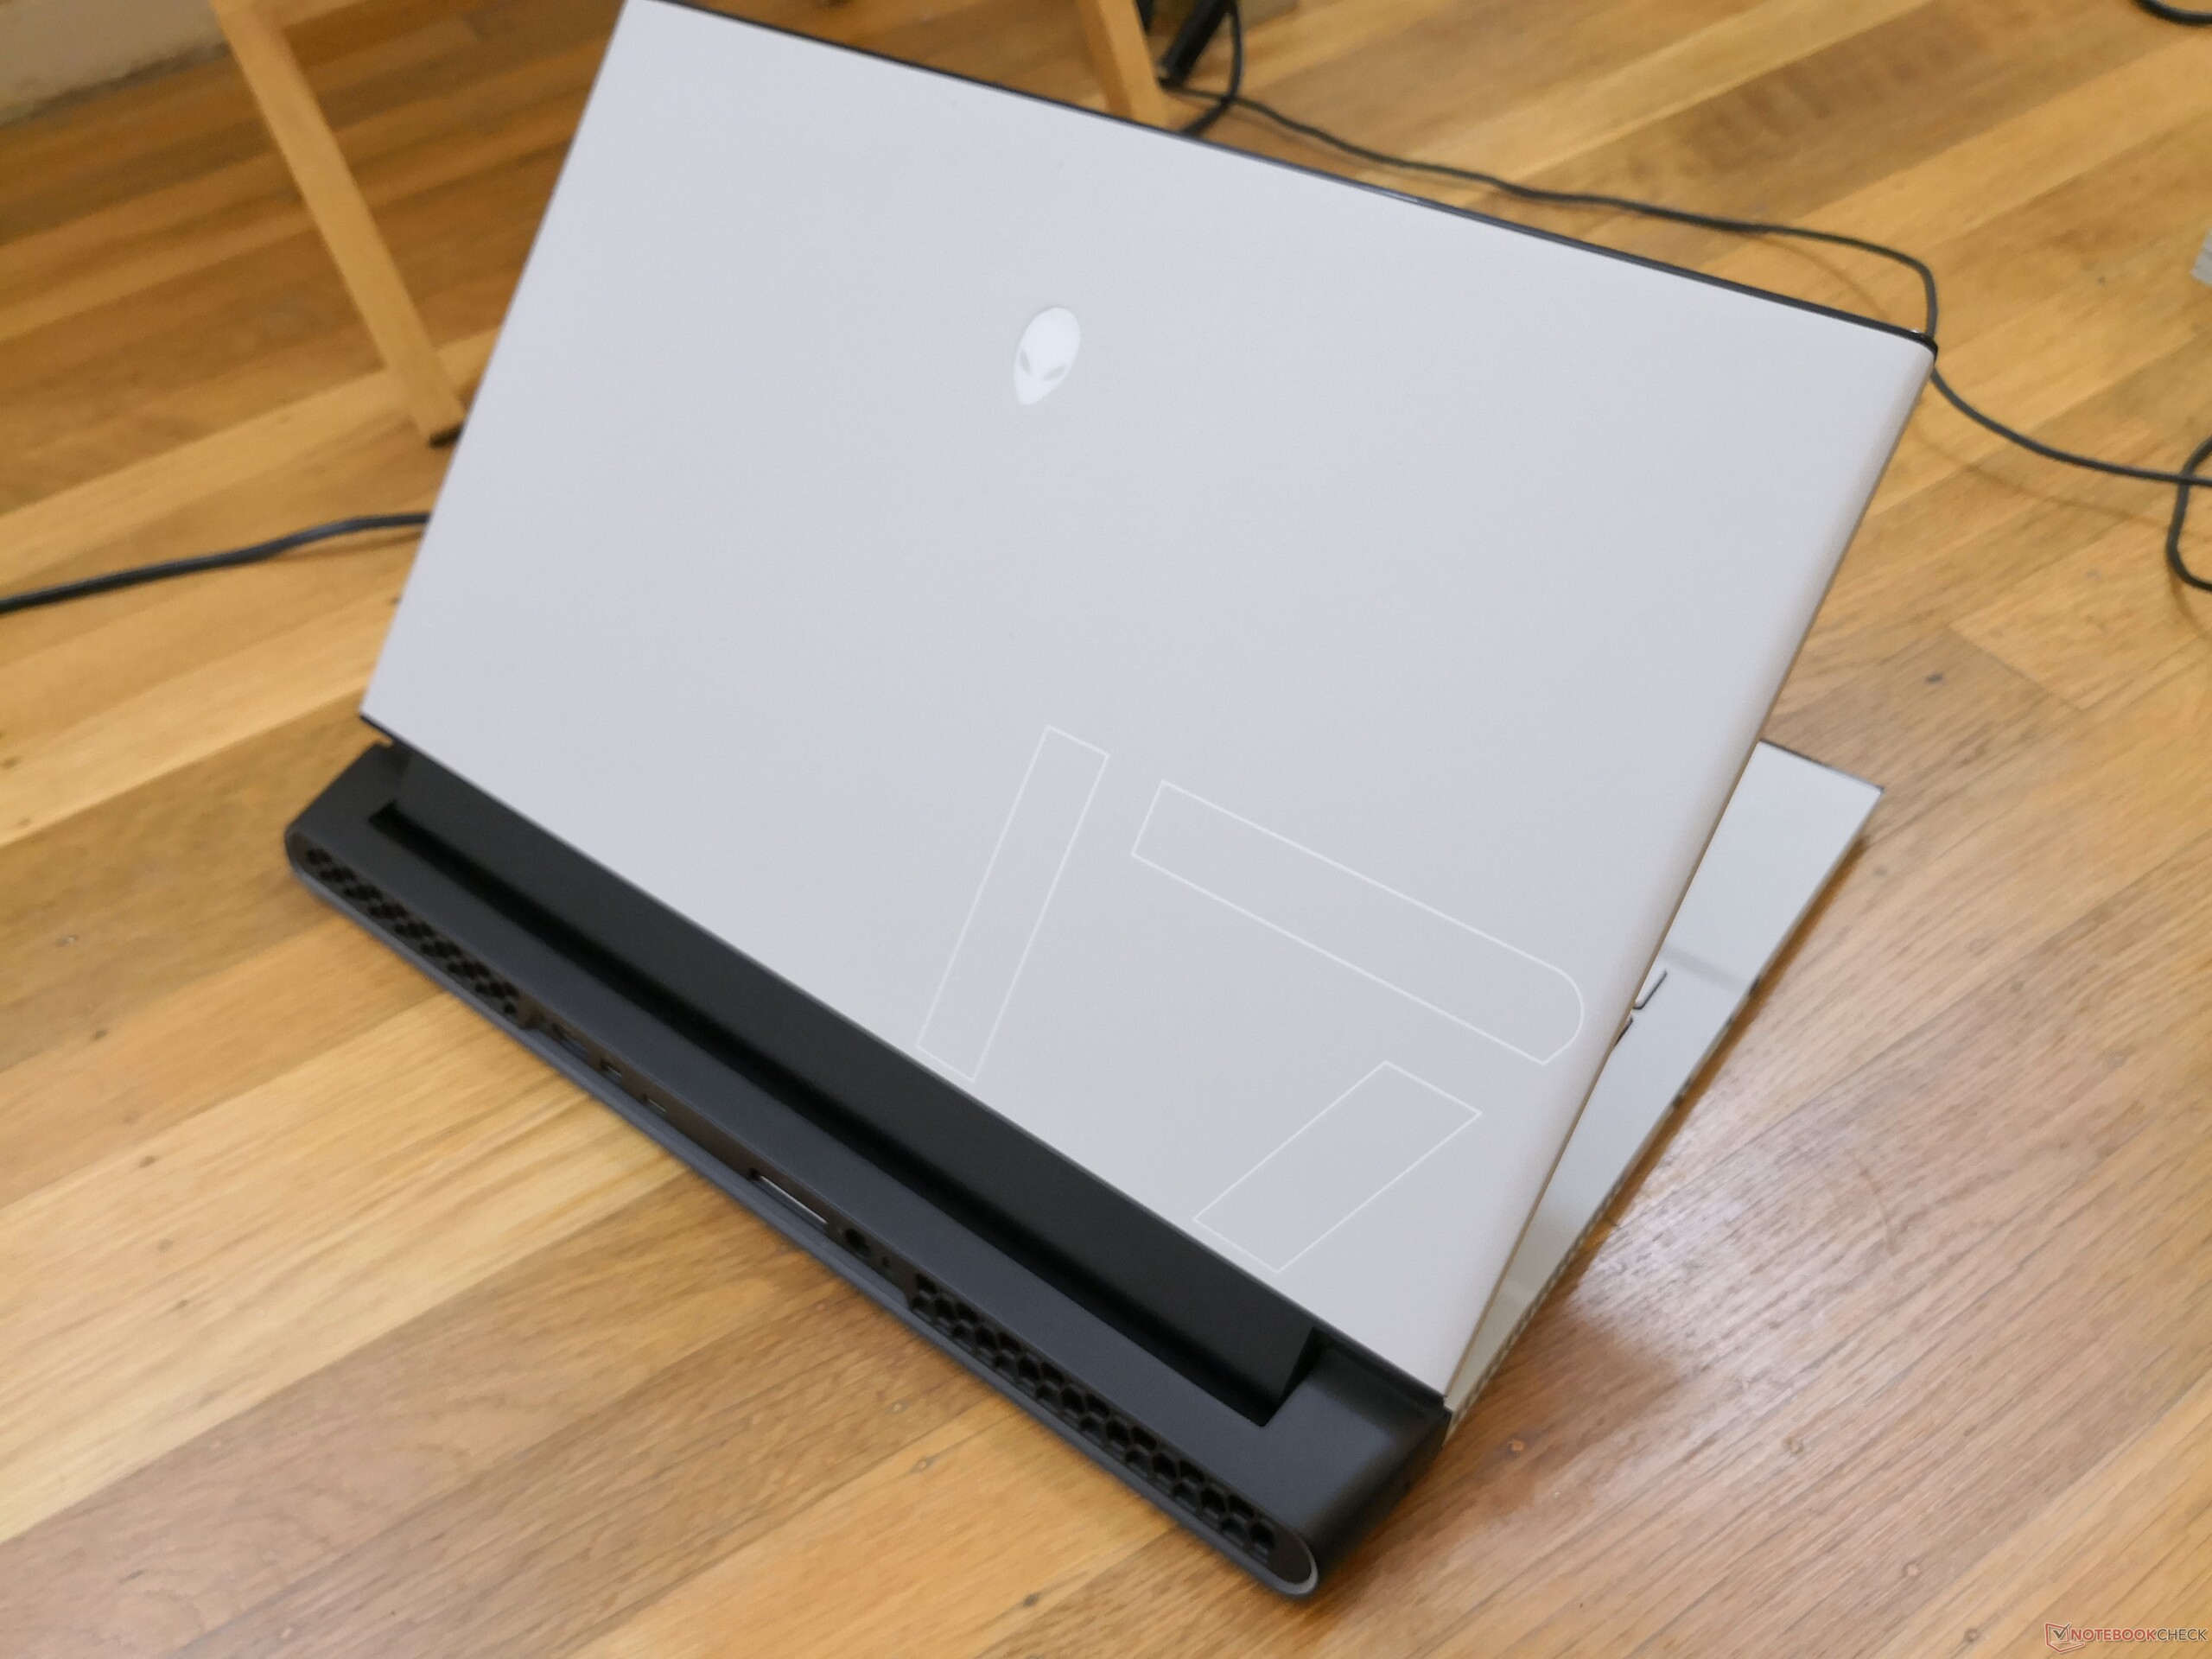
Alienware m17 R2 handlar helt och hållet om att maximera prestandan från seriens tunnaste chassi. Vill man utnyttja vad det här systemet har att erbjuda får man leva med fläktar som låter mycket, höga kärntemperaturer och ett fotavtryck som är stort till och med för en spellaptop på 17.3 tum.
Alienware m17 R2 P41E
- 07/31/2020 v7 (old)
Allen Ngo
Price comparison
