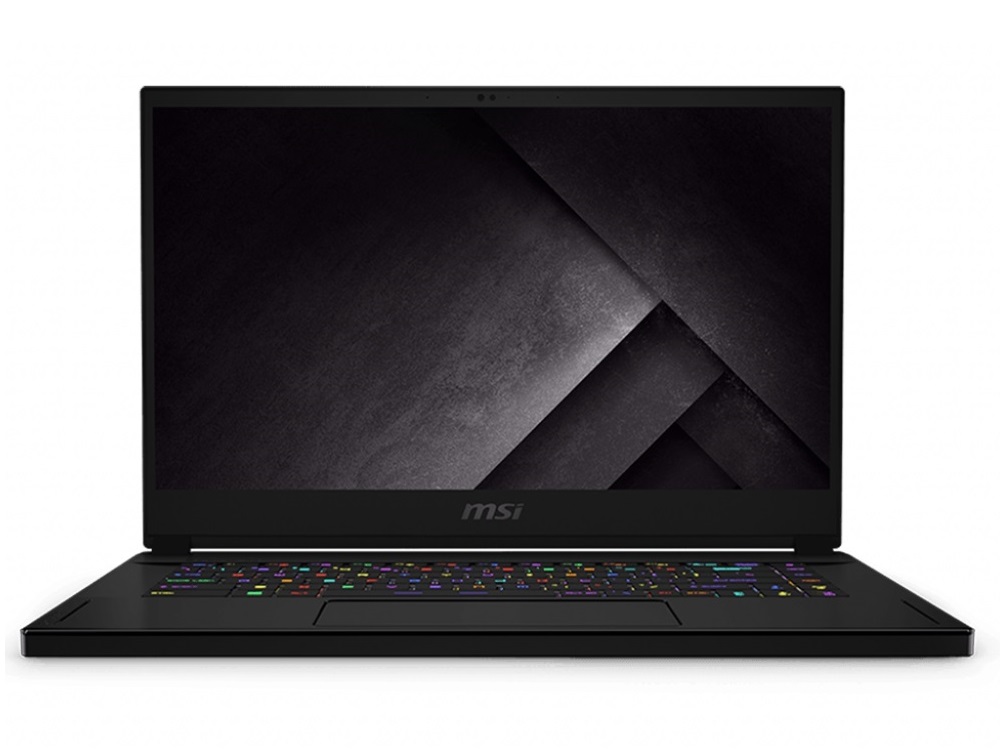
Test: MSI GS66 Stealth 10SFS - Visuellt nedtonad, akustiskt slående (Sammanfattning)
Gradering | Datum | Modell | Vikt | Höjd | Storlek | Upplösning | Pris |
|---|---|---|---|---|---|---|---|
| 82.8 % v7 (old) | 05/2020 | MSI GS66 Stealth 10SFS i9-10980HK, GeForce RTX 2070 Super Max-Q | 2.2 kg | 20 mm | 15.60" | 1920x1080 | |
| 84 % v7 (old) | 08/2019 | Acer Predator Triton 500 PT515-51-71PZ i7-9750H, GeForce RTX 2070 Max-Q | 2.1 kg | 18 mm | 15.60" | 1920x1080 | |
| 84 % v7 (old) | 05/2019 | Gigabyte Aero 15 Classic-XA i7-9750H, GeForce RTX 2070 Max-Q | 2.1 kg | 19 mm | 15.60" | 1920x1080 | |
| 82.3 % v7 (old) | 09/2019 | HP Omen X 2S 15-dg0075cl i7-9750H, GeForce RTX 2070 Max-Q | 2.4 kg | 19.8 mm | 15.60" | 1920x1080 | |
| 82.8 % v7 (old) | 12/2019 | Schenker XMG Neo 15 XNE15M19 i7-9750H, GeForce RTX 2070 Max-Q | 2.1 kg | 22 mm | 15.60" | 1920x1080 |


| |||||||||||||||||||||||||
Distribution av ljusstyrkan: 92 %
Mitt på batteriet: 316 cd/m²
Kontrast: 1505:1 (Svärta: 0.21 cd/m²)
ΔE ColorChecker Calman: 3.03 | ∀{0.5-29.43 Ø4.71}
calibrated: 1.1
ΔE Greyscale Calman: 3.9 | ∀{0.09-98 Ø4.96}
100% sRGB (Argyll 1.6.3 3D)
65% AdobeRGB 1998 (Argyll 1.6.3 3D)
70.8% AdobeRGB 1998 (Argyll 3D)
99.6% sRGB (Argyll 3D)
69.5% Display P3 (Argyll 3D)
Gamma: 2.42
CCT: 7439 K
| MSI GS66 Stealth 10SFS AUO B156HAN12.0 (AUO328E), IPS, 1920x1080, 15.6" | Acer Predator Triton 500 PT515-51-71PZ NV156FHM-N4K (BOE082A), IPS, 1920x1080, 15.6" | Gigabyte Aero 15 Classic-XA Sharp LQ156M1JW03 (SHP14C5), IGZO, 1920x1080, 15.6" | HP Omen X 2S 15-dg0075cl AU Optronics AUO82ED, IPS, 1920x1080, 15.6" | Schenker XMG Neo 15 XNE15M19 NV156FHM-N4G (BOE084D), IPS, 1920x1080, 15.6" | |
|---|---|---|---|---|---|
| Display | -7% | -5% | -6% | -8% | |
| Display P3 Coverage (%) | 69.5 | 64.6 -7% | 65.3 -6% | 66.2 -5% | 64 -8% |
| sRGB Coverage (%) | 99.6 | 92.6 -7% | 95.5 -4% | 92.3 -7% | 90.3 -9% |
| AdobeRGB 1998 Coverage (%) | 70.8 | 66 -7% | 66.5 -6% | 67.2 -5% | 65.4 -8% |
| Response Times | 23% | -13% | -11% | 3% | |
| Response Time Grey 50% / Grey 80% * (ms) | 14 ? | 5.2 ? 63% | 15.2 ? -9% | 15.2 ? -9% | 9.6 ? 31% |
| Response Time Black / White * (ms) | 9.6 ? | 11.2 ? -17% | 11.2 ? -17% | 10.8 ? -13% | 12 ? -25% |
| PWM Frequency (Hz) | 23580 ? | ||||
| Screen | -7% | -8% | -34% | -12% | |
| Brightness middle (cd/m²) | 316 | 288 -9% | 266 -16% | 324.8 3% | 313 -1% |
| Brightness (cd/m²) | 311 | 265 -15% | 248 -20% | 316 2% | 295 -5% |
| Brightness Distribution (%) | 92 | 84 -9% | 89 -3% | 84 -9% | 89 -3% |
| Black Level * (cd/m²) | 0.21 | 0.22 -5% | 0.31 -48% | 0.26 -24% | 0.3 -43% |
| Contrast (:1) | 1505 | 1309 -13% | 858 -43% | 1249 -17% | 1043 -31% |
| Colorchecker dE 2000 * | 3.03 | 3.22 -6% | 2.78 8% | 4.96 -64% | 3.33 -10% |
| Colorchecker dE 2000 max. * | 7.32 | 6.26 14% | 5.96 19% | 8.95 -22% | 6.25 15% |
| Colorchecker dE 2000 calibrated * | 1.1 | 1.5 -36% | 0.91 17% | 3.23 -194% | 1.77 -61% |
| Greyscale dE 2000 * | 3.9 | 3.43 12% | 3.58 8% | 5 -28% | 3.1 21% |
| Gamma | 2.42 91% | 2.41 91% | 2.46 89% | 2.21 100% | 2.51 88% |
| CCT | 7439 87% | 7290 89% | 7186 90% | 7742 84% | 6930 94% |
| Color Space (Percent of AdobeRGB 1998) (%) | 65 | 60 -8% | 62 -5% | 59.8 -8% | 59 -9% |
| Color Space (Percent of sRGB) (%) | 100 | 93 -7% | 96 -4% | 91.8 -8% | 90 -10% |
| Totalt genomsnitt (program/inställningar) | 3% /
-4% | -9% /
-8% | -17% /
-26% | -6% /
-10% |
* ... mindre är bättre
Visa svarstider
| ↔ Svarstid svart till vitt | ||
|---|---|---|
| 9.6 ms ... stiga ↗ och falla ↘ kombinerat | ↗ 5.2 ms stiga | 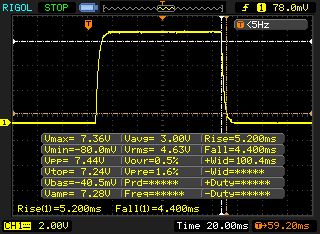 |
| ↘ 4.4 ms hösten | ||
| Skärmen visar snabba svarsfrekvenser i våra tester och bör passa för spel. I jämförelse sträcker sig alla testade enheter från 0.1 (minst) till 240 (maximalt) ms. » 26 % av alla enheter är bättre. Det betyder att den uppmätta svarstiden är bättre än genomsnittet av alla testade enheter (19.8 ms). | ||
| ↔ Svarstid 50 % grått till 80 % grått | ||
| 14 ms ... stiga ↗ och falla ↘ kombinerat | ↗ 6.8 ms stiga | 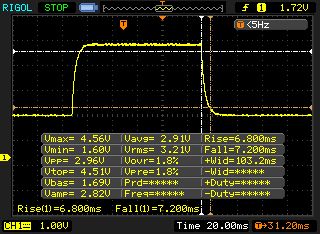 |
| ↘ 7.2 ms hösten | ||
| Skärmen visar bra svarsfrekvens i våra tester, men kan vara för långsam för konkurrenskraftiga spelare. I jämförelse sträcker sig alla testade enheter från 0.165 (minst) till 636 (maximalt) ms. » 28 % av alla enheter är bättre. Det betyder att den uppmätta svarstiden är bättre än genomsnittet av alla testade enheter (30.9 ms). | ||
Skärmflimmer / PWM (Puls-Width Modulation)
| Skärmflimmer / PWM upptäcktes inte | 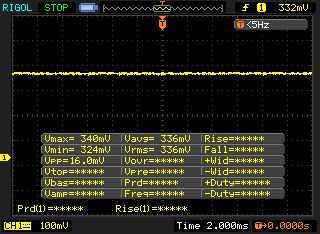 | ||
Som jämförelse: 52 % av alla testade enheter använder inte PWM för att dämpa skärmen. Om PWM upptäcktes mättes ett medelvärde av 7741 (minst: 5 - maximum: 343500) Hz. | |||
| Blender - v2.79 BMW27 CPU | |
| MSI GS66 Stealth 10SFS | |
| Genomsnitt av klass Gaming (79 - 330, n=101, senaste 2 åren) | |
| Geekbench 5.5 | |
| Single-Core | |
| Genomsnitt av klass Gaming (1403 - 2474, n=102, senaste 2 åren) | |
| MSI GS66 Stealth 10SFS | |
| Multi-Core | |
| Genomsnitt av klass Gaming (6460 - 28263, n=102, senaste 2 åren) | |
| MSI GS66 Stealth 10SFS | |
| HWBOT x265 Benchmark v2.2 - 4k Preset | |
| Genomsnitt av klass Gaming (11.5 - 44.4, n=102, senaste 2 åren) | |
| MSI GS66 Stealth 10SFS | |
| LibreOffice - 20 Documents To PDF | |
| MSI GS66 Stealth 10SFS | |
| Genomsnitt av klass Gaming (33.2 - 88.8, n=102, senaste 2 åren) | |
| R Benchmark 2.5 - Overall mean | |
| MSI GS66 Stealth 10SFS | |
| Genomsnitt av klass Gaming (0.3439 - 0.59, n=102, senaste 2 åren) | |
* ... mindre är bättre
| DPC Latencies / LatencyMon - interrupt to process latency (max), Web, Youtube, Prime95 | |
| MSI GS66 Stealth 10SFS | |
* ... mindre är bättre
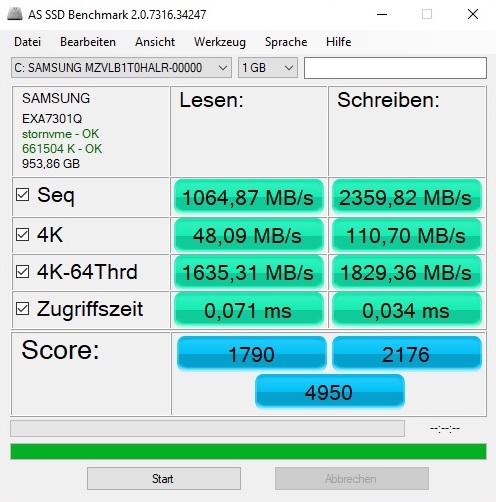
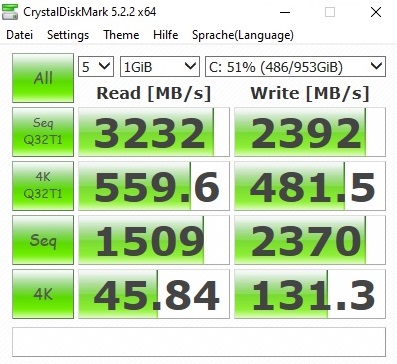
| MSI GS66 Stealth 10SFS Samsung SSD PM981 MZVLB1T0HALR | Acer Predator Triton 500 PT515-51-71PZ WDC PC SN720 SDAPNTW-512G | Gigabyte Aero 15 Classic-XA Intel SSD 760p SSDPEKKW512G8 | HP Omen X 2S 15-dg0075cl WDC PC SN720 SDAPNTW-1T00 | Schenker XMG Neo 15 XNE15M19 Seagate FireCuda 510 SSD ZP1000GM30001 | |
|---|---|---|---|---|---|
| CrystalDiskMark 5.2 / 6 | -4% | -4% | 2% | -12% | |
| Write 4K (MB/s) | 131.3 | 108.8 -17% | 115.5 -12% | 137.4 5% | 108.7 -17% |
| Read 4K (MB/s) | 45.84 | 40.31 -12% | 58 27% | 41.37 -10% | 41.4 -10% |
| Write Seq (MB/s) | 2370 | 2488 5% | 1555 -34% | 2500 5% | 1083 -54% |
| Read Seq (MB/s) | 1509 | 1916 27% | 2590 72% | 1576 4% | 917 -39% |
| Write 4K Q32T1 (MB/s) | 481.5 | 382.4 -21% | 369.3 -23% | 446.7 -7% | 468.5 -3% |
| Read 4K Q32T1 (MB/s) | 560 | 421.8 -25% | 441.7 -21% | 522 -7% | 530 -5% |
| Write Seq Q32T1 (MB/s) | 2392 | 2542 6% | 1547 -35% | 2796 17% | 3057 28% |
| Read Seq Q32T1 (MB/s) | 3232 | 3320 3% | 2969 -8% | 3415 6% | 3422 6% |

| 3DMark 11 Performance | 21934 poäng | |
| 3DMark Cloud Gate Standard Score | 45202 poäng | |
| 3DMark Fire Strike Score | 17312 poäng | |
| 3DMark Time Spy Score | 7272 poäng | |
Hjälp | ||
| The Witcher 3 - 1920x1080 Ultra Graphics & Postprocessing (HBAO+) | |
| Genomsnitt av klass Gaming (104.7 - 240, n=7, senaste 2 åren) | |
| MSI GS66 Stealth 10SFS | |
| HP Omen X 2S 15-dg0075cl | |
| Acer Predator Triton 500 PT515-51-71PZ | |
| Gigabyte Aero 15 Classic-XA | |
| Schenker XMG Neo 15 XNE15M19 | |
| låg | med. | hög | ultra | |
|---|---|---|---|---|
| GTA V (2015) | 182 | 174 | 153 | 83.4 |
| The Witcher 3 (2015) | 131 | 70.5 | ||
| Dota 2 Reborn (2015) | 153 | 138 | 128 | 120 |
| X-Plane 11.11 (2018) | 113 | 97.4 | 82.3 | |
| Shadow of the Tomb Raider (2018) | 102 | 91 | ||
| Battlefield V (2018) | 121 | 113 | ||
| Apex Legends (2019) | 140 | 139 | ||
| Borderlands 3 (2019) | 76.3 | 58.9 | ||
| FIFA 20 (2019) | 196 | 190 | ||
| Need for Speed Heat (2019) | 88.2 | 80.7 | ||
| Star Wars Jedi Fallen Order (2019) | 95 | 88.8 | ||
| Escape from Tarkov (2020) | 121 | 119 | ||
| Hunt Showdown (2020) | 91.6 | |||
| Doom Eternal (2020) | 141 | 137 | ||
| Gears Tactics (2020) | 116 | 90.6 |
Ljudnivå
| Låg belastning |
| 32 / 34 / 39 dB(A) |
| Hög belastning |
| 53 / 53 dB(A) |
 | ||
30 dB tyst 40 dB(A) hörbar 50 dB(A) högt ljud |
||
min: | ||
| MSI GS66 Stealth 10SFS i9-10980HK, GeForce RTX 2070 Super Max-Q | Acer Predator Triton 500 PT515-51-71PZ i7-9750H, GeForce RTX 2070 Max-Q | Gigabyte Aero 15 Classic-XA i7-9750H, GeForce RTX 2070 Max-Q | HP Omen X 2S 15-dg0075cl i7-9750H, GeForce RTX 2070 Max-Q | Schenker XMG Neo 15 XNE15M19 i7-9750H, GeForce RTX 2070 Max-Q | |
|---|---|---|---|---|---|
| Noise | 4% | 0% | 8% | 1% | |
| av / miljö * (dB) | 30 | 30 -0% | 30 -0% | 29 3% | 31 -3% |
| Idle Minimum * (dB) | 32 | 30 6% | 31 3% | 30.5 5% | 31 3% |
| Idle Average * (dB) | 34 | 33 3% | 34 -0% | 31.5 7% | 34 -0% |
| Idle Maximum * (dB) | 39 | 39 -0% | 39 -0% | 31.5 19% | 37 5% |
| Load Average * (dB) | 53 | 45 15% | 46 13% | 40.6 23% | 47 11% |
| Witcher 3 ultra * (dB) | 48 | 49 -2% | 53 -10% | 49.5 -3% | 50 -4% |
| Load Maximum * (dB) | 53 | 51 4% | 55 -4% | 53.4 -1% | 54 -2% |
* ... mindre är bättre
(-) Den maximala temperaturen på ovansidan är 53 °C / 127 F, jämfört med genomsnittet av 40.4 °C / 105 F , allt från 21.2 till 68.8 °C för klassen Gaming.
(-) Botten värms upp till maximalt 55 °C / 131 F, jämfört med genomsnittet av 43.2 °C / 110 F
(+) Vid tomgångsbruk är medeltemperaturen för ovansidan 26.8 °C / 80 F, jämfört med enhetsgenomsnittet på 33.9 °C / ### class_avg_f### F.
(-) När du spelar The Witcher 3 är medeltemperaturen för ovansidan 44 °C / 111 F, jämfört med enhetsgenomsnittet på 33.9 °C / ## #class_avg_f### F.
(±) Handledsstöden och pekplattan kan bli väldigt varma vid beröring med maximalt 37 °C / 98.6 F.
(-) Medeltemperaturen för handledsstödsområdet på liknande enheter var 28.8 °C / 83.8 F (-8.2 °C / -14.8 F).
| MSI GS66 Stealth 10SFS i9-10980HK, GeForce RTX 2070 Super Max-Q | Acer Predator Triton 500 PT515-51-71PZ i7-9750H, GeForce RTX 2070 Max-Q | Gigabyte Aero 15 Classic-XA i7-9750H, GeForce RTX 2070 Max-Q | HP Omen X 2S 15-dg0075cl i7-9750H, GeForce RTX 2070 Max-Q | Schenker XMG Neo 15 XNE15M19 i7-9750H, GeForce RTX 2070 Max-Q | |
|---|---|---|---|---|---|
| Heat | 0% | -10% | -24% | -13% | |
| Maximum Upper Side * (°C) | 53 | 49 8% | 58 -9% | 48.8 8% | 60 -13% |
| Maximum Bottom * (°C) | 55 | 59 -7% | 64 -16% | 55 -0% | 66 -20% |
| Idle Upper Side * (°C) | 28 | 28 -0% | 30 -7% | 41 -46% | 30 -7% |
| Idle Bottom * (°C) | 29 | 29 -0% | 31 -7% | 45.6 -57% | 32 -10% |
* ... mindre är bättre
MSI GS66 Stealth 10SFS ljudanalys
(+) | högtalare kan spela relativt högt (91 dB)
Bas 100 - 315 Hz
(-) | nästan ingen bas - i genomsnitt 25.3% lägre än medianen
(+) | basen är linjär (6.8% delta till föregående frekvens)
Mellan 400 - 2000 Hz
(±) | högre mellan - i genomsnitt 9.2% högre än median
(±) | linjäriteten för mids är genomsnittlig (8.3% delta till föregående frekvens)
Högsta 2 - 16 kHz
(+) | balanserade toppar - endast 2.9% från medianen
(+) | toppar är linjära (5.8% delta till föregående frekvens)
Totalt 100 - 16 000 Hz
(±) | linjäriteten för det totala ljudet är genomsnittlig (23.5% skillnad mot median)
Jämfört med samma klass
» 85% av alla testade enheter i den här klassen var bättre, 5% liknande, 10% sämre
» Den bästa hade ett delta på 6%, genomsnittet var 18%, sämst var 132%
Jämfört med alla testade enheter
» 70% av alla testade enheter var bättre, 6% liknande, 24% sämre
» Den bästa hade ett delta på 4%, genomsnittet var 23%, sämst var 134%
Acer Predator Triton 500 PT515-51-71PZ ljudanalys
(±) | högtalarljudstyrkan är genomsnittlig men bra (80 dB)
Bas 100 - 315 Hz
(±) | reducerad bas - i genomsnitt 12.2% lägre än medianen
(±) | linjäriteten för basen är genomsnittlig (12.6% delta till föregående frekvens)
Mellan 400 - 2000 Hz
(+) | balanserad mellan - endast 4.5% från medianen
(+) | mids är linjära (4.7% delta till föregående frekvens)
Högsta 2 - 16 kHz
(+) | balanserade toppar - endast 2.2% från medianen
(+) | toppar är linjära (3.2% delta till föregående frekvens)
Totalt 100 - 16 000 Hz
(+) | det totala ljudet är linjärt (14.8% skillnad mot median)
Jämfört med samma klass
» 29% av alla testade enheter i den här klassen var bättre, 7% liknande, 63% sämre
» Den bästa hade ett delta på 6%, genomsnittet var 18%, sämst var 132%
Jämfört med alla testade enheter
» 20% av alla testade enheter var bättre, 4% liknande, 76% sämre
» Den bästa hade ett delta på 4%, genomsnittet var 23%, sämst var 134%
| Av/Standby | |
| Låg belastning | |
| Hög belastning |
|
Förklaring:
min: | |
| MSI GS66 Stealth 10SFS i9-10980HK, GeForce RTX 2070 Super Max-Q | Acer Predator Triton 500 PT515-51-71PZ i7-9750H, GeForce RTX 2070 Max-Q | Gigabyte Aero 15 Classic-XA i7-9750H, GeForce RTX 2070 Max-Q | HP Omen X 2S 15-dg0075cl i7-9750H, GeForce RTX 2070 Max-Q | Schenker XMG Neo 15 XNE15M19 i7-9750H, GeForce RTX 2070 Max-Q | |
|---|---|---|---|---|---|
| Power Consumption | 24% | -17% | -109% | 15% | |
| Idle Minimum * (Watt) | 13 | 7 46% | 21 -62% | 46 -254% | 11 15% |
| Idle Average * (Watt) | 16 | 12 25% | 23 -44% | 59 -269% | 15 6% |
| Idle Maximum * (Watt) | 27 | 22 19% | 32 -19% | 65.5 -143% | 21 22% |
| Load Average * (Watt) | 109 | 86 21% | 97 11% | 99.8 8% | 94 14% |
| Witcher 3 ultra * (Watt) | 155 | 144 7% | 148 5% | 154.1 1% | 143 8% |
| Load Maximum * (Watt) | 236 | 177 25% | 213 10% | 222.7 6% | 173 27% |
* ... mindre är bättre
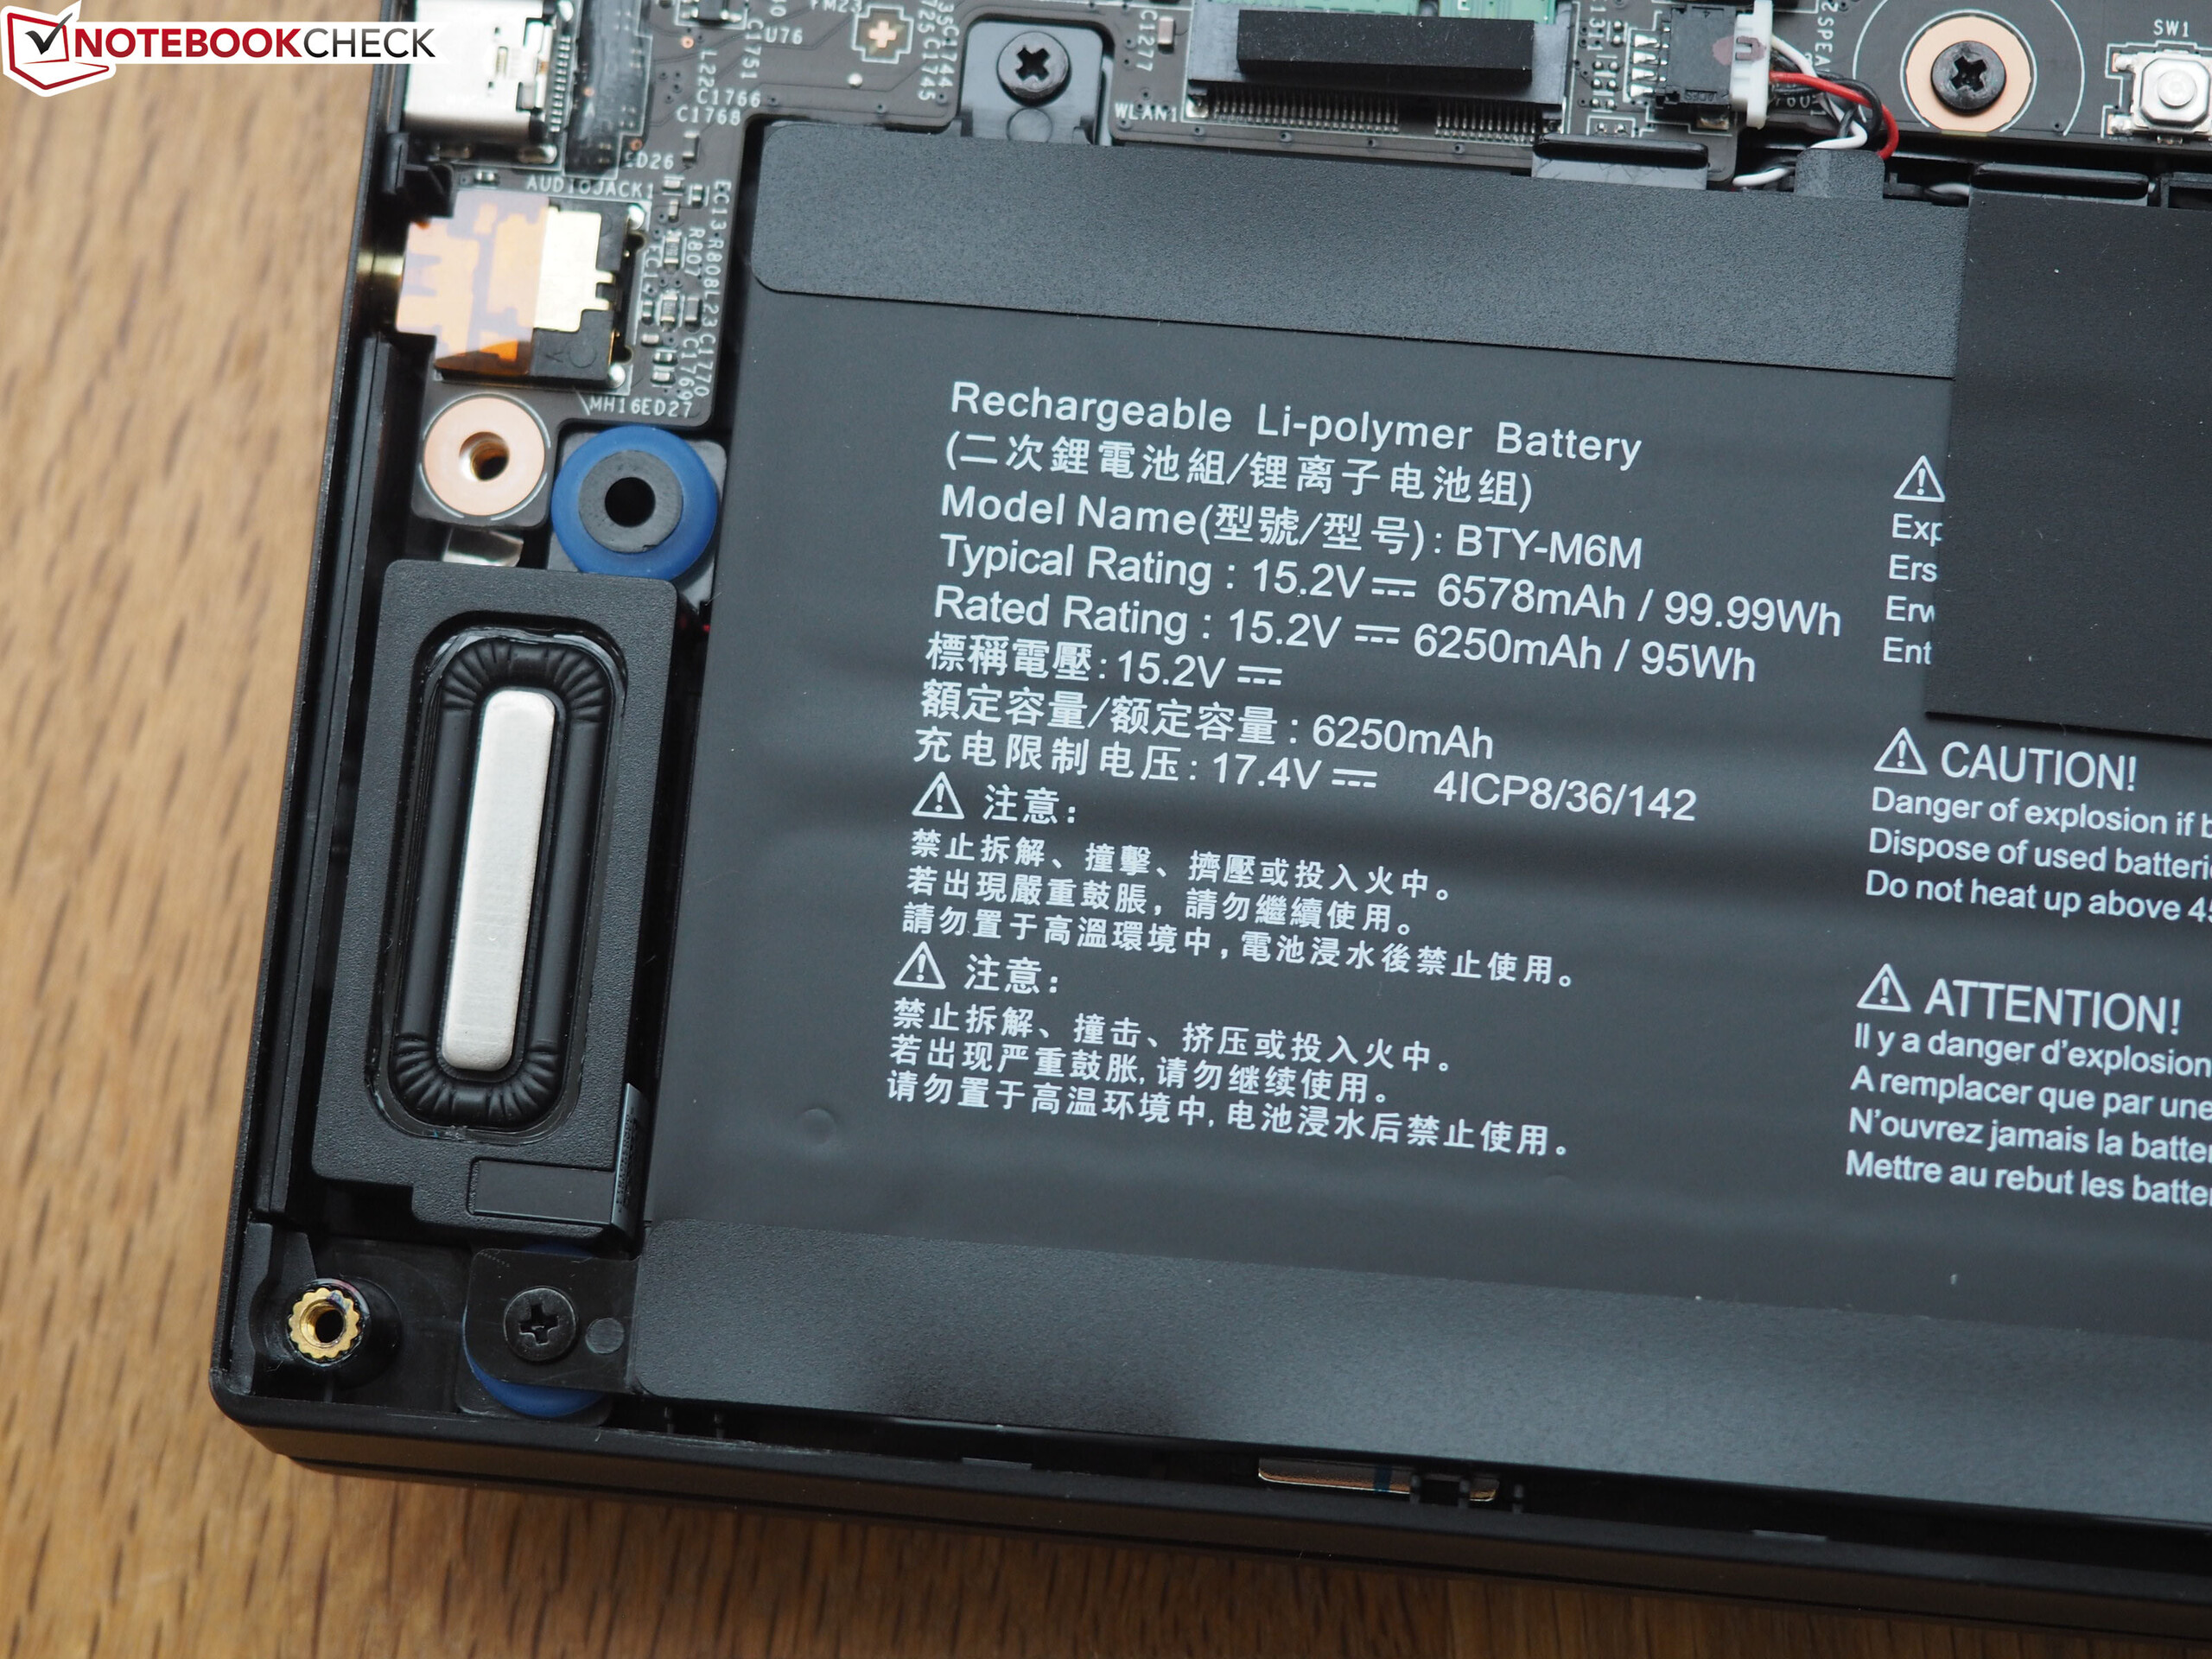
| MSI GS66 Stealth 10SFS i9-10980HK, GeForce RTX 2070 Super Max-Q, 99.99 Wh | Acer Predator Triton 500 PT515-51-71PZ i7-9750H, GeForce RTX 2070 Max-Q, Wh | Gigabyte Aero 15 Classic-XA i7-9750H, GeForce RTX 2070 Max-Q, 94.24 Wh | HP Omen X 2S 15-dg0075cl i7-9750H, GeForce RTX 2070 Max-Q, 72 Wh | Schenker XMG Neo 15 XNE15M19 i7-9750H, GeForce RTX 2070 Max-Q, 62 Wh | Genomsnitt av klass Gaming | |
|---|---|---|---|---|---|---|
| Batteridrifttid | 19% | 33% | -48% | -15% | -1% | |
| Reader / Idle (h) | 8.4 | 11.1 32% | 9.1 8% | 3.7 -56% | 7.3 -13% | 7.84 ? -7% |
| WiFi v1.3 (h) | 6.1 | 8 31% | 7 15% | 2.2 -64% | 5.7 -7% | 7.08 ? 16% |
| Load (h) | 1.7 | 1.6 -6% | 3 76% | 1.3 -24% | 1.3 -24% | 1.496 ? -12% |
| H.264 (h) | 6.8 | 8.27 ? |
För
Emot
Läs den fullständiga versionen av den här recensionen på engelska här.
GS66 är ett tydligt steg framåt jämfört med GS65.
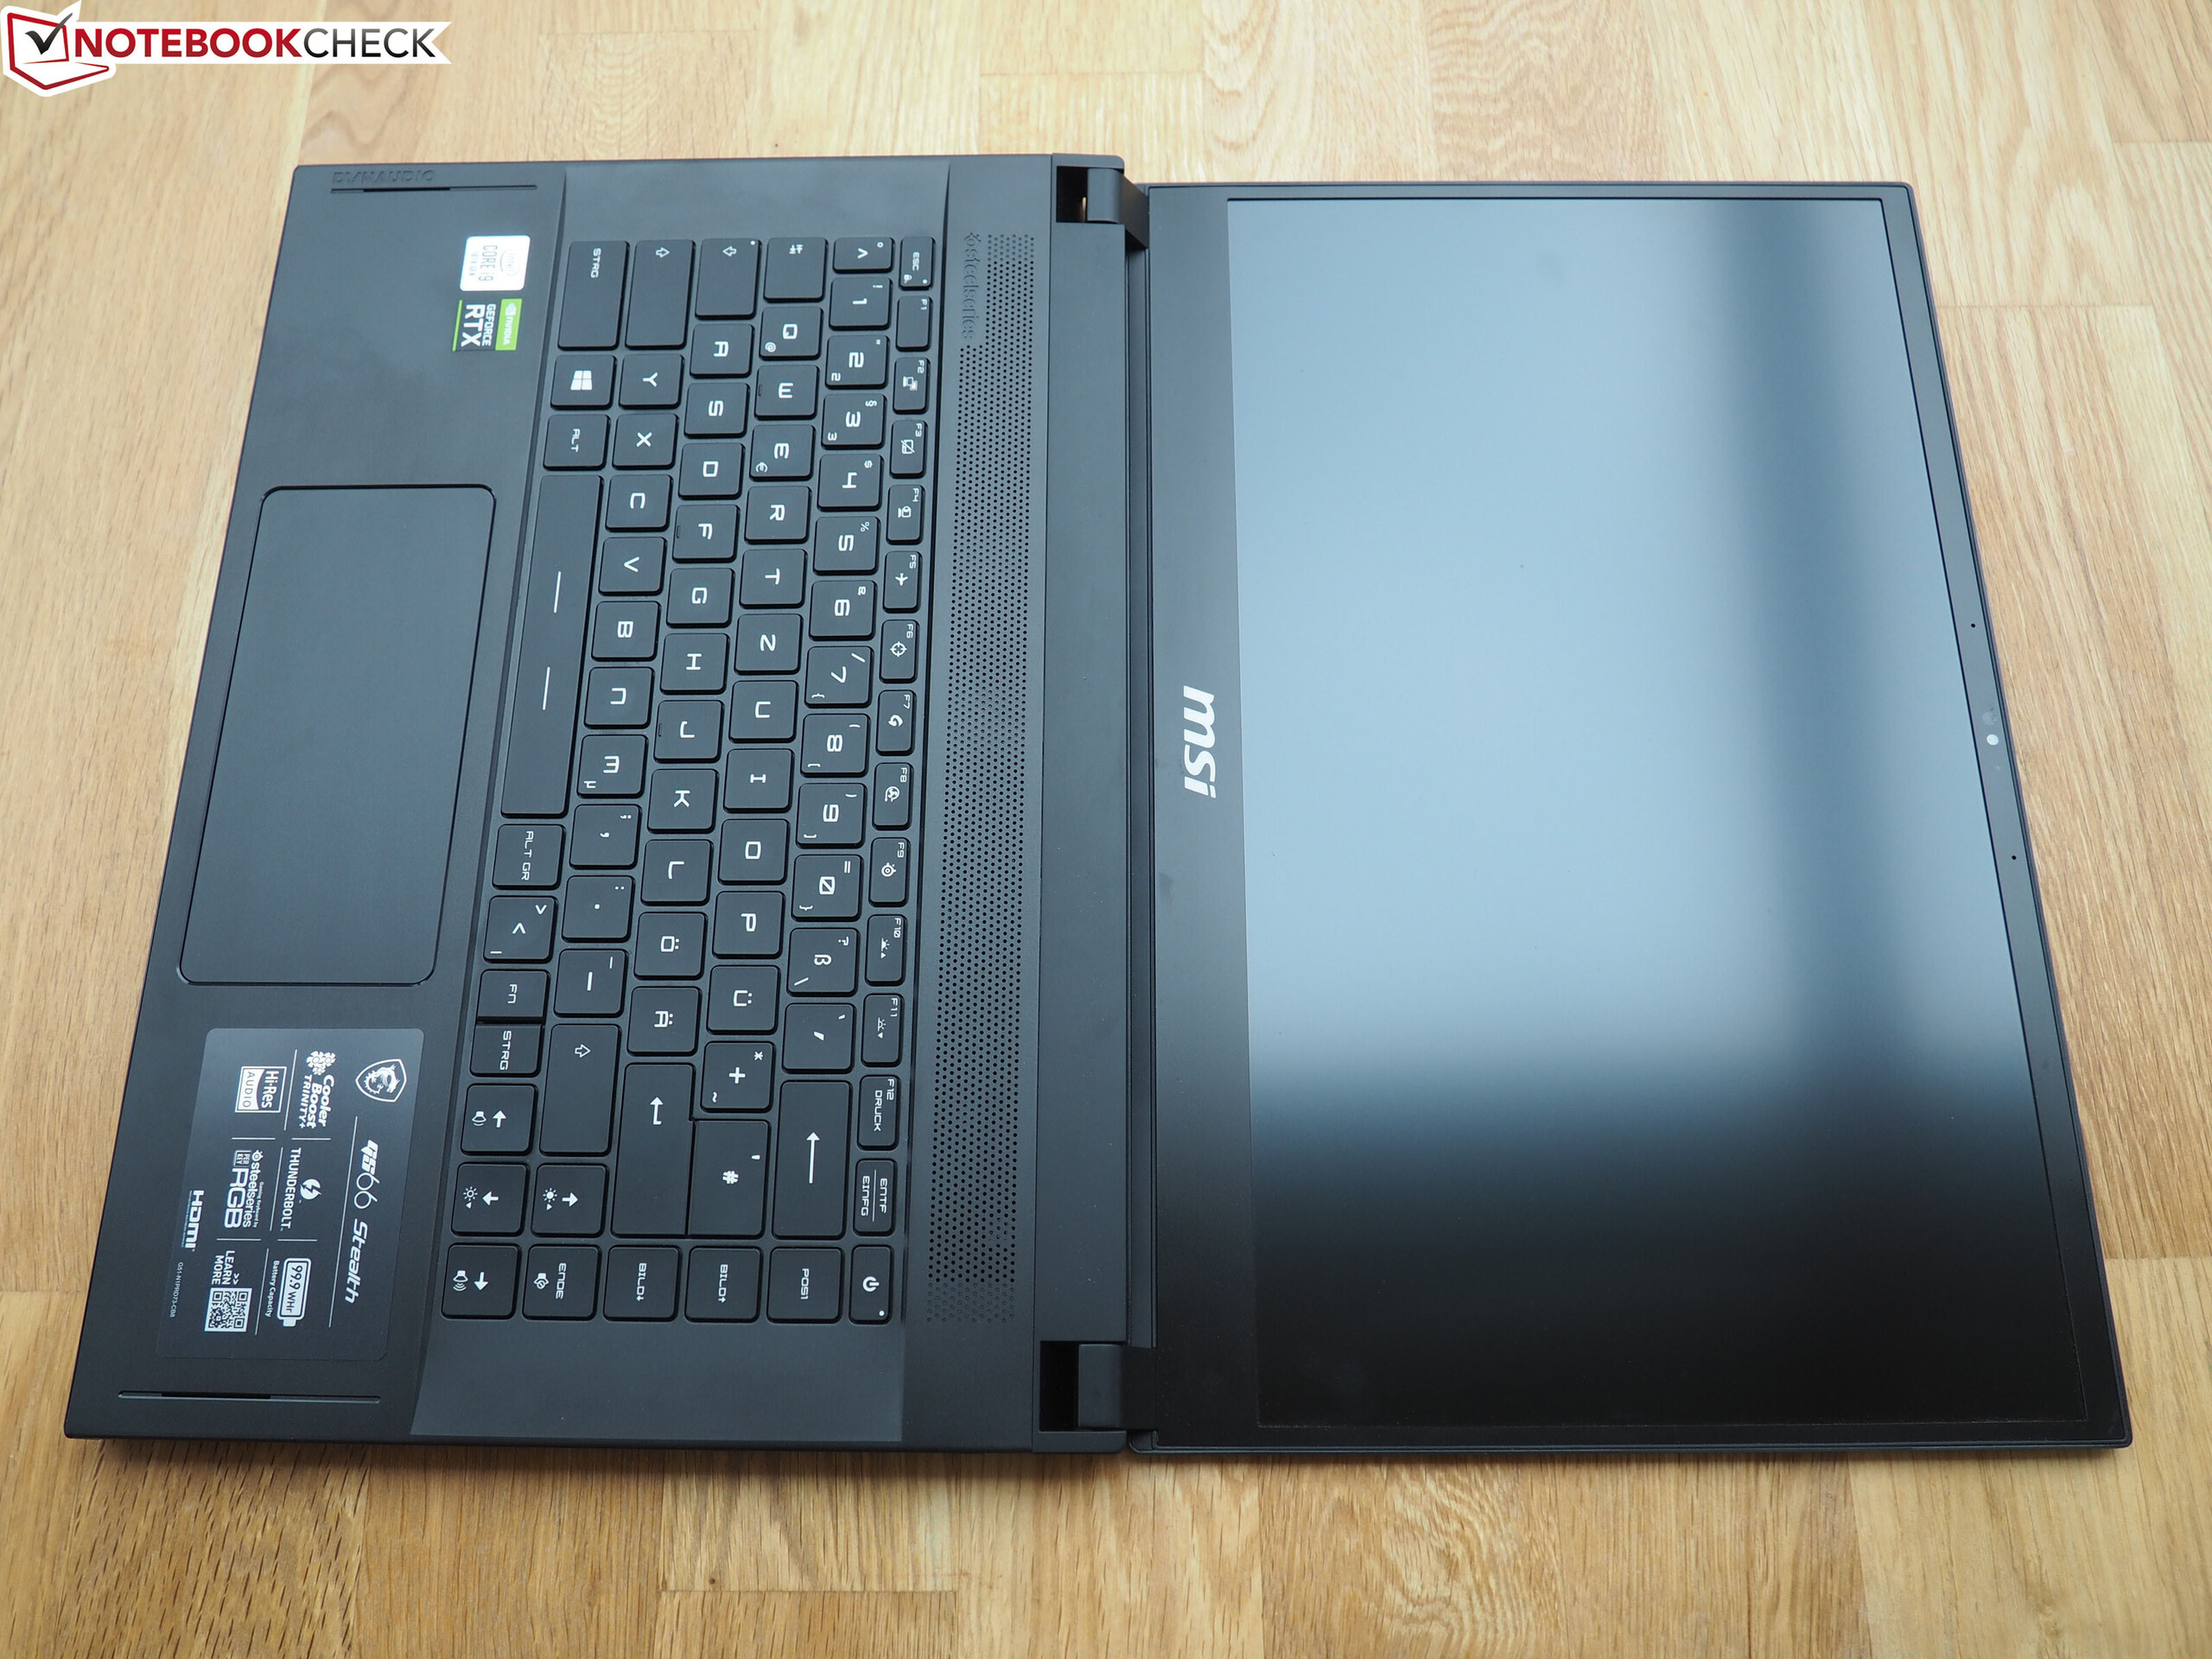
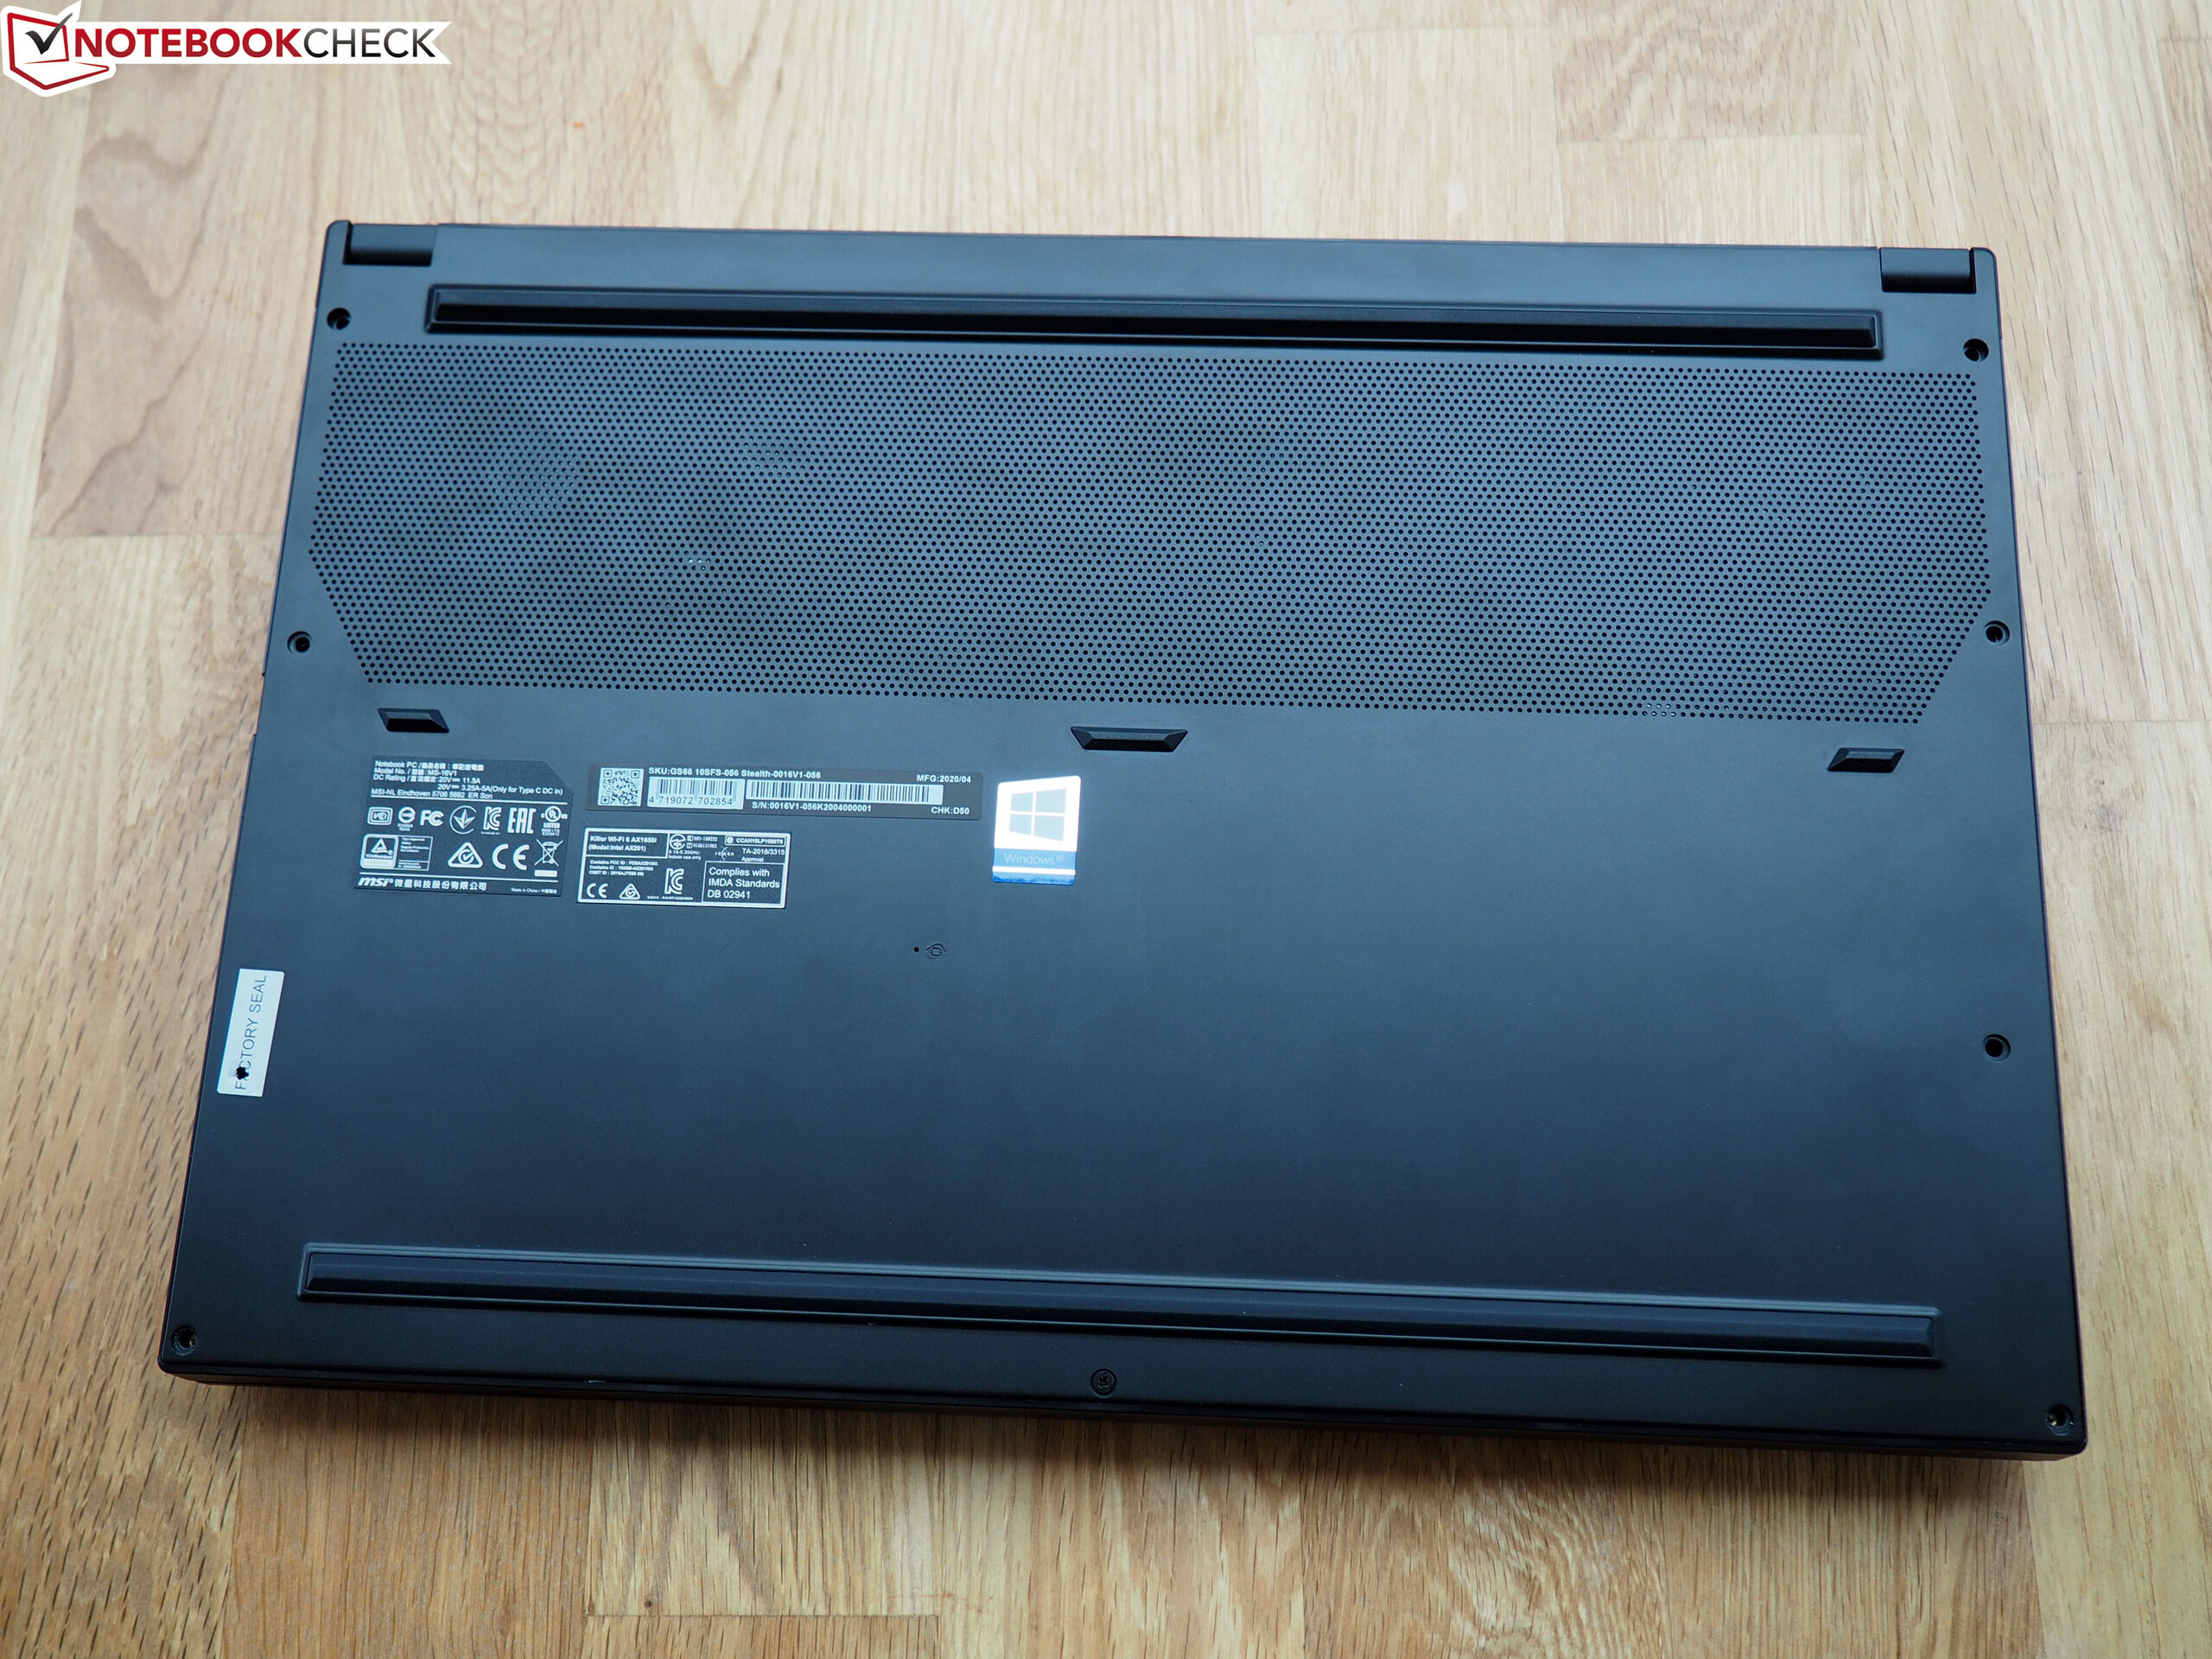
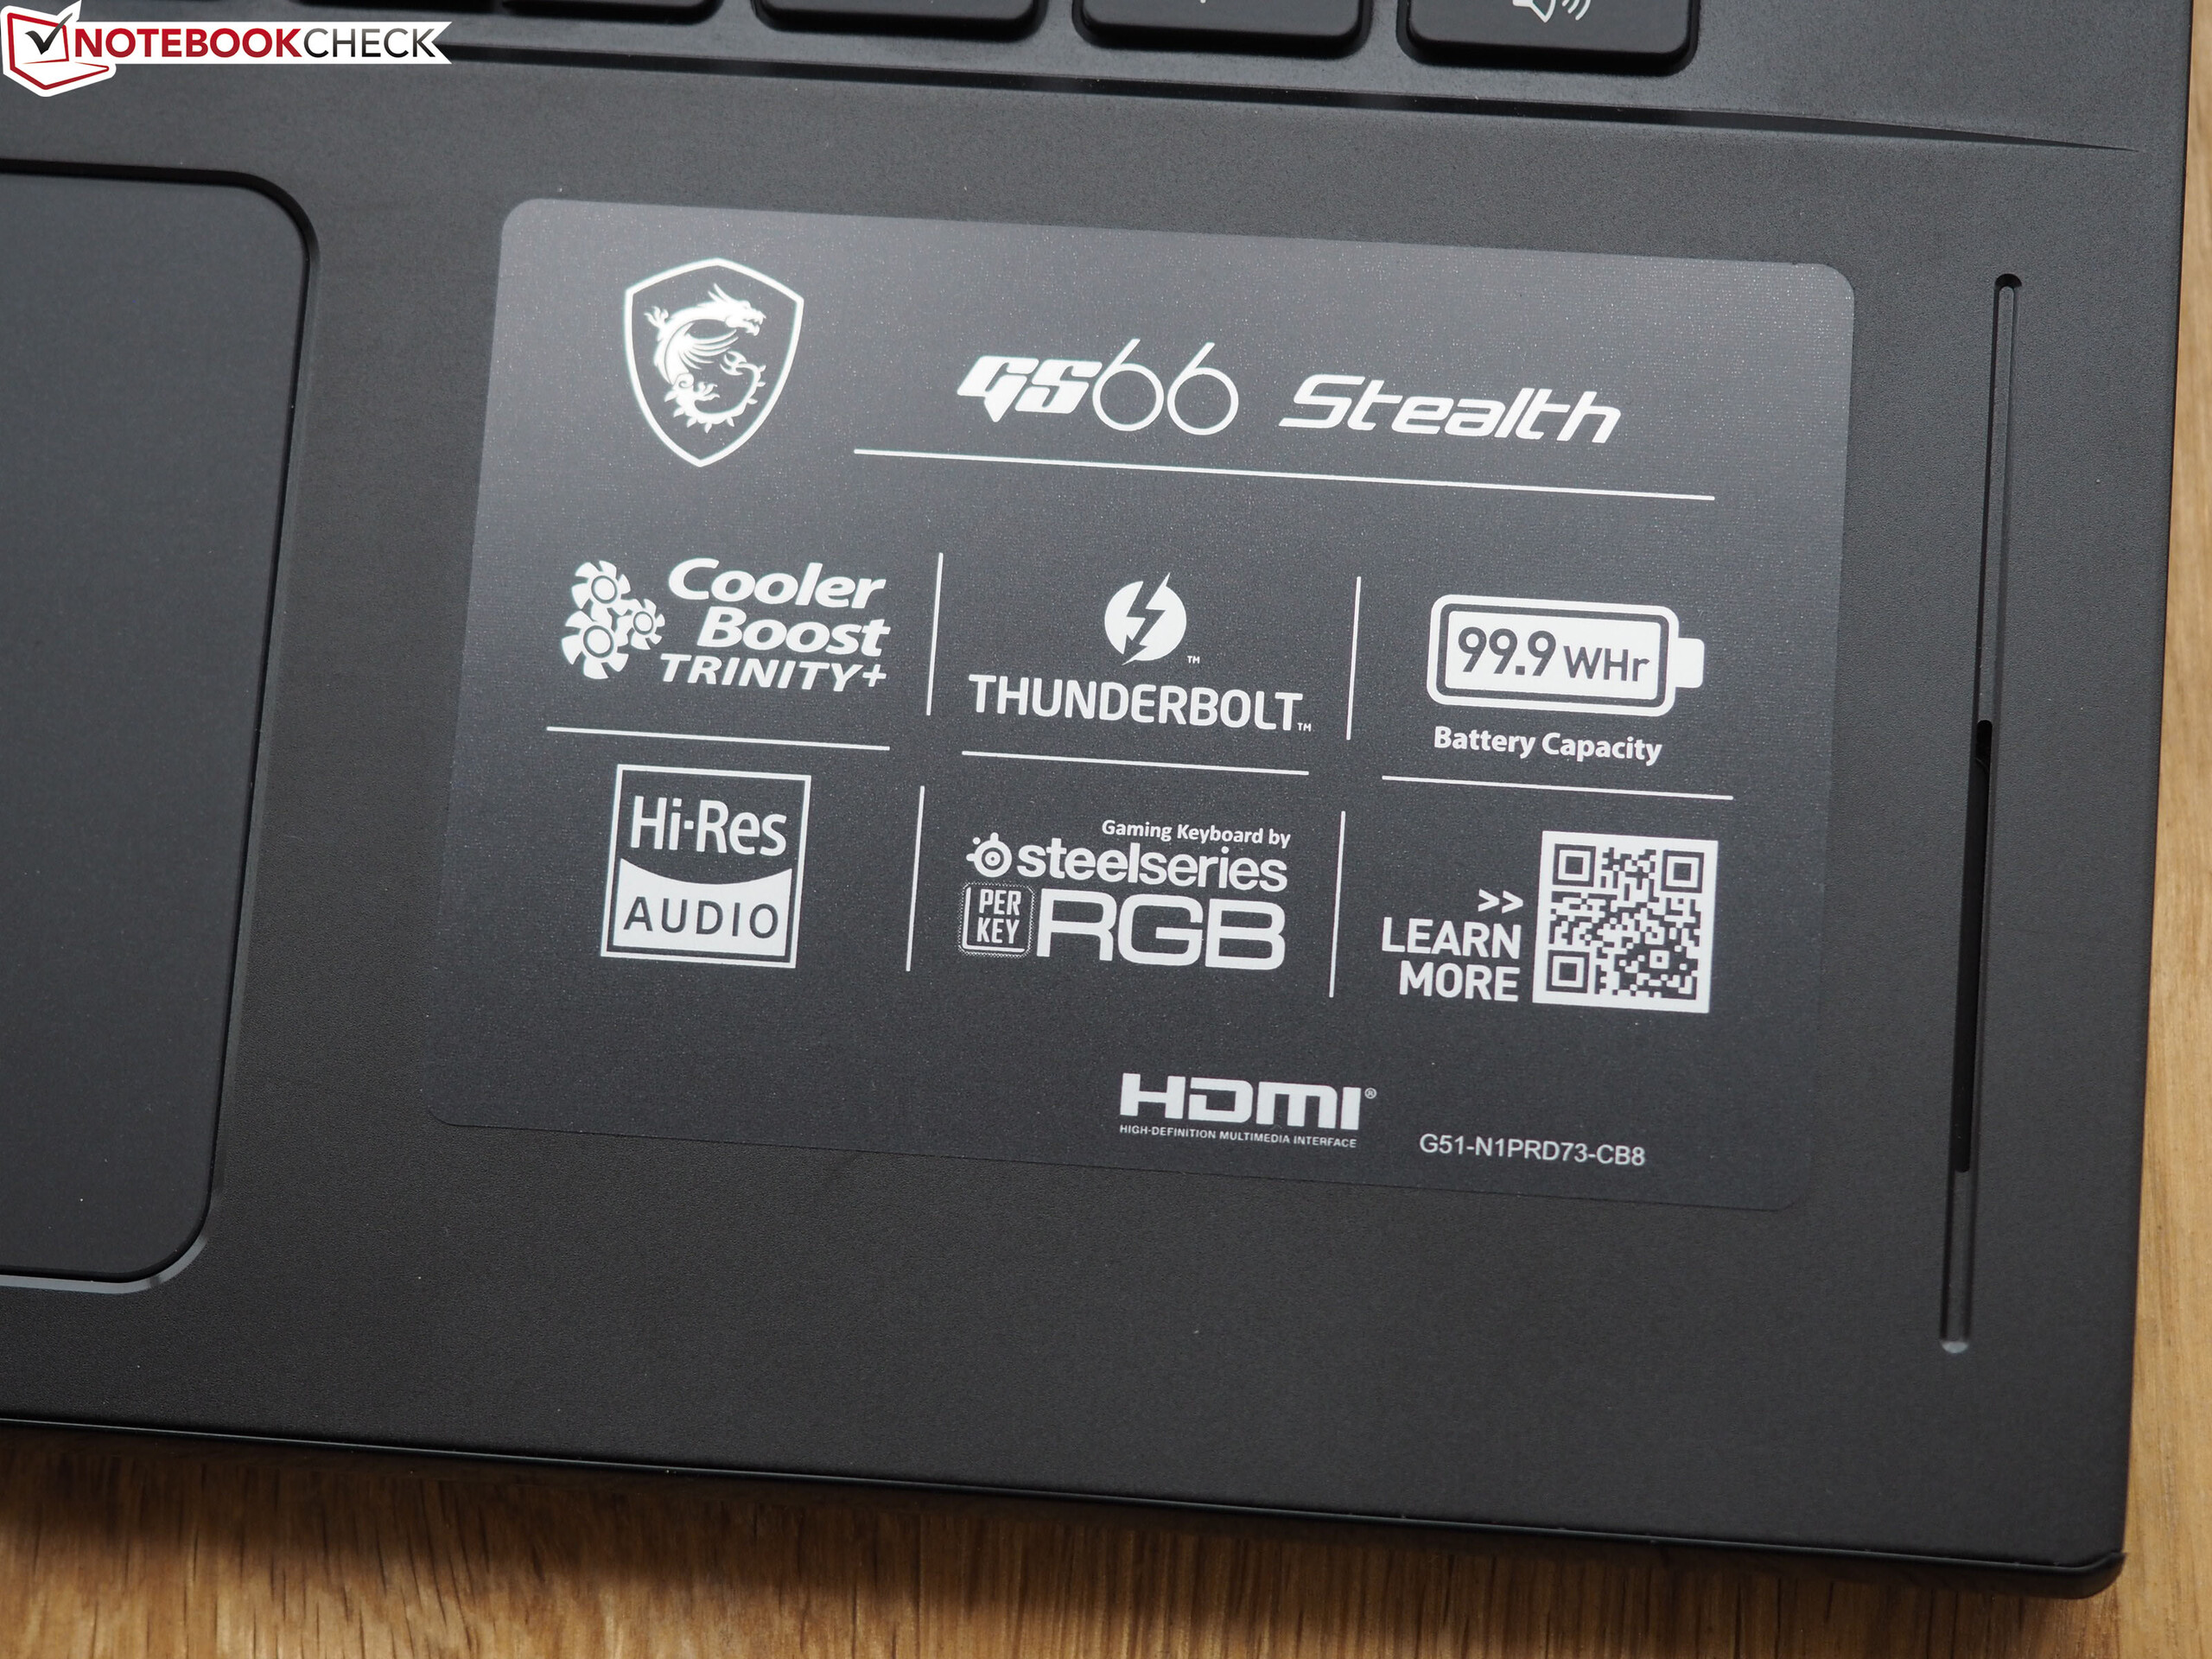
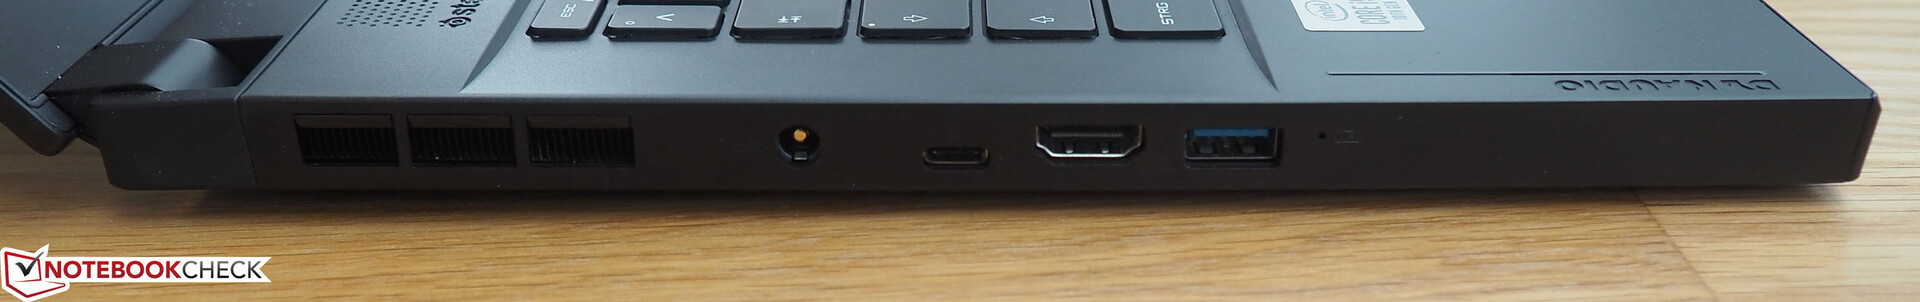
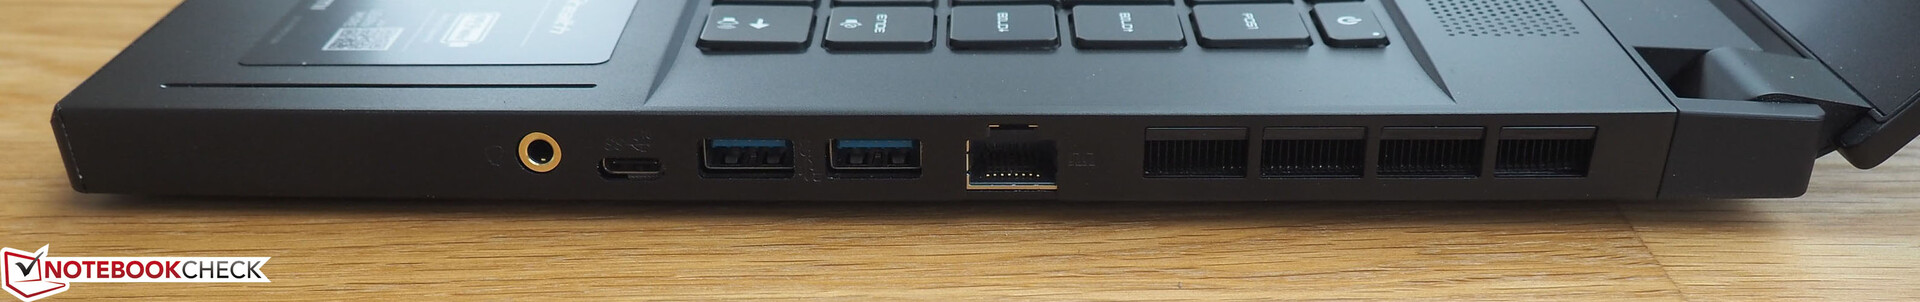
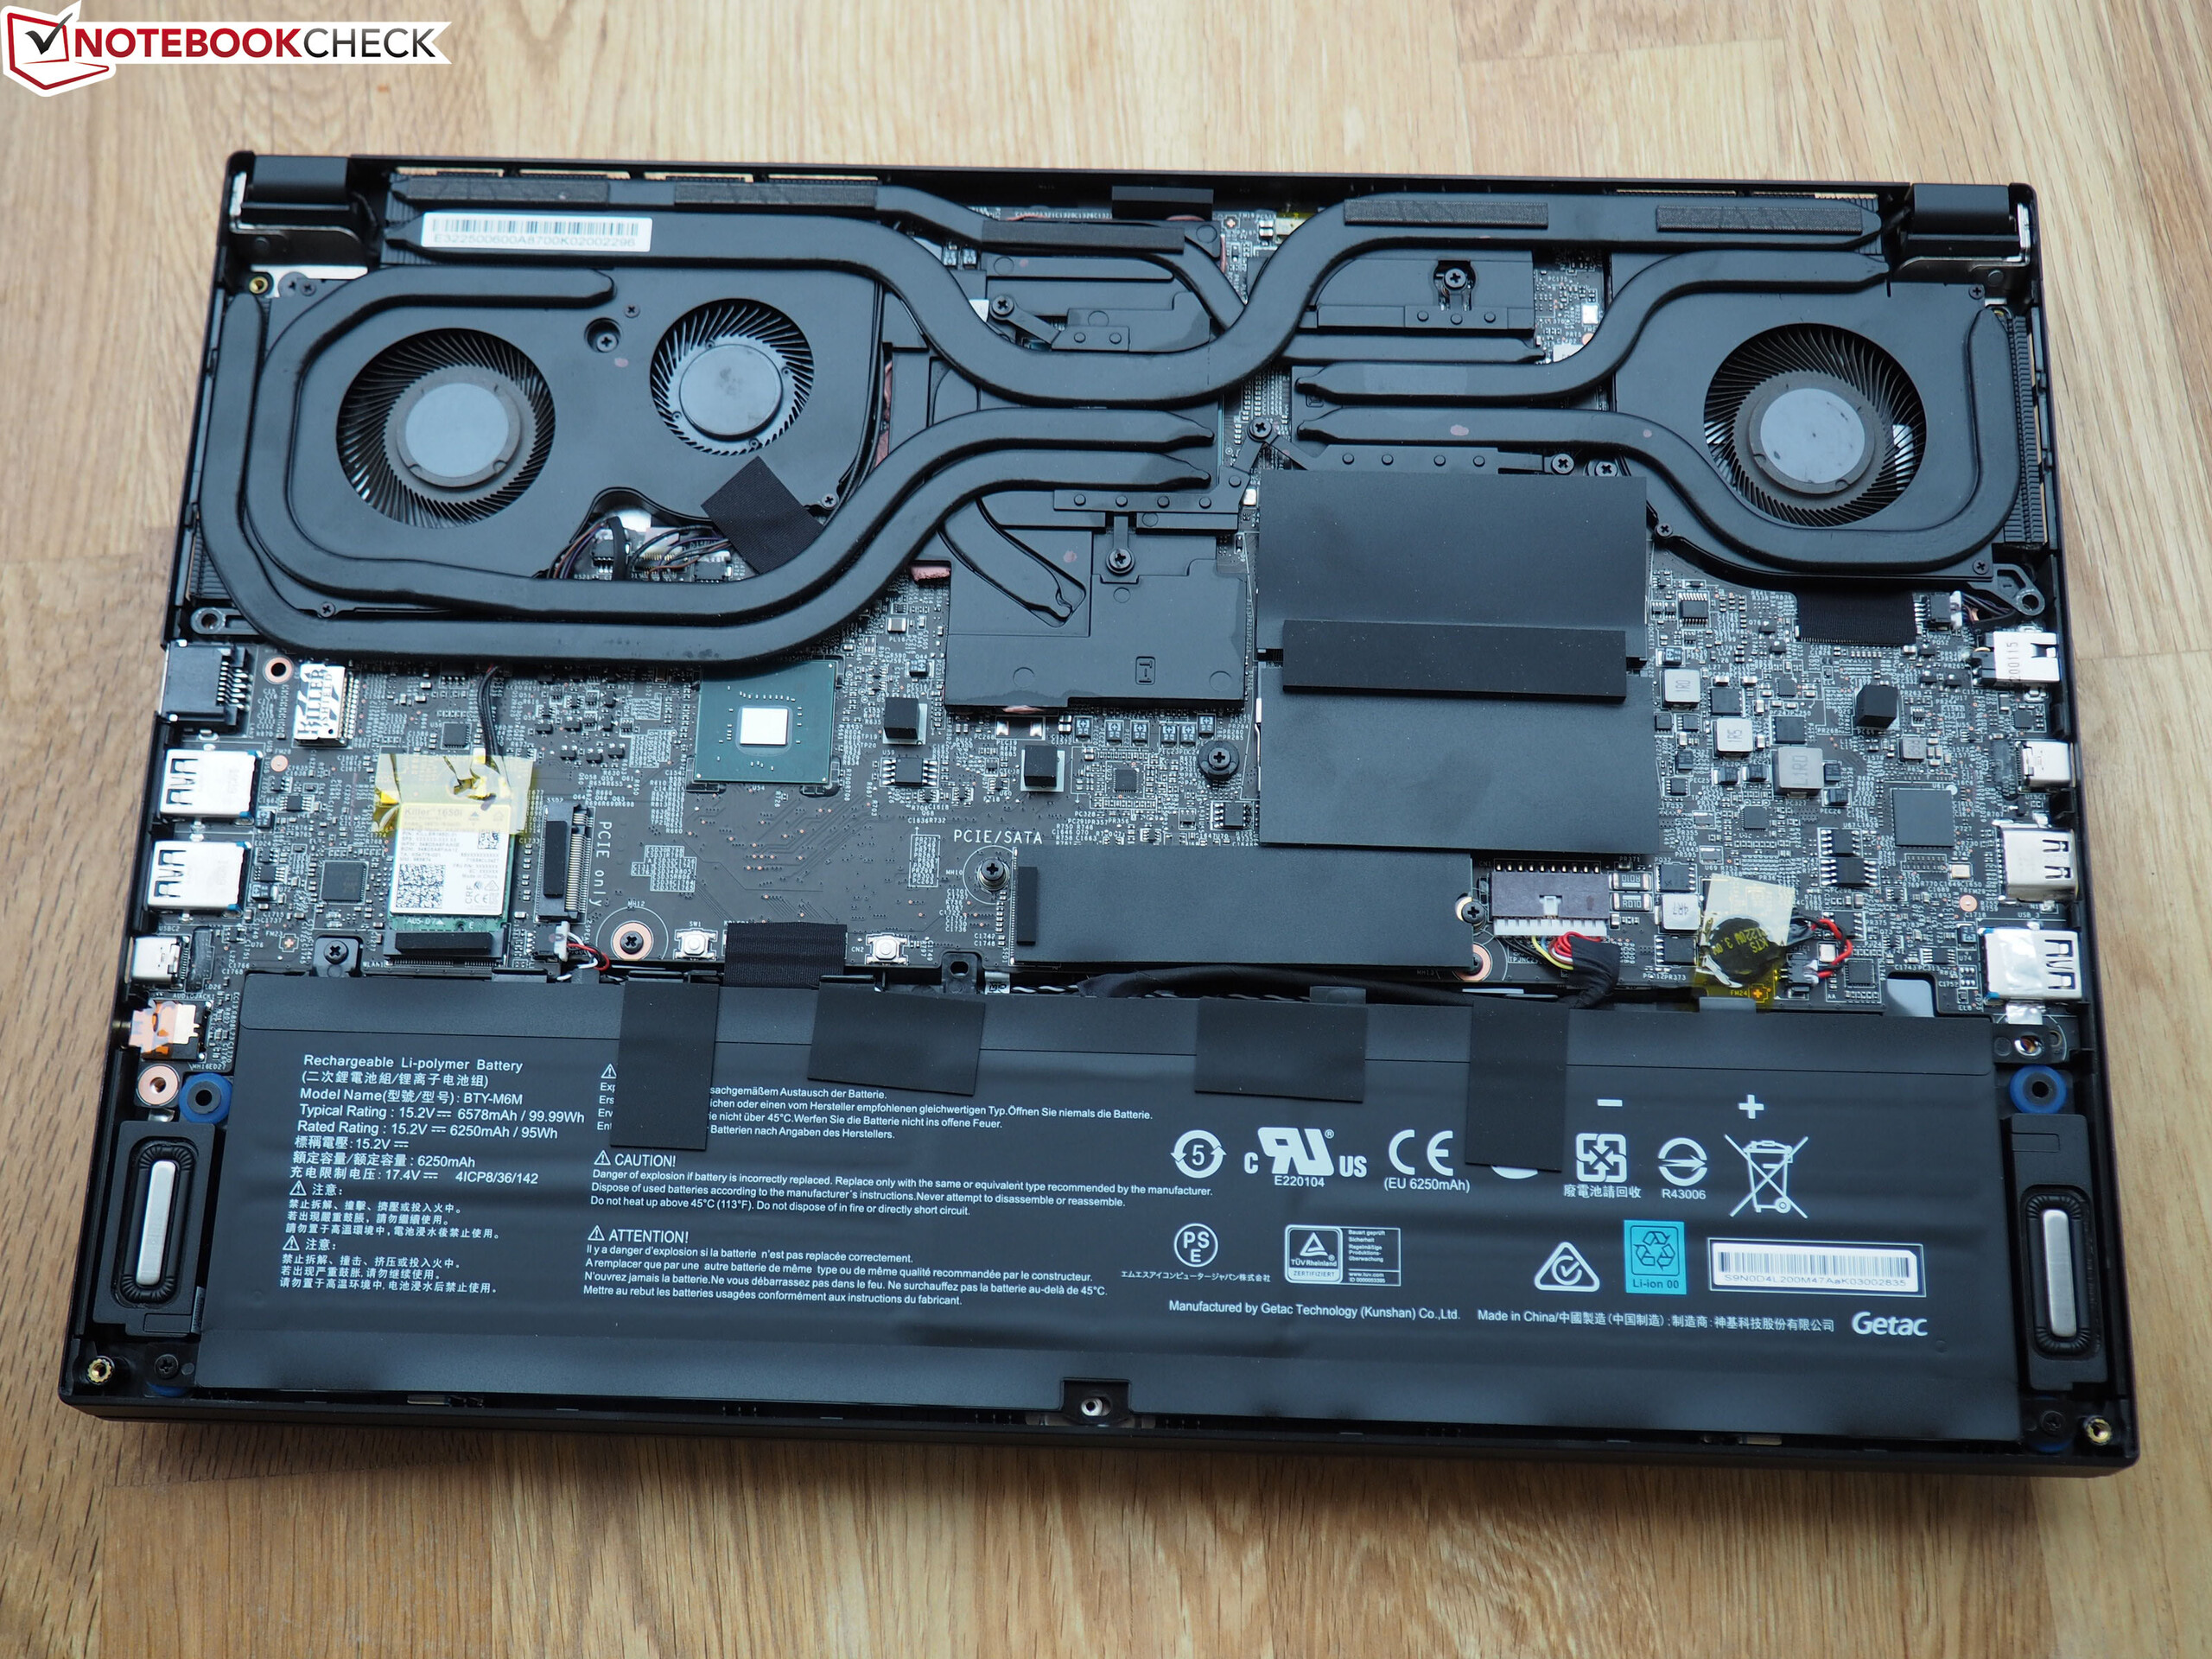
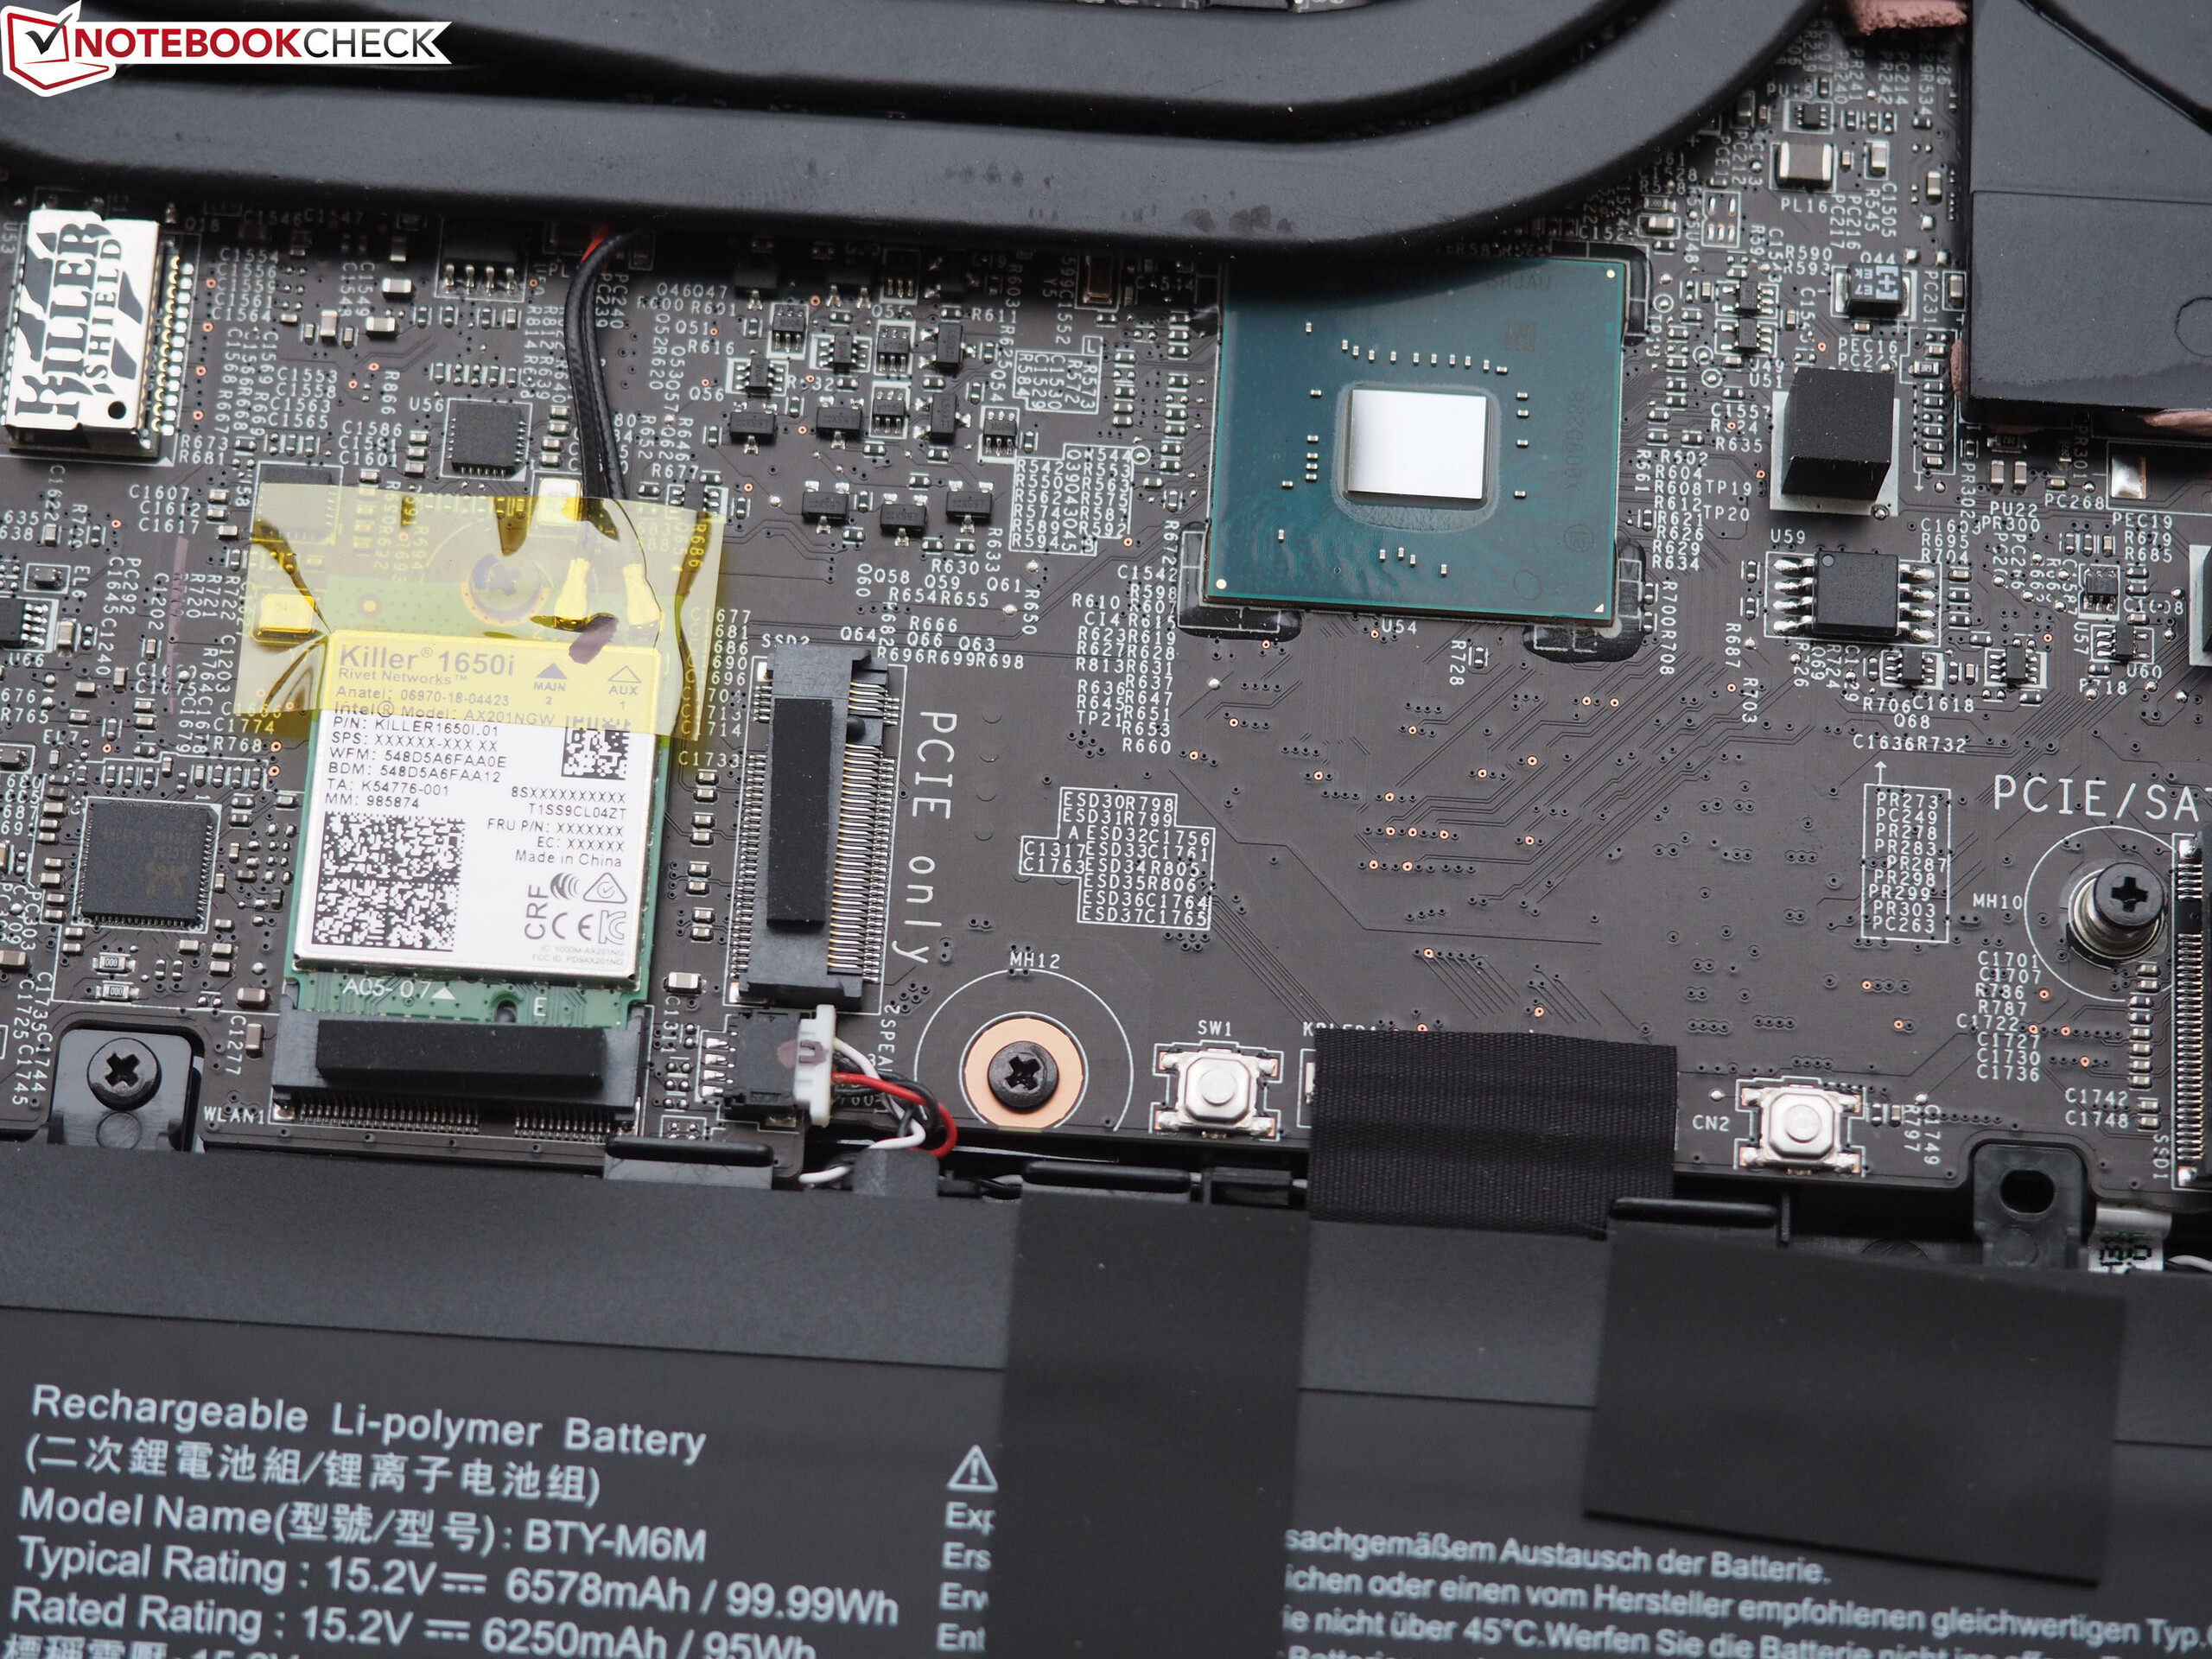
MSI har tagit hand om de viktigaste klagomålen och ger bättre stabilitet och fler servicemöjligheter till det kompakta höljet. GS66 förtjänar också beröm för moderna anslutningar (Thunderbolt 3), en snabb och kontrastrik 300 Hz-skärm samt ett stort batteri, även om det inte riktigt lyckades leva upp till sin potential.
Vi förstår däremot inte riktigt valet av processor. Core i9-10980HK är förstås väldigt lockande från ett marknadsföringsperspektiv och i fråga om prestanda, men då man som kund snarare får leva med nackdelarna (väldigt höga temperaturer och hög ljudnivå) istället för fördelarna (högre prestandapotential) känns det inte som att man som leverantör borde erbjuda det alternativet till en laptop som är designad för mobilitet.
MSI GS66 Stealth 10SFS
- 05/17/2020 v7 (old)
Florian Glaser
Price comparison