Test: Razer Blade 15 Advanced Model (i7-9750H, RTX 2080 Max-Q, 240 Hz) Laptop (Sammanfattning)
| |||||||||||||||||||||||||
Distribution av ljusstyrkan: 87 %
Mitt på batteriet: 293 cd/m²
Kontrast: 1010:1 (Svärta: 0.29 cd/m²)
ΔE ColorChecker Calman: 1.69 | ∀{0.5-29.43 Ø4.73}
calibrated: 1.24
ΔE Greyscale Calman: 2.3 | ∀{0.09-98 Ø4.97}
98.5% sRGB (Argyll 1.6.3 3D)
63% AdobeRGB 1998 (Argyll 1.6.3 3D)
68.5% AdobeRGB 1998 (Argyll 3D)
98.1% sRGB (Argyll 3D)
66.9% Display P3 (Argyll 3D)
Gamma: 2.3
CCT: 6758 K
| Razer Blade 15 RTX 2080 Max-Q Sharp LQ156M1JW03 (SHP14C5), IPS, 15.6", 1920x1080 | Razer Blade 15 RTX 2070 Max-Q LG Philips LGD05C0, IPS, 15.6", 1920x1080 | Alienware m15 GTX 1070 Max-Q AU Optronics B156HAN, IPS, 15.6", 1920x1080 | Asus Zephyrus S GX502GW AU Optronics B156HAN08.2 (AUO82ED), IPS, 15.6", 1920x1080 | Apple MacBook Pro 15 2018 (2.6 GHz, 560X) APPA040, IPS, 15.4", 2880x1800 | MSI GS65 Stealth Thin 8RE-051US AUO80ED, IPS, 15.6", 1920x1080 | |
|---|---|---|---|---|---|---|
| Display | -3% | -7% | -5% | 25% | -3% | |
| Display P3 Coverage (%) | 66.9 | 65.3 -2% | 63.5 -5% | 64.9 -3% | 98.7 48% | 65.8 -2% |
| sRGB Coverage (%) | 98.1 | 94.9 -3% | 89.4 -9% | 91 -7% | 99.9 2% | 92.1 -6% |
| AdobeRGB 1998 Coverage (%) | 68.5 | 66.3 -3% | 64.5 -6% | 65.9 -4% | 86.6 26% | 67 -2% |
| Response Times | -22% | -28% | 30% | -219% | -36% | |
| Response Time Grey 50% / Grey 80% * (ms) | 12.8 ? | 16.8 ? -31% | 18 ? -41% | 7.2 ? 44% | 43.2 ? -238% | 20 ? -56% |
| Response Time Black / White * (ms) | 10.4 ? | 11.6 ? -12% | 12 ? -15% | 8.8 ? 15% | 31.2 ? -200% | 12 ? -15% |
| PWM Frequency (Hz) | 23810 ? | 117000 ? | ||||
| Screen | -19% | -46% | -18% | 33% | -35% | |
| Brightness middle (cd/m²) | 293 | 314.7 7% | 353.6 21% | 286 -2% | 520 77% | 250.9 -14% |
| Brightness (cd/m²) | 270 | 312 16% | 346 28% | 275 2% | 492 82% | 257 -5% |
| Brightness Distribution (%) | 87 | 90 3% | 86 -1% | 90 3% | 88 1% | 83 -5% |
| Black Level * (cd/m²) | 0.29 | 0.38 -31% | 0.3 -3% | 0.37 -28% | 0.39 -34% | 0.32 -10% |
| Contrast (:1) | 1010 | 828 -18% | 1179 17% | 773 -23% | 1333 32% | 784 -22% |
| Colorchecker dE 2000 * | 1.69 | 2.56 -51% | 4.55 -169% | 2.19 -30% | 1.2 29% | 2.77 -64% |
| Colorchecker dE 2000 max. * | 3.37 | 4.89 -45% | 7.91 -135% | 4.4 -31% | 2.3 32% | 5.89 -75% |
| Colorchecker dE 2000 calibrated * | 1.24 | 1.71 -38% | 3.37 -172% | 2.27 -83% | 2.5 -102% | |
| Greyscale dE 2000 * | 2.3 | 3.4 -48% | 4.1 -78% | 2.2 4% | 1.3 43% | 4 -74% |
| Gamma | 2.3 96% | 2.3 96% | 2.27 97% | 2.41 91% | 2.18 101% | 2.27 97% |
| CCT | 6758 96% | 6435 101% | 7434 87% | 6405 101% | 6738 96% | 6901 94% |
| Color Space (Percent of AdobeRGB 1998) (%) | 63 | 60.7 -4% | 57.9 -8% | 59 -6% | 60 -5% | |
| Color Space (Percent of sRGB) (%) | 98.5 | 94.6 -4% | 88.9 -10% | 91 -8% | 92 -7% | |
| Totalt genomsnitt (program/inställningar) | -15% /
-17% | -27% /
-37% | 2% /
-10% | -54% /
-8% | -25% /
-29% |
* ... mindre är bättre
Visa svarstider
| ↔ Svarstid svart till vitt | ||
|---|---|---|
| 10.4 ms ... stiga ↗ och falla ↘ kombinerat | ↗ 6 ms stiga | 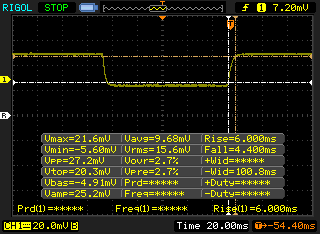 |
| ↘ 4.4 ms hösten | ||
| Skärmen visar bra svarsfrekvens i våra tester, men kan vara för långsam för konkurrenskraftiga spelare. I jämförelse sträcker sig alla testade enheter från 0.1 (minst) till 240 (maximalt) ms. » 28 % av alla enheter är bättre. Det betyder att den uppmätta svarstiden är bättre än genomsnittet av alla testade enheter (19.9 ms). | ||
| ↔ Svarstid 50 % grått till 80 % grått | ||
| 12.8 ms ... stiga ↗ och falla ↘ kombinerat | ↗ 6.8 ms stiga | 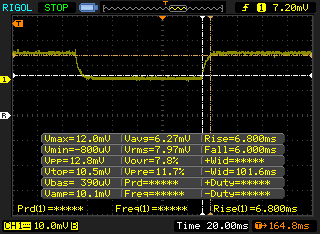 |
| ↘ 6 ms hösten | ||
| Skärmen visar bra svarsfrekvens i våra tester, men kan vara för långsam för konkurrenskraftiga spelare. I jämförelse sträcker sig alla testade enheter från 0.165 (minst) till 636 (maximalt) ms. » 26 % av alla enheter är bättre. Det betyder att den uppmätta svarstiden är bättre än genomsnittet av alla testade enheter (31.1 ms). | ||
Skärmflimmer / PWM (Puls-Width Modulation)
| Skärmflimmer / PWM upptäckt | 23810 Hz | ≤ 10 % ljusstyrka inställning | 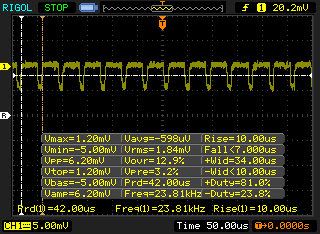 |
Displayens bakgrundsbelysning flimrar vid 23810 Hz (i värsta fall, t.ex. med PWM) Flimrande upptäckt vid en ljusstyrkeinställning på 10 % och lägre. Det ska inte finnas något flimmer eller PWM över denna ljusstyrkeinställning. Frekvensen för 23810 Hz är ganska hög, så de flesta användare som är känsliga för PWM bör inte märka något flimmer. Som jämförelse: 52 % av alla testade enheter använder inte PWM för att dämpa skärmen. Om PWM upptäcktes mättes ett medelvärde av 7798 (minst: 5 - maximum: 343500) Hz. | |||
| PCMark 8 Home Score Accelerated v2 | 4380 poäng | |
| PCMark 8 Work Score Accelerated v2 | 5749 poäng | |
| PCMark 10 Score | 5839 poäng | |
Hjälp | ||
| Razer Blade 15 RTX 2080 Max-Q Samsung SSD PM981 MZVLB512HAJQ | Razer Blade 15 RTX 2070 Max-Q Samsung SSD PM981 MZVLB512HAJQ | Alienware m15 GTX 1070 Max-Q Toshiba XG5 KXG50ZNV512G | Asus Zephyrus S GX502GW 2x Intel SSD 660p SSDPEKNW512G8 (RAID 0) | Apple MacBook Pro 15 2018 (2.6 GHz, 560X) Apple SSD AP0512 | |
|---|---|---|---|---|---|
| AS SSD | 1% | -43% | -21% | -76% | |
| Seq Read (MB/s) | 1832 | 1840 0% | 1967 7% | 2506 37% | 2239 22% |
| Seq Write (MB/s) | 1864 | 1822 -2% | 1135 -39% | 1712 -8% | 1644 -12% |
| 4K Read (MB/s) | 52.1 | 52.3 0% | 29.17 -44% | 48.32 -7% | 9.46 -82% |
| 4K Write (MB/s) | 108.3 | 110.7 2% | 93.4 -14% | 103.6 -4% | 18.78 -83% |
| 4K-64 Read (MB/s) | 1159 | 1126 -3% | 995 -14% | 624 -46% | 965 -17% |
| 4K-64 Write (MB/s) | 1807 | 1717 -5% | 656 -64% | 1253 -31% | 163.5 -91% |
| Access Time Read * (ms) | 0.05 | 0.047 6% | 0.116 -132% | 0.08 -60% | 0.225 -350% |
| Access Time Write * (ms) | 0.034 | 0.033 3% | 0.063 -85% | 0.04 -18% | |
| Score Read (Points) | 1394 | 1362 -2% | 1221 -12% | 923 -34% | 1199 -14% |
| Score Write (Points) | 2102 | 2010 -4% | 862 -59% | 1528 -27% | 347 -83% |
| Score Total (Points) | 4221 | 4079 -3% | 2667 -37% | 2896 -31% | 2119 -50% |
| Copy ISO MB/s (MB/s) | 2083 | 1975 -5% | 642 -69% | ||
| Copy Program MB/s (MB/s) | 496.5 | 526 6% | 431.5 -13% | ||
| Copy Game MB/s (MB/s) | 977 | 1200 23% | 706 -28% |
* ... mindre är bättre

| 3DMark 11 Performance | 21563 poäng | |
| 3DMark Cloud Gate Standard Score | 32108 poäng | |
| 3DMark Fire Strike Score | 17838 poäng | |
| 3DMark Time Spy Score | 7410 poäng | |
Hjälp | ||
| The Witcher 3 - 1920x1080 Ultra Graphics & Postprocessing (HBAO+) | |
| MSI GE75 9SG | |
| Genomsnitt NVIDIA GeForce RTX 2080 Max-Q (65.7 - 92.7, n=22) | |
| Razer Blade 15 RTX 2080 Max-Q | |
| Razer Blade 15 RTX 2070 Max-Q | |
| Alienware m15 GTX 1070 Max-Q | |
| Schenker Compact 15 | |
| MSI GS65 Stealth Thin 8RE-051US | |
| Acer Aspire Nitro 5 AN515-54-53Z2 | |
| Razer Blade Stealth i7-8565U | |
| låg | med. | hög | ultra | |
|---|---|---|---|---|
| BioShock Infinite (2013) | 323.8 | 280.2 | 262 | 170 |
| The Witcher 3 (2015) | 273.9 | 227.6 | 146.6 | 78.3 |
| Rise of the Tomb Raider (2016) | 239.5 | 174.7 | 143.8 | 126 |
| Razer Blade 15 RTX 2080 Max-Q GeForce RTX 2080 Max-Q, i7-9750H, Samsung SSD PM981 MZVLB512HAJQ | Razer Blade 15 RTX 2070 Max-Q GeForce RTX 2070 Max-Q, i7-8750H, Samsung SSD PM981 MZVLB512HAJQ | Alienware m15 GTX 1070 Max-Q GeForce GTX 1070 Max-Q, i7-8750H, Toshiba XG5 KXG50ZNV512G | Asus Zephyrus S GX502GW GeForce RTX 2070 Mobile, i7-9750H, 2x Intel SSD 660p SSDPEKNW512G8 (RAID 0) | Apple MacBook Pro 15 2018 (2.6 GHz, 560X) Radeon Pro 560X, i7-8850H, Apple SSD AP0512 | MSI GS65 Stealth Thin 8RE-051US GeForce GTX 1060 Mobile, i7-8750H, Samsung SSD PM981 MZVLB256HAHQ | Dell XPS 15 9570 Core i9 UHD GeForce GTX 1050 Ti Max-Q, i9-8950HK, Samsung SSD PM981 MZVLB1T0HALR | |
|---|---|---|---|---|---|---|---|
| Noise | -1% | -6% | -22% | -6% | -5% | -2% | |
| av / miljö * (dB) | 28.3 | 28.8 -2% | 28.6 -1% | 30 -6% | 29.6 -5% | 28.4 -0% | 28.2 -0% |
| Idle Minimum * (dB) | 28.8 | 28.8 -0% | 28.6 1% | 31 -8% | 30.1 -5% | 28.4 1% | 28.5 1% |
| Idle Average * (dB) | 28.8 | 28.8 -0% | 28.6 1% | 33 -15% | 30.1 -5% | 28.4 1% | 28.6 1% |
| Idle Maximum * (dB) | 29 | 29.4 -1% | 28.6 1% | 38 -31% | 30.1 -4% | 29.6 -2% | 28.8 1% |
| Load Average * (dB) | 33.5 | 35.7 -7% | 40.8 -22% | 50 -49% | 46.8 -40% | 43.5 -30% | 36.2 -8% |
| Witcher 3 ultra * (dB) | 45 | 42.5 6% | 49.6 -10% | 53 -18% | 36 20% | 45.7 -2% | 47.6 -6% |
| Load Maximum * (dB) | 45.2 | 45 -0% | 49.6 -10% | 56 -24% | 46.8 -4% | 45.7 -1% | 47.6 -5% |
* ... mindre är bättre
Ljudnivå
| Låg belastning |
| 28.8 / 28.8 / 29 dB(A) |
| Hög belastning |
| 33.5 / 45.2 dB(A) |
 | ||
30 dB tyst 40 dB(A) hörbar 50 dB(A) högt ljud |
||
min: | ||
(-) Den maximala temperaturen på ovansidan är 47 °C / 117 F, jämfört med genomsnittet av 40.4 °C / 105 F , allt från 21.2 till 68.8 °C för klassen Gaming.
(-) Botten värms upp till maximalt 49.2 °C / 121 F, jämfört med genomsnittet av 43.2 °C / 110 F
(+) Vid tomgångsbruk är medeltemperaturen för ovansidan 27.5 °C / 82 F, jämfört med enhetsgenomsnittet på 33.9 °C / ### class_avg_f### F.
(±) När du spelar The Witcher 3 är medeltemperaturen för ovansidan 37.5 °C / 100 F, jämfört med enhetsgenomsnittet på 33.9 °C / ## #class_avg_f### F.
(±) Handledsstöden och pekplattan kan bli väldigt varma vid beröring med maximalt 36 °C / 96.8 F.
(-) Medeltemperaturen för handledsstödsområdet på liknande enheter var 28.8 °C / 83.8 F (-7.2 °C / -13 F).
Razer Blade 15 RTX 2080 Max-Q ljudanalys
(+) | högtalare kan spela relativt högt (83.8 dB)
Bas 100 - 315 Hz
(±) | reducerad bas - i genomsnitt 10.7% lägre än medianen
(±) | linjäriteten för basen är genomsnittlig (11.3% delta till föregående frekvens)
Mellan 400 - 2000 Hz
(±) | högre mellan - i genomsnitt 5.7% högre än median
(+) | mids är linjära (5.4% delta till föregående frekvens)
Högsta 2 - 16 kHz
(±) | reducerade toppar - i genomsnitt 6% lägre än medianen
(±) | linjäriteten för toppar är genomsnittlig (9.1% delta till föregående frekvens)
Totalt 100 - 16 000 Hz
(±) | linjäriteten för det totala ljudet är genomsnittlig (21.7% skillnad mot median)
Jämfört med samma klass
» 78% av alla testade enheter i den här klassen var bättre, 6% liknande, 17% sämre
» Den bästa hade ett delta på 6%, genomsnittet var 18%, sämst var 132%
Jämfört med alla testade enheter
» 61% av alla testade enheter var bättre, 7% liknande, 31% sämre
» Den bästa hade ett delta på 4%, genomsnittet var 24%, sämst var 134%
Apple MacBook 12 (Early 2016) 1.1 GHz ljudanalys
(+) | högtalare kan spela relativt högt (83.6 dB)
Bas 100 - 315 Hz
(±) | reducerad bas - i genomsnitt 11.3% lägre än medianen
(±) | linjäriteten för basen är genomsnittlig (14.2% delta till föregående frekvens)
Mellan 400 - 2000 Hz
(+) | balanserad mellan - endast 2.4% från medianen
(+) | mids är linjära (5.5% delta till föregående frekvens)
Högsta 2 - 16 kHz
(+) | balanserade toppar - endast 2% från medianen
(+) | toppar är linjära (4.5% delta till föregående frekvens)
Totalt 100 - 16 000 Hz
(+) | det totala ljudet är linjärt (10.2% skillnad mot median)
Jämfört med samma klass
» 7% av alla testade enheter i den här klassen var bättre, 2% liknande, 91% sämre
» Den bästa hade ett delta på 5%, genomsnittet var 18%, sämst var 53%
Jämfört med alla testade enheter
» 5% av alla testade enheter var bättre, 1% liknande, 94% sämre
» Den bästa hade ett delta på 4%, genomsnittet var 24%, sämst var 134%
| Av/Standby | |
| Låg belastning | |
| Hög belastning |
|
Förklaring:
min: | |
| Razer Blade 15 RTX 2080 Max-Q i7-9750H, GeForce RTX 2080 Max-Q, Samsung SSD PM981 MZVLB512HAJQ, IPS, 1920x1080, 15.6" | Razer Blade 15 RTX 2070 Max-Q i7-8750H, GeForce RTX 2070 Max-Q, Samsung SSD PM981 MZVLB512HAJQ, IPS, 1920x1080, 15.6" | Alienware m15 GTX 1070 Max-Q i7-8750H, GeForce GTX 1070 Max-Q, Toshiba XG5 KXG50ZNV512G, IPS, 1920x1080, 15.6" | Asus Zephyrus S GX502GW i7-9750H, GeForce RTX 2070 Mobile, 2x Intel SSD 660p SSDPEKNW512G8 (RAID 0), IPS, 1920x1080, 15.6" | Apple MacBook Pro 15 2018 (2.6 GHz, 560X) i7-8850H, Radeon Pro 560X, Apple SSD AP0512, IPS, 2880x1800, 15.4" | MSI GS65 Stealth Thin 8RE-051US i7-8750H, GeForce GTX 1060 Mobile, Samsung SSD PM981 MZVLB256HAHQ, IPS, 1920x1080, 15.6" | Dell XPS 15 9570 Core i9 UHD i9-8950HK, GeForce GTX 1050 Ti Max-Q, Samsung SSD PM981 MZVLB1T0HALR, IPS, 3840x2160, 15.6" | |
|---|---|---|---|---|---|---|---|
| Power Consumption | 10% | 16% | -47% | 40% | 18% | 24% | |
| Idle Minimum * (Watt) | 12.5 | 10.4 17% | 7.6 39% | 24 -92% | 3.4 73% | 8.7 30% | 7.1 43% |
| Idle Average * (Watt) | 15.3 | 14.6 5% | 13.8 10% | 27 -76% | 11 28% | 13 15% | 13.6 11% |
| Idle Maximum * (Watt) | 20.7 | 16.3 21% | 14.6 29% | 33 -59% | 14.9 28% | 14.3 31% | 14.1 32% |
| Load Average * (Watt) | 90.2 | 88.5 2% | 97.6 -8% | 129 -43% | 78.9 13% | 107.4 -19% | 103.9 -15% |
| Witcher 3 ultra * (Watt) | 162 | 155.4 4% | 145.8 10% | 176 -9% | 129 20% | 103 36% | |
| Load Maximum * (Watt) | 209.3 | 182.4 13% | 172.5 18% | 216 -3% | 91.2 56% | 151.5 28% | 130.9 37% |
* ... mindre är bättre
| Razer Blade 15 RTX 2080 Max-Q i7-9750H, GeForce RTX 2080 Max-Q, 80 Wh | Razer Blade 15 RTX 2070 Max-Q i7-8750H, GeForce RTX 2070 Max-Q, 80 Wh | Alienware m15 GTX 1070 Max-Q i7-8750H, GeForce GTX 1070 Max-Q, 90 Wh | Asus Zephyrus S GX502GW i7-9750H, GeForce RTX 2070 Mobile, 76 Wh | Apple MacBook Pro 15 2018 (2.6 GHz, 560X) i7-8850H, Radeon Pro 560X, 83 Wh | MSI GS65 Stealth Thin 8RE-051US i7-8750H, GeForce GTX 1060 Mobile, 82 Wh | Dell XPS 15 9570 Core i9 UHD i9-8950HK, GeForce GTX 1050 Ti Max-Q, 97 Wh | |
|---|---|---|---|---|---|---|---|
| Batteridrifttid | -14% | -6% | -49% | 55% | -18% | -6% | |
| Reader / Idle (h) | 15.9 | 11.4 -28% | 10.5 -34% | 5.9 -63% | 15 -6% | ||
| WiFi v1.3 (h) | 6.6 | 6.5 -2% | 7.7 17% | 3.7 -44% | 10.2 55% | 6.2 -6% | 8.6 30% |
| Load (h) | 1.7 | 1.5 -12% | 1.7 0% | 1 -41% | 1.2 -29% | 1 -41% | |
| Witcher 3 ultra (h) | 1.5 |
För
Emot
Läs den fullständiga versionen av den här recensionen på engelska här.
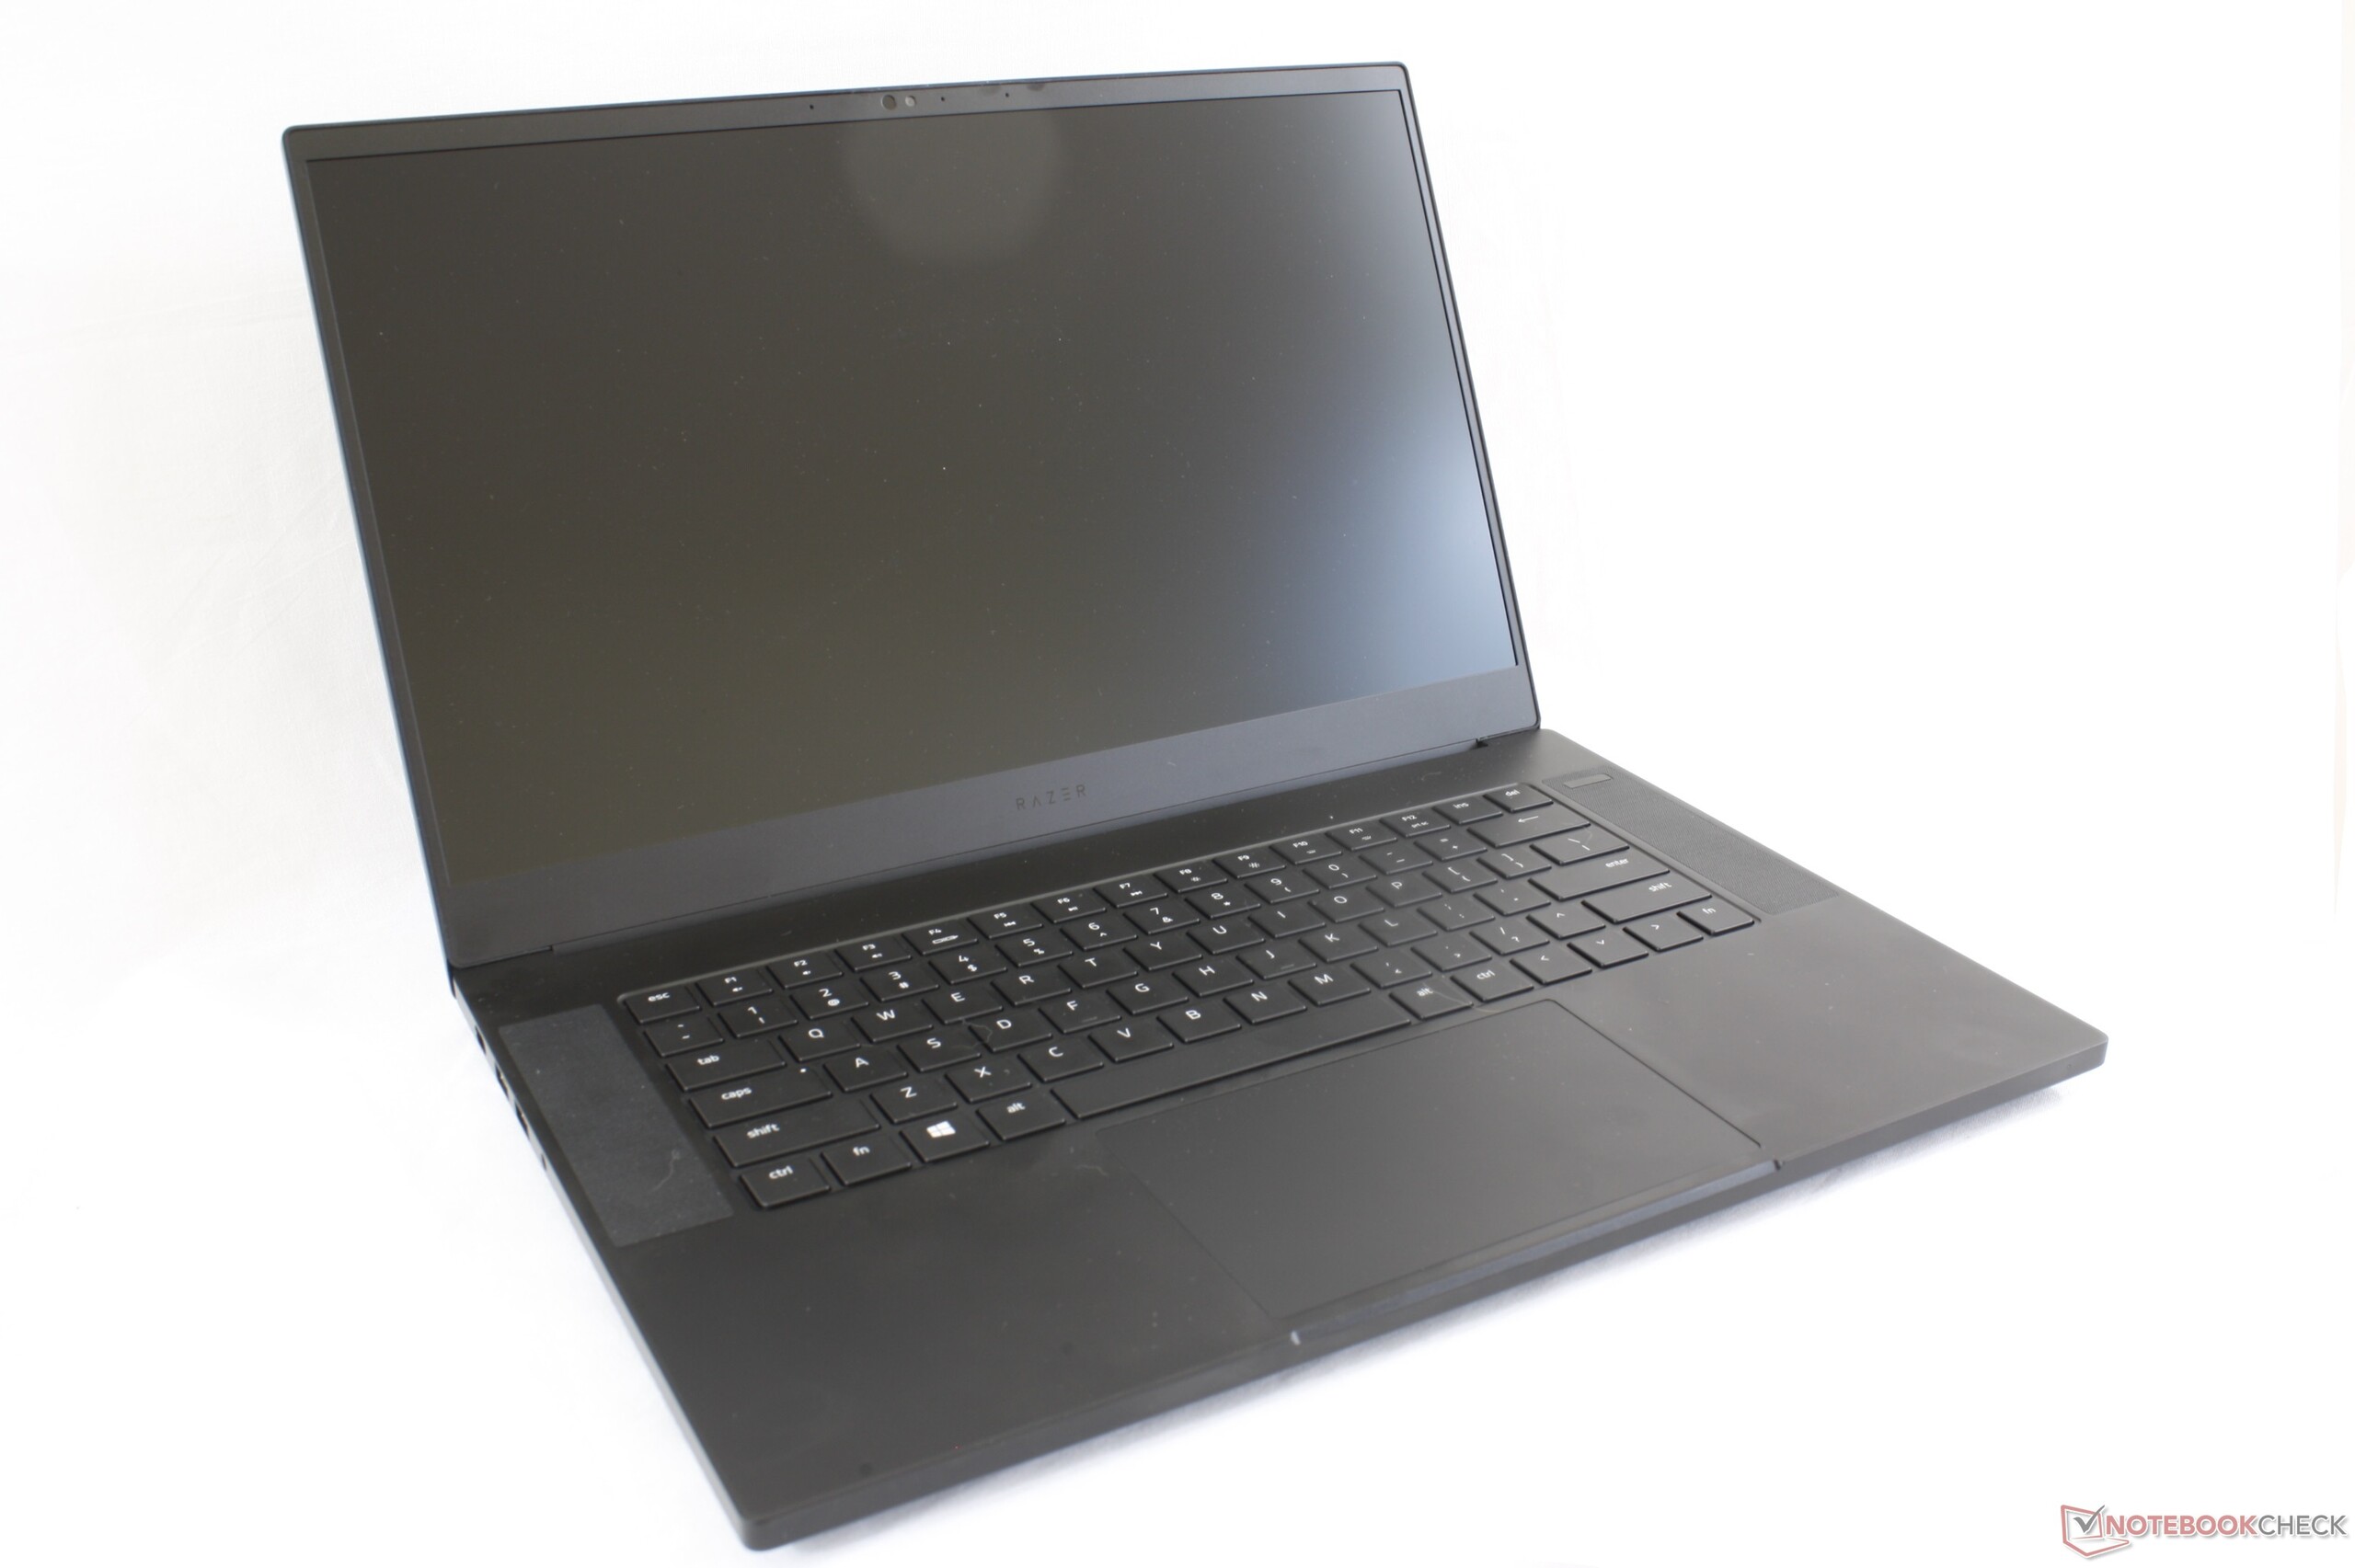
Den största anledningen att skaffa senaste Blade 15 istället för de tidigare varianterna är för 240 Hz- eller OLED-skärmarna. Även om vi inte kan kommentera OLED-alternativet just nu så bleknar steget från WiFi 5 till WiFi 6 eller 8:e generationens Intel Core i7 till 9:e generationens Core i7 i jämförelse med steget från en 60 Hz-skärm till en 240 Hz-skärm. Smidigheten, responsitiviteten och lyxen av 4 gånger snabbare bilduppdatering är påtaglig oavsett om man spelar eller inte.
Samtidigt kommer den som överväger RTX 2080 Max-Q istället för RTX 2070 Max-Q se upp mot 17 procent snabbare spelprestanda utan någon direkt påverkan på fläktens ljudnivå, temperaturen eller batteritiden. 2080 Max-Q är dock ca 5.000 kronor dyrare, så det finns förstås ett pris att betala för att få det bästa som Blade 15 har att erbjuda.
För alla som inte är ultra-entusiaster är den ursprungliga 144 Hz-skärmen mer än tillräcklig för det är i praktiken svårt att se någon skillnad mellan 144 Hz och 240 Hz. Båda alternativen får dock den vanliga 60 Hz-skärmen att kännas trist efter bara några dagars användning. Pengarna du sparar kan istället gå till potentiellt sett viktigare saker som extra lagring, mer RAM, tillbehör eller till och med utökad RazerCare-garanti.
Razers mer välavrundade spellaptop blev plötsligt ännu bättre med dessa toppskiktsvarianter för entusiaster. De nya uppgraderingarna befäster Razers position som ett företag byggt för gamers. Men en genomsnittlig gamer kommer inte märka några större prestandaökningar jämfört med de redan utmärkta Blade 15-alternativen med 144 Hz och Intels 8:e generation.
Razer Blade 15 RTX 2080 Max-Q
- 05/20/2019 v6 (old)
Allen Ngo
Price comparison
