Test: ASUS ROG Zephyrus S GX502GW (Core i7-9750H, RTX 2070) Laptop (Sammanfattning)
| |||||||||||||||||||||||||
Distribution av ljusstyrkan: 90 %
Mitt på batteriet: 286 cd/m²
Kontrast: 773:1 (Svärta: 0.37 cd/m²)
ΔE ColorChecker Calman: 2.19 | ∀{0.5-29.43 Ø4.73}
calibrated: 2.27
ΔE Greyscale Calman: 2.2 | ∀{0.09-98 Ø4.97}
91% sRGB (Argyll 1.6.3 3D)
59% AdobeRGB 1998 (Argyll 1.6.3 3D)
65.9% AdobeRGB 1998 (Argyll 3D)
91% sRGB (Argyll 3D)
64.9% Display P3 (Argyll 3D)
Gamma: 2.41
CCT: 6405 K
| Asus Zephyrus S GX502GW AU Optronics B156HAN08.2 (AUO82ED), IPS, 1920x1080 | Asus Zephyrus S GX531GX AU Optronics B156HAN08.2, IPS, 1920x1080 | Acer Predator Triton 500 AU Optronics B156HAN08.2 (AUO82ED), IPS, 1920x1080 | Razer Blade 15 RTX 2070 Max-Q LG Philips LGD05C0, IPS, 1920x1080 | Gigabyte Aero 15-X9 LGD05C0, IPS, 1920x1080 | |
|---|---|---|---|---|---|
| Display | 1% | 0% | 2% | -1% | |
| Display P3 Coverage (%) | 64.9 | 65.6 1% | 64.2 -1% | 65.3 1% | 63.5 -2% |
| sRGB Coverage (%) | 91 | 92.2 1% | 92.6 2% | 94.9 4% | 93.1 2% |
| AdobeRGB 1998 Coverage (%) | 65.9 | 66.9 2% | 65.7 0% | 66.3 1% | 64.5 -2% |
| Response Times | -3% | -19% | -83% | -92% | |
| Response Time Grey 50% / Grey 80% * (ms) | 7.2 ? | 7 ? 3% | 8 ? -11% | 16.8 ? -133% | 16.4 ? -128% |
| Response Time Black / White * (ms) | 8.8 ? | 9.6 ? -9% | 11.2 ? -27% | 11.6 ? -32% | 13.6 ? -55% |
| PWM Frequency (Hz) | |||||
| Screen | -3% | -24% | -2% | 12% | |
| Brightness middle (cd/m²) | 286 | 323.6 13% | 304 6% | 314.7 10% | 250 -13% |
| Brightness (cd/m²) | 275 | 315 15% | 299 9% | 312 13% | 235 -15% |
| Brightness Distribution (%) | 90 | 91 1% | 89 -1% | 90 0% | 85 -6% |
| Black Level * (cd/m²) | 0.37 | 0.29 22% | 0.27 27% | 0.38 -3% | 0.29 22% |
| Contrast (:1) | 773 | 1116 44% | 1126 46% | 828 7% | 862 12% |
| Colorchecker dE 2000 * | 2.19 | 3.31 -51% | 4.66 -113% | 2.56 -17% | 1.46 33% |
| Colorchecker dE 2000 max. * | 4.4 | 5.74 -30% | 9.65 -119% | 4.89 -11% | 2.47 44% |
| Colorchecker dE 2000 calibrated * | 2.27 | 2.73 -20% | 1.72 24% | 1.71 25% | |
| Greyscale dE 2000 * | 2.2 | 2.9 -32% | 5.53 -151% | 3.4 -55% | 1.27 42% |
| Gamma | 2.41 91% | 2.29 96% | 2.5 88% | 2.3 96% | 2.4 92% |
| CCT | 6405 101% | 6765 96% | 8028 81% | 6435 101% | 6749 96% |
| Color Space (Percent of AdobeRGB 1998) (%) | 59 | 59.7 1% | 60 2% | 60.7 3% | 60 2% |
| Color Space (Percent of sRGB) (%) | 91 | 91.8 1% | 93 2% | 94.6 4% | 93 2% |
| Totalt genomsnitt (program/inställningar) | -2% /
-2% | -14% /
-19% | -28% /
-11% | -27% /
-4% |
* ... mindre är bättre
Visa svarstider
| ↔ Svarstid svart till vitt | ||
|---|---|---|
| 8.8 ms ... stiga ↗ och falla ↘ kombinerat | ↗ 4.4 ms stiga | 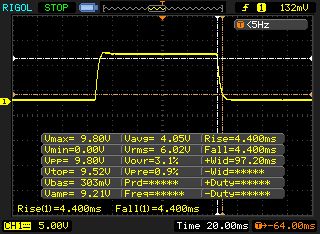 |
| ↘ 4.4 ms hösten | ||
| Skärmen visar snabba svarsfrekvenser i våra tester och bör passa för spel. I jämförelse sträcker sig alla testade enheter från 0.1 (minst) till 240 (maximalt) ms. » 24 % av alla enheter är bättre. Det betyder att den uppmätta svarstiden är bättre än genomsnittet av alla testade enheter (19.9 ms). | ||
| ↔ Svarstid 50 % grått till 80 % grått | ||
| 7.2 ms ... stiga ↗ och falla ↘ kombinerat | ↗ 3.8 ms stiga | 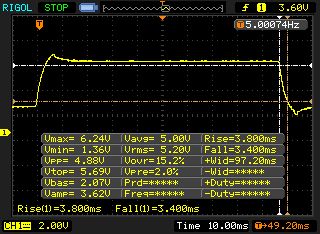 |
| ↘ 3.4 ms hösten | ||
| Skärmen visar väldigt snabba svarsfrekvenser i våra tester och borde vara mycket väl lämpad för fartfyllt spel. I jämförelse sträcker sig alla testade enheter från 0.165 (minst) till 636 (maximalt) ms. » 20 % av alla enheter är bättre. Det betyder att den uppmätta svarstiden är bättre än genomsnittet av alla testade enheter (31.1 ms). | ||
Skärmflimmer / PWM (Puls-Width Modulation)
| Skärmflimmer / PWM upptäcktes inte | 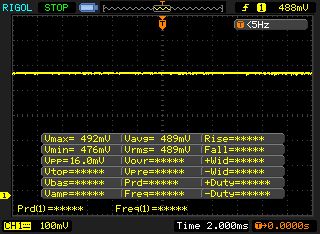 | ||
Som jämförelse: 52 % av alla testade enheter använder inte PWM för att dämpa skärmen. Om PWM upptäcktes mättes ett medelvärde av 7798 (minst: 5 - maximum: 343500) Hz. | |||
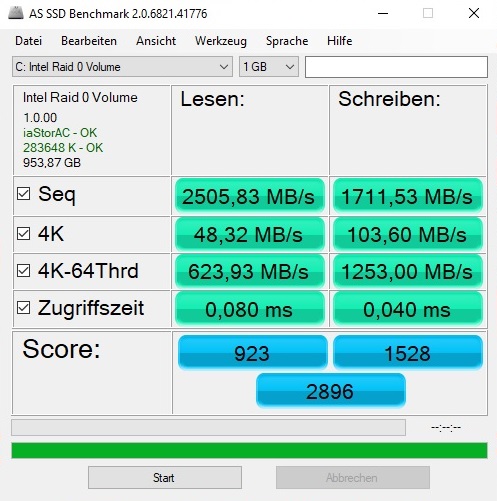
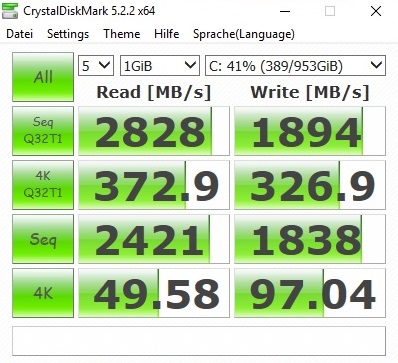
| Asus Zephyrus S GX502GW 2x Intel SSD 660p SSDPEKNW512G8 (RAID 0) | Asus Zephyrus S GX531GX Intel SSD 660p SSDPEKNW512G8 | Acer Predator Triton 500 2x WDC PC SN720 SDAPNTW-256G-1014 (RAID 0) | Razer Blade 15 RTX 2070 Max-Q Samsung SSD PM981 MZVLB512HAJQ | Gigabyte Aero 15-X9 Intel SSD 760p SSDPEKKW010T8 | |
|---|---|---|---|---|---|
| CrystalDiskMark 5.2 / 6 | -29% | 7% | -10% | -11% | |
| Write 4K (MB/s) | 97 | 93.9 -3% | 93.6 -4% | 93.9 -3% | 97.1 0% |
| Read 4K (MB/s) | 49.58 | 46.29 -7% | 38.82 -22% | 40.56 -18% | 53.7 8% |
| Write Seq (MB/s) | 1838 | 974 -47% | 2455 34% | 1468 -20% | 1526 -17% |
| Read Seq (MB/s) | 2421 | 1425 -41% | 2107 -13% | 1540 -36% | 2020 -17% |
| Write 4K Q32T1 (MB/s) | 326.9 | 259.4 -21% | 298.7 -9% | 293.5 -10% | 285.6 -13% |
| Read 4K Q32T1 (MB/s) | 372.9 | 296.5 -20% | 338.7 -9% | 346 -7% | 321.8 -14% |
| Write Seq Q32T1 (MB/s) | 1894 | 977 -48% | 2902 53% | 1941 2% | 1533 -19% |
| Read Seq Q32T1 (MB/s) | 2828 | 1666 -41% | 3536 25% | 3266 15% | 2351 -17% |

| 3DMark 11 Performance | 18686 poäng | |
| 3DMark Cloud Gate Standard Score | 30754 poäng | |
| 3DMark Fire Strike Score | 16290 poäng | |
| 3DMark Time Spy Score | 6890 poäng | |
Hjälp | ||
| The Witcher 3 - 1920x1080 Ultra Graphics & Postprocessing (HBAO+) | |
| Genomsnitt av klass Gaming (95 - 240, n=8, senaste 2 åren) | |
| Asus Zephyrus S GX531GX | |
| Acer Predator Triton 500 | |
| Asus Zephyrus S GX502GW | |
| Razer Blade 15 RTX 2070 Max-Q | |
| Gigabyte Aero 15-X9 | |
| låg | med. | hög | ultra | |
|---|---|---|---|---|
| The Witcher 3 (2015) | 130 | 70.2 | ||
| Shadow of the Tomb Raider (2018) | 91.3 | 86 | 80.3 | 74.2 |
| Apex Legends (2019) | 128 | 126 | ||
| Far Cry New Dawn (2019) | 91 | 83 | ||
| Metro Exodus (2019) | 91.1 | 82.6 | 66.3 | 54.6 |
| Anthem (2019) | 84 | 79 | ||
| Dirt Rally 2.0 (2019) | 121 | 75 | ||
| The Division 2 (2019) | 121 | 111 | 94 | 73 |
| Anno 1800 (2019) | 76.8 | 39.5 | ||
| Rage 2 (2019) | 180 | 122 | 103 | 101 |
| Control (2019) | 152 | 90 | 68 | |
| Borderlands 3 (2019) | 94 | 84 | 71 | 61 |
Ljudnivå
| Låg belastning |
| 31 / 33 / 38 dB(A) |
| Hög belastning |
| 50 / 56 dB(A) |
 | ||
30 dB tyst 40 dB(A) hörbar 50 dB(A) högt ljud |
||
min: | ||
| Asus Zephyrus S GX502GW GeForce RTX 2070 Mobile, i7-9750H | Asus Zephyrus S GX531GX GeForce RTX 2080 Max-Q, i7-8750H | Acer Predator Triton 500 GeForce RTX 2080 Max-Q, i7-8750H | Razer Blade 15 RTX 2070 Max-Q GeForce RTX 2070 Max-Q, i7-8750H | Gigabyte Aero 15-X9 GeForce RTX 2070 Max-Q, i7-8750H | Genomsnitt av klass Gaming | |
|---|---|---|---|---|---|---|
| Noise | 4% | 9% | 17% | 7% | 16% | |
| av / miljö * (dB) | 30 | 28.7 4% | 29 3% | 28.8 4% | 30 -0% | 24.1 ? 20% |
| Idle Minimum * (dB) | 31 | 29.8 4% | 30 3% | 28.8 7% | 32 -3% | 25.8 ? 17% |
| Idle Average * (dB) | 33 | 32.4 2% | 32 3% | 28.8 13% | 34 -3% | 27.4 ? 17% |
| Idle Maximum * (dB) | 38 | 38 -0% | 34 11% | 29.4 23% | 36 5% | 30 ? 21% |
| Load Average * (dB) | 50 | 38.2 24% | 44 12% | 35.7 29% | 42 16% | 43 ? 14% |
| Witcher 3 ultra * (dB) | 53 | 56.6 -7% | 46 13% | 42.5 20% | 44 17% | |
| Load Maximum * (dB) | 56 | 56.6 -1% | 47 16% | 45 20% | 48 14% | 54 ? 4% |
* ... mindre är bättre
(-) Den maximala temperaturen på ovansidan är 54 °C / 129 F, jämfört med genomsnittet av 40.4 °C / 105 F , allt från 21.2 till 68.8 °C för klassen Gaming.
(-) Botten värms upp till maximalt 47 °C / 117 F, jämfört med genomsnittet av 43.2 °C / 110 F
(+) Vid tomgångsbruk är medeltemperaturen för ovansidan 31.2 °C / 88 F, jämfört med enhetsgenomsnittet på 33.9 °C / ### class_avg_f### F.
(-) När du spelar The Witcher 3 är medeltemperaturen för ovansidan 44.1 °C / 111 F, jämfört med enhetsgenomsnittet på 33.9 °C / ## #class_avg_f### F.
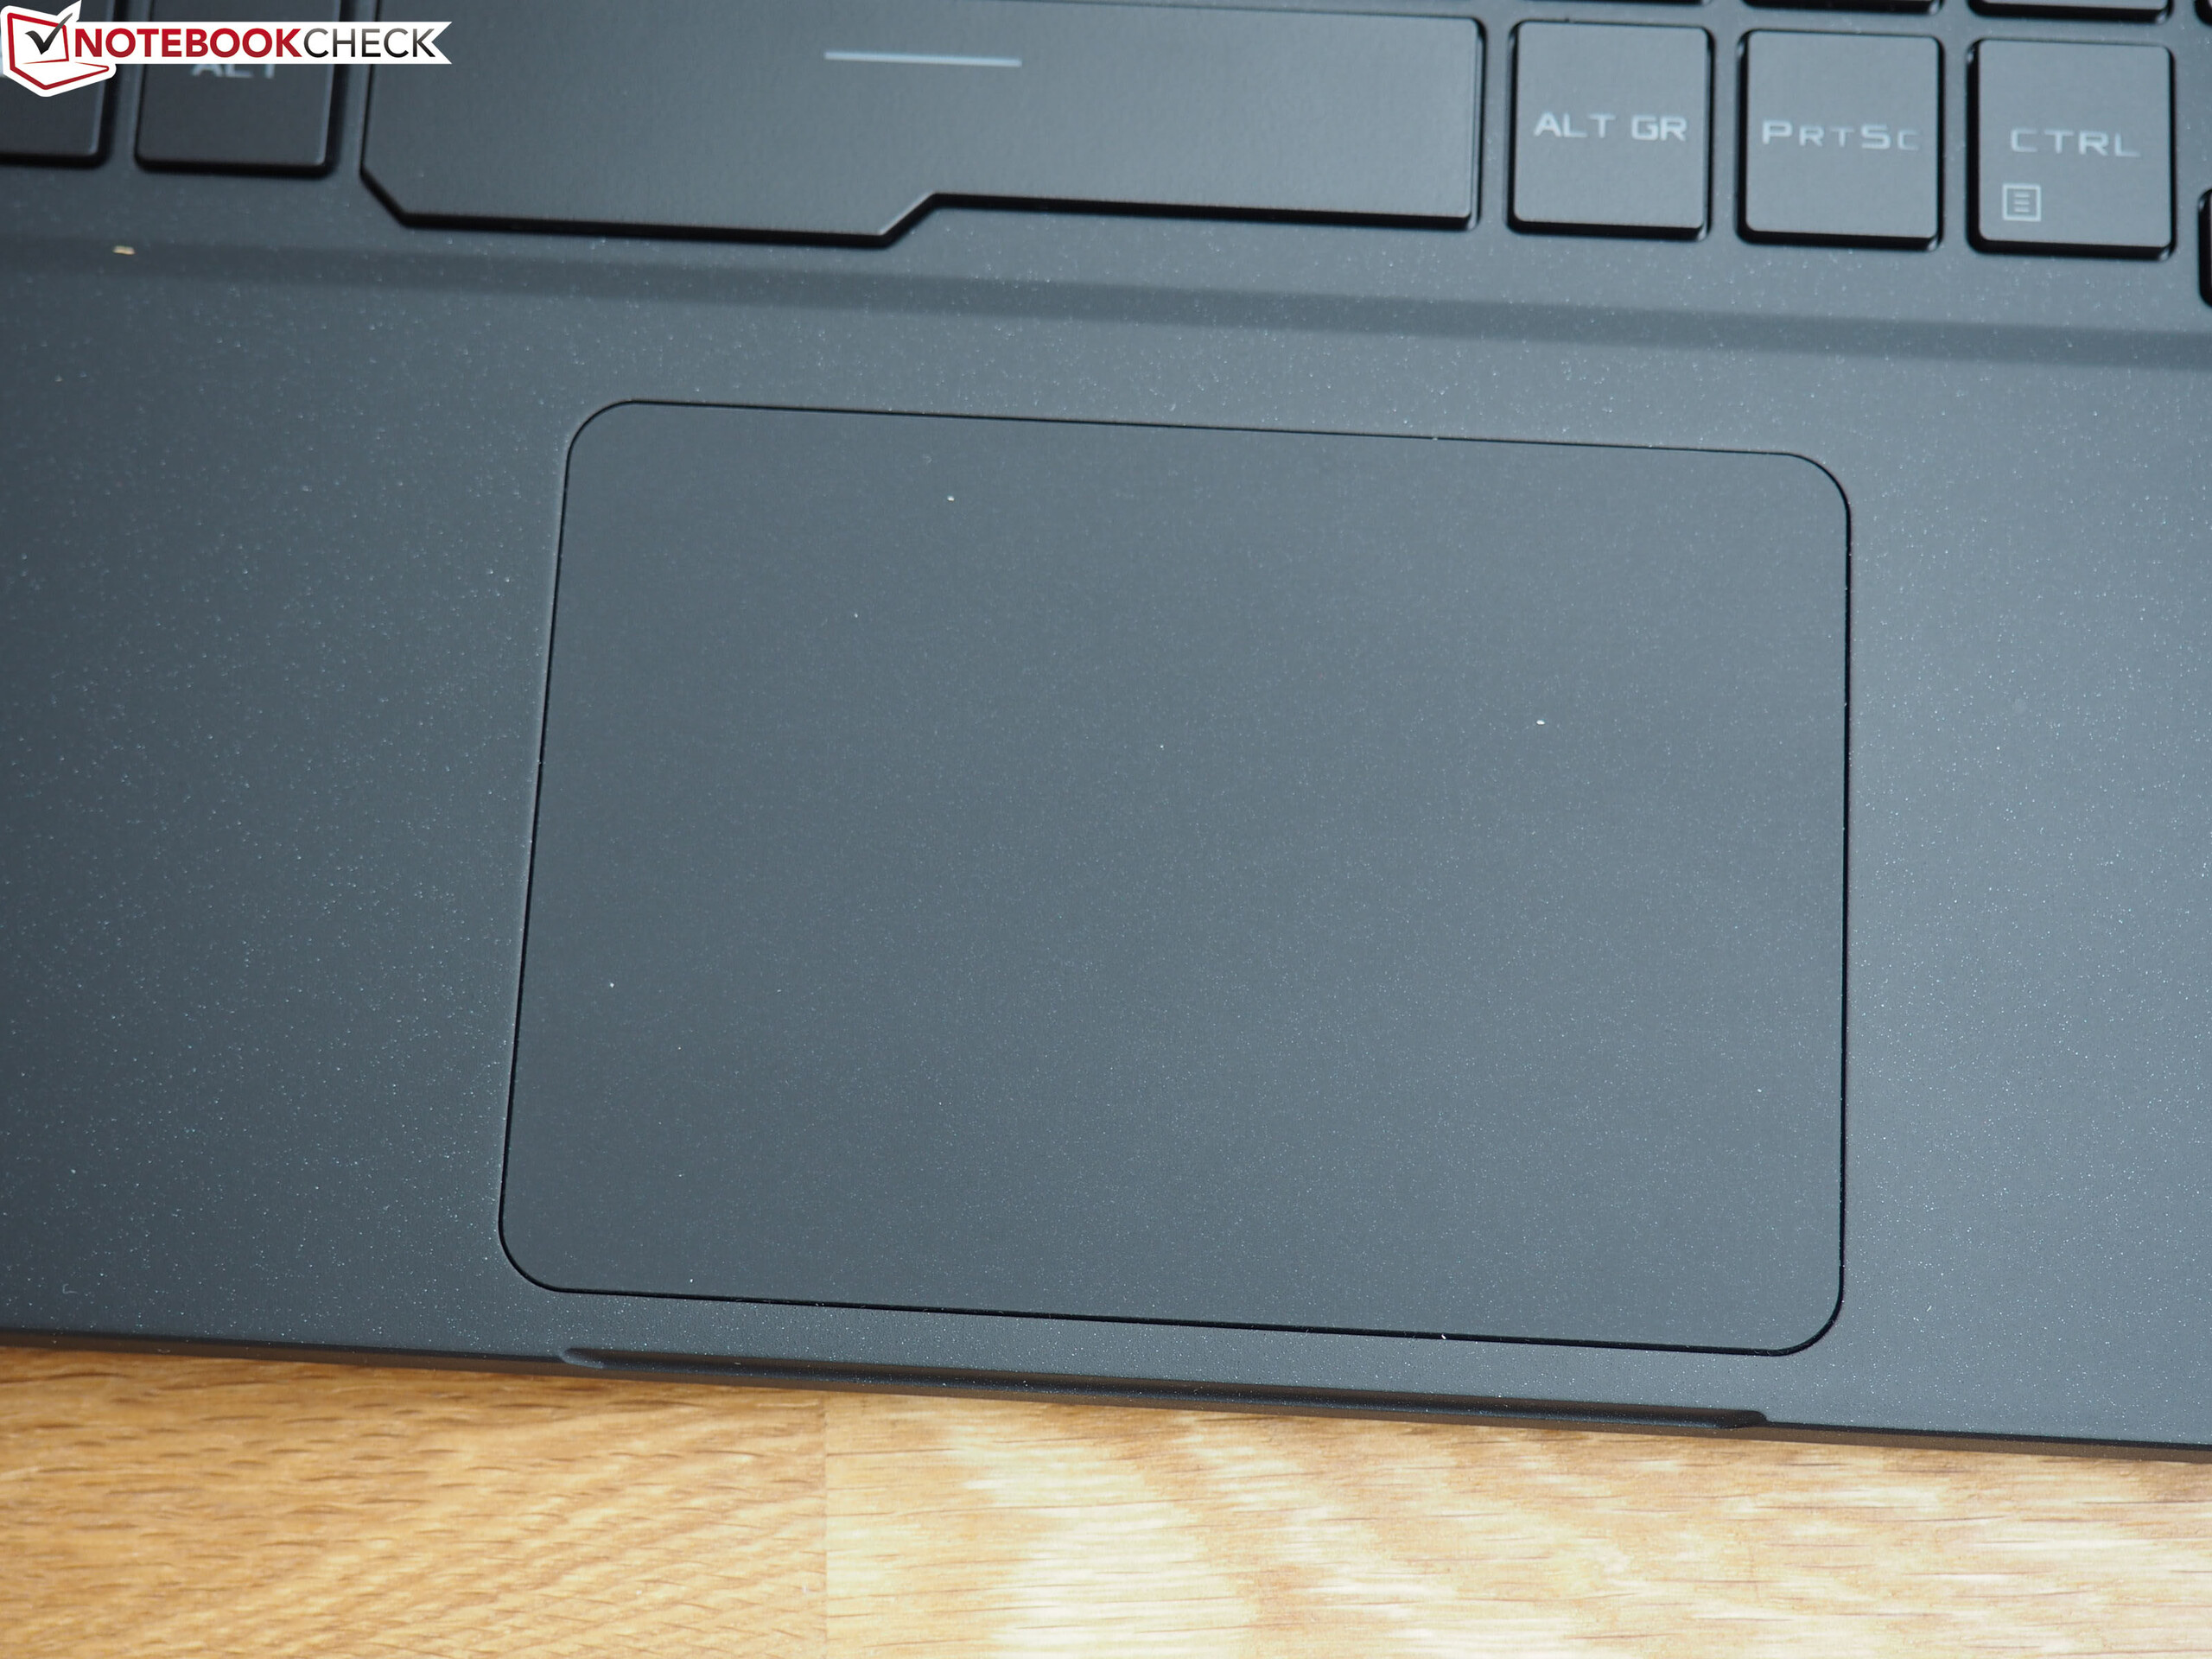
(±) Handledsstöden och pekplattan kan bli väldigt varma vid beröring med maximalt 38 °C / 100.4 F.
(-) Medeltemperaturen för handledsstödsområdet på liknande enheter var 28.8 °C / 83.8 F (-9.2 °C / -16.6 F).
| Asus Zephyrus S GX502GW GeForce RTX 2070 Mobile, i7-9750H | Asus Zephyrus S GX531GX GeForce RTX 2080 Max-Q, i7-8750H | Acer Predator Triton 500 GeForce RTX 2080 Max-Q, i7-8750H | Razer Blade 15 RTX 2070 Max-Q GeForce RTX 2070 Max-Q, i7-8750H | Gigabyte Aero 15-X9 GeForce RTX 2070 Max-Q, i7-8750H | Genomsnitt av klass Gaming | |
|---|---|---|---|---|---|---|
| Heat | 6% | -3% | 12% | -1% | 5% | |
| Maximum Upper Side * (°C) | 54 | 47 13% | 49 9% | 49 9% | 56 -4% | 45.2 ? 16% |
| Maximum Bottom * (°C) | 47 | 48.6 -3% | 58 -23% | 49 -4% | 66 -40% | 48 ? -2% |
| Idle Upper Side * (°C) | 33 | 28.8 13% | 33 -0% | 25.4 23% | 27 18% | 31.1 ? 6% |
| Idle Bottom * (°C) | 34 | 33.2 2% | 33 3% | 27.2 20% | 27 21% | 34.2 ? -1% |
* ... mindre är bättre
Asus Zephyrus S GX502GW ljudanalys
(+) | högtalare kan spela relativt högt (90 dB)
Bas 100 - 315 Hz
(±) | reducerad bas - i genomsnitt 12.7% lägre än medianen
(±) | linjäriteten för basen är genomsnittlig (8.5% delta till föregående frekvens)
Mellan 400 - 2000 Hz
(+) | balanserad mellan - endast 4.5% från medianen
(+) | mids är linjära (4.1% delta till föregående frekvens)
Högsta 2 - 16 kHz
(±) | högre toppar - i genomsnitt 6.7% högre än medianen
(±) | linjäriteten för toppar är genomsnittlig (10.8% delta till föregående frekvens)
Totalt 100 - 16 000 Hz
(+) | det totala ljudet är linjärt (14.6% skillnad mot median)
Jämfört med samma klass
» 28% av alla testade enheter i den här klassen var bättre, 7% liknande, 65% sämre
» Den bästa hade ett delta på 6%, genomsnittet var 18%, sämst var 132%
Jämfört med alla testade enheter
» 19% av alla testade enheter var bättre, 4% liknande, 77% sämre
» Den bästa hade ett delta på 4%, genomsnittet var 24%, sämst var 134%
Asus Zephyrus S GX531GX ljudanalys
(±) | högtalarljudstyrkan är genomsnittlig men bra (73 dB)
Bas 100 - 315 Hz
(±) | reducerad bas - i genomsnitt 13.3% lägre än medianen
(±) | linjäriteten för basen är genomsnittlig (14.9% delta till föregående frekvens)
Mellan 400 - 2000 Hz
(+) | balanserad mellan - endast 1.9% från medianen
(+) | mids är linjära (5.2% delta till föregående frekvens)
Högsta 2 - 16 kHz
(±) | högre toppar - i genomsnitt 5.6% högre än medianen
(±) | linjäriteten för toppar är genomsnittlig (10.8% delta till föregående frekvens)
Totalt 100 - 16 000 Hz
(±) | linjäriteten för det totala ljudet är genomsnittlig (18.3% skillnad mot median)
Jämfört med samma klass
» 58% av alla testade enheter i den här klassen var bättre, 9% liknande, 33% sämre
» Den bästa hade ett delta på 6%, genomsnittet var 18%, sämst var 132%
Jämfört med alla testade enheter
» 40% av alla testade enheter var bättre, 8% liknande, 52% sämre
» Den bästa hade ett delta på 4%, genomsnittet var 24%, sämst var 134%
| Av/Standby | |
| Låg belastning | |
| Hög belastning |
|
Förklaring:
min: | |
| Asus Zephyrus S GX502GW GeForce RTX 2070 Mobile, i7-9750H | Asus Zephyrus S GX531GX GeForce RTX 2080 Max-Q, i7-8750H | Acer Predator Triton 500 GeForce RTX 2080 Max-Q, i7-8750H | Razer Blade 15 RTX 2070 Max-Q GeForce RTX 2070 Max-Q, i7-8750H | Gigabyte Aero 15-X9 GeForce RTX 2070 Max-Q, i7-8750H | Genomsnitt av klass Gaming | |
|---|---|---|---|---|---|---|
| Power Consumption | 18% | 20% | 36% | 31% | 20% | |
| Idle Minimum * (Watt) | 24 | 16.1 33% | 16 33% | 10.4 57% | 16 33% | 13.2 ? 45% |
| Idle Average * (Watt) | 27 | 20.9 23% | 22 19% | 14.6 46% | 18 33% | 18.9 ? 30% |
| Idle Maximum * (Watt) | 33 | 27 18% | 32 3% | 16.3 51% | 23 30% | 24.3 ? 26% |
| Load Average * (Watt) | 129 | 93.4 28% | 89 31% | 88.5 31% | 88 32% | 108 ? 16% |
| Witcher 3 ultra * (Watt) | 176 | 168.2 4% | 147 16% | 155.4 12% | 120 32% | |
| Load Maximum * (Watt) | 216 | 215.3 -0% | 173 20% | 182.4 16% | 167 23% | 254 ? -18% |
* ... mindre är bättre
| Asus Zephyrus S GX502GW GeForce RTX 2070 Mobile, i7-9750H, 76 Wh | Asus Zephyrus S GX531GX GeForce RTX 2080 Max-Q, i7-8750H, 50 Wh | Acer Predator Triton 500 GeForce RTX 2080 Max-Q, i7-8750H, 82 Wh | Razer Blade 15 RTX 2070 Max-Q GeForce RTX 2070 Max-Q, i7-8750H, 80 Wh | Gigabyte Aero 15-X9 GeForce RTX 2070 Max-Q, i7-8750H, 94.24 Wh | Genomsnitt av klass Gaming | |
|---|---|---|---|---|---|---|
| Batteridrifttid | -19% | 7% | 73% | 106% | 62% | |
| Reader / Idle (h) | 5.9 | 5.6 -5% | 11.4 93% | 9.2 56% | 8.71 ? 48% | |
| WiFi v1.3 (h) | 3.7 | 3 -19% | 3.2 -14% | 6.5 76% | 6.4 73% | 7.02 ? 90% |
| Load (h) | 1 | 1.4 40% | 1.5 50% | 2.9 190% | 1.47 ? 47% | |
| H.264 (h) | 6.1 | 8.26 ? |
För
Emot
Läs den fullständiga versionen av den här recensionen på engelska här.
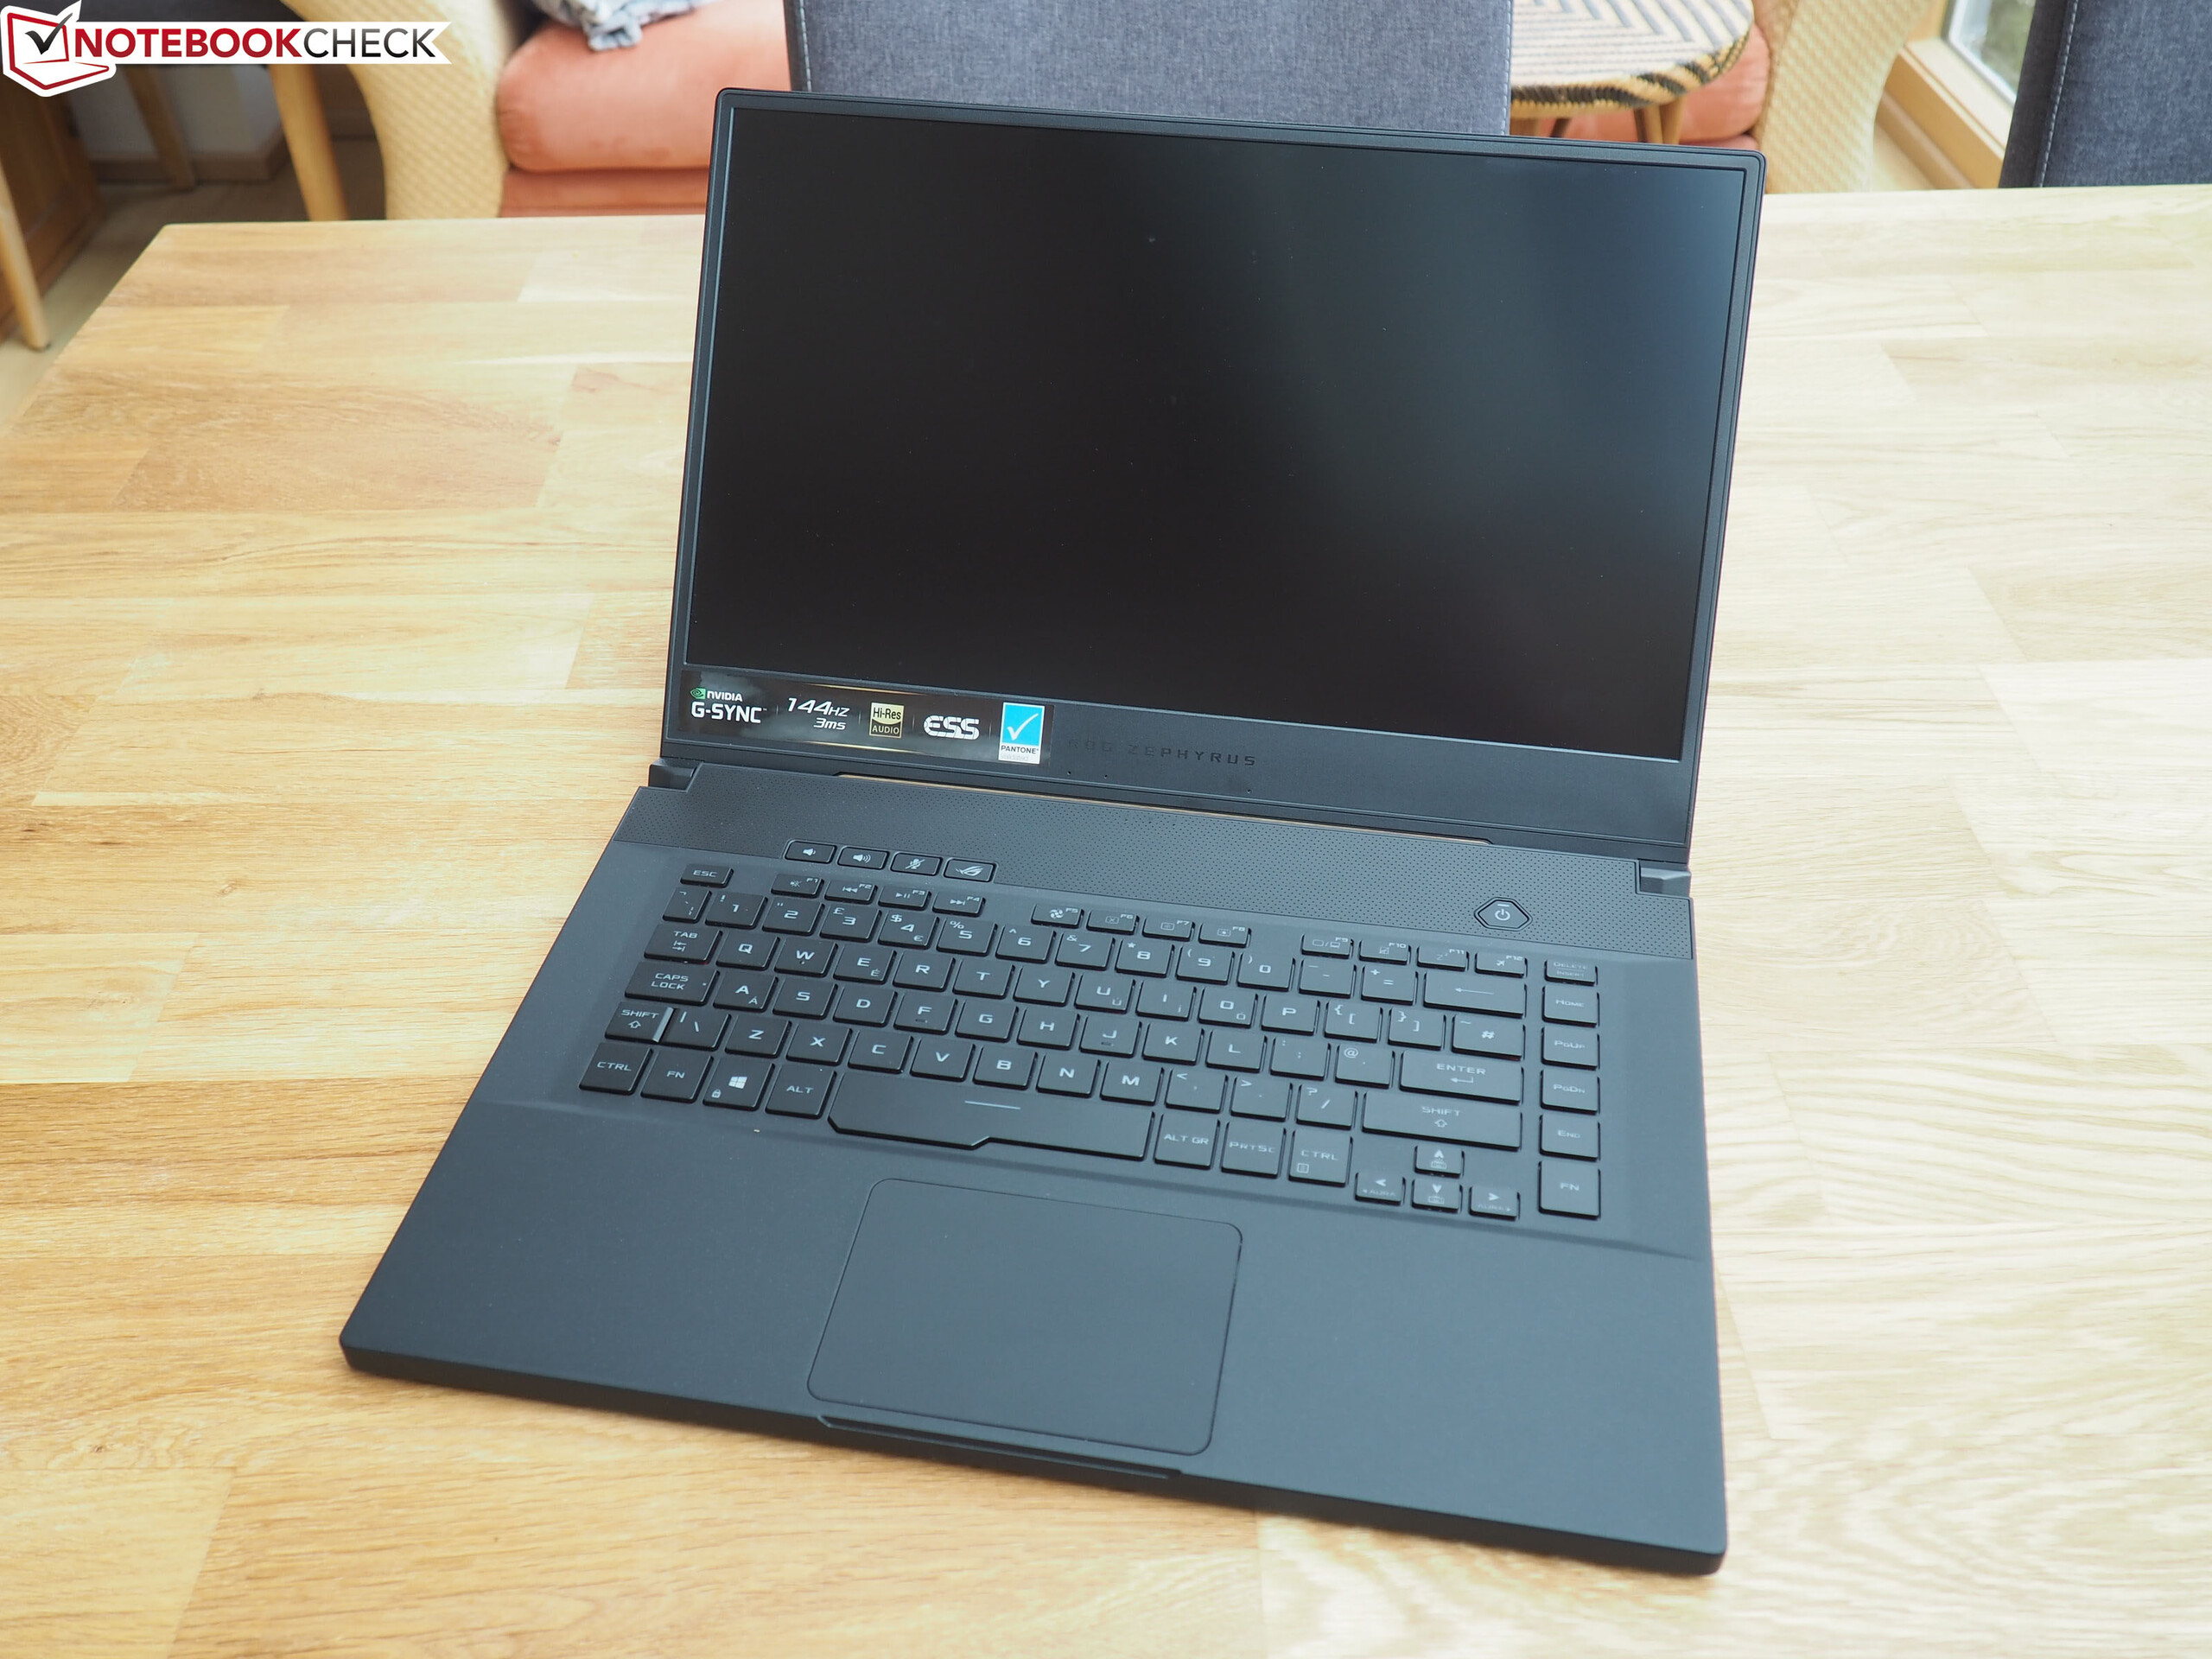
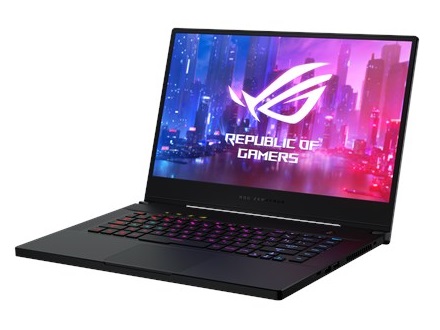
På ytan är ASUS ROG Zephyrus S GX502GW en av de bästa bärbara speldatorerna som går att köpa för tillfället. Den har dock en del frustrerande svagheter som kan tänkas skrämma bort folk.
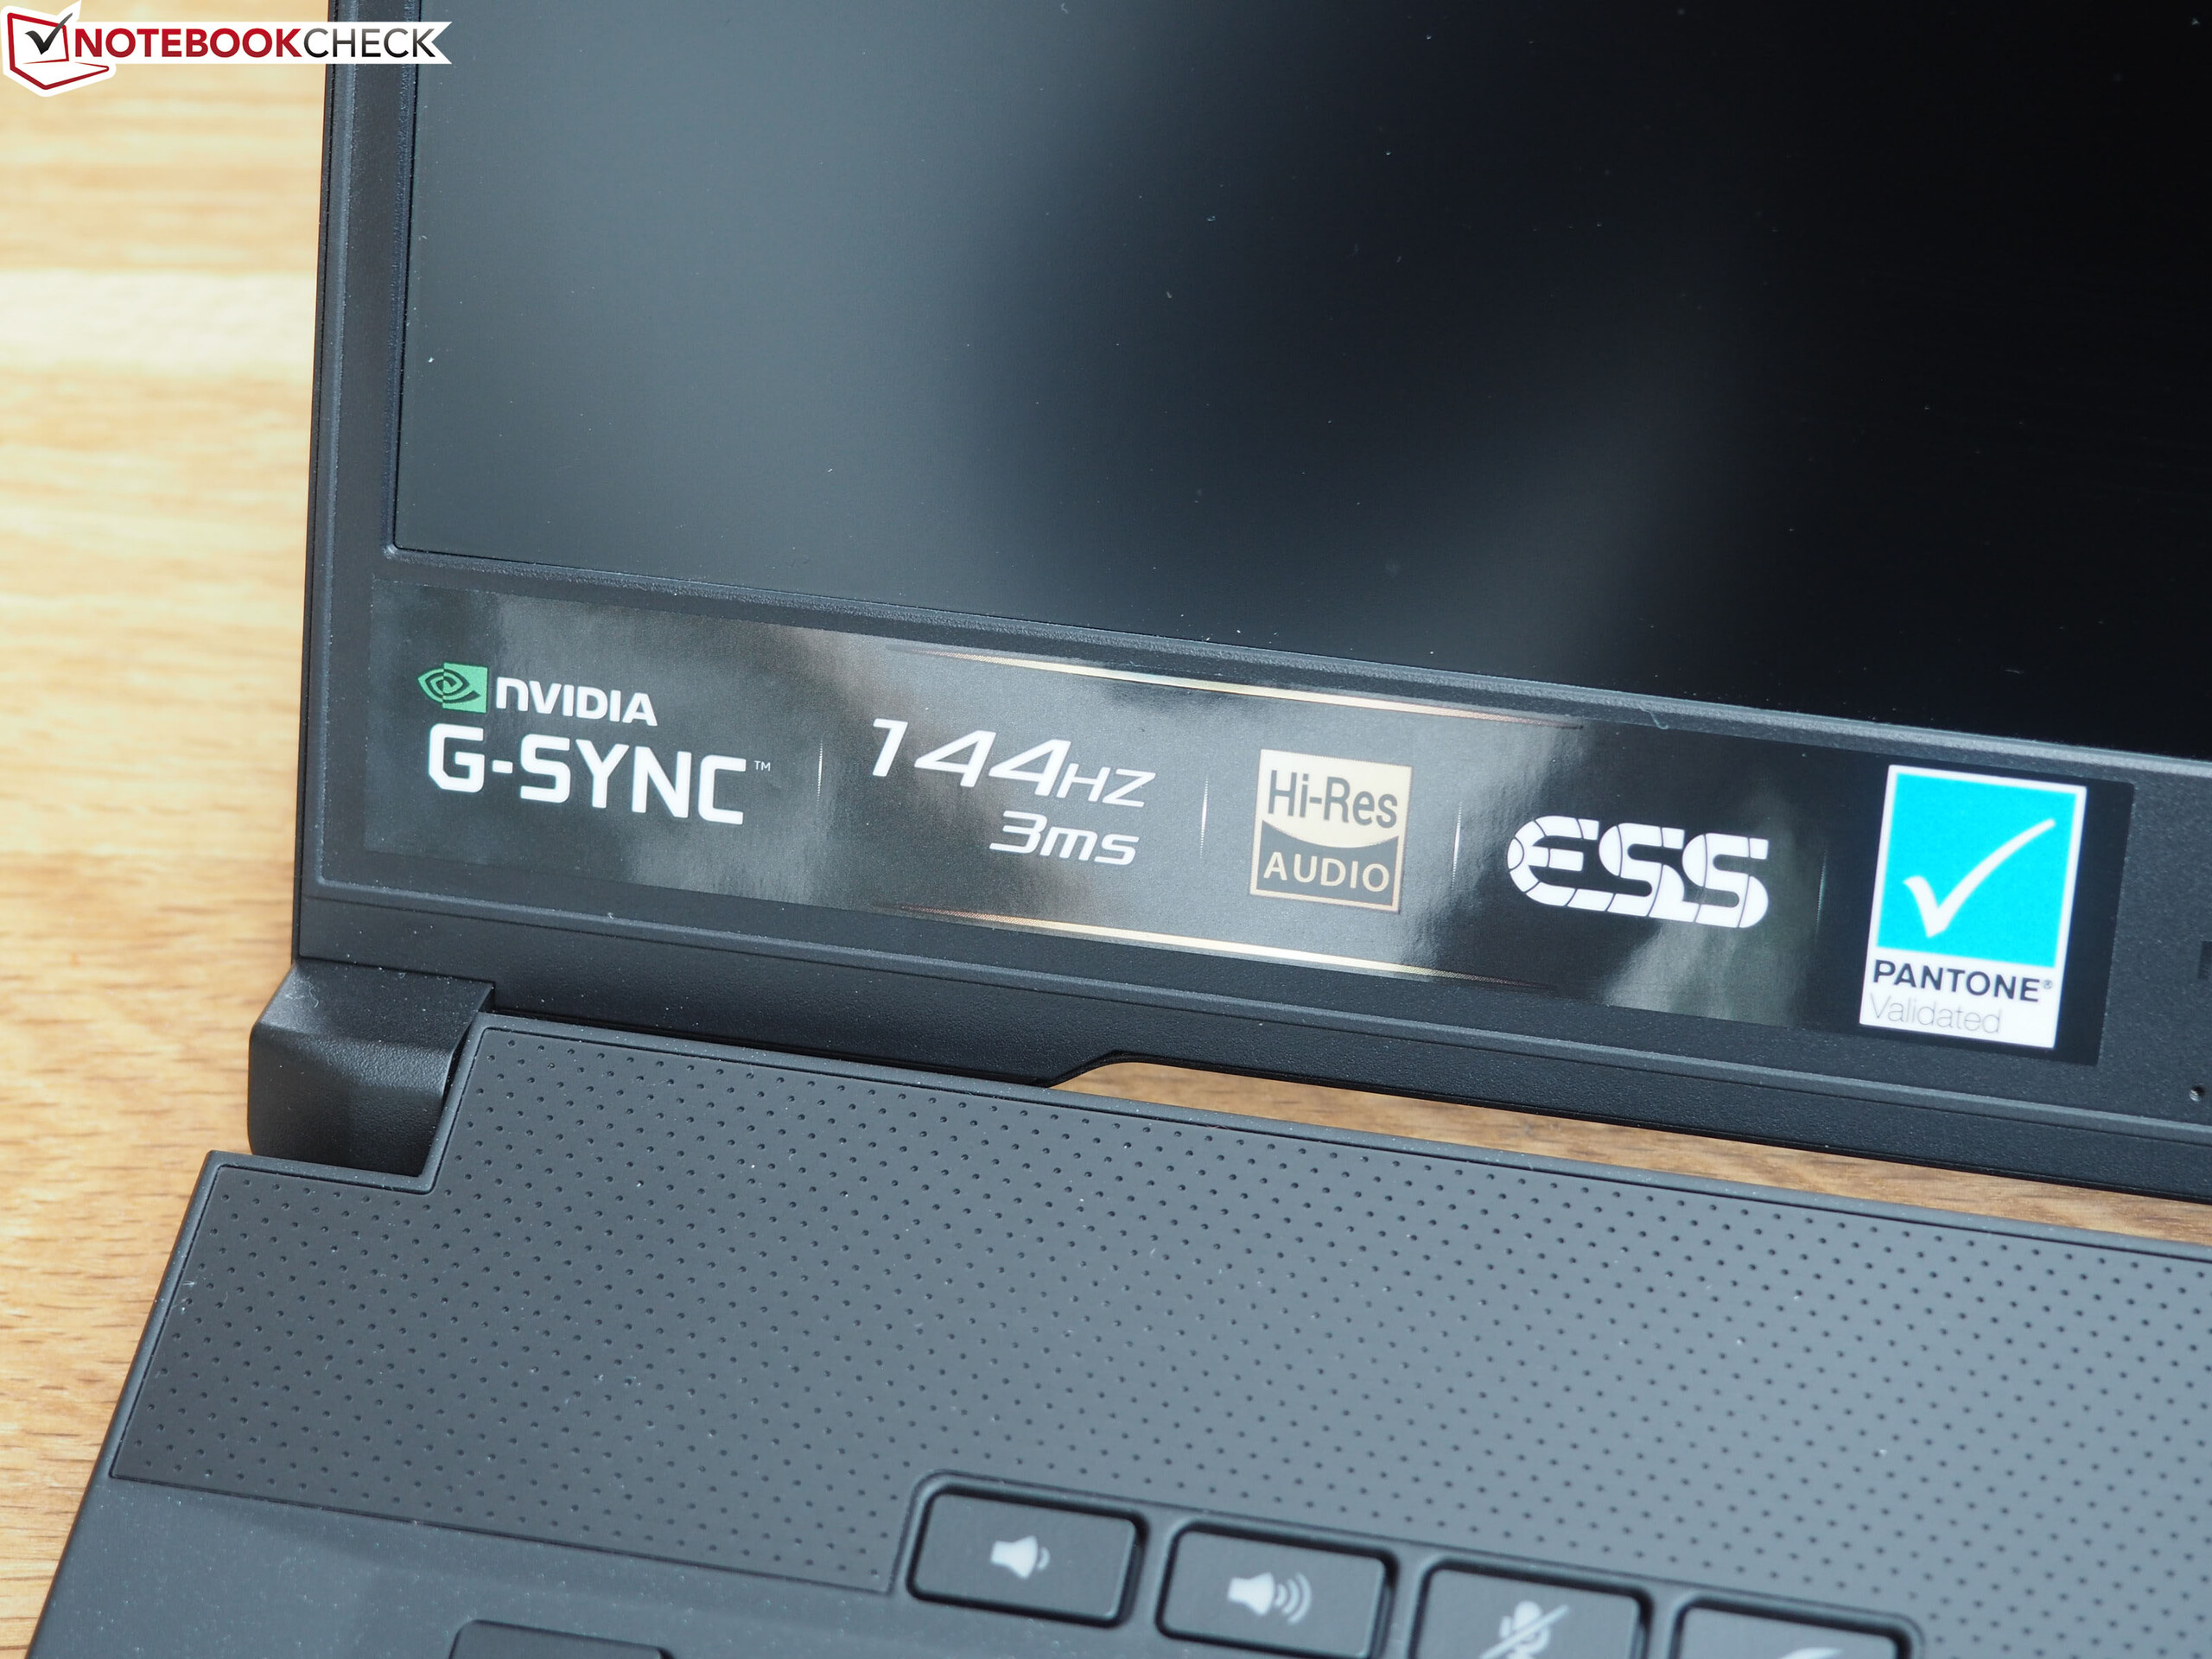
Den har en kompakt och tunn design men lyckas ändå inrymma otroligt kraftfulla komponenter. Den har CPU och GPU från toppskiktet, vilket gör att den utan problem kan ta sig igenom alla AAA-spel som släppts under de senaste åren med höga eller maximala grafikinställningar. Låga responstider, stöd för G-Sync och 144 Hz bilduppdatering gör att spelen rör sig silkeslent. Men du får stå ut med ett lågt kontrastförhållande och förskräcklig batteritid. Vi rekommenderar att du aktiverar Nvidia Optimus när du inte spelar, för annars kommer GPU:n snabbt äta igenom batteriet om den alltid är påslagen.
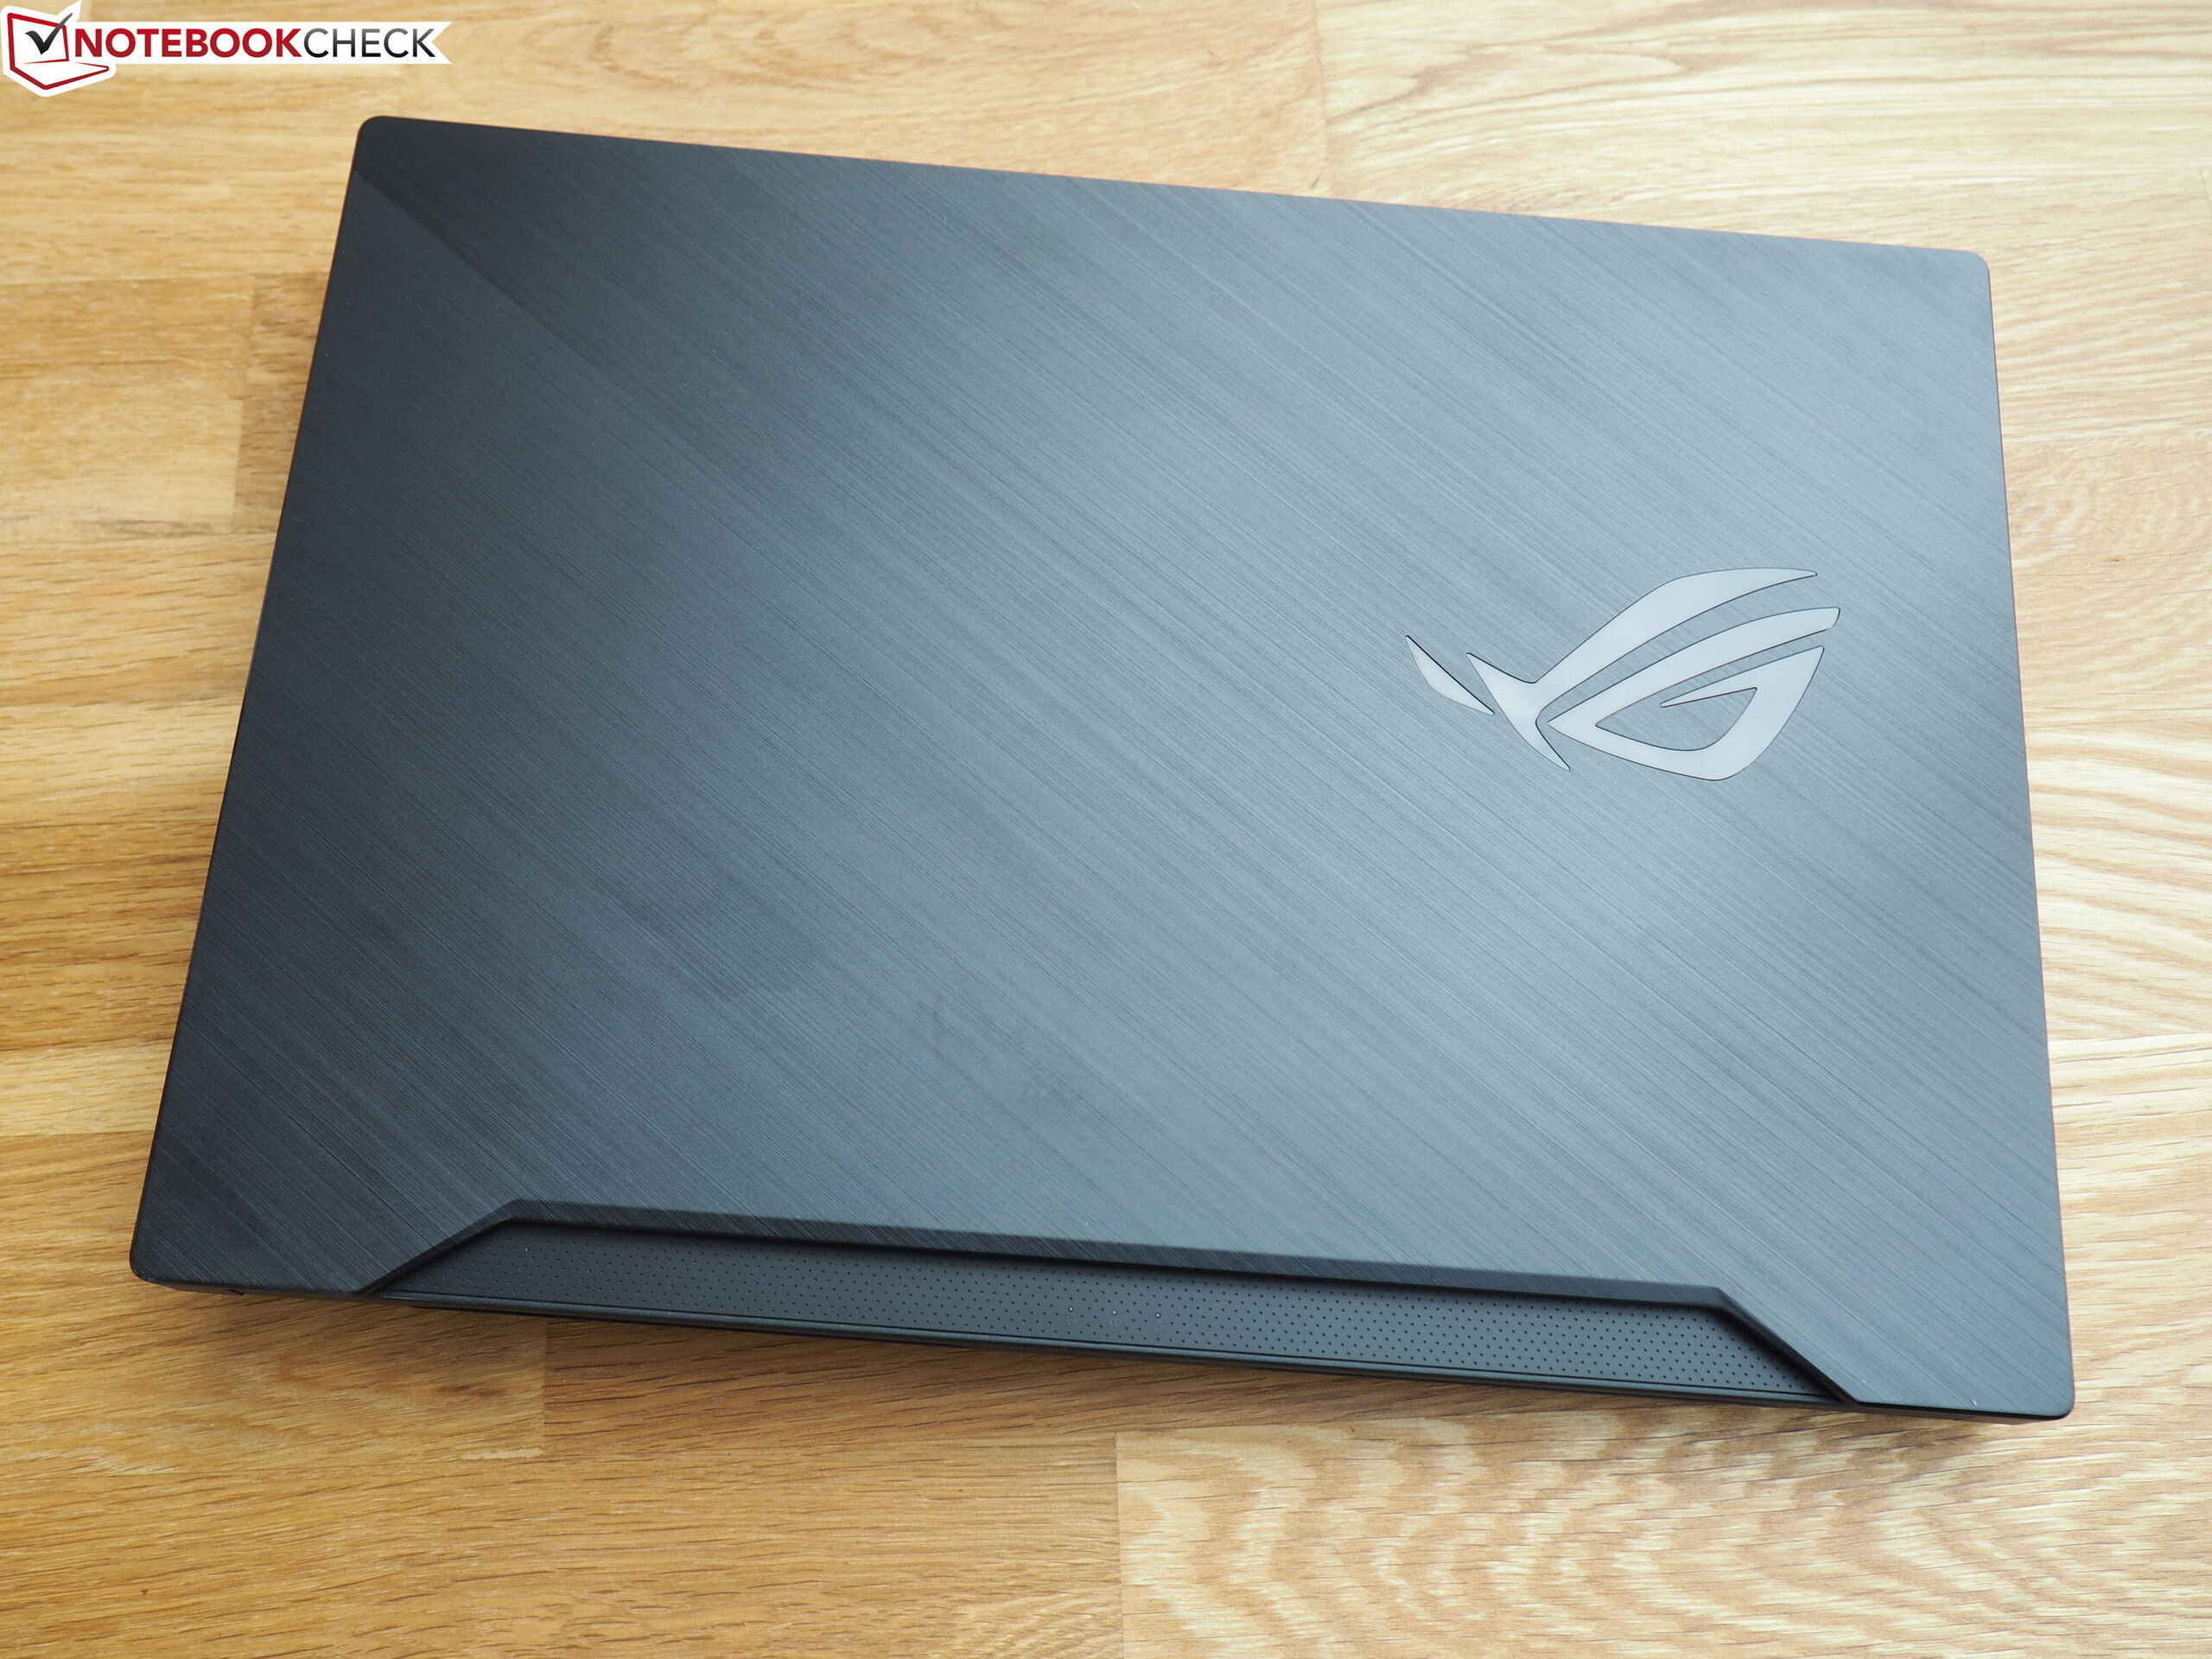
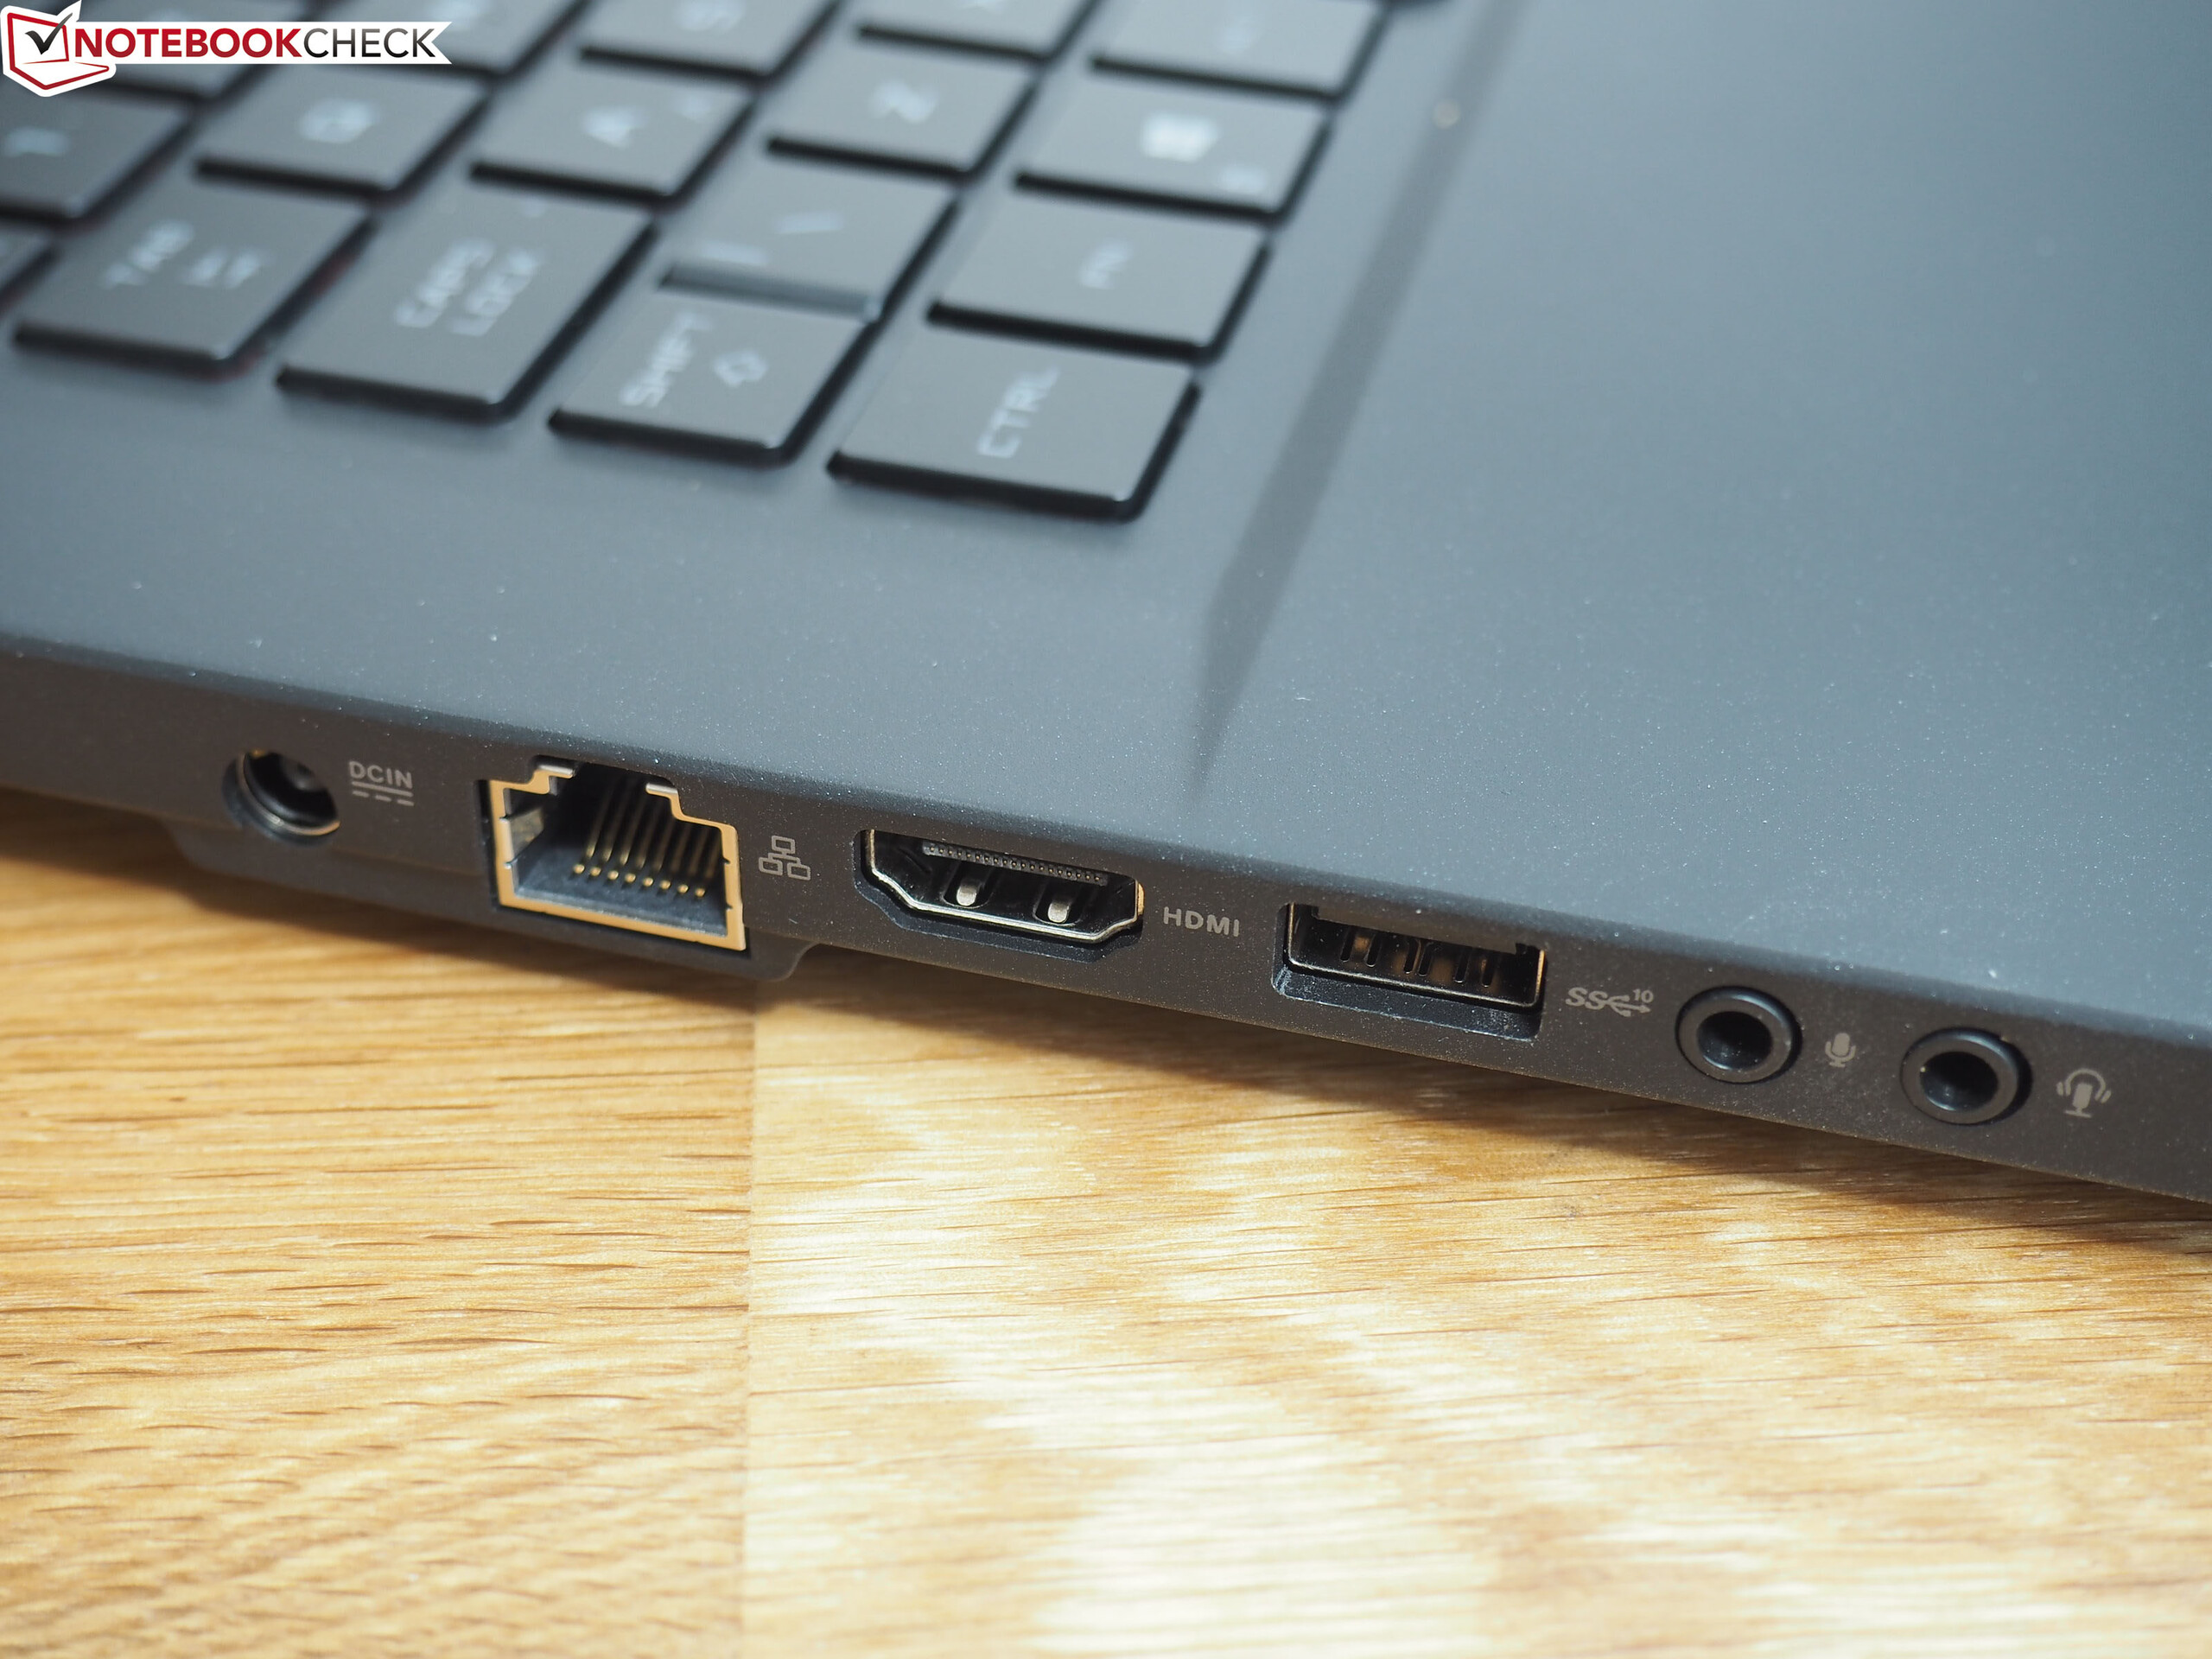
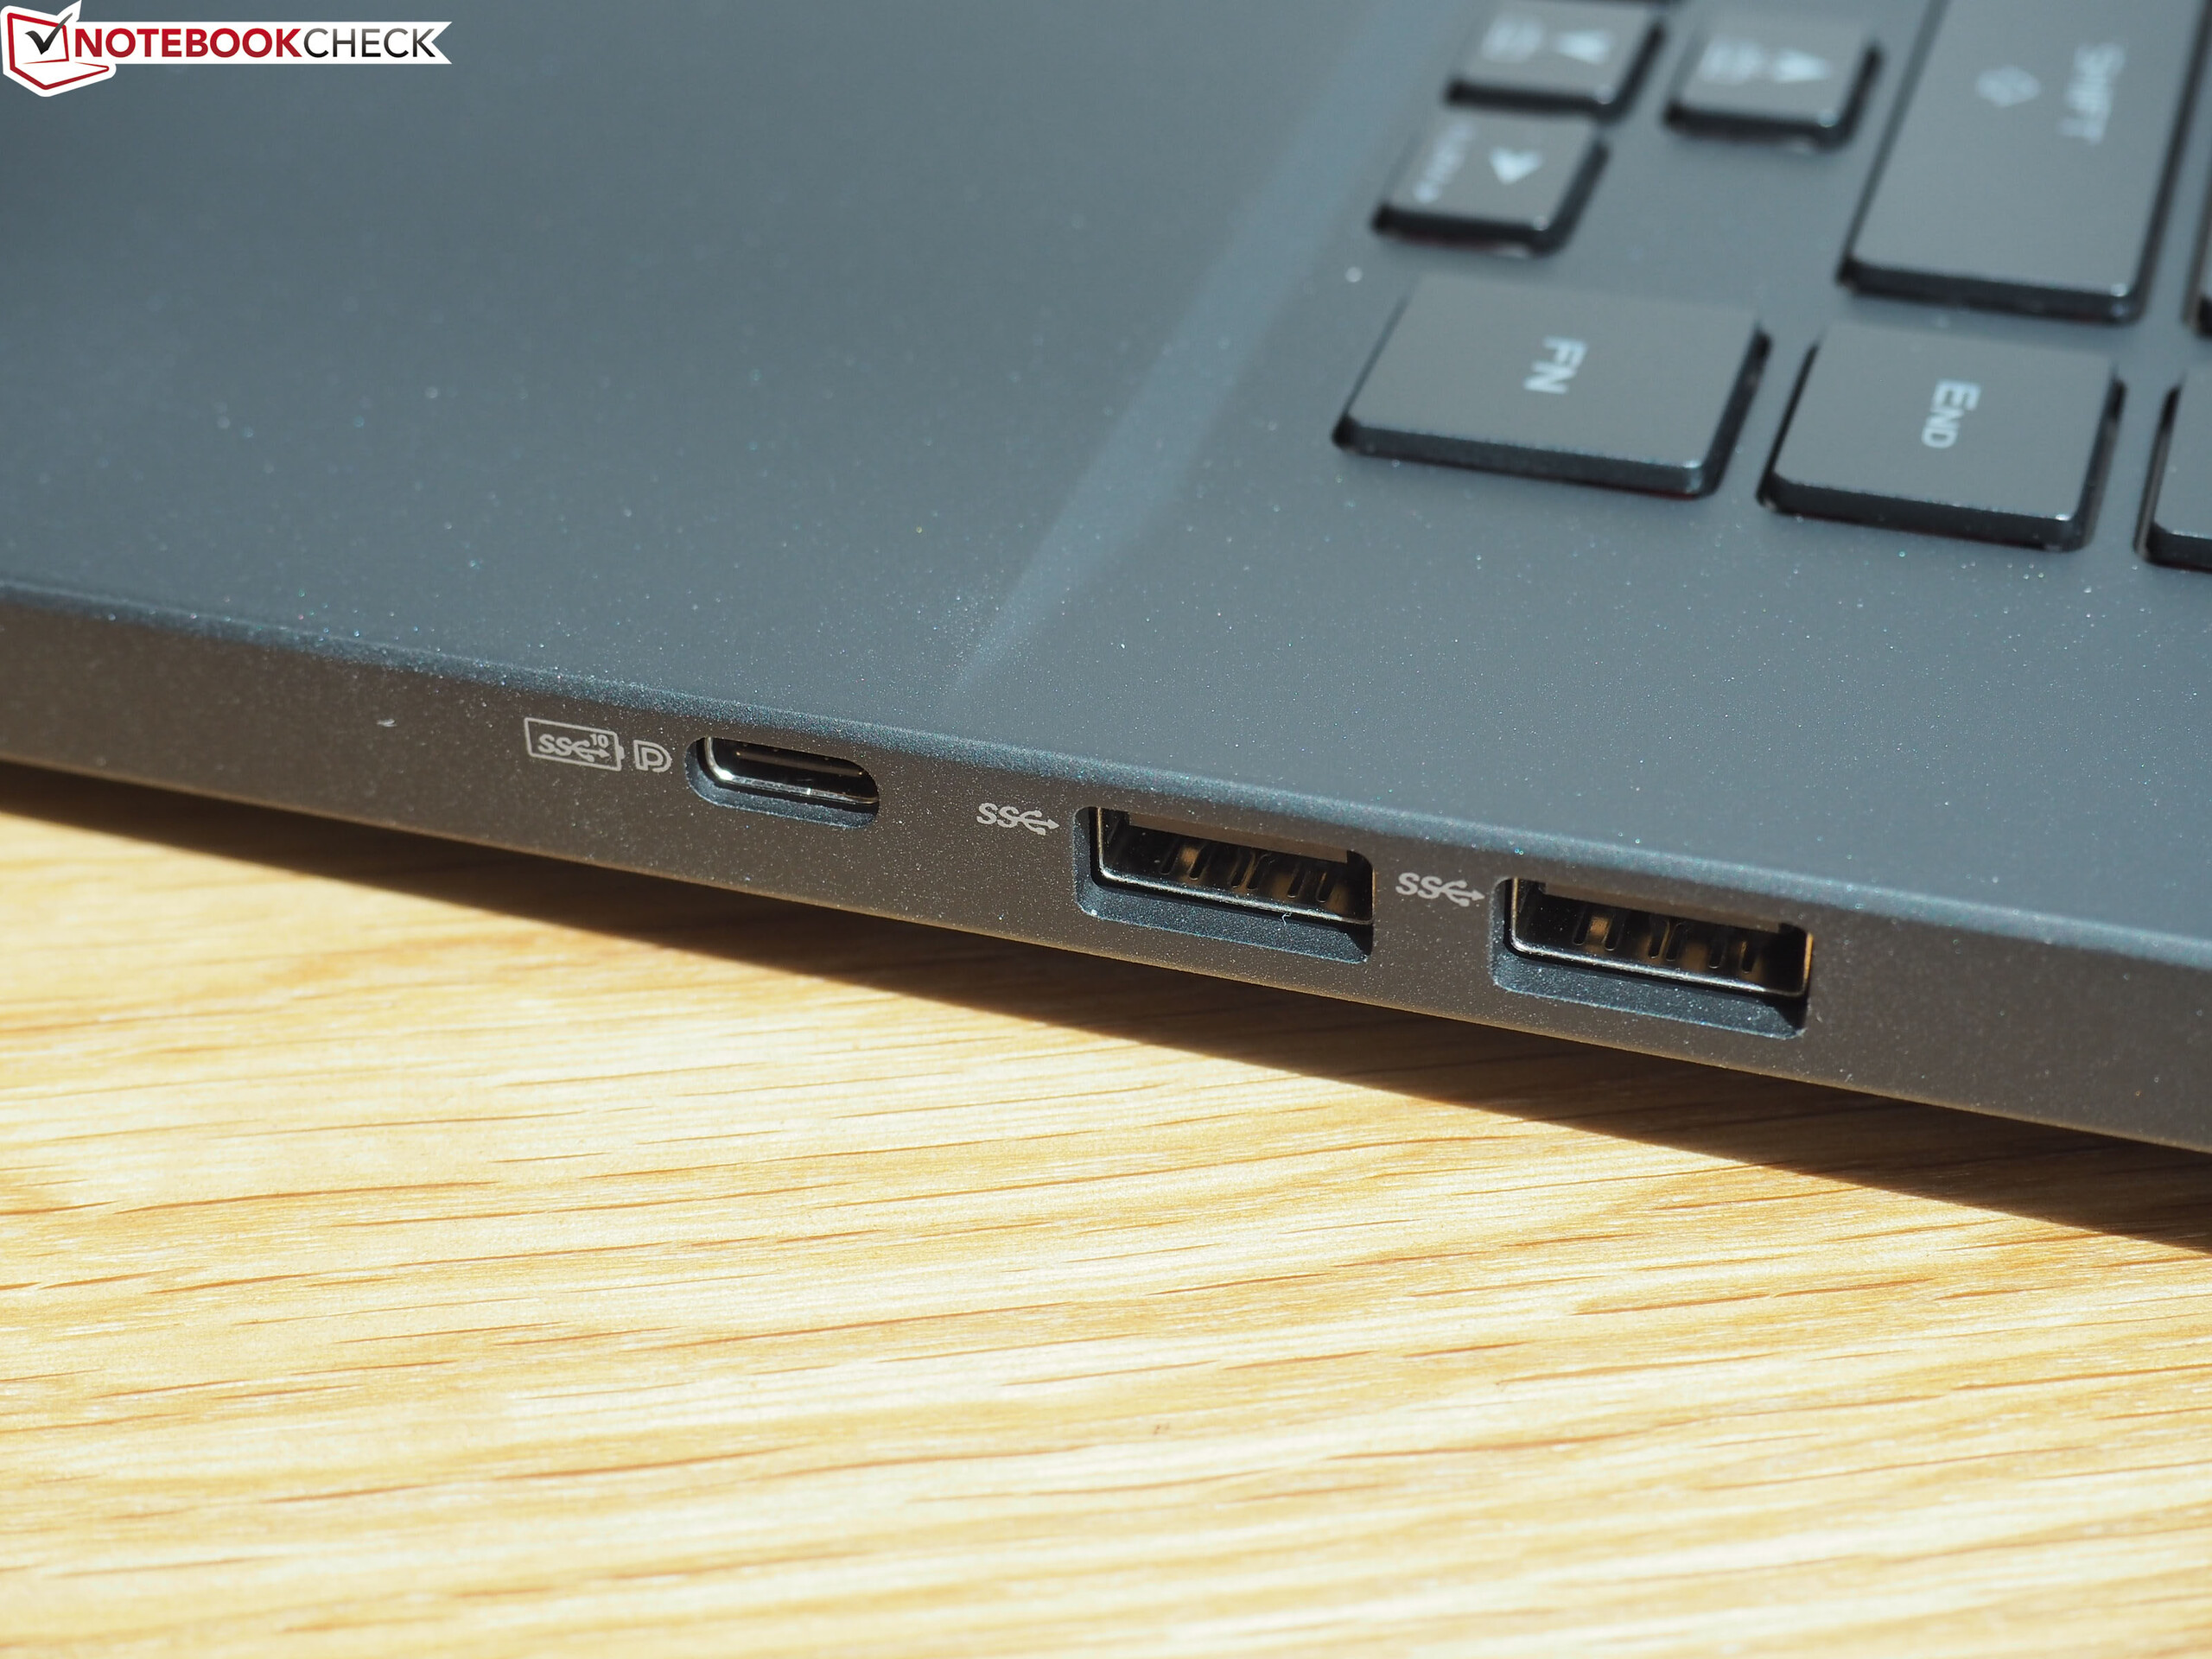
Det är mycket som talar för ASUS ROG Zephyrus S GX502GW. Den är tjusig, kompakt och levererar en utmärkt spelupplevelse. Men den är högljudd, saknar en del användbara portar och har förskräcklig batteritid.
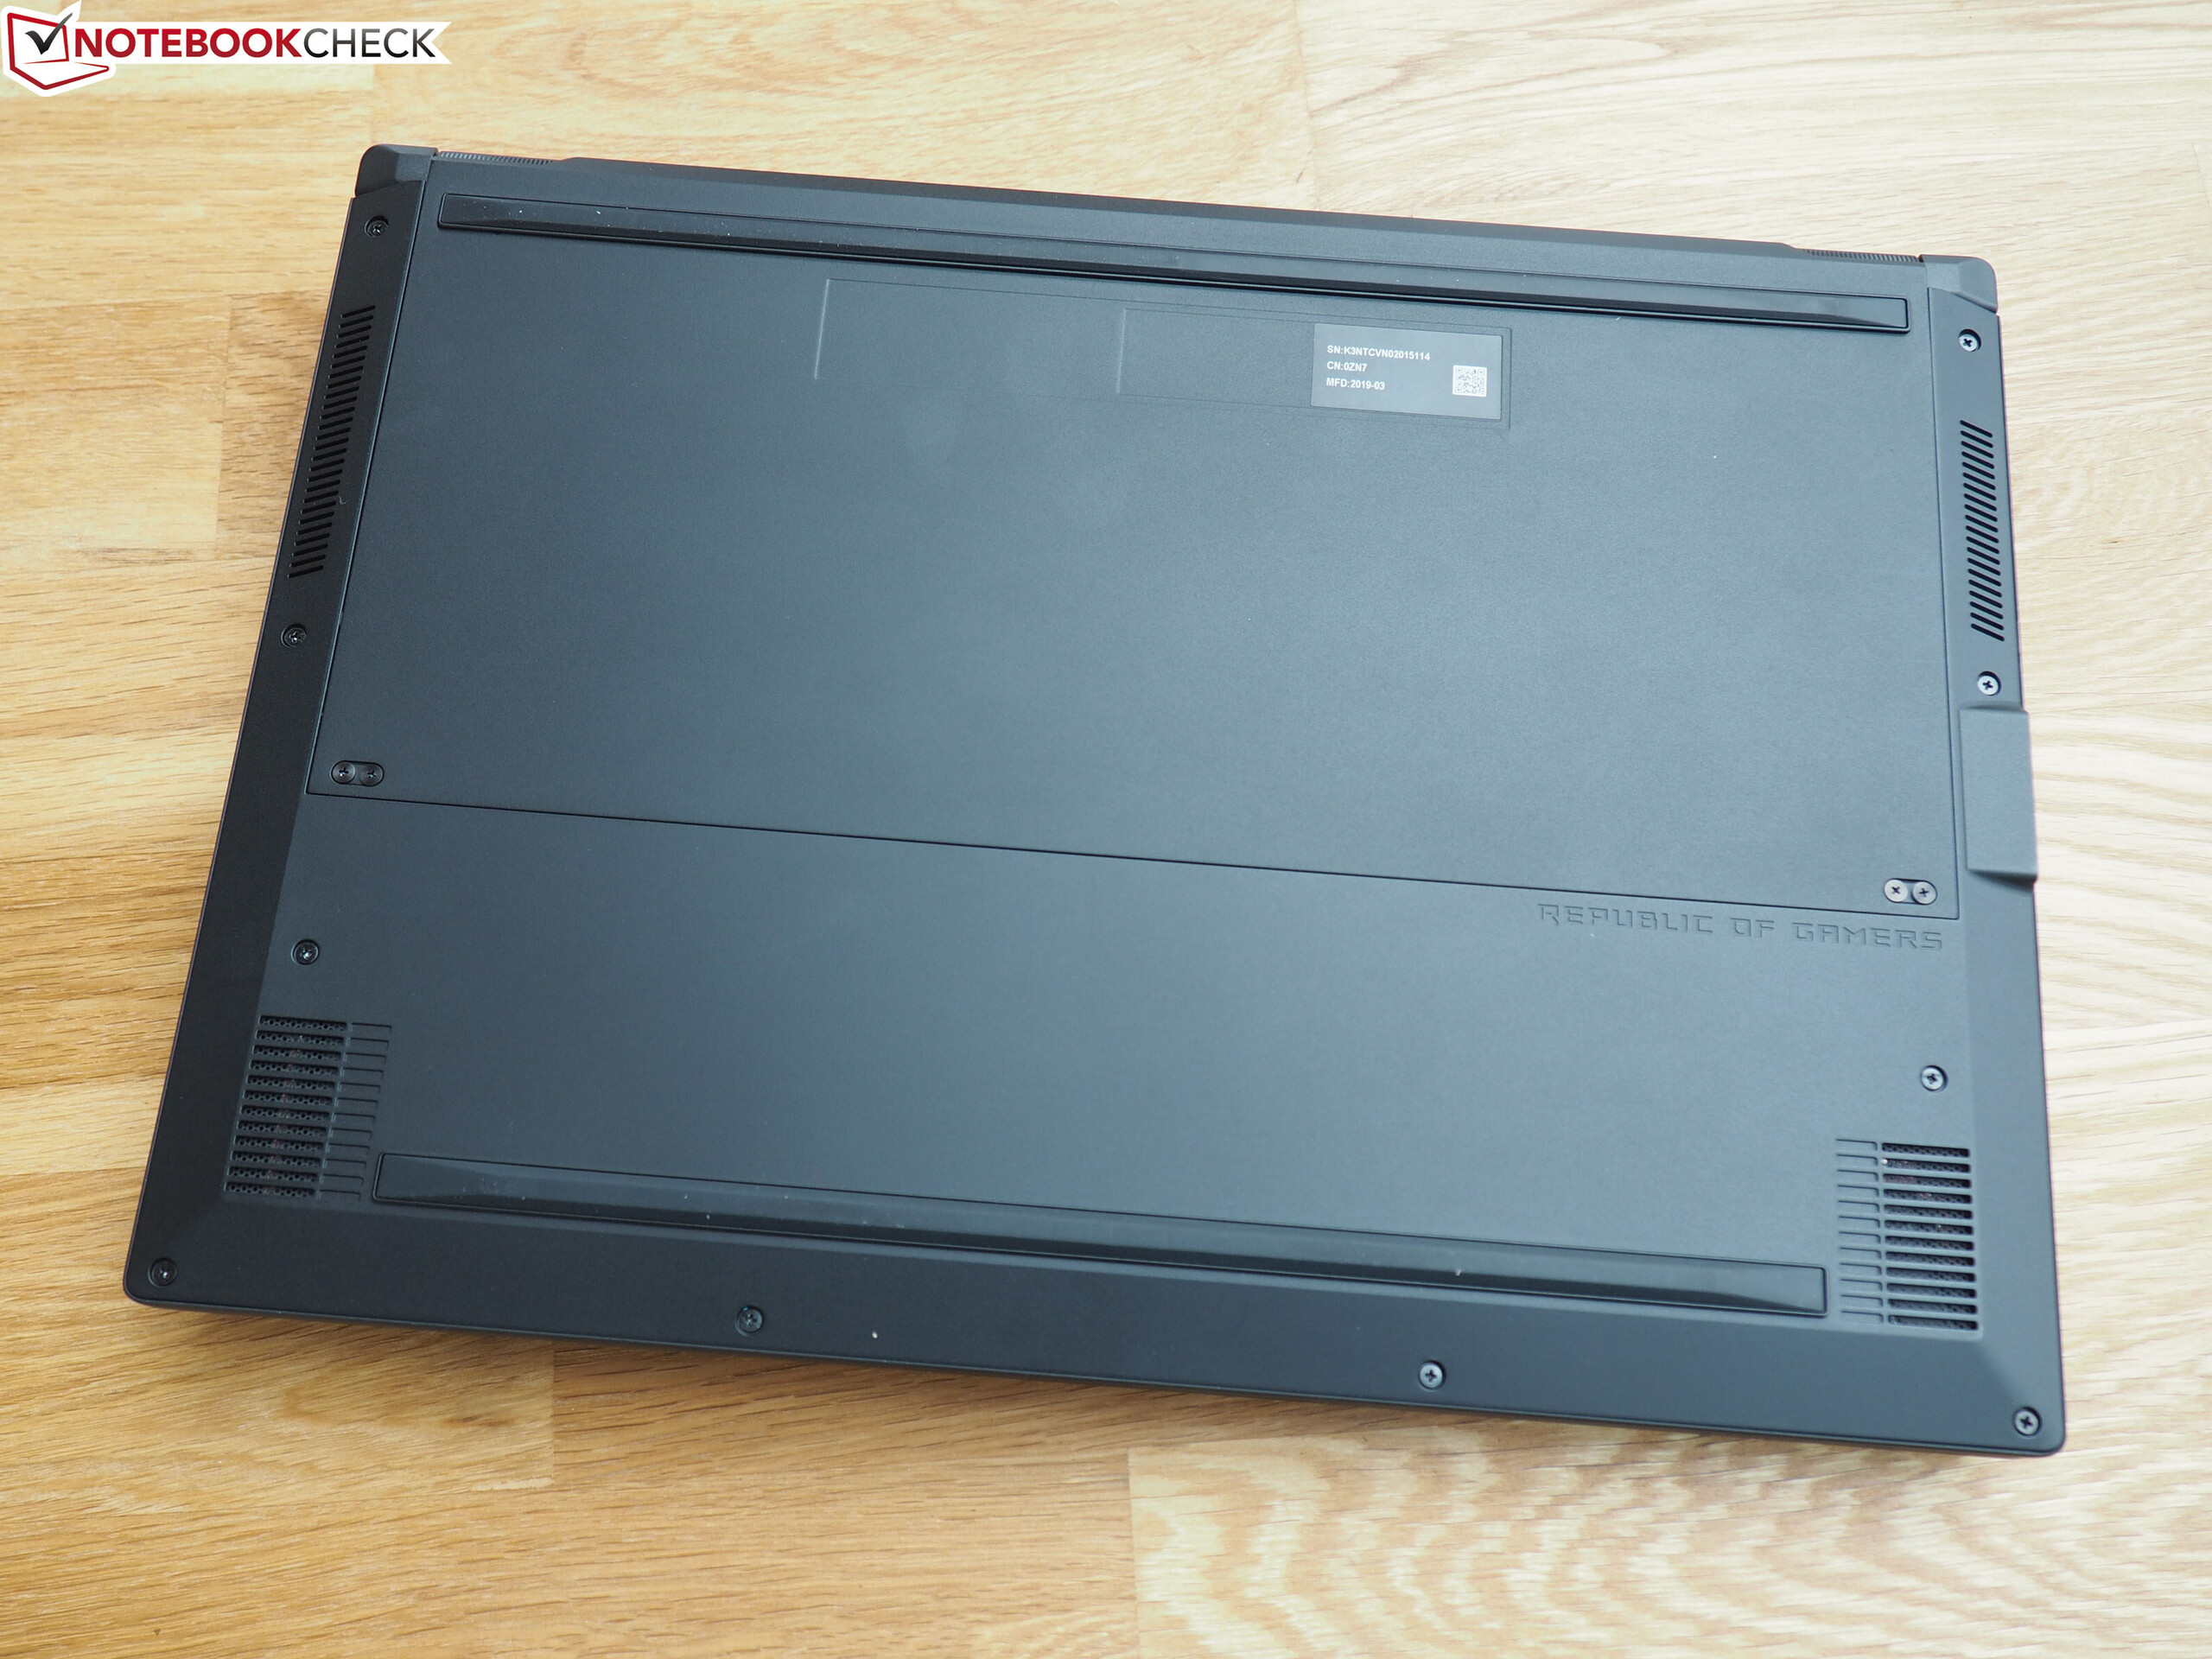
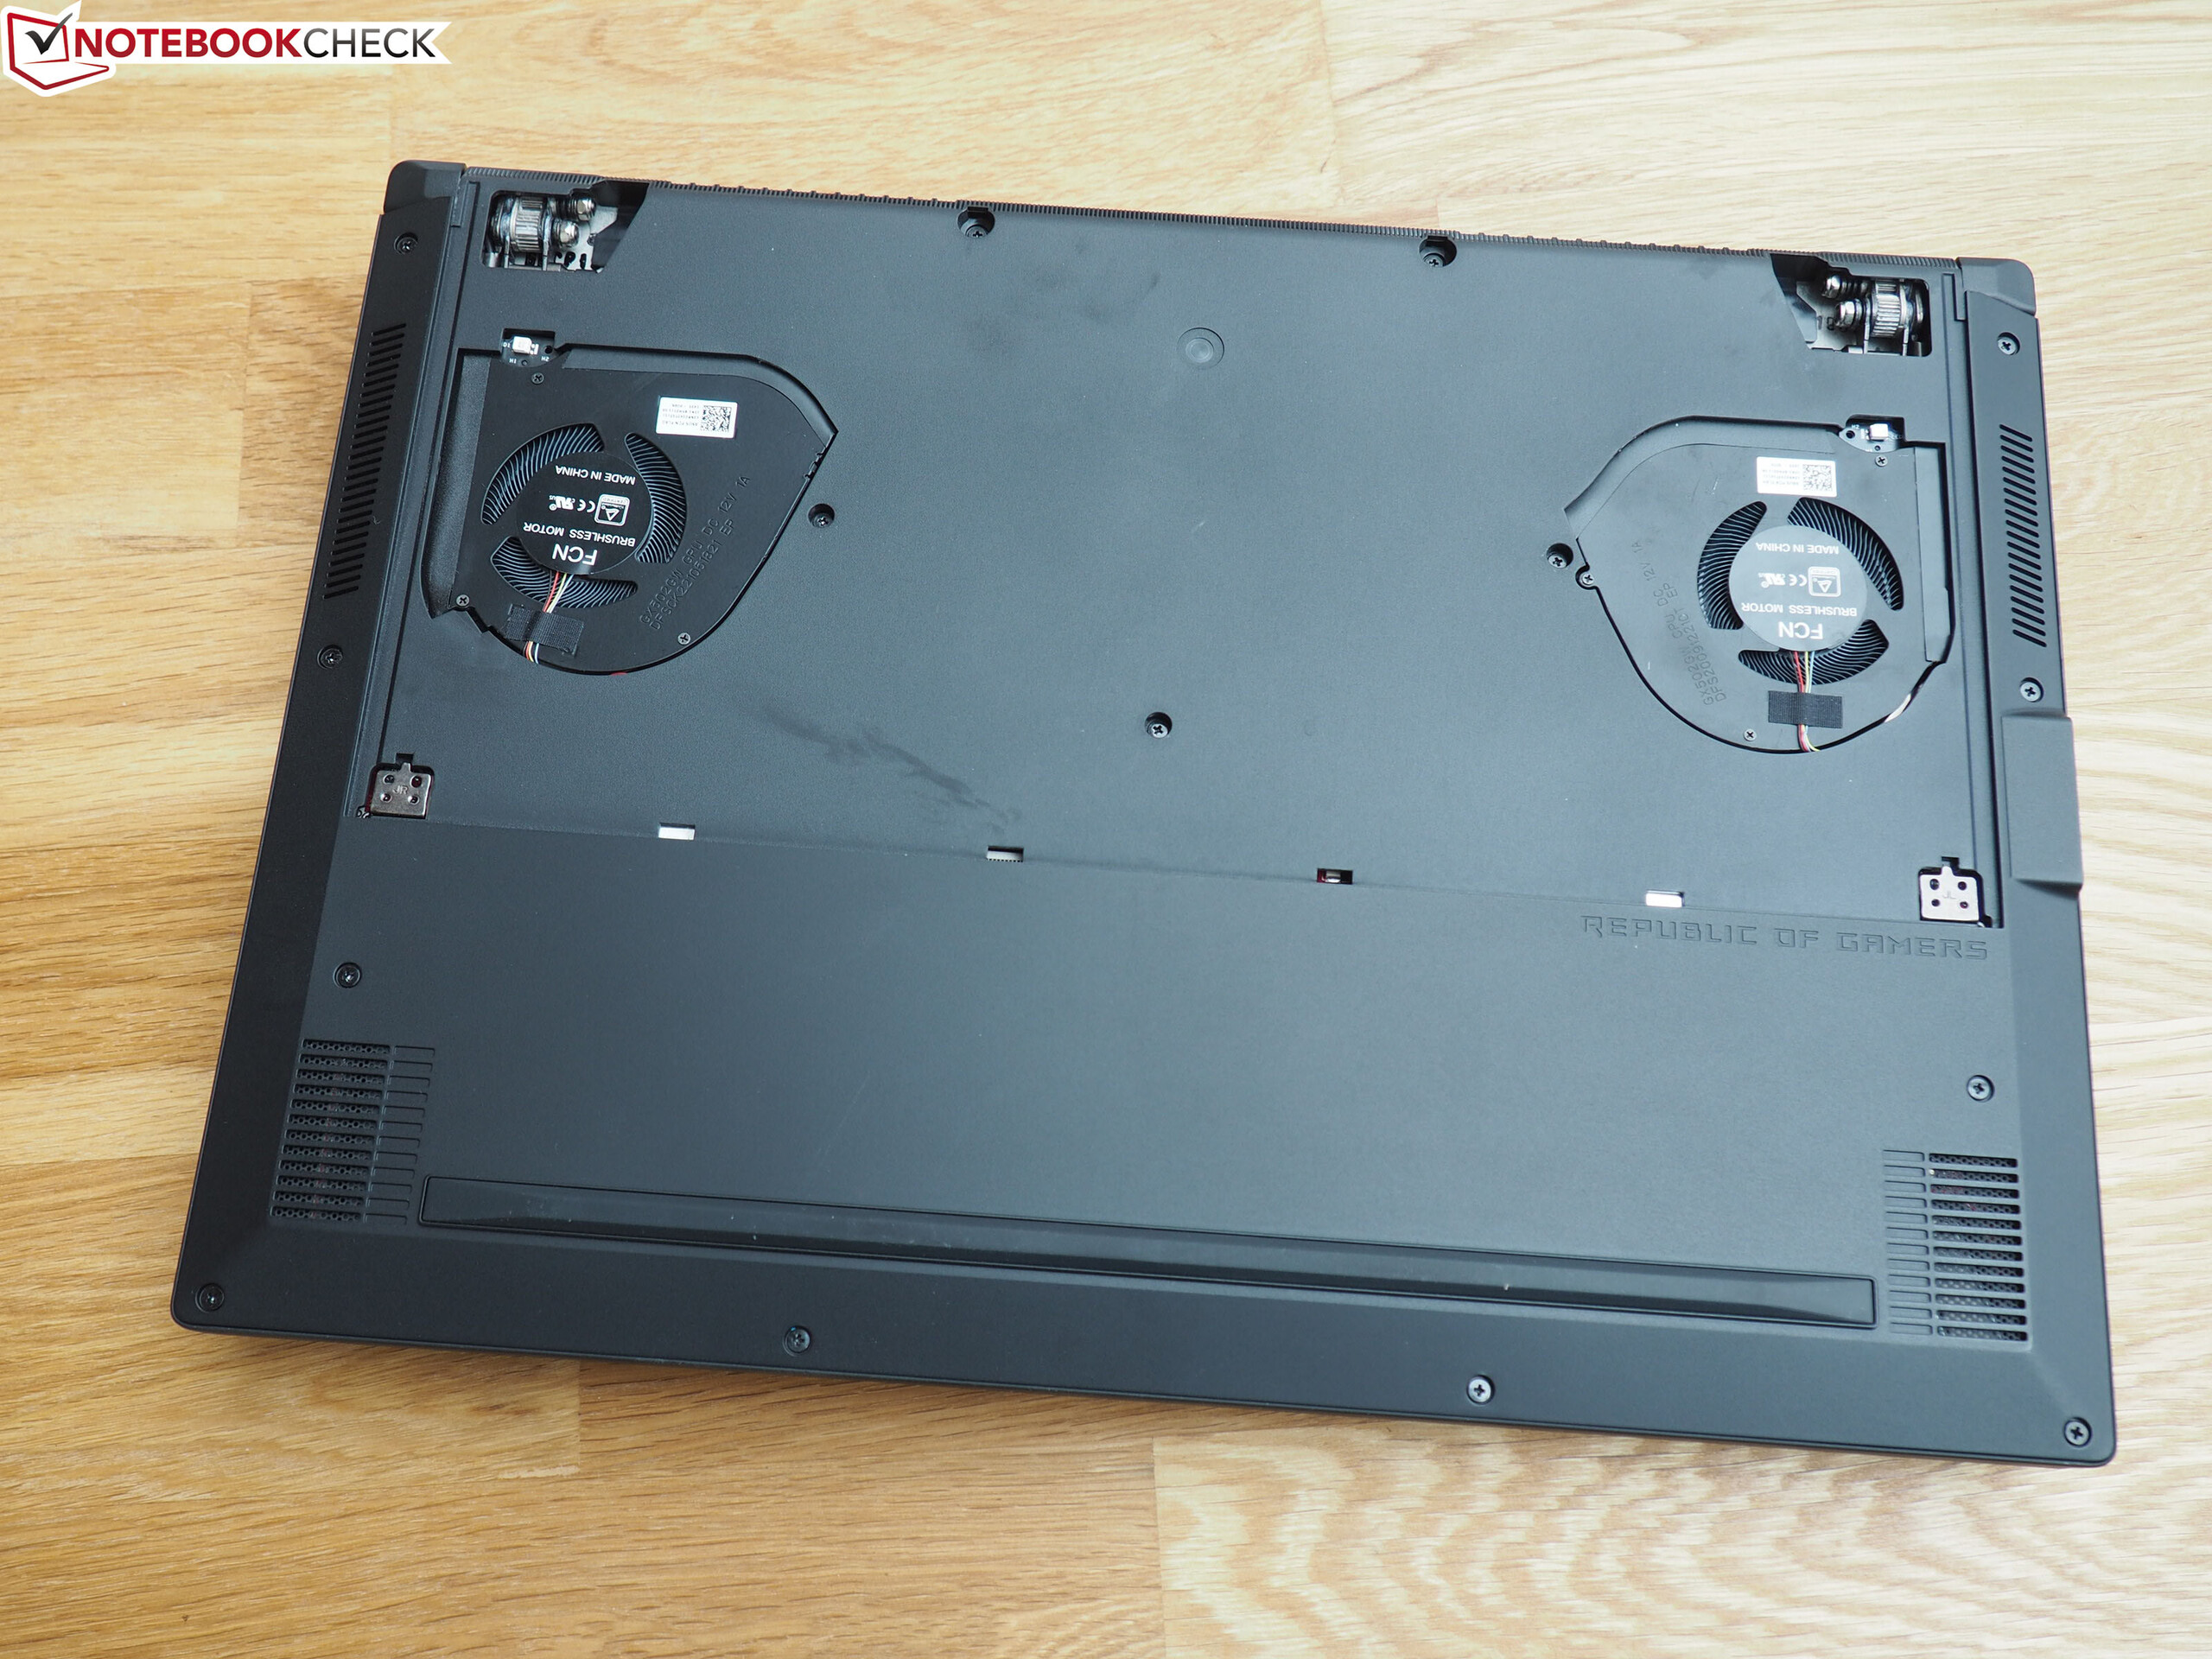
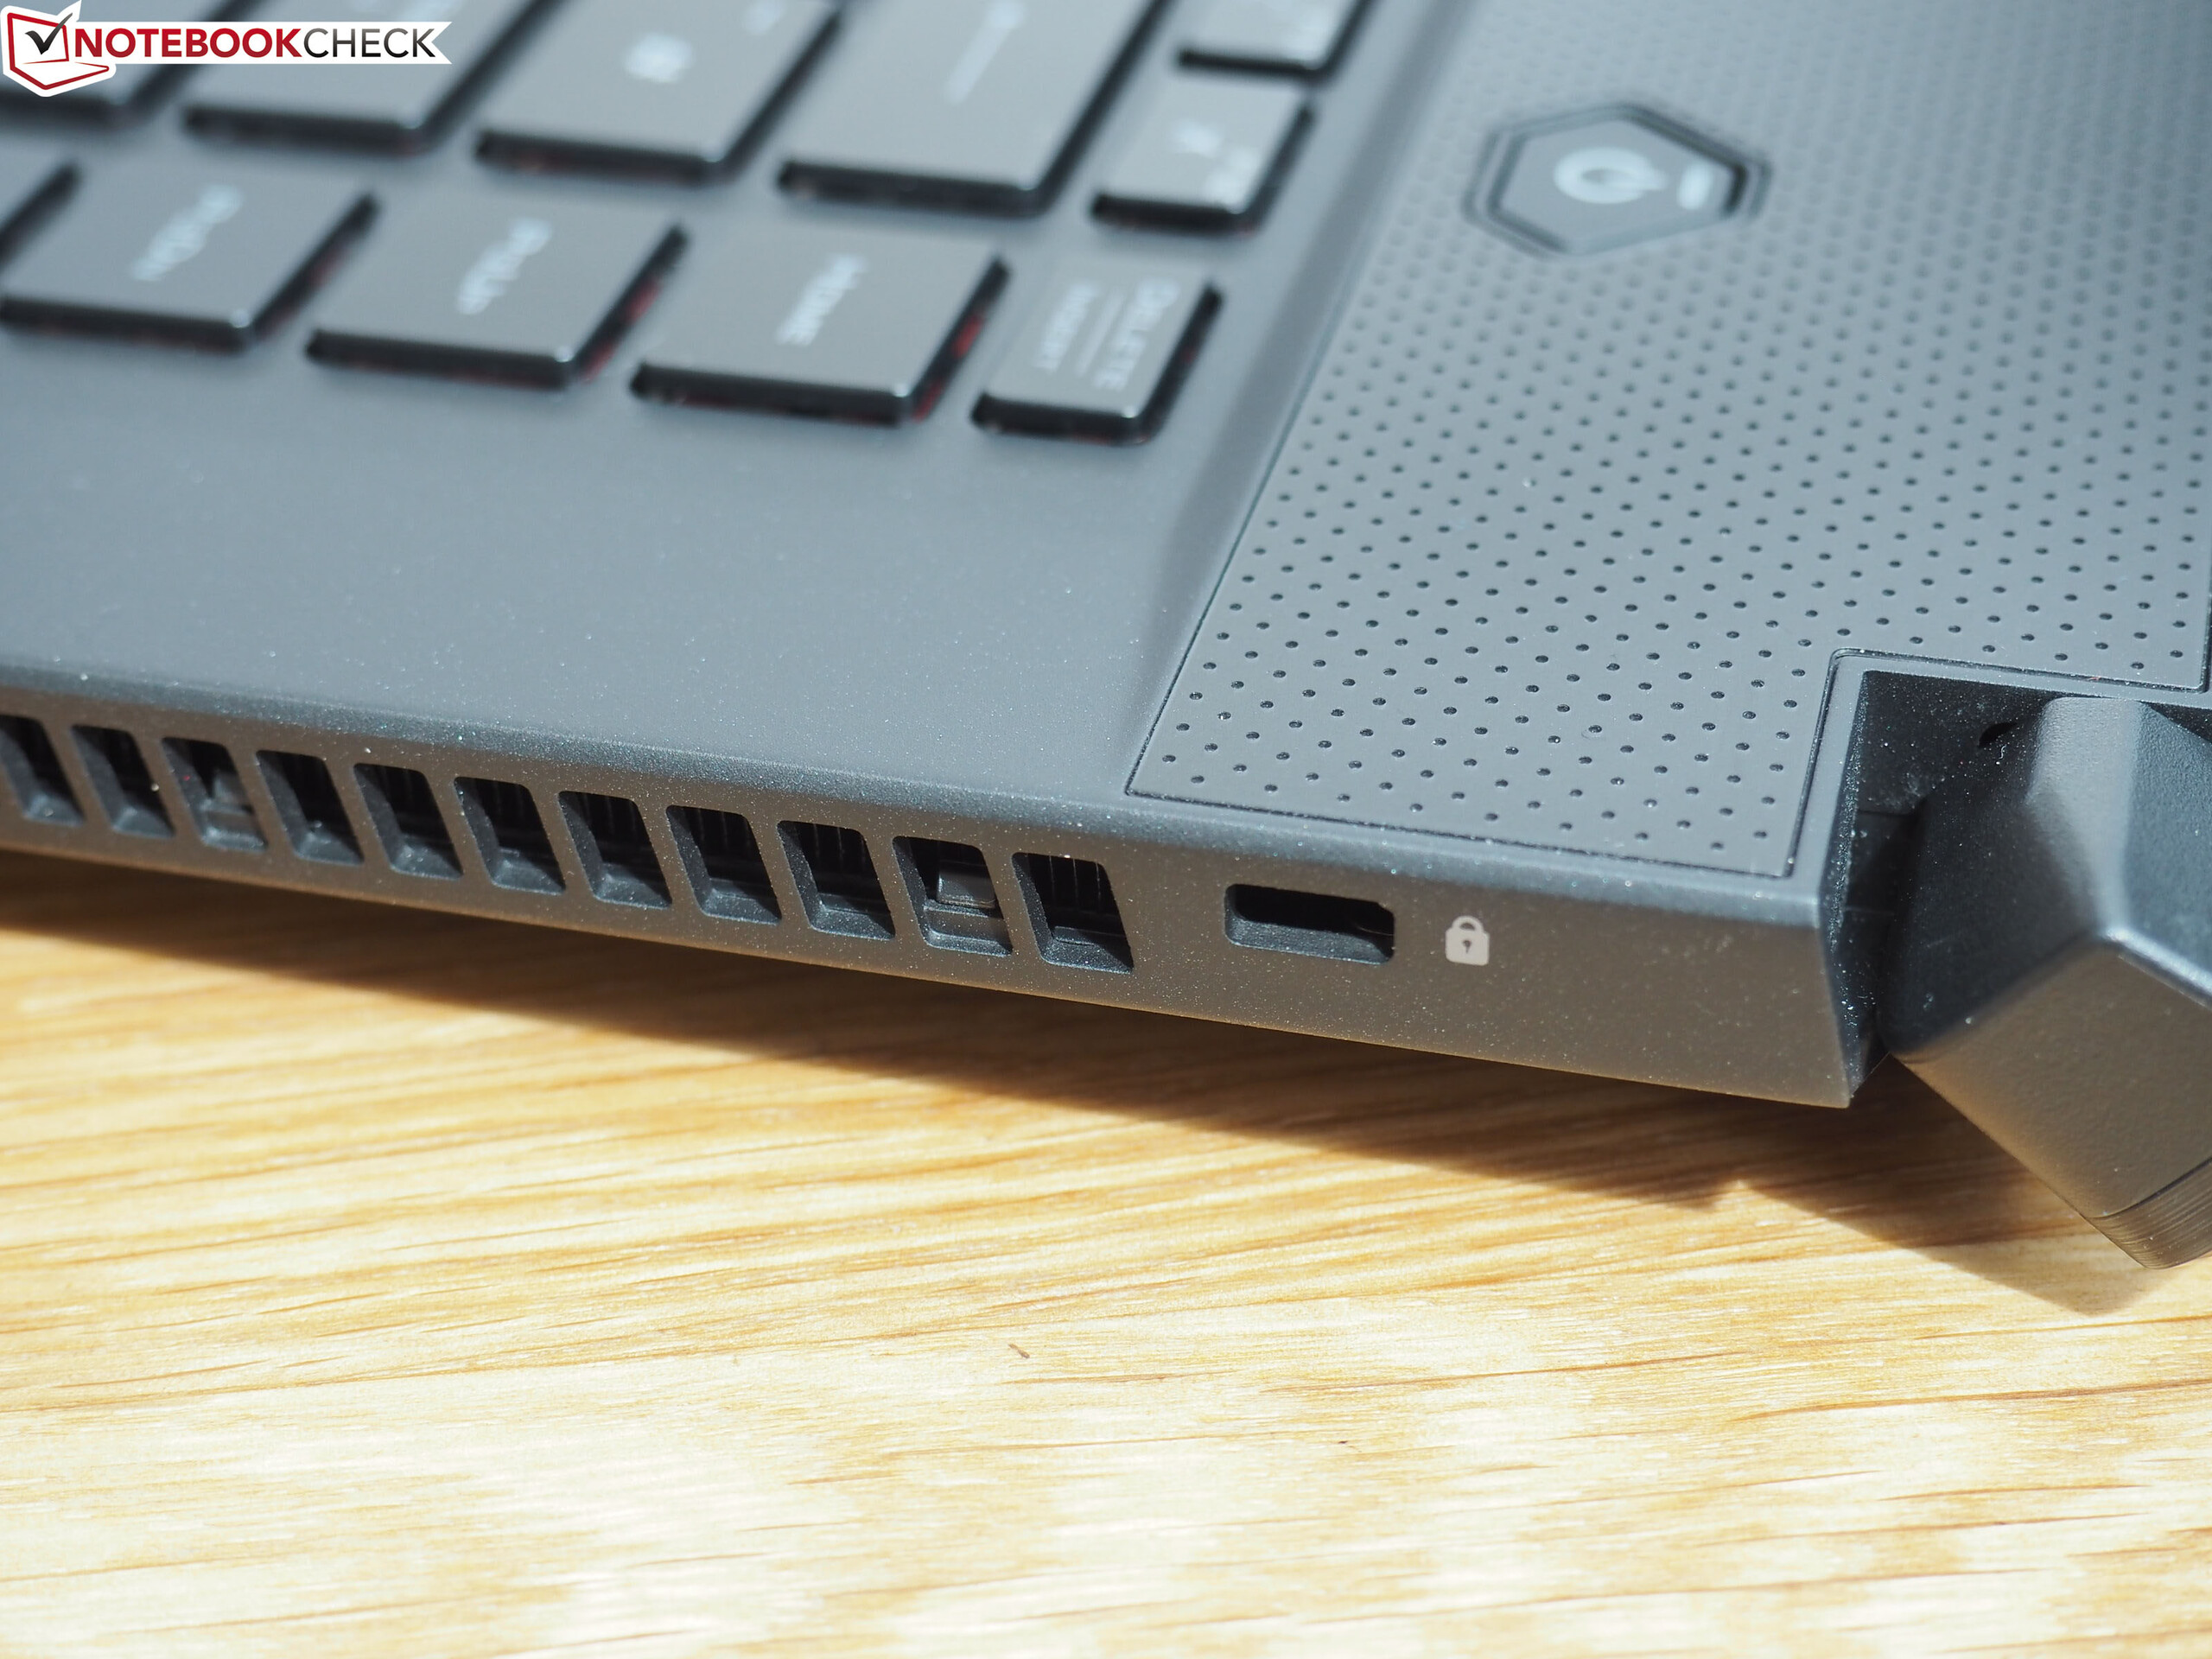
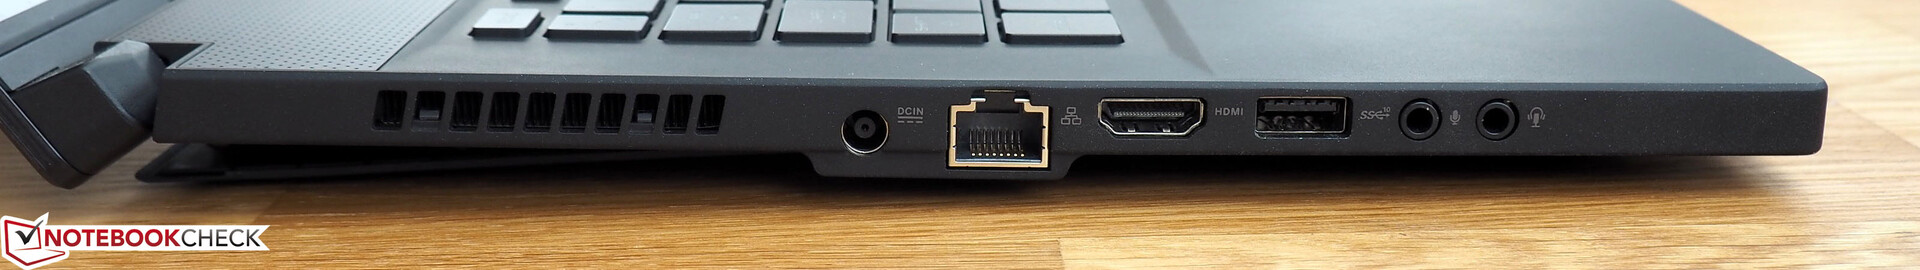
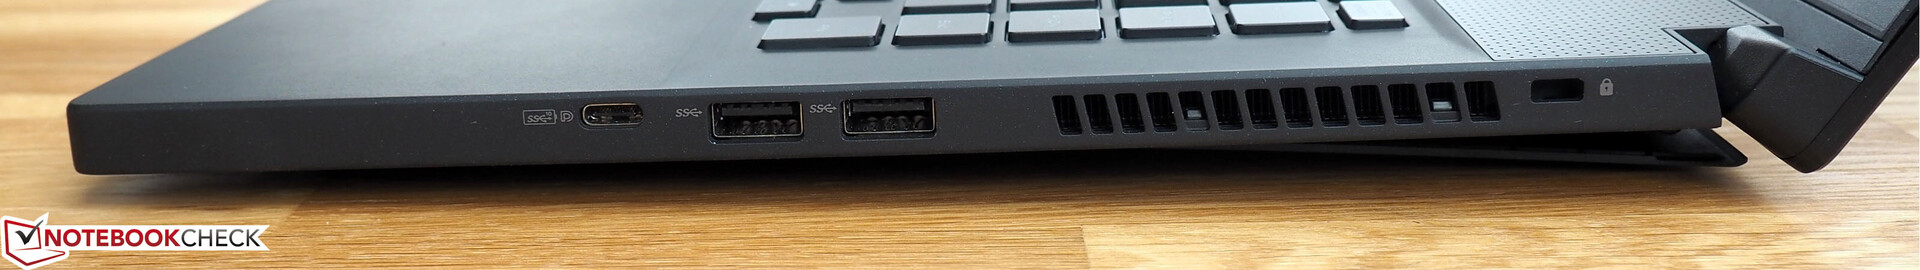
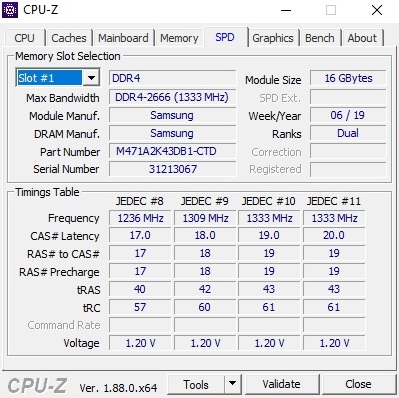
Vi kan dock inte förstå en del av besluten som ASUS tagit. Att löda fast hälften av allt RAM-minne på moderkortet verkar kortsiktigt, precis som valet att inte inkludera kortläsare, kamera eller en Thunderbolt 3-port. I slutändan är GX502GW för högljudd och för varm för att vara en lyxig tunn-och-lätt spellaptop.
För att sammanfatta så finns det få anledningar att välja GX502-serien framför Aero 15-X9 eller Razer Blade 15. En anledning kan vara att den inte har en Max-Q GPU, men att ha ett fullständig RTX 20-kort i en laptop kommer med en del problem. GX502GW är fortfarande ett bra alternativ om du letar efter en spellaptop på 15.6 tum, men den når inte riktigt upp till ribban som Gigabyte och Razer har satt.
Asus Zephyrus S GX502GW
- 05/14/2020 v7 (old)
Florian Glaser
Price comparison