Test: MSI Alpha 15 A3DDK - En energislukande spellaptop från mittenskiktet (Sammanfattning)
Gradering | Datum | Modell | Vikt | Höjd | Storlek | Upplösning | Pris |
|---|---|---|---|---|---|---|---|
| 78.8 % v7 (old) | 02/2020 | MSI Alpha 15 A3DDK-034 R7 3750H, Radeon RX 5500M | 2.3 kg | 27.5 mm | 15.60" | 1920x1080 | |
| 82.1 % v7 (old) | 11/2019 | Acer Predator Helios 300 PH315-52-79TY i7-9750H, GeForce GTX 1660 Ti Mobile | 2.3 kg | 23.2 mm | 15.60" | 1920x1080 | |
| 79.7 % v7 (old) | 12/2019 | HP Pavilion Gaming 15-ec0017ng R7 3750H, GeForce GTX 1660 Ti Max-Q | 2.3 kg | 23.5 mm | 15.60" | 1920x1080 | |
| 79.6 % v7 (old) | 11/2019 | Dell G5 15 5590-PCNJJ i5-9300H, GeForce GTX 1650 Mobile | 2.7 kg | 23.7 mm | 15.60" | 1920x1080 | |
| 82.3 % v7 (old) | 08/2019 | Lenovo Legion Y540-15IRH-81SX00B2GE i7-9750H, GeForce GTX 1660 Ti Mobile | 2.2 kg | 26 mm | 15.60" | 1920x1080 |
| SD Card Reader | |
| average JPG Copy Test (av. of 3 runs) | |
| Genomsnitt av klass Gaming (20.9 - 210, n=54, senaste 2 åren) | |
| HP Pavilion Gaming 15-ec0017ng (Toshiba Exceria Pro SDXC 64 GB UHS-II) | |
| MSI Alpha 15 A3DDK-034 (Toshiba Exceria Pro SDXC 64 GB UHS-II) | |
| Dell G5 15 5590-PCNJJ (Toshiba Exceria Pro SDXC 64 GB UHS-II) | |
| maximum AS SSD Seq Read Test (1GB) | |
| Genomsnitt av klass Gaming (25.5 - 261, n=51, senaste 2 åren) | |
| HP Pavilion Gaming 15-ec0017ng (Toshiba Exceria Pro SDXC 64 GB UHS-II) | |
| MSI Alpha 15 A3DDK-034 (Toshiba Exceria Pro SDXC 64 GB UHS-II) | |
| Dell G5 15 5590-PCNJJ (Toshiba Exceria Pro SDXC 64 GB UHS-II) | |
| |||||||||||||||||||||||||
Distribution av ljusstyrkan: 86 %
Mitt på batteriet: 310 cd/m²
Kontrast: 1069:1 (Svärta: 0.29 cd/m²)
ΔE ColorChecker Calman: 4.78 | ∀{0.5-29.43 Ø4.72}
calibrated: 2.36
ΔE Greyscale Calman: 4.78 | ∀{0.09-98 Ø4.97}
91% sRGB (Argyll 1.6.3 3D)
59% AdobeRGB 1998 (Argyll 1.6.3 3D)
66.6% AdobeRGB 1998 (Argyll 3D)
91% sRGB (Argyll 3D)
66.4% Display P3 (Argyll 3D)
Gamma: 2.43
CCT: 7739 K
| MSI Alpha 15 A3DDK-034 AU Optronics B156HAN08.0 (AUO80ED), IPS, 1920x1080 | Acer Predator Helios 300 PH315-52-79TY AUO, B156HAN08.2, IPS, 1920x1080 | HP Pavilion Gaming 15-ec0017ng AU Optronics B156HAK02.0, IPS, 1920x1080 | Dell G5 15 5590-PCNJJ AU Optronics B156HAN (AUO23ED), IPS, 1920x1080 | Lenovo Legion Y540-15IRH-81SX00B2GE BOE 084D, IPS, 1920x1080 | |
|---|---|---|---|---|---|
| Display | -1% | -4% | 27% | -2% | |
| Display P3 Coverage (%) | 66.4 | 64.1 -3% | 62.8 -5% | 83.1 25% | 63.6 -4% |
| sRGB Coverage (%) | 91 | 93 2% | 89.2 -2% | 99.9 10% | 91.7 1% |
| AdobeRGB 1998 Coverage (%) | 66.6 | 65.7 -1% | 63.8 -4% | 96.8 45% | 65.2 -2% |
| Response Times | -51% | -325% | -387% | -21% | |
| Response Time Grey 50% / Grey 80% * (ms) | 7 ? | 15 ? -114% | 40 ? -471% | 48 ? -586% | 8.8 ? -26% |
| Response Time Black / White * (ms) | 10.4 ? | 9 ? 13% | 29 ? -179% | 30 ? -188% | 12 ? -15% |
| PWM Frequency (Hz) | |||||
| Screen | 7% | 1% | -21% | 5% | |
| Brightness middle (cd/m²) | 310 | 325 5% | 302 -3% | 234 -25% | 299 -4% |
| Brightness (cd/m²) | 310 | 310 0% | 291 -6% | 216 -30% | 290 -6% |
| Brightness Distribution (%) | 86 | 82 -5% | 84 -2% | 87 1% | 89 3% |
| Black Level * (cd/m²) | 0.29 | 0.255 12% | 0.25 14% | 0.22 24% | 0.29 -0% |
| Contrast (:1) | 1069 | 1275 19% | 1208 13% | 1064 0% | 1031 -4% |
| Colorchecker dE 2000 * | 4.78 | 4.28 10% | 4.84 -1% | 6.52 -36% | 3.7 23% |
| Colorchecker dE 2000 max. * | 8.1 | 8.42 -4% | 8.18 -1% | 10.58 -31% | 7 14% |
| Colorchecker dE 2000 calibrated * | 2.36 | 1.45 39% | 2.63 -11% | 3.56 -51% | 2 15% |
| Greyscale dE 2000 * | 4.78 | 5.01 -5% | 4.31 10% | 5.33 -12% | 4.1 14% |
| Gamma | 2.43 91% | 2.6 85% | 2.56 86% | 2.86 77% | 2.19 100% |
| CCT | 7739 84% | 7678 85% | 7318 89% | 5983 109% | 7166 91% |
| Color Space (Percent of AdobeRGB 1998) (%) | 59 | 60 2% | 58 -2% | 36 -39% | 59.3 1% |
| Color Space (Percent of sRGB) (%) | 91 | 93 2% | 89 -2% | 57 -37% | 91.5 1% |
| Totalt genomsnitt (program/inställningar) | -15% /
-2% | -109% /
-41% | -127% /
-58% | -6% /
1% |
* ... mindre är bättre
Visa svarstider
| ↔ Svarstid svart till vitt | ||
|---|---|---|
| 10.4 ms ... stiga ↗ och falla ↘ kombinerat | ↗ 5.2 ms stiga | 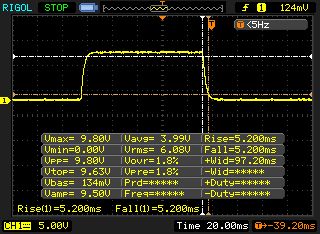 |
| ↘ 5.2 ms hösten | ||
| Skärmen visar bra svarsfrekvens i våra tester, men kan vara för långsam för konkurrenskraftiga spelare. I jämförelse sträcker sig alla testade enheter från 0.1 (minst) till 240 (maximalt) ms. » 28 % av alla enheter är bättre. Det betyder att den uppmätta svarstiden är bättre än genomsnittet av alla testade enheter (19.9 ms). | ||
| ↔ Svarstid 50 % grått till 80 % grått | ||
| 7 ms ... stiga ↗ och falla ↘ kombinerat | ↗ 3.4 ms stiga | 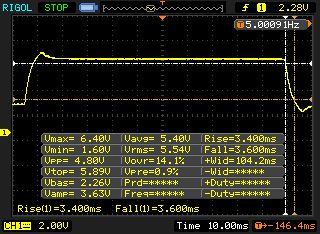 |
| ↘ 3.6 ms hösten | ||
| Skärmen visar väldigt snabba svarsfrekvenser i våra tester och borde vara mycket väl lämpad för fartfyllt spel. I jämförelse sträcker sig alla testade enheter från 0.165 (minst) till 636 (maximalt) ms. » 20 % av alla enheter är bättre. Det betyder att den uppmätta svarstiden är bättre än genomsnittet av alla testade enheter (31.1 ms). | ||
Skärmflimmer / PWM (Puls-Width Modulation)
| Skärmflimmer / PWM upptäcktes inte | 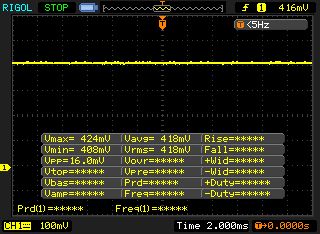 | ||
Som jämförelse: 52 % av alla testade enheter använder inte PWM för att dämpa skärmen. Om PWM upptäcktes mättes ett medelvärde av 7784 (minst: 5 - maximum: 343500) Hz. | |||
| Cinebench R15 | |
| CPU Single 64Bit | |
| Genomsnitt av klass Gaming (188.8 - 343, n=109, senaste 2 åren) | |
| Acer Predator Helios 300 PH315-52-79TY | |
| Lenovo Legion Y540-15IRH-81SX00B2GE | |
| Dell G5 15 5590-PCNJJ | |
| MSI Alpha 15 A3DDK-034 | |
| HP Pavilion Gaming 15-ec0017ng | |
| MSI Alpha 15 A3DDK-034 (Silent) | |
| CPU Multi 64Bit | |
| Genomsnitt av klass Gaming (1578 - 6271, n=109, senaste 2 åren) | |
| Acer Predator Helios 300 PH315-52-79TY | |
| Lenovo Legion Y540-15IRH-81SX00B2GE | |
| Dell G5 15 5590-PCNJJ | |
| HP Pavilion Gaming 15-ec0017ng | |
| MSI Alpha 15 A3DDK-034 | |
| MSI Alpha 15 A3DDK-034 (Silent) | |
| Cinebench R10 | |
| Rendering Single 32Bit | |
| Genomsnitt av klass Gaming (7457 - 11779, n=8, senaste 2 åren) | |
| HP Pavilion Gaming 15-ec0017ng | |
| MSI Alpha 15 A3DDK-034 | |
| Rendering Multiple CPUs 32Bit | |
| Genomsnitt av klass Gaming (42932 - 81339, n=8, senaste 2 åren) | |
| HP Pavilion Gaming 15-ec0017ng | |
| MSI Alpha 15 A3DDK-034 | |
| Geekbench 3 | |
| 32 Bit Multi-Core Score | |
| HP Pavilion Gaming 15-ec0017ng | |
| MSI Alpha 15 A3DDK-034 | |
| 32 Bit Single-Core Score | |
| HP Pavilion Gaming 15-ec0017ng | |
| MSI Alpha 15 A3DDK-034 | |
| Geekbench 5.0 | |
| 5.0 Multi-Core | |
| Genomsnitt av klass Gaming (11903 - 23588, n=4, senaste 2 åren) | |
| HP Pavilion Gaming 15-ec0017ng | |
| MSI Alpha 15 A3DDK-034 | |
| MSI Alpha 15 A3DDK-034 (Silent) | |
| 5.0 Single-Core | |
| Genomsnitt av klass Gaming (1927 - 2270, n=4, senaste 2 åren) | |
| HP Pavilion Gaming 15-ec0017ng | |
| MSI Alpha 15 A3DDK-034 | |
| MSI Alpha 15 A3DDK-034 (Silent) | |
| Geekbench 5.5 | |
| Multi-Core | |
| Genomsnitt av klass Gaming (6460 - 27010, n=108, senaste 2 åren) | |
| MSI Alpha 15 A3DDK-034 | |
| Single-Core | |
| Genomsnitt av klass Gaming (986 - 2474, n=108, senaste 2 åren) | |
| MSI Alpha 15 A3DDK-034 | |
| Mozilla Kraken 1.1 - Total | |
| Lenovo Legion Y540-15IRH-81SX00B2GE | |
| MSI Alpha 15 A3DDK-034 (Edge 44) | |
| HP Pavilion Gaming 15-ec0017ng (Edge 44) | |
| Acer Predator Helios 300 PH315-52-79TY (Edge: 44.18362.387.0) | |
| Genomsnitt av klass Gaming (391 - 590, n=104, senaste 2 åren) | |
| Octane V2 - Total Score | |
| Genomsnitt av klass Gaming (89353 - 139447, n=29, senaste 2 åren) | |
| Lenovo Legion Y540-15IRH-81SX00B2GE | |
| Acer Predator Helios 300 PH315-52-79TY (Edge: 44.18362.387.0) | |
| HP Pavilion Gaming 15-ec0017ng (Edge 44) | |
| MSI Alpha 15 A3DDK-034 (Edge 44) | |
| JetStream 1.1 - 1.1 Total | |
| Genomsnitt av klass Gaming (533 - 647, n=4, senaste 2 åren) | |
| Acer Predator Helios 300 PH315-52-79TY (Edge: 44.18362.387.0) | |
| HP Pavilion Gaming 15-ec0017ng (Edge 44) | |
| Lenovo Legion Y540-15IRH-81SX00B2GE | |
| MSI Alpha 15 A3DDK-034 (Edge 44) | |
| MSI Alpha 15 A3DDK-034 (Edge 44; Silent) | |
* ... mindre är bättre
| PCMark 8 Home Score Accelerated v2 | 4121 poäng | |
| PCMark 8 Creative Score Accelerated v2 | 4614 poäng | |
| PCMark 8 Work Score Accelerated v2 | 5045 poäng | |
| PCMark 10 Score | 4605 poäng | |
Hjälp | ||

| MSI Alpha 15 A3DDK-034 Kingston RBUSNS8154P3512GJ | Acer Predator Helios 300 PH315-52-79TY WDC PC SN720 SDAPNTW-512G | HP Pavilion Gaming 15-ec0017ng WDC PC SN720 SDAPNTW-256G | Dell G5 15 5590-PCNJJ KBG30ZMS128G | Lenovo Legion Y540-15IRH-81SX00B2GE WDC PC SN720 SDAPNTW-512G | |
|---|---|---|---|---|---|
| CrystalDiskMark 5.2 / 6 | 67% | 39% | -48% | 60% | |
| Write 4K (MB/s) | 105.4 | 108.7 3% | 148 40% | 65.3 -38% | 158.8 51% |
| Read 4K (MB/s) | 33.24 | 44.91 35% | 43.73 32% | 29.71 -11% | 29.11 -12% |
| Write Seq (MB/s) | 1029 | 2424 136% | 1617 57% | 128.8 -87% | 1584 54% |
| Read Seq (MB/s) | 1098 | 1617 47% | 1753 60% | 859 -22% | 1694 54% |
| Write 4K Q32T1 (MB/s) | 322.1 | 356.9 11% | 246.3 -24% | 95.8 -70% | 536 66% |
| Read 4K Q32T1 (MB/s) | 352 | 557 58% | 368 5% | 197.6 -44% | 363.9 3% |
| Write Seq Q32T1 (MB/s) | 1036 | 2542 145% | 1618 56% | 132.5 -87% | 2536 145% |
| Read Seq Q32T1 (MB/s) | 1606 | 3218 100% | 3027 88% | 1208 -25% | 3458 115% |
| 3DMark 06 Standard Score | 24966 poäng | |
| 3DMark 11 Performance | 12765 poäng | |
| 3DMark Ice Storm Standard Score | 55844 poäng | |
| 3DMark Cloud Gate Standard Score | 21898 poäng | |
| 3DMark Fire Strike Score | 10319 poäng | |
| 3DMark Time Spy Score | 4105 poäng | |
Hjälp | ||
| 3DMark 11 - 1280x720 Performance GPU | |
| Genomsnitt av klass Gaming (21841 - 80022, n=106, senaste 2 åren) | |
| Lenovo Legion Y540-15IRH-81SX00B2GE | |
| Acer Predator Helios 300 PH315-52-79TY | |
| HP Pavilion Gaming 15-ec0017ng | |
| MSI Alpha 15 A3DDK-034 | |
| MSI Alpha 15 A3DDK-034 (Silent) | |
| Dell G5 15 5590-PCNJJ | |
| The Witcher 3 - 1920x1080 Ultra Graphics & Postprocessing (HBAO+) | |
| Genomsnitt av klass Gaming (95 - 240, n=8, senaste 2 åren) | |
| Acer Predator Helios 300 PH315-52-79TY | |
| Lenovo Legion Y540-15IRH-81SX00B2GE | |
| HP Pavilion Gaming 15-ec0017ng | |
| MSI Alpha 15 A3DDK-034 | |
| MSI Alpha 15 A3DDK-034 (Silent) | |
| Dell G5 15 5590-PCNJJ | |
| BioShock Infinite - 1920x1080 Ultra Preset, DX11 (DDOF) | |
| Lenovo Legion Y540-15IRH-81SX00B2GE | |
| Acer Predator Helios 300 PH315-52-79TY | |
| HP Pavilion Gaming 15-ec0017ng | |
| MSI Alpha 15 A3DDK-034 | |
| MSI Alpha 15 A3DDK-034 (Silent) | |
| Dell G5 15 5590-PCNJJ | |
| For Honor - 1920x1080 Extreme Preset AA:T AF:16x | |
| MSI Alpha 15 A3DDK-034 | |
| F1 2019 - 1920x1080 Ultra High Preset AA:T AF:16x | |
| HP Pavilion Gaming 15-ec0017ng | |
| MSI Alpha 15 A3DDK-034 | |
| Dell G5 15 5590-PCNJJ | |
| låg | med. | hög | ultra | |
|---|---|---|---|---|
| BioShock Infinite (2013) | 197.3 | 173.5 | 155 | 94.2 |
| The Witcher 3 (2015) | 173.6 | 129 | 73.3 | 44.7 |
| For Honor (2017) | 184.3 | 102 | 97 | 78.5 |
| Ghost Recon Wildlands (2017) | 73.1 | 52.9 | 50.3 | 27.1 |
| Final Fantasy XV Benchmark (2018) | 90.9 | 57.7 | 30.8 | |
| World of Tanks enCore (2018) | 241.9 | 176.3 | 89.7 | |
| F1 2019 (2019) | 114 | 97 | 82 | 68 |
| Control (2019) | 128.9 | 50.1 | 36.9 | |
| Borderlands 3 (2019) | 75.2 | 62.3 | 45 | 34.2 |
| Star Wars Jedi Fallen Order (2019) | 57.3 | 52.8 | 50.1 |
Ljudnivå
| Låg belastning |
| 36 / 37 / 46 dB(A) |
| Hög belastning |
| 50 / 57 dB(A) |
 | ||
30 dB tyst 40 dB(A) hörbar 50 dB(A) högt ljud |
||
min: | ||
| MSI Alpha 15 A3DDK-034 R7 3750H, Radeon RX 5500M | Acer Predator Helios 300 PH315-52-79TY i7-9750H, GeForce GTX 1660 Ti Mobile | HP Pavilion Gaming 15-ec0017ng R7 3750H, GeForce GTX 1660 Ti Max-Q | Dell G5 15 5590-PCNJJ i5-9300H, GeForce GTX 1650 Mobile | Lenovo Legion Y540-15IRH-81SX00B2GE i7-9750H, GeForce GTX 1660 Ti Mobile | |
|---|---|---|---|---|---|
| Noise | 15% | 15% | 9% | 20% | |
| av / miljö * (dB) | 29 | 30.2 -4% | 30.2 -4% | 30 -3% | 29.3 -1% |
| Idle Minimum * (dB) | 36 | 31 14% | 31.5 12% | 31 14% | 29.3 19% |
| Idle Average * (dB) | 37 | 31 16% | 31.5 15% | 32 14% | 29.3 21% |
| Idle Maximum * (dB) | 46 | 31 33% | 31.5 32% | 35 24% | 29.3 36% |
| Load Average * (dB) | 50 | 41.5 17% | 41.4 17% | 49 2% | 35.7 29% |
| Witcher 3 ultra * (dB) | 51 | 46.7 8% | 43.7 14% | 47 8% | 44.2 13% |
| Load Maximum * (dB) | 57 | 46.9 18% | 45.5 20% | 53 7% | 45.6 20% |
* ... mindre är bättre
(±) Den maximala temperaturen på ovansidan är 44 °C / 111 F, jämfört med genomsnittet av 40.4 °C / 105 F , allt från 21.2 till 68.8 °C för klassen Gaming.
(-) Botten värms upp till maximalt 49 °C / 120 F, jämfört med genomsnittet av 43.2 °C / 110 F
(+) Vid tomgångsbruk är medeltemperaturen för ovansidan 25.6 °C / 78 F, jämfört med enhetsgenomsnittet på 33.9 °C / ### class_avg_f### F.
(±) När du spelar The Witcher 3 är medeltemperaturen för ovansidan 37.3 °C / 99 F, jämfört med enhetsgenomsnittet på 33.9 °C / ## #class_avg_f### F.
(±) Handledsstöden och pekplattan kan bli väldigt varma vid beröring med maximalt 37 °C / 98.6 F.
(-) Medeltemperaturen för handledsstödsområdet på liknande enheter var 28.8 °C / 83.8 F (-8.2 °C / -14.8 F).
| MSI Alpha 15 A3DDK-034 R7 3750H, Radeon RX 5500M | Acer Predator Helios 300 PH315-52-79TY i7-9750H, GeForce GTX 1660 Ti Mobile | HP Pavilion Gaming 15-ec0017ng R7 3750H, GeForce GTX 1660 Ti Max-Q | Dell G5 15 5590-PCNJJ i5-9300H, GeForce GTX 1650 Mobile | Lenovo Legion Y540-15IRH-81SX00B2GE i7-9750H, GeForce GTX 1660 Ti Mobile | |
|---|---|---|---|---|---|
| Heat | 1% | 6% | -3% | -20% | |
| Maximum Upper Side * (°C) | 44 | 52 -18% | 44.8 -2% | 49 -11% | 42.7 3% |
| Maximum Bottom * (°C) | 49 | 46.3 6% | 40.8 17% | 55 -12% | 52.7 -8% |
| Idle Upper Side * (°C) | 26 | 24.8 5% | 25.4 2% | 25 4% | 33.1 -27% |
| Idle Bottom * (°C) | 28 | 25.4 9% | 26.6 5% | 26 7% | 41 -46% |
* ... mindre är bättre
MSI Alpha 15 A3DDK-034 ljudanalys
(+) | högtalare kan spela relativt högt (91 dB)
Bas 100 - 315 Hz
(-) | nästan ingen bas - i genomsnitt 31.4% lägre än medianen
(+) | basen är linjär (5.8% delta till föregående frekvens)
Mellan 400 - 2000 Hz
(±) | reducerade mids - i genomsnitt 7.4% lägre än median
(±) | linjäriteten för mids är genomsnittlig (9.9% delta till föregående frekvens)
Högsta 2 - 16 kHz
(+) | balanserade toppar - endast 2.1% från medianen
(+) | toppar är linjära (3.7% delta till föregående frekvens)
Totalt 100 - 16 000 Hz
(±) | linjäriteten för det totala ljudet är genomsnittlig (19.5% skillnad mot median)
Jämfört med samma klass
» 67% av alla testade enheter i den här klassen var bättre, 7% liknande, 26% sämre
» Den bästa hade ett delta på 6%, genomsnittet var 18%, sämst var 132%
Jämfört med alla testade enheter
» 48% av alla testade enheter var bättre, 7% liknande, 44% sämre
» Den bästa hade ett delta på 4%, genomsnittet var 24%, sämst var 134%
HP Pavilion Gaming 15-ec0017ng ljudanalys
(-) | inte särskilt höga högtalare (68 dB)
Bas 100 - 315 Hz
(-) | nästan ingen bas - i genomsnitt 22.5% lägre än medianen
(±) | linjäriteten för basen är genomsnittlig (10.5% delta till föregående frekvens)
Mellan 400 - 2000 Hz
(+) | balanserad mellan - endast 1.7% från medianen
(±) | linjäriteten för mids är genomsnittlig (8.4% delta till föregående frekvens)
Högsta 2 - 16 kHz
(+) | balanserade toppar - endast 4.4% från medianen
(±) | linjäriteten för toppar är genomsnittlig (8.1% delta till föregående frekvens)
Totalt 100 - 16 000 Hz
(±) | linjäriteten för det totala ljudet är genomsnittlig (23.8% skillnad mot median)
Jämfört med samma klass
» 86% av alla testade enheter i den här klassen var bättre, 5% liknande, 10% sämre
» Den bästa hade ett delta på 6%, genomsnittet var 18%, sämst var 132%
Jämfört med alla testade enheter
» 71% av alla testade enheter var bättre, 6% liknande, 22% sämre
» Den bästa hade ett delta på 4%, genomsnittet var 24%, sämst var 134%
| Av/Standby | |
| Låg belastning | |
| Hög belastning |
|
Förklaring:
min: | |
| MSI Alpha 15 A3DDK-034 R7 3750H, Radeon RX 5500M | Acer Predator Helios 300 PH315-52-79TY i7-9750H, GeForce GTX 1660 Ti Mobile | HP Pavilion Gaming 15-ec0017ng R7 3750H, GeForce GTX 1660 Ti Max-Q | Dell G5 15 5590-PCNJJ i5-9300H, GeForce GTX 1650 Mobile | Lenovo Legion Y540-15IRH-81SX00B2GE i7-9750H, GeForce GTX 1660 Ti Mobile | |
|---|---|---|---|---|---|
| Power Consumption | -12% | 38% | 34% | -2% | |
| Idle Minimum * (Watt) | 14 | 17.2 -23% | 3.4 76% | 4 71% | 14.5 -4% |
| Idle Average * (Watt) | 18 | 22.6 -26% | 7.6 58% | 7 61% | 18.5 -3% |
| Idle Maximum * (Watt) | 32 | 25.5 20% | 10.2 68% | 12 62% | 20 37% |
| Load Average * (Watt) | 64 | 88 -38% | 73 -14% | 95 -48% | 81.6 -27% |
| Witcher 3 ultra * (Watt) | 123 | 107 13% | 86 30% | 132 -7% | |
| Load Maximum * (Watt) | 193 | 177 8% | 140.5 27% | 135 30% | 208.1 -8% |
* ... mindre är bättre
| MSI Alpha 15 A3DDK-034 R7 3750H, Radeon RX 5500M, 51 Wh | Acer Predator Helios 300 PH315-52-79TY i7-9750H, GeForce GTX 1660 Ti Mobile, 58.75 Wh | HP Pavilion Gaming 15-ec0017ng R7 3750H, GeForce GTX 1660 Ti Max-Q, 52.5 Wh | Dell G5 15 5590-PCNJJ i5-9300H, GeForce GTX 1650 Mobile, 60 Wh | Lenovo Legion Y540-15IRH-81SX00B2GE i7-9750H, GeForce GTX 1660 Ti Mobile, 57 Wh | |
|---|---|---|---|---|---|
| Batteridrifttid | 2% | 103% | 140% | -3% | |
| Reader / Idle (h) | 5.8 | 5 -14% | 13.7 136% | 14.5 150% | 4 -31% |
| H.264 (h) | 3.9 | 3.4 -13% | 8.5 118% | ||
| WiFi v1.3 (h) | 4.1 | 3.5 -15% | 8 95% | 8 95% | 2.4 -41% |
| Load (h) | 0.8 | 1.2 50% | 1.3 63% | 2.2 175% | 1.3 63% |
För
Emot
Omdöme - En kompetent och kompakt speldator från mittenskiktet som lider av högljudda fläktar och kort batteritid
Läs den fullständiga versionen av den här recensionen på engelska här.
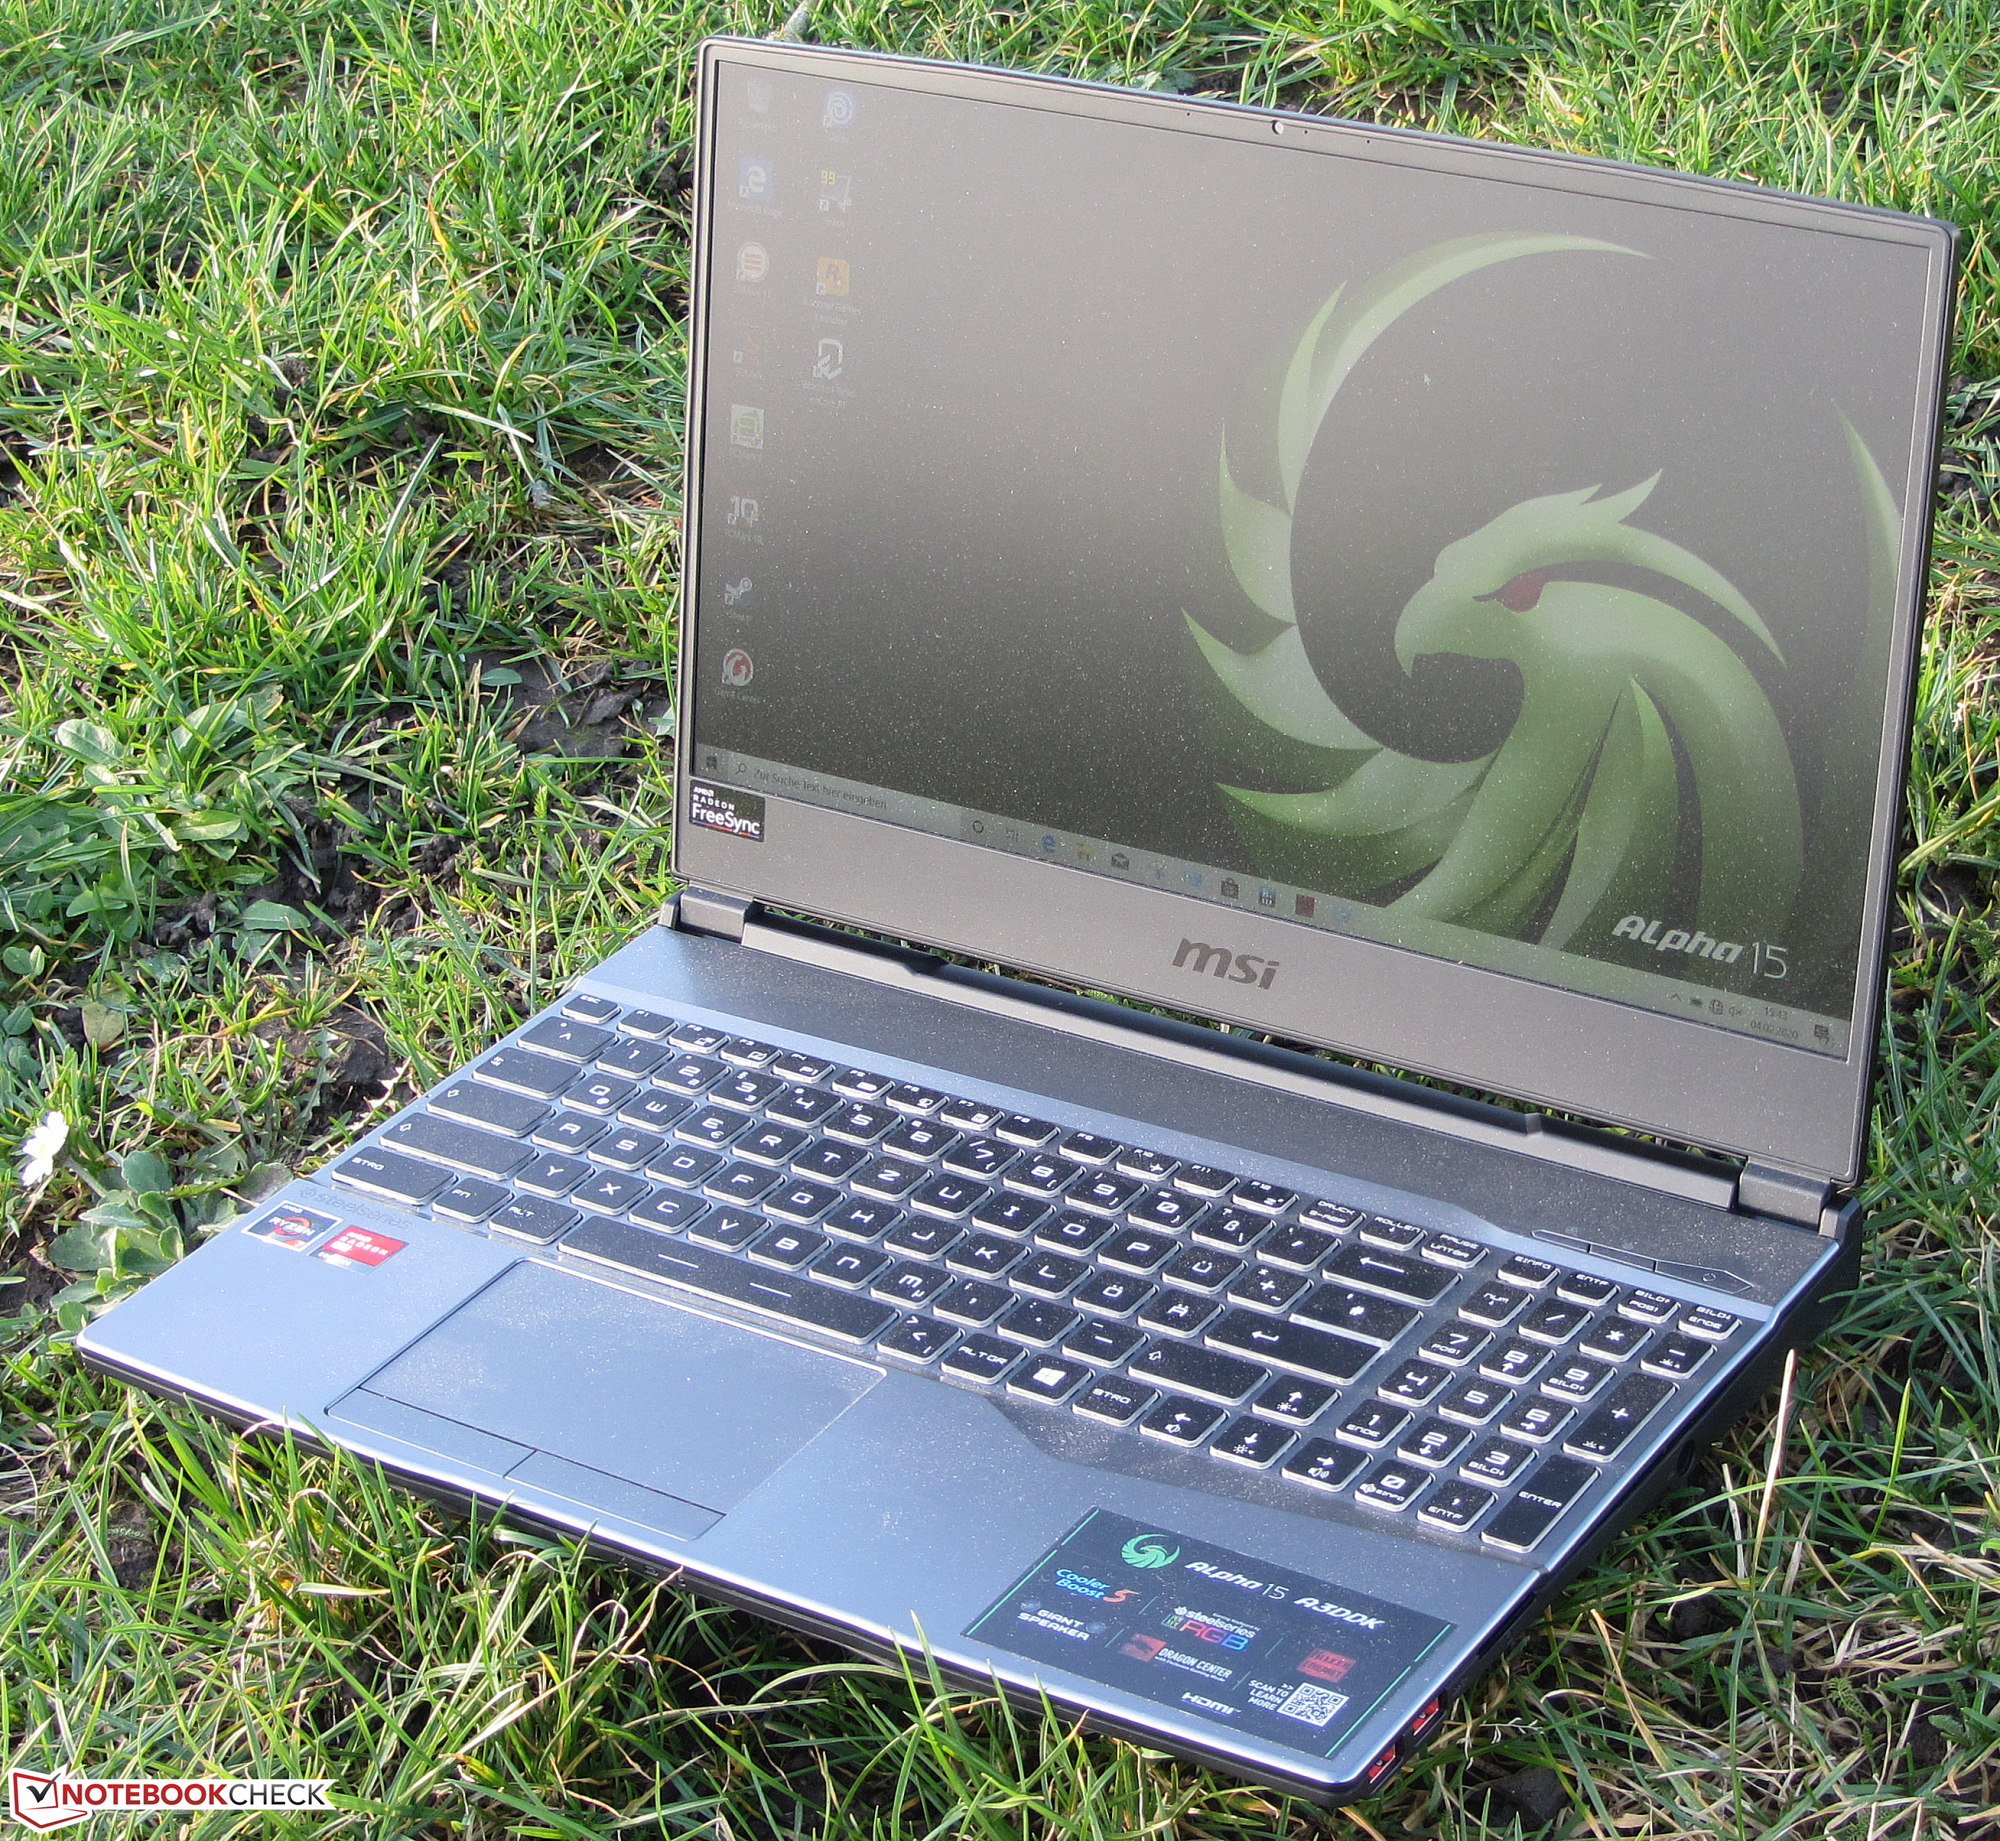
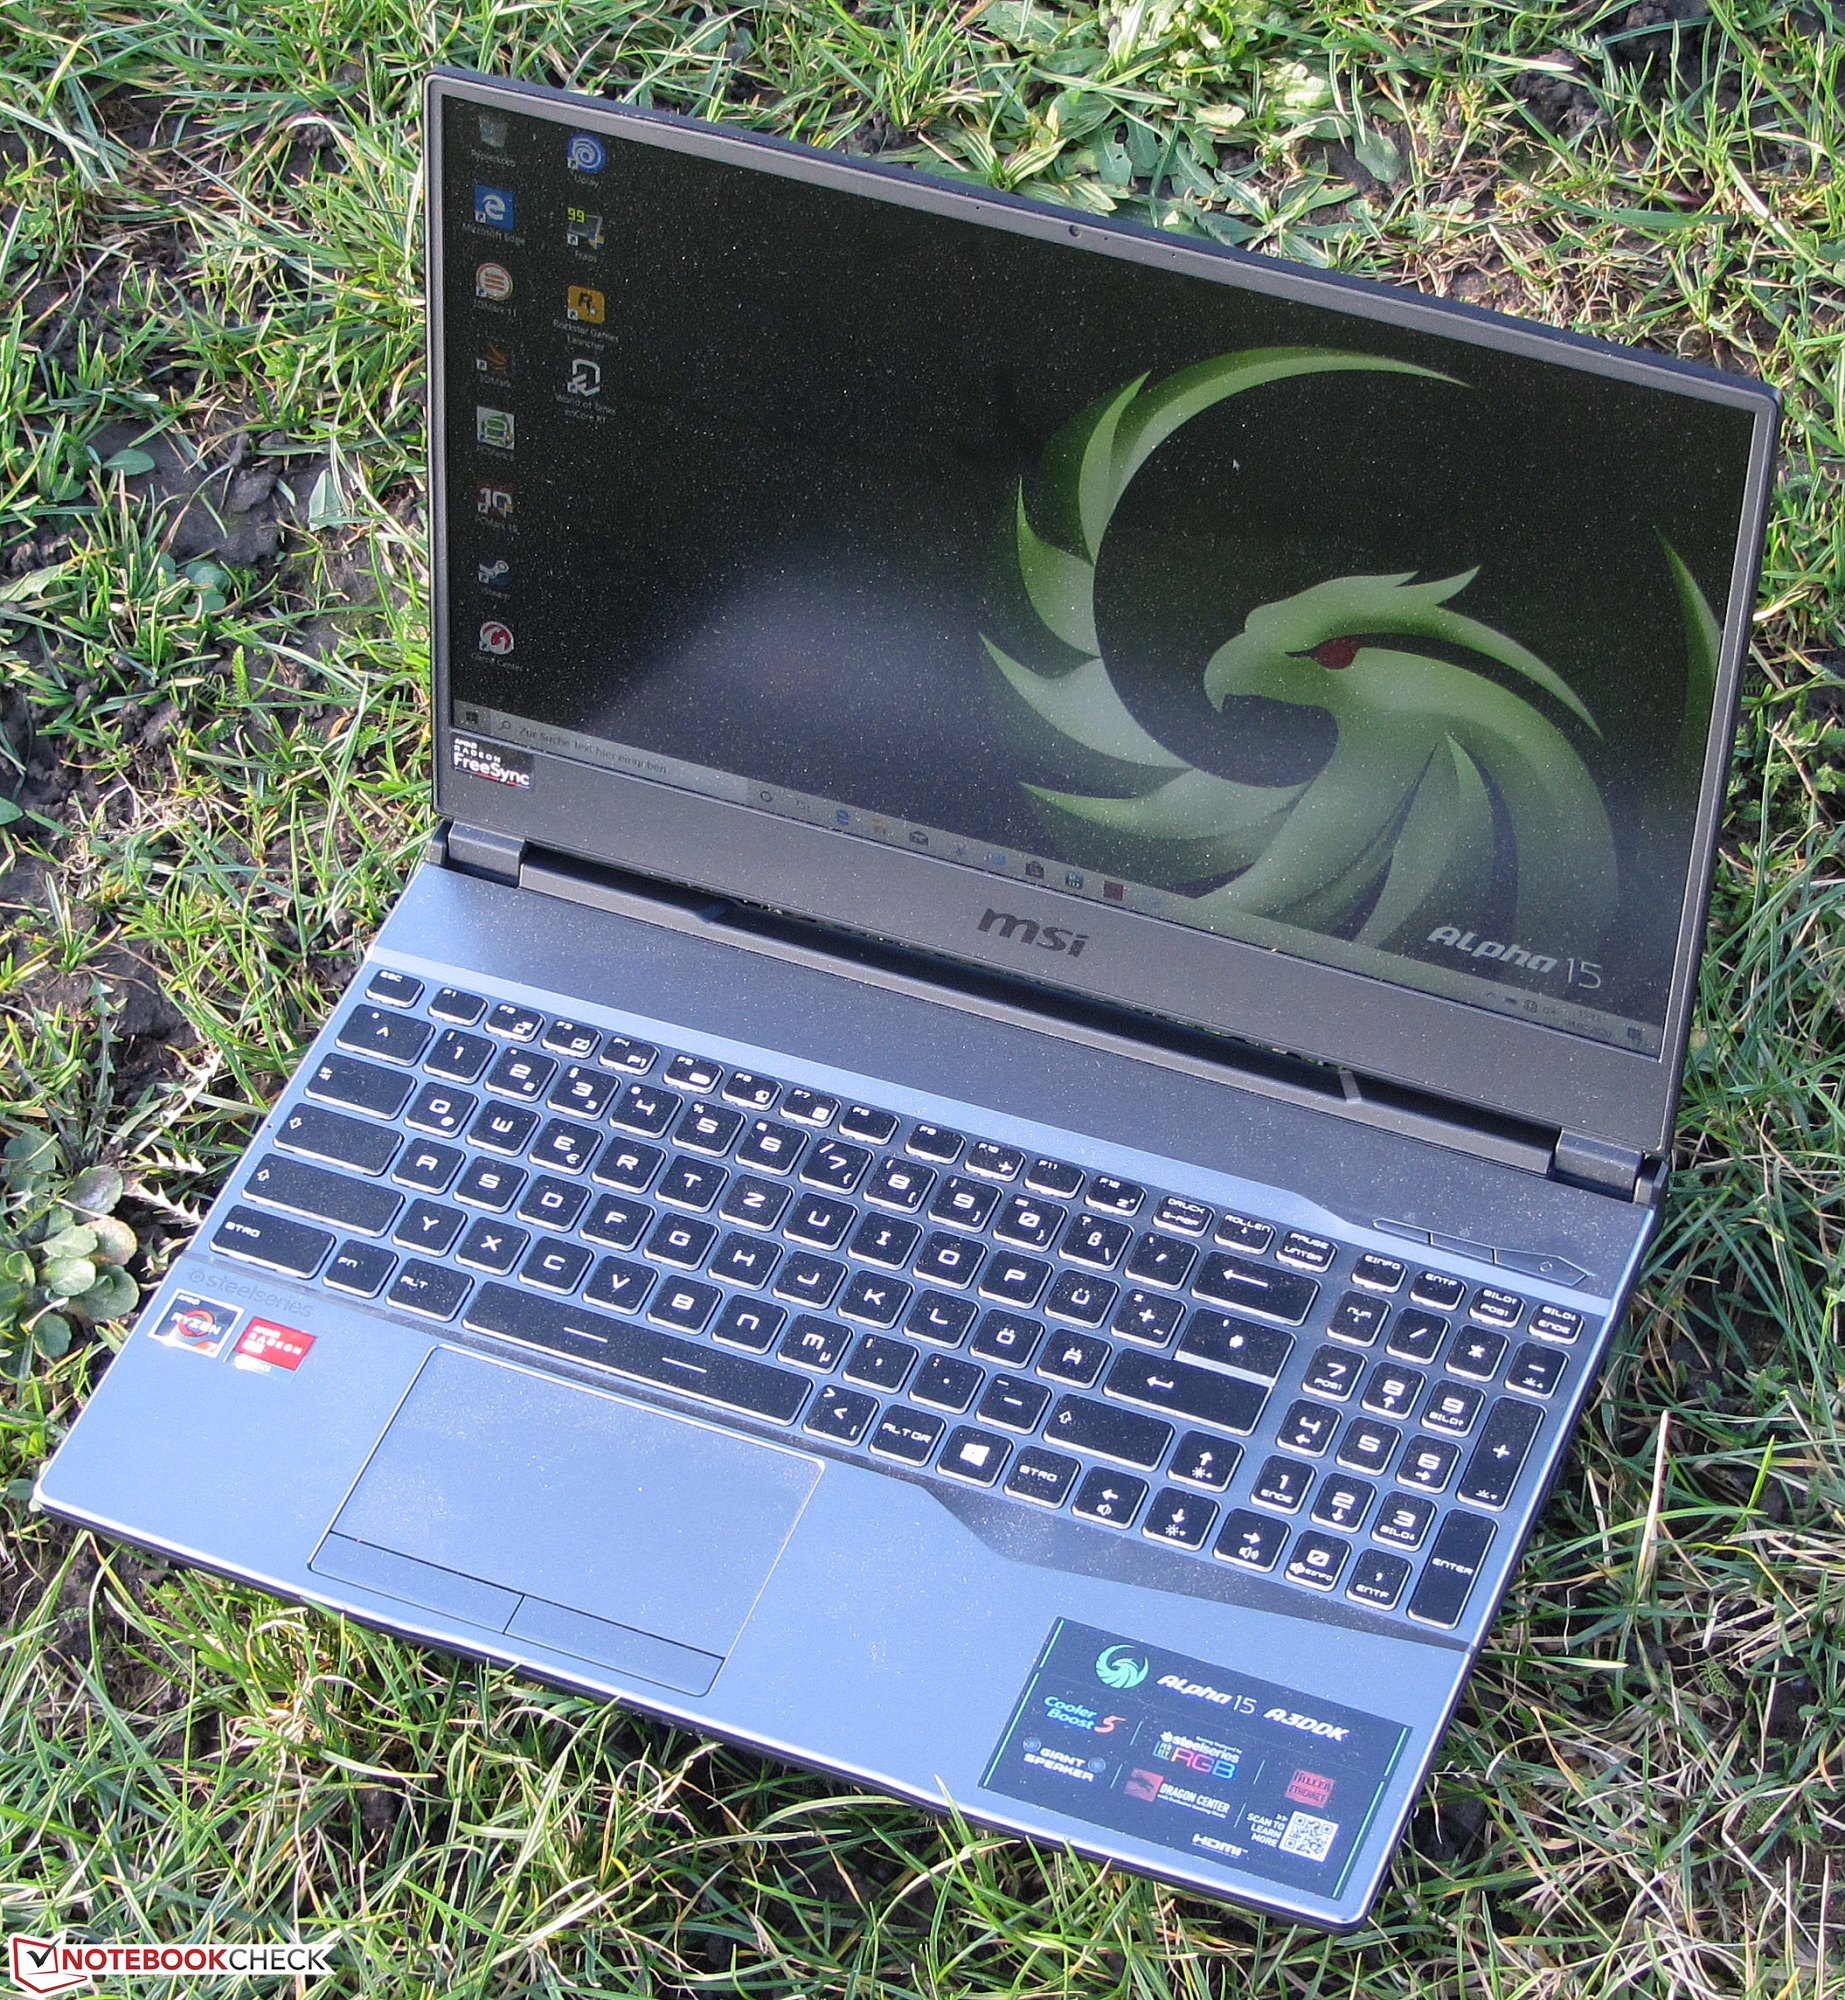
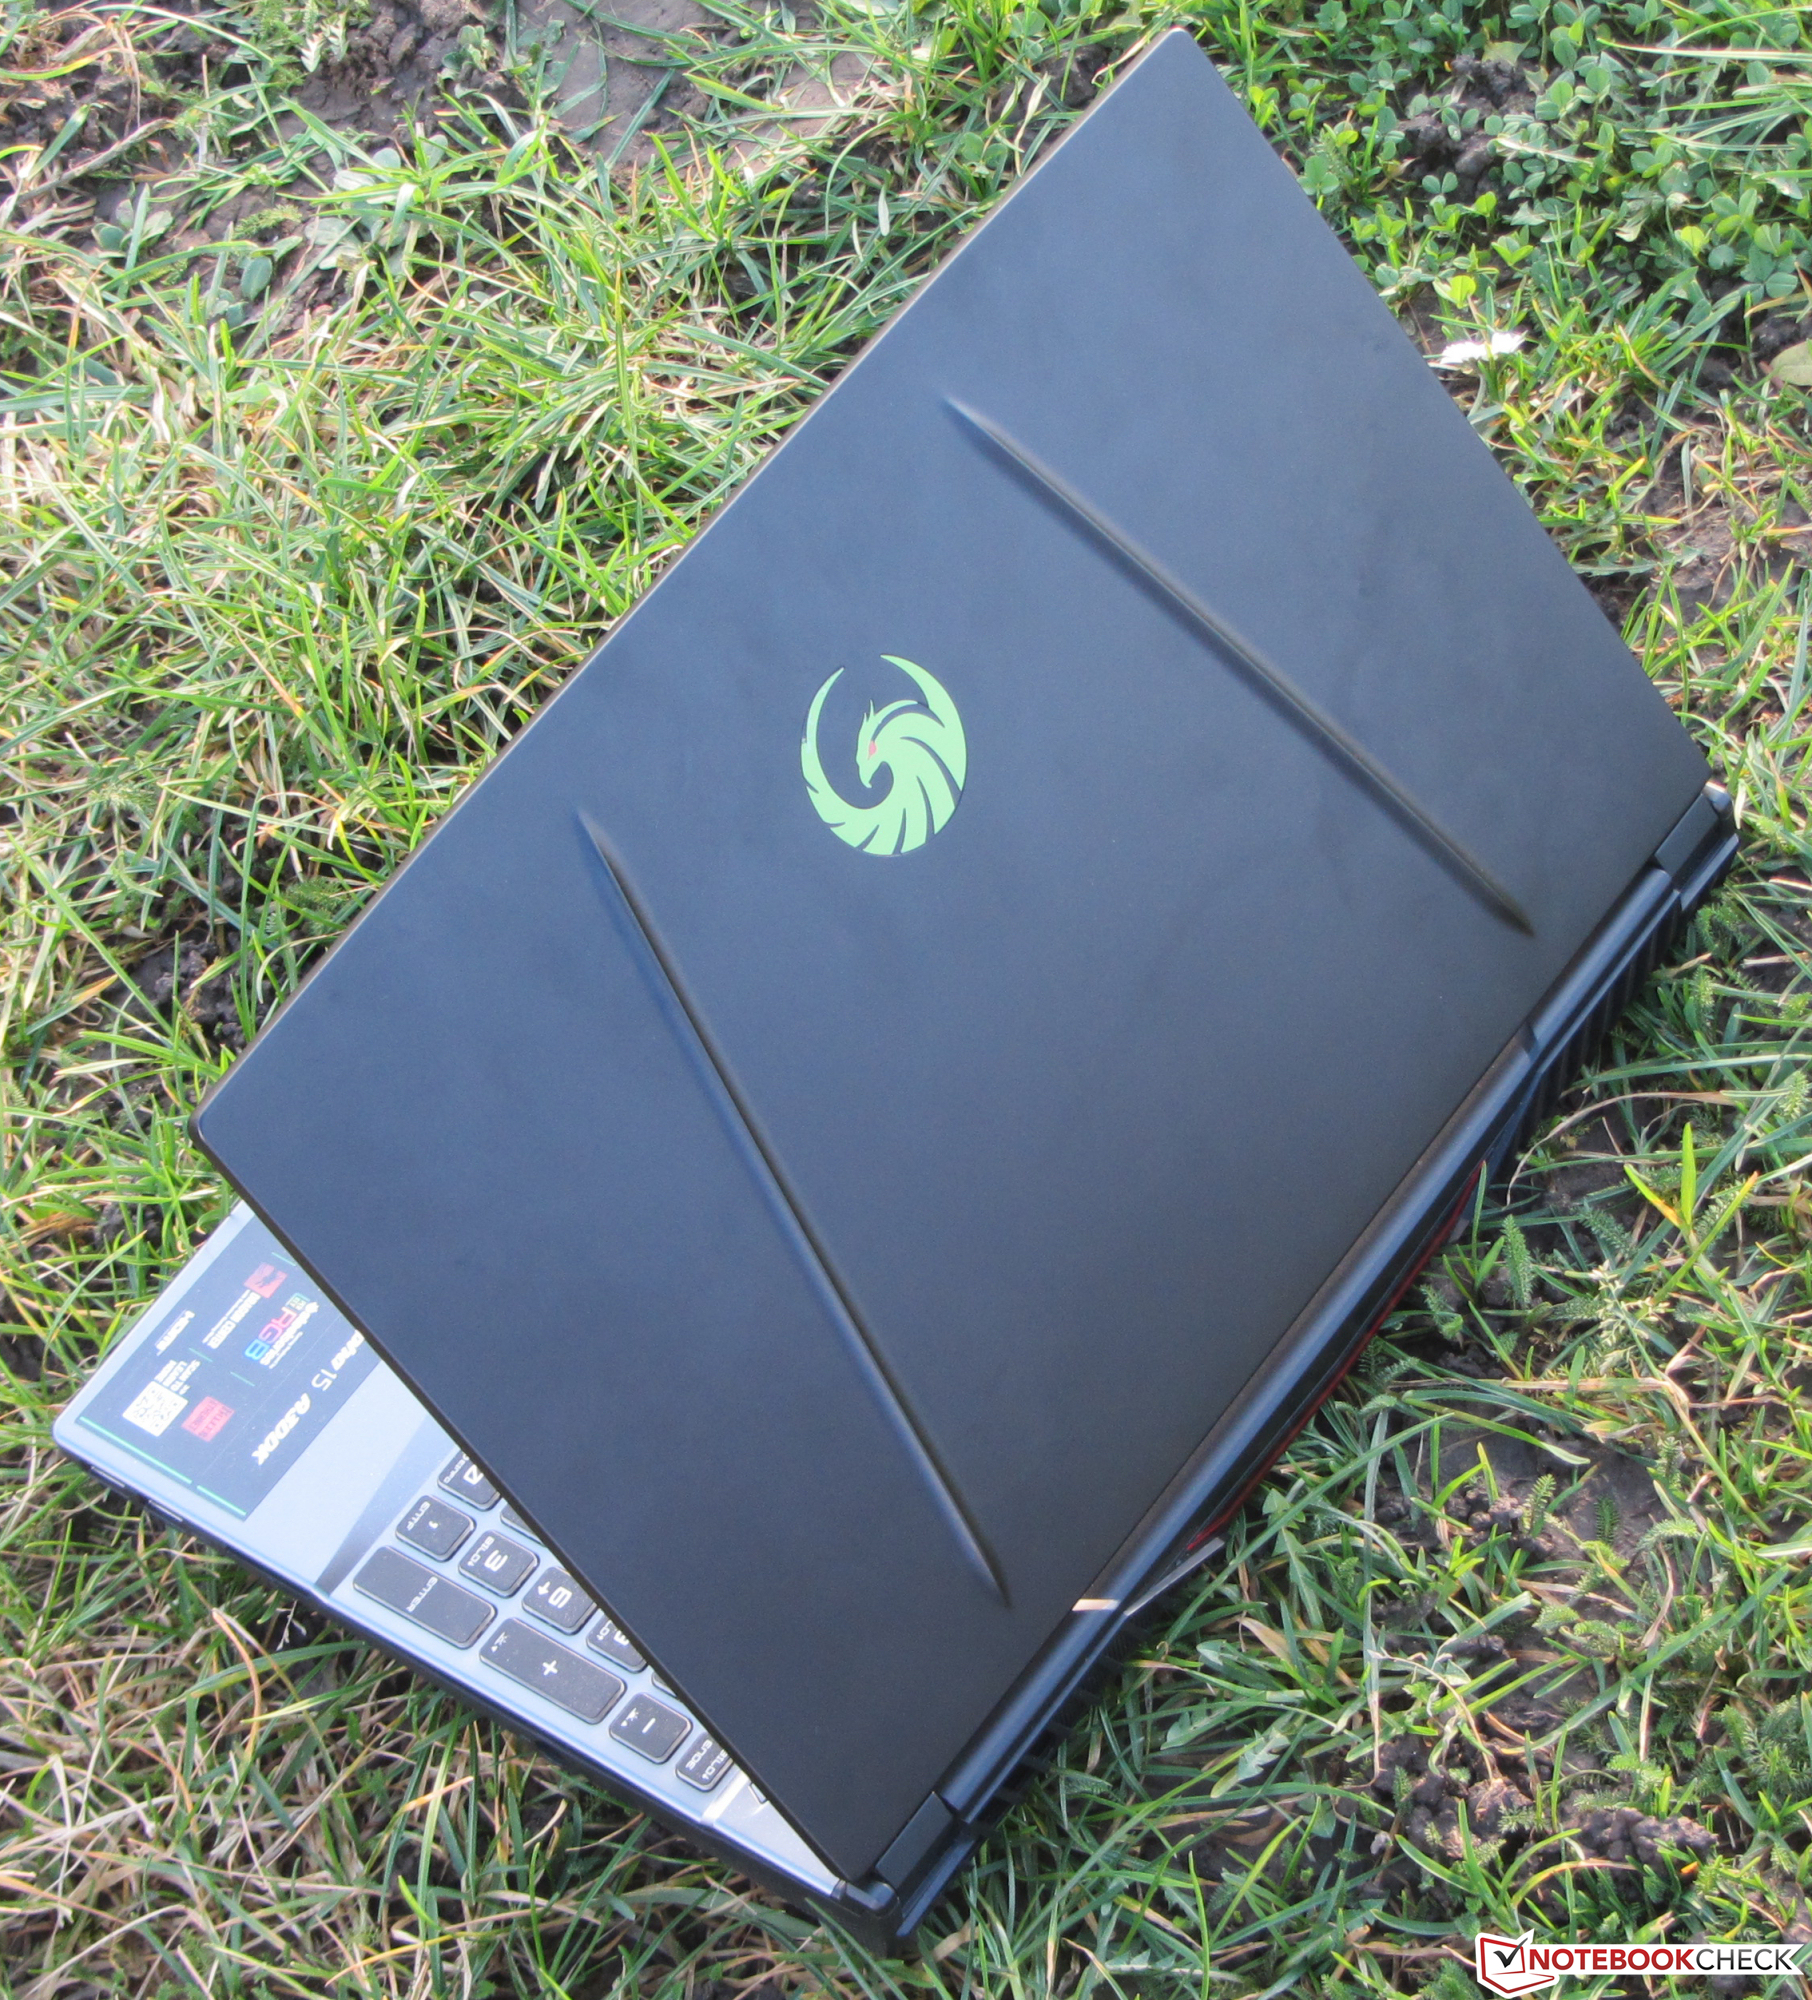
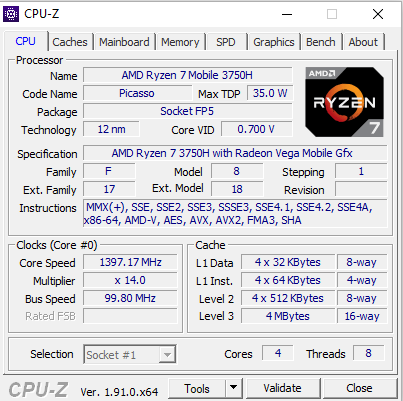
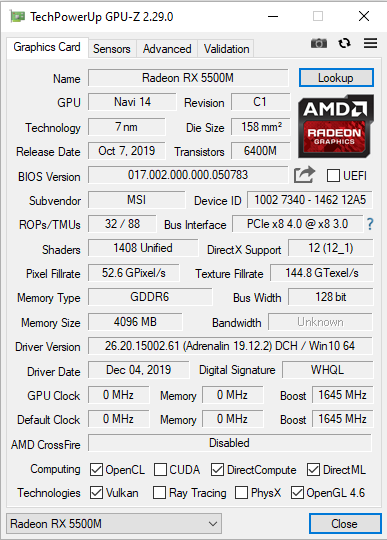
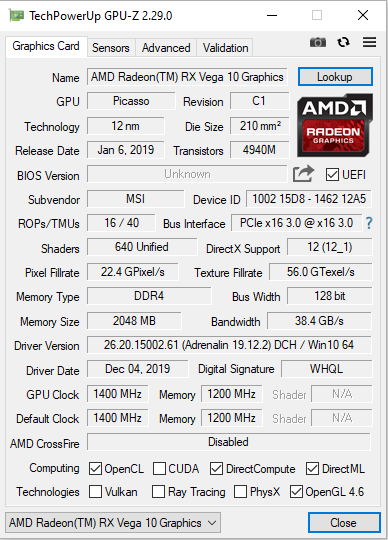
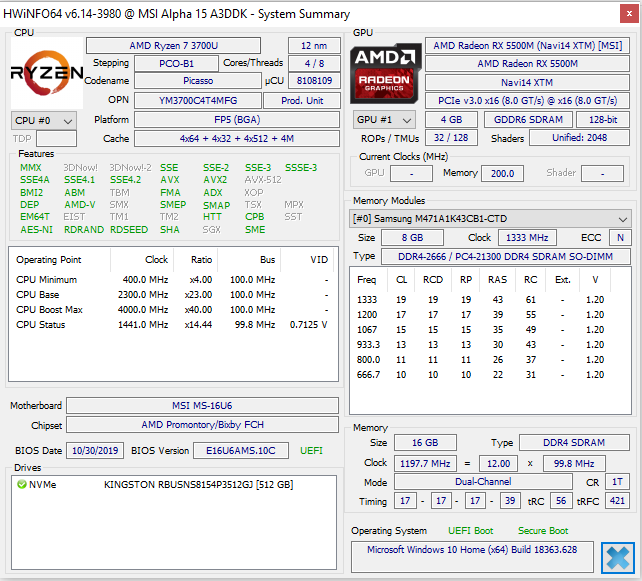
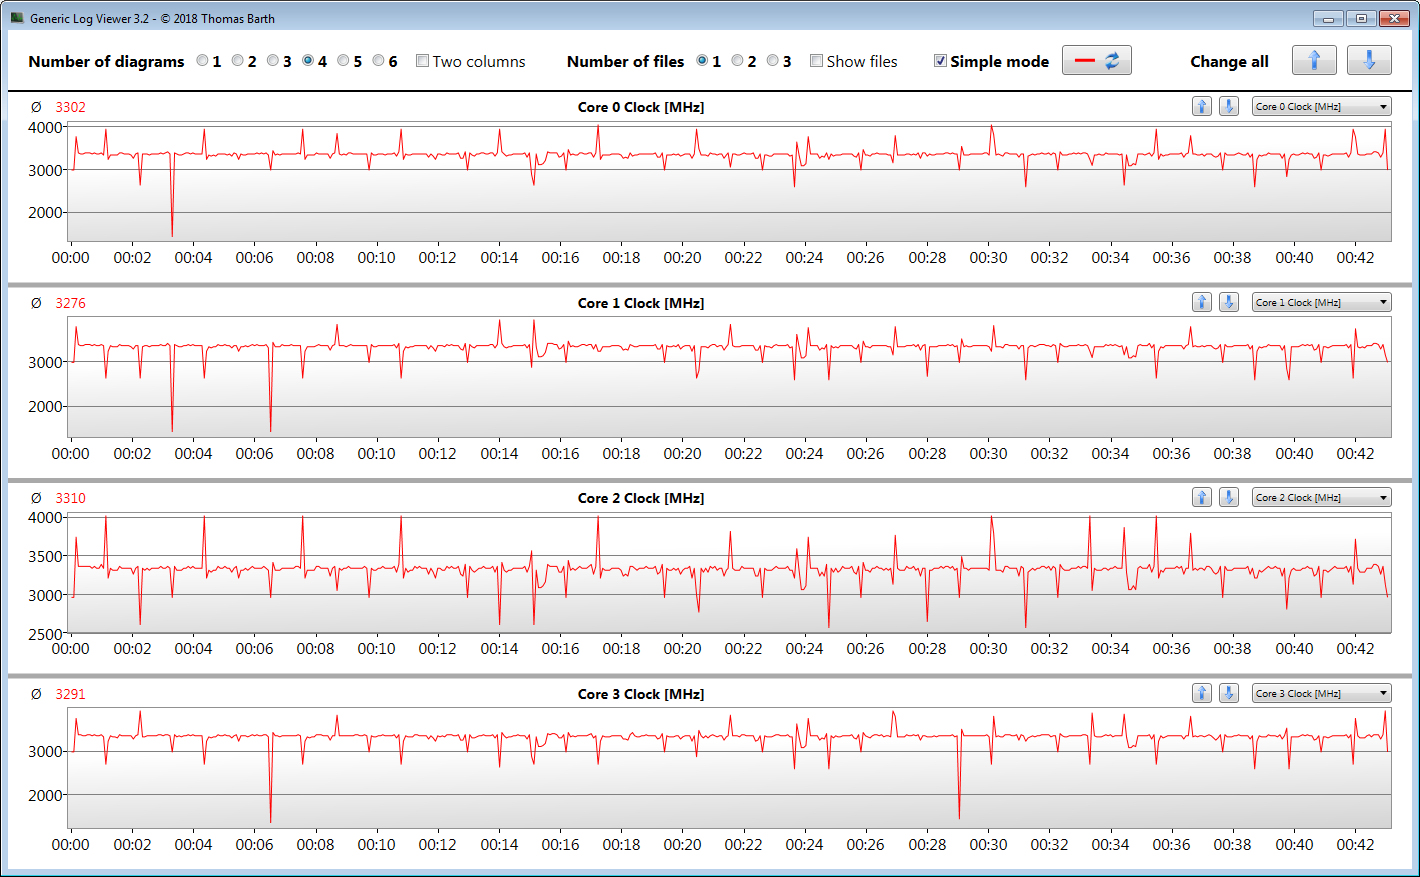
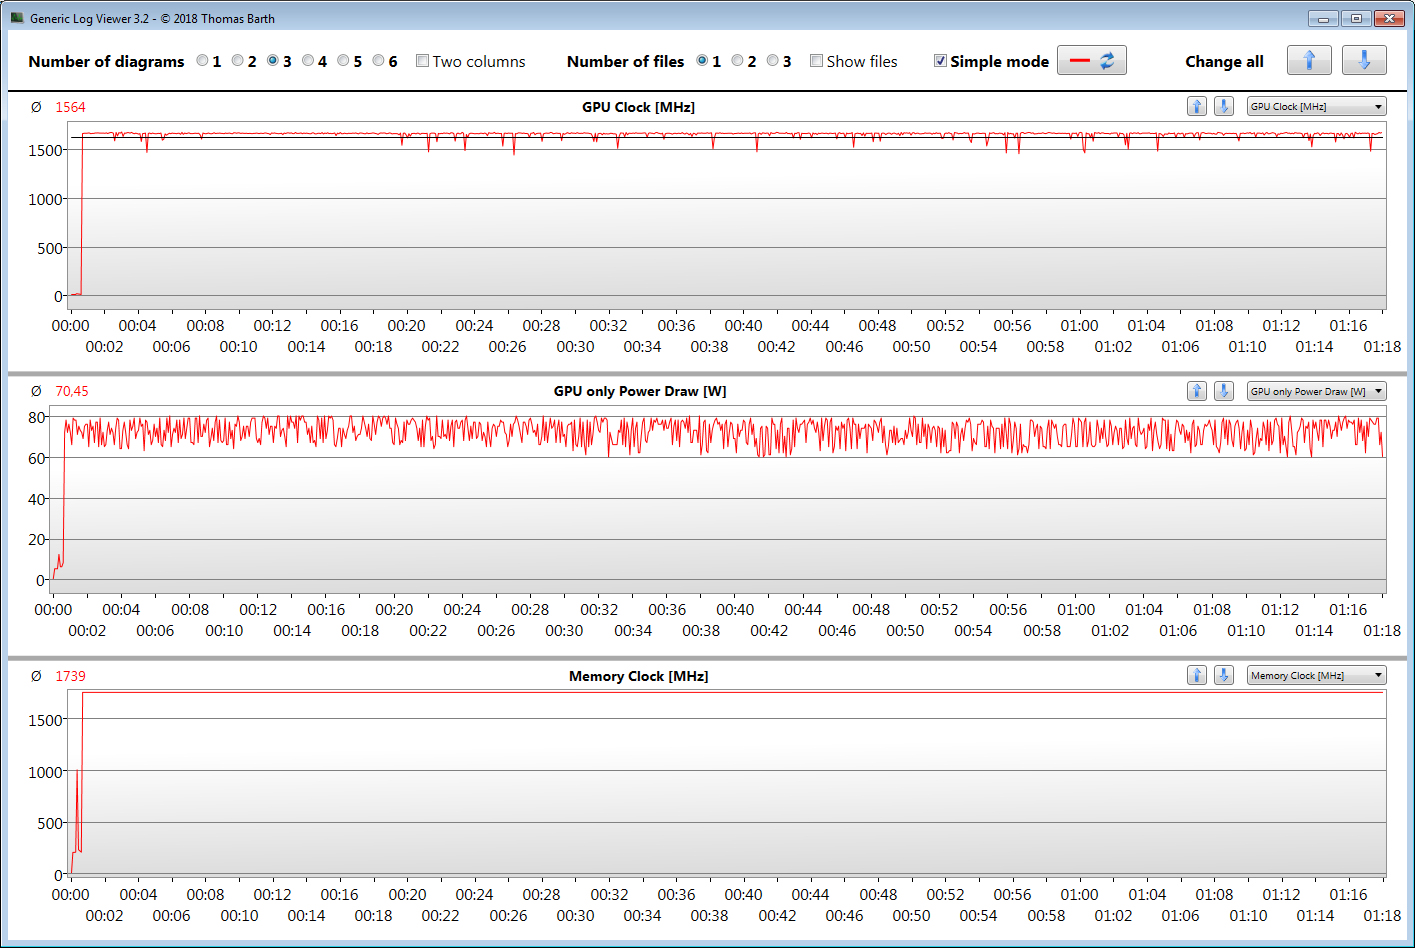
Med Alpha 15 har MSI skapat en hyfsad 15.6-tums spellaptop för mittenskiktet. En Ryzen 7 3750H APU och en Radeon RX 5500M GPU låter Alpha 15 spela alla aktuella spel smidigt. I regel klarar Alpha 15 av att spela spel i 1080p med medel till höga inställningar. I en del fall kan den till och med klara mer än så, men bara för mindre krävande titlar. Generellt hamnar RX 5500M mellan GeForce GTX 1650 och GeForce GTX 1660 Ti Max-Q.
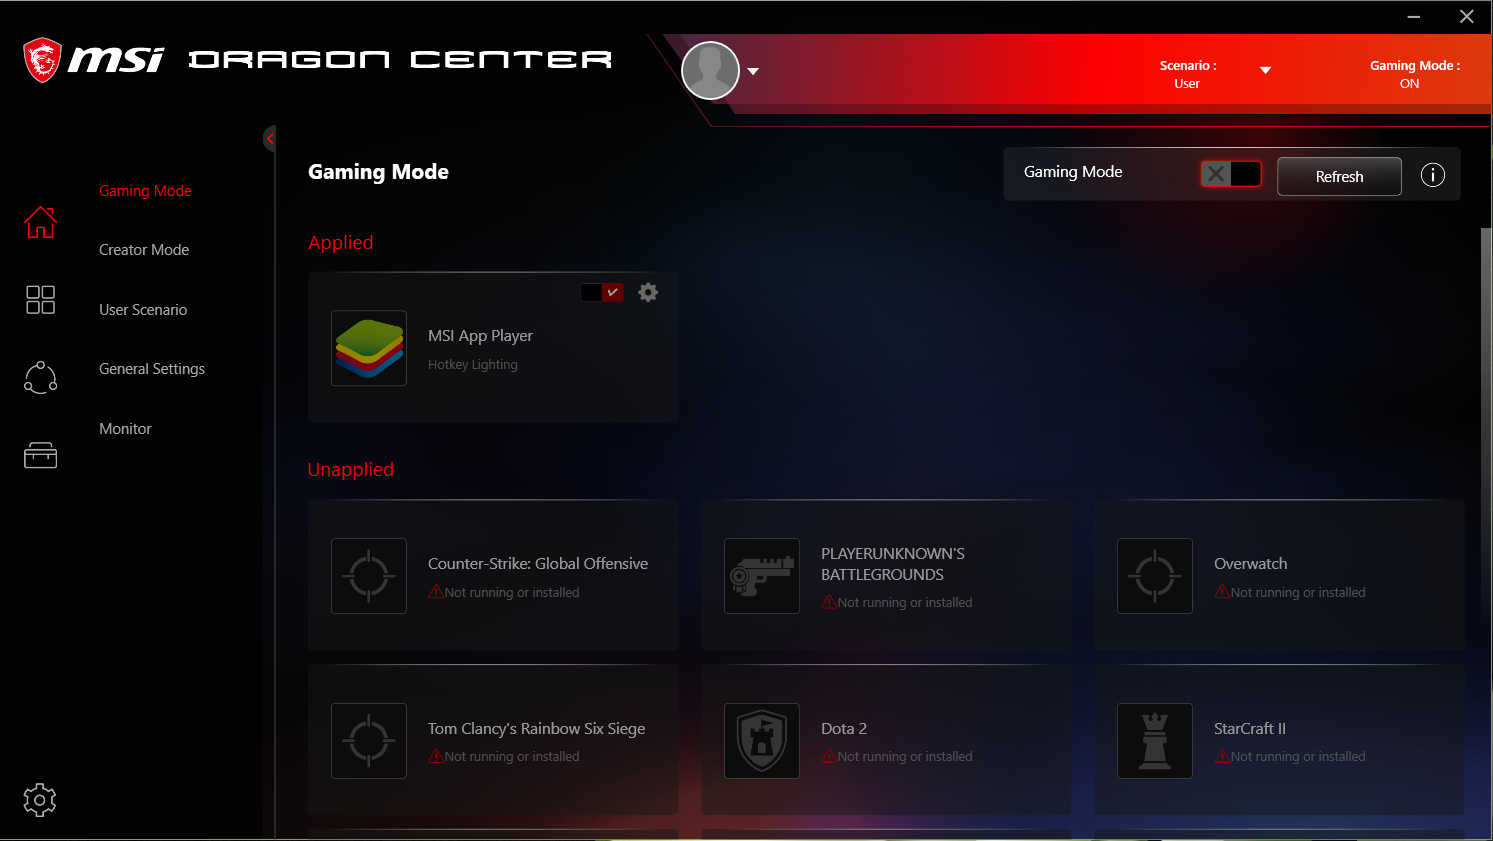
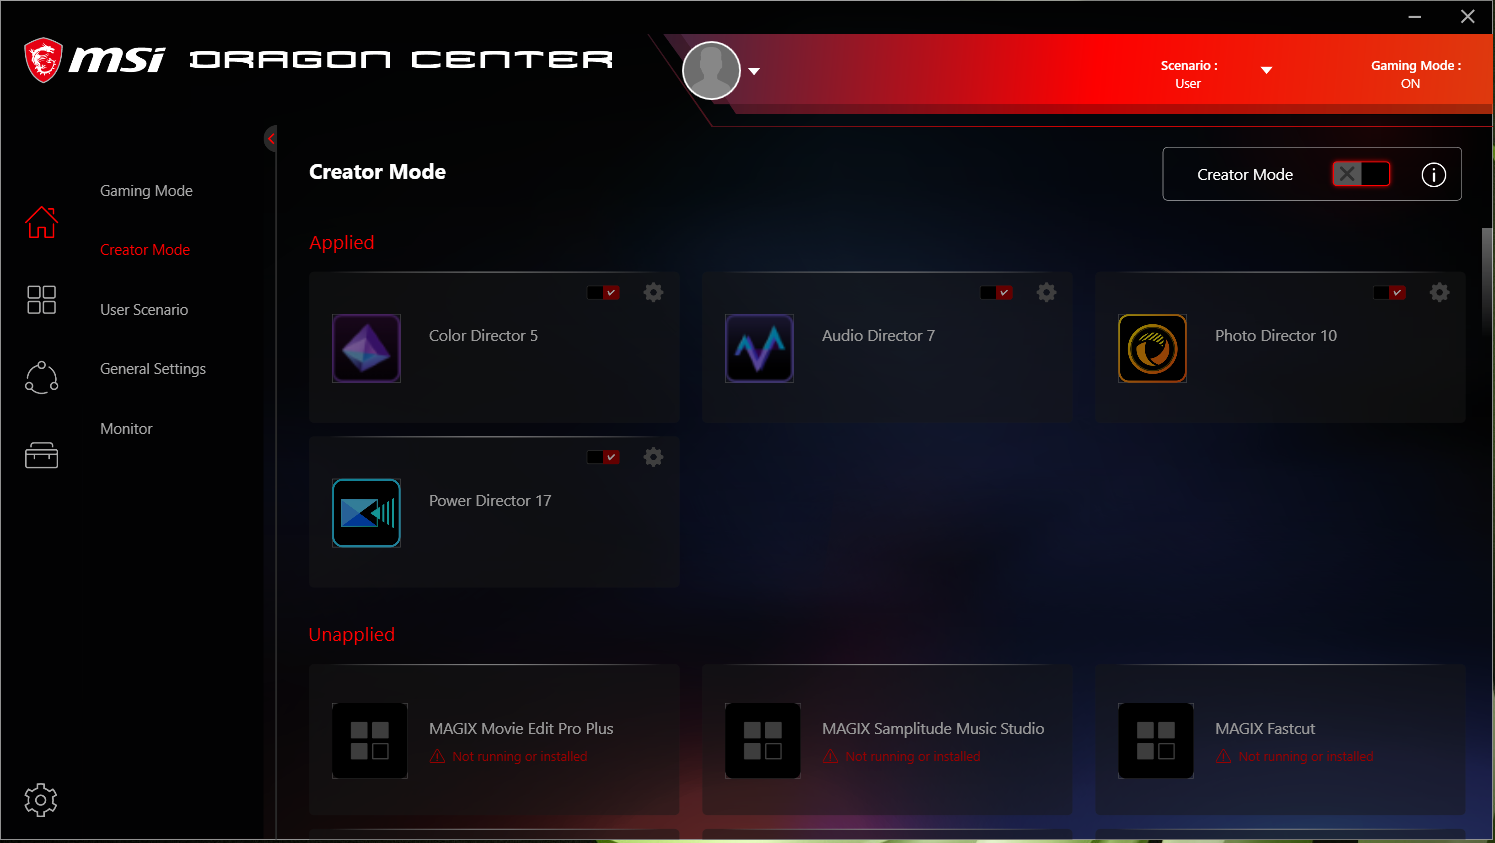
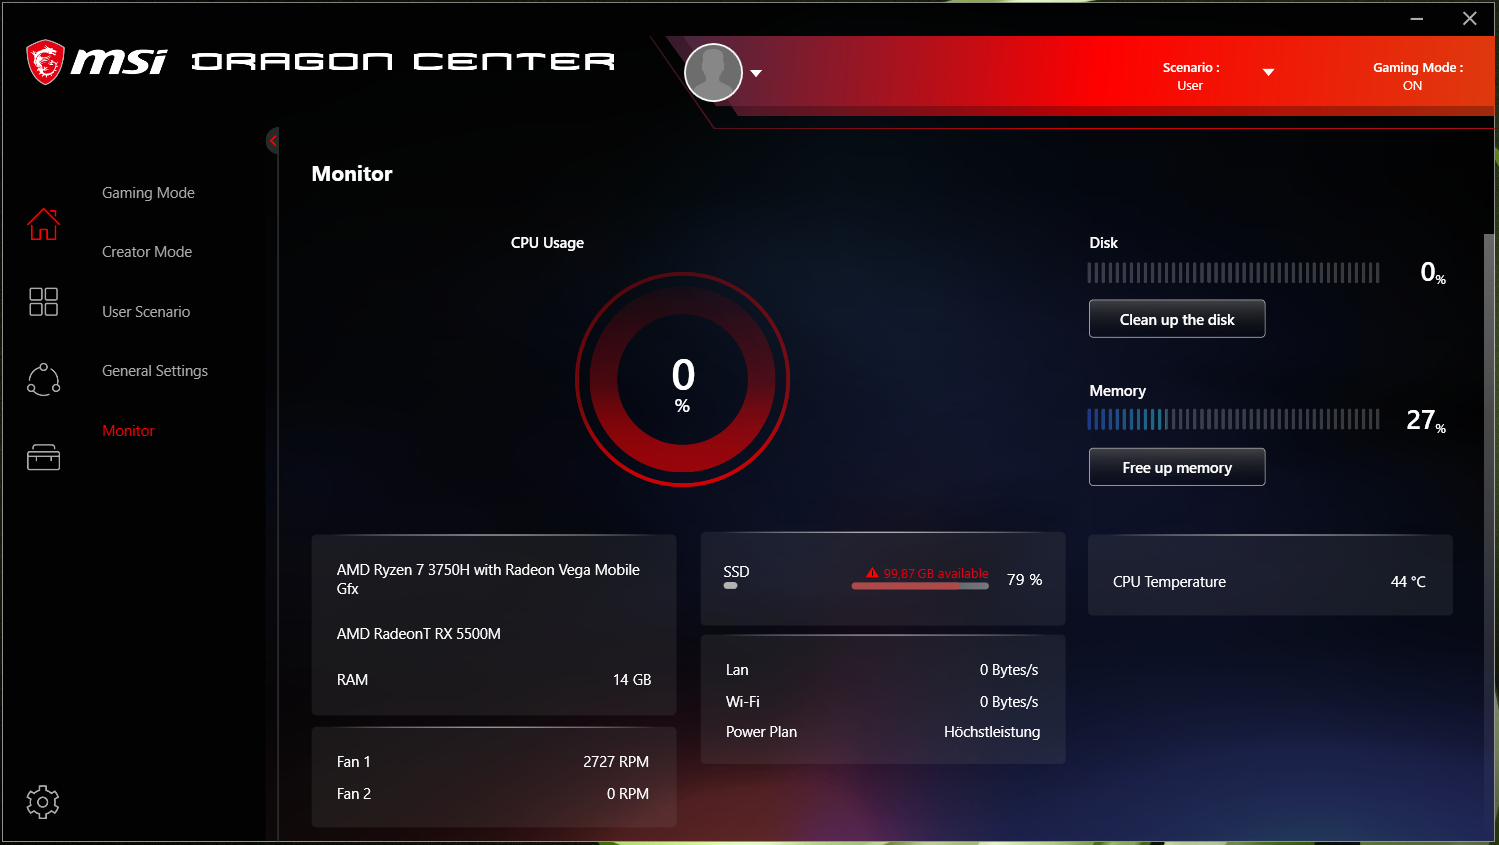
Alpha 15 har dessutom jämförelsevis hög energiförbrukning, både vid tomgång och vid belastning. Som ett resultat håller batteriet på 51 Wh inte särskilt länge. MSI bör i vårt tyckte ta en extra titt på energihanteringen. Datorn låter också mycket, särskilt med den prestandaprofil vi använde under testerna. Om du däremot inte behöver maximal prestanda kan du prova det tysta läget som finns att välja i MSI Dragon Center. Det skulle åtminstone vara ett bättre alternativ vid vardagsbruk.
I stort är MSI Alpha 15 A3DDK en lyckad spellaptop från mittenskiktet. Men den lider av en svaghet som MSI ännu inte lyckats lösa, om det nu går överhuvudtaget.
MSI har utrustat enheten med en snabb NVMe SSD som har 512 GB lagring. Om det inte räcker kan du lägga till en SATA-enhet på 2.5 tum. MSI har till och med förberett Alpha 15 med en SATA-plats och en monteringsram.
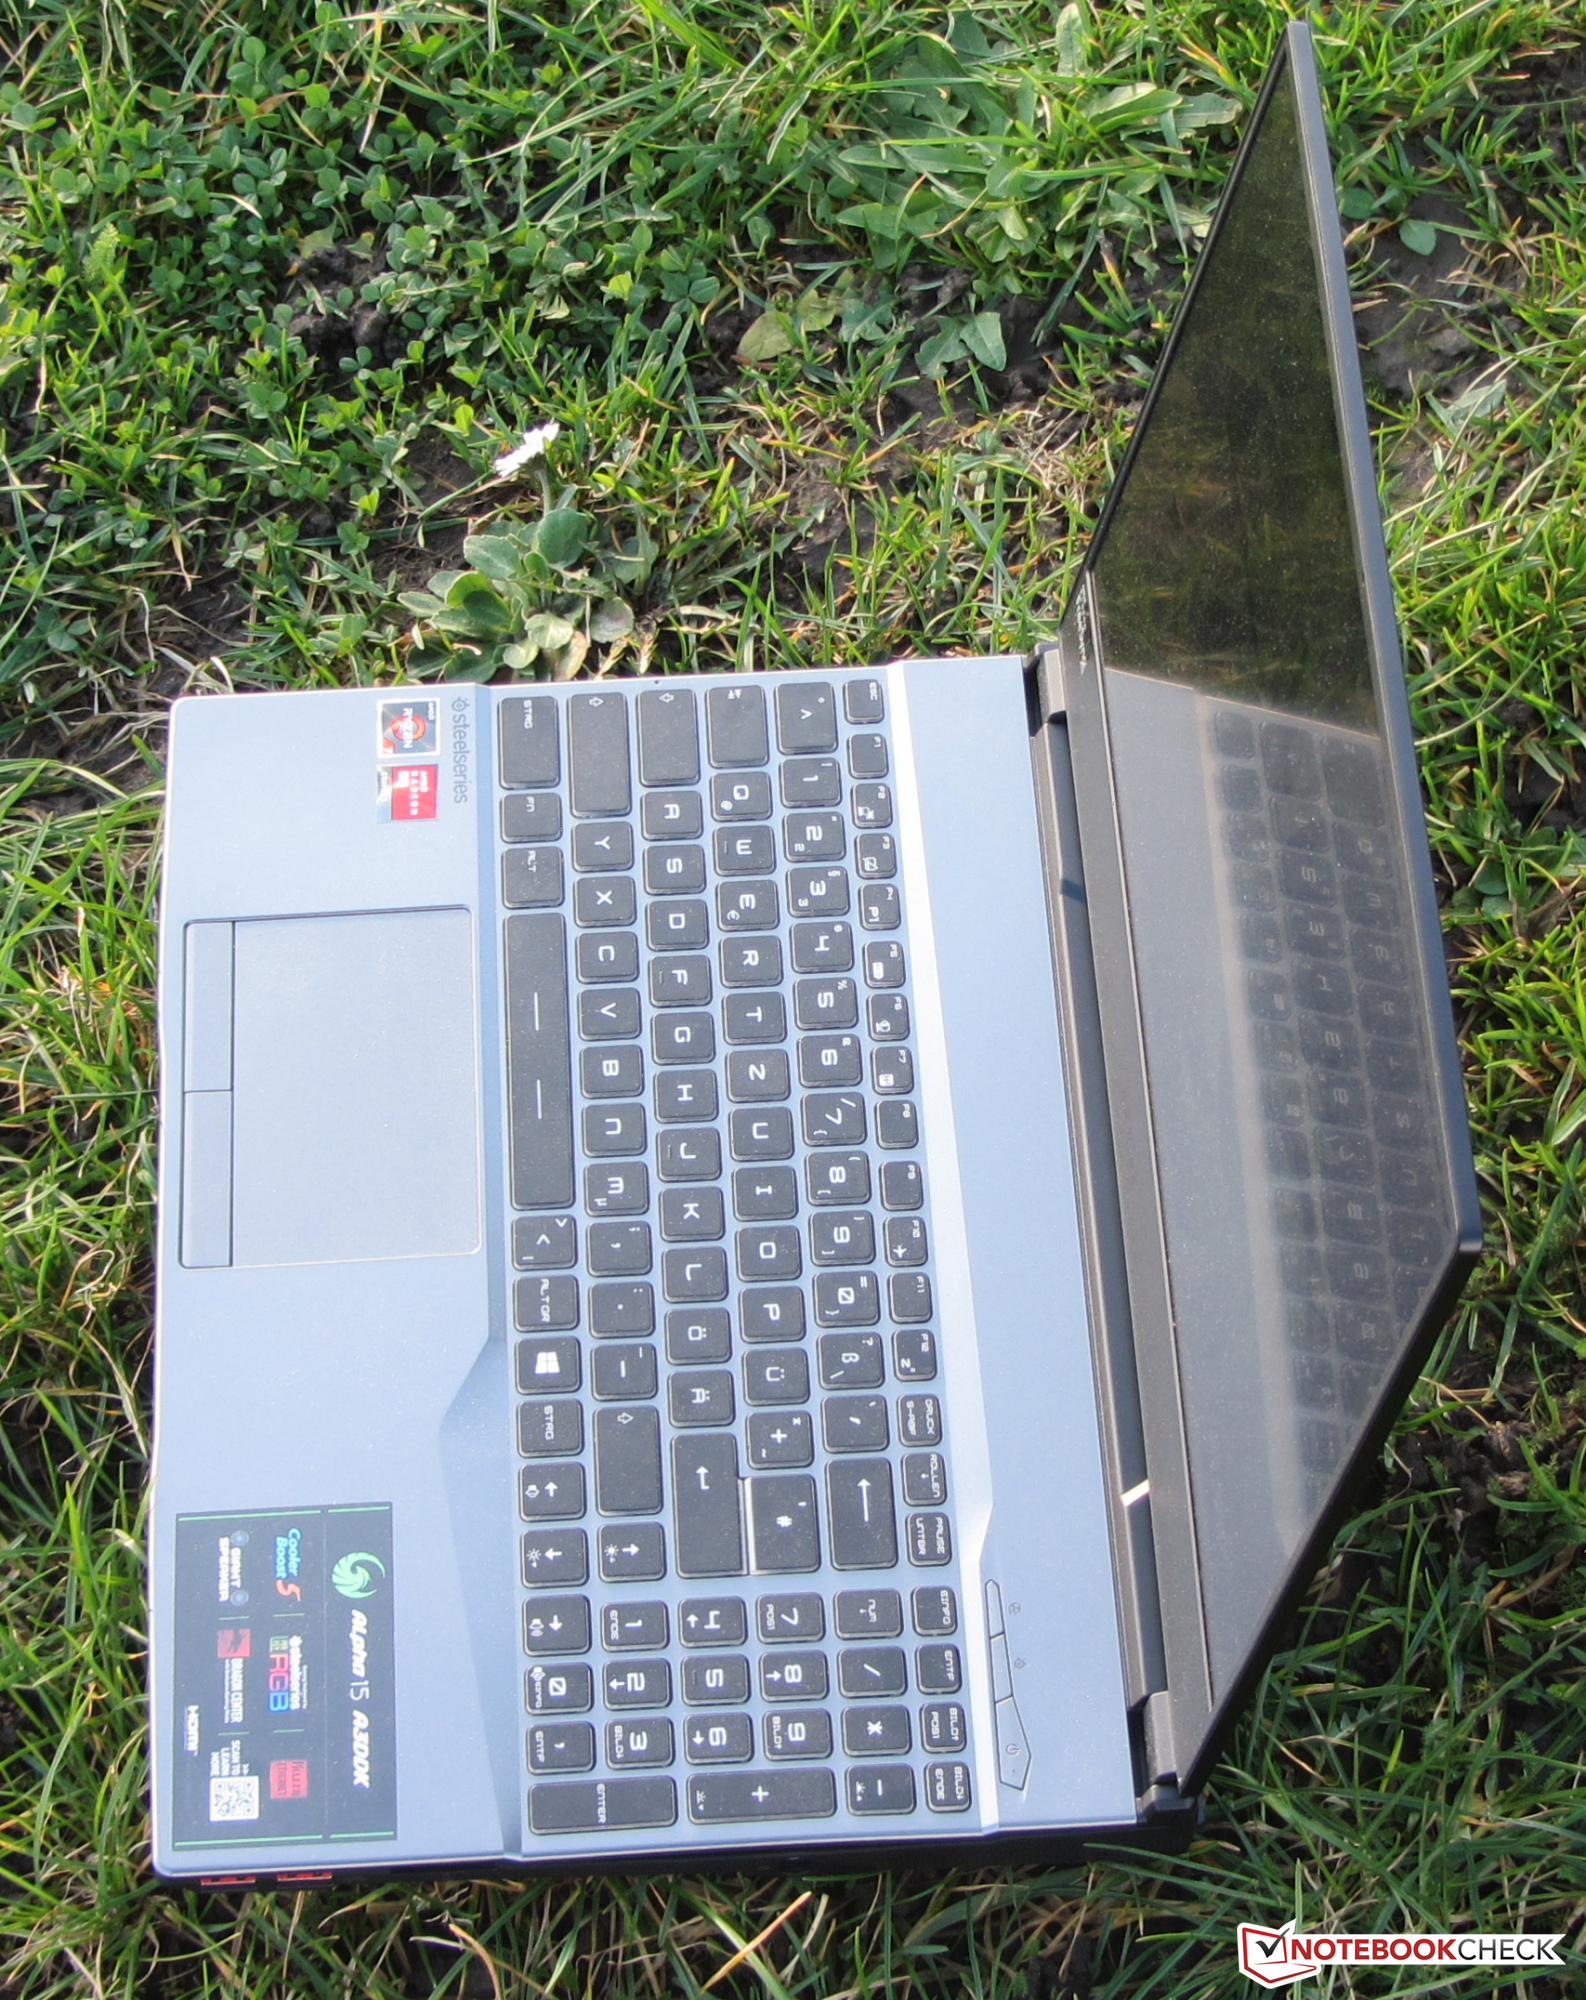
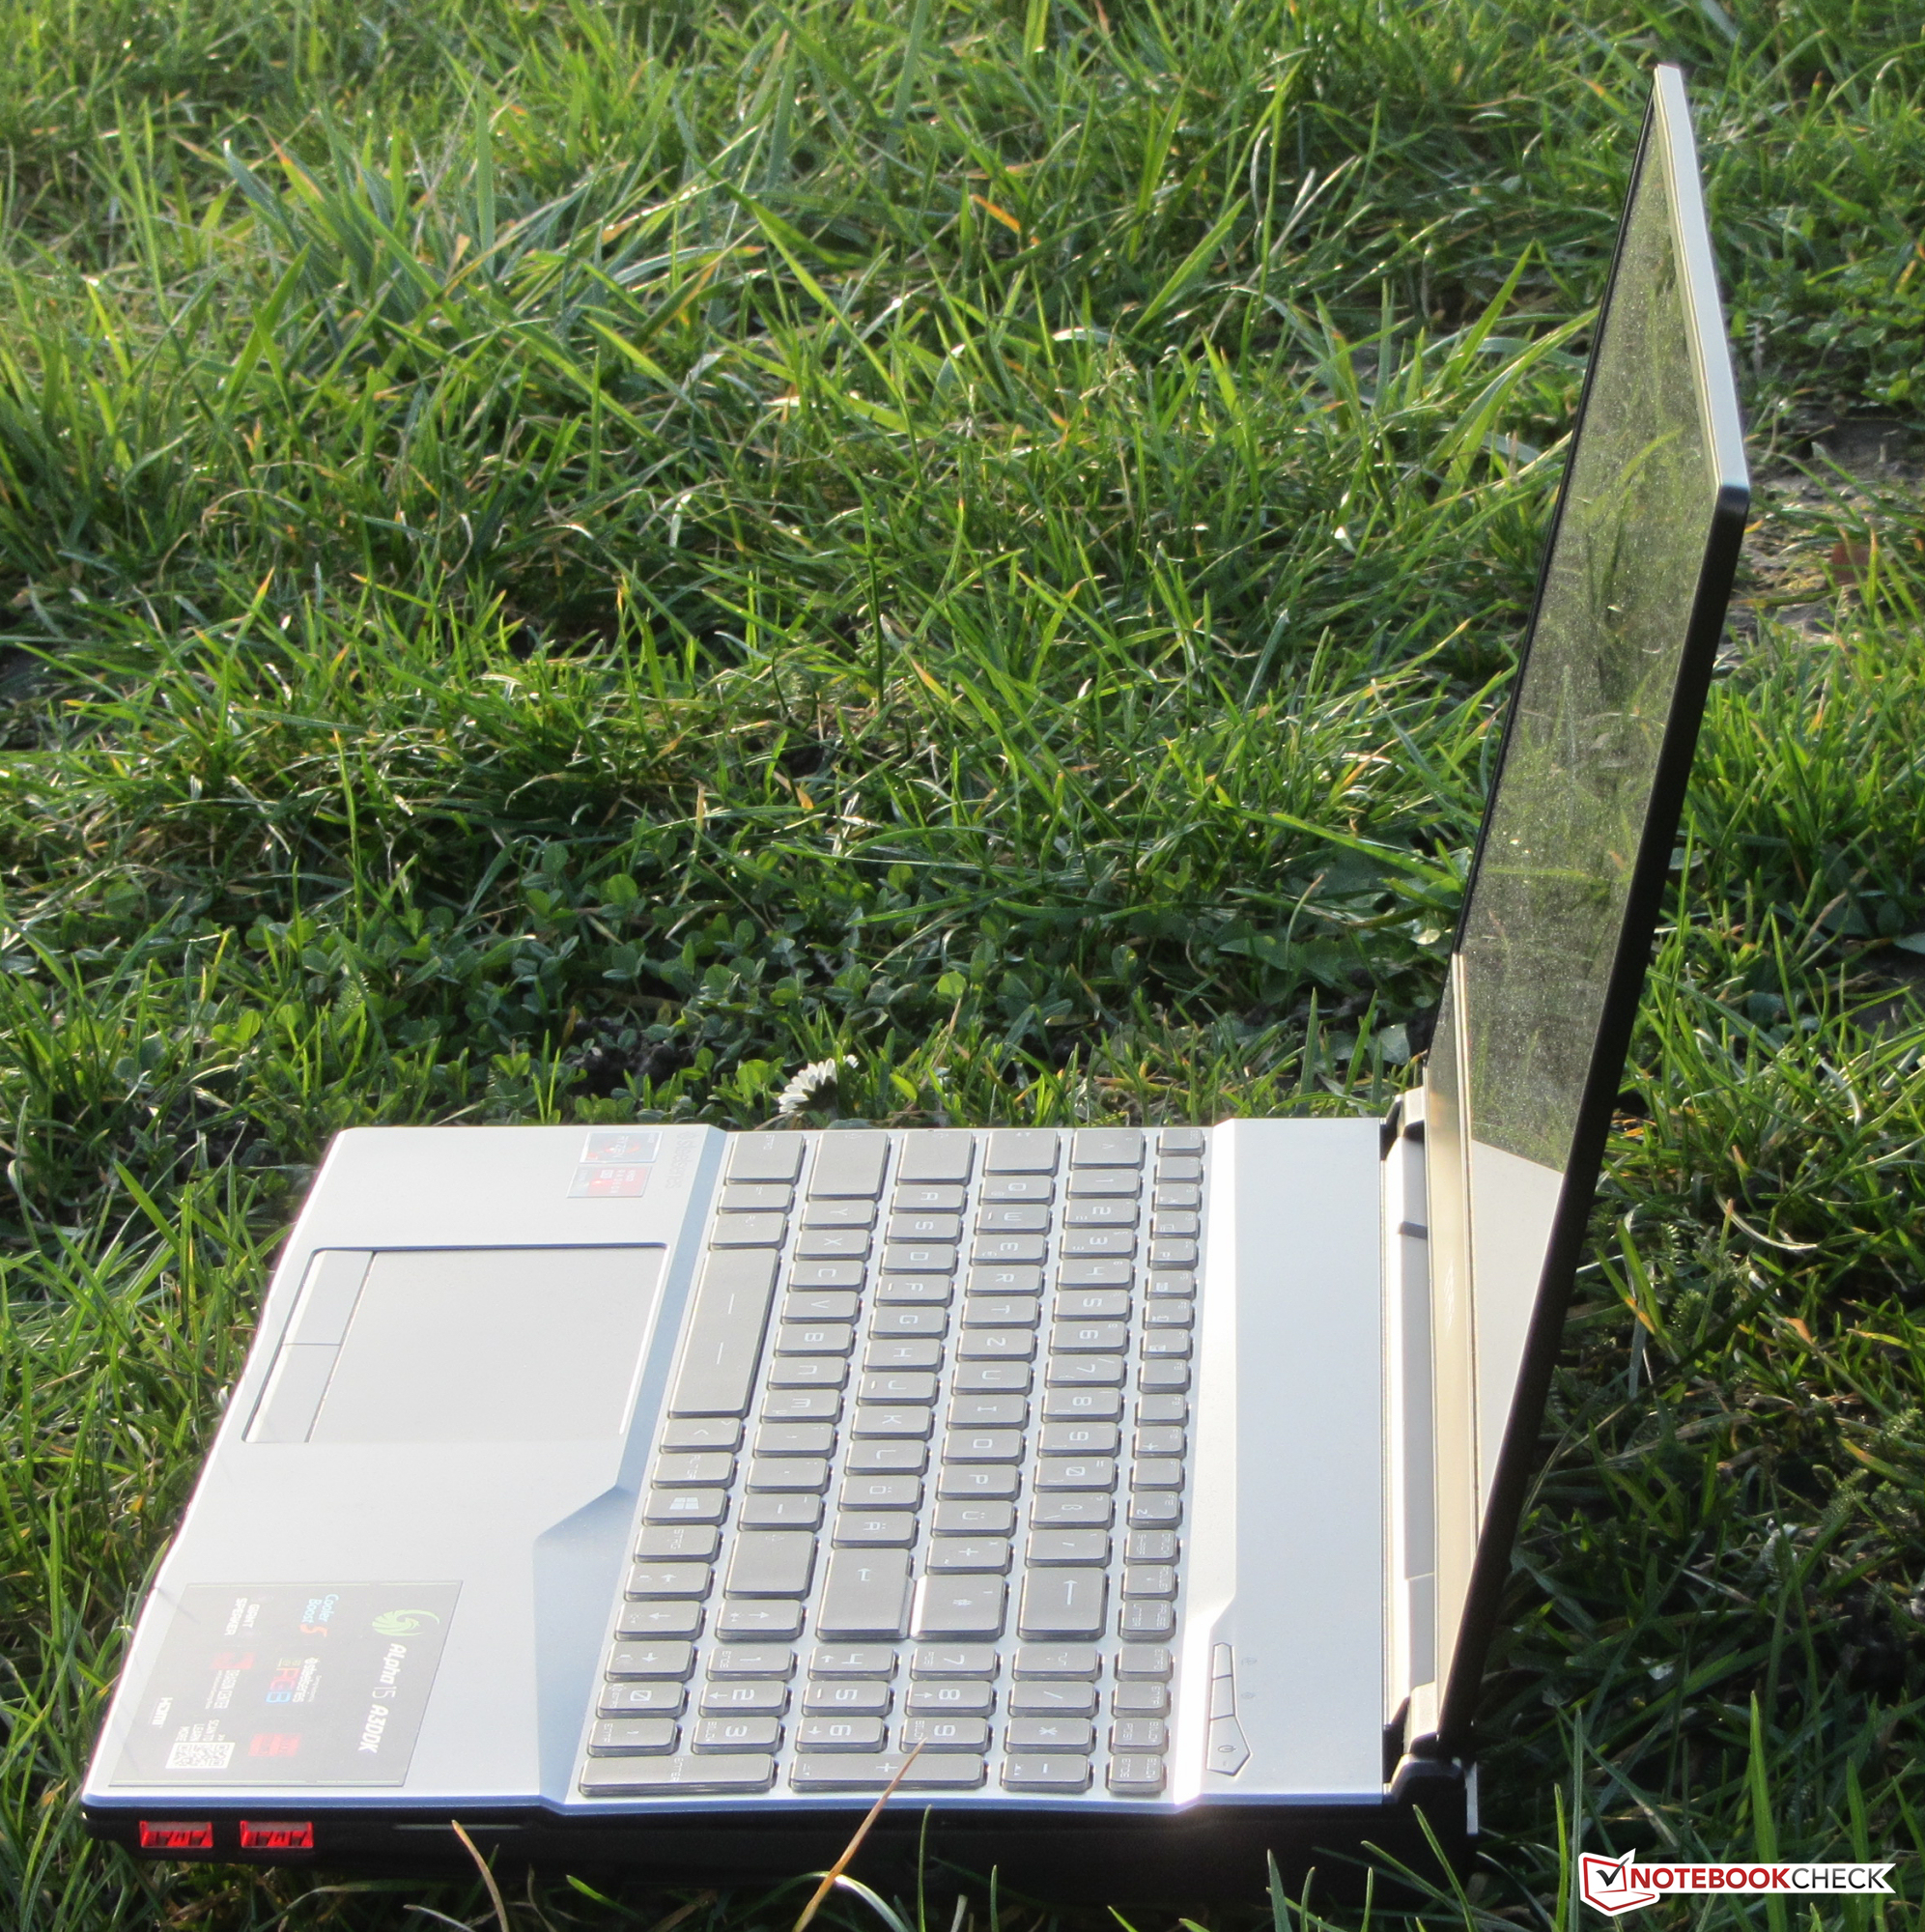
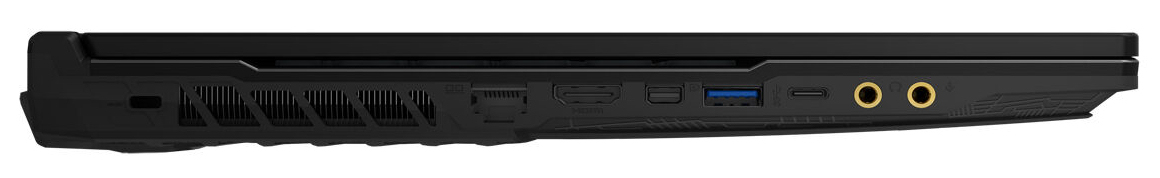
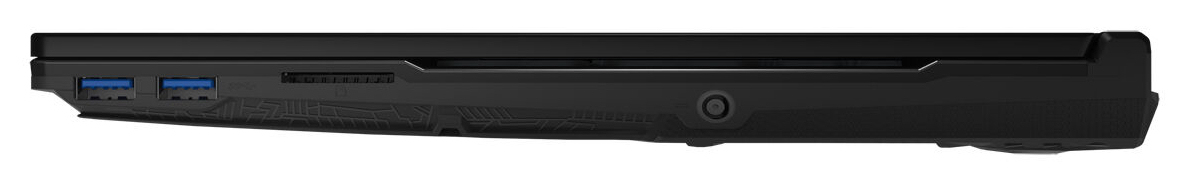
Vidare har enheten en hyfsat ljusstark IPS-skärm med en matt yta och 1080p-upplösning. Skärmen har ett bra kontrastförhållande samt stabila betraktningsvinklar, skaplig färgprecision och korta responstider. Stöd finns även för AMD:s FreeSync-teknik. Alpha 15 har dessutom en helt okej mängd portar, men den har inte Thunderbolt 3. Det bakgrundsbelysta tangentbordet är bra nog för vardagsbruk.
Alpha 15 kommer dock inte få det lätt att synas i mängden. En del konkurrenter är betydligt mer prisvärda. HP Pavilion Gaming 15-ec0017ng kostar 11.500 kronor, 1.500 kronor mindre än vår recensionsenhet. Pavilion Gaming 15 har dessutom en starkare GPU än Alpha 15 tillsammans med tystare fläktar, lägre yttemperaturer, lägre energiförbrukning och betydligt bättre batteritid.
MSI Alpha 15 A3DDK-034
- 02/07/2020 v7 (old)
Sascha Mölck
Price comparison
