Test: MSI GE63 Raider 8SG - Billigt GeForce RTX 2080 (Sammanfattning)
Gradering | Datum | Modell | Vikt | Höjd | Storlek | Upplösning | Pris |
|---|---|---|---|---|---|---|---|
| 83.4 % v7 (old) | 12/2019 | MSI GE63 Raider 8SG i7-8750H, GeForce RTX 2080 Mobile | 2.6 kg | 29.5 mm | 15.60" | 1920x1080 | |
| 84.8 % v7 (old) | Lenovo Legion Y740-15ICHg i7-9750H, GeForce RTX 2070 Max-Q | 2.3 kg | 25 mm | 15.60" | 1920x1080 | ||
| 82.3 % v7 (old) | 10/2019 | Dell G7 7590 i7-9750H, GeForce RTX 2060 Mobile | 2.5 kg | 19.9 mm | 15.60" | 1920x1080 | |
| 82.1 % v7 (old) | Asus Strix Scar III G531GW-AZ062T i7-9750H, GeForce RTX 2070 Mobile | 2.4 kg | 25 mm | 15.60" | 1920x1080 | ||
| 84.7 % v7 (old) | 02/2019 | Razer Blade 15 RTX 2070 Max-Q i7-8750H, GeForce RTX 2070 Max-Q | 2.1 kg | 17.8 mm | 15.60" | 1920x1080 |
| SD Card Reader | |
| average JPG Copy Test (av. of 3 runs) | |
| MSI GT75 8RG-090 Titan (Toshiba Exceria Pro SDXC 64 GB UHS-II) | |
| MSI GE63 Raider 8SG (Toshiba Exceria Pro SDXC 64 GB UHS-II) | |
| MSI GL65 9SEK (Toshiba Exceria Pro SDXC 64 GB UHS-II) | |
| MSI GT63 Titan 8RG-046 (Toshiba Exceria Pro SDXC 64 GB UHS-II) | |
| maximum AS SSD Seq Read Test (1GB) | |
| MSI GT75 8RG-090 Titan (Toshiba Exceria Pro SDXC 64 GB UHS-II) | |
| MSI GE63 Raider 8SG (Toshiba Exceria Pro SDXC 64 GB UHS-II) | |
| MSI GL65 9SEK (Toshiba Exceria Pro SDXC 64 GB UHS-II) | |
| MSI GT63 Titan 8RG-046 (Toshiba Exceria Pro SDXC 64 GB UHS-II) | |
| Networking | |
| iperf3 transmit AX12 | |
| MSI Prestige 15 A10SC | |
| Lenovo Legion Y740-15ICHg | |
| MSI GT63 Titan 8RG-046 | |
| MSI GL65 9SEK | |
| iperf3 receive AX12 | |
| MSI Prestige 15 A10SC | |
| MSI GL65 9SEK | |
| MSI GT63 Titan 8RG-046 | |
| Lenovo Legion Y740-15ICHg | |
| |||||||||||||||||||||||||
Distribution av ljusstyrkan: 84 %
Mitt på batteriet: 268.3 cd/m²
Kontrast: 1342:1 (Svärta: 0.2 cd/m²)
ΔE ColorChecker Calman: 2.65 | ∀{0.5-29.43 Ø4.73}
calibrated: 2.76
ΔE Greyscale Calman: 2.2 | ∀{0.09-98 Ø4.97}
93.3% sRGB (Argyll 1.6.3 3D)
59.3% AdobeRGB 1998 (Argyll 1.6.3 3D)
65.9% AdobeRGB 1998 (Argyll 3D)
91.7% sRGB (Argyll 3D)
65.1% Display P3 (Argyll 3D)
Gamma: 2.33
CCT: 6862 K
| MSI GE63 Raider 8SG AU Optronics B156HAN07.1, IPS, 15.6", 1920x1080 | MSI GL65 9SEK AU Optronics B156HAN13.0, IPS, 15.6", 1920x1080 | Lenovo Legion Y740-15ICHg BOE NV156FHM-N4J, IPS, 15.6", 1920x1080 | MSI GT63 Titan 8RG-046 N156HHE-GA1, TN, 15.6", 1920x1080 | Asus Strix Scar III G531GW-AZ062T Sharp LQ156M1JW09 (SHP14D3), IPS, 15.6", 1920x1080 | MSI GE63 Raider RGB 8RF-008 CMN N156HHE-GA1 (CMN15F4), TN, 15.6", 1920x1080 | |
|---|---|---|---|---|---|---|
| Display | -42% | 2% | 26% | 4% | 26% | |
| Display P3 Coverage (%) | 65.1 | 36.63 -44% | 67.7 4% | 91.3 40% | 66.2 2% | 90 38% |
| sRGB Coverage (%) | 91.7 | 55 -40% | 91.6 0% | 99.9 9% | 97.1 6% | 100 9% |
| AdobeRGB 1998 Coverage (%) | 65.9 | 37.85 -43% | 67.1 2% | 85.7 30% | 67.6 3% | 86 31% |
| Response Times | -184% | -53% | 27% | -25% | -109% | |
| Response Time Grey 50% / Grey 80% * (ms) | 8.8 ? | 26.4 ? -200% | 19 ? -116% | 8.4 ? 5% | 15 ? -70% | 24.4 ? -177% |
| Response Time Black / White * (ms) | 11.2 ? | 30 ? -168% | 10 ? 11% | 5.8 ? 48% | 9 ? 20% | 15.8 ? -41% |
| PWM Frequency (Hz) | 25510 ? | 250 ? | 25510 ? | |||
| Screen | -55% | 9% | -4% | -30% | -28% | |
| Brightness middle (cd/m²) | 268.3 | 277.3 3% | 477 78% | 307.1 14% | 309 15% | 292 9% |
| Brightness (cd/m²) | 261 | 256 -2% | 431 65% | 276 6% | 284 9% | 258 -1% |
| Brightness Distribution (%) | 84 | 86 2% | 84 0% | 80 -5% | 88 5% | 81 -4% |
| Black Level * (cd/m²) | 0.2 | 0.2 -0% | 0.175 13% | 0.37 -85% | 0.42 -110% | 0.23 -15% |
| Contrast (:1) | 1342 | 1387 3% | 2726 103% | 830 -38% | 736 -45% | 1270 -5% |
| Colorchecker dE 2000 * | 2.65 | 5.25 -98% | 4.17 -57% | 2.53 5% | 3.99 -51% | 5.82 -120% |
| Colorchecker dE 2000 max. * | 4.67 | 19.43 -316% | 6.97 -49% | 4.66 -0% | 8.3 -78% | 9.05 -94% |
| Colorchecker dE 2000 calibrated * | 2.76 | 4.39 -59% | 2.51 9% | 2.82 -2% | 1.12 59% | 2.82 -2% |
| Greyscale dE 2000 * | 2.2 | 3.5 -59% | 3.49 -59% | 1.7 23% | 5.43 -147% | 4.61 -110% |
| Gamma | 2.33 94% | 2.1 105% | 2.5 88% | 2.194 100% | 2.57 86% | 2.65 83% |
| CCT | 6862 95% | 6895 94% | 7076 92% | 6893 94% | 7767 84% | 6950 94% |
| Color Space (Percent of AdobeRGB 1998) (%) | 59.3 | 35 -41% | 60 1% | 76 28% | 63 6% | 76 28% |
| Color Space (Percent of sRGB) (%) | 93.3 | 55 -41% | 91 -2% | 100 7% | 97 4% | 100 7% |
| Totalt genomsnitt (program/inställningar) | -94% /
-69% | -14% /
0% | 16% /
5% | -17% /
-23% | -37% /
-28% |
* ... mindre är bättre
Visa svarstider
| ↔ Svarstid svart till vitt | ||
|---|---|---|
| 11.2 ms ... stiga ↗ och falla ↘ kombinerat | ↗ 5.2 ms stiga | 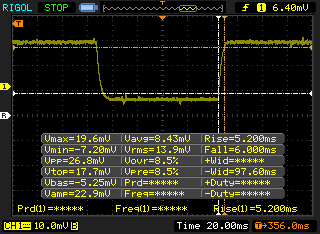 |
| ↘ 6 ms hösten | ||
| Skärmen visar bra svarsfrekvens i våra tester, men kan vara för långsam för konkurrenskraftiga spelare. I jämförelse sträcker sig alla testade enheter från 0.1 (minst) till 240 (maximalt) ms. » 30 % av alla enheter är bättre. Det betyder att den uppmätta svarstiden är bättre än genomsnittet av alla testade enheter (19.9 ms). | ||
| ↔ Svarstid 50 % grått till 80 % grått | ||
| 8.8 ms ... stiga ↗ och falla ↘ kombinerat | ↗ 4.4 ms stiga | 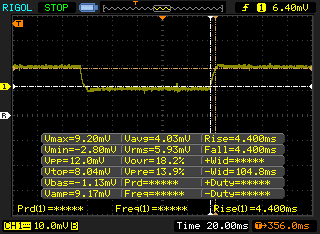 |
| ↘ 4.4 ms hösten | ||
| Skärmen visar snabba svarsfrekvenser i våra tester och bör passa för spel. I jämförelse sträcker sig alla testade enheter från 0.165 (minst) till 636 (maximalt) ms. » 22 % av alla enheter är bättre. Det betyder att den uppmätta svarstiden är bättre än genomsnittet av alla testade enheter (31.1 ms). | ||
Skärmflimmer / PWM (Puls-Width Modulation)
| Skärmflimmer / PWM upptäcktes inte |  | ||
Som jämförelse: 52 % av alla testade enheter använder inte PWM för att dämpa skärmen. Om PWM upptäcktes mättes ett medelvärde av 7798 (minst: 5 - maximum: 343500) Hz. | |||
| PCMark 10 | |
| Score | |
| Lenovo Legion Y740-15ICHg | |
| MSI GL65 9SEK | |
| Asus Strix Scar III G531GW-AZ062T | |
| Genomsnitt Intel Core i7-8750H, NVIDIA GeForce RTX 2080 Mobile (5316 - 5816, n=3) | |
| MSI GE63 Raider 8SG | |
| Essentials | |
| MSI GL65 9SEK | |
| Lenovo Legion Y740-15ICHg | |
| Genomsnitt Intel Core i7-8750H, NVIDIA GeForce RTX 2080 Mobile (8917 - 9041, n=3) | |
| MSI GE63 Raider 8SG | |
| Asus Strix Scar III G531GW-AZ062T | |
| Productivity | |
| MSI GL65 9SEK | |
| Asus Strix Scar III G531GW-AZ062T | |
| Genomsnitt Intel Core i7-8750H, NVIDIA GeForce RTX 2080 Mobile (6947 - 7759, n=3) | |
| Lenovo Legion Y740-15ICHg | |
| MSI GE63 Raider 8SG | |
| Digital Content Creation | |
| Lenovo Legion Y740-15ICHg | |
| Asus Strix Scar III G531GW-AZ062T | |
| Genomsnitt Intel Core i7-8750H, NVIDIA GeForce RTX 2080 Mobile (6584 - 7697, n=3) | |
| MSI GL65 9SEK | |
| MSI GE63 Raider 8SG | |
| PCMark 8 | |
| Home Score Accelerated v2 | |
| Lenovo Legion Y740-15ICHg | |
| Asus Strix Scar III G531GW-AZ062T | |
| Genomsnitt Intel Core i7-8750H, NVIDIA GeForce RTX 2080 Mobile (4124 - 4918, n=3) | |
| MSI GE63 Raider RGB 8RF-008 | |
| MSI GL65 9SEK | |
| MSI GE63 Raider 8SG | |
| Work Score Accelerated v2 | |
| Lenovo Legion Y740-15ICHg | |
| Asus Strix Scar III G531GW-AZ062T | |
| Genomsnitt Intel Core i7-8750H, NVIDIA GeForce RTX 2080 Mobile (5574 - 5697, n=3) | |
| MSI GE63 Raider 8SG | |
| MSI GL65 9SEK | |
| MSI GE63 Raider RGB 8RF-008 | |
| PCMark 8 Home Score Accelerated v2 | 4124 poäng | |
| PCMark 8 Work Score Accelerated v2 | 5577 poäng | |
| PCMark 10 Score | 5316 poäng | |
Hjälp | ||
| MSI GE63 Raider 8SG WDC PC SN520 SDAPNUW-512G | MSI GL65 9SEK WDC PC SN520 SDAPNUW-512G | Lenovo Legion Y740-15ICHg WDC PC SN520 SDAPMUW-128G | MSI GT63 Titan 8RG-046 CUK Cyclone 500GB M.2 NVMe | Asus Strix Scar III G531GW-AZ062T Intel SSD 660p SSDPEKNW512G8 | MSI GE63 Raider RGB 8RF-008 Samsung SSD PM871a MZNLN256HMHQ | |
|---|---|---|---|---|---|---|
| AS SSD | 14% | -19% | 53% | -16% | -27% | |
| Seq Read (MB/s) | 904 | 1315 45% | 1372 52% | 2399 165% | 1163 29% | 512 -43% |
| Seq Write (MB/s) | 1344 | 1378 3% | 746 -44% | 1665 24% | 919 -32% | 462.8 -66% |
| 4K Read (MB/s) | 24.99 | 25.31 1% | 35.42 42% | 49.17 97% | 48.88 96% | 32.36 29% |
| 4K Write (MB/s) | 107.4 | 118.2 10% | 99.9 -7% | 87.7 -18% | 90.1 -16% | 68.6 -36% |
| 4K-64 Read (MB/s) | 631 | 839 33% | 302.1 -52% | 1144 81% | 323.8 -49% | 348.6 -45% |
| 4K-64 Write (MB/s) | 731 | 720 -2% | 191.4 -74% | 648 -11% | 403.8 -45% | 294.3 -60% |
| Access Time Read * (ms) | 0.131 | 0.116 11% | 0.132 -1% | 0.05 62% | 0.24 -83% | 0.101 23% |
| Access Time Write * (ms) | 0.099 | 0.091 8% | 0.037 63% | 0.042 58% | 0.046 54% | 0.051 48% |
| Score Read (Points) | 746 | 996 34% | 475 -36% | 1433 92% | 489 -34% | 432 -42% |
| Score Write (Points) | 973 | 976 0% | 366 -62% | 902 -7% | 586 -40% | 409 -58% |
| Score Total (Points) | 2126 | 2485 17% | 1065 -50% | 3040 43% | 1332 -37% | 1071 -50% |
| Copy ISO MB/s (MB/s) | 1187 | 1279 8% | 1062 -11% | 1269 7% | ||
| Copy Program MB/s (MB/s) | 673 | 889 32% | 426 -37% | 452.8 -33% | ||
| Copy Game MB/s (MB/s) | 1295 | 1218 -6% | 650 -50% | 755 -42% |
* ... mindre är bättre

| 3DMark 11 | |
| 1280x720 Performance GPU | |
| MSI RTX 2080 Gaming X Trio | |
| Genomsnitt NVIDIA GeForce RTX 2080 Mobile (31826 - 38809, n=17) | |
| MSI GE63 Raider 8SG | |
| Razer Blade Pro 17 4K UHD 120 Hz | |
| Asus Strix Scar III G531GW-AZ062T | |
| Walmart EVOO Gaming 17 | |
| Schenker XMG Neo 15 XNE15M19 | |
| Maingear Vector 15 | |
| Dell G3 3590 | |
| HP Pavilion Gaming 15-cx0003ng | |
| MSI GL62M 7RD-077 | |
| 1280x720 Performance Combined | |
| Genomsnitt NVIDIA GeForce RTX 2080 Mobile (9038 - 18934, n=17) | |
| MSI RTX 2080 Gaming X Trio | |
| Walmart EVOO Gaming 17 | |
| Razer Blade Pro 17 4K UHD 120 Hz | |
| Maingear Vector 15 | |
| Schenker XMG Neo 15 XNE15M19 | |
| Asus Strix Scar III G531GW-AZ062T | |
| MSI GE63 Raider 8SG | |
| Dell G3 3590 | |
| HP Pavilion Gaming 15-cx0003ng | |
| MSI GL62M 7RD-077 | |
| 3DMark 11 Performance | 20224 poäng | |
| 3DMark Cloud Gate Standard Score | 27465 poäng | |
| 3DMark Fire Strike Score | 18985 poäng | |
| 3DMark Time Spy Score | 8501 poäng | |
Hjälp | ||
| Shadow of the Tomb Raider | |
| 1280x720 Lowest Preset | |
| Eurocom Sky X4C i9-9900KS | |
| KFA2 GeForce RTX 2080 Ti EX | |
| Asus ROG Strix RTX 2080 OC | |
| Genomsnitt NVIDIA GeForce RTX 2080 Mobile (85 - 178, n=6) | |
| MSI GF65 9SD | |
| Walmart EVOO Gaming 17 | |
| Razer Blade Pro 17 4K UHD 120 Hz | |
| MSI GE75 8SG Raider | |
| Asus Strix Scar III G531GW-AZ062T | |
| Dell G3 3590 | |
| Acer Aspire 7 A715-72G-704Q | |
| MSI GE63 Raider 8SG | |
| Asus GL753VD | |
| 1920x1080 Highest Preset AA:T | |
| KFA2 GeForce RTX 2080 Ti EX | |
| Eurocom Sky X4C i9-9900KS | |
| Asus ROG Strix RTX 2080 OC | |
| Razer Blade Pro 17 4K UHD 120 Hz | |
| Genomsnitt NVIDIA GeForce RTX 2080 Mobile (69 - 124, n=7) | |
| MSI GE75 8SG Raider | |
| Walmart EVOO Gaming 17 | |
| Asus Strix Scar III G531GW-AZ062T | |
| Schenker XMG Fusion 15 XFU15L19 | |
| MSI GE63 Raider 8SG | |
| MSI GF65 9SD | |
| Acer Aspire 7 A715-72G-704Q | |
| Asus GL753VD | |
| The Witcher 3 | |
| 1920x1080 Ultra Graphics & Postprocessing (HBAO+) | |
| KFA2 GeForce RTX 2080 Ti EX | |
| Asus ROG Strix RTX 2080 OC | |
| Genomsnitt NVIDIA GeForce RTX 2080 Mobile (82.2 - 105, n=16) | |
| Eurocom Sky X4C i9-9900KS | |
| Razer Blade Pro 17 4K UHD 120 Hz | |
| MSI GE75 8SG Raider | |
| MSI GE63 Raider 8SG | |
| Asus Strix Scar III G531GW-AZ062T | |
| Walmart EVOO Gaming 17 | |
| Schenker XMG Fusion 15 XFU15L19 | |
| MSI GF65 9SD | |
| Dell G3 3590 | |
| Acer Aspire 7 A715-72G-704Q | |
| 1024x768 Low Graphics & Postprocessing | |
| Eurocom Sky X4C i9-9900KS | |
| KFA2 GeForce RTX 2080 Ti EX | |
| Razer Blade Pro 17 4K UHD 120 Hz | |
| Genomsnitt NVIDIA GeForce RTX 2080 Mobile (195.8 - 414, n=9) | |
| Asus ROG Strix RTX 2080 OC | |
| Walmart EVOO Gaming 17 | |
| MSI GF65 9SD | |
| MSI GE75 8SG Raider | |
| Asus Strix Scar III G531GW-AZ062T | |
| MSI GE63 Raider 8SG | |
| Dell G3 3590 | |
| Acer Aspire 7 A715-72G-704Q | |
| BioShock Infinite | |
| 1280x720 Very Low Preset | |
| Eurocom Sky X4C i9-9900KS | |
| KFA2 GeForce RTX 2080 Ti EX | |
| Genomsnitt NVIDIA GeForce RTX 2080 Mobile (240 - 528, n=6) | |
| Razer Blade Pro 17 4K UHD 120 Hz | |
| Walmart EVOO Gaming 17 | |
| MSI GF65 9SD | |
| Acer Aspire 7 A715-72G-704Q | |
| Dell G3 3590 | |
| MSI GE63 Raider 8SG | |
| 1920x1080 Ultra Preset, DX11 (DDOF) | |
| KFA2 GeForce RTX 2080 Ti EX | |
| Eurocom Sky X4C i9-9900KS | |
| Genomsnitt NVIDIA GeForce RTX 2080 Mobile (148.6 - 213, n=7) | |
| Razer Blade Pro 17 4K UHD 120 Hz | |
| Walmart EVOO Gaming 17 | |
| MSI GE63 Raider 8SG | |
| MSI GF65 9SD | |
| Dell G3 3590 | |
| Acer Aspire 7 A715-72G-704Q | |
| låg | med. | hög | ultra | |
|---|---|---|---|---|
| BioShock Infinite (2013) | 240.2 | 208.3 | 202 | 148.6 |
| The Witcher 3 (2015) | 195.8 | 157.5 | 126.1 | 82.2 |
| Shadow of the Tomb Raider (2018) | 85 | 73 | 69 | 69 |
| MSI GE63 Raider 8SG GeForce RTX 2080 Mobile, i7-8750H, WDC PC SN520 SDAPNUW-512G | MSI GL65 9SEK GeForce RTX 2060 Mobile, i7-9750H, WDC PC SN520 SDAPNUW-512G | Lenovo Legion Y740-15ICHg GeForce RTX 2070 Max-Q, i7-9750H, WDC PC SN520 SDAPMUW-128G | Dell G7 7590 GeForce RTX 2060 Mobile, i7-9750H, Toshiba BG3 KBG30ZMS256G | MSI GT63 Titan 8RG-046 GeForce GTX 1080 Mobile, i7-8750H, CUK Cyclone 500GB M.2 NVMe | MSI GE63 Raider RGB 8RF-008 GeForce GTX 1070 Mobile, i7-8750H, Samsung SSD PM871a MZNLN256HMHQ | |
|---|---|---|---|---|---|---|
| Noise | 0% | 8% | 6% | 8% | -0% | |
| av / miljö * (dB) | 28.5 | 28.1 1% | 30 -5% | 28.4 -0% | 28 2% | 30 -5% |
| Idle Minimum * (dB) | 33.9 | 31.4 7% | 31.3 8% | 29.5 13% | 31.4 7% | 30 12% |
| Idle Average * (dB) | 33.9 | 31.5 7% | 31.3 8% | 29.6 13% | 31.4 7% | 35 -3% |
| Idle Maximum * (dB) | 34.3 | 33.5 2% | 31.3 9% | 29.6 14% | 32.2 6% | 36 -5% |
| Load Average * (dB) | 39.5 | 49.3 -25% | 42 -6% | 45 -14% | 35.5 10% | 42 -6% |
| Witcher 3 ultra * (dB) | 56.2 | 51.3 9% | 42.1 25% | 51.5 8% | 47.6 15% | 54 4% |
| Load Maximum * (dB) | 57.2 | 58 -1% | 46.5 19% | 53 7% | 50.8 11% | 56 2% |
* ... mindre är bättre
Ljudnivå
| Låg belastning |
| 33.9 / 33.9 / 34.3 dB(A) |
| Hög belastning |
| 39.5 / 57.2 dB(A) |
 | ||
30 dB tyst 40 dB(A) hörbar 50 dB(A) högt ljud |
||
min: | ||
(+) Den maximala temperaturen på ovansidan är 39.8 °C / 104 F, jämfört med genomsnittet av 40.4 °C / 105 F , allt från 21.2 till 68.8 °C för klassen Gaming.
(±) Botten värms upp till maximalt 42.6 °C / 109 F, jämfört med genomsnittet av 43.2 °C / 110 F
(+) Vid tomgångsbruk är medeltemperaturen för ovansidan 20.5 °C / 69 F, jämfört med enhetsgenomsnittet på 33.9 °C / ### class_avg_f### F.
(+) När du spelar The Witcher 3 är medeltemperaturen för ovansidan 30.2 °C / 86 F, jämfört med enhetsgenomsnittet på 33.9 °C / ## #class_avg_f### F.
(+) Handledsstöden och pekplattan är kallare än hudtemperaturen med maximalt 27.4 °C / 81.3 F och är därför svala att ta på.
(±) Medeltemperaturen för handledsstödsområdet på liknande enheter var 28.8 °C / 83.8 F (+1.4 °C / 2.5 F).
MSI GE63 Raider 8SG ljudanalys
(+) | högtalare kan spela relativt högt (93.1 dB)
Bas 100 - 315 Hz
(±) | reducerad bas - i genomsnitt 8% lägre än medianen
(±) | linjäriteten för basen är genomsnittlig (7.4% delta till föregående frekvens)
Mellan 400 - 2000 Hz
(+) | balanserad mellan - endast 2.4% från medianen
(+) | mids är linjära (4.7% delta till föregående frekvens)
Högsta 2 - 16 kHz
(+) | balanserade toppar - endast 3.1% från medianen
(+) | toppar är linjära (5.5% delta till föregående frekvens)
Totalt 100 - 16 000 Hz
(+) | det totala ljudet är linjärt (11.3% skillnad mot median)
Jämfört med samma klass
» 8% av alla testade enheter i den här klassen var bättre, 3% liknande, 88% sämre
» Den bästa hade ett delta på 6%, genomsnittet var 18%, sämst var 132%
Jämfört med alla testade enheter
» 7% av alla testade enheter var bättre, 2% liknande, 91% sämre
» Den bästa hade ett delta på 4%, genomsnittet var 24%, sämst var 134%
Apple MacBook 12 (Early 2016) 1.1 GHz ljudanalys
(+) | högtalare kan spela relativt högt (83.6 dB)
Bas 100 - 315 Hz
(±) | reducerad bas - i genomsnitt 11.3% lägre än medianen
(±) | linjäriteten för basen är genomsnittlig (14.2% delta till föregående frekvens)
Mellan 400 - 2000 Hz
(+) | balanserad mellan - endast 2.4% från medianen
(+) | mids är linjära (5.5% delta till föregående frekvens)
Högsta 2 - 16 kHz
(+) | balanserade toppar - endast 2% från medianen
(+) | toppar är linjära (4.5% delta till föregående frekvens)
Totalt 100 - 16 000 Hz
(+) | det totala ljudet är linjärt (10.2% skillnad mot median)
Jämfört med samma klass
» 7% av alla testade enheter i den här klassen var bättre, 2% liknande, 91% sämre
» Den bästa hade ett delta på 5%, genomsnittet var 18%, sämst var 53%
Jämfört med alla testade enheter
» 5% av alla testade enheter var bättre, 1% liknande, 94% sämre
» Den bästa hade ett delta på 4%, genomsnittet var 24%, sämst var 134%
| Av/Standby | |
| Låg belastning | |
| Hög belastning |
|
Förklaring:
min: | |
| MSI GE63 Raider 8SG i7-8750H, GeForce RTX 2080 Mobile, WDC PC SN520 SDAPNUW-512G, IPS, 1920x1080, 15.6" | MSI GL65 9SEK i7-9750H, GeForce RTX 2060 Mobile, WDC PC SN520 SDAPNUW-512G, IPS, 1920x1080, 15.6" | Lenovo Legion Y740-15ICHg i7-9750H, GeForce RTX 2070 Max-Q, WDC PC SN520 SDAPMUW-128G, IPS, 1920x1080, 15.6" | MSI GT63 Titan 8RG-046 i7-8750H, GeForce GTX 1080 Mobile, CUK Cyclone 500GB M.2 NVMe, TN, 1920x1080, 15.6" | Asus Strix Scar III G531GW-AZ062T i7-9750H, GeForce RTX 2070 Mobile, Intel SSD 660p SSDPEKNW512G8, IPS, 1920x1080, 15.6" | MSI GE63 Raider RGB 8RF-008 i7-8750H, GeForce GTX 1070 Mobile, Samsung SSD PM871a MZNLN256HMHQ, TN, 1920x1080, 15.6" | |
|---|---|---|---|---|---|---|
| Power Consumption | -26% | 14% | -3% | 31% | 34% | |
| Idle Minimum * (Watt) | 16 | 41 -156% | 22.2 -39% | 26.4 -65% | 11.4 29% | 9 44% |
| Idle Average * (Watt) | 22.8 | 45.3 -99% | 24.9 -9% | 30 -32% | 13.5 41% | 14 39% |
| Idle Maximum * (Watt) | 69.4 | 47.1 32% | 30.6 56% | 30.6 56% | 21.6 69% | 19 73% |
| Load Average * (Watt) | 107 | 94.9 11% | 101 6% | 90.4 16% | 106 1% | 91 15% |
| Witcher 3 ultra * (Watt) | 243.2 | 149.4 39% | 143 41% | 255.6 -5% | 186 24% | 182 25% |
| Load Maximum * (Watt) | 256.9 | 214.2 17% | 186 28% | 224.4 13% | 196 24% | 238 7% |
* ... mindre är bättre
| MSI GE63 Raider 8SG i7-8750H, GeForce RTX 2080 Mobile, 51 Wh | MSI GL65 9SEK i7-9750H, GeForce RTX 2060 Mobile, 51 Wh | Lenovo Legion Y740-15ICHg i7-9750H, GeForce RTX 2070 Max-Q, 57 Wh | MSI GT63 Titan 8RG-046 i7-8750H, GeForce GTX 1080 Mobile, 75.24 Wh | Asus Strix Scar III G531GW-AZ062T i7-9750H, GeForce RTX 2070 Mobile, 66 Wh | MSI GE63 Raider RGB 8RF-008 i7-8750H, GeForce GTX 1070 Mobile, 51 Wh | |
|---|---|---|---|---|---|---|
| Batteridrifttid | -3% | -25% | -20% | 40% | -3% | |
| Reader / Idle (h) | 6.2 | 4.4 -29% | 5.7 -8% | |||
| WiFi v1.3 (h) | 4 | 3.8 -5% | 3 -25% | 3.2 -20% | 5.6 40% | 4 0% |
| Load (h) | 0.8 | 1 25% | 0.8 0% |
För
Emot

Läs den fullständiga versionen av den här recensionen på engelska här.
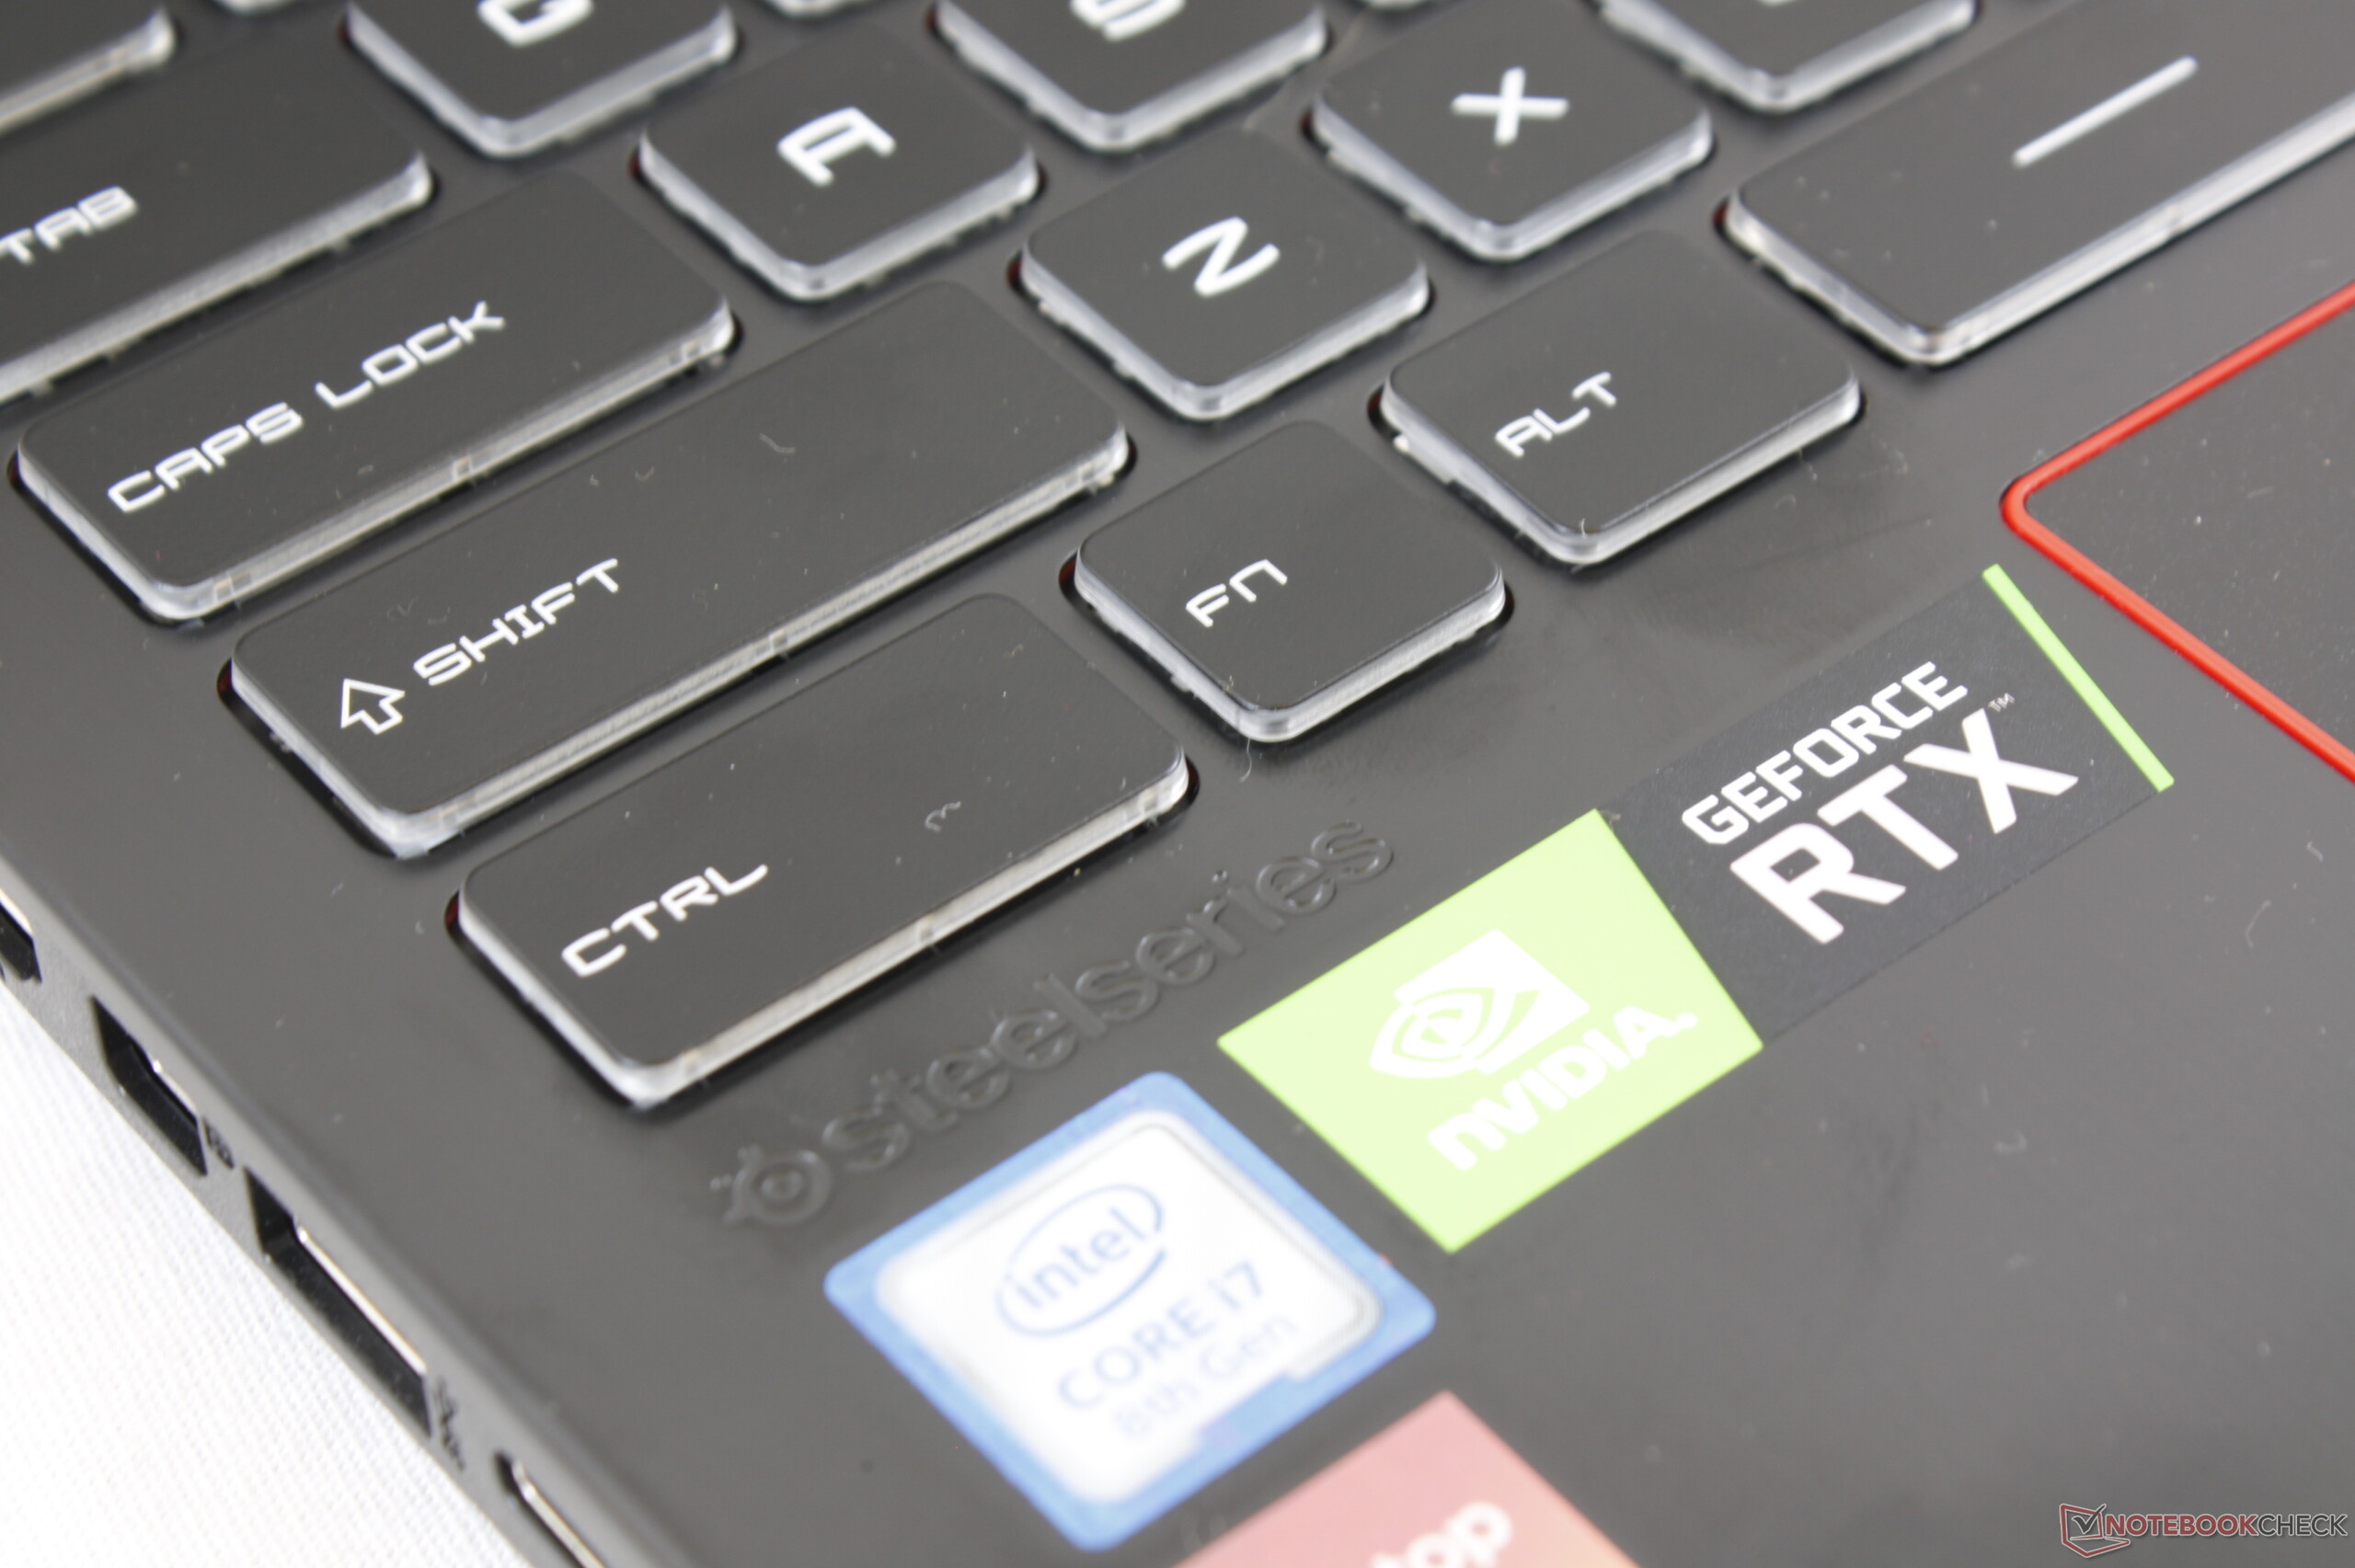
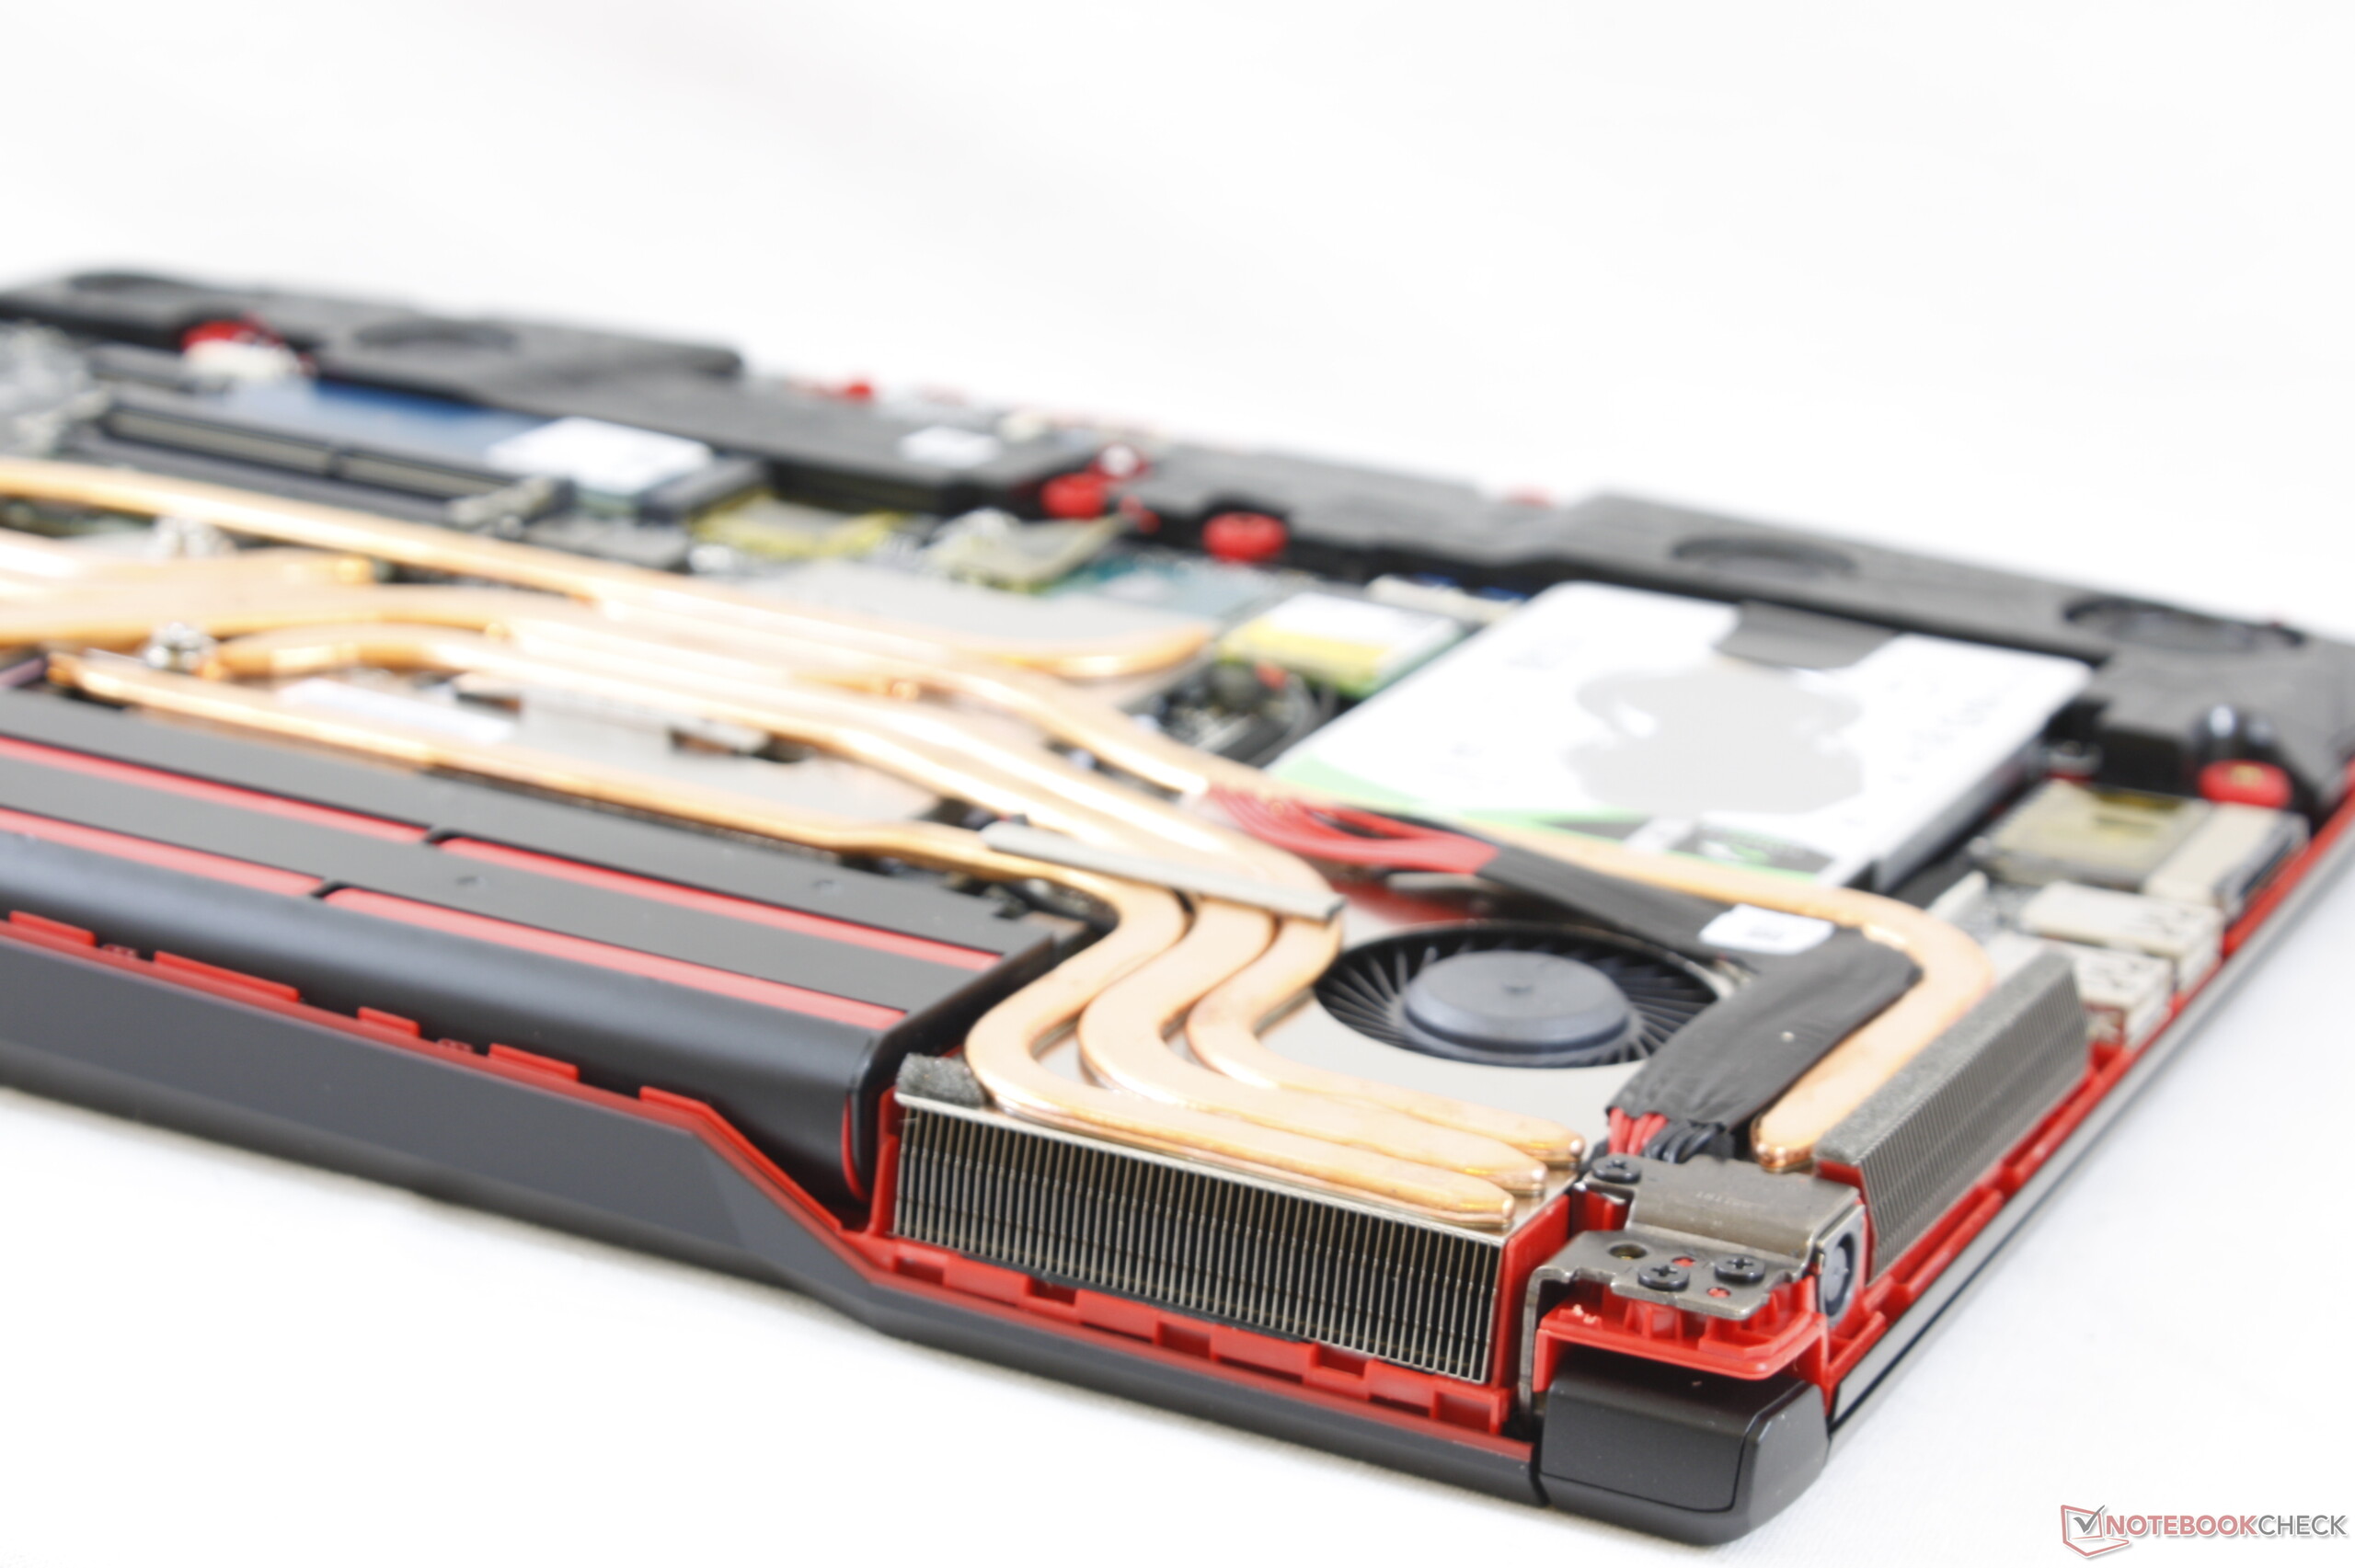
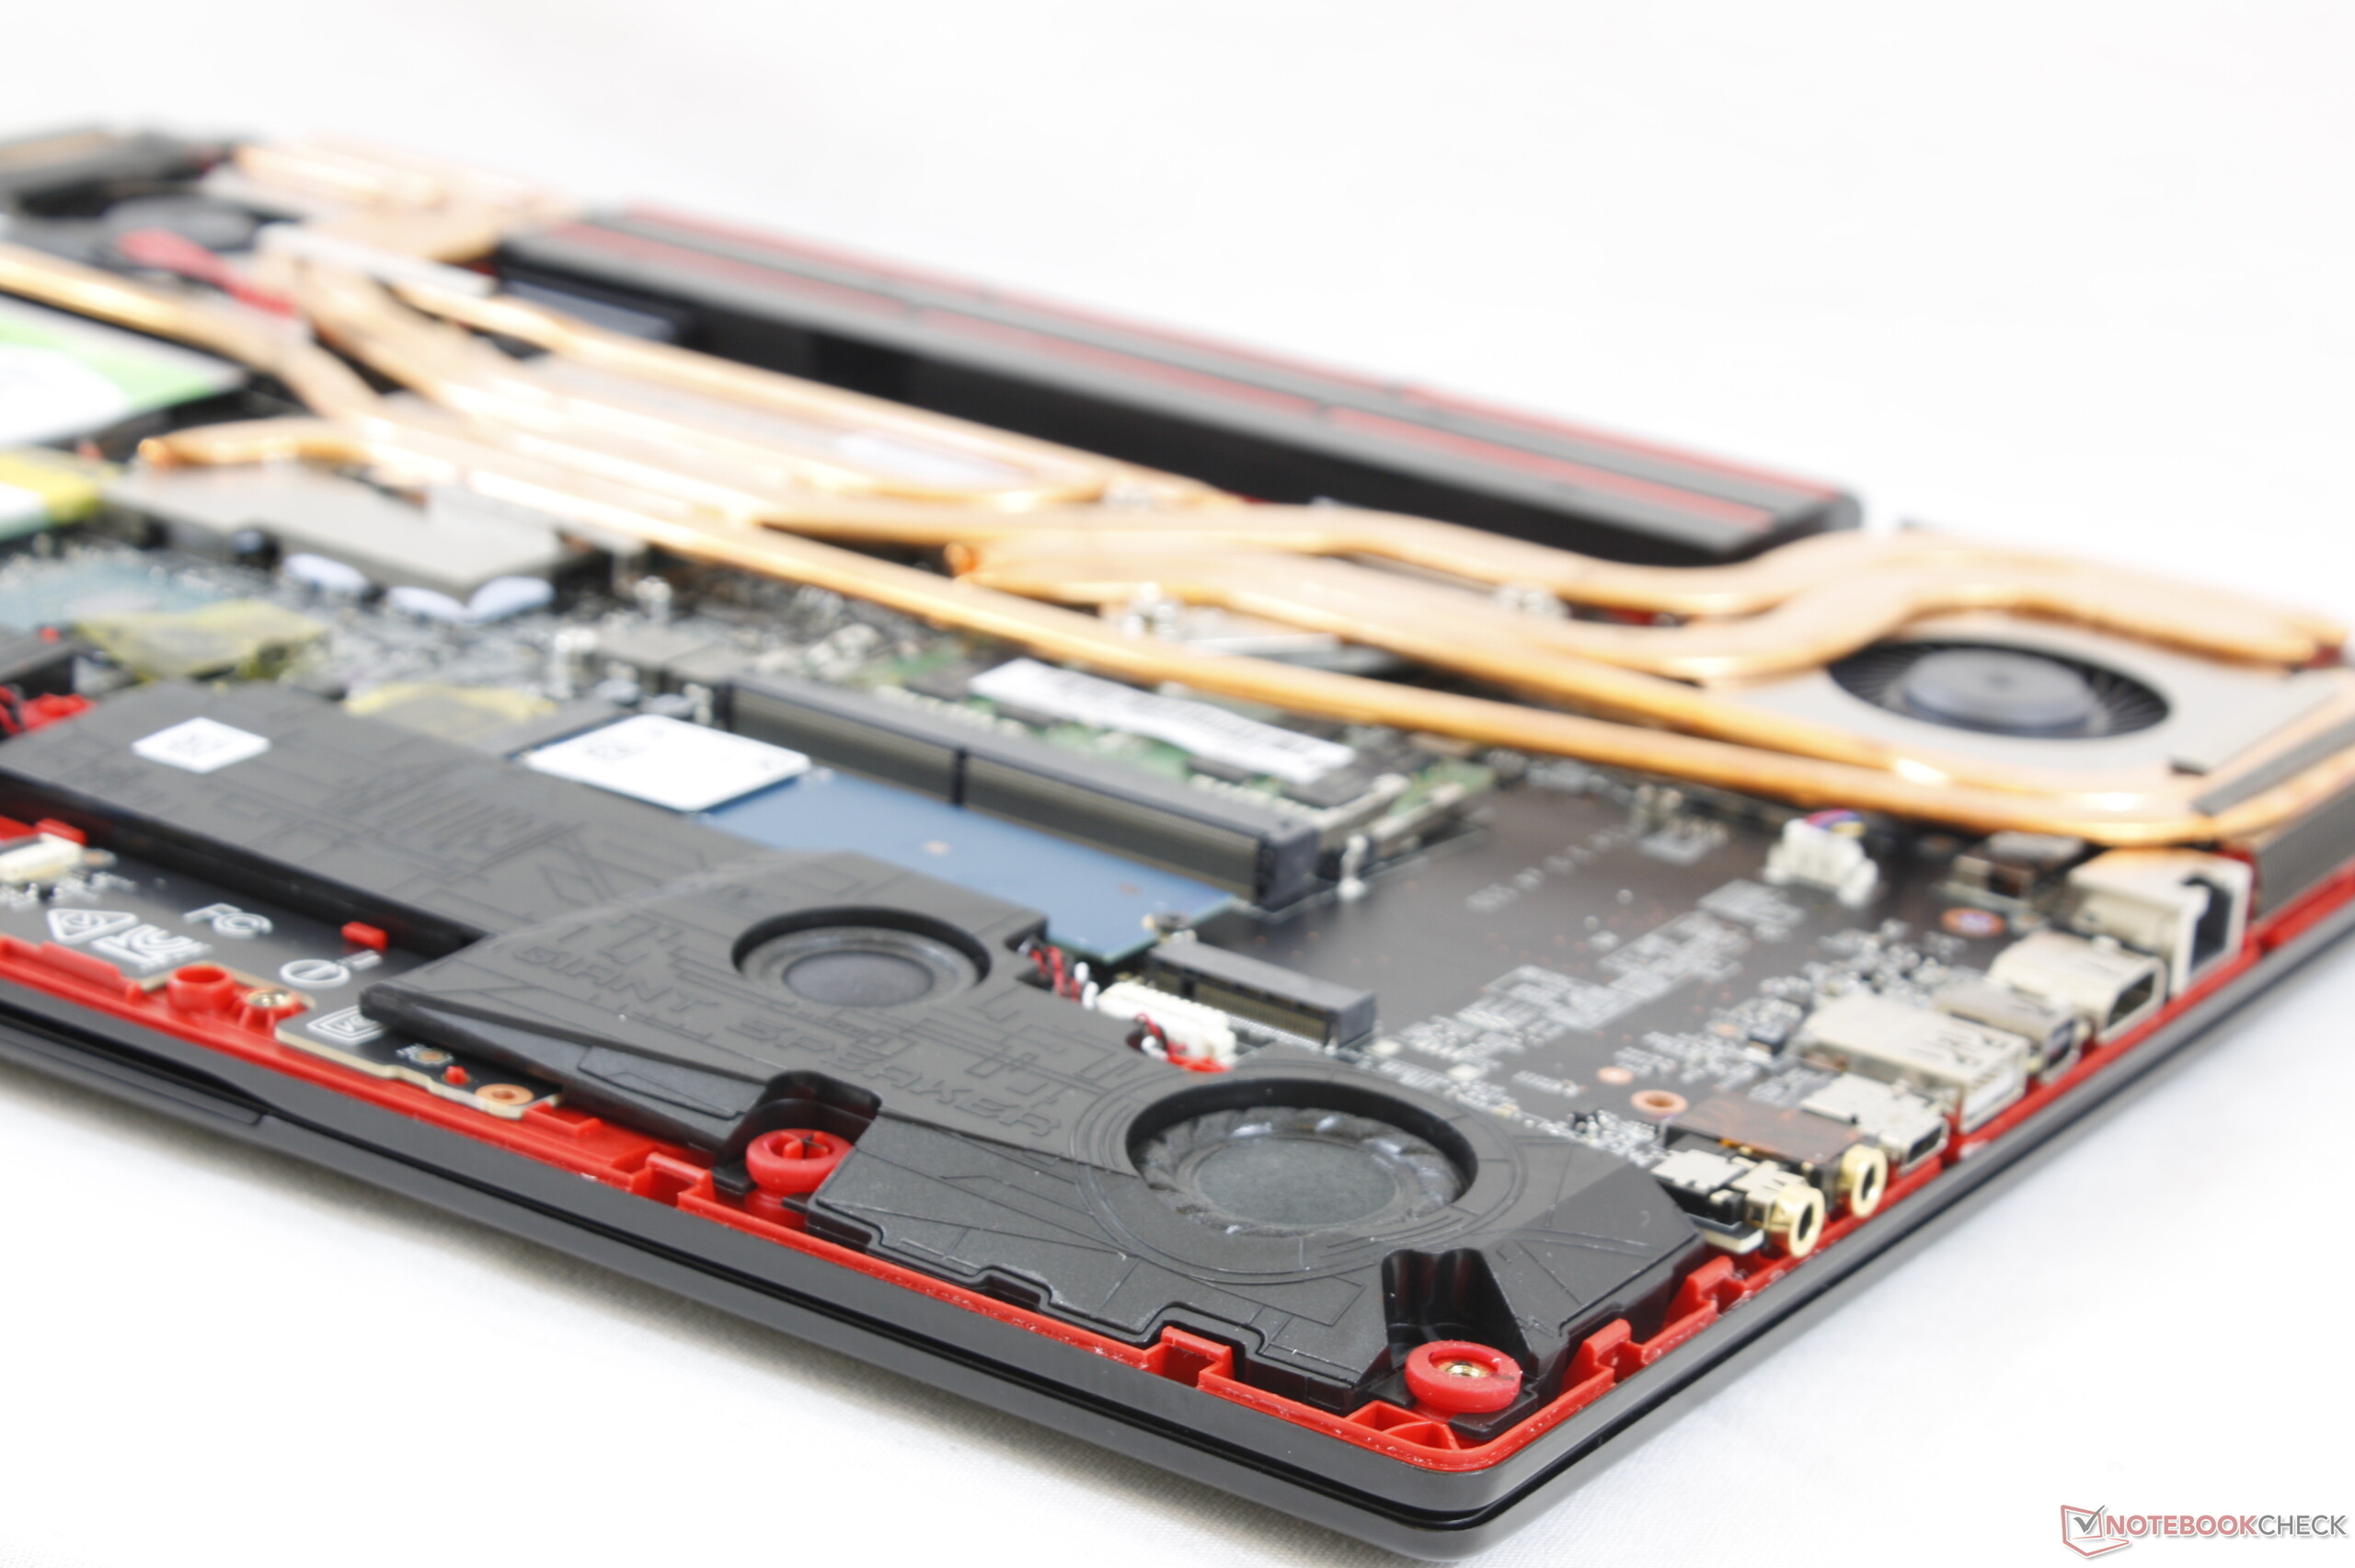
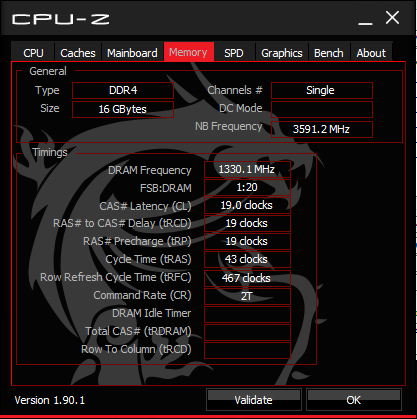
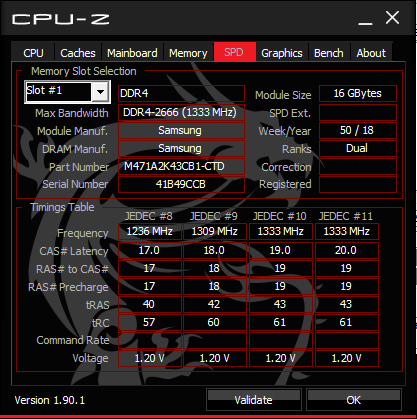
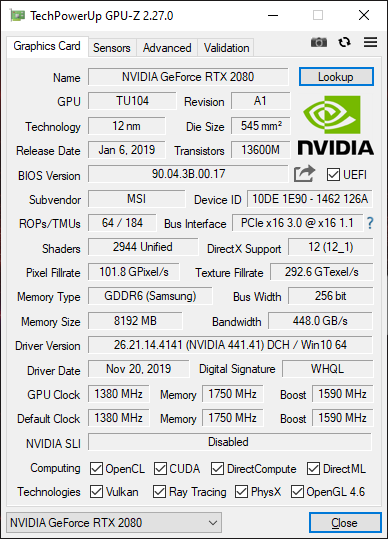
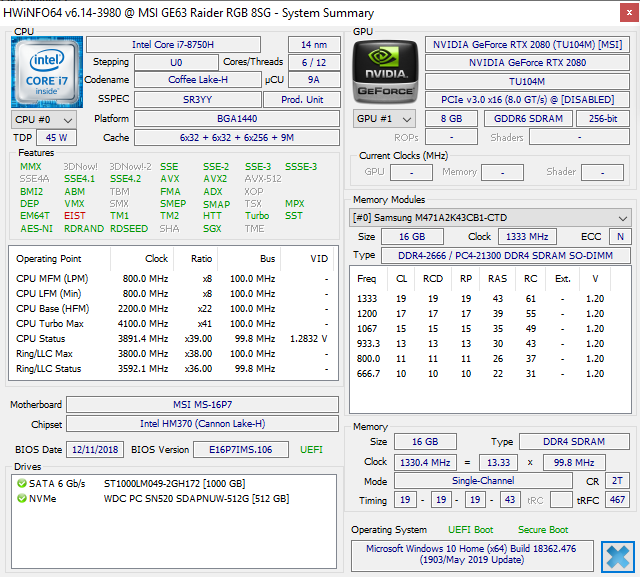
Vår specifika konfiguration av GE63 är en blandad kompott. Även om GPU-prestandan i 3DMark är utmärkt är både medelmåttig CPU-prestanda och enkelkanals-RAM flaskhalsar på en i övrigt kraftfull spellaptop. Bilduppdateringen i spel är lägre än förväntat så vi rekommenderar verkligen att du utrustar den med RAM i dubbla kanaler om möjligt. Vill du uppgradera RAM eller lagring själv behöver du dock riva isär ett fabriksförseglingsmärke.
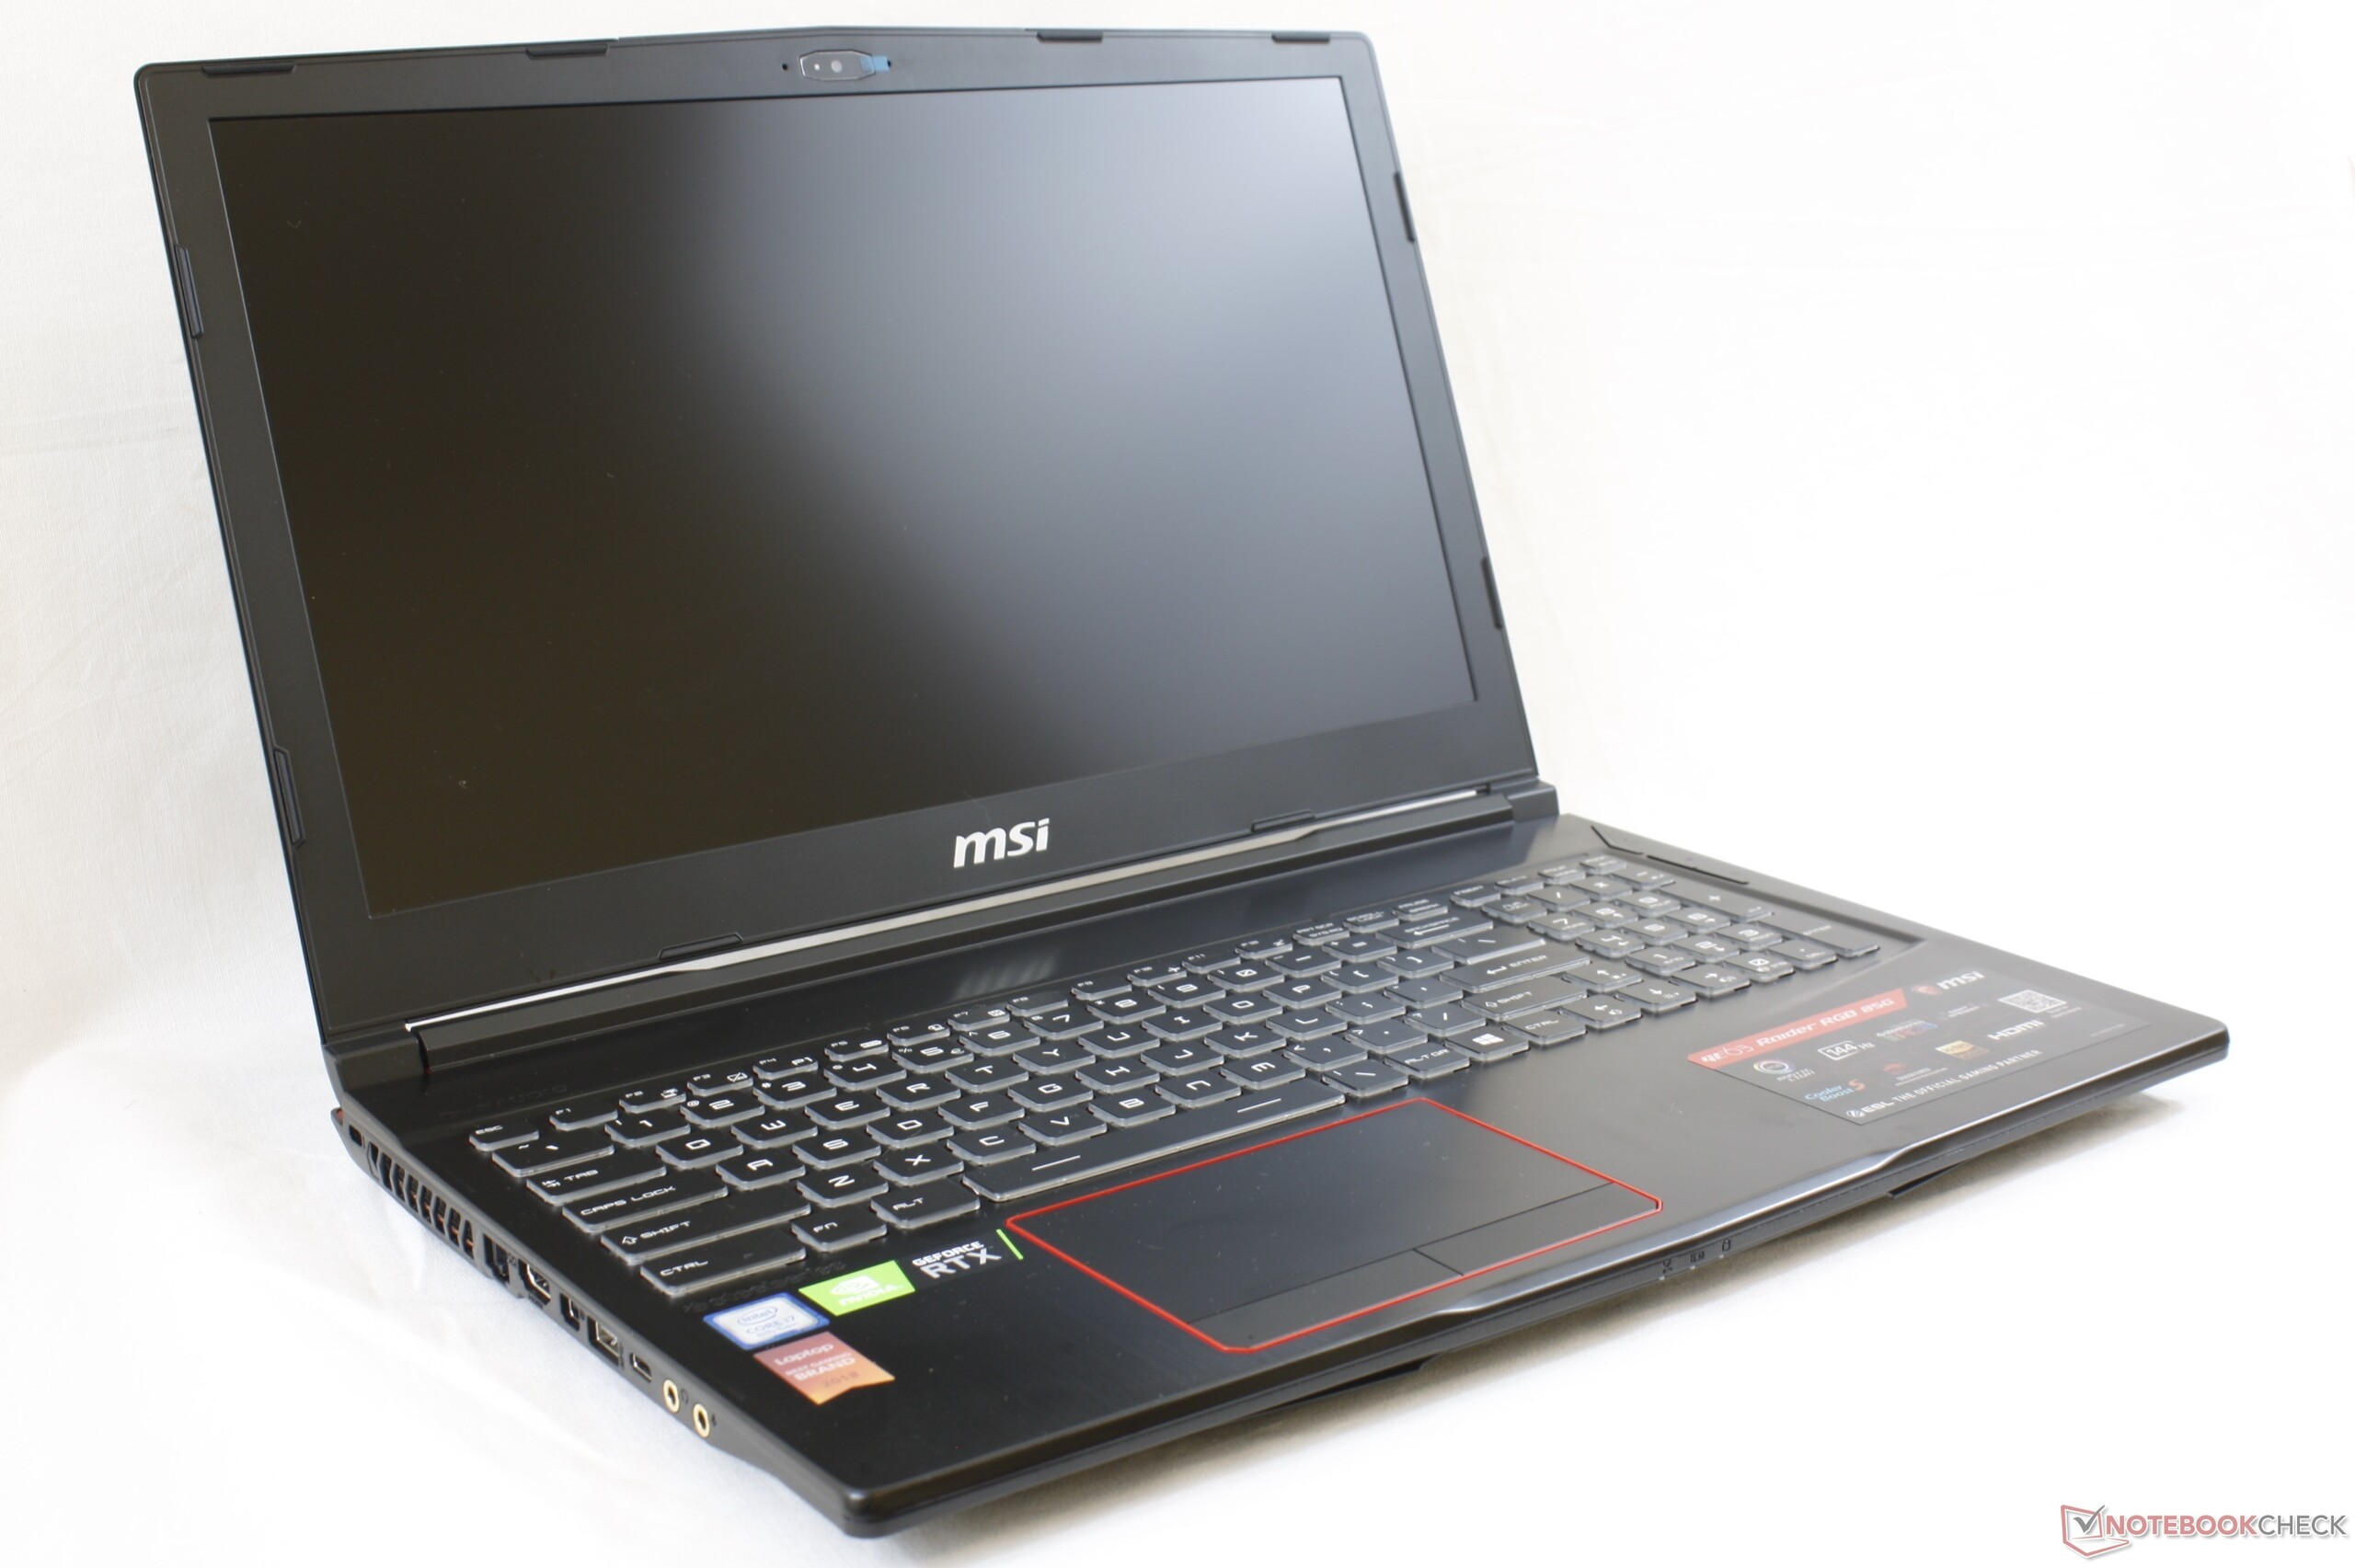
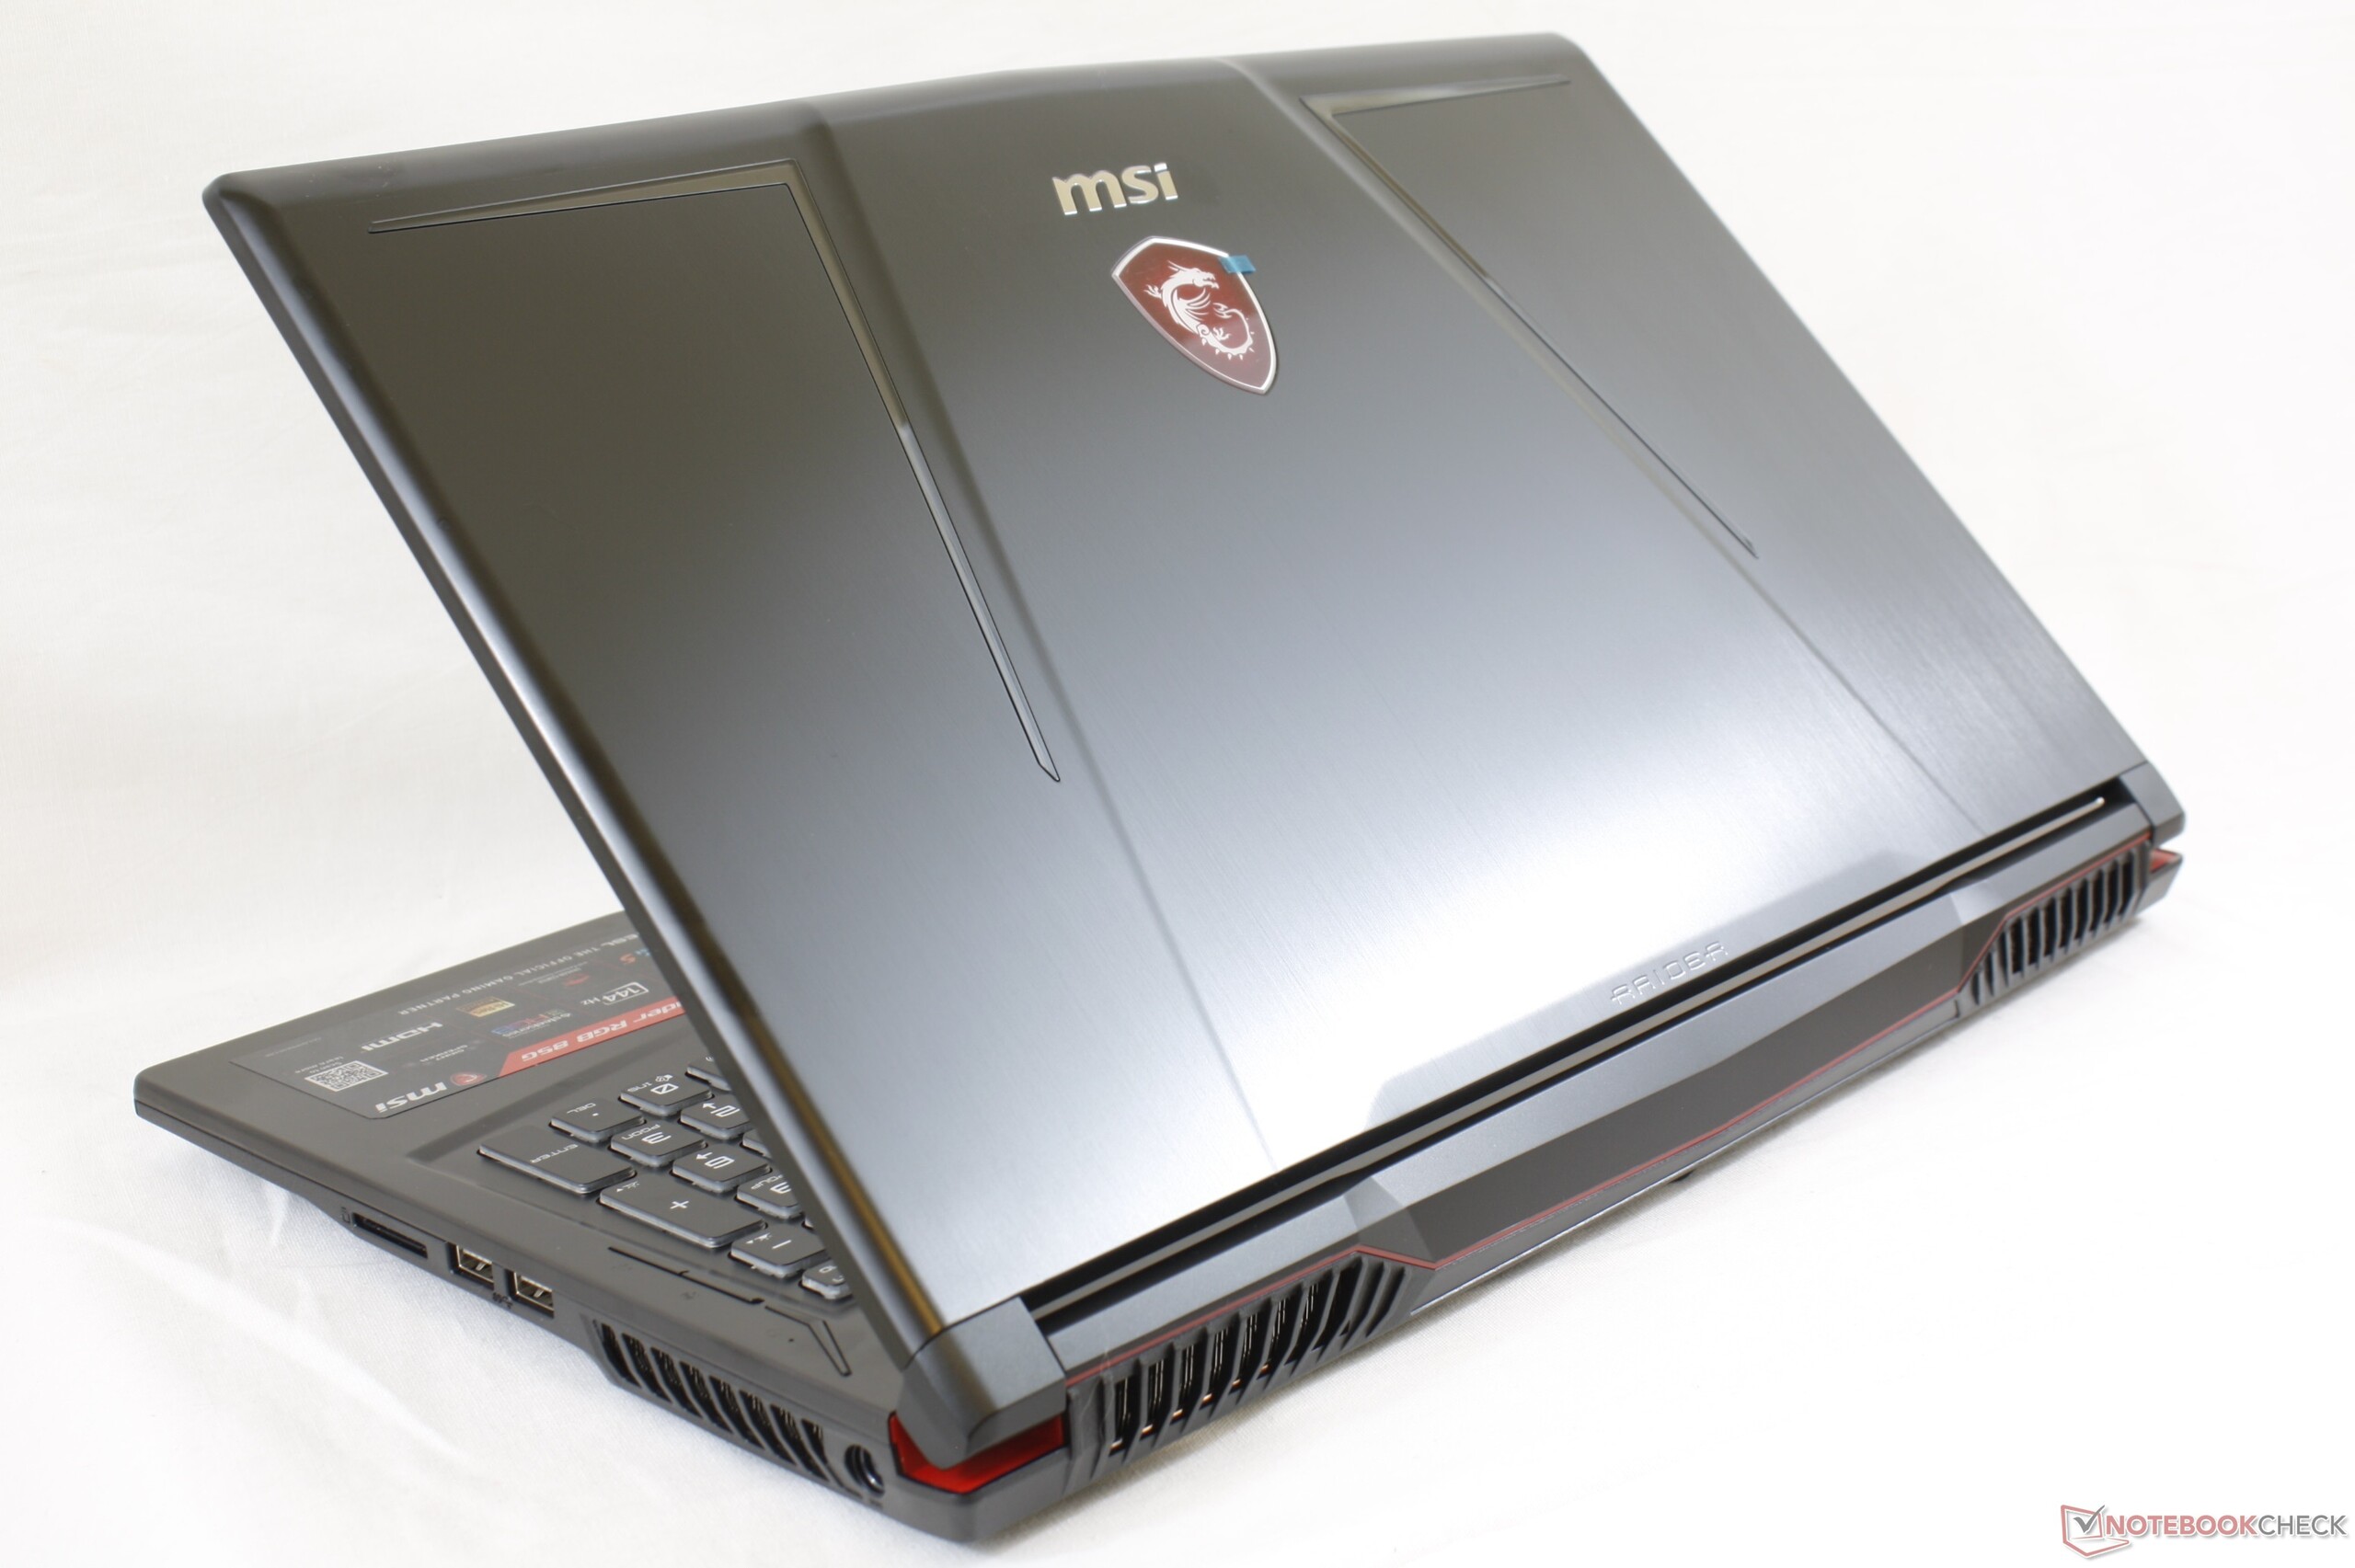
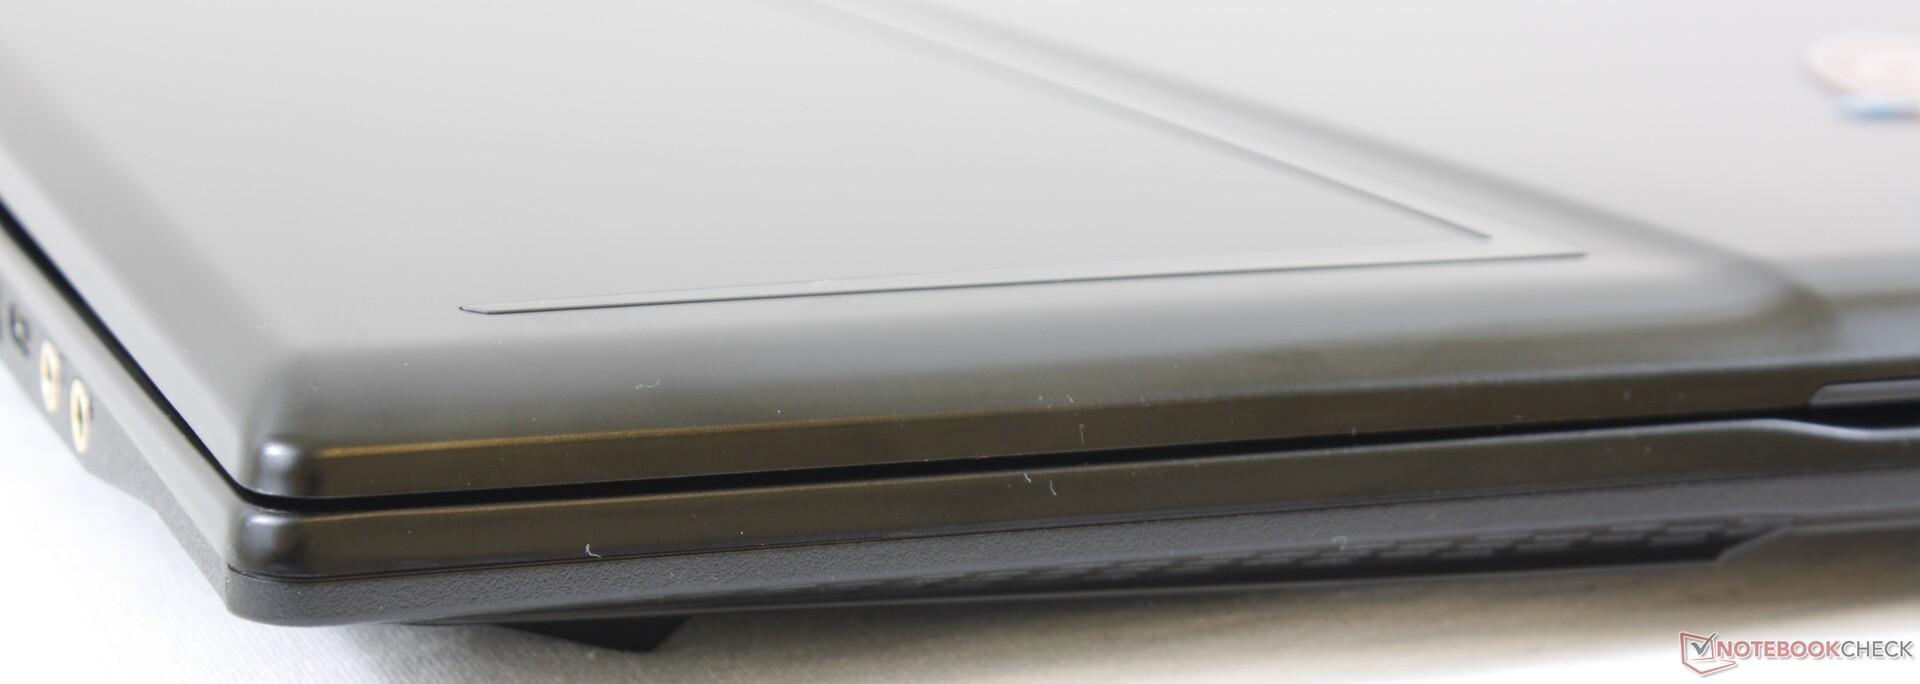
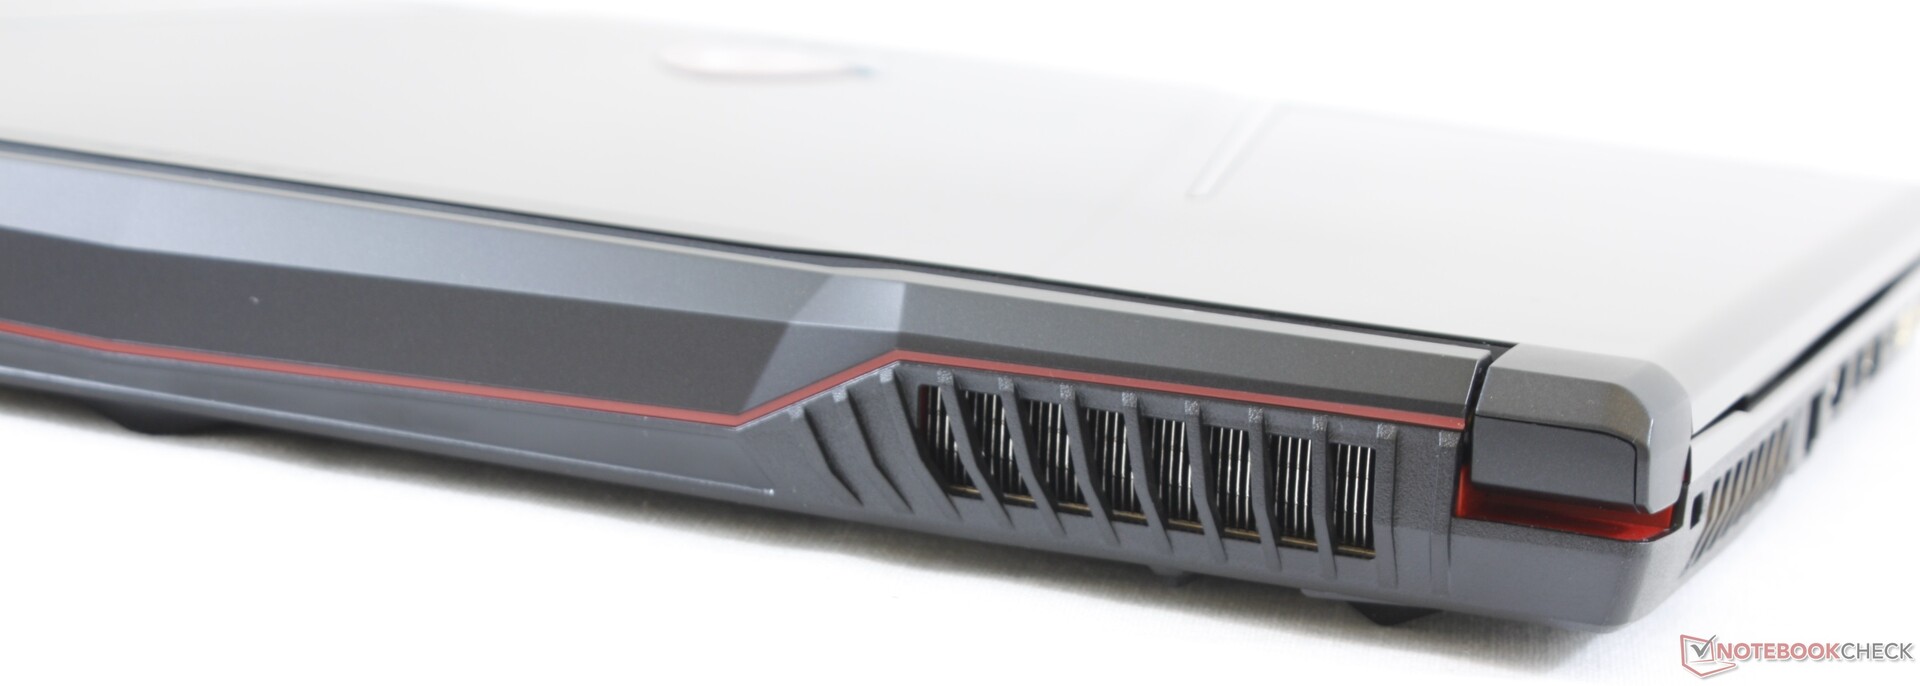
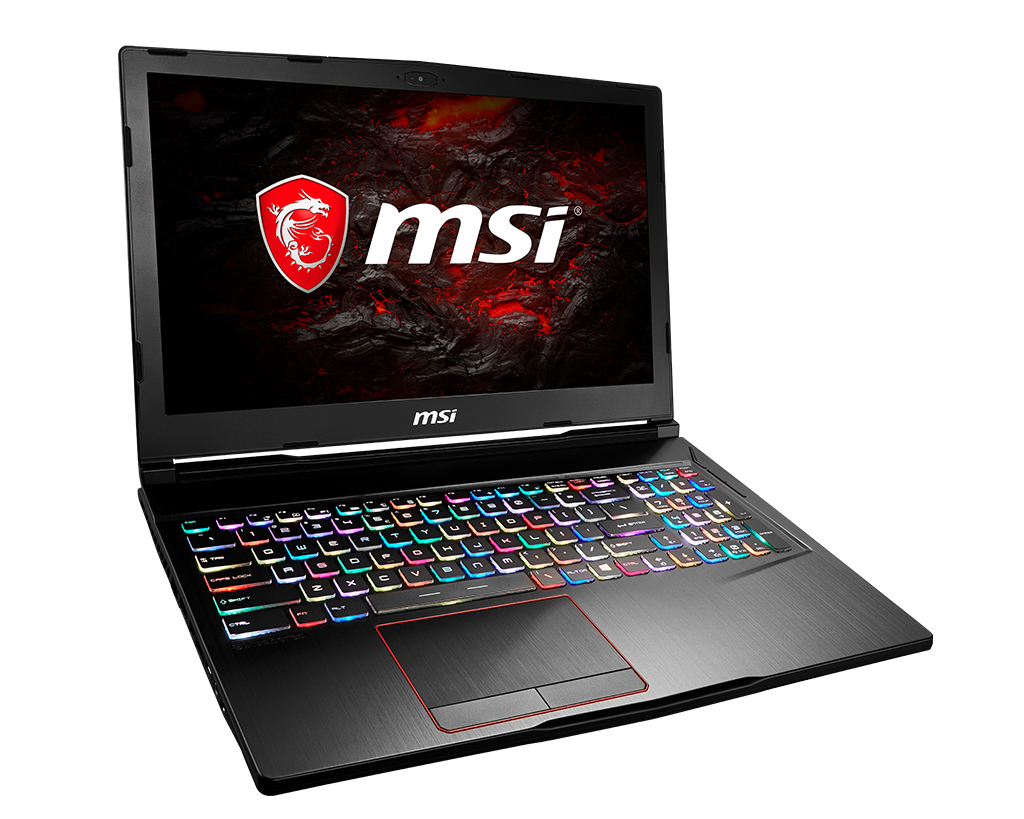
Bortsett från de större bristerna ovan är GE63 troligen ett av de bättre erbjudandena du kan hitta med en fullfjädrad (d.v.s. ej Max-Q) GeForce RTX 2080 GPU. Designen på det här specifika chassit börjar nå slutet av sin karriär även om skärmen, tangentbordet med tangentspecifik RGB-belysning och GPU:n alla är lika bra eller bättre än på de flesta nyare modeller. Det är dessutom en av få bärbara speldatorer på 15.6 tum utanför Clevo som har tre alternativ för intern lagring, så det går verkligen att maximera lagringskapaciteten.
Om du kan konfigurera den med RAM i dubbla kanaler och klarar av att fläktarna låter högt när du spelar är MSI GE63 en relativt billig väg till mobil GeForce RTX 2080-grafik. Du blir utan tjusig tunn infattning och låg vikt vilket nyare laptopdesigner kan erbjuda, men GE63 kommer inte kännas ömtålig att hålla i eller bära runt på.
MSI GE63 Raider 8SG
- 12/03/2019 v7 (old)
Allen Ngo
Price comparison
