Test: Asus ROG Mothership GZ700GX - Från en annan värld (Sammanfattning)
Gradering | Datum | Modell | Vikt | Höjd | Storlek | Upplösning | Pris |
|---|---|---|---|---|---|---|---|
| 84.7 % v7 (old) | 12/2019 | Asus ROG Mothership GZ700GX i9-9980HK, GeForce RTX 2080 Mobile | 4.8 kg | 30 mm | 17.30" | 1920x1080 | |
| 85.8 % v7 (old) | Asus ROG G703GXR i7-9750H, GeForce RTX 2080 Mobile | 4.7 kg | 48 mm | 17.30" | 1920x1080 | ||
| 85.1 % v7 (old) | 08/2019 | HP Omen 17-cb0020ng i9-9880H, GeForce RTX 2080 Mobile | 3.3 kg | 27 mm | 17.30" | 1920x1080 | |
| 86.1 % v7 (old) | 05/2019 | MSI GE75 9SG i9-9880H, GeForce RTX 2080 Mobile | 2.7 kg | 27.5 mm | 17.30" | 1920x1080 | |
| 85.5 % v7 (old) | 07/2019 | MSI GT76 Titan DT 9SG i9-9900K, GeForce RTX 2080 Mobile | 4.2 kg | 42 mm | 17.30" | 1920x1080 | |
| 85.8 % v7 (old) | 03/2019 | Alienware Area-51m i9-9900K RTX 2080 i9-9900K, GeForce RTX 2080 Mobile | 3.9 kg | 42 mm | 17.30" | 1920x1080 |
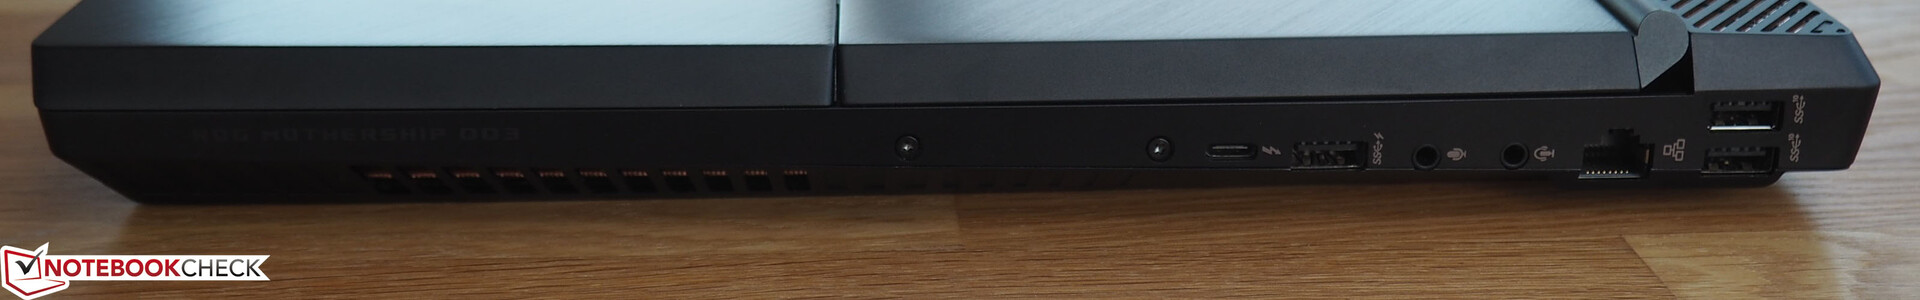
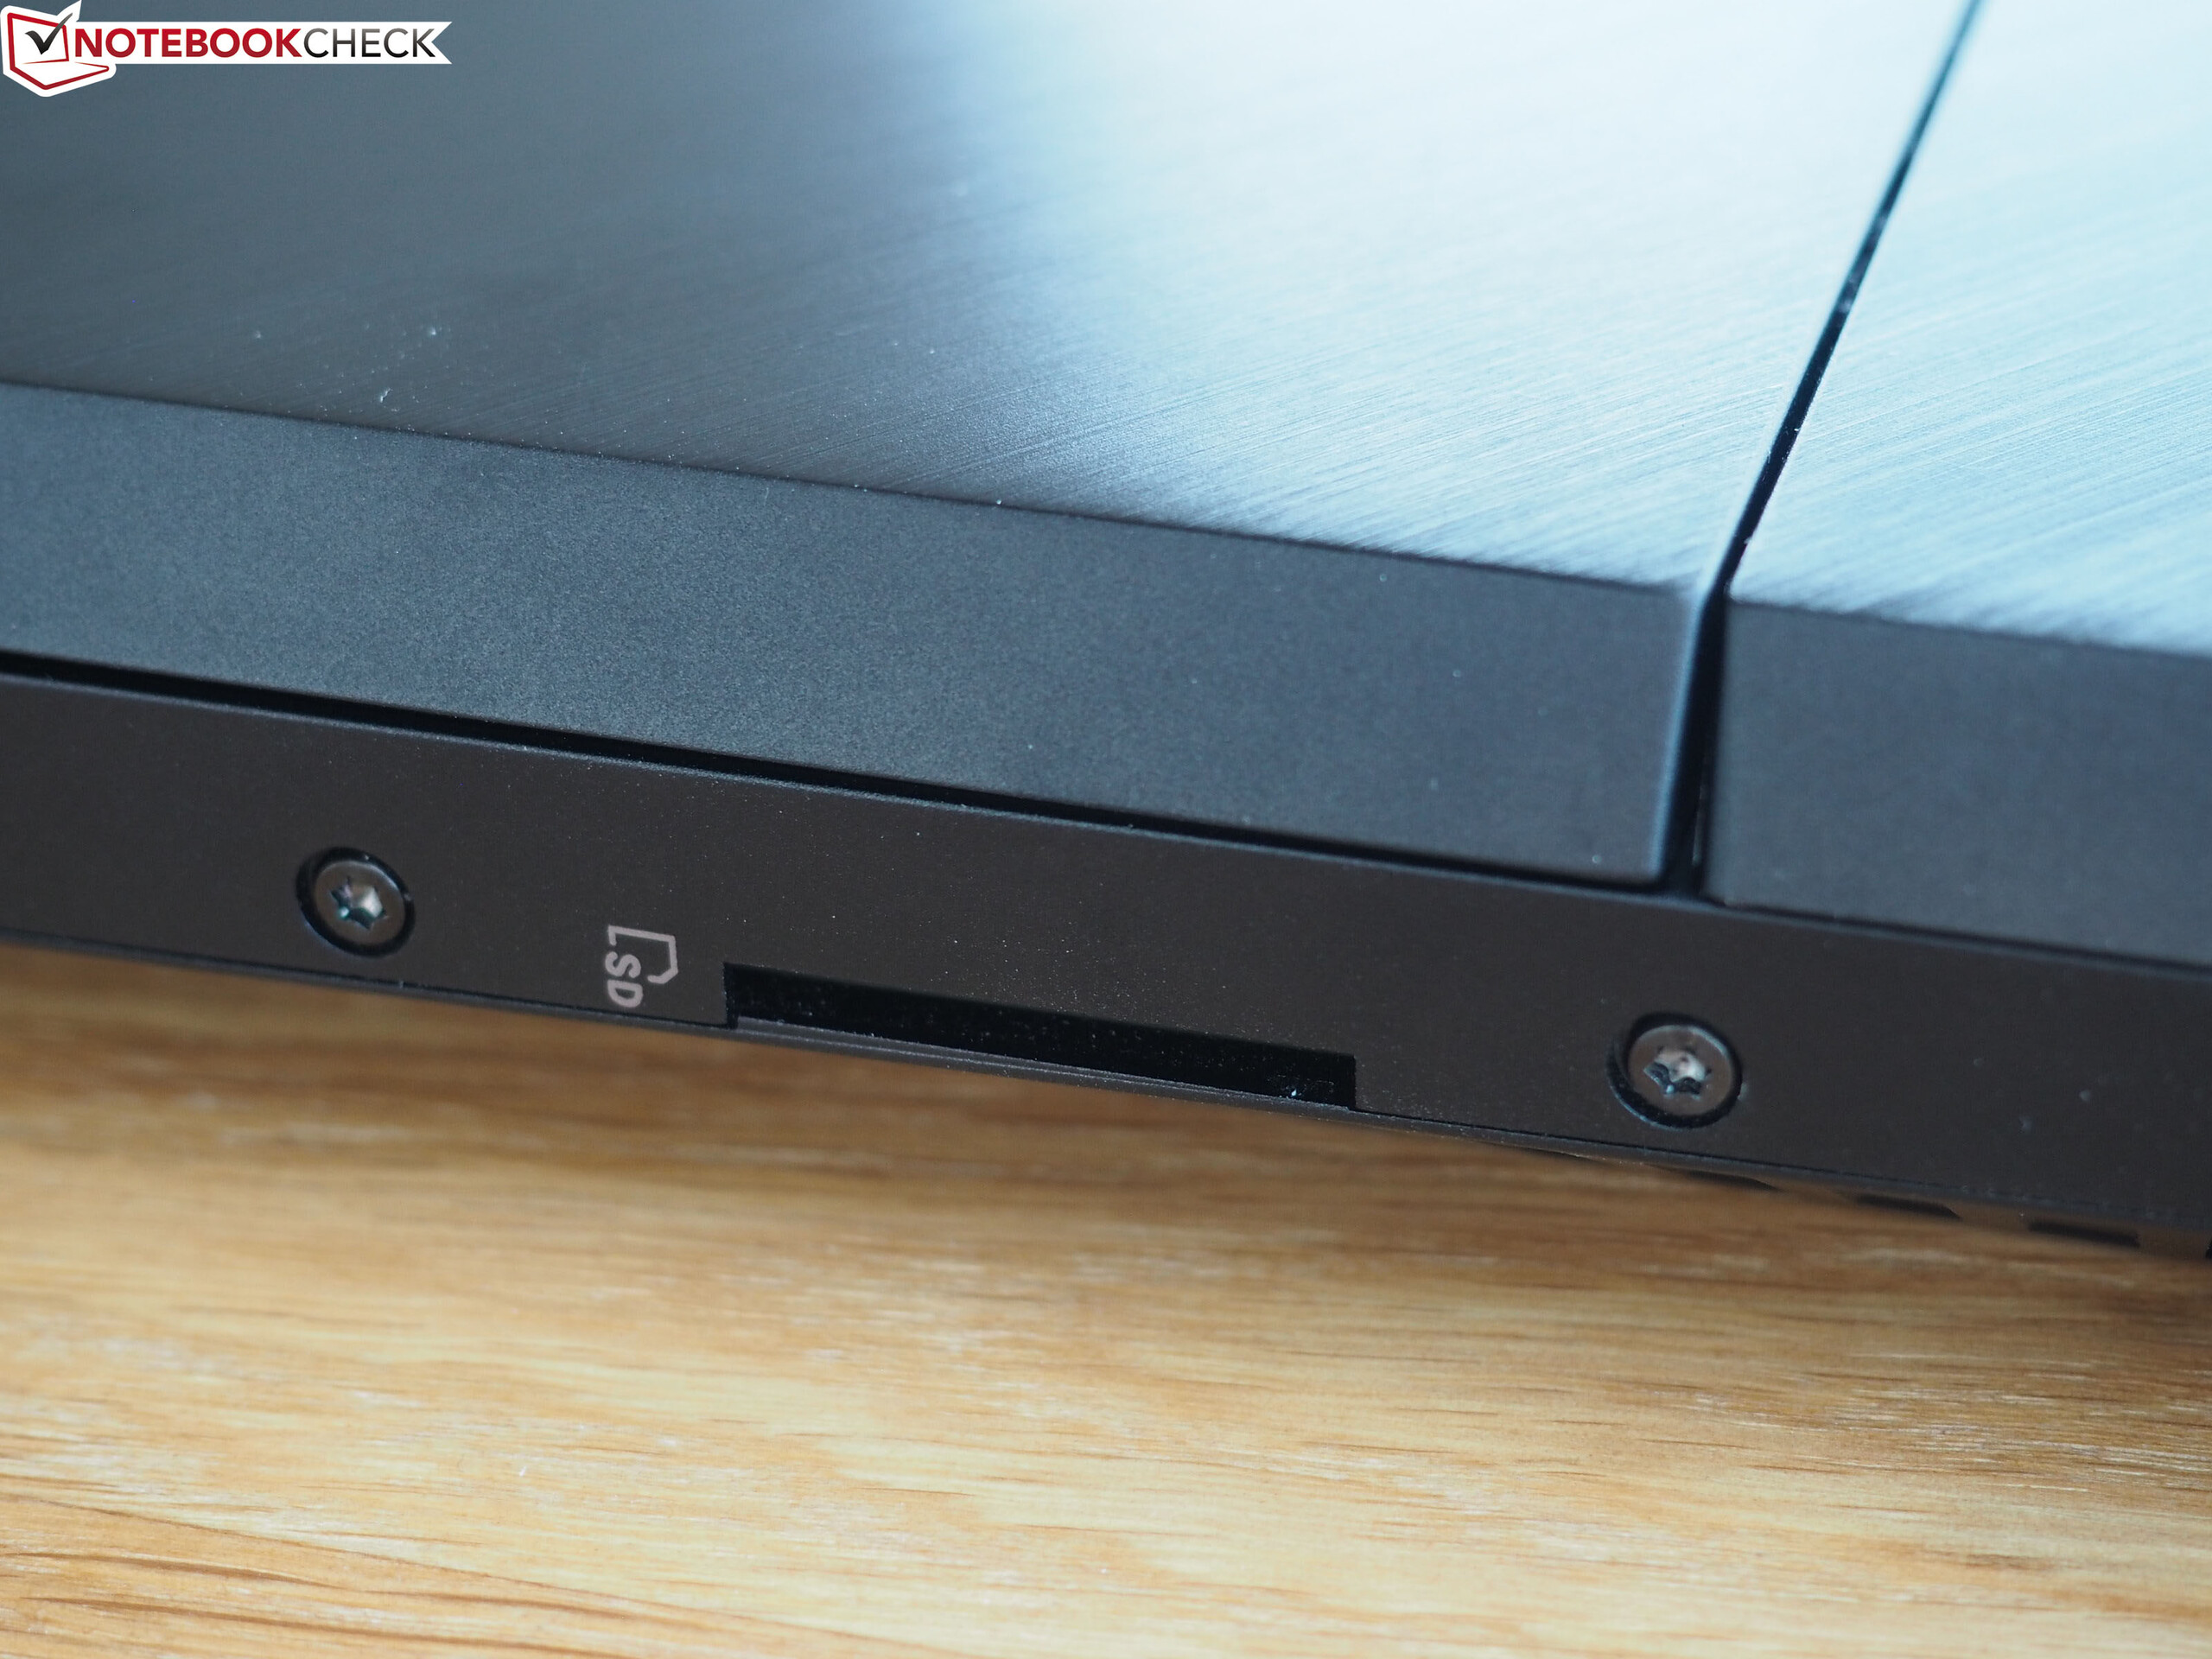
| SD Card Reader | |
| average JPG Copy Test (av. of 3 runs) | |
| Asus ROG G703GXR (Toshiba Exceria Pro SDXC 64 GB UHS-II) | |
| Genomsnitt av klass Gaming (20.9 - 210, n=55, senaste 2 åren) | |
| Asus ROG Mothership GZ700GX (Toshiba Exceria Pro SDXC 64 GB UHS-II) | |
| HP Omen 17-cb0020ng (Toshiba Exceria Pro SDXC 64 GB UHS-II) | |
| MSI GE75 9SG (Toshiba Exceria Pro SDXC 64 GB UHS-II) | |
| maximum AS SSD Seq Read Test (1GB) | |
| Asus ROG G703GXR (Toshiba Exceria Pro SDXC 64 GB UHS-II) | |
| Genomsnitt av klass Gaming (25.5 - 261, n=52, senaste 2 åren) | |
| Asus ROG Mothership GZ700GX (Toshiba Exceria Pro SDXC 64 GB UHS-II) | |
| HP Omen 17-cb0020ng (Toshiba Exceria Pro SDXC 64 GB UHS-II) | |
| MSI GE75 9SG (Toshiba Exceria Pro SDXC 64 GB UHS-II) | |
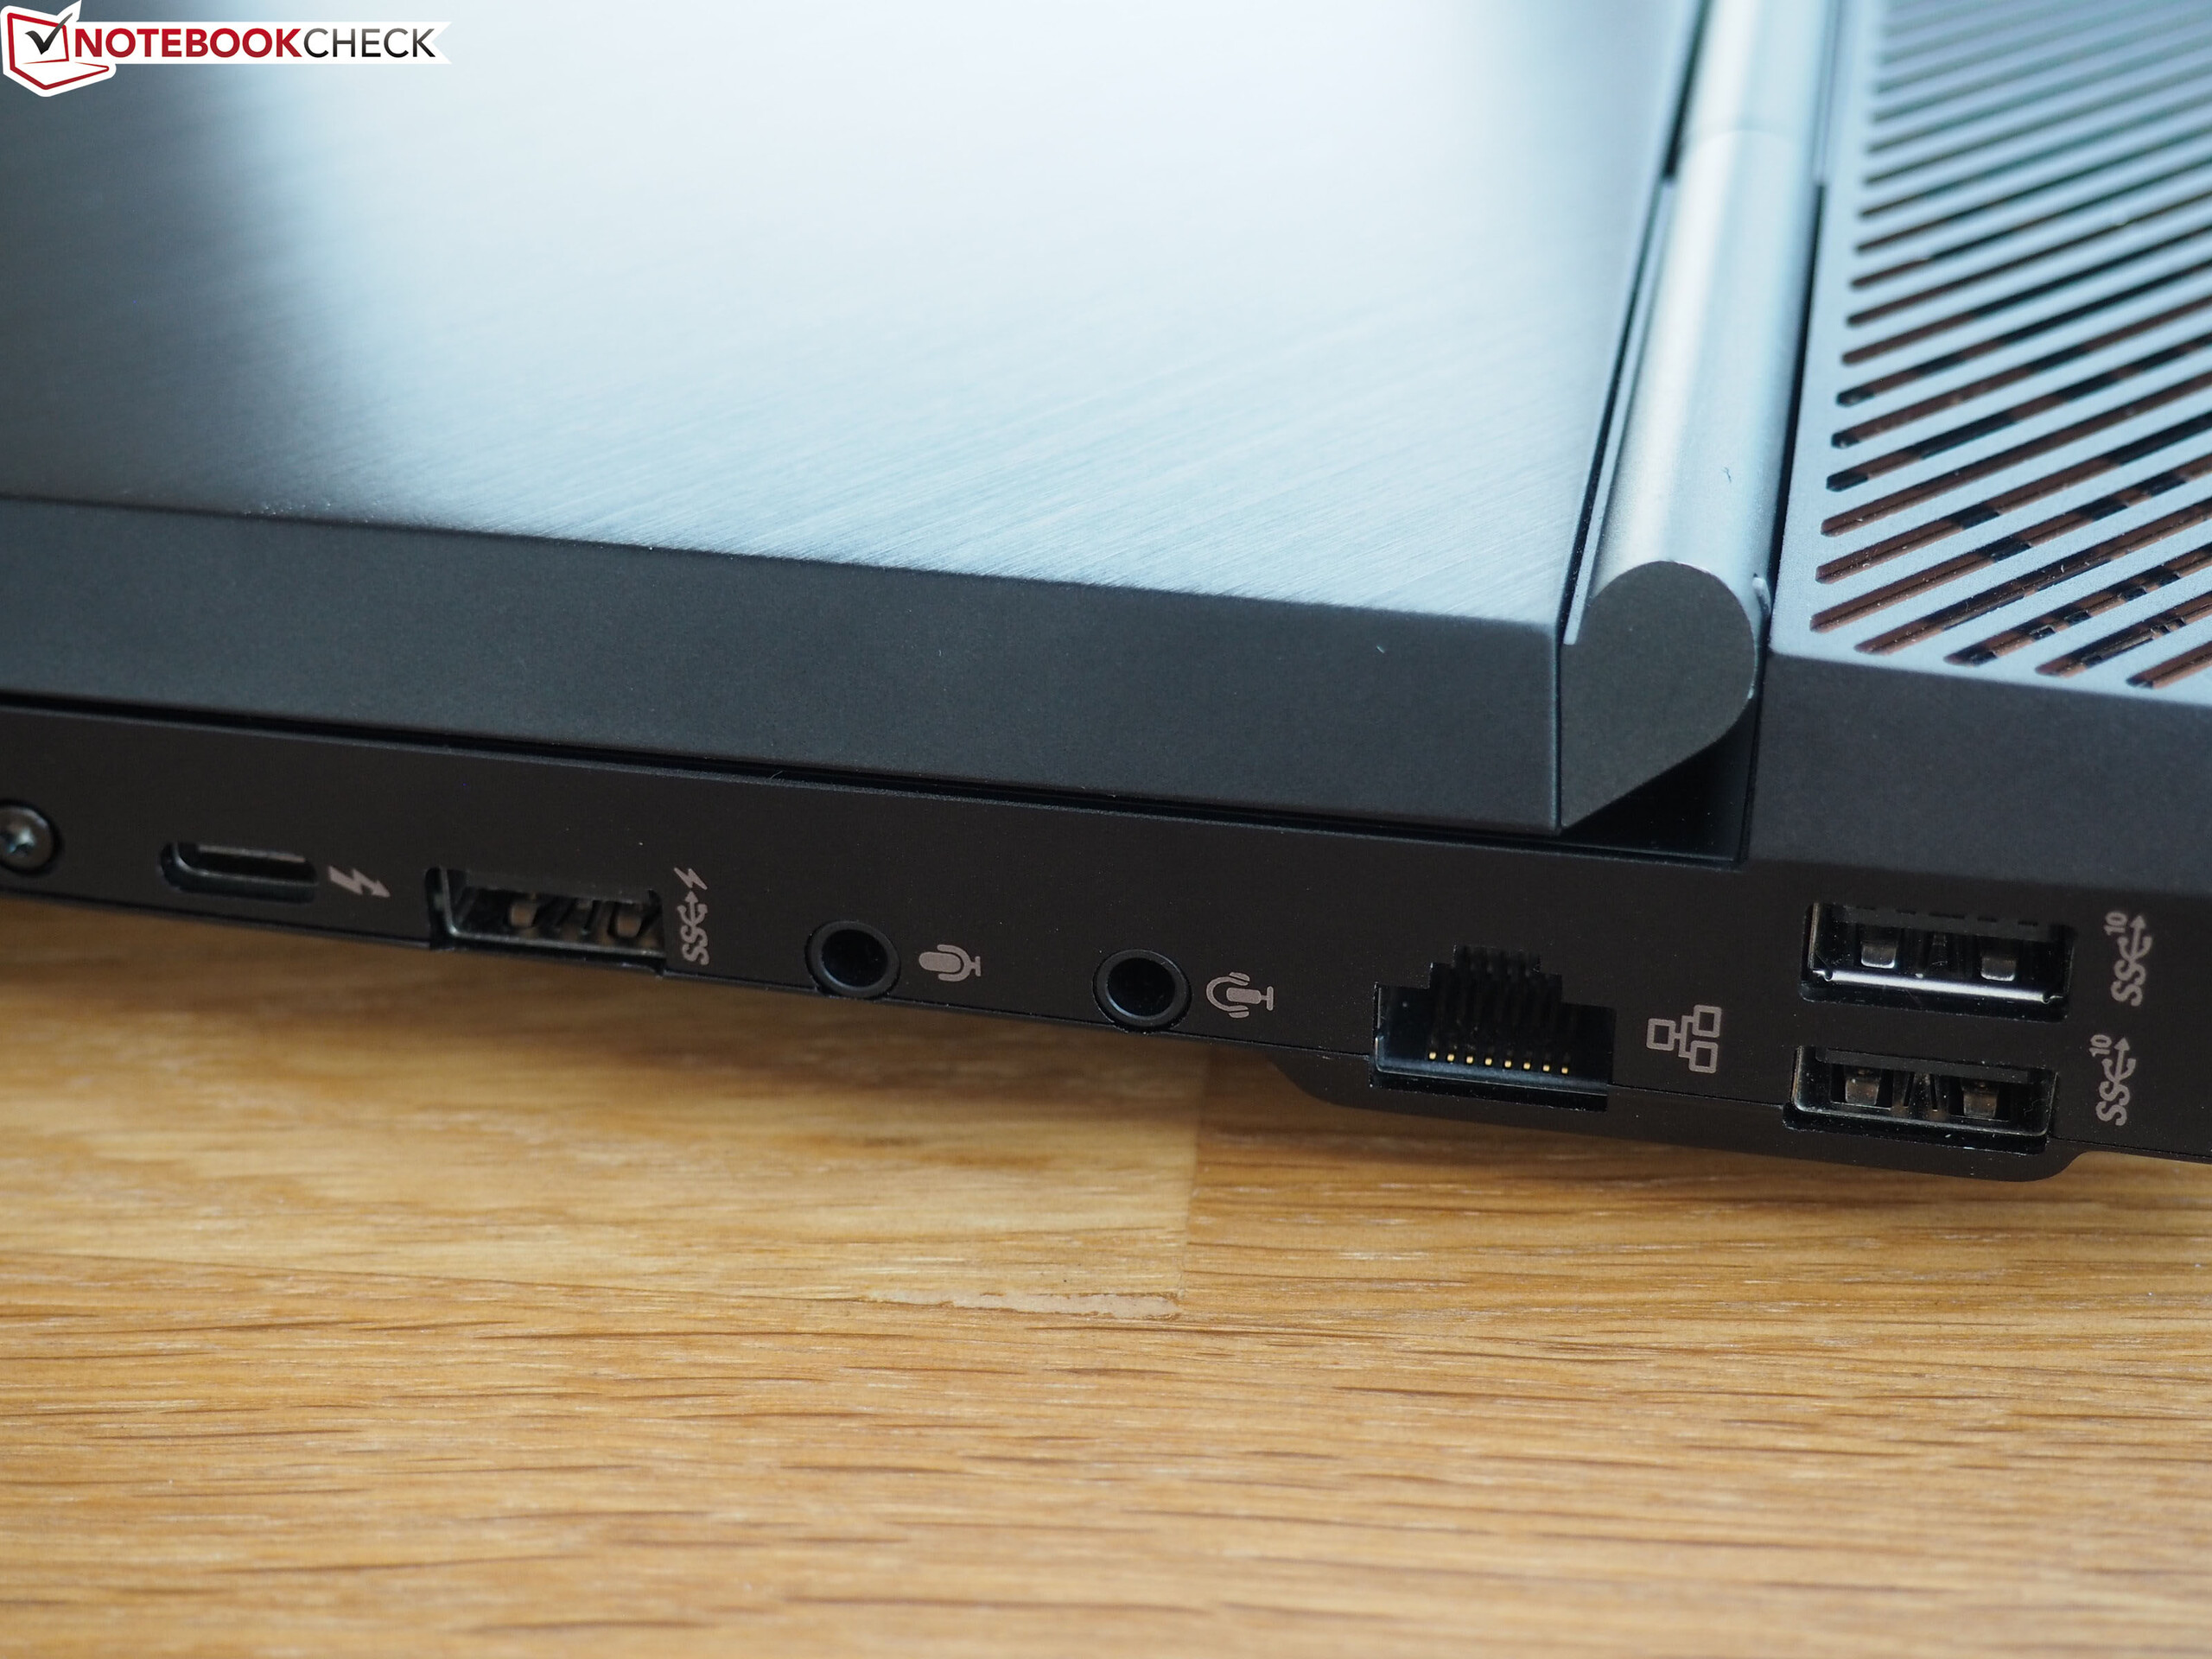
| Networking | |
| iperf3 transmit AX12 | |
| Asus ROG Mothership GZ700GX | |
| HP Omen 17-cb0020ng | |
| MSI GT76 Titan DT 9SG | |
| MSI GE75 9SG | |
| Asus ROG G703GXR | |
| Alienware Area-51m i9-9900K RTX 2080 | |
| iperf3 receive AX12 | |
| Asus ROG Mothership GZ700GX | |
| MSI GT76 Titan DT 9SG | |
| Asus ROG G703GXR | |
| HP Omen 17-cb0020ng | |
| MSI GE75 9SG | |
| Alienware Area-51m i9-9900K RTX 2080 | |
| |||||||||||||||||||||||||
Distribution av ljusstyrkan: 90 %
Mitt på batteriet: 283 cd/m²
Kontrast: 1230:1 (Svärta: 0.23 cd/m²)
ΔE ColorChecker Calman: 5.87 | ∀{0.5-29.43 Ø4.73}
calibrated: 1.82
ΔE Greyscale Calman: 7.19 | ∀{0.09-98 Ø4.97}
90% sRGB (Argyll 1.6.3 3D)
58% AdobeRGB 1998 (Argyll 1.6.3 3D)
63.7% AdobeRGB 1998 (Argyll 3D)
90.4% sRGB (Argyll 3D)
62.3% Display P3 (Argyll 3D)
Gamma: 2.41
CCT: 8239 K
| Asus ROG Mothership GZ700GX AU Optronics B173HAN04.0 (AUO409D), IPS, 1920x1080 | Asus ROG G703GXR AU Optronics B173HAN04.0 (AUO409D), IPS, 1920x1080 | HP Omen 17-cb0020ng CMN175D, IPS, 1920x1080 | MSI GE75 9SG Chi Mei N173HCE-G33, AHVA, 1920x1080 | MSI GT76 Titan DT 9SG Chi Mei N173HCE-G33 (CMN175C), IPS, 1920x1080 | Alienware Area-51m i9-9900K RTX 2080 LG Philips 173WFG, IPS, 1920x1080 | |
|---|---|---|---|---|---|---|
| Display | 2% | 4% | 0% | 1% | 6% | |
| Display P3 Coverage (%) | 62.3 | 63.2 1% | 63.7 2% | 61.5 -1% | 62.3 0% | 66.3 6% |
| sRGB Coverage (%) | 90.4 | 92 2% | 96 6% | 92 2% | 93.4 3% | 96.9 7% |
| AdobeRGB 1998 Coverage (%) | 63.7 | 64.7 2% | 65.8 3% | 63.5 0% | 64.3 1% | 66.5 4% |
| Response Times | -15% | -101% | 9% | -15% | -62% | |
| Response Time Grey 50% / Grey 80% * (ms) | 6 ? | 6.4 ? -7% | 17.6 ? -193% | 7.2 ? -20% | 8 ? -33% | 13.2 ? -120% |
| Response Time Black / White * (ms) | 10.4 ? | 12.8 ? -23% | 11.2 ? -8% | 6.6 ? 37% | 10 ? 4% | 10.8 ? -4% |
| PWM Frequency (Hz) | 25510 ? | 26040 ? | 26040 ? | |||
| Screen | 10% | 28% | 25% | 25% | -3% | |
| Brightness middle (cd/m²) | 283 | 290 2% | 360 27% | 400.7 42% | 396 40% | 335.2 18% |
| Brightness (cd/m²) | 285 | 281 -1% | 342 20% | 372 31% | 373 31% | 297 4% |
| Brightness Distribution (%) | 90 | 91 1% | 91 1% | 89 -1% | 89 -1% | 82 -9% |
| Black Level * (cd/m²) | 0.23 | 0.2 13% | 0.26 -13% | 0.34 -48% | 0.33 -43% | 0.66 -187% |
| Contrast (:1) | 1230 | 1450 18% | 1385 13% | 1179 -4% | 1200 -2% | 508 -59% |
| Colorchecker dE 2000 * | 5.87 | 4.77 19% | 1.91 67% | 1.33 77% | 2.04 65% | 2.02 66% |
| Colorchecker dE 2000 max. * | 11.01 | 9.08 18% | 4.08 63% | 3.51 68% | 3.85 65% | 7.23 34% |
| Colorchecker dE 2000 calibrated * | 1.82 | 1.46 20% | 0.78 57% | 1.39 24% | 0.82 55% | 1.17 36% |
| Greyscale dE 2000 * | 7.19 | 5.83 19% | 2.72 62% | 1.3 82% | 2.83 61% | 3.2 55% |
| Gamma | 2.41 91% | 2.47 89% | 2.37 93% | 2.24 98% | 2.49 88% | 2.16 102% |
| CCT | 8239 79% | 8076 80% | 6692 97% | 6735 97% | 7113 91% | 6746 96% |
| Color Space (Percent of AdobeRGB 1998) (%) | 58 | 59 2% | 60 3% | 58.2 0% | 59 2% | 61.3 6% |
| Color Space (Percent of sRGB) (%) | 90 | 92 2% | 96 7% | 92.1 2% | 94 4% | 96.9 8% |
| Totalt genomsnitt (program/inställningar) | -1% /
6% | -23% /
7% | 11% /
18% | 4% /
16% | -20% /
-8% |
* ... mindre är bättre
Visa svarstider
| ↔ Svarstid svart till vitt | ||
|---|---|---|
| 10.4 ms ... stiga ↗ och falla ↘ kombinerat | ↗ 6 ms stiga | 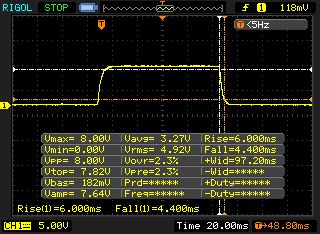 |
| ↘ 4.4 ms hösten | ||
| Skärmen visar bra svarsfrekvens i våra tester, men kan vara för långsam för konkurrenskraftiga spelare. I jämförelse sträcker sig alla testade enheter från 0.1 (minst) till 240 (maximalt) ms. » 28 % av alla enheter är bättre. Det betyder att den uppmätta svarstiden är bättre än genomsnittet av alla testade enheter (19.9 ms). | ||
| ↔ Svarstid 50 % grått till 80 % grått | ||
| 6 ms ... stiga ↗ och falla ↘ kombinerat | ↗ 3 ms stiga | 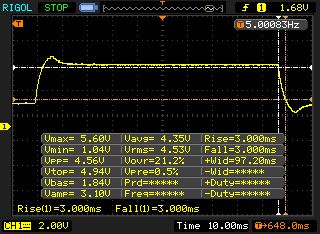 |
| ↘ 3 ms hösten | ||
| Skärmen visar väldigt snabba svarsfrekvenser i våra tester och borde vara mycket väl lämpad för fartfyllt spel. I jämförelse sträcker sig alla testade enheter från 0.165 (minst) till 636 (maximalt) ms. » 18 % av alla enheter är bättre. Det betyder att den uppmätta svarstiden är bättre än genomsnittet av alla testade enheter (31.1 ms). | ||
Skärmflimmer / PWM (Puls-Width Modulation)
| Skärmflimmer / PWM upptäcktes inte | 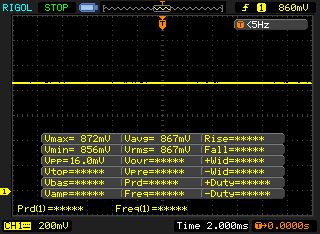 | ||
Som jämförelse: 52 % av alla testade enheter använder inte PWM för att dämpa skärmen. Om PWM upptäcktes mättes ett medelvärde av 7801 (minst: 5 - maximum: 343500) Hz. | |||
| Cinebench R20 | |
| CPU (Single Core) | |
| Genomsnitt av klass Gaming (442 - 895, n=112, senaste 2 åren) | |
| MSI GT76 Titan DT 9SG | |
| HP Omen 17-cb0020ng | |
| Asus ROG Mothership GZ700GX | |
| MSI GE75 9SG | |
| Asus ROG G703GXR | |
| CPU (Multi Core) | |
| Genomsnitt av klass Gaming (4029 - 16108, n=112, senaste 2 åren) | |
| MSI GT76 Titan DT 9SG | |
| Asus ROG Mothership GZ700GX | |
| MSI GE75 9SG | |
| Asus ROG G703GXR | |
| HP Omen 17-cb0020ng | |
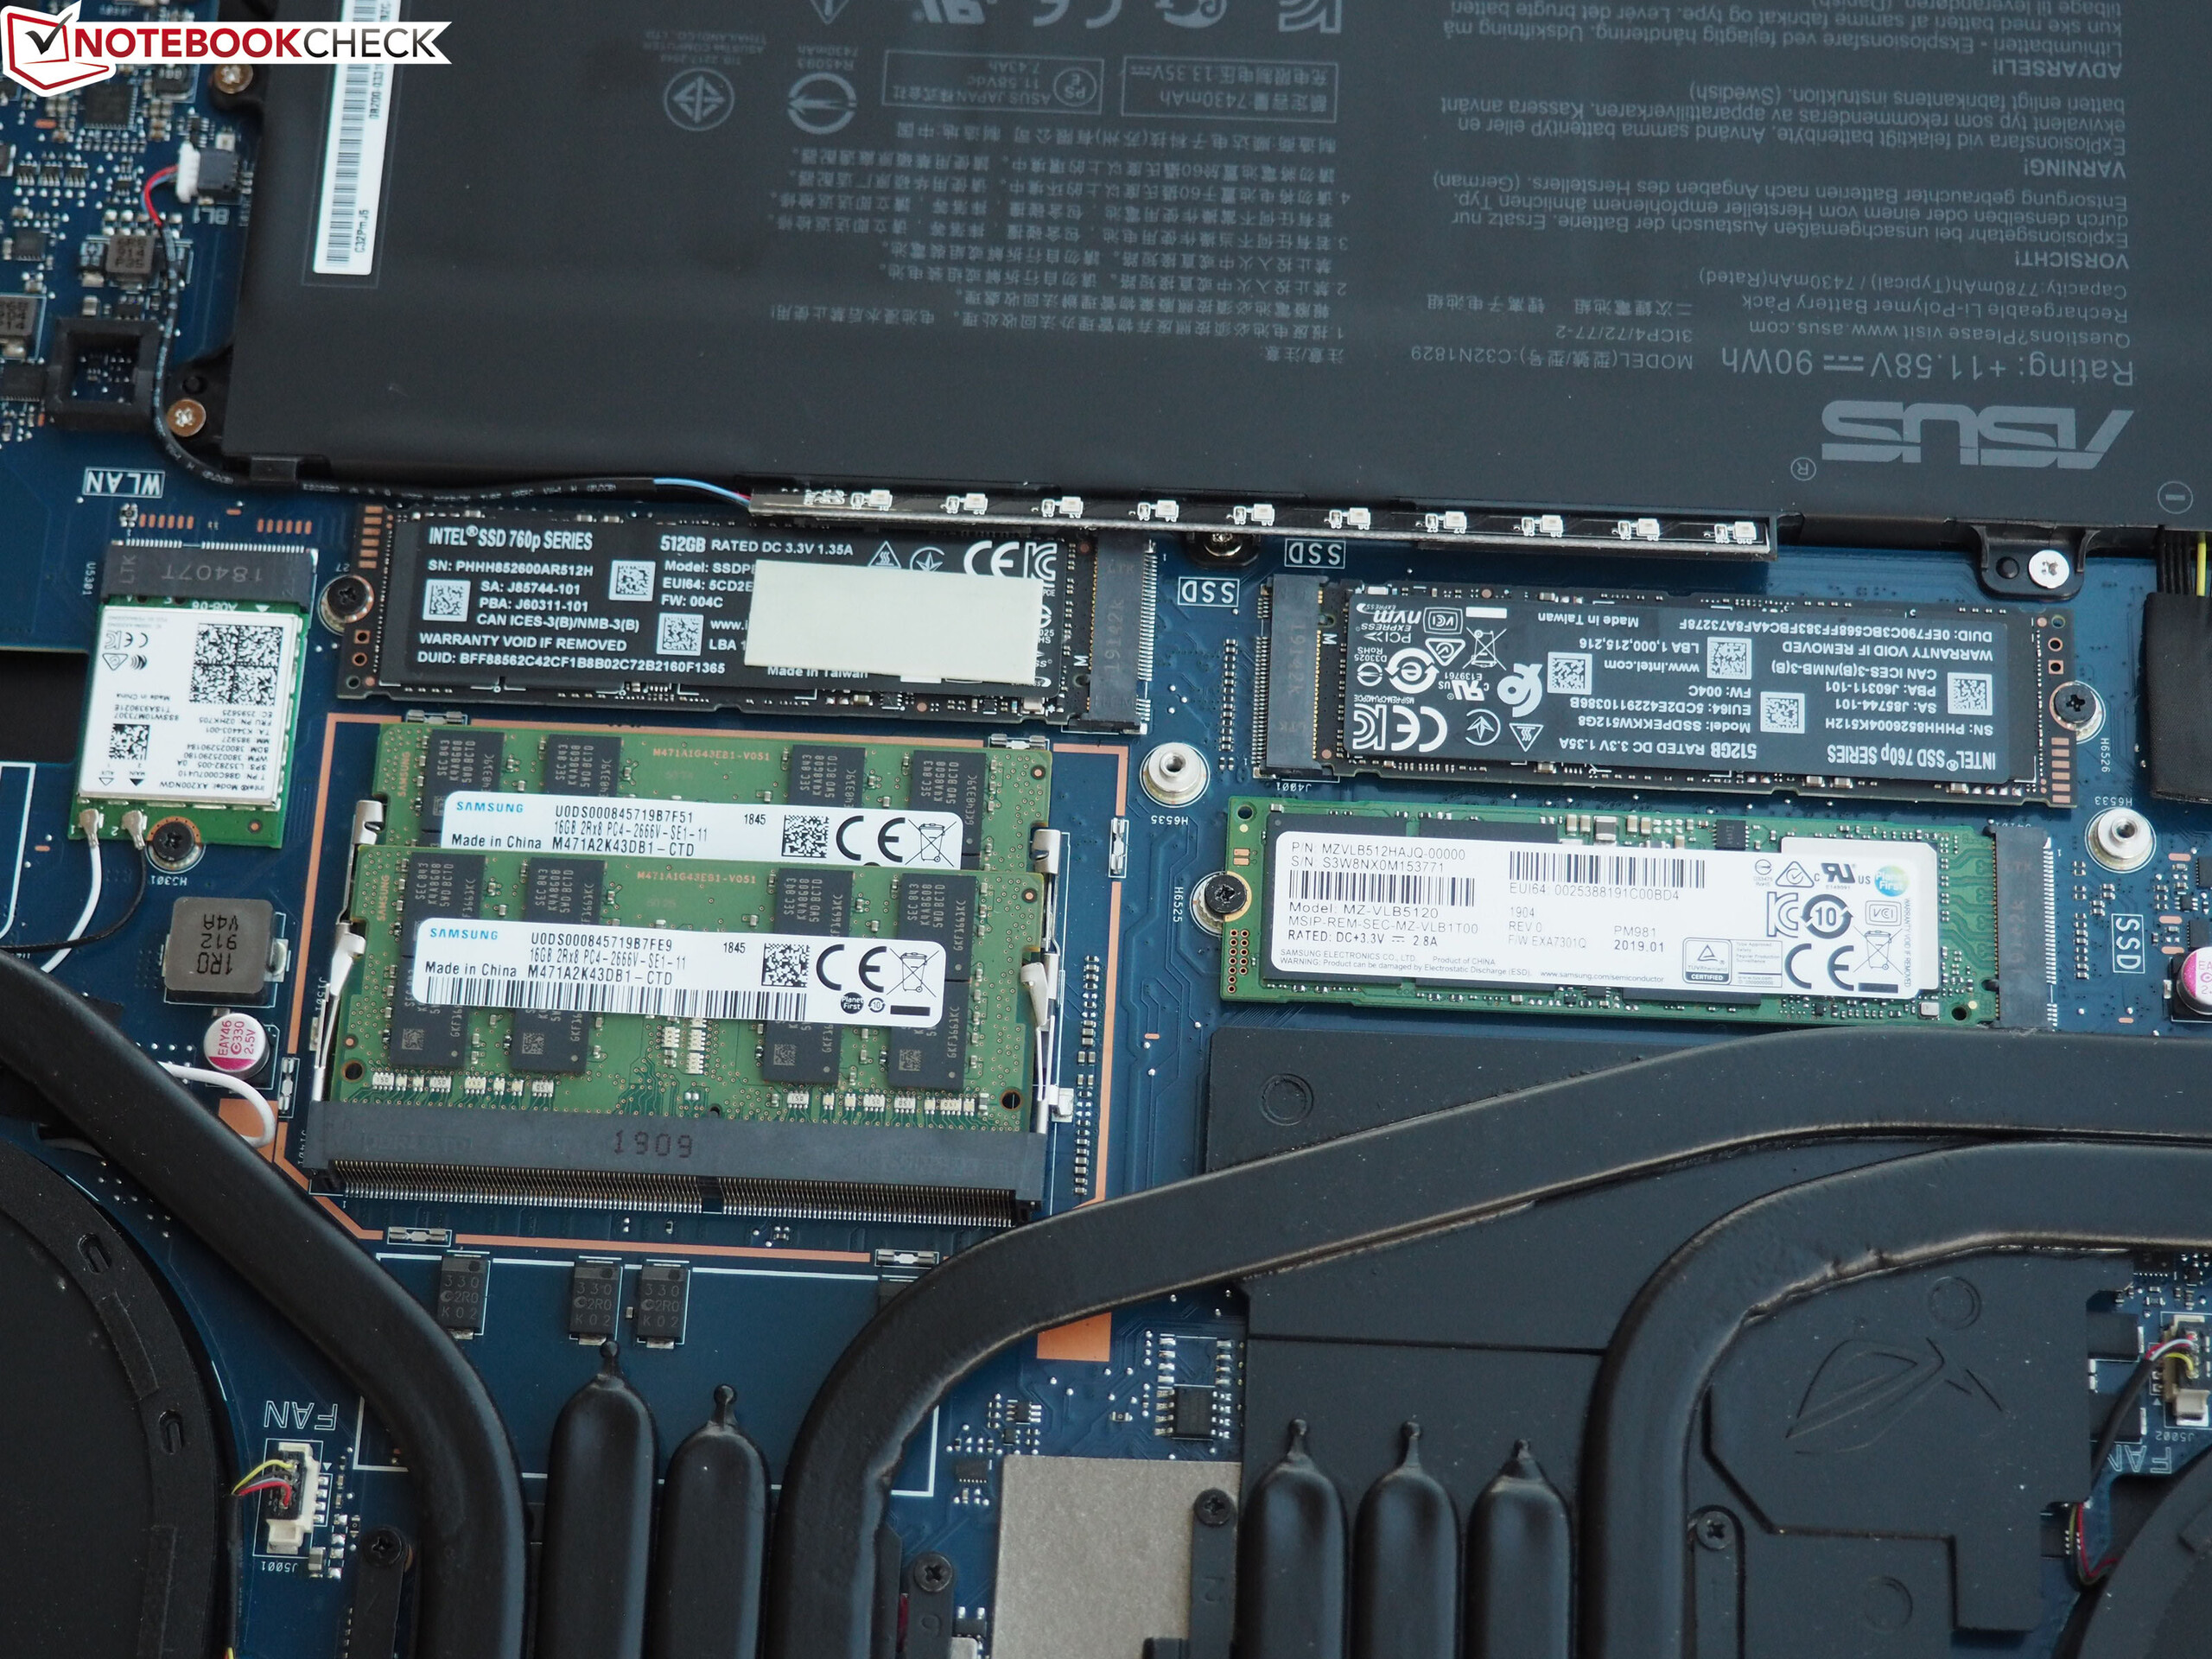
| Asus ROG Mothership GZ700GX 1x Samsung SSD PM981 MZVLB512HAJQ + 2x Intel SSD 760p SSDPEKKW512G8 (RAID 0) | Asus ROG G703GXR Samsung SSD PM981 MZVLB512HAJQ | HP Omen 17-cb0020ng 2x Samsung SSD PM981 MZVLB512HAJQ (RAID 0) | MSI GE75 9SG Samsung SSD PM981 MZVLB1T0HALR | MSI GT76 Titan DT 9SG 2x Samsung PM961 MZVLW256HEHP (RAID 0) | Alienware Area-51m i9-9900K RTX 2080 2x SK Hynix PC400 512GB (RAID 0) | |
|---|---|---|---|---|---|---|
| AS SSD | -18% | -14% | -11% | -9% | -18% | |
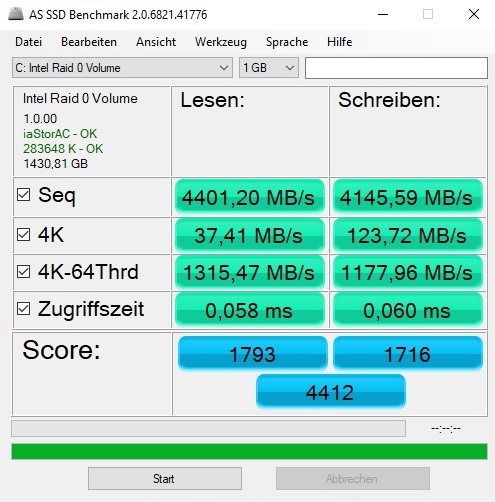
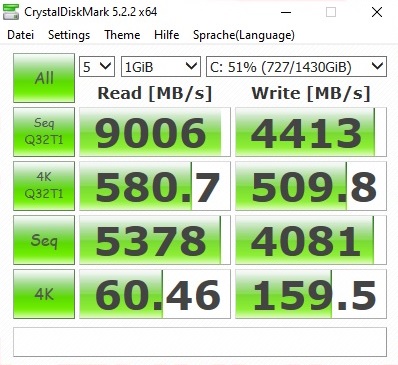
| Seq Read (MB/s) | 4401 | 1030 -77% | 2568 -42% | 1358 -69% | 2646 -40% | 2082 -53% |
| Seq Write (MB/s) | 4146 | 1888 -54% | 2608 -37% | 2381 -43% | 2214 -47% | 2335 -44% |
| 4K Read (MB/s) | 37.41 | 43.83 17% | 41.2 10% | 27.02 -28% | 30.42 -19% | 24.14 -35% |
| 4K Write (MB/s) | 123.7 | 97.1 -22% | 98 -21% | 89.2 -28% | 95.9 -22% | 91.8 -26% |
| 4K-64 Read (MB/s) | 1315 | 1092 -17% | 1352 3% | 1642 25% | 1609 22% | 1561 19% |
| 4K-64 Write (MB/s) | 1178 | 1647 40% | 1138 -3% | 1799 53% | 1573 34% | 1350 15% |
| Score Total (Points) | 4412 | 3856 -13% | 3994 -9% | 4899 11% | 4740 7% | 4390 0% |

| 3DMark 11 Performance | 28126 poäng | |
| 3DMark Cloud Gate Standard Score | 55579 poäng | |
| 3DMark Fire Strike Score | 22005 poäng | |
| 3DMark Time Spy Score | 10150 poäng | |
Hjälp | ||
| 3DMark | |
| 2560x1440 Port Royal Graphics | |
| Genomsnitt av klass Gaming (4395 - 17286, n=70, senaste 2 åren) | |
| Asus ROG Mothership GZ700GX | |
| Alienware Area-51m i9-9900K RTX 2080 | |
| MSI GT76 Titan DT 9SG | |
| HP Omen 17-cb0020ng | |
| Asus ROG G703GXR | |
| MSI GE75 9SG | |
| 2560x1440 Time Spy Graphics | |
| Genomsnitt av klass Gaming (5012 - 26212, n=120, senaste 2 åren) | |
| Alienware Area-51m i9-9900K RTX 2080 | |
| MSI GT76 Titan DT 9SG | |
| Asus ROG G703GXR | |
| Asus ROG Mothership GZ700GX | |
| MSI GE75 9SG | |
| HP Omen 17-cb0020ng | |
| 1920x1080 Fire Strike Graphics | |
| Genomsnitt av klass Gaming (12242 - 62849, n=121, senaste 2 åren) | |
| Alienware Area-51m i9-9900K RTX 2080 | |
| Asus ROG Mothership GZ700GX | |
| Asus ROG G703GXR | |
| MSI GT76 Titan DT 9SG | |
| MSI GE75 9SG | |
| HP Omen 17-cb0020ng | |
| 3DMark 11 - 1280x720 Performance GPU | |
| Genomsnitt av klass Gaming (21841 - 80022, n=109, senaste 2 åren) | |
| Alienware Area-51m i9-9900K RTX 2080 | |
| Asus ROG Mothership GZ700GX | |
| Asus ROG G703GXR | |
| MSI GE75 9SG | |
| HP Omen 17-cb0020ng | |
| The Witcher 3 - 1920x1080 Ultra Graphics & Postprocessing (HBAO+) | |
| Genomsnitt av klass Gaming (95 - 240, n=8, senaste 2 åren) | |
| Alienware Area-51m i9-9900K RTX 2080 | |
| MSI GT76 Titan DT 9SG | |
| Asus ROG Mothership GZ700GX | |
| Asus ROG G703GXR | |
| MSI GE75 9SG | |
| HP Omen 17-cb0020ng | |
| låg | med. | hög | ultra | |
|---|---|---|---|---|
| The Witcher 3 (2015) | 181 | 98.3 | ||
| Control (2019) | 92.1 | |||
| Borderlands 3 (2019) | 104 | 89.4 | ||
| FIFA 20 (2019) | 267 | 262 | ||
| Ghost Recon Breakpoint (2019) | 111 | 83 | ||
| GRID 2019 (2019) | 127 | 89.7 | ||
| Call of Duty Modern Warfare 2019 (2019) | 159 | 136 | ||
| Need for Speed Heat (2019) | 99.2 | 90.1 | ||
| Star Wars Jedi Fallen Order (2019) | 111 | 108 | ||
| Red Dead Redemption 2 (2019) | 88.9 | 56.8 |
Ljudnivå
| Låg belastning |
| 37 / 38 / 39 dB(A) |
| Hög belastning |
| 40 / 52 dB(A) |
 | ||
30 dB tyst 40 dB(A) hörbar 50 dB(A) högt ljud |
||
min: | ||
| Asus ROG Mothership GZ700GX i9-9980HK, GeForce RTX 2080 Mobile | Asus ROG G703GXR i7-9750H, GeForce RTX 2080 Mobile | HP Omen 17-cb0020ng i9-9880H, GeForce RTX 2080 Mobile | MSI GE75 9SG i9-9880H, GeForce RTX 2080 Mobile | MSI GT76 Titan DT 9SG i9-9900K, GeForce RTX 2080 Mobile | Alienware Area-51m i9-9900K RTX 2080 i9-9900K, GeForce RTX 2080 Mobile | Genomsnitt av klass Gaming | |
|---|---|---|---|---|---|---|---|
| Noise | 4% | 0% | 6% | -5% | -1% | 15% | |
| av / miljö * (dB) | 30 | 30 -0% | 30 -0% | 28.2 6% | 30 -0% | 28.1 6% | 24.1 ? 20% |
| Idle Minimum * (dB) | 37 | 33 11% | 34 8% | 30.4 18% | 33 11% | 28.1 24% | 25.8 ? 30% |
| Idle Average * (dB) | 38 | 34 11% | 35 8% | 30.4 20% | 34 11% | 28.6 25% | 27.5 ? 28% |
| Idle Maximum * (dB) | 39 | 35 10% | 36 8% | 33.4 14% | 44 -13% | 51 -31% | 30 ? 23% |
| Load Average * (dB) | 40 | 38 5% | 51 -27% | 37.1 7% | 47 -18% | 51 -27% | 43.1 ? -8% |
| Witcher 3 ultra * (dB) | 48 | 50 -4% | 47 2% | 54.2 -13% | 53 -10% | 51 -6% | |
| Load Maximum * (dB) | 52 | 54 -4% | 51 2% | 56.4 -8% | 59 -13% | 51 2% | 54 ? -4% |
* ... mindre är bättre
(+) Den maximala temperaturen på ovansidan är 39 °C / 102 F, jämfört med genomsnittet av 40.4 °C / 105 F , allt från 21.2 till 68.8 °C för klassen Gaming.
(-) Botten värms upp till maximalt 51 °C / 124 F, jämfört med genomsnittet av 43.2 °C / 110 F
(+) Vid tomgångsbruk är medeltemperaturen för ovansidan 25 °C / 77 F, jämfört med enhetsgenomsnittet på 33.9 °C / ### class_avg_f### F.
(+) När du spelar The Witcher 3 är medeltemperaturen för ovansidan 28.2 °C / 83 F, jämfört med enhetsgenomsnittet på 33.9 °C / ## #class_avg_f### F.
(+) Handledsstöden och pekplattan är kallare än hudtemperaturen med maximalt 27 °C / 80.6 F och är därför svala att ta på.
(±) Medeltemperaturen för handledsstödsområdet på liknande enheter var 28.8 °C / 83.8 F (+1.8 °C / 3.2 F).
| Asus ROG Mothership GZ700GX i9-9980HK, GeForce RTX 2080 Mobile | Asus ROG G703GXR i7-9750H, GeForce RTX 2080 Mobile | HP Omen 17-cb0020ng i9-9880H, GeForce RTX 2080 Mobile | MSI GE75 9SG i9-9880H, GeForce RTX 2080 Mobile | MSI GT76 Titan DT 9SG i9-9900K, GeForce RTX 2080 Mobile | Alienware Area-51m i9-9900K RTX 2080 i9-9900K, GeForce RTX 2080 Mobile | Genomsnitt av klass Gaming | |
|---|---|---|---|---|---|---|---|
| Heat | -9% | -12% | -27% | -8% | -17% | -10% | |
| Maximum Upper Side * (°C) | 39 | 46 -18% | 47 -21% | 48.8 -25% | 51 -31% | 47 -21% | 45.2 ? -16% |
| Maximum Bottom * (°C) | 51 | 49 4% | 54 -6% | 52 -2% | 57 -12% | 58.8 -15% | 48.2 ? 5% |
| Idle Upper Side * (°C) | 25 | 31 -24% | 32 -28% | 36.2 -45% | 26 -4% | 31 -24% | 31.1 ? -24% |
| Idle Bottom * (°C) | 33 | 32 3% | 30 9% | 44.4 -35% | 28 15% | 35 -6% | 34.3 ? -4% |
* ... mindre är bättre
Asus ROG Mothership GZ700GX ljudanalys
(+) | högtalare kan spela relativt högt (85 dB)
Bas 100 - 315 Hz
(±) | reducerad bas - i genomsnitt 5.6% lägre än medianen
(±) | linjäriteten för basen är genomsnittlig (13.1% delta till föregående frekvens)
Mellan 400 - 2000 Hz
(+) | balanserad mellan - endast 3% från medianen
(+) | mids är linjära (5.8% delta till föregående frekvens)
Högsta 2 - 16 kHz
(+) | balanserade toppar - endast 3% från medianen
(+) | toppar är linjära (5.9% delta till föregående frekvens)
Totalt 100 - 16 000 Hz
(+) | det totala ljudet är linjärt (8.1% skillnad mot median)
Jämfört med samma klass
» 1% av alla testade enheter i den här klassen var bättre, 1% liknande, 98% sämre
» Den bästa hade ett delta på 6%, genomsnittet var 18%, sämst var 132%
Jämfört med alla testade enheter
» 2% av alla testade enheter var bättre, 1% liknande, 98% sämre
» Den bästa hade ett delta på 4%, genomsnittet var 24%, sämst var 134%
Asus ROG G703GXR ljudanalys
(+) | högtalare kan spela relativt högt (92 dB)
Bas 100 - 315 Hz
(±) | reducerad bas - i genomsnitt 13.2% lägre än medianen
(±) | linjäriteten för basen är genomsnittlig (8.9% delta till föregående frekvens)
Mellan 400 - 2000 Hz
(+) | balanserad mellan - endast 3.1% från medianen
(+) | mids är linjära (3.1% delta till föregående frekvens)
Högsta 2 - 16 kHz
(±) | reducerade toppar - i genomsnitt 5.4% lägre än medianen
(+) | toppar är linjära (4.2% delta till föregående frekvens)
Totalt 100 - 16 000 Hz
(+) | det totala ljudet är linjärt (14.8% skillnad mot median)
Jämfört med samma klass
» 29% av alla testade enheter i den här klassen var bättre, 7% liknande, 64% sämre
» Den bästa hade ett delta på 6%, genomsnittet var 18%, sämst var 132%
Jämfört med alla testade enheter
» 20% av alla testade enheter var bättre, 4% liknande, 76% sämre
» Den bästa hade ett delta på 4%, genomsnittet var 24%, sämst var 134%
| Av/Standby | |
| Låg belastning | |
| Hög belastning |
|
Förklaring:
min: | |
| Asus ROG Mothership GZ700GX i9-9980HK, GeForce RTX 2080 Mobile | Asus ROG G703GXR i7-9750H, GeForce RTX 2080 Mobile | HP Omen 17-cb0020ng i9-9880H, GeForce RTX 2080 Mobile | MSI GE75 9SG i9-9880H, GeForce RTX 2080 Mobile | MSI GT76 Titan DT 9SG i9-9900K, GeForce RTX 2080 Mobile | Alienware Area-51m i9-9900K RTX 2080 i9-9900K, GeForce RTX 2080 Mobile | Genomsnitt av klass Gaming | |
|---|---|---|---|---|---|---|---|
| Power Consumption | 10% | 21% | 32% | 21% | 1% | 41% | |
| Idle Minimum * (Watt) | 37 | 27 27% | 26 30% | 13.9 62% | 14 62% | 23.3 37% | 13.3 ? 64% |
| Idle Average * (Watt) | 48 | 32 33% | 29 40% | 18.8 61% | 18 62% | 33.5 30% | 19 ? 60% |
| Idle Maximum * (Watt) | 59 | 39 34% | 38 36% | 23.1 61% | 23 61% | 38.4 35% | 24.5 ? 58% |
| Load Average * (Watt) | 105 | 124 -18% | 106 -1% | 112.3 -7% | 114 -9% | 114.1 -9% | 108.1 ? -3% |
| Witcher 3 ultra * (Watt) | 233 | 274 -18% | 228 2% | 231 1% | 283 -21% | 339.5 -46% | |
| Load Maximum * (Watt) | 349 | 338 3% | 287 18% | 291.5 16% | 443 -27% | 485.1 -39% | 254 ? 27% |
* ... mindre är bättre
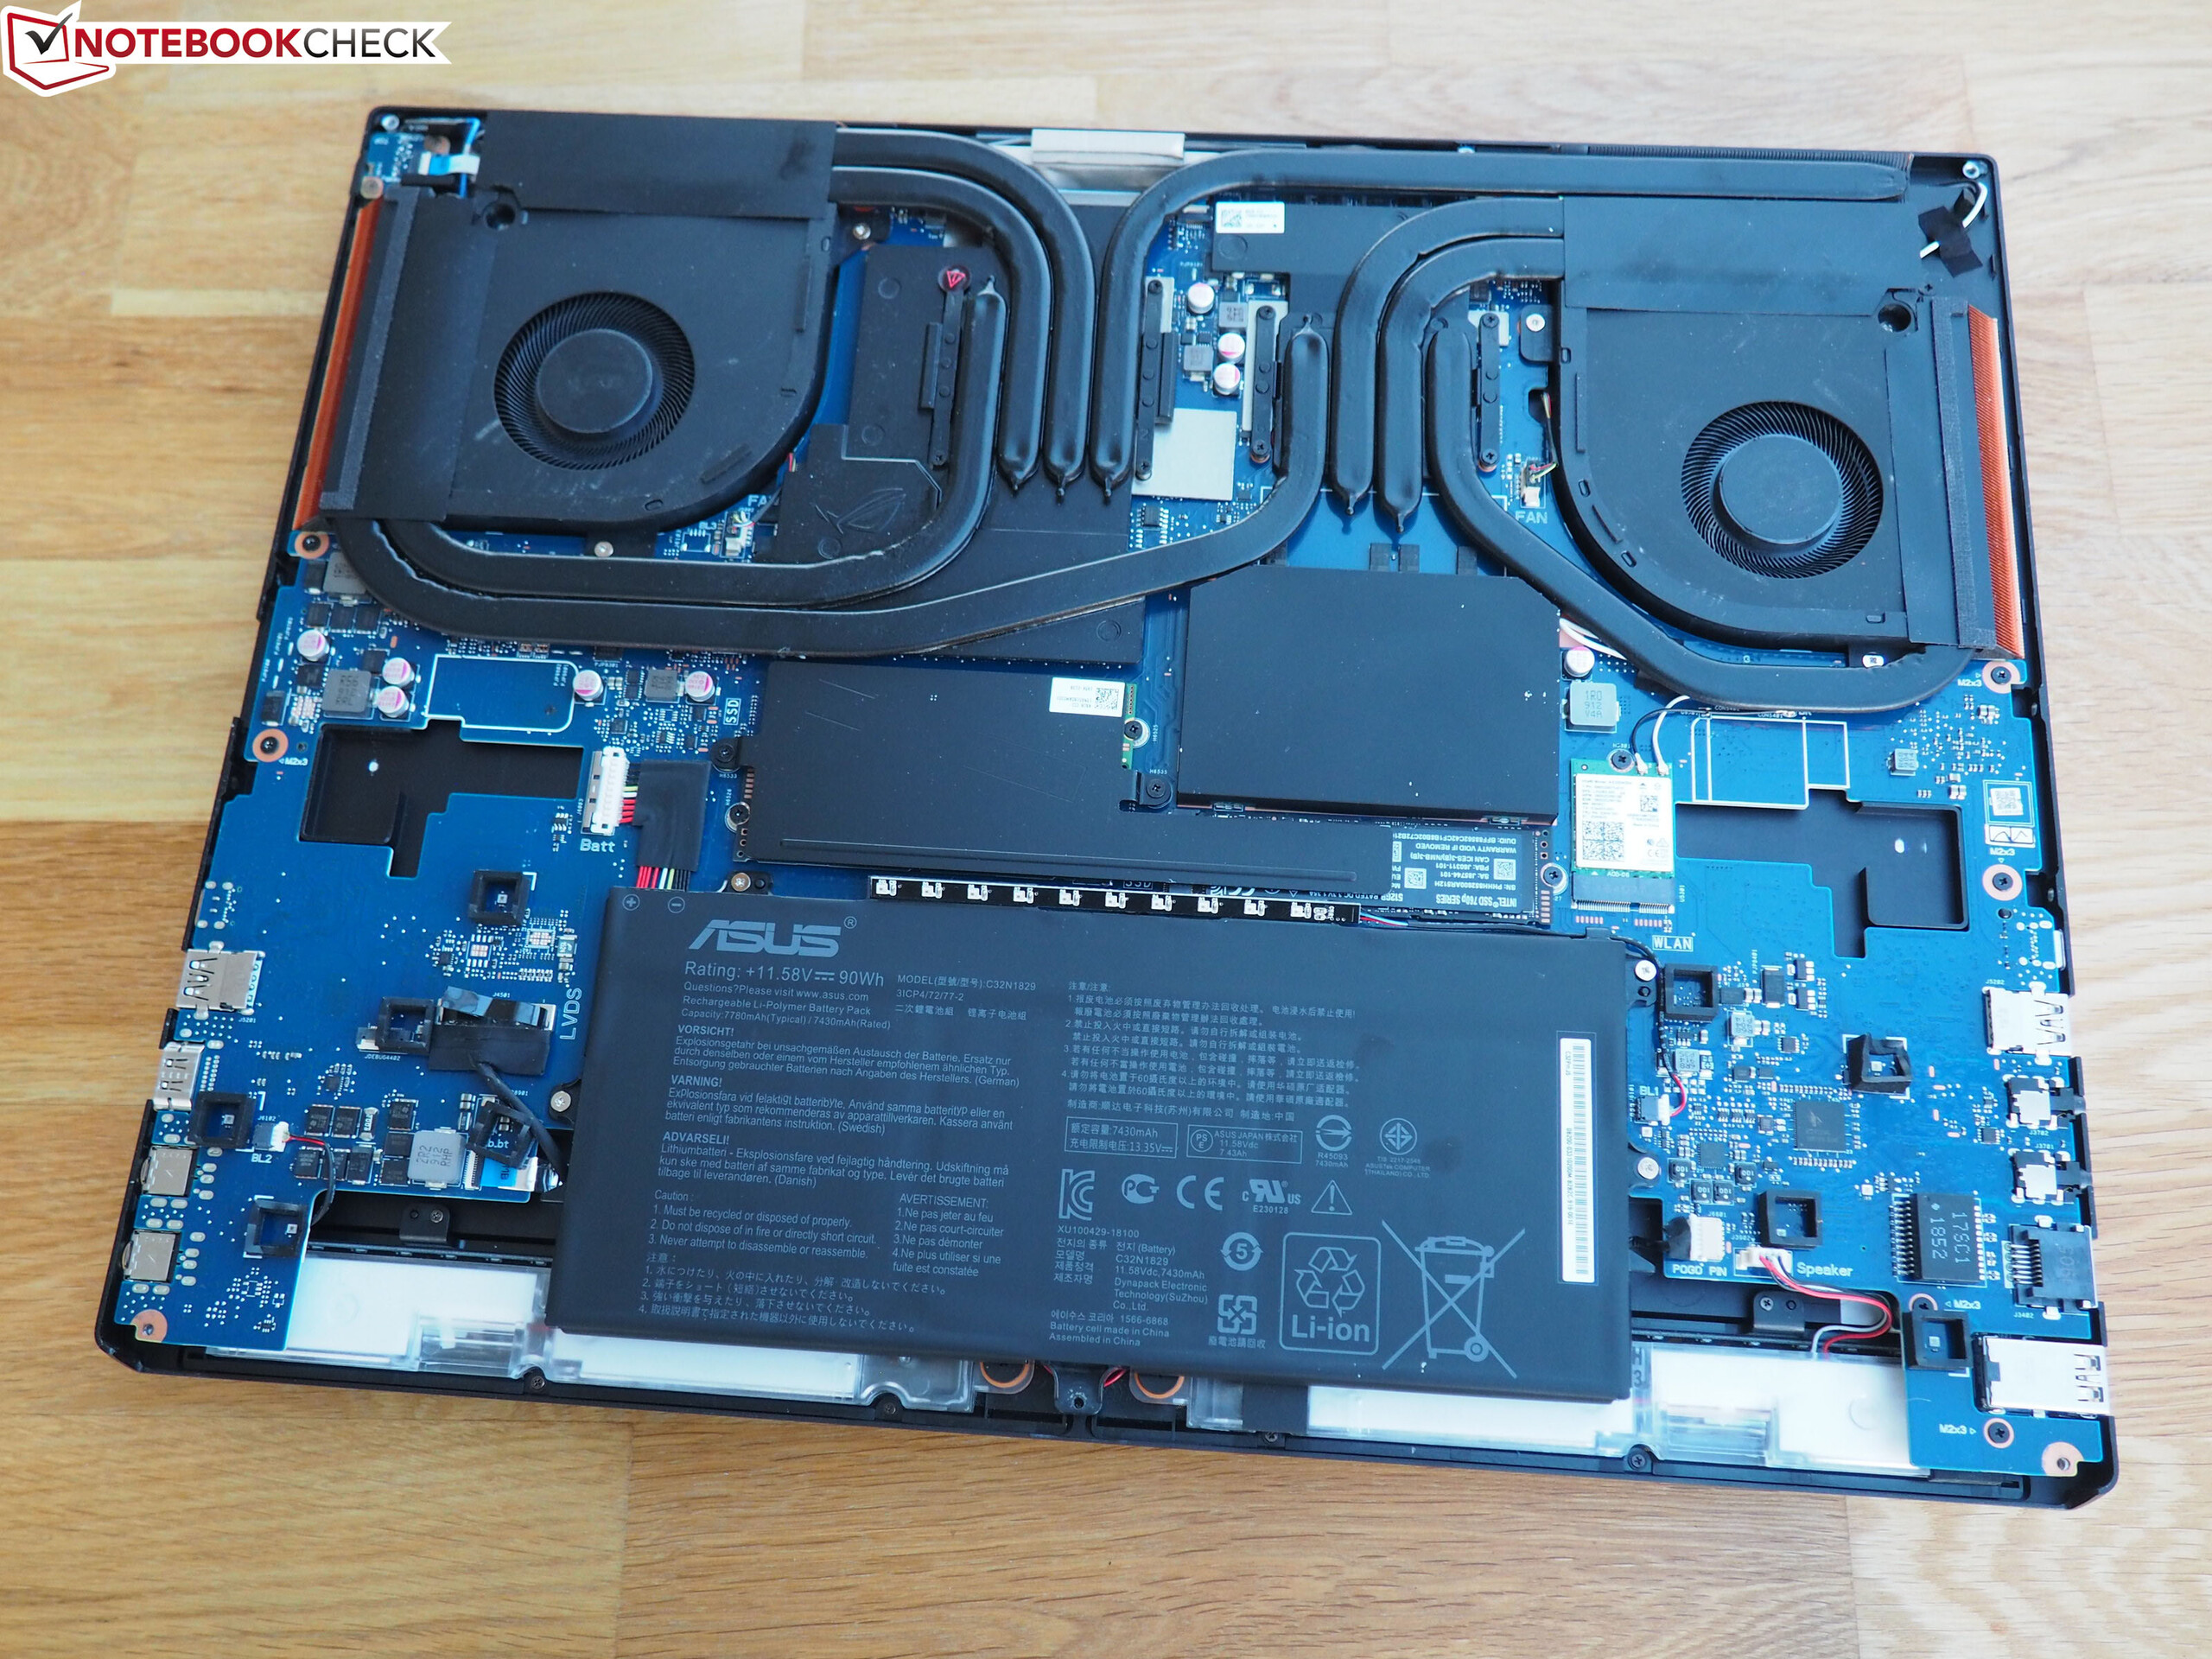
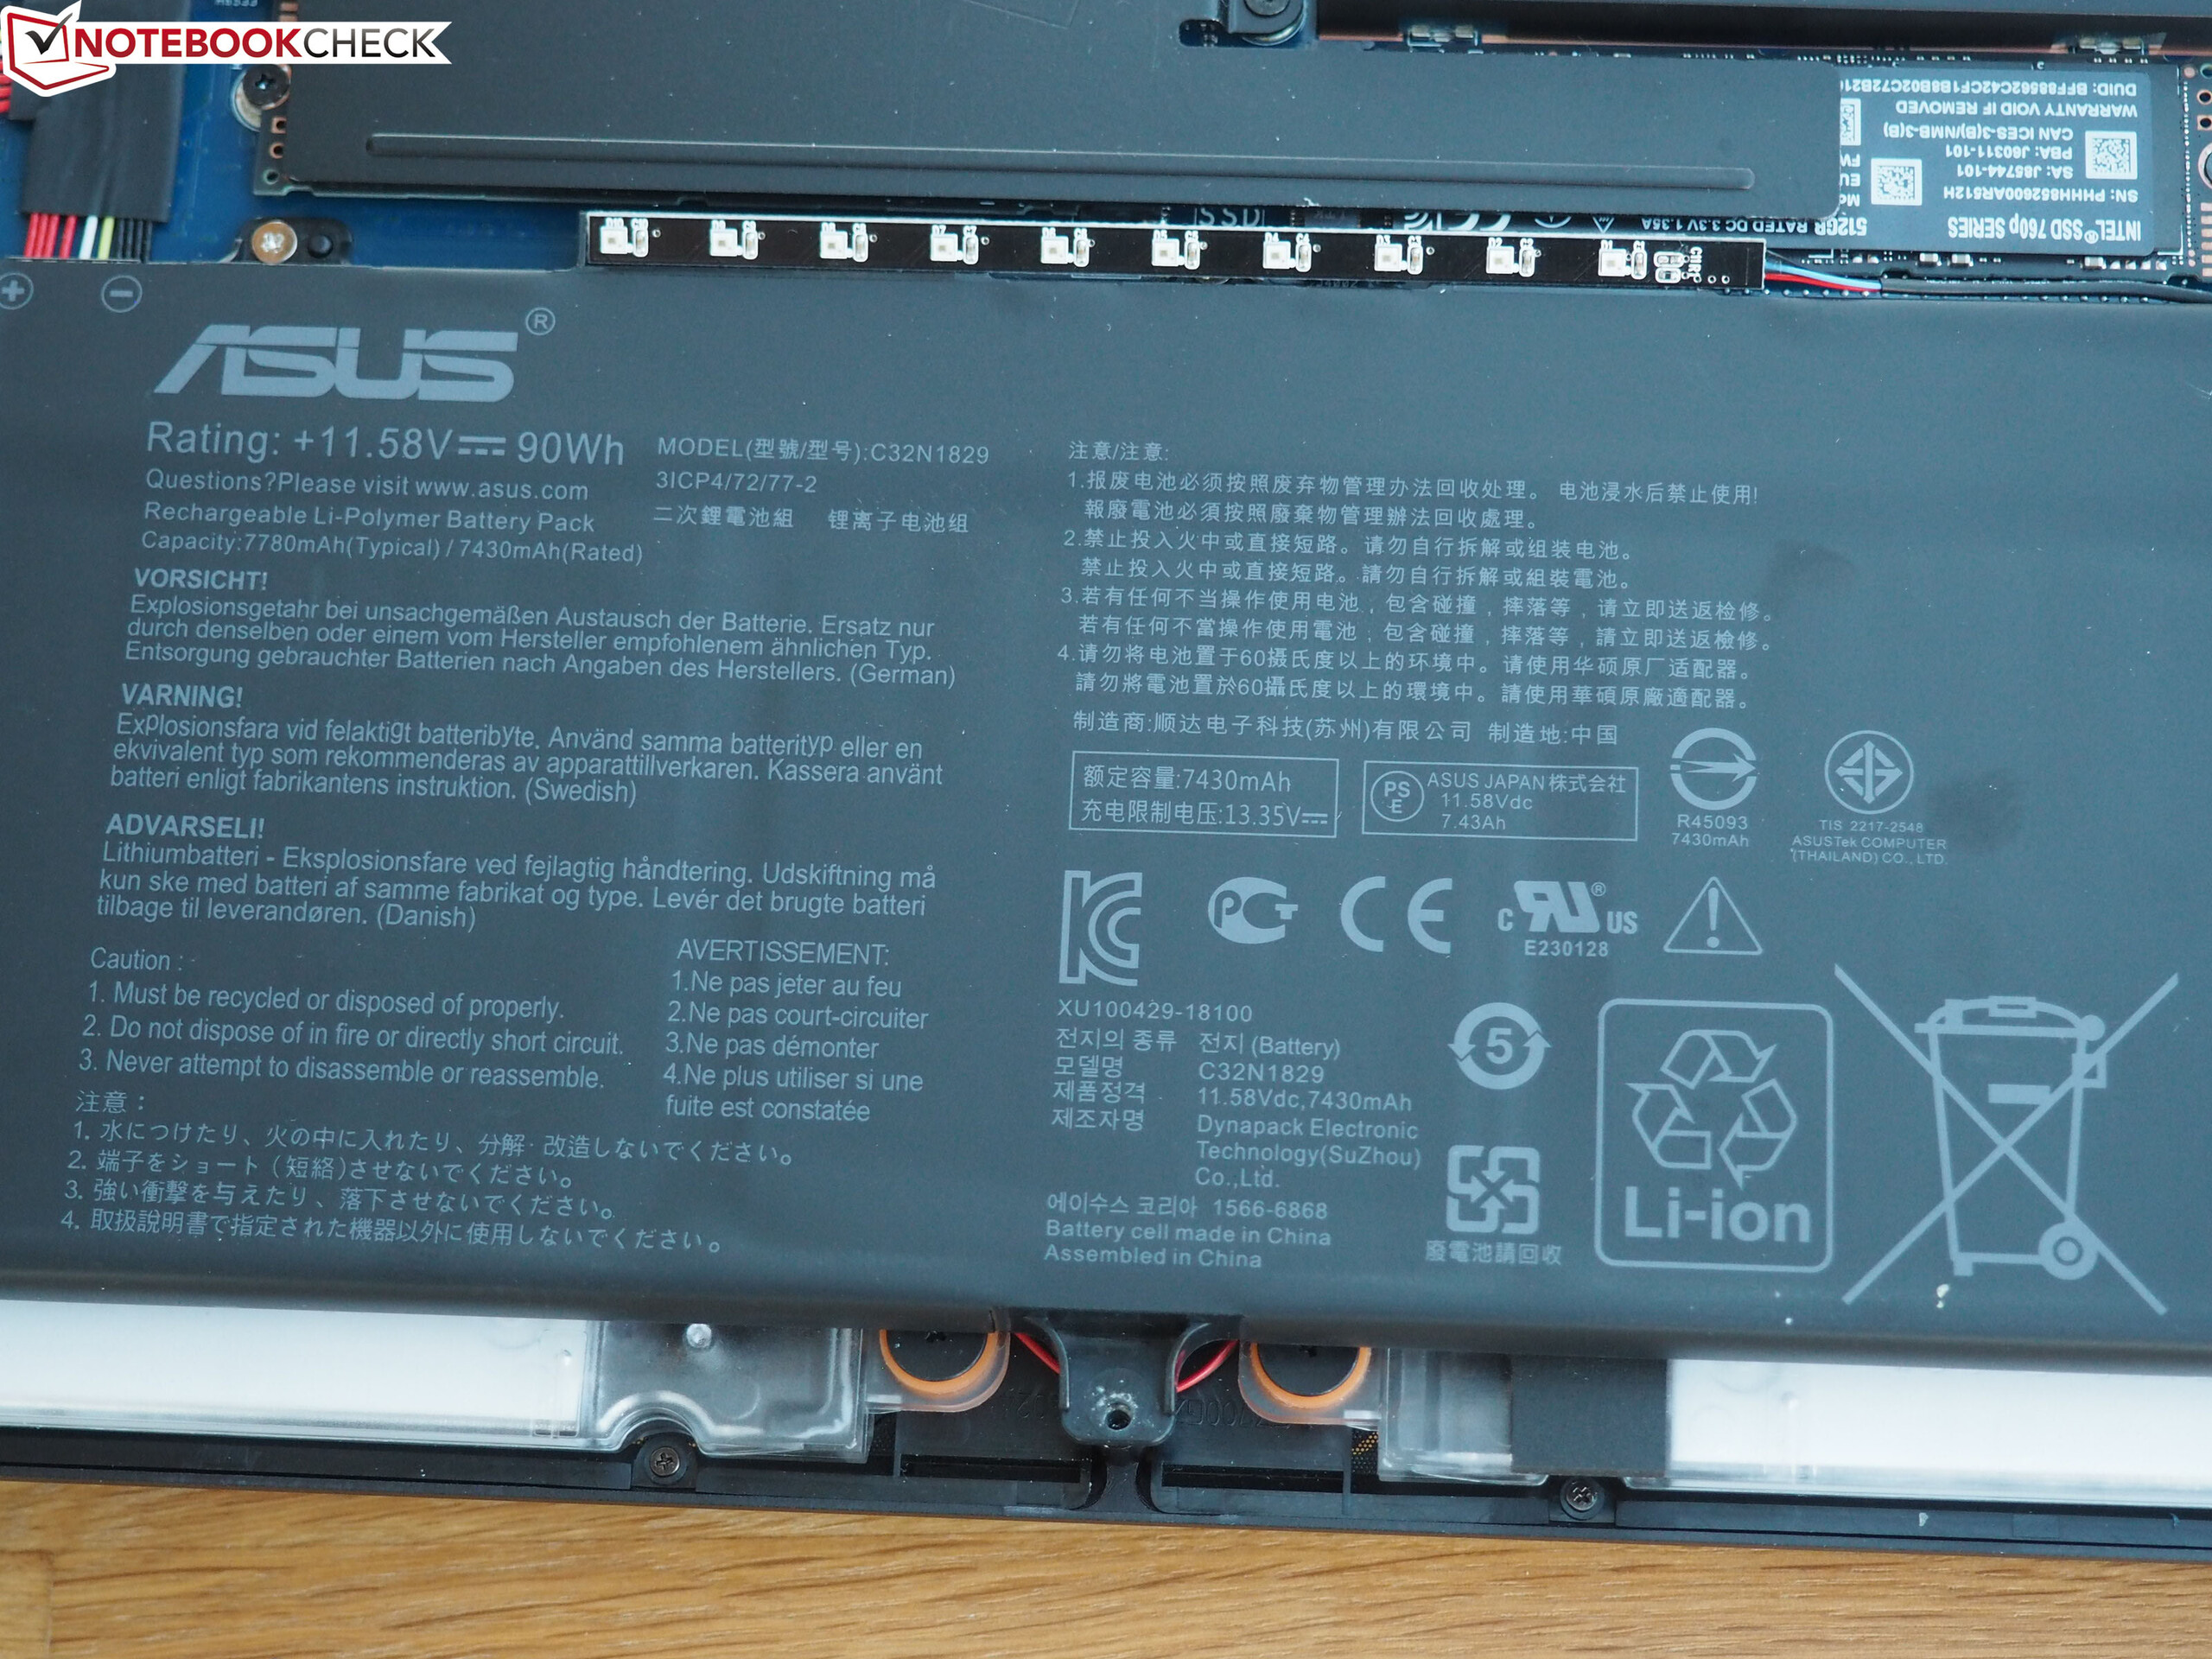
| Asus ROG Mothership GZ700GX i9-9980HK, GeForce RTX 2080 Mobile, 90 Wh | Asus ROG G703GXR i7-9750H, GeForce RTX 2080 Mobile, 96 Wh | HP Omen 17-cb0020ng i9-9880H, GeForce RTX 2080 Mobile, 70 Wh | MSI GE75 9SG i9-9880H, GeForce RTX 2080 Mobile, 65 Wh | MSI GT76 Titan DT 9SG i9-9900K, GeForce RTX 2080 Mobile, 90 Wh | Alienware Area-51m i9-9900K RTX 2080 i9-9900K, GeForce RTX 2080 Mobile, 90 Wh | Genomsnitt av klass Gaming | |
|---|---|---|---|---|---|---|---|
| Batteridrifttid | 87% | 9% | 88% | 56% | -24% | 114% | |
| Reader / Idle (h) | 3 | 8.1 170% | 4.2 40% | 6.8 127% | 2.6 -13% | 8.71 ? 190% | |
| WiFi v1.3 (h) | 2.6 | 6.1 135% | 3.3 27% | 4.9 88% | 5 92% | 2.1 -19% | 7.01 ? 170% |
| Load (h) | 1.8 | 1 -44% | 1.1 -39% | 0.9 -50% | 1.1 -39% | 1.47 ? -18% |
För
Emot
Läs den fullständiga versionen av den här recensionen på engelska här.
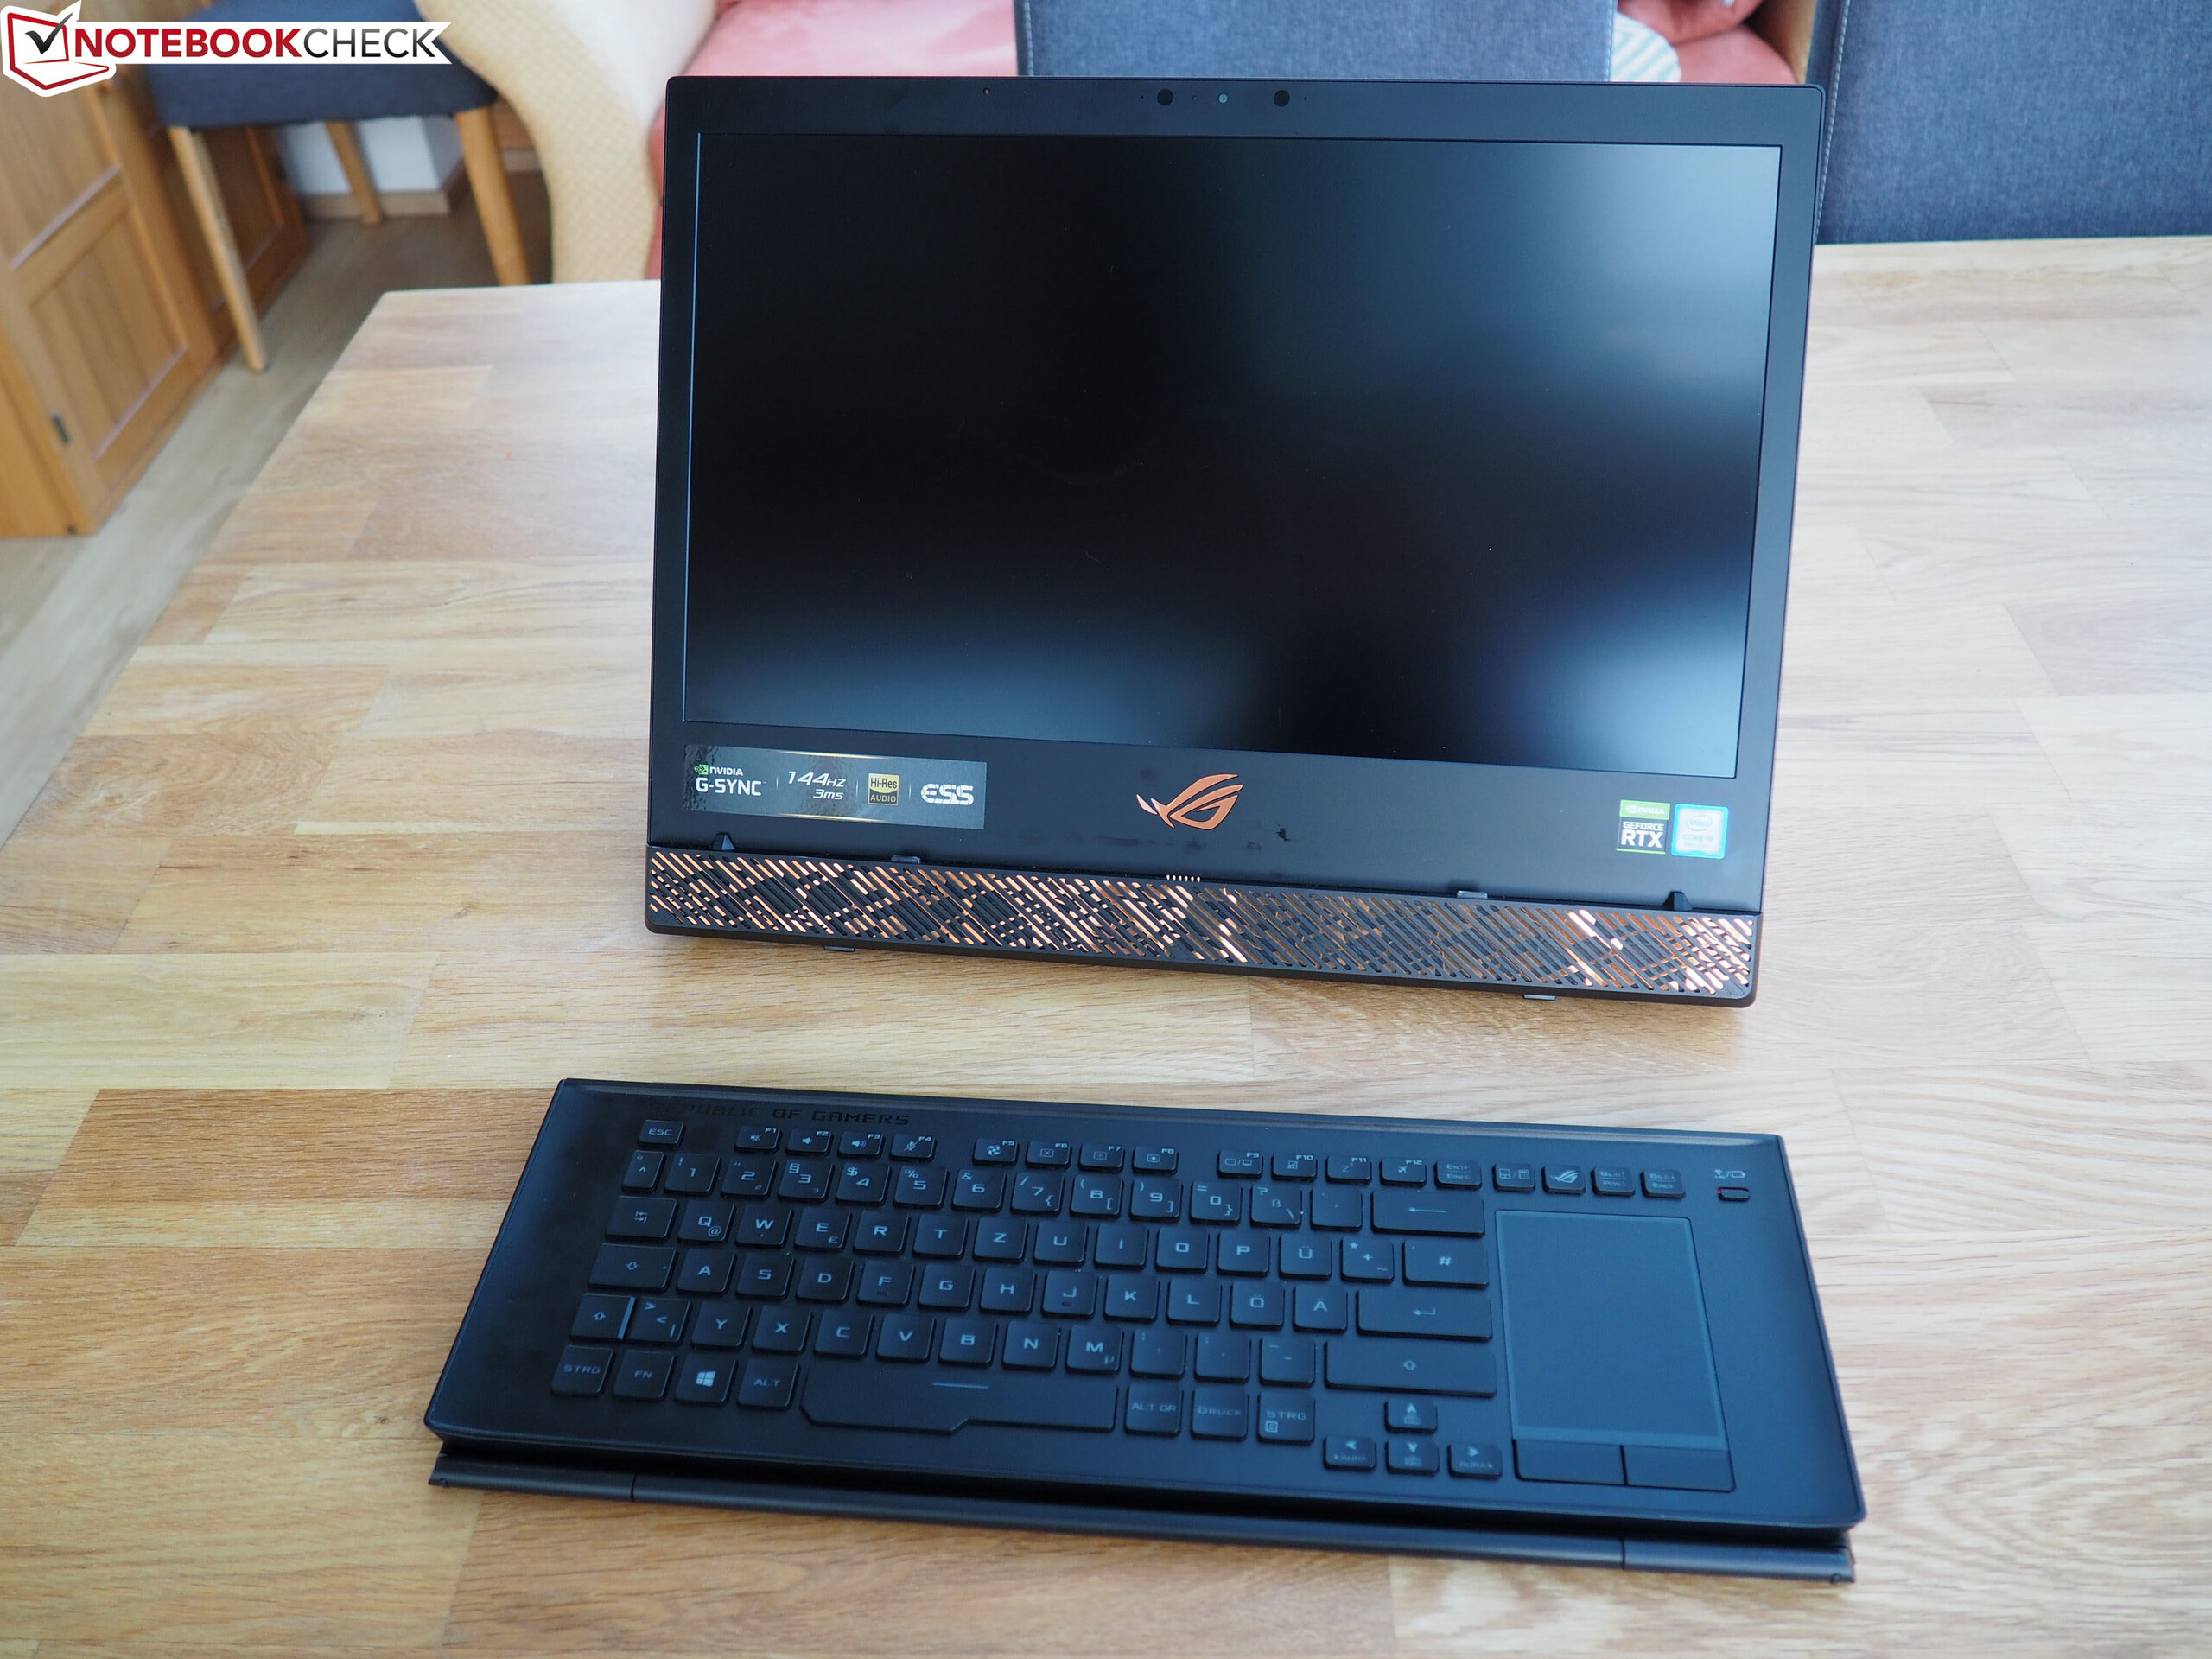
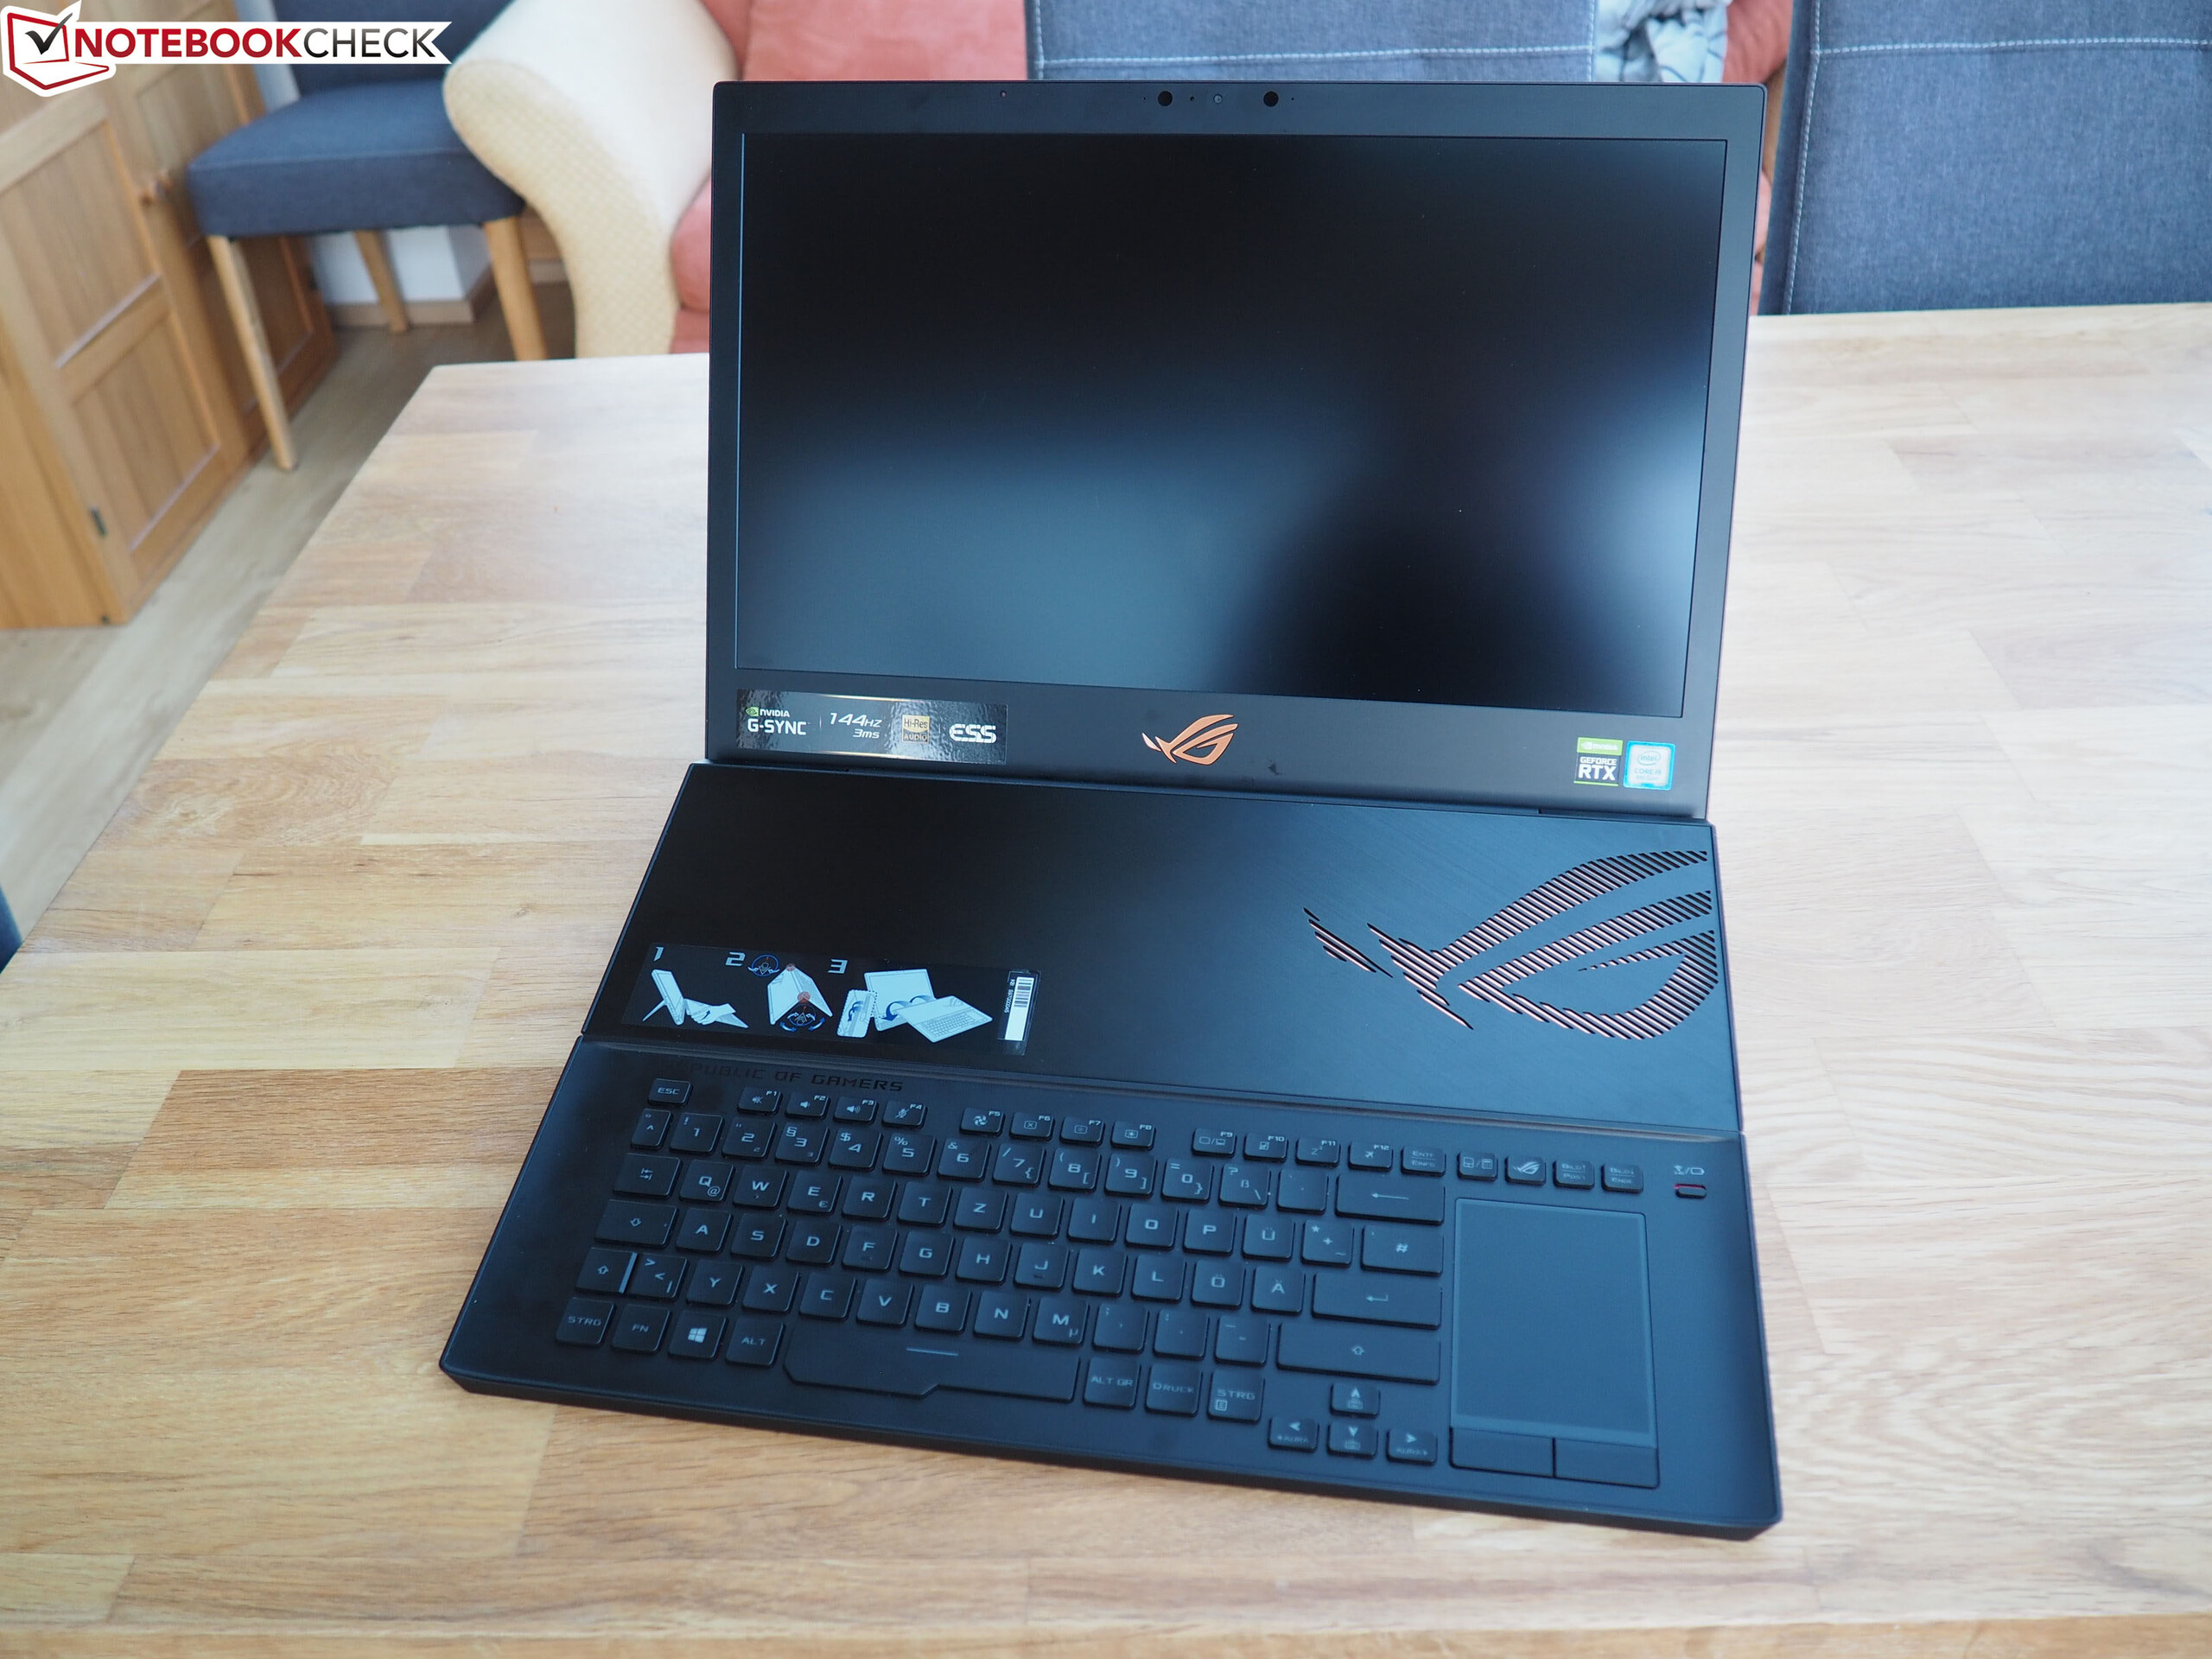
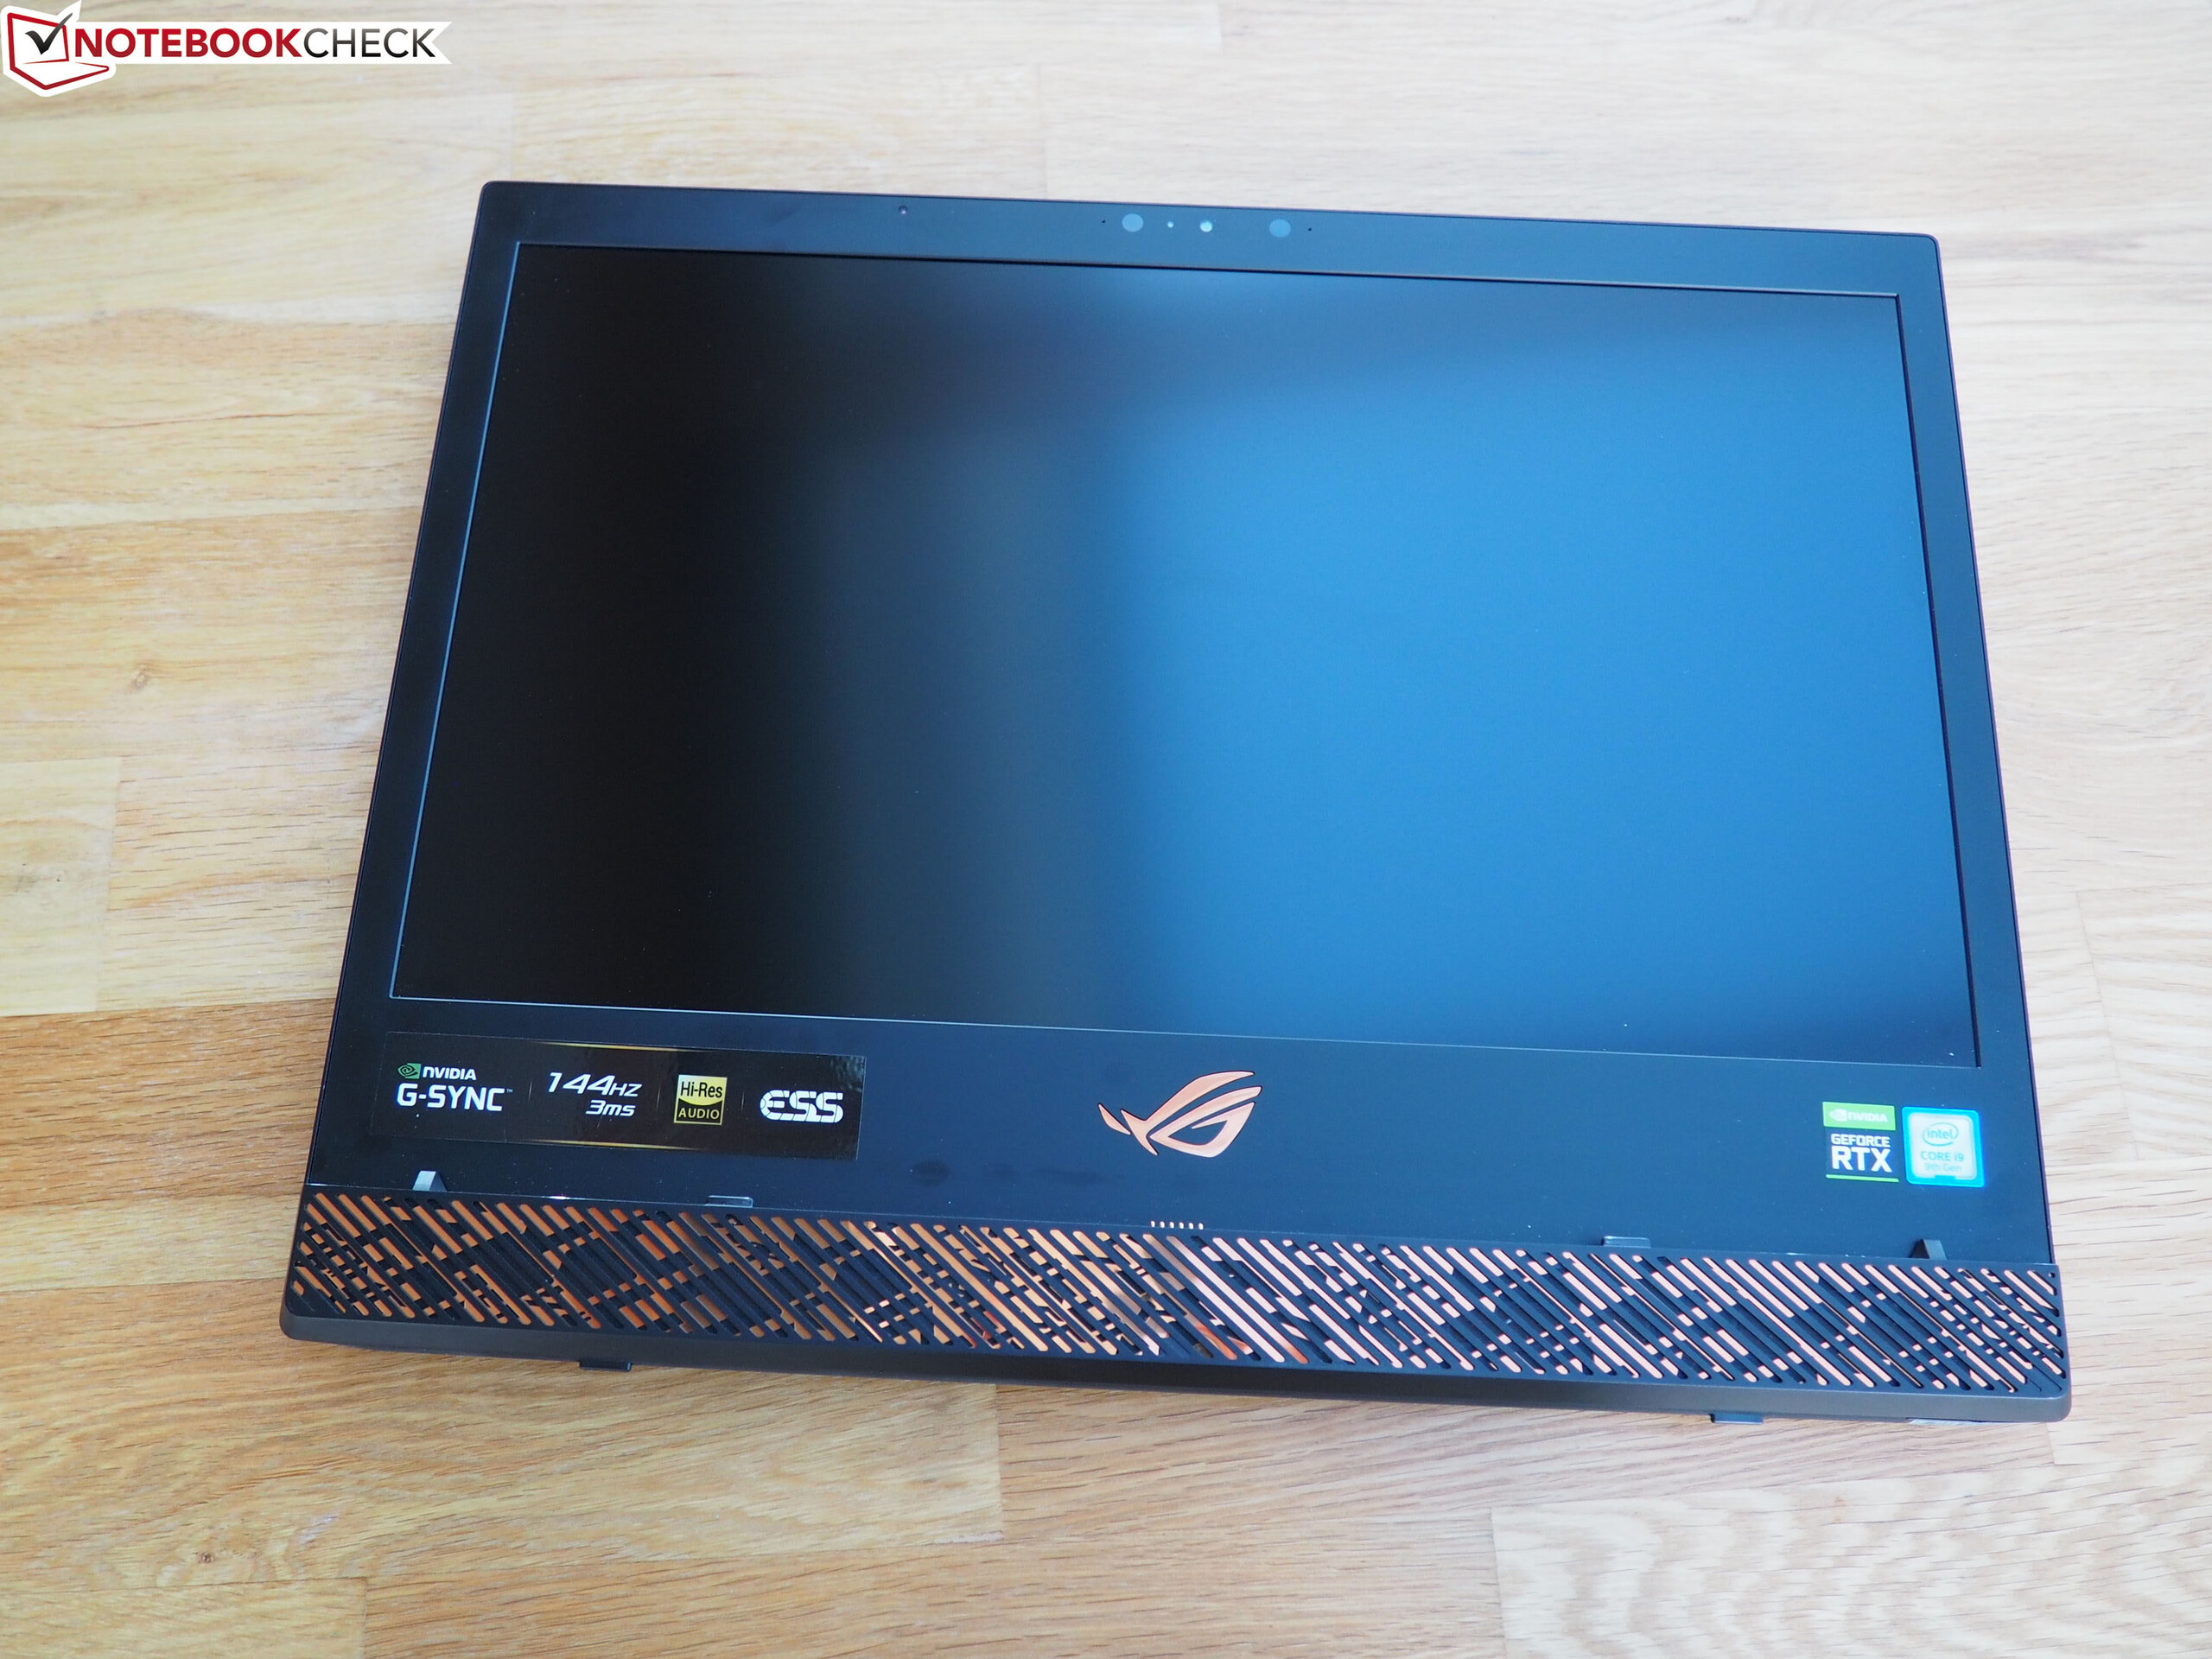
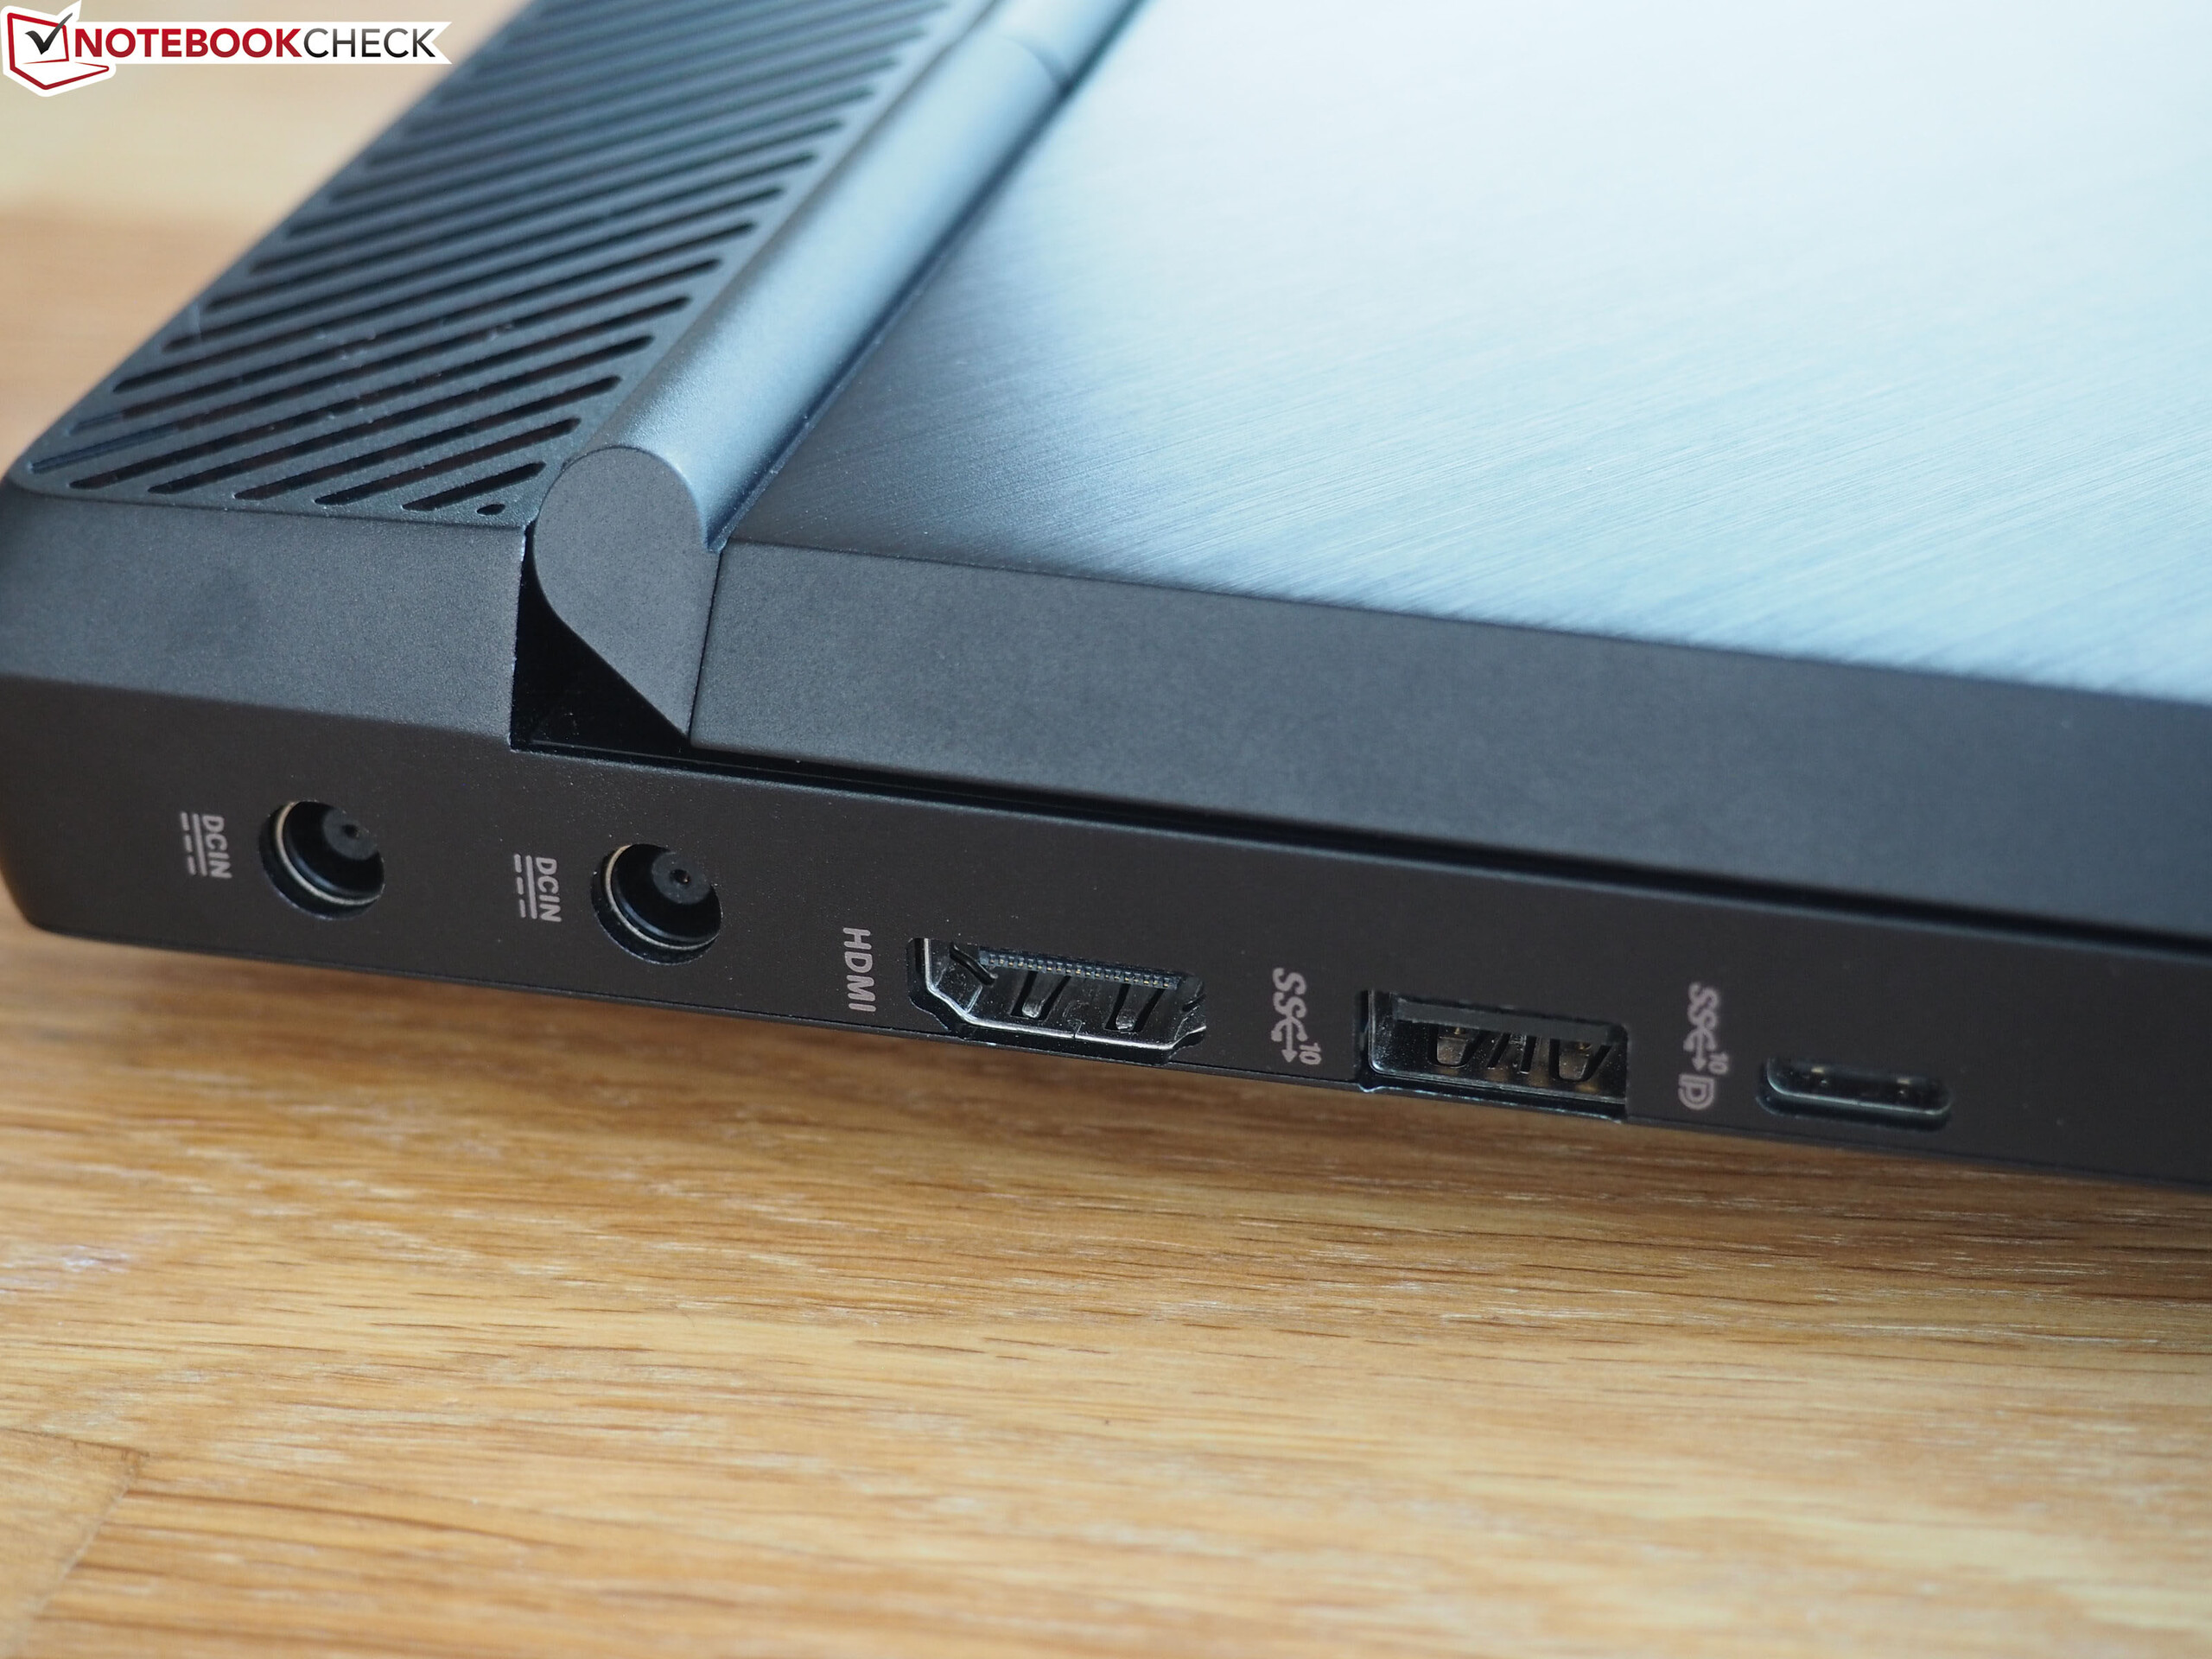
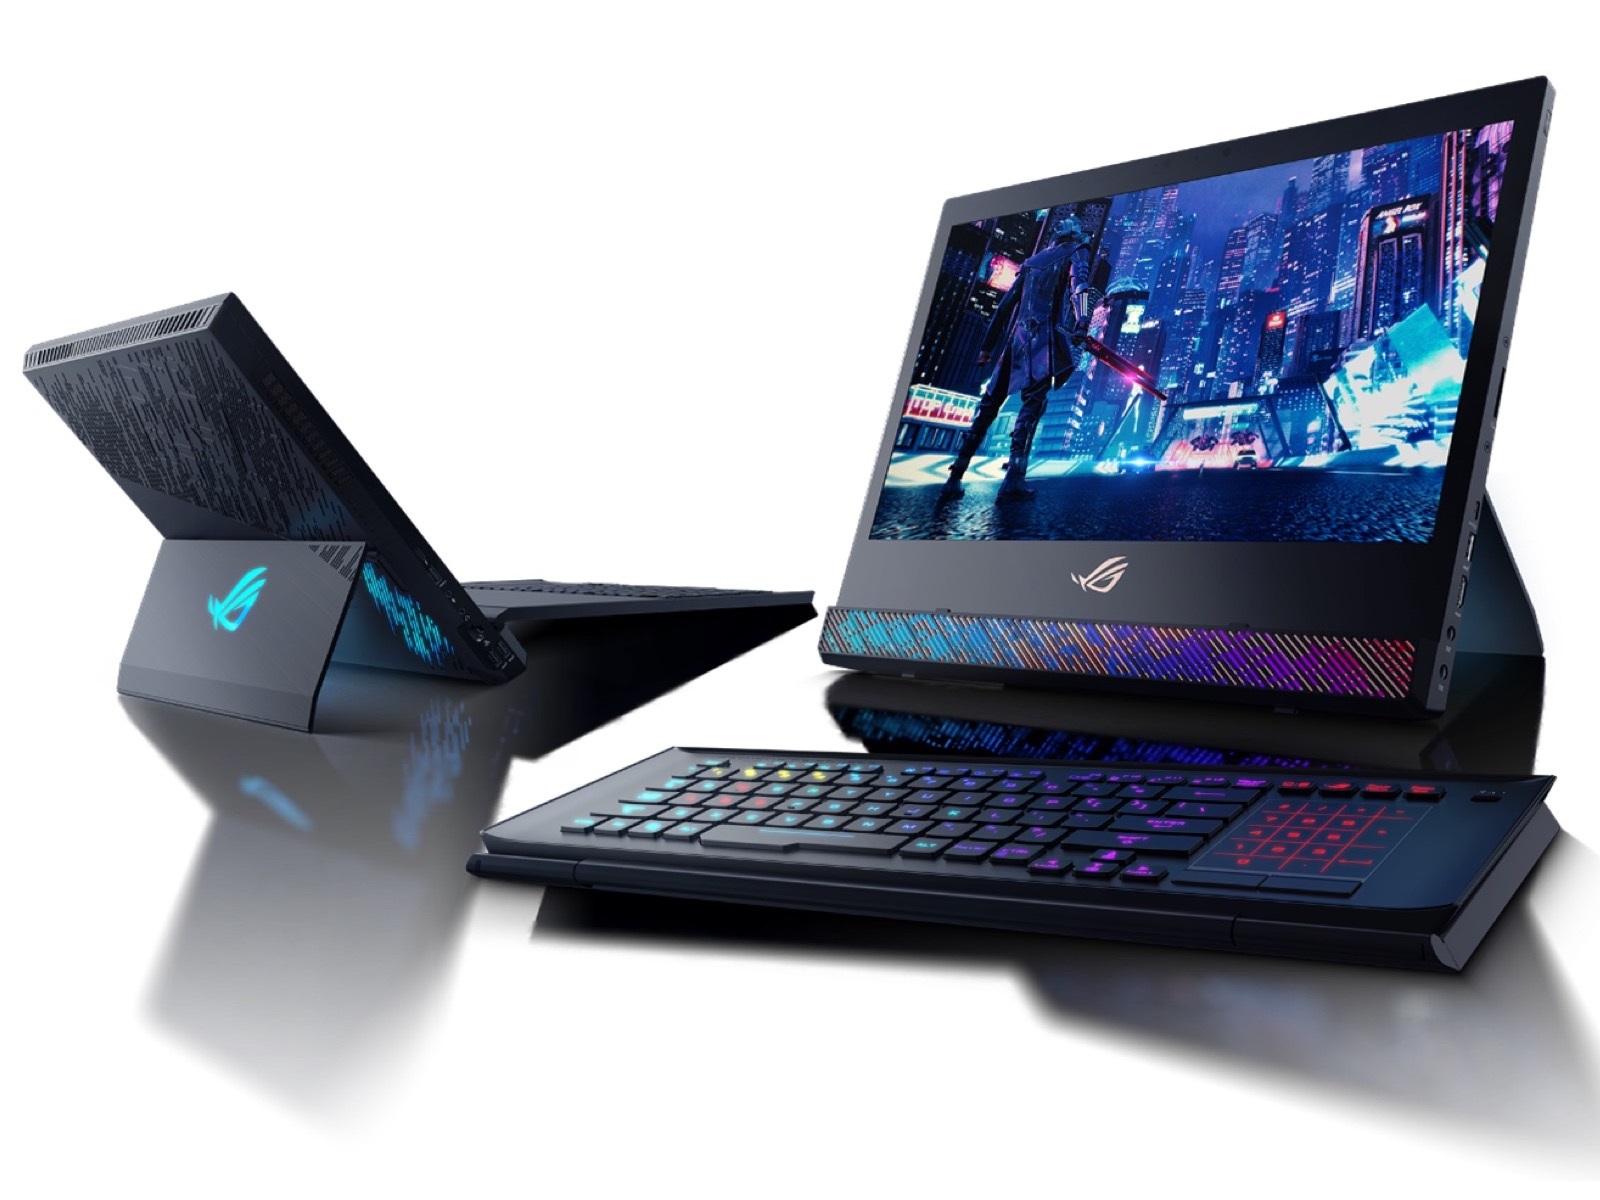
I fråga om teknik och kvalitet är ROG Mothership GZ700GX en utmärkt toppskiktslaptop. Det lyxiga metallchassit innehåller inte bara massor av portar utan också en 144 Hz-skärm med bra kontrastförhållande, bra betraktningsvinklar och utmärkta responstider.
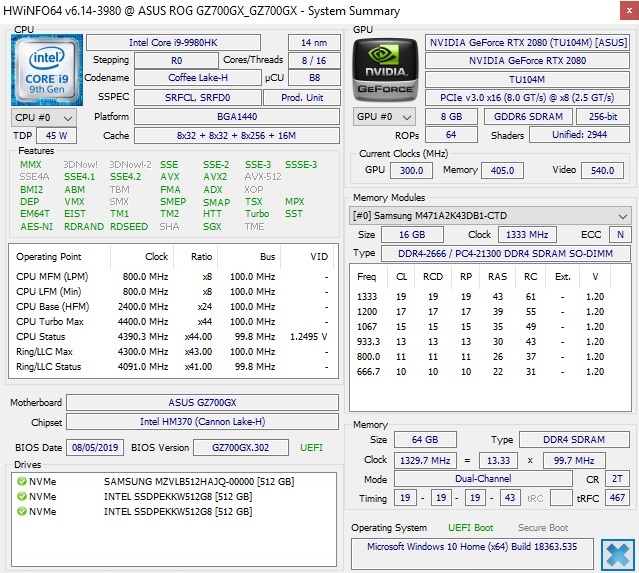
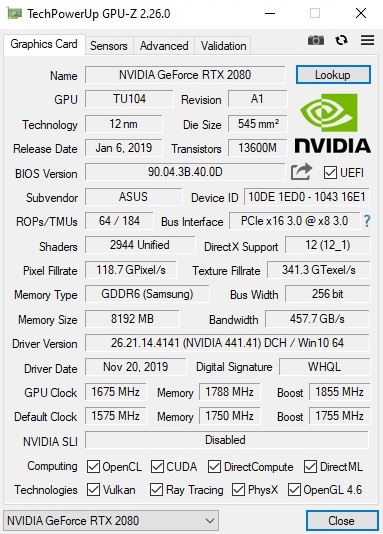
Prestandan är fantastisk. Intels Core i9-9980HK och Nvidias GeForce RTX 2080 utgör en extraordinärt snabb duo som har stöd av 64 GB DDR4 RAM och tre SSD-enheter i RAID 0. Vi imponerades också av det utmärkta ljudet och möjligheten att välja mellan G-Sync och Optimus.
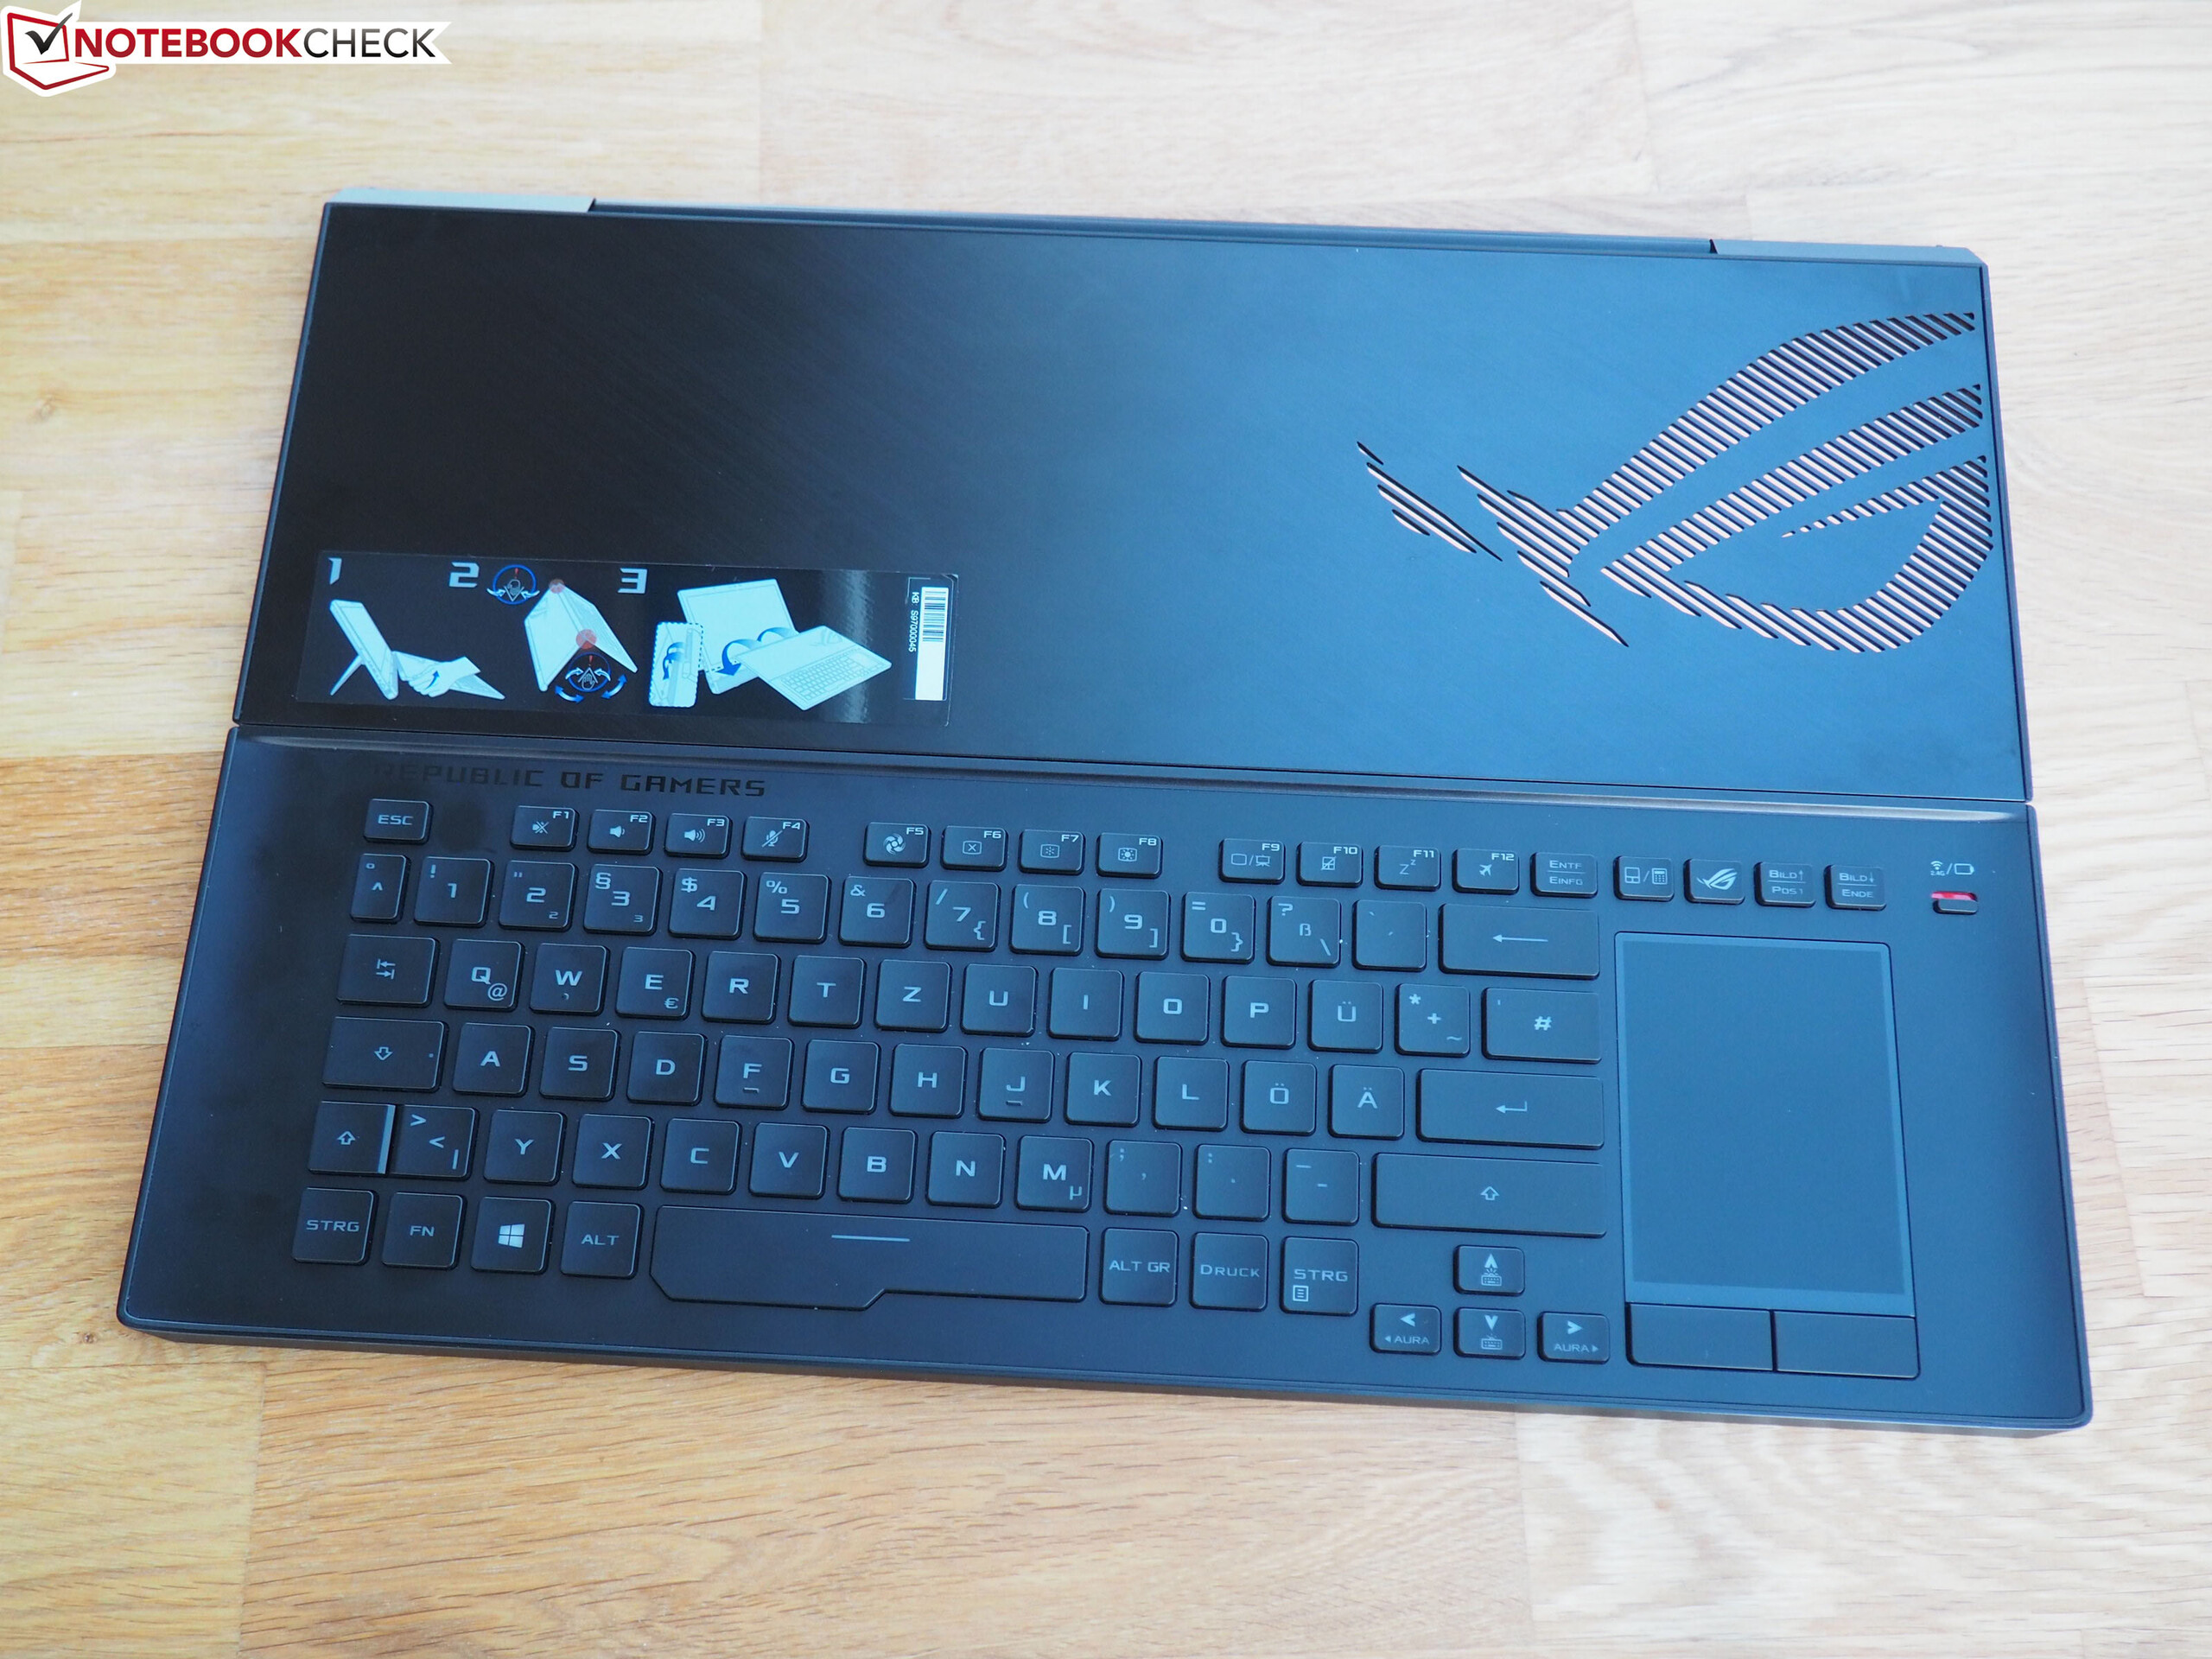
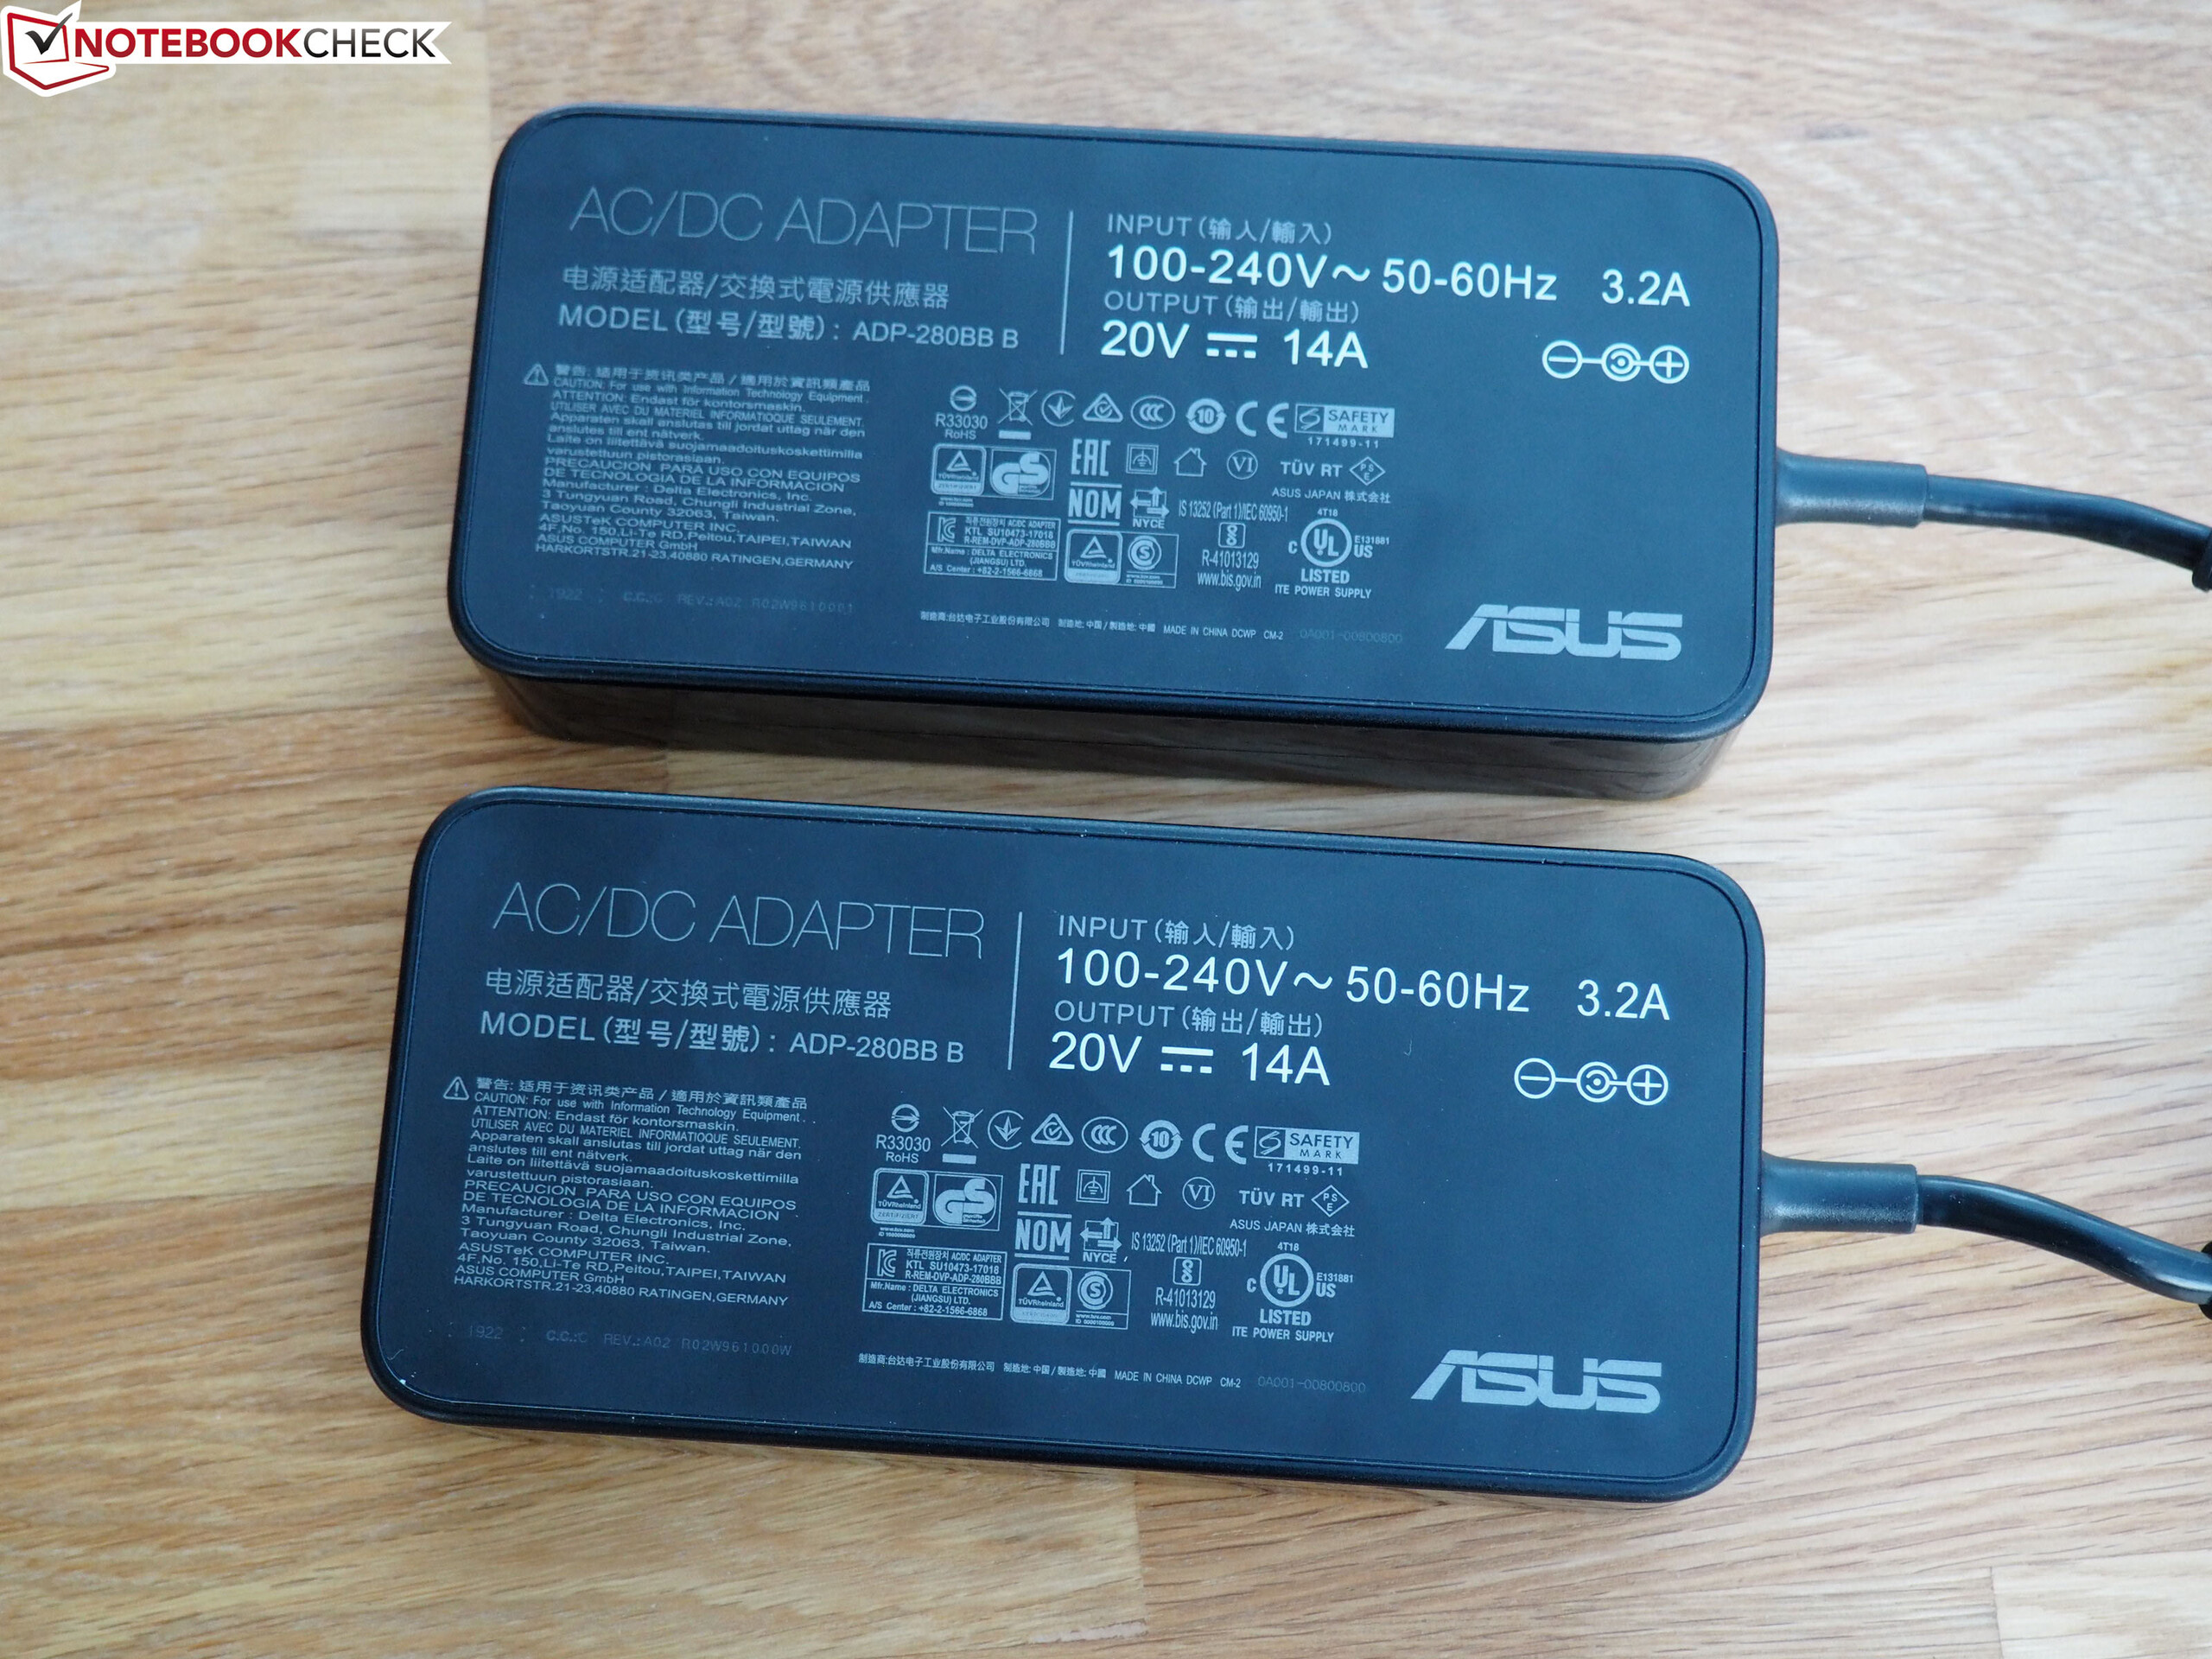
Det största problemet med GZ700GX är det absurda priset. Asus tar ordentligt betalt för sin 2-i-1 design, men frågan om hur praktiskt den är återstår. ROG Mothership kostar nästan dubbelt så mycket som andra bärbara datorer med RTX 2080.
Asus ROG Mothership GZ700GX
- 05/14/2020 v7 (old)
Florian Glaser
Price comparison