Test: Gigabyte Aero 15 XB - Tar ledningen med OLED (Sammanfattning)
Gradering | Datum | Modell | Vikt | Höjd | Storlek | Upplösning | Pris |
|---|---|---|---|---|---|---|---|
| 85.8 % v7 (old) | 05/2020 | Gigabyte Aero 15 OLED XB-8DE51B0SP i7-10875H, GeForce RTX 2070 Super Max-Q | 2.2 kg | 20 mm | 15.60" | 3840x2160 | |
| 82.8 % v7 (old) | 05/2020 | MSI GS66 Stealth 10SFS i9-10980HK, GeForce RTX 2070 Super Max-Q | 2.2 kg | 20 mm | 15.60" | 1920x1080 | |
| 84.4 % v7 (old) | 08/2019 | Gigabyte Aero 15 OLED XA i7-9750H, GeForce RTX 2070 Max-Q | 2.2 kg | 20 mm | 15.60" | 3840x2160 | |
| 84 % v7 (old) | 08/2019 | Acer Predator Triton 500 PT515-51-71PZ i7-9750H, GeForce RTX 2070 Max-Q | 2.1 kg | 18 mm | 15.60" | 1920x1080 | |
| 82.3 % v7 (old) | 09/2019 | HP Omen X 2S 15-dg0075cl i7-9750H, GeForce RTX 2070 Max-Q | 2.4 kg | 19.8 mm | 15.60" | 1920x1080 | |
| 82.8 % v7 (old) | 12/2019 | Schenker XMG Neo 15 XNE15M19 i7-9750H, GeForce RTX 2070 Max-Q | 2.1 kg | 22 mm | 15.60" | 1920x1080 |
| SD Card Reader | |
| average JPG Copy Test (av. of 3 runs) | |
| Gigabyte Aero 15 OLED XB-8DE51B0SP (Toshiba Exceria Pro SDXC 64 GB UHS-II) | |
| Gigabyte Aero 15 OLED XA (Toshiba Exceria Pro SDXC 64 GB UHS-II) | |
| Schenker XMG Neo 15 XNE15M19 (Toshiba Exceria Pro SDXC 64 GB UHS-II) | |
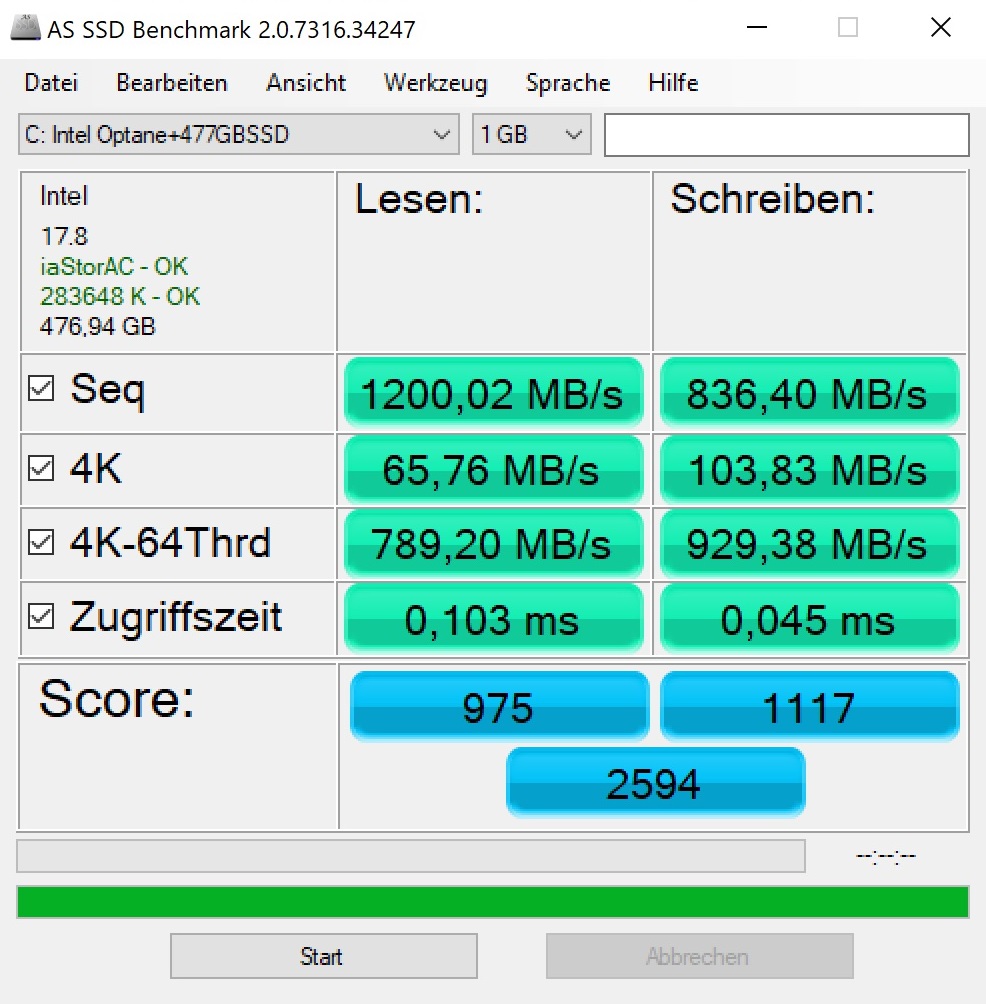
| maximum AS SSD Seq Read Test (1GB) | |
| Gigabyte Aero 15 OLED XB-8DE51B0SP (Toshiba Exceria Pro SDXC 64 GB UHS-II) | |
| Gigabyte Aero 15 OLED XA (Toshiba Exceria Pro SDXC 64 GB UHS-II) | |
| Schenker XMG Neo 15 XNE15M19 (Toshiba Exceria Pro SDXC 64 GB UHS-II) | |
| Networking | |
| iperf3 transmit AX12 | |
| MSI GS66 Stealth 10SFS | |
| Gigabyte Aero 15 OLED XB-8DE51B0SP | |
| Schenker XMG Neo 15 XNE15M19 | |
| iperf3 receive AX12 | |
| Schenker XMG Neo 15 XNE15M19 | |
| MSI GS66 Stealth 10SFS | |
| Gigabyte Aero 15 OLED XB-8DE51B0SP | |

")
")
| |||||||||||||||||||||||||
Distribution av ljusstyrkan: 93 %
Mitt på batteriet: 385 cd/m²
Kontrast: ∞:1 (Svärta: 0 cd/m²)
ΔE ColorChecker Calman: 2.46 | ∀{0.5-29.43 Ø4.72}
calibrated: 2.6
ΔE Greyscale Calman: 1.39 | ∀{0.09-98 Ø4.97}
100% sRGB (Argyll 1.6.3 3D)
98% AdobeRGB 1998 (Argyll 1.6.3 3D)
98.2% AdobeRGB 1998 (Argyll 3D)
100% sRGB (Argyll 3D)
99.9% Display P3 (Argyll 3D)
Gamma: 2.31
CCT: 6395 K
| Gigabyte Aero 15 OLED XB-8DE51B0SP Samsung SDCA029, OLED, 3840x2160 | MSI GS66 Stealth 10SFS AUO B156HAN12.0 (AUO328E), IPS, 1920x1080 | Gigabyte Aero 15 OLED XA Samsung SDCA029, OLED, 3840x2160 | Acer Predator Triton 500 PT515-51-71PZ NV156FHM-N4K (BOE082A), IPS, 1920x1080 | HP Omen X 2S 15-dg0075cl AU Optronics AUO82ED, IPS, 1920x1080 | Schenker XMG Neo 15 XNE15M19 NV156FHM-N4G (BOE084D), IPS, 1920x1080 | |
|---|---|---|---|---|---|---|
| Display | -19% | -25% | -25% | -26% | ||
| Display P3 Coverage (%) | 99.9 | 69.5 -30% | 64.6 -35% | 66.2 -34% | 64 -36% | |
| sRGB Coverage (%) | 100 | 99.6 0% | 92.6 -7% | 92.3 -8% | 90.3 -10% | |
| AdobeRGB 1998 Coverage (%) | 98.2 | 70.8 -28% | 66 -33% | 67.2 -32% | 65.4 -33% | |
| Response Times | -485% | -16% | -329% | -546% | -452% | |
| Response Time Grey 50% / Grey 80% * (ms) | 2.2 ? | 14 ? -536% | 2.4 ? -9% | 5.2 ? -136% | 15.2 ? -591% | 9.6 ? -336% |
| Response Time Black / White * (ms) | 1.8 ? | 9.6 ? -433% | 2.2 ? -22% | 11.2 ? -522% | 10.8 ? -500% | 12 ? -567% |
| PWM Frequency (Hz) | 60 ? | 60 ? | ||||
| Screen | -34% | -31% | -34% | -67% | -31% | |
| Brightness middle (cd/m²) | 385 | 316 -18% | 373 -3% | 288 -25% | 324.8 -16% | 313 -19% |
| Brightness (cd/m²) | 390 | 311 -20% | 375 -4% | 265 -32% | 316 -19% | 295 -24% |
| Brightness Distribution (%) | 93 | 92 -1% | 93 0% | 84 -10% | 84 -10% | 89 -4% |
| Black Level * (cd/m²) | 0.21 | 0.22 | 0.26 | 0.3 | ||
| Colorchecker dE 2000 * | 2.46 | 3.03 -23% | 3.98 -62% | 3.22 -31% | 4.96 -102% | 3.33 -35% |
| Colorchecker dE 2000 max. * | 4.01 | 7.32 -83% | 6.28 -57% | 6.26 -56% | 8.95 -123% | 6.25 -56% |
| Colorchecker dE 2000 calibrated * | 2.6 | 1.1 58% | 1.5 42% | 3.23 -24% | 1.77 32% | |
| Greyscale dE 2000 * | 1.39 | 3.9 -181% | 2.81 -102% | 3.43 -147% | 5 -260% | 3.1 -123% |
| Gamma | 2.31 95% | 2.42 91% | 2.62 84% | 2.41 91% | 2.21 100% | 2.51 88% |
| CCT | 6395 102% | 7439 87% | 6434 101% | 7290 89% | 7742 84% | 6930 94% |
| Color Space (Percent of AdobeRGB 1998) (%) | 98 | 65 -34% | 78 -20% | 60 -39% | 59.8 -39% | 59 -40% |
| Color Space (Percent of sRGB) (%) | 100 | 100 0% | 97 -3% | 93 -7% | 91.8 -8% | 90 -10% |
| Contrast (:1) | 1505 | 1309 | 1249 | 1043 | ||
| Totalt genomsnitt (program/inställningar) | -179% /
-95% | -24% /
-28% | -129% /
-74% | -213% /
-126% | -170% /
-90% |
* ... mindre är bättre
Visa svarstider
| ↔ Svarstid svart till vitt | ||
|---|---|---|
| 1.8 ms ... stiga ↗ och falla ↘ kombinerat | ↗ 1 ms stiga | 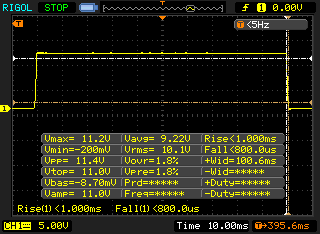 |
| ↘ 0.8 ms hösten | ||
| Skärmen visar väldigt snabba svarsfrekvenser i våra tester och borde vara mycket väl lämpad för fartfyllt spel. I jämförelse sträcker sig alla testade enheter från 0.1 (minst) till 240 (maximalt) ms. » 11 % av alla enheter är bättre. Det betyder att den uppmätta svarstiden är bättre än genomsnittet av alla testade enheter (19.8 ms). | ||
| ↔ Svarstid 50 % grått till 80 % grått | ||
| 2.2 ms ... stiga ↗ och falla ↘ kombinerat | ↗ 1 ms stiga | 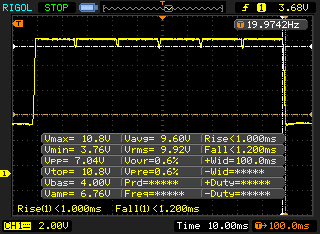 |
| ↘ 1.2 ms hösten | ||
| Skärmen visar väldigt snabba svarsfrekvenser i våra tester och borde vara mycket väl lämpad för fartfyllt spel. I jämförelse sträcker sig alla testade enheter från 0.165 (minst) till 636 (maximalt) ms. » 11 % av alla enheter är bättre. Det betyder att den uppmätta svarstiden är bättre än genomsnittet av alla testade enheter (31 ms). | ||
Skärmflimmer / PWM (Puls-Width Modulation)
| Skärmflimmer / PWM upptäckt | 60 Hz | ≤ 80 % ljusstyrka inställning | 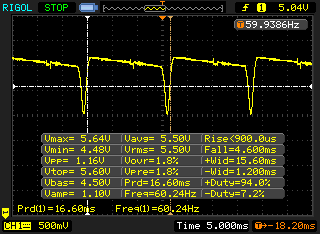 |
Displayens bakgrundsbelysning flimrar vid 60 Hz (i värsta fall, t.ex. med PWM) Flimrande upptäckt vid en ljusstyrkeinställning på 80 % och lägre. Det ska inte finnas något flimmer eller PWM över denna ljusstyrkeinställning. Frekvensen för 60 Hz är mycket låg, så flimmer kan orsaka ögon- och huvudvärk efter långvarig användning. Som jämförelse: 52 % av alla testade enheter använder inte PWM för att dämpa skärmen. Om PWM upptäcktes mättes ett medelvärde av 7747 (minst: 5 - maximum: 343500) Hz. | |||
| Blender - v2.79 BMW27 CPU | |
| MSI GS66 Stealth 10SFS | |
| Gigabyte Aero 15 OLED XB-8DE51B0SP | |
| 7-Zip 18.03 | |
| 7z b 4 -mmt1 | |
| Gigabyte Aero 15 OLED XB-8DE51B0SP | |
| MSI GS66 Stealth 10SFS | |
| 7z b 4 | |
| Gigabyte Aero 15 OLED XB-8DE51B0SP | |
| MSI GS66 Stealth 10SFS | |
| Geekbench 5.5 | |
| Single-Core | |
| Gigabyte Aero 15 OLED XB-8DE51B0SP | |
| MSI GS66 Stealth 10SFS | |
| Multi-Core | |
| Gigabyte Aero 15 OLED XB-8DE51B0SP | |
| MSI GS66 Stealth 10SFS | |
| HWBOT x265 Benchmark v2.2 - 4k Preset | |
| Gigabyte Aero 15 OLED XB-8DE51B0SP | |
| MSI GS66 Stealth 10SFS | |
| LibreOffice - 20 Documents To PDF | |
| MSI GS66 Stealth 10SFS | |
| Gigabyte Aero 15 OLED XB-8DE51B0SP | |
| R Benchmark 2.5 - Overall mean | |
| MSI GS66 Stealth 10SFS | |
| Gigabyte Aero 15 OLED XB-8DE51B0SP | |
* ... mindre är bättre
| DPC Latencies / LatencyMon - interrupt to process latency (max), Web, Youtube, Prime95 | |
| MSI GS66 Stealth 10SFS | |
| Gigabyte Aero 15 OLED XB-8DE51B0SP | |
* ... mindre är bättre
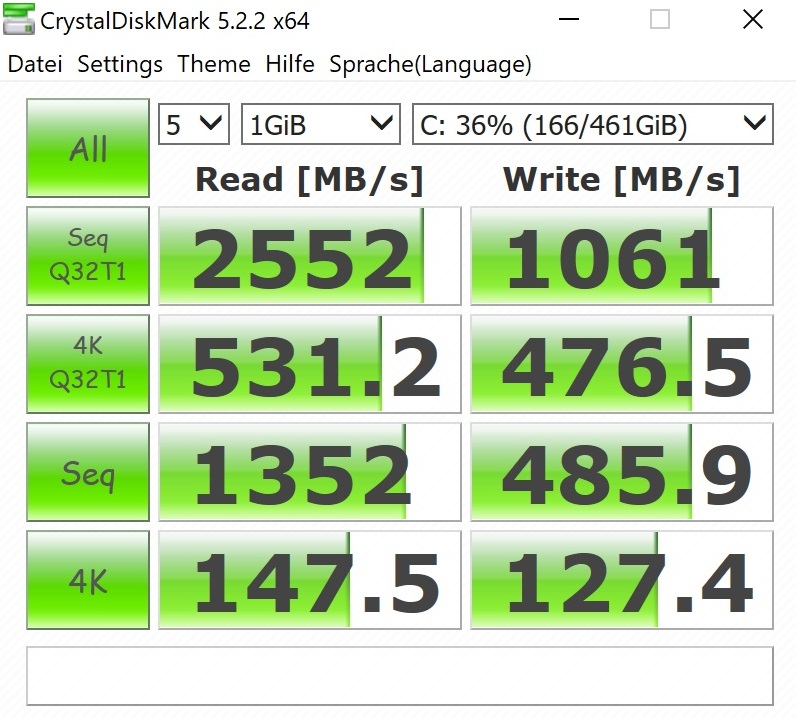
| Gigabyte Aero 15 OLED XB-8DE51B0SP Intel Optane Memory H10 with Solid State Storage 32GB + 512GB HBRPEKNX0202A(L/H) | MSI GS66 Stealth 10SFS Samsung SSD PM981 MZVLB1T0HALR | Gigabyte Aero 15 OLED XA Intel SSD 600p SSDPEKKW512G8L | Acer Predator Triton 500 PT515-51-71PZ WDC PC SN720 SDAPNTW-512G | HP Omen X 2S 15-dg0075cl WDC PC SN720 SDAPNTW-1T00 | Schenker XMG Neo 15 XNE15M19 Seagate FireCuda 510 SSD ZP1000GM30001 | |
|---|---|---|---|---|---|---|
| CrystalDiskMark 5.2 / 6 | 62% | 34% | 62% | 70% | 28% | |
| Write 4K (MB/s) | 127.4 | 131.3 3% | 126.7 -1% | 108.8 -15% | 137.4 8% | 108.7 -15% |
| Read 4K (MB/s) | 147.5 | 45.84 -69% | 66.1 -55% | 40.31 -73% | 41.37 -72% | 41.4 -72% |
| Write Seq (MB/s) | 485.9 | 2370 388% | 1538 217% | 2488 412% | 2500 415% | 1083 123% |
| Read Seq (MB/s) | 1352 | 1509 12% | 2269 68% | 1916 42% | 1576 17% | 917 -32% |
| Write 4K Q32T1 (MB/s) | 476.5 | 481.5 1% | 456.7 -4% | 382.4 -20% | 446.7 -6% | 468.5 -2% |
| Read 4K Q32T1 (MB/s) | 531 | 560 5% | 554 4% | 421.8 -21% | 522 -2% | 530 0% |
| Write Seq Q32T1 (MB/s) | 1061 | 2392 125% | 1541 45% | 2542 140% | 2796 164% | 3057 188% |
| Read Seq Q32T1 (MB/s) | 2552 | 3232 27% | 2567 1% | 3320 30% | 3415 34% | 3422 34% |

| 3DMark 11 Performance | 24383 poäng | |
| 3DMark Cloud Gate Standard Score | 47119 poäng | |
| 3DMark Fire Strike Score | 18947 poäng | |
| 3DMark Time Spy Score | 8066 poäng | |
Hjälp | ||
| The Witcher 3 | |
| 1920x1080 High Graphics & Postprocessing (Nvidia HairWorks Off) | |
| Gigabyte Aero 15 OLED XB-8DE51B0SP | |
| HP Omen X 2S 15-dg0075cl | |
| MSI GS66 Stealth 10SFS | |
| Acer Predator Triton 500 PT515-51-71PZ | |
| Schenker XMG Neo 15 XNE15M19 | |
| 1920x1080 Ultra Graphics & Postprocessing (HBAO+) | |
| Gigabyte Aero 15 OLED XB-8DE51B0SP | |
| MSI GS66 Stealth 10SFS | |
| HP Omen X 2S 15-dg0075cl | |
| Acer Predator Triton 500 PT515-51-71PZ | |
| Gigabyte Aero 15 OLED XA | |
| Schenker XMG Neo 15 XNE15M19 | |
| låg | med. | hög | ultra | QHD | 4K | |
|---|---|---|---|---|---|---|
| GTA V (2015) | 182 | 176 | 161 | 91.3 | 73.1 | |
| The Witcher 3 (2015) | 152 | 79.1 | 52.9 | |||
| Dota 2 Reborn (2015) | 157.8 | 148.3 | 140.9 | 132.3 | ||
| X-Plane 11.11 (2018) | 122 | 106 | 89.3 | 67.8 | ||
| Shadow of the Tomb Raider (2018) | 110 | 100 | 68 | 35 | ||
| Battlefield V (2018) | 139 | 130 | 100 | 58.2 | ||
| Far Cry New Dawn (2019) | 110 | 98 | 80 | 45 | ||
| Metro Exodus (2019) | 75.4 | 60.4 | 46.7 | 29.1 | ||
| The Division 2 (2019) | 105 | 77 | 54 | 29 | ||
| Anno 1800 (2019) | 84.2 | 46.8 | 37 | 21.5 | ||
| Control (2019) | 60.2 | 40.6 | 23.8 | |||
| Borderlands 3 (2019) | 84.4 | 64.8 | 45.6 | 24.5 | ||
| Ghost Recon Breakpoint (2019) | 92 | 69 | 50 | 29 | ||
| Red Dead Redemption 2 (2019) | 65.7 | 42.4 | 34.3 | 22 |
Ljudnivå
| Låg belastning |
| 34 / 36 / 41 dB(A) |
| Hög belastning |
| 48 / 54 dB(A) |
 | ||
30 dB tyst 40 dB(A) hörbar 50 dB(A) högt ljud |
||
min: | ||
| Gigabyte Aero 15 OLED XB-8DE51B0SP i7-10875H, GeForce RTX 2070 Super Max-Q | MSI GS66 Stealth 10SFS i9-10980HK, GeForce RTX 2070 Super Max-Q | Gigabyte Aero 15 OLED XA i7-9750H, GeForce RTX 2070 Max-Q | Acer Predator Triton 500 PT515-51-71PZ i7-9750H, GeForce RTX 2070 Max-Q | HP Omen X 2S 15-dg0075cl i7-9750H, GeForce RTX 2070 Max-Q | Schenker XMG Neo 15 XNE15M19 i7-9750H, GeForce RTX 2070 Max-Q | |
|---|---|---|---|---|---|---|
| Noise | 1% | -1% | 5% | 9% | 3% | |
| av / miljö * (dB) | 30 | 30 -0% | 30 -0% | 30 -0% | 29 3% | 31 -3% |
| Idle Minimum * (dB) | 34 | 32 6% | 34 -0% | 30 12% | 30.5 10% | 31 9% |
| Idle Average * (dB) | 36 | 34 6% | 35 3% | 33 8% | 31.5 12% | 34 6% |
| Idle Maximum * (dB) | 41 | 39 5% | 45 -10% | 39 5% | 31.5 23% | 37 10% |
| Load Average * (dB) | 48 | 53 -10% | 43 10% | 45 6% | 40.6 15% | 47 2% |
| Witcher 3 ultra * (dB) | 48 | 48 -0% | 52 -8% | 49 -2% | 49.5 -3% | 50 -4% |
| Load Maximum * (dB) | 54 | 53 2% | 54 -0% | 51 6% | 53.4 1% | 54 -0% |
* ... mindre är bättre
(-) Den maximala temperaturen på ovansidan är 49 °C / 120 F, jämfört med genomsnittet av 40.4 °C / 105 F , allt från 21.2 till 68.8 °C för klassen Gaming.
(-) Botten värms upp till maximalt 61 °C / 142 F, jämfört med genomsnittet av 43.2 °C / 110 F
(+) Vid tomgångsbruk är medeltemperaturen för ovansidan 25.6 °C / 78 F, jämfört med enhetsgenomsnittet på 33.9 °C / ### class_avg_f### F.
(-) När du spelar The Witcher 3 är medeltemperaturen för ovansidan 40.2 °C / 104 F, jämfört med enhetsgenomsnittet på 33.9 °C / ## #class_avg_f### F.
(±) Handledsstöden och pekplattan kan bli väldigt varma vid beröring med maximalt 36 °C / 96.8 F.
(-) Medeltemperaturen för handledsstödsområdet på liknande enheter var 28.8 °C / 83.8 F (-7.2 °C / -13 F).
| Gigabyte Aero 15 OLED XB-8DE51B0SP i7-10875H, GeForce RTX 2070 Super Max-Q | MSI GS66 Stealth 10SFS i9-10980HK, GeForce RTX 2070 Super Max-Q | Gigabyte Aero 15 OLED XA i7-9750H, GeForce RTX 2070 Max-Q | Acer Predator Triton 500 PT515-51-71PZ i7-9750H, GeForce RTX 2070 Max-Q | HP Omen X 2S 15-dg0075cl i7-9750H, GeForce RTX 2070 Max-Q | Schenker XMG Neo 15 XNE15M19 i7-9750H, GeForce RTX 2070 Max-Q | |
|---|---|---|---|---|---|---|
| Heat | -1% | -7% | -0% | -25% | -13% | |
| Maximum Upper Side * (°C) | 49 | 53 -8% | 49 -0% | 49 -0% | 48.8 -0% | 60 -22% |
| Maximum Bottom * (°C) | 61 | 55 10% | 59 3% | 59 3% | 55 10% | 66 -8% |
| Idle Upper Side * (°C) | 27 | 28 -4% | 33 -22% | 28 -4% | 41 -52% | 30 -11% |
| Idle Bottom * (°C) | 29 | 29 -0% | 32 -10% | 29 -0% | 45.6 -57% | 32 -10% |
* ... mindre är bättre
Gigabyte Aero 15 OLED XB-8DE51B0SP ljudanalys
(+) | högtalare kan spela relativt högt (85 dB)
Bas 100 - 315 Hz
(-) | nästan ingen bas - i genomsnitt 23.8% lägre än medianen
(±) | linjäriteten för basen är genomsnittlig (9.7% delta till föregående frekvens)
Mellan 400 - 2000 Hz
(±) | högre mellan - i genomsnitt 5.2% högre än median
(+) | mids är linjära (6.9% delta till föregående frekvens)
Högsta 2 - 16 kHz
(+) | balanserade toppar - endast 2.2% från medianen
(+) | toppar är linjära (4.9% delta till föregående frekvens)
Totalt 100 - 16 000 Hz
(±) | linjäriteten för det totala ljudet är genomsnittlig (18.3% skillnad mot median)
Jämfört med samma klass
» 58% av alla testade enheter i den här klassen var bättre, 9% liknande, 33% sämre
» Den bästa hade ett delta på 6%, genomsnittet var 18%, sämst var 132%
Jämfört med alla testade enheter
» 40% av alla testade enheter var bättre, 8% liknande, 52% sämre
» Den bästa hade ett delta på 4%, genomsnittet var 23%, sämst var 134%
MSI GS66 Stealth 10SFS ljudanalys
(+) | högtalare kan spela relativt högt (91 dB)
Bas 100 - 315 Hz
(-) | nästan ingen bas - i genomsnitt 25.3% lägre än medianen
(+) | basen är linjär (6.8% delta till föregående frekvens)
Mellan 400 - 2000 Hz
(±) | högre mellan - i genomsnitt 9.2% högre än median
(±) | linjäriteten för mids är genomsnittlig (8.3% delta till föregående frekvens)
Högsta 2 - 16 kHz
(+) | balanserade toppar - endast 2.9% från medianen
(+) | toppar är linjära (5.8% delta till föregående frekvens)
Totalt 100 - 16 000 Hz
(±) | linjäriteten för det totala ljudet är genomsnittlig (23.5% skillnad mot median)
Jämfört med samma klass
» 85% av alla testade enheter i den här klassen var bättre, 5% liknande, 10% sämre
» Den bästa hade ett delta på 6%, genomsnittet var 18%, sämst var 132%
Jämfört med alla testade enheter
» 70% av alla testade enheter var bättre, 6% liknande, 24% sämre
» Den bästa hade ett delta på 4%, genomsnittet var 23%, sämst var 134%
| Av/Standby | |
| Låg belastning | |
| Hög belastning |
|
Förklaring:
min: | |
| Gigabyte Aero 15 OLED XB-8DE51B0SP i7-10875H, GeForce RTX 2070 Super Max-Q | MSI GS66 Stealth 10SFS i9-10980HK, GeForce RTX 2070 Super Max-Q | Gigabyte Aero 15 OLED XA i7-9750H, GeForce RTX 2070 Max-Q | Acer Predator Triton 500 PT515-51-71PZ i7-9750H, GeForce RTX 2070 Max-Q | HP Omen X 2S 15-dg0075cl i7-9750H, GeForce RTX 2070 Max-Q | Schenker XMG Neo 15 XNE15M19 i7-9750H, GeForce RTX 2070 Max-Q | |
|---|---|---|---|---|---|---|
| Power Consumption | 15% | -2% | 34% | -65% | 28% | |
| Idle Minimum * (Watt) | 18 | 13 28% | 23 -28% | 7 61% | 46 -156% | 11 39% |
| Idle Average * (Watt) | 21 | 16 24% | 25 -19% | 12 43% | 59 -181% | 15 29% |
| Idle Maximum * (Watt) | 38 | 27 29% | 33 13% | 22 42% | 65.5 -72% | 21 45% |
| Load Average * (Watt) | 113 | 109 4% | 96 15% | 86 24% | 99.8 12% | 94 17% |
| Witcher 3 ultra * (Watt) | 149 | 155 -4% | 168 -13% | 144 3% | 154.1 -3% | 143 4% |
| Load Maximum * (Watt) | 256 | 236 8% | 197 23% | 177 31% | 222.7 13% | 173 32% |
* ... mindre är bättre
| Gigabyte Aero 15 OLED XB-8DE51B0SP i7-10875H, GeForce RTX 2070 Super Max-Q, 94.2 Wh | MSI GS66 Stealth 10SFS i9-10980HK, GeForce RTX 2070 Super Max-Q, 99.99 Wh | Gigabyte Aero 15 OLED XA i7-9750H, GeForce RTX 2070 Max-Q, 94.24 Wh | Acer Predator Triton 500 PT515-51-71PZ i7-9750H, GeForce RTX 2070 Max-Q, Wh | HP Omen X 2S 15-dg0075cl i7-9750H, GeForce RTX 2070 Max-Q, 72 Wh | Schenker XMG Neo 15 XNE15M19 i7-9750H, GeForce RTX 2070 Max-Q, 62 Wh | |
|---|---|---|---|---|---|---|
| Batteridrifttid | -14% | -1% | 6% | -58% | -25% | |
| Reader / Idle (h) | 8.6 | 8.4 -2% | 9.9 15% | 11.1 29% | 3.7 -57% | 7.3 -15% |
| WiFi v1.3 (h) | 6.1 | 6.1 0% | 5.7 -7% | 8 31% | 2.2 -64% | 5.7 -7% |
| Load (h) | 2.8 | 1.7 -39% | 2.5 -11% | 1.6 -43% | 1.3 -54% | 1.3 -54% |
För
Emot
Läs den fullständiga versionen av den här recensionen på engelska här.
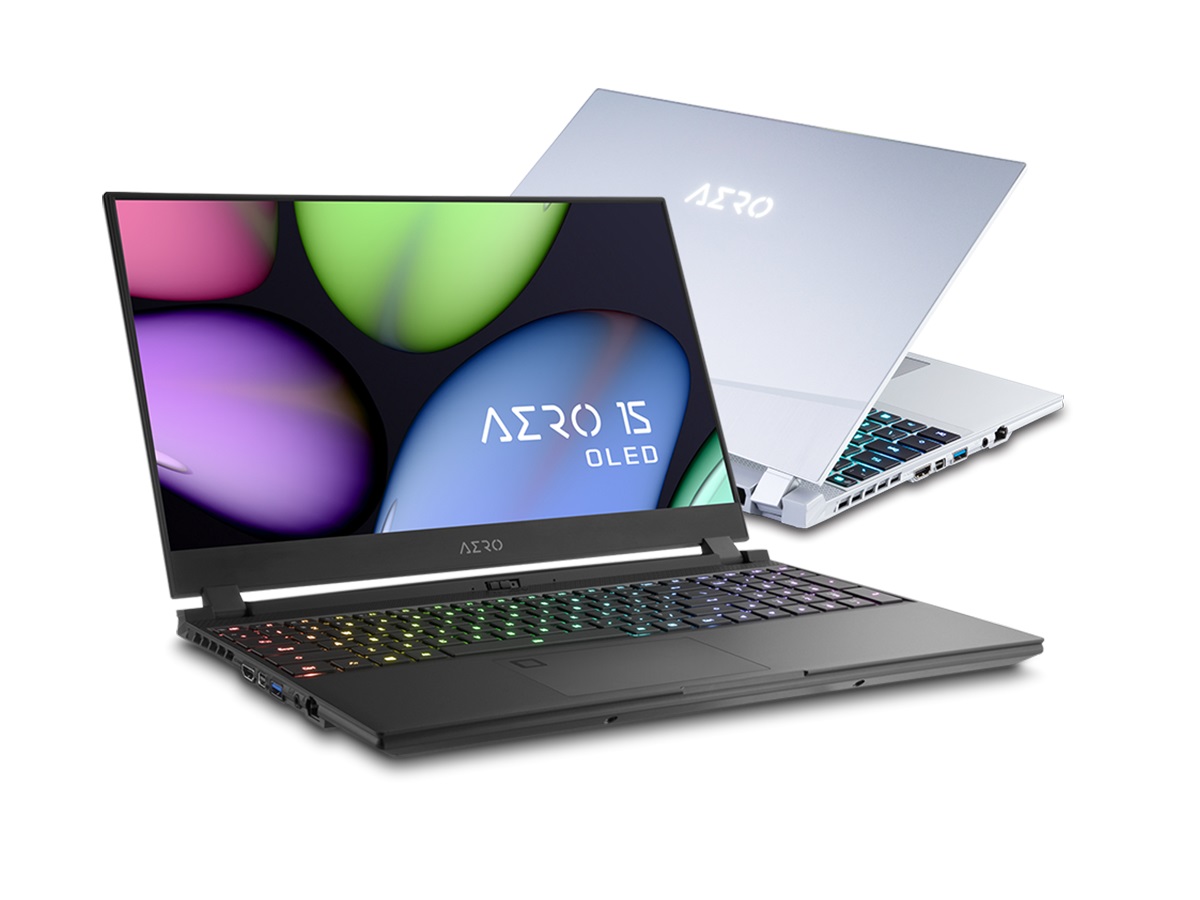
Om du lägger stor vikt vid din laptops bildkvalitet är Aero 15 OLED helt rätt val.
Om du bortser från den reflekterande ytan och uppdateringsfrekvensen får 4K-skärmen bara pluspoäng. Utöver hög ljusstyrka, utmärkt kontrast och korta responstider borde även ett brett färgomfång, som kommer till sin rätta tack vare X-Rite Pantone, nämnas på den positiva sidan.
Eftersom Aero 15 OLED inte tillåter sig själv några andra uppenbara fel kan både gamers och kreatörer som ansluter ett headset när datorn jobbar med 3D (nyckelord "ljudnivå") helt enkelt köra på.
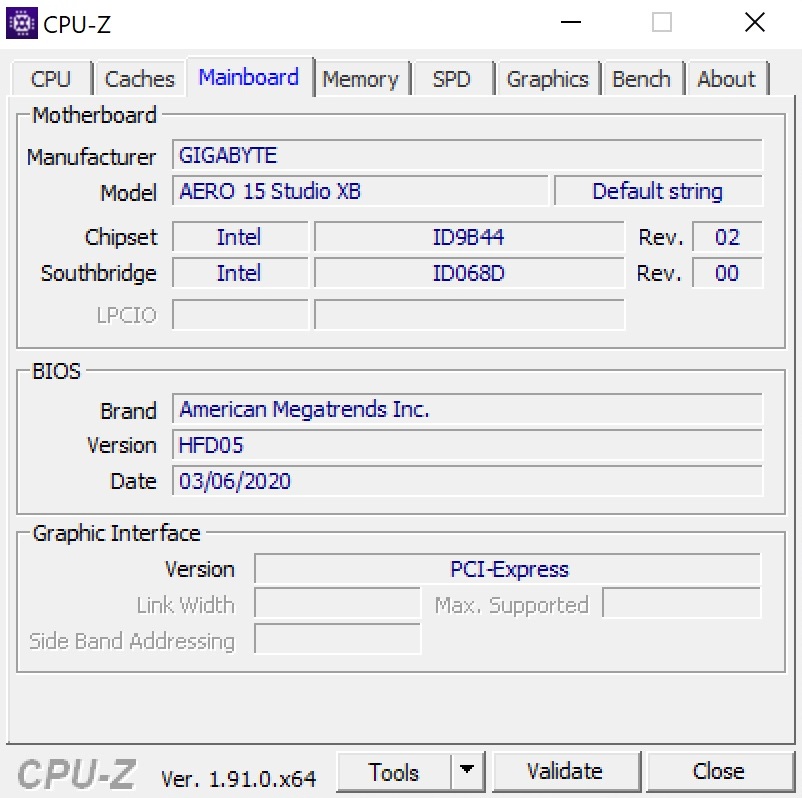
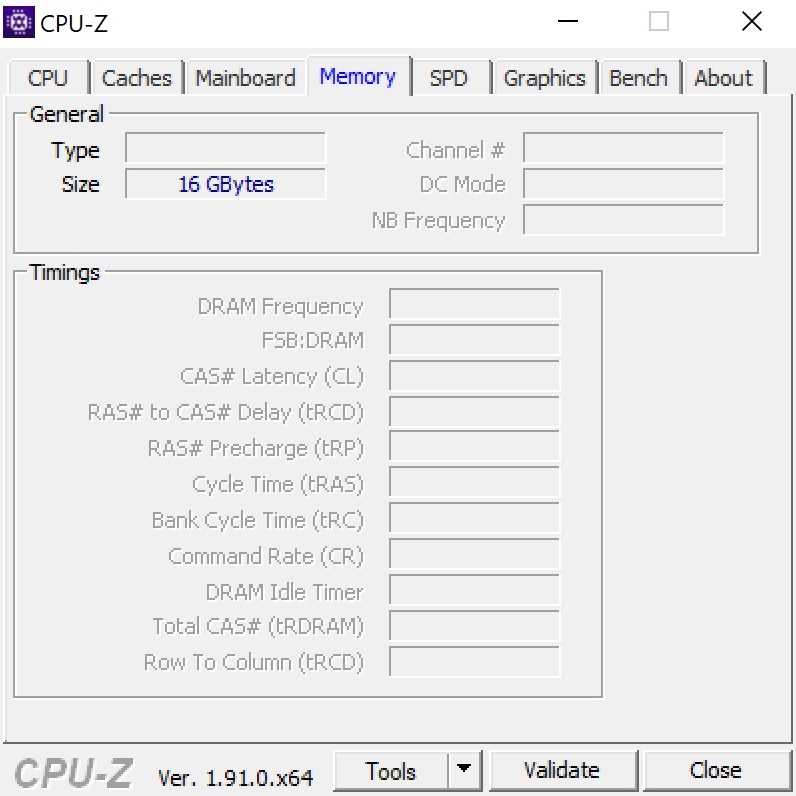
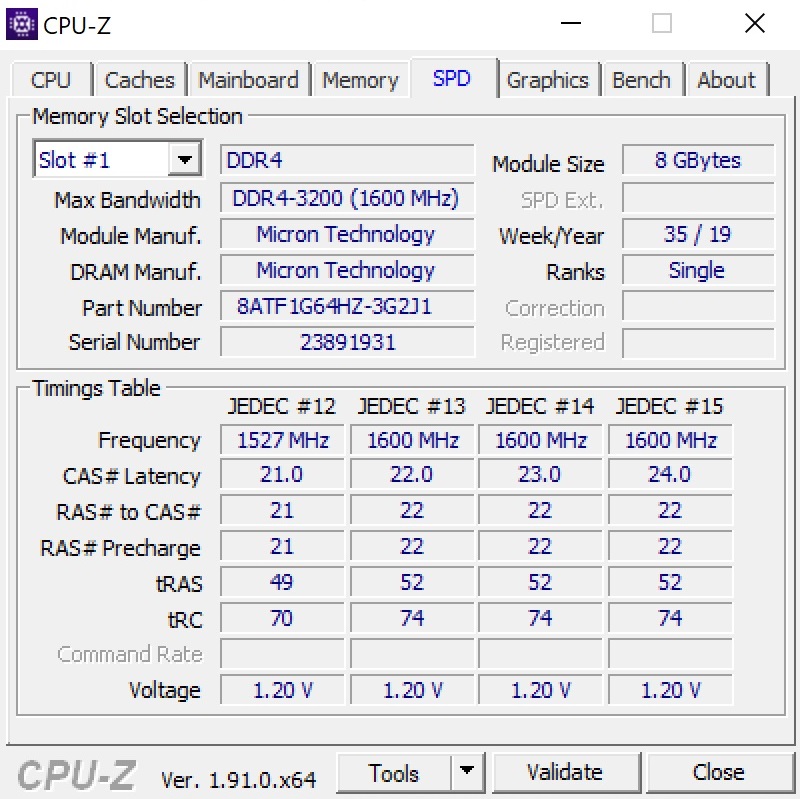
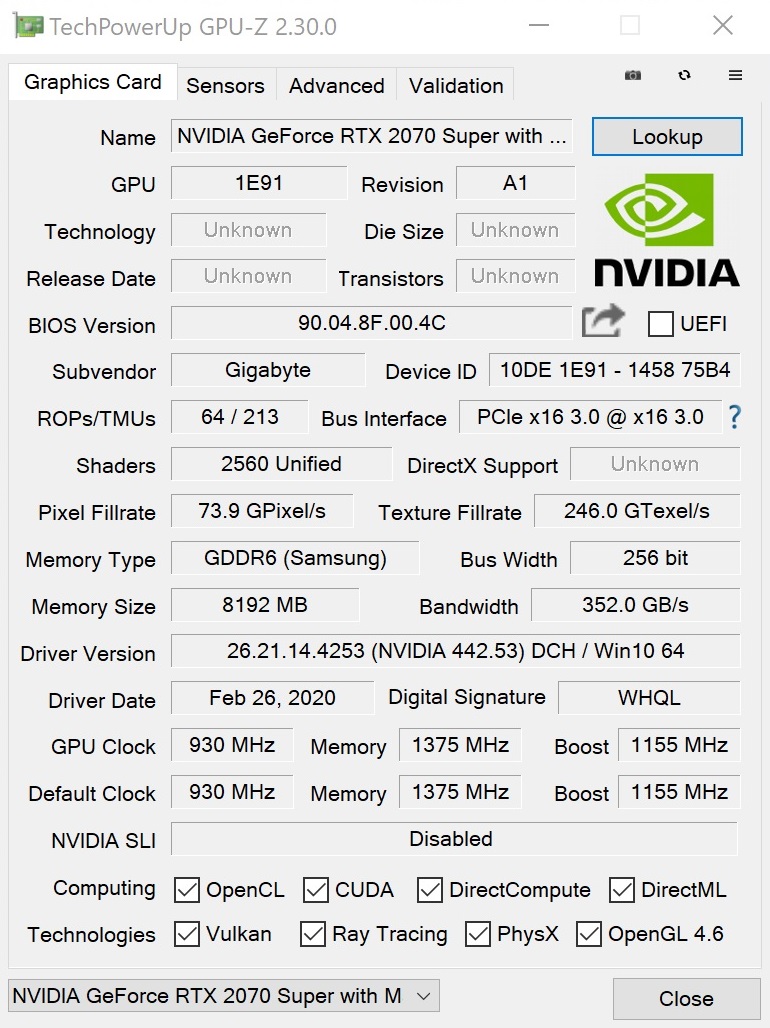
Gigabyte Aero 15 OLED XB-8DE51B0SP
- 08/31/2022 v7 (old)
Florian Glaser
Price comparison